BaoshanIron & Steel Co.,Ltd. 2012Full Year Results …BaoshanIron & Steel Co.,Ltd. 2012Full Year...
32
Baoshan Iron & Steel Co.,Ltd. 2012 Full Year Results April 2013
Transcript of BaoshanIron & Steel Co.,Ltd. 2012Full Year Results …BaoshanIron & Steel Co.,Ltd. 2012Full Year...

Baoshan Iron & Steel Co.,Ltd.
2012 Full Year Results
April 2013
Disclaimer
The following presentation distributed herewith includes forward-looking statements. All statements, other than statements of historical facts, that address activities, events
or developments that Baoshan Iron & Steel Co.,Ltd.(Baosteel) expects or anticipates will or may occur in the future are forward-looking statements.
Baosteel’s actual results or developments may differ materially from those indicated by these forward-looking statements as a result of various factors and uncertainties, including but not limited to price fluctuations, actual demand, exchange rate fluctuations, competition and other risks and factors beyond our control.
I. Operation Results
II. Industry Dynamics
III.Company Outlook

� Production and Sales
unit::::million tons 2010 2011 2012 YoY
Crude steel output 26.45 26.64 23.00 -13.7%
Sales of finished products 25.26 25.80 23.57 -8.6%
including::::domestic 22.93 23.06 21.23 -7.9%
export 2.33 2.74 2.34 -14.6%
Note:Stainless and special steel assets were sold to Baosteel Group corporation on 1 April, 2012;
Only Q1 results of stainless and special steel were included.
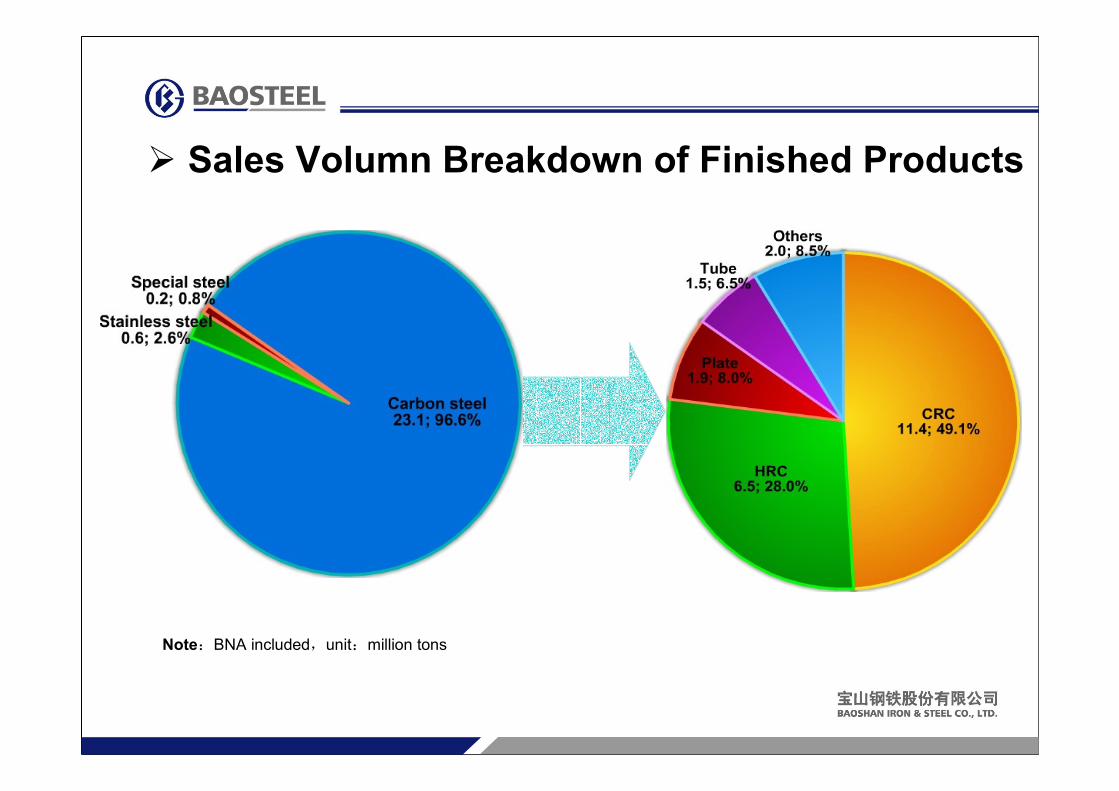
� Sales Volumn Breakdown of Finished Products
Note:BNA included,unit:million tons

unit::::million tons
billion YuanSales Revenue YoY Cost YoY
Gross
marginYoY
CRC 9.4 52.0 -11.8% 46.2 -10.6% 11.2% ↓↓↓↓1.2 ppts
HRC 8.0 32.0 -17.7% 29.1 -15.8% 8.8% ↓↓↓↓2.1 ppts
Plate 1.9 8.5 -27.7% 9.5 -25.8% -11.7% ↓↓↓↓2.8 ppts
Tube 1.5 10.3 -5.3% 9.4 -4.8% 9.0% ↓↓↓↓0.5 ppts
Stainless steel 0.6 7.5 -58.6% 7.5 -57.6% -1.1% ↓↓↓↓2.4 ppts
Special steel 0.2 2.2 -80.1% 2.4 -79.0% -6.3% ↓↓↓↓5.4 ppts
Others 2.0 8.2 -6.1% 8.5 -2.4% -3.9% ↓↓↓↓3.9 ppts
Total 23.6 120.6 -23.8% 112.6 -23.3% 6.6% ↓↓↓↓0.7 ppts
� Gross Profit--By Product

� Income Statement Summary
unit::::billion Yuan 2010 2011 2012 YoY
Revenue 202.41 222.86 191.51 -14.1%
Cost 186.59 214.64 189.12 -11.9%
Gross profit 24.33 19.61 14.37
Gross margin%%%% 12.02 8.80 7.50 ↓↓↓↓1.30 ppts
Operating profit 16.67 8.84 3.60
Operating margin%%%% 8.24 3.97 1.88 ↓↓↓↓2.09ppts
Net profit 12.89 7.36 10.39
Net profit margin%%%% 6.37 3.30 5.42 ↑↑↑↑2.12 ppts
Note:Decline in 2012 operating profit was due to 2.65 billion Yuan impairment loss of Luojing remaining assets.
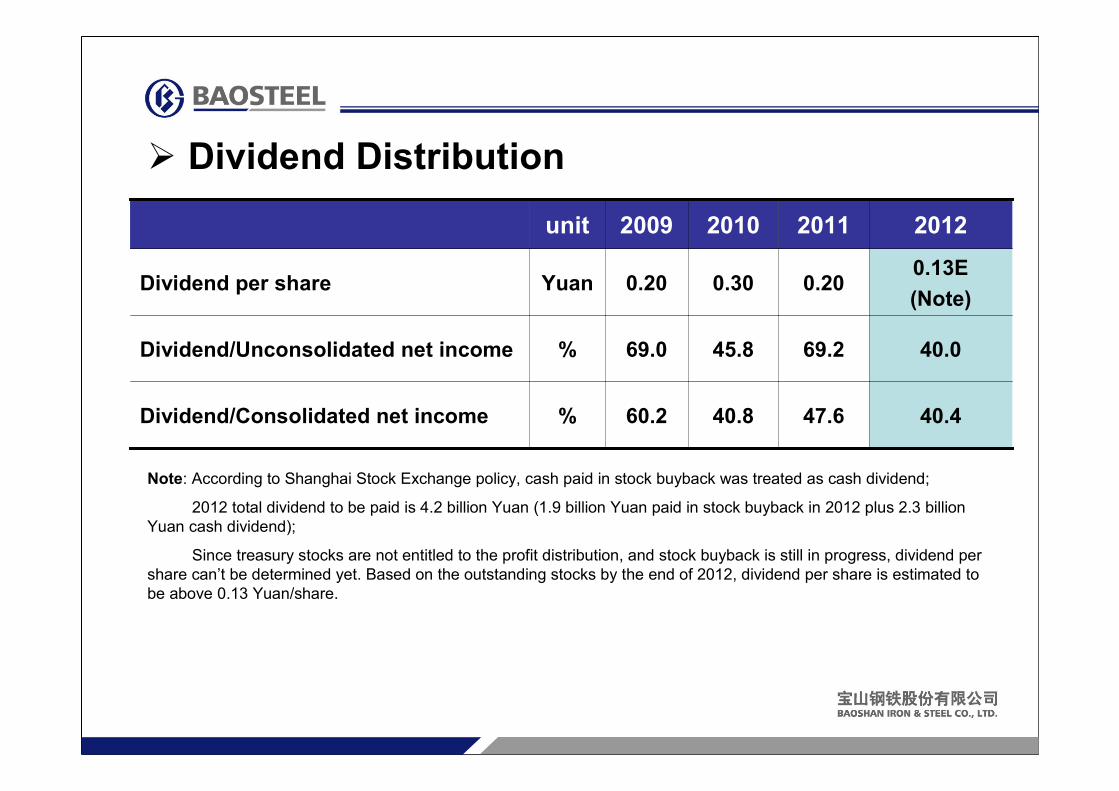
� Dividend Distribution
unit 2009 2010 2011 2012
Dividend per share Yuan 0.20 0.30 0.200.13E
(Note)
Dividend/Unconsolidated net income % 69.0 45.8 69.2 40.0
Dividend/Consolidated net income % 60.2 40.8 47.6 40.4
Note: According to Shanghai Stock Exchange policy, cash paid in stock buyback was treated as cash dividend;
2012 total dividend to be paid is 4.2 billion Yuan (1.9 billion Yuan paid in stock buyback in 2012 plus 2.3 billion
Yuan cash dividend);
Since treasury stocks are not entitled to the profit distribution, and stock buyback is still in progress, dividend per
share can’t be determined yet. Based on the outstanding stocks by the end of 2012, dividend per share is estimated to
be above 0.13 Yuan/share.

unit::::Yuan 2010 2011 2012 YoY
EPS 0.74 0.42 0.60 42.9%
BVPS 5.98 6.08 6.51 7.1%
Net CFO per share 1.08 0.69 1.30 88.4%
Gross margin% 13.25 8.75 7.46 ↓↓↓↓1.29 ppts
ROE (weighted)% 12.95 7.02 9.52 ↑↑↑↑2.50 ppts
� Financial Highlights

Financial index unit 2011-12-31 2012-12-31 Change
Solvency
Total debts/
total assets%%%% 50.89 45.26 ↓↓↓↓ 5.63 ppts
Current ratio 0.80 0.84 ↑↑↑↑ 0.04
Quick ratio 0.42 0.49 ↑↑↑↑ 0.07
Financial index unit 2011 2012 Change
Liquidity
Days of receivables day 8.4 19.0 126.2%
Days of inventories day 74.9 70.8 -5.5%
Cash conversion
cycleday 51.1 51.6 1.0%
� Solvency and Liquidity
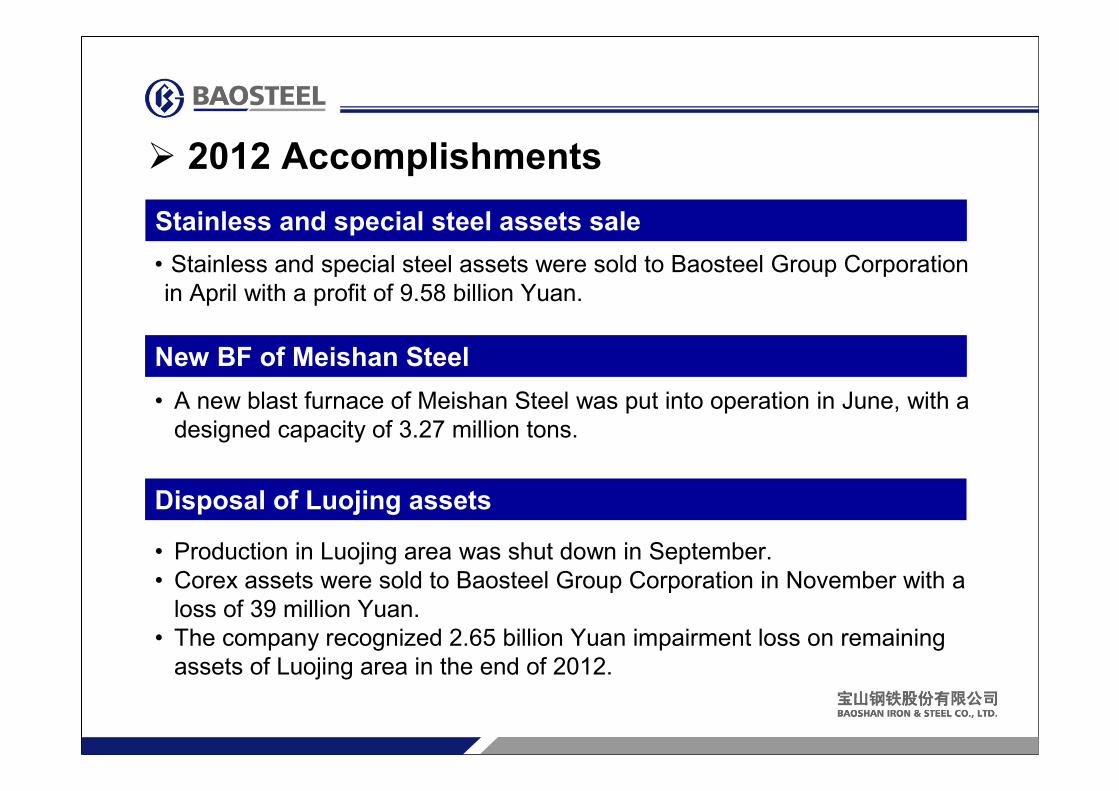
� 2012 Accomplishments
Stainless and special steel assets sale
• Stainless and special steel assets were sold to Baosteel Group Corporation
in April with a profit of 9.58 billion Yuan.
New BF of Meishan Steel
• A new blast furnace of Meishan Steel was put into operation in June, with a
designed capacity of 3.27 million tons.
Disposal of Luojing assets
• Production in Luojing area was shut down in September.
• Corex assets were sold to Baosteel Group Corporation in November with a
loss of 39 million Yuan.
• The company recognized 2.65 billion Yuan impairment loss on remaining
assets of Luojing area in the end of 2012.
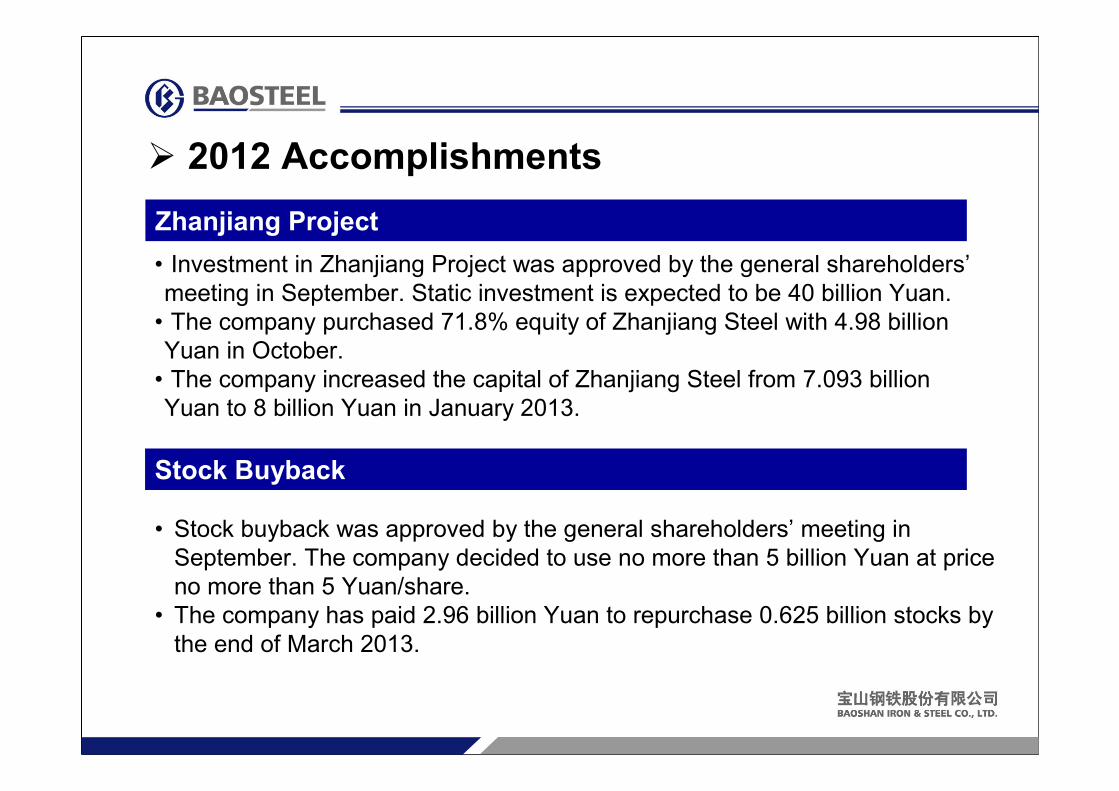
� 2012 Accomplishments
Zhanjiang Project
• Investment in Zhanjiang Project was approved by the general shareholders’
meeting in September. Static investment is expected to be 40 billion Yuan.
• The company purchased 71.8% equity of Zhanjiang Steel with 4.98 billion
Yuan in October.
• The company increased the capital of Zhanjiang Steel from 7.093 billion
Yuan to 8 billion Yuan in January 2013.
Stock Buyback
• Stock buyback was approved by the general shareholders’ meeting in
September. The company decided to use no more than 5 billion Yuan at price
no more than 5 Yuan/share.
• The company has paid 2.96 billion Yuan to repurchase 0.625 billion stocks by
the end of March 2013.
I. Operation Results
II. Industry Dynamics
III.Company Outlook
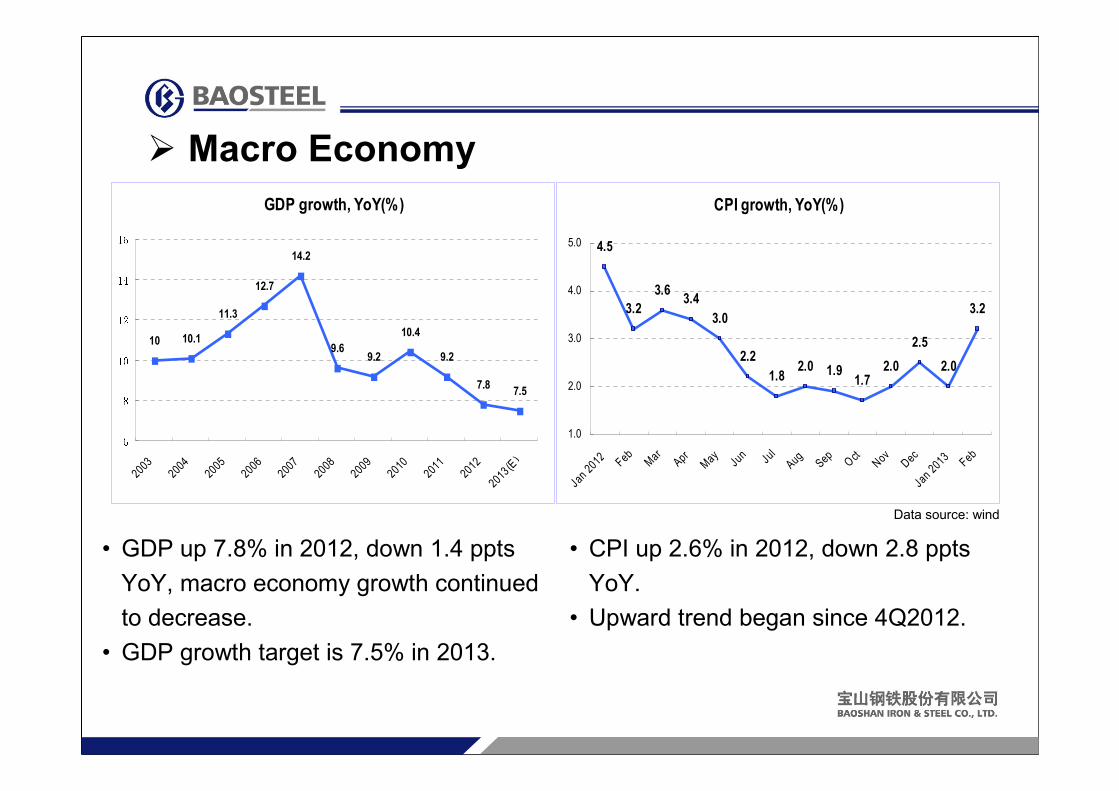
� Macro Economy
• GDP up 7.8% in 2012, down 1.4 ppts
YoY, macro economy growth continued
to decrease.
• GDP growth target is 7.5% in 2013.
Data source: wind
• CPI up 2.6% in 2012, down 2.8 ppts
YoY.
• Upward trend began since 4Q2012.
GDP growth, YoY(%)
10 10.1
11.3
12.7
14.2
9.69.2
10.4
9.2
7.87.56810
121416
2003
2004
2005
2006
2007
2008
2009
2010
2011
2012
2013
(E)
CPI growth, YoY(%)
4.5
3.2
3.63.4
3.0
2.2
1.82.0 1.9
1.72.0
2.5
2.0
3.2
1.0
2.0
3.0
4.0
5.0
Jan 20
12 Feb
Mar
Apr
May Jun Jul
Aug
Sep
Oct
Nov
Dec
Jan 20
13 Feb

� Demand and Supply Analysis--Supply(Crude Steel)
• Crude steel output still grew in 2012, while the growth rate slowed down.
• Crude steel output was 589 million tons from member steelmakers in CISA, down 0.6% YoY, and 127 million tons from others, up 24.8% YoY.
• FAI in steel industry was 658 billion Yuan, up 3% YoY. The growth rate was down 12.5 ppts YoY.
• Output growth rate was expected a further decrease in 2013.
Data resource: National Bureau of Statistics, MIIT, Customs statistic and company forecast
648648648648
35353535
683683683683
2011
699699699699
38383838
737737737737
2013EUnit: million tons YoY 2012 YoY YoY
Output 8.9%8.9%8.9%8.9% 717717717717 4.9%4.9%4.9%4.9% 2.9%2.9%2.9%2.9%
Net export 29.6%29.6%29.6%29.6% 44444444 25.7%25.7%25.7%25.7% ----14.2%14.2%14.2%14.2%
Apparent
Consumption 8.2%8.2%8.2%8.2% 673673673673 3.9%3.9%3.9%3.9% 4.0%4.0%4.0%4.0%
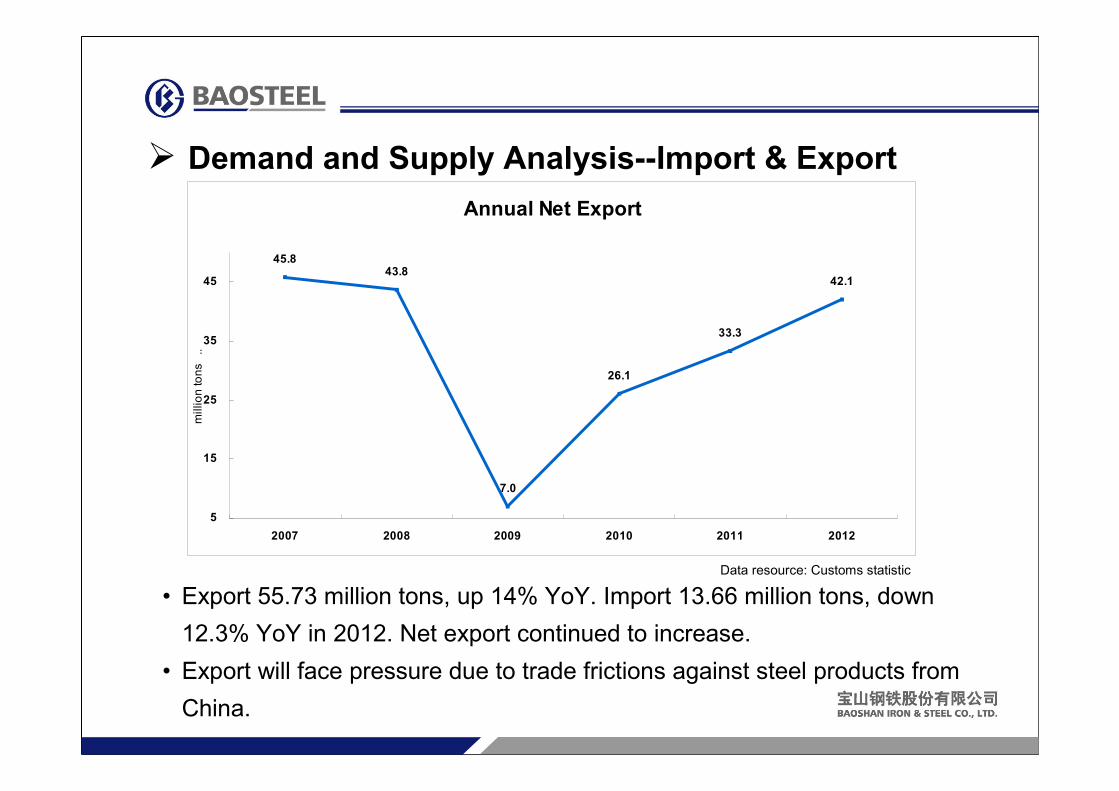
� Demand and Supply Analysis--Import & Export
• Export 55.73 million tons, up 14% YoY. Import 13.66 million tons, down
12.3% YoY in 2012. Net export continued to increase.
• Export will face pressure due to trade frictions against steel products from
China.
Data resource: Customs statistic
Annual Net Export
45.843.8
7.0
26.1
33.3
42.1
5
15
25
35
45
2007 2008 2009 2010 2011 2012
million tons ..
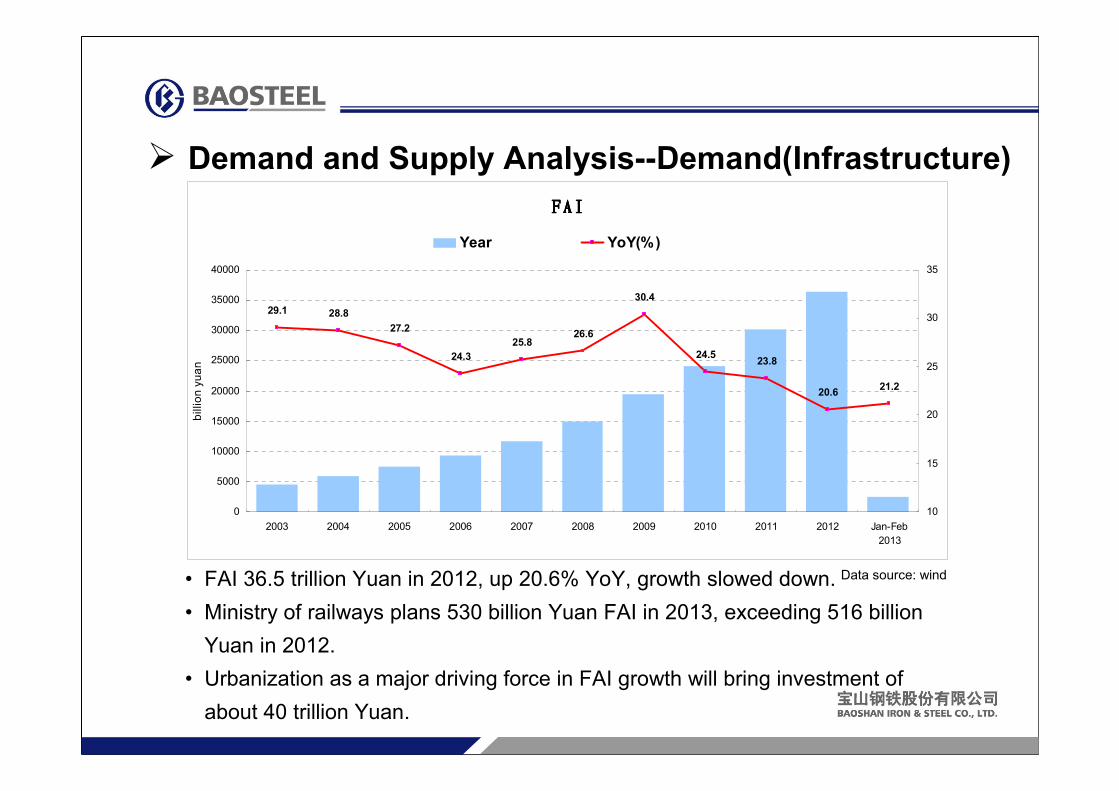
� Demand and Supply Analysis--Demand(Infrastructure)
• FAI 36.5 trillion Yuan in 2012, up 20.6% YoY, growth slowed down.
• Ministry of railways plans 530 billion Yuan FAI in 2013, exceeding 516 billion
Yuan in 2012.
• Urbanization as a major driving force in FAI growth will bring investment of
about 40 trillion Yuan.
Data source: wind
FAIFAIFAIFAI
29.1 28.8
27.2
24.3
25.826.6
24.523.8
20.621.2
30.4
0
5000
10000
15000
20000
25000
30000
35000
40000
2003 2004 2005 2006 2007 2008 2009 2010 2011 2012 Jan-Feb
2013
billion yuan
10
15
20
25
30
35
Year YoY(%)

� Demand and Supply Analysis--Demand(Real Estate)
• Investment up 16.2% YoY, new start area down 7.3% YoY, and sales area up
1.8% YoY in 2012.
• Industry began to rebounce in the end of 2012, while the recent new control
policy brings uncertainty.
Data source: wind
0
0.5
1
1.5
2
2003 2004 2005 2006 2007 2008 2009 2010 2011 2012 Jan-Feb
2013
New start area (billion square meters)
Sales area (billion square meters)
Investment (billion Yuan, left)
Growth Ytd, YoY (%, right)
0
1000
2000
3000
4000
5000
6000
7000
2003 2004 2005 2006 2007 2008 2009 2010 2011 2012 Jan-Feb
2013
0
5
10
15
20
25
30
35

� Demand and Supply Analysis—Demand(Automobile)
• Growth picked up from the low level of 2011.
• Japanese car sales decreased in 2012, while has improved since Dec 2012.
• Subsidy to energy-saving and new energy cars is expected in the near future.
• Growth rate is expected 8% in 2013.
Data source: wind
Output
0
5
10
15
20
2003 2005 2007 2009 2011 Jan-Feb
2013
million
0
10
20
30
40
50
output YoY%
Sales
0
5
10
15
20
2003 2005 2007 2009 2011 Jan-Feb
2013
million
0
10
20
30
40
50
sales YoY%
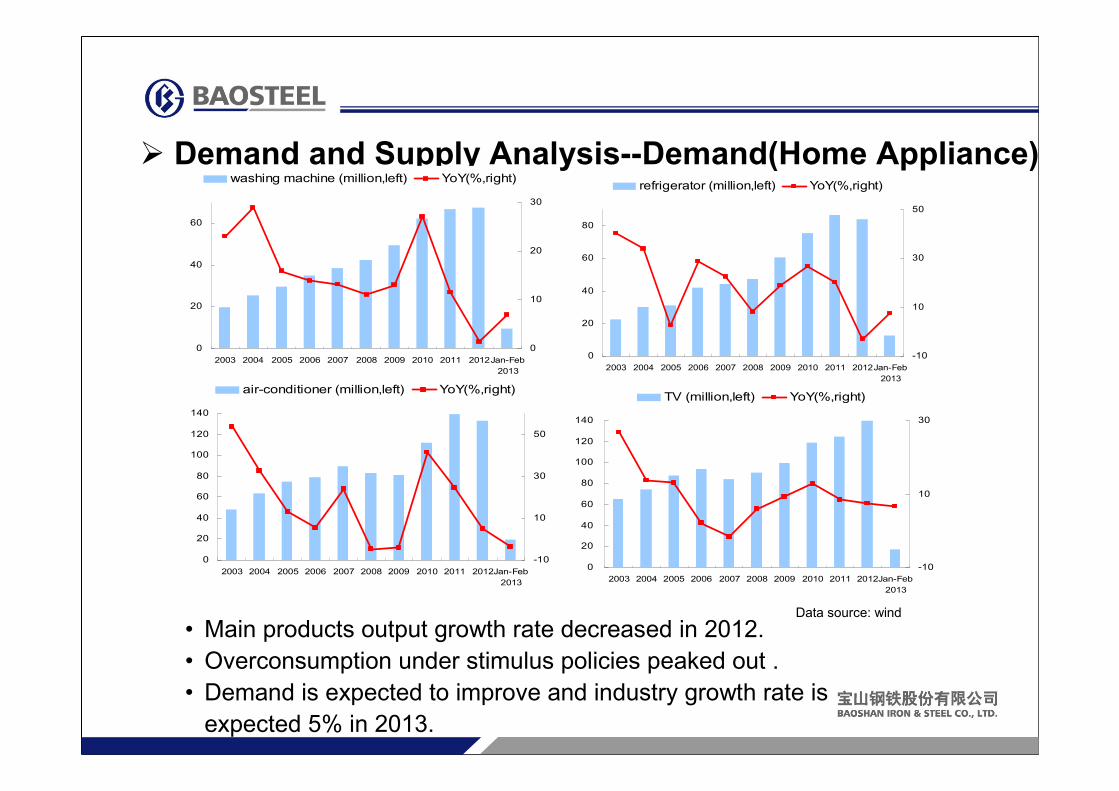
� Demand and Supply Analysis--Demand(Home Appliance)
• Main products output growth rate decreased in 2012.
• Overconsumption under stimulus policies peaked out .
• Demand is expected to improve and industry growth rate is
expected 5% in 2013.
Data source: wind
0
20
40
60
2003 2004 2005 2006 2007 2008 2009 2010 2011 2012Jan-Feb
2013
0
10
20
30
washing machine (million,left) YoY(%,right)
0
20
40
60
80
2003 2004 2005 2006 2007 2008 2009 2010 2011 2012Jan-Feb
2013
-10
10
30
50
refrigerator (million,left) YoY(%,right)
0
20
40
60
80
100
120
140
2003 2004 2005 2006 2007 2008 2009 2010 2011 2012Jan-Feb
2013
-10
10
30
50
air-conditioner (million,left) YoY(%,right)
0
20
40
60
80
100
120
140
2003 2004 2005 2006 2007 2008 2009 2010 2011 2012Jan-Feb
2013
-10
10
30
TV (million,left) YoY(%,right)

� Demand and Supply Analysis--Demand(Machinery)
• Machinery industry was still in downward trend in 2012.
• In 2013, growth will pick up driven by related industries, like infrastructure, real
estate and autos. The growth rate is expected 15%.
• In sub-industries: construction machinery is still depressed, railway equipment
and agricultural machinery may improve.
Data source: CMIF
Machinery industry growth,YoY
11.9% 11.9% 12.2%14.2%
11.6%13.3% 12.1% 11.9% 12.2% 11.9% 12.0%
0%
5%
10%
15%
20%
25%
30%
35%
40%
45%
50%
Jan-Feb Mar Apr May Jun Jul Aug Sep Oct Nov Dec
2010 2011 2012

� Demand and Supply Analysis--Demand(Ship Building)
• Completion, new order and carrying order were :60, 20 and 110
million tonnages, down 21%, 44% and 29% YoY respectively in 2012.
• Industry is still depressed in 2013 and little chance of improvement in
a short run.
Data source: CANSI
Ship-building Completion
7.19
4.024.44
6.88
9.67
3.29
2.34
3.75
5.09
3.88
9.66
0
2
4
6
8
10
12
14
16
Jan-Feb Mar Apr May Jun Jul Aug Sep Oct Nov Dec
million tonnage
2009 2010 2011 2012

� Steel Inventory
• Year end inventory down 7.9% YoY.
• Inventory increased slowly before Feb 2013. There was a explosive inventory growth
after the Spring Festival, with the release of steel output .
• Inventory growth slowed down after mid-March, great pressure of later destocking.
Unit:
million tons
22 Mar
2013
1 Mar
2013
1 Feb
2013
28 Dec
2012
YoY
Change %
Rebar 10.80 10.34 7.06 5.20 0.34 6.9%
Wire 3.21 3.16 1.77 1.23 0.11 9.7%
HRC 4.72 4.72 3.65 2.75 -1.28 -31.8%
CRC 1.69 1.71 1.53 1.54 0.05 3.2%
Plate 1.67 1.81 1.48 1.16 -0.23 -16.3%
Long product 14.01 13.51 8.83 6.43 0.45 7.5%
Flat product 8.07 8.24 6.66 5.45 -1.46 -21.2%
Total 22.08 21.75 15.49 11.88 -1.02 -7.9%
Data source: Mysteel
Note: range of social inventory statistics is expanded since 2013

� Iron Ore Inventory
• Downward trend in iron ore port inventory, down 23.5% YoY.
• Inventory dropped below 90 million tons in Nov 2012 and now 67.92
million tons (29 Mar, 2013).
Data source: Mysteel
Iron ore port inventory
1
6
11
16
21
26
31
36
41
Jan-11 Mar-11 Jun-11 Aug-11 Oct-11 Jan-12 Mar-12 Jun-12 Aug-12 Oct-12 Jan-13 Mar-13
million tons
Australian Brazil India
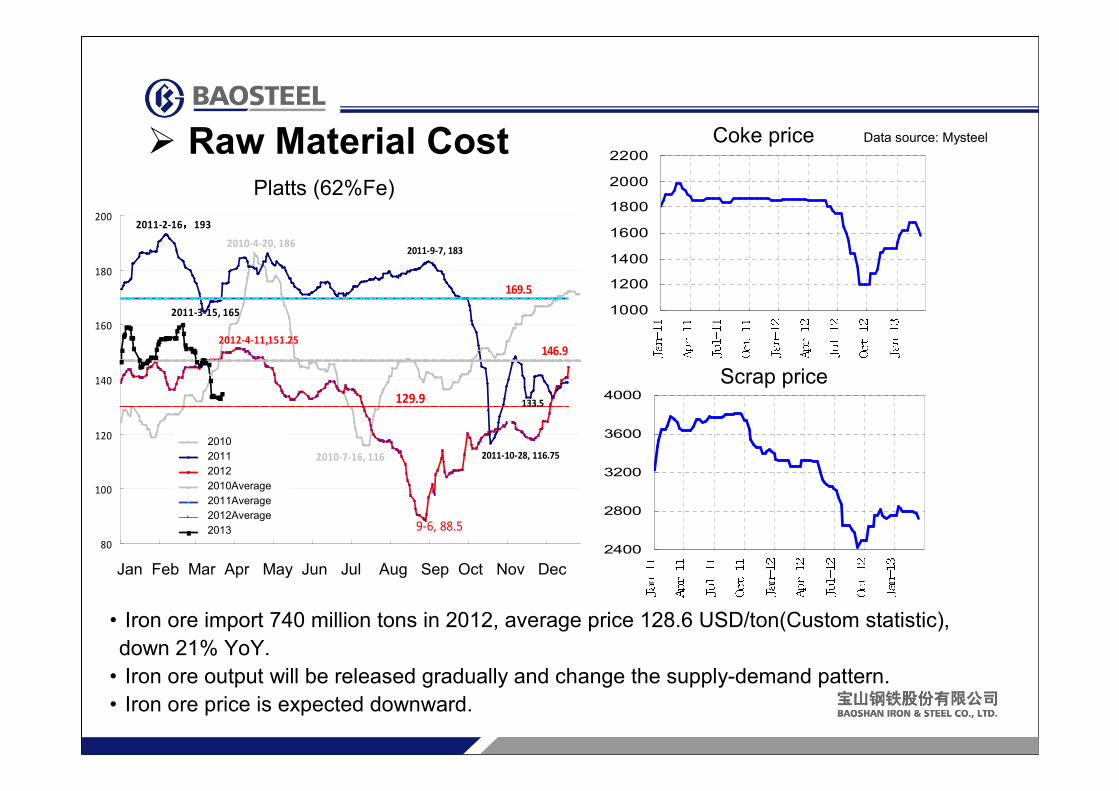
� Raw Material Cost
• Iron ore import 740 million tons in 2012, average price 128.6 USD/ton(Custom statistic),
down 21% YoY.
• Iron ore output will be released gradually and change the supply-demand pattern.
• Iron ore price is expected downward.
62%粉矿62%粉矿62%粉矿62%粉矿PlattsPlattsPlattsPlatts指数价格走势指数价格走势指数价格走势指数价格走势((((CFR,CFR,CFR,CFR,美元/干吨美元/干吨美元/干吨美元/干吨))))
2010-7-16, 116
2010-4-20, 186
2011-10-28, 116.75
2011-9-7, 183
2011-2-16,,,,193
2011-3-15, 165
133.5
2012-4-11,151.25
9-6, 88.5
146.9
169.5
129.9
80
100
120
140
160
180
200
1
月
2
月
3
月
4
月
5
月
6
月
7
月8
月9
月1
0
月1
1
月1
2
月2010年2011年2012年2010年指数年均价2011年指数年均价2012年指数年均价2013年
Jan Feb Mar Apr May Jun Jul Aug Sep Oct Nov Dec
2010
2011
2012
2010Average
2011Average
2012Average
2013
Platts (62%Fe)
焦炭价格焦炭价格焦炭价格焦炭价格1000
1200
1400
1600
1800
2000
2200
Jan-11 Apr-11 Jul-11 Oct-11 Jan-12 Apr-12 Jul-12 Oct-12 Jan-13Coke price
废钢价格废钢价格废钢价格废钢价格2400
2800
3200
3600
4000
Jan-11 Apr-11 Jul-11 Oct-11 Jan-12 Apr-12 Jul-12 Oct-12 Jan-13Scrap price
Data source: Mysteel

� Steel Price
Unit:
Yuan/ton22 Mar MoM% YoY%
Average
2012YoY%
HRC 4020 -3.8 -7.2 4117 -12.7
CRC 4930 -1.8 -6.3 4888 -10.6
Plate 3990 -2.9 -10.1 4007 -16.6
Wire 3490 -5.2 -15.9 3830 -18.5
Rebar 3680 -6.4 -12.8 3954 -15.9
Data source: Mysteel
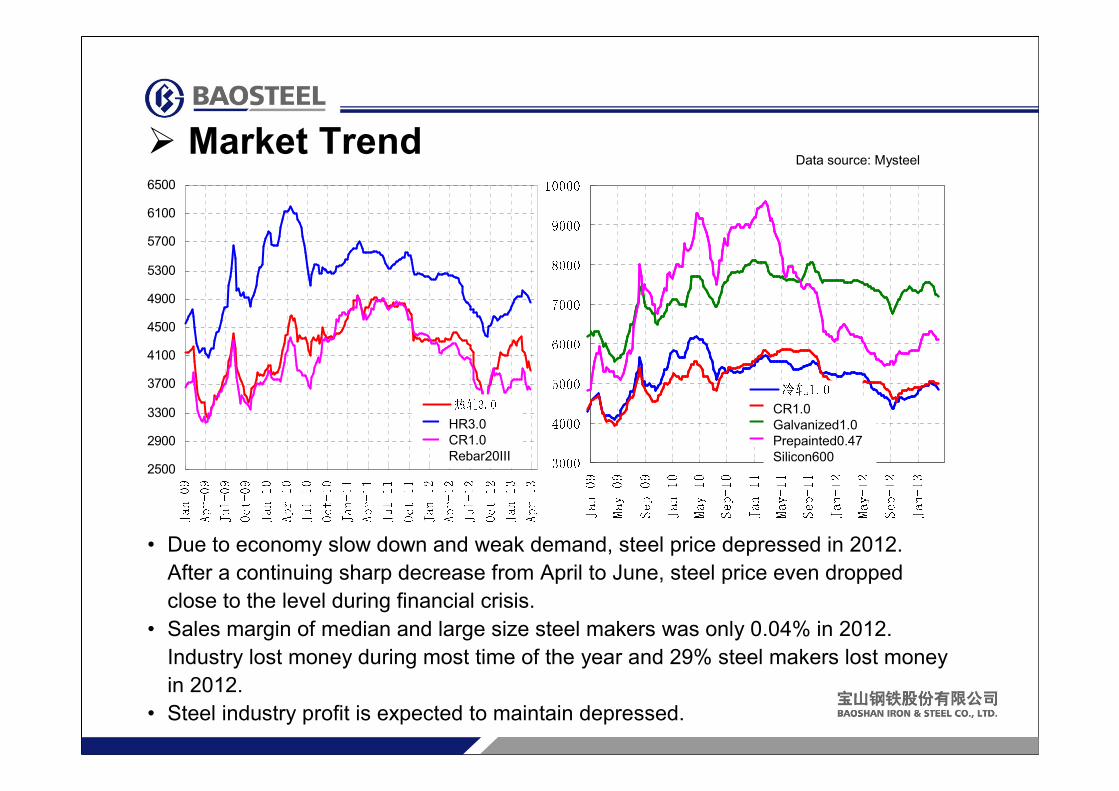
• Due to economy slow down and weak demand, steel price depressed in 2012.
After a continuing sharp decrease from April to June, steel price even dropped
close to the level during financial crisis.
• Sales margin of median and large size steel makers was only 0.04% in 2012.
Industry lost money during most time of the year and 29% steel makers lost money
in 2012.
• Steel industry profit is expected to maintain depressed.
� Market TrendData source: Mysteel
2500
2900
3300
3700
4100
4500
4900
5300
5700
6100
6500
Jan-09 Apr-09 Jul-09 Oct-09 Jan-10 Apr-10 Jul-10 Oct-10 Jan-11 Apr-11 Jul-11 Oct-11 Jan-12 Apr-12 Jul-12 Oct-12 Jan-13 Apr-13热轧3.0冷轧1.0螺纹20Ⅲ级HR3.0
CR1.0
Rebar20III 300040005000600070008000900010000
Jan-09 May-09 Sep-09 Jan-10 May-10 Sep-10 Jan-11 May-11 Sep-11 Jan-12 May-12 Sep-12 Jan-13冷轧1.0镀锌1.0彩涂0.476硅钢600CR1.0
Galvanized1.0
Prepainted0.47
Silicon600

I. Operation Results
II. Industry Dynamics
III.Company Outlook
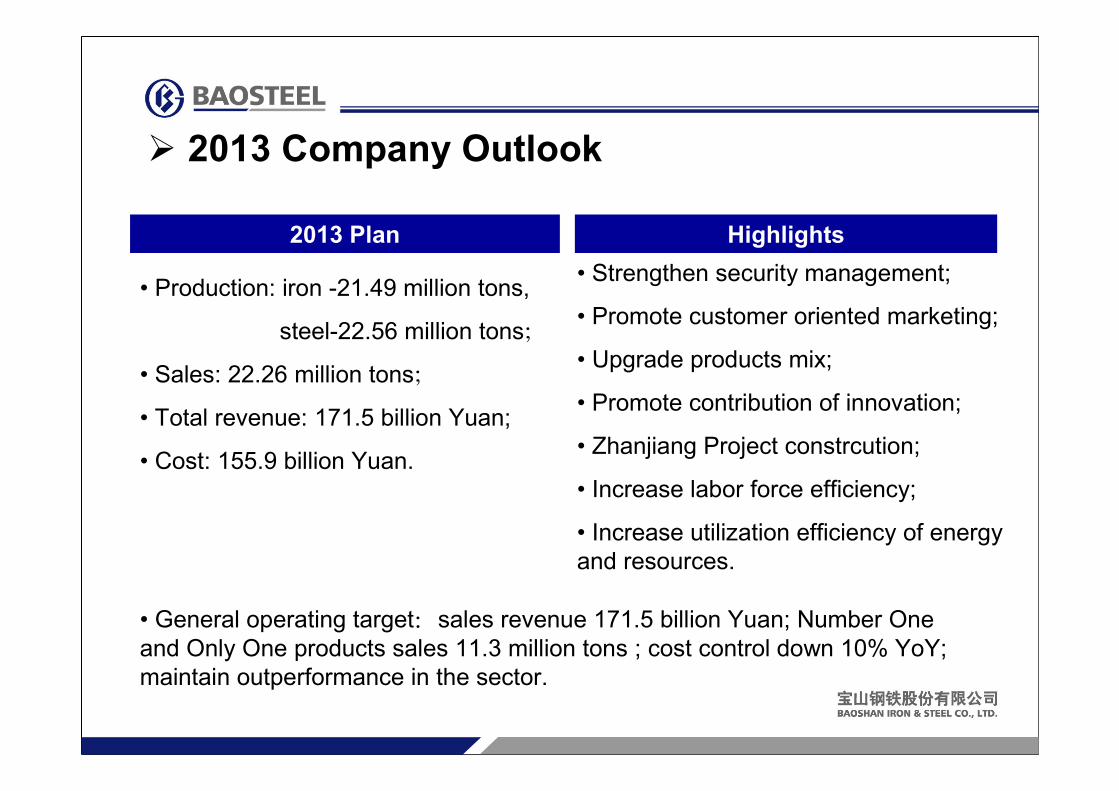
� 2013 Company Outlook
2013 Plan Highlights
• Production: iron -21.49 million tons,
steel-22.56 million tons;
• Sales: 22.26 million tons;
• Total revenue: 171.5 billion Yuan;
• Cost: 155.9 billion Yuan.
• Strengthen security management;
• Promote customer oriented marketing;
• Upgrade products mix;
• Promote contribution of innovation;
• Zhanjiang Project constrcution;
• Increase labor force efficiency;
• Increase utilization efficiency of energy
and resources.
• General operating target:sales revenue 171.5 billion Yuan; Number One
and Only One products sales 11.3 million tons ; cost control down 10% YoY;
maintain outperformance in the sector.
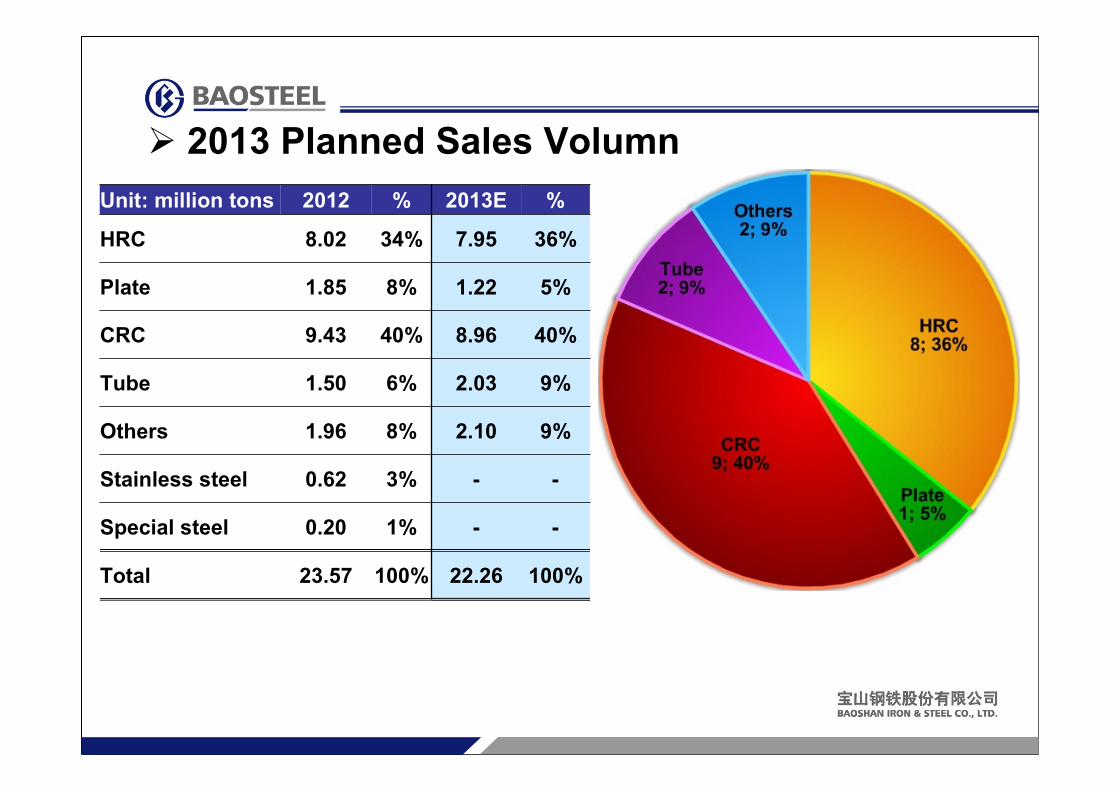
Unit: million tons 2012 % 2013E %
HRC 8.02 34% 7.95 36%
Plate 1.85 8% 1.22 5%
CRC 9.43 40% 8.96 40%
Tube 1.50 6% 2.03 9%
Others 1.96 8% 2.10 9%
Stainless steel 0.62 3% - -
Special steel 0.20 1% - -
Total 23.57 100% 22.26 100%
� 2013 Planned Sales Volumn
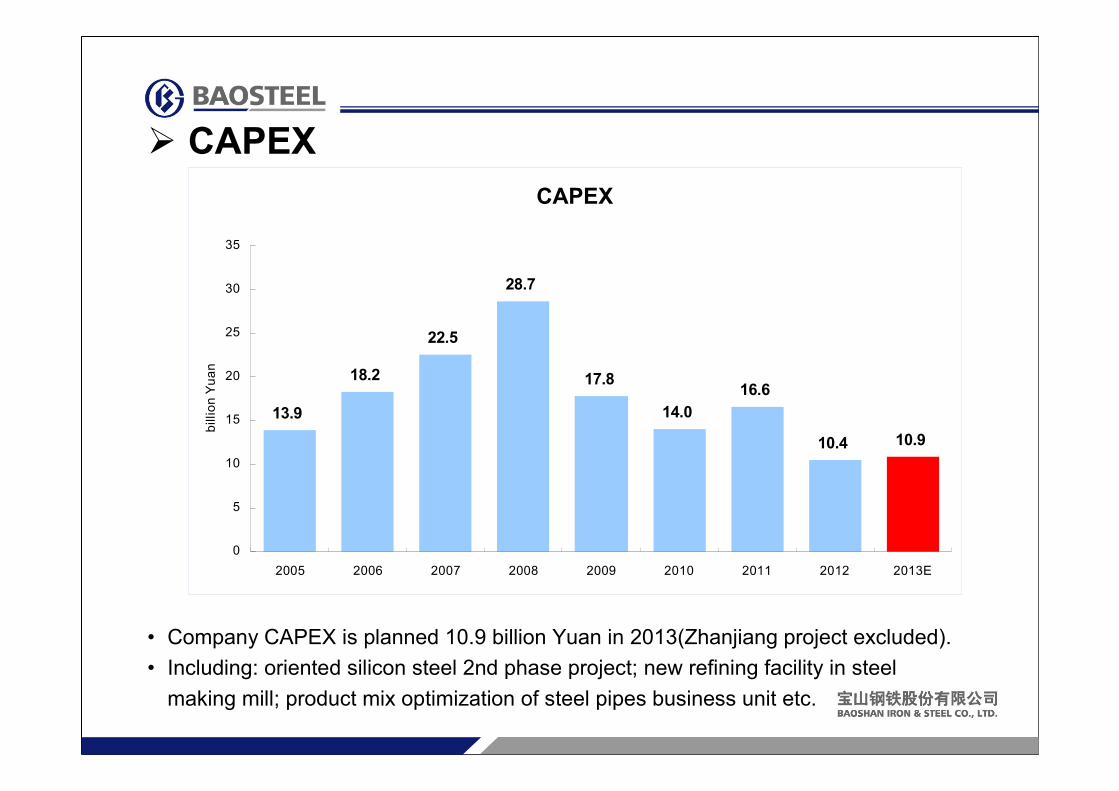
� CAPEX
• Company CAPEX is planned 10.9 billion Yuan in 2013(Zhanjiang project excluded).
• Including: oriented silicon steel 2nd phase project; new refining facility in steel
making mill; product mix optimization of steel pipes business unit etc.
CAPEX
13.9
18.2
22.5
28.7
17.8
14.0
16.6
10.4 10.9
0
5
10
15
20
25
30
35
2005 2006 2007 2008 2009 2010 2011 2012 2013E
billion Yuan