Baoshan Iron & Steel Co., Ltd. 2016 Semi-annual...
151
2016 Semi-annual Report 1 / 151 Corporation code: 600019 Corporation abbreviation: Baosteel Baoshan Iron & Steel Co., Ltd. 2016 Semi-annual Report Important Notice I. The Board of Directors and the Board of Supervisors of Baoshan Iron & Steel Co., Ltd. (hereinafter “the Company”), along with their directors, supervisors and senior executives, hereby guarantee that this Semi-annual Report (hereinafter “the Report”) is free from false statement, misleading information or grave material omission, and assume relevant separate and joint responsibilities in regard to the truth, the accuracy and the integrity of the contents of the Report. II. All members of the Board of Directors attended the board meeting. III. The semi-annual financial statement of the Company is unaudited. IV. Chen Derong, Chairman of the Company, Wu Kunzong, Chief Accountant, and Wang Juan, Director of the Finance Department in charge of the accounting affairs, attest to the truthfulness, correctness and completeness of the financial statements in the Report. V. Proposed Profit Appropriation Plan and Capitalizing of Reverses Plan for the Reporting Period Reviewed by the Board of Directors None VI. Risk Disclosure on Proactive Statements The proactive future plans and developing strategies in this Report do not constitute actual promises to investors. Investors are kindly reminded that investment involves risks. VII. Was Capital Found in the Company to be Occupied by the Controlling Shareholder and Its Related Parties? None VIII. Was Guarantee Found in the Company to be Provided in Manner that is against the Stipulated Decision-making Procedures? None IX. Miscellaneous None
-
Upload
trinhduong -
Category
Documents
-
view
221 -
download
0
Transcript of Baoshan Iron & Steel Co., Ltd. 2016 Semi-annual...

2016 Semi-annual Report
1 / 151
Corporation code: 600019 Corporation abbreviation: Baosteel
Baoshan Iron & Steel Co., Ltd.
2016 Semi-annual Report
Important Notice
I. The Board of Directors and the Board of Supervisors of Baoshan Iron & Steel Co., Ltd. (hereinafter
“the Company”), along with their directors, supervisors and senior executives, hereby guarantee
that this Semi-annual Report (hereinafter “the Report”) is free from false statement, misleading
information or grave material omission, and assume relevant separate and joint responsibilities in
regard to the truth, the accuracy and the integrity of the contents of the Report.
II. All members of the Board of Directors attended the board meeting.
III. The semi-annual financial statement of the Company is unaudited.
IV. Chen Derong, Chairman of the Company, Wu Kunzong, Chief Accountant, and Wang Juan, Director
of the Finance Department in charge of the accounting affairs, attest to the truthfulness,
correctness and completeness of the financial statements in the Report.
V. Proposed Profit Appropriation Plan and Capitalizing of Reverses Plan for the Reporting Period
Reviewed by the Board of Directors
None
VI. Risk Disclosure on Proactive Statements
The proactive future plans and developing strategies in this Report do not constitute actual promises to
investors. Investors are kindly reminded that investment involves risks.
VII. Was Capital Found in the Company to be Occupied by the Controlling Shareholder and Its Related
Parties?
None
VIII. Was Guarantee Found in the Company to be Provided in Manner that is against the Stipulated
Decision-making Procedures?
None
IX. Miscellaneous
None

2016 Semi-annual Report
2 / 151
Table of Contents Section I. Definitions .......................................................................................................................... 3
Section II. Company Profile ............................................................................................................... 4
Section III. Accounting and Financial Highlights .............................................................................. 5
Section IV. Board of Directors’ Report ............................................................................................... 7
Section V. Significant Events ........................................................................................................... 21
Section VI. Changes in Shares and Shareholders ........................................................................ 30
Section VII. Preferred Stock ....................................................................................................... 34
Section VIII. Directors, Supervisors and Senior Executives ................................................... 35
Section IX. Corporate Bonds ............................................................................................................ 36
Section X. Financial Statements ...................................................................................................... 37
Section XI. Reference Documents Dictionary .............................................................................. 151

2016 Semi-annual Report
3 / 151
Section I. Definitions
The following terms have meaning below in this report unless the context requires otherwise:
Commonly-used words meaning
CSRC Refers to China Securities Regulatory Commission
SSE Refers to Shanghai Stock Exchange
Group
Corporation
Refers to Baosteel Group Corporation, the parent company of the
Company.
Ouyeel
Commerce
Refers to Ouyeel Commerce Co., Ltd., a subsidiary controlled by the
Company
Zhanjiang
Steel
Refers to Baosteel Zhanjiang Iron & Steel Co., Ltd., a subsidiary controlled
by the Company.
Baosight Refers to Shanghai Baosight Software Co., Ltd., a subsidiary controlled by
the Company.
One Body Two
Wings
Refers to A development strategy to enhance comprehensive competition
with iron and steel as the body and to create new driving force for
company development with wisdom manufacturing and platform
service from steel ecosystem of Ouyeel Commerce.
DCR
Refers to Double Cold Reduction is a second cold rolling for cold-rolled
strip steel to replace temper rolling after its annealing, a way to
produce thinner uncoated tinplate base with high strength.
Carbon steel
Refers to An alloy of iron and carbon, carbon content of which is usually
believed to be 0.04%-2% but most actually below 1.4%. Steel
contains iron, carbon, silicon, manganese, sulfur and
phosphorus, no other alloy elements, with silicon content no
more than 0.4% and manganese 0.8%.
Oriented
silicon steel
Refers to A kind of silicon steel that has an obvious pattern and certain orientation in crystallization arrangement, and in which the content of Si is commonly around 3%. It has a low core loss and high magnetic induction, of which the nominal thickness may be 0.20mm, 0.23mm, 0.27mm, 0.30mm or 0.35mm, etc. Oriented silicon steel is used in all kinds of electric transformers, etc.
CMMI5
Refers to Capability Maturity Model Integration (CMMI, also called
Software CMMI), an expandable product program integrating
multi-discipline and developed in 1994 by United States
Department of Defense and Carnegie Mellon University &
National Defense Industrial Association, which could be used to
guide a process improvement across an organization utilizing two
or more single discipline models. CMMI Level 5 is the highest
level.

2016 Semi-annual Report
4 / 151
Section II. Company Profile
I. Company Profile
Chinese Name 宝山钢铁股份有限公司
Chinese Abbreviation 宝钢股份
English Name Baoshan Iron & Steel Co., Ltd.
English Abbreviation Baosteel
Legal Representative Chen Derong
II. Contact Information
Secretary of Board of Directors Representative of Securities Affairs
Name Wu Kunzong Yu Hong
Address Board of Directors' Secretary Office of Baoshan Iron & Steel Co., Ltd., Baosteel Administration Center, 885 Fujin Rd. Baoshan District, Shanghai
Board of Directors' Secretary Office of Baoshan Iron & Steel Co., Ltd., Baosteel Administration Center, 885 Fujin Rd. Baoshan District, Shanghai
Tel. 86-21-26647000 86-21-26647000
Fax 86-21-26646999 86-21-26646999
E-mail [email protected] [email protected]
III. Basic Information Change
Registered Address 885 Fujin Road, Baoshan District, Shanghai
Zip Code of Registered Address 201900
Office Address 885 Fujin Road, Baoshan District, Shanghai
Zip Code of Office Address 201900
Internet website http://bg.baosteel.com/
E-mail [email protected]
IV. Company Announcements or Disclosures & Copies of the Report Change
Company Announcements or Disclosures published in:
China Securities News, Shanghai Securities News, and Securities Times
Semi-annual Report Website Designated by China Securities Regulatory Commission
http://www.sse.com.cn/
Copies of the Annual Report of the Company available at:
Baosteel Administration Center, 885 Fujin Road, Baoshan District, Shanghai
V. Profiles of Stocks of the Company
Stock Type Stock listed at Abbreviation of stock Stock code Abbreviation of stocks
before alteration
A-share Shanghai Stock Exchange Baosteel 600019 G Baosteel
VI. Changes of Registration of the Company during the Reporting Period
Date of registration March 21, 2016
Place of registration Shanghai
Registration number of Business License 91310000631696382C
VII. Other Relevant Information
None.

2016 Semi-annual Report
5 / 151
Section III. Accounting and Financial Highlights
I. Key Data
利润总额
RMB 50.2亿元2015年上半年:44.0亿元
商品坯材销量
1185.1万吨2015年上半年:1069.9万吨
普碳钢销售毛利率
20.1%2015年上半年:14.5%
独有和领先产品销量
686.8万吨2015年上半年:611.0 万吨
全方位成本削减额及完成率
RMB 38.0亿元,93%2016年目标:40.8亿元
经营活动现金流(不含财务公司)
RMB 113.0亿元2015年上半年:80.2亿元
电商业务收入
RMB 86.8 亿元2015年上半年:76.3亿元
劳动效率
员工劳动效率提升4.4%2016年目标: 3.8%
14% 11%
上升5.6个百分
点
完成率93%
14%
12%
上升0.6个百分
点
40.9%
II. Highlights of the Company
With powerful cost reform and full efforts to break through in high cost problems, the Company has done a
remarkable job in cost reduction in the first half year and completed 93% of the annual goal.
Ultra-strength steel for auto sheet in the first half year has been produced 60 % more than the same period
last year; BNA has achieved its goal in four respects of hot galvanizing unit #4 and been able to produce
1180Mpa two-way ultra-strength steel for auto sheet in batches.
Research Project on DCR Product and Core Technology has been awarded Shanghai Science and
Technology Progress as one of four representative scientific and technical achievements; CT 130 steel for
ultra-strength coiled tubing has been successfully trail-produced; The Company has been conferred on by
DNV GL submarine pipeline manufacturing and coating process certificate, becoming the first domestic
steel company earning this certificate.
Zhanjiang Steel project has been progressing smoothly: production lines of 2030 cold-rolled project were
connected on March 30, production line of heavy plate trail-ran under thermal load on May 28, and
Zhanjiang Steel #2 blast furnace was successfully ignited on July 15.
Ouyeel Commerce has established its 1000th warehouse adopting its administrative system, which means
its 1000 warehouses scheme has been completed; Baosight has passed CMMI5 international certificate
again, marking its most sophisticated software development and process control capacity.
Total profit RMB 5.02 billion First half year in 2015: RMB 4.4 billion
Gross margin of plain carbon steel sales 20.1% First half year in 2015: 14.5%
Overall cost reduction and its completion rate RMB 3.8 billion, 93% Goal in 2016: RMB 4.08 billion
Revenue from e-commerce RMB 8.68 billion First half year in 2015: RMB 7.63 billion
Commercial billets sales 11.851 million tons First half year in 2015: 10.699 million tons
Exclusive and leading product sales 6.868 million tons First half year in 2015: 6.110 million tons
Cash flow from operating activities (excluding Finance Co.) RMB 11.3 billion First half year in 2015: RMB 8.02 billion
Labor efficiency Employee labor efficiency up by 4.4 % Goal in 2016: 3.8%
Up by 5.6
ppts
Up by 0.6 ppts
Completion rate 93%

2016 Semi-annual Report
6 / 151
III. Major Accounting Data and Financial Indicators of the Company
i. Major Accounting Data
Unit: RMB Million
Major accounting data This reporting period
(January- June) Same period last
year Year-on-year change
(%)
Business income 77,993 80,771 -3.44
Net profit attributable to shareholders of listed company
3,468 3,174 9.26
Net profit attributable to shareholders of the listed Company less non-recurring gains and losses
3,682 3,144 17.11
Net cash flows from operating activities 8,277 9,407 -12.01
At the end of this reporting period
At the end of last reporting period
Year-on-year change (%)
Net assets attributable to shareholders of listed company
115,625 112,803 2.50
Total assets 266,265 234,123 13.73
ii. Major Financial Data
Major Financial Indicators
This reporting period
(January- June)
Same period last
year
Year-on-year change (%)
Basic earnings per share (Yuan/share) 0.21 0.19 10.53
Diluted earnings per share (Yuan/share) 0.21 0.19 10.53
Basic earnings per share net of non-recurring gains and losses (Yuan/share)
0.22 0.19 15.79
Weighted average return on equity (%) 3.03 2.76 Up by 0.27 ppts
Weighted average return on equity net of non-recurring gains and losses (%)
3.21 2.74 Up by 0.47 ppts
IV. Non-recurring Gains and Losses Items and Amount
√ Applicable □ Not applicable
Unit: RMB Million
Non-recurring Gains and Losses Items Amount Notes (if applicable)
Gains and losses from disposal of non-current assets -208
Government subsidy calculated in current gains and losses, but related to normal operating activities, except consecutive fixed government subsidy in lines with policies, rules and certain standards
114
Gains and losses from change of fair value for holding held-for-trading financial assets and liabilities, investment income at the disposal of held-for-trading financial assets and liabilities, and available-for-sale financial assets, except effective hedging operations
110
Other non-operating income and expenditure except above mentioned items
4
Gains and losses items in line with definition of Non-recurring gains and losses
-280
Affected amount belonging to minority shareholders -22
Effect of income tax 69
Total -213

2016 Semi-annual Report
7 / 151
Section IV. Board of Directors’ Report
I. Board of Directors’ Discussion and Analysis about Operation within Company Reporting Period
In the first half year of 2016, China has produced 400 million tons of crude steel, down by 1.1% year-on-year. Steel industry has recovered a little compared to the 4th quarter last year, but the supply-demand relationship has not been actually improved, even with more price fluctuation. Decapacity across steel industry still has a long way to go. Anti-dumping and trade barrier are bothering increasingly worse steel market. Though Chinese medium- and large-sized membership steel companies have made profit of RMB 12.59 billion, 427.3% more than same period last year, 26.3% of members are in the red.
As both the international environment and domestic economic development have been undergoing profound changes, domestic demand for iron and steel is facing a correction after violent fluctuations, the iron and steel industry is full of complexity and variability, and the Company is facing a critical stage of transformation, upgrade, advantage solidification, reform and innovation. During the reporting period, the Company realized an iron output of 12.761 million tons, a steel output of 13.27 million tons, commercial billets sales volume of 11.851 million tons, and combined profits of RMB 5.02 billion in total.
5500
6000
6500
7000
7500
1、2月月均 3月 4月 5月 6月
40.0
55.0
70.0
85.0
2014年粗钢 2015年粗钢 2016年粗钢 钢协价格综合指数(周)
To prepare for a traditionally slack market, production ramp-up of Zhanjiang Steel, and the Company’s comprehensive annual overhaul in the second half of the year, the Company would further change the way of thinking, consolidate the cost reduction realized in the first half of the year, accelerate market expansion, and enhance production and marketing collaboration, so as to tackle the impact of unfavorable external factors.
i. Analysis of Major Business
1. Analysis of Changes to Financial Statements
Unit: RMB Million
Item Current Period Same Period Last
Year Change (%)
Operating revenue 77,993 80,771 -3.44
Operating cost 67,070 71,525 -6.23
Sales expenses 1,016 971 4.63
Administrative expenses 3,362 3,494 -3.78
Financial expenses 1,157 444 160.37
Net cash flow from operating activities 8,277 9,407 -12.01
Net cash flow from investment activities -27,125 -8,584 -215.99
Net cash flow from financing activities 22,386 3,170 606.09
万吨 点
Jan. and Feb. Average
Point
March April June May
10,000 tons
Crude steel in 2014 Crude steel in 2015 Crude steel in 2016 CSPI of CISA (week)

2016 Semi-annual Report
8 / 151
(1) Notes to reasons of changes in financial expenses: Financial expense was up by RMB 710 million year on
year, mainly because of the following: due to the decrease in the amount of principal of long-term receivables from Wusong Plot, interest income for the first half of the year was down by RMB 120 million
year on year; whereas interest expense was up by RMB 620 million year on year, including: ① To avoid
exchange rate risk and prevent foreign exchange loss, the Company has implemented a RMB-based financing strategy in 2016. Compared to the foreign exchange-based financing strategy in 2015, the
financing interest rate saw an increase, and interest expense was up by RMB 270 million year on year; ②
As the construction in progress of Zhanjiang Steel, a subsidiary of the Company, was converted to fixed asset, the corresponding financing interest was no longer capitalized, and instead accounted as financial
expense, increasing interest expense by RMB 150 million year on year; ③ Based on the Company’s
judgment about the direct financing window, and the liquidity management need, newly increased direct financing was up to RMB 20 billion year on year, and interest expense was up by nearly RMB 200 million. In the meantime, the Company tried to ensure the preserving and appreciation of value of periodic idle capital at low risks, and relevant earnings would be confirmed as income from investment by stages according to the maturity date.
(2) Explanation of reason for net cash flow from operating activities: for details please see “3. Cash Flow Analysis.
(3) Explanation of reason for net cash flow from investment activities: for details please see“3. Cash Flow
Analysis. (4) Explanation of reason for net cash flow from financial activities: for details please see“3. Cash Flow
Analysis.
2. Analysis of Profit Composition
The Company has realized combined profit of RMB 5.02 billion in the first half year, RMB 620 million more than the same period last year, primarily due to internal ongoing cost reduction, category structure optimization and market development.
3. Cash Flows Analysis
(1) Analysis on cash flow from operating activities:
In the first half year of 2016, the Company realized RMB 8.28 billion of net cash inflow from operating activities, with RMB 9.41 billion in the same period last year, representing RMB 1.13 billion less inflow year-on-year and down by 12.0%. In the meantime, the Company realized 3.62 billion Yuan of net profit, 5.27 billion Yuan of fixed assets depreciation and amortization, 1.19 billion Yuan of financial cost and other projects, and 10.07 billion Yuan of cash receivable from operating. Flow decreased by 3.00 billion Yuan due to the increase of stock funds occupancy; flow decreased by 1.65 billion Yuan due to the increase of operational receivables, and flow increased by 2.86 billion Yuan due to the increase of operational payables.
Excluding the influence from finance company, net cash inflow from operating activities in the first half year was 11.30 billion Yuan, 3.28 billion Yuan more than 8.02 billion Yuan in the same period last year. Main reasons are as follows:
1)Net profit in the first half year was 3.51 billion Yuan, 260 million Yuan of flow more than 3.25 billion Yuan
in the same period last year;
2)Asset impairment reserve increased by 360 million Yuan, with the increase of 40 million Yuan in the
same period last year, increasing the flow of 320 million Yuan year-on-year.
3)Financial expense was 1.18 billion Yuan, with 470 million Yuan in the same period last year, increasing
cash flow of 710 million Yuan year-on-year.
4)Such items have decreased cash flow by 390 million Yuan year-on-year as depreciation amortization,
losses from fair value change, loss from disposal of assets, investment losses and changes in deferred asset liabilities.
5)Inventories in late June increased by 3.00 billion Yuan compared with the beginning of the year, with the
decrease of 830 million Yuan in the same period last year, decreasing the flow of 3.84 billion Yuan on year-on-year basis.
6)Operational receivables in late June increased by 1.19 billion Yuan compared with the beginning of the
year, with the increase of 1.19 billion Yuan in the same period last year, decreasing the flow of 810 million Yuan on year-on-year basis.
7)Operational payables in late June increased by 6.19 billion Yuan compared with the beginning of the
year, with the decrease of 830 million Yuan in the same period last year, increasing the flow of 7.02 billion Yuan on year-on-year basis.
(2) Analysis on cash flow from investment activities:
Net cash outflow from investment activities was 27.12 billion Yuan, increasing by 18.54 billion Yuan compared with 8.58 billion Yuan in the same period last year, with growth rate of 216.0%. It is mainly

2016 Semi-annual Report
9 / 151
because net expenses for capital operation of the Company increased by 24.57 billion Yuan compared to the same period last year; investment expenses in fixed assets and other long-term asset decreased by 6.45 billion Yuan compared to the last period last year.
(3) Analysis on cash flow from financing activities:
Net cash inflow from financing activities was 22.39 billion Yuan, increasing by 19.22 billion Yuan compared with 3.17 billion Yuan in the same period last year. It is mainly because debt financing scale this year increased by 23.88 billion Yuan compared with the beginning of the year, and debt financing scale in same period last year increased by 7.38 billion Yuan compared with the beginning of last year, increasing cash inflow of 16.50 billion Yuan on a year-on-year basis. Dividend and interest expenses decreased by 1.7 billion Yuan compared with the same period last year. In addition, the Company paid 1.5 billion Yuan for stock equity of Guangzhou Sheet Co., Ltd. to the Group Corporation, with the flow increasing by 1.5 billion Yuan year-on-year.
4. Analysis of Budgets and Plans Fulfillment
Total operating income budget of 2016 is 160.37 billion Yuan, and 78.11 billion Yuan was actually reached in the first half year, completing 48.7% of the annual budget. Operating cost budget is 149.13 billion Yuan, and 67.07 billion Yuan was actually reached in the first half year, completing 45.0% of the annual budget. In the second half year, the company will actively cope with more unfavorable difficulties and challenges, continue to enhance “cost reduction”, speed up the transformation of Zhanjiang Steel from construction to operation and build a stable and efficient manufacturing system with low cost and multi-bases. Meanwhile, the Company will push forward the new products development and maintain the advantages in differential competition to try to keep the domestically leading operating performance and constantly improve comprehensive competitiveness.
ii. Analysis of Business by Industry, by Products or by Region
1. Principal Business by Industry and Product
Unit: RMB Million
Principal Business by Industry
Industry Operating revenue
Operating cost
Gross margin
(%)
YoY change in revenue
(%)
YoY change
in cost (%)
YoY Change
in gross margin (%)
Iron & steel manufacturing
48,451 39,897 17.7 -5.8 -11.6 Up by 5.4 ppts
Processing & distribution
66,885 64,489 3.6 -8.1 -8.6 Up by 0.4 ppts
Information technology
1,717 1,203 29.9 6.7 3.5 Up by 2.2 ppts
E-commerce 11,984 11,954 0.2 55.5 55.1 Up by 0.2 ppts
Chemical 3,568 3,335 6.5 -8.4 -8.6 Up by 0.3 ppts
Finance 247 123 50.2 -23.2 -18.3 Down by 3.0 ppts
Offset between segments
-54,679 -53,829 1.6 -3.7 -5.0 Up by 1.4 ppts
Total 78,172 67,173 14.1 -3.5 -6.3 Up by 2.5 ppts
Principal Business by Product
Product Operating revenue
Operating cost
Gross margin
(%)
YoY change in revenue
(%)
YoY change in cost
(%)
YoY Change
in gross margin (%)
Cold-rolled carbon steel sheets and coils
21,757 16,457 24.4 -3.6 -11.5 Up by 6.7 ppts
Hot-rolled carbon steel sheets and coils
12,134 9,747 19.7 -2.1 -5.3 Up by 2.7 ppts
Steel tubes and pipes
2,930 2,920 0.3 -22.2 -22.2 Down by 0.038 ppts
Other iron and steel products
4,273 3,701 13.4 0.2 -10.0 Up by 9.7 ppts
Total 41,094 32,825 20.1 -4.4 -10.7 Up by 5.6 ppts
Note: Gross margin of steel products has incredibly increased than the same period last year, mainly due to overall advance of cost reduction and constant optimization in category structure.

2016 Semi-annual Report
10 / 151
Description of principal business in terms of different industries and products:
The company is divided into six management divisions - steel manufacturing, processing and distribution, information technology, E-commerce, chemical industry and finance in accordance with the internal organization structure. The Steel Manufacturing Division covers steel manufacturing units, Processing and Distribution Division covers Baosteel International and overseas companies and other trading units, Information Technology Division covers Baosight business, E-commerce Division covers Ouyeel Commerce and B-CHEM.COM business, Chemical Division covers the business of chemical companies, and Finance Division covers the business of Finance Co.
2. Principal Business by Region
The company exported 1.666 million tons of iron and steel products in the first half of 2016, with 1.147 million tons in the same period of 2015. Operating revenue by region is as follow:
Unit: RMB Million Region Operating revenue YoY change in revenue
Domestic market 68,848 -3.61
Overseas market 9,323 -2.71
iii. Analysis of Core Competitiveness
During the reporting period, 2016-2021 Development Plan of Baoshan Iron & Steel Co., Ltd. has been
prepared, guiding the Company to implement future sustainable development and maintain its best performance among the industry by.
The Company has seen obvious development and great result in “One Body Two Wings” during the reporting period. Staged improvements have been made in One Body (iron & steel business, involving fine base, manufacturing capacity, technical innovation, user service, environmental operation, etc.) and Two Wings (wisdom manufacturing and platform service from steel ecosystem of Ouyeel Commerce) respectively.
1. Continuously Improved Competitiveness of Iron & Steel Business
(1) Fine Base Construction
BNA has achieved its goal in four respects of hot galvanizing unit #4, besides, output, yield, energy consumption, efficiency and other indexes have outperformed intended goal. This marks that this unit, as a production line, has officially been able to produce 1180 two-way ultrastrength steel for auto sheet in batches and to contribute to quantitative trend and energy conservation and emission reduction of China’s auto industry.
During the reporting period, for Zhanjiang Steel, steelmaking department has expanded 130 categories, hot rolled department has expanded 61 steel categories and successfully rolled X80 pipeline steel and cold rolled department has expanded two categories, namely low-carbon mild steel and low-level IF steel. The production lines of 2030 cold rolled project have been connected, fully stepping into thermal-loaded trial-run.
(2) Manufacturing Ability Enhancement
During the reporting period, high-efficient oriented silicon steel B27R080 and B30R090 have realized their global debut and been successfully used for making transformers with extra-high voltage; high-grade coiled tubing CT110 has realized its global debut, being supplied in small batches; Zn-Al-Mg coating has been successfully applied to C908 unit in first industrial trial production, with its apparent quality meeting requirements of color-coated sheets and inner auto sheets; the first trial appraisal for laminated steel has been done among users of easy to open end, basic caps and hallow-drawn food cans, results of cooking adhesion experiment and other experiments were qualified; all certificate experiments of LPG low-temperature steel for vessels have been approved by 6 classification societies including ABS, BV and CCS, with the thickest certified at 40mm; BMD has established industrial trial production line and finished multiple trial production and application for users of fine-blanking steel, automotive frame and wheels, which serves BMD core technology with Baosteel feature; cooling-control equipment has been installed and the body has been debugged for Yantai Steel 460 online cooling, enabling automated and continuous cooling-control production with good uniform cooling at any point.
During the reporting period, the hot rolled high-strength steel of the Company has made breakthroughs after 3 years of benchmarking. Category specification, product performance, shape level, application

2016 Semi-annual Report
11 / 151
technologies by users and other aspects have reached international level with qualities of some products excessing that of benchmark, which were recognized by users.
(3) Technological Innovation Progress
During the reporting period, “Research on Baosteel DCR Product and Core Technology” has been awarded the first prize of Shanghai Science and Technology Progress; two projects (“Development and Engineering Application of High-strength Quenched and Tempered Steel Plate SA738Gr.B for Containment of Nuclear Power Plant AP-1000” and “Development on CT80-CT100 Coiled Sheets for Coiled tubing”) have been awarded the second and third prize of Shanghai Science and Technology Progress; “Research on Cold Rolled High-strength Thin Stripe Steel Welding Technology and Equipment and the Application” has been awarded the second prize (workers’ prize) of Shanghai Science and Technology Progress. Eight trademarks including new steel for track axle (LZ45CrV and EA1N) and inorganic and solid-lubricated GI steel plate (DC53D+Z-T and DC54D+Z-T) have been approved as Shanghai hi-tech products.
(4) Service Recognition From Users
During the reporting period, the Company has been rewarded by auto users with a collection of 2015 annual awards, including “Annual Excellent Supplier” by SAIC-GM, “Excellent Supplier” by FAW-VOLKSWAGEN, “Best Supplier Top 10” by FAW CAR, “Special Contribution” by FTMS, title of Excellent Supplier by Dongfeng Nissan, “GAC FAIT-Chrysler Excellent Supplier”, title of “Excellent Supplier” by Zhengzhou Nissan, “Sincere Partner” by Great Wall Motor, “Excellent Quality” and “Special Supply Support” by GAC Toyota Motor and title of “Excellent Supplier” by Guangxi Automobile Group.
During the reporting period, the Company has the honor to win a collection of 2015 annual awards from household appliances users, including “Award of Best Cooperation” by GE, “Gold Rubik's Cube Prize” by Haier and "Special Award for Stable Supply" by DAKIN Air-conditioning.
(5) Implementation of Environmental Management
The Company released 2015 Sustainable Development Report in the reporting period. The Report
presented a vision of sustainable development to “build a steel enterprise with the best performance, become the best environment-friendly practicer and become an urban steel mill for a better life”.
The Company has prepared a new round of urban steel mill development planning 2016-2021 in the reporting period. This planning defines the objective of “building upgraded green factory with premium steel manufacturing as core and constructing example urban steel mill with ecological harmony as basis” and implementation path of “over 100 projects and 10 billion investment”. The Company committed itself to matching regional 13th Five Year planning and reached wide consensus with local government in sharing resources, connecting urban industries and building ecological environment.
Steel slag processing equipment of the Company has played significant role in the reporting period, with annual processing rate up to 99.6%. 1.2 million tons of slag has been processed, which is the best history record, without any slag falling to the ground.
2. Accelerated the development of “Two Wings”
(1) Wisdom Manufacturing
During the reporting period, the Company and Siemens have officially entered into the Wisdom Manufacturing (Industry4.0) Strategic Agreement between Baosteel and Siemens. Baosteel and Siemens have established joint working group since 2015 to promote Project of Jointly Exploiting Industry 4.0 by Baosteel and Siemens (Project). Ministry of Industry and Information Technology of the People’s Republic of China has first trial-run the Project on the pilot project of intelligent manufacturing “1580 Hot Rolled Intelligent Workshop”, and Industry 4.0 standards for China’s steel industry have been further jointly established. Based on that, Baosteel and Siemens have formulated, when necessary, a business mode available for steel industry and other industries.
(2) Ouyeel Commerce
During the reporting period, Ouyeel Logistics have established 1000th warehouse adopting its administrative system, marking the “1000 Warehouses Scheme” of Ouyeel Commerce fully completed. “1000 Warehouses Scheme” was designed to build warehouse service capacity, cloud warehouse platform basis and core competitiveness of Ouyeel Logistics by rapidly deploying Baosaas system to boost its market share.
Ouyeel Commerce established Ouyeel International Co., Ltd. for overseas market in the reporting period.

2016 Semi-annual Report
12 / 151
iv. Investment Analysis
1. Overall Analysis of Outward Equity Investment
The company spent RMB 744 million in equity investment projects, with RMB 1.76 billion less than in the same period in 2014. Please see the following table for the main investment projects.
Unit: RMB Million
Name of Invested Company Nature of Business Baosteel’s Share in Equity of Invested
Company
Capital Actually Contributed by
Baosteel
Means of Capital
Contribution
Shanghai Ouyeel Financial Information Service Co., Ltd
Financial service platform
54.91% 500 Cash
Ouyeel International Co., Ltd. Steel service
platform 100.00% 99 Cash
Shanghai Ouyeel Resources Co., Ltd.
Resources service platform
60.00% 60 Cash
PT BAOSTEEL INDONESIA STEEL SERVICE CENTER
Steel cutting and processing center
100.00% 21 Cash
Baosteel Chemical Zhanjiang Co., Ltd.
Chemical 100.00% 30 Cash
Total 710

2016 Semi-annual Report
13 / 151
(1) Investment in Securities
√Applicable □Not applicable
S/N Type Code Abbreviation
Initial
investment
(RMB)
Shareholding (Share)
Book value
as at end of
period
(RMB)
Ratio in total share of
bond as
at end of period
(%)
Gains and
Losses in the
period
(RMB)
1 Convertible
bond 113009.SH GAC convertible bond 1,500,000.00 15,000 1,780,500.00 33.93 884,204.24
2 Convertible
bond 110035.SH Baiyun convertible bond 1,000,000.00 10,000 1,185,600.00 22.60 193,642.87
3 Convertible
bond 127003.SZ Haiyin convertible bond 886,000.00 8,860 886,000.00 16.89 0.00
4 Stock 601611.SH China Nuclear Engineering 118,389.46 34,118 713,748.56 13.60 446,519.33
5 Stock 601127.SH Sokon Stock 47,723.34 8,214 196,068.18 3.74 111,258.63
6 Stock 603737.SH SKSHU 20,323.50 1,275 148,002.00 2.82 95,758.88
7 Stock 601966.SH Linglong Tier 95,545.78 7,361 95,545.78 1.82 0.00
8 Stock 300515.SZ Sundy 10,541.10 1,230 57,650.10 1.10 35,331.75
9 Stock 603131.SH Shanghai Hugong 8,768.21 869 52,748.30 1.01 32,985.07
10 Stock 002799.SZ Global Printing 8,498.70 1,065 46,476.60 0.89 28,483.43
Other securities investment held at the end of the period 61,674.16 / 84,827.64 1.62 17,365.09
Gains and losses from sold securities investment in the reporting period / / / / 6,088,629.37
Total 3,757,464.25 / 5,247,167.16 100% 7,934,178.66

2016 Semi-annual Report
14 / 151
(2) Stocks Held in Other Listed Companies
√Applicable □Not applicable Unit: RMB
Code Abbreviation Initial investment BOP
shareholding ratio (%)
EOP shareholding
ratio (%) EOP book value
Gains and Losses in
current period
Change in shareholders’
equity in current period
Accounting type Share source
600508 Shanghai Energy 5,549,532.15 0.77% 0.77% 51,658,993.89 - -4,263,120.85 Financial assets
available for sale
Investment when
established
600997 Kailuan
Corporation 3,505,968.41 0.38% 0.38% 24,232,000.00 - -1,328,100.00
Financial assets available for sale
Investment when
established
601001 Datong Coal
Industry 2,571,428.57 0.22% 0.22% 19,332,000.00 - -486,000.00
Financial assets available for sale
Investment when
established
601699 Lu’an
Environmental Energy
5,047,135.05 0.51% 0.51% 100,411,137.90 - 1,381,804.65 Financial assets
available for sale
Investment when
established
000983 Xishan Coal
Electricity Group
941,660,003.69 1.35% 1.35% 347,665,193.90 - 66,227,020.06 Financial assets
available for sale
Acquisition at secondary
market
Total 958,334,067.87 / / 543,299,325.69 61,531,603.86 / /
(3) Equities Held in Financial Enterprises
√Applicable □Not applicable
Financial Enterprises Name
Initial investment (RMB)
BOP shareholding
ratio (%)
EOP shareholding
ratio (%)
EOP book value (RMB)
Gains and Losses in
current period (RMB)
Change in shareholders’
equity in current Period (RMB)
Accounting type Share source
ICBC 11,902,455.62 0.00 0.00 11,188,800.00 0 -713,655.62 Financial assets
available for sale Acquisition at
secondary market
Bank of Ningbo 5,359,184.65 0.01 0.01 5,453,820.00 0 94,635.35 Financial assets
available for sale Acquisition at
secondary market
Ping’an Bank 7,749,947.99 0.00 0.00 6,472,800.00 89,490.57 -1,277,147.99 Financial assets
available for sale Acquisition at
secondary market
Total 25,011,588.26 / / 23,115,420.00 89,490.57 -1,896,168.26 / /

2016 Semi-annual Report
15 / 151
2. Entrusted Financial Management Products and the Derivative Products in Non-Financial Companies
(1) Entrusted Financial Management
√Applicable □Not applicable Unit: RMB Million
Partner Name Products
Type Entrusted Amount
Starting Date
Expiration Date
Determined Payment Method
Anticipated Income
Actual Withdrawn Principal
Actual Gain
Legal Proceedin
gs
Provision Depreciati
on Reserves
Related Transac
tions
Involvement in lawsuit
s
Capital from
financing Association
Industrial Commercial
Bank of China Ltd.
ICBC financial product -win-win
100.00 2015/10/28 2016/3/24 Annual interest
rate 4.5% 1.82 100.00 1.82 Yes No No No
Shanghai Pudong Development Bank
Co., Ltd. Yield Plus 8,800.00 2016/1/12 2016/11/21
Annual interest rate 3.8%-5.2%
108.33 4,800.00 22.82 Yes No No No
Bank of China Limited
Zhihui Series 9,383.00 2015/7/8 2017/4/18 Annual interest
rate 3.55%-4.9%
249.72 3,000.00 49.94 Yes No No No
Agricultural Bank of China
An Xin De Li 14,600.00 2016/2/18 2016/11/17 Annual interest
rate 3.75%-4.25%
347.72 0.00 0.00 Yes No No No
Huabao Trust Co., Ltd.
Baoying Safety
Portfolio 1,920.00 2015/1/8 2019/6/17
Annual interest rate
4.275%-5.9% 168.69 900.00 73.00 Yes Yes No No
Group brother
company
China Universal Asset Management
Co,Ltd
China Universal-
Baosteel #1 Asset
Management Plan
100.00 2015/12/31 2016/12/30 Anticipated
income range 4.5%-5.5%
4.50 0.00 0.00 Yes No No No
JPMorgan Chase & Co.
USD Structured Financing
1,657.80 2016/5/10 2021/5/18 Anticipated
income range 2.55%-4%
211.37 0.00 0.00 Yes No No No
Total / 36,560.80 / / / 1,092.15 8,800.00 147.58 / / / / /
Total Amount of Past-due and Uncollected Principal and Gain (RMB) 0 Notes None

2016 Semi-annual Report
16 / 151
(2) Entrusted loans
□Applicable √Not applicable
(3) Other Investment in Financial Management Products and the Derivative Products
√Applicable □Not applicable Unit: RMB Million
Investment type Capital source Signing party Shares of
investment Investment term Product category
Anticipated gains
Profit Involvement in lawsuits
I. Other investment in financial management
Financial assets available for sale
Policy financial bonds Self-generated fund Interbank market 0.60 Less than one year Bond -2.51 3.27 No
Corporate bond Self-generated fund Interbank market 1.20 Less than one year Bond -1.46 2.79 No
Corporate bond (Tianwei) Self-generated fund Interbank market 0.50 Less than one year Bond Yes
Corporate bond Self-generated fund Interbank market 1.50 Over one year Bond -1.34 2.74 No
Open fund Self-generated fund Fund company 567.13 Over one year Fund 5.38 0.50 No
Trust plan Self-generated fund Trust company 1,441.06 Less than one year Trust 0.00 22.24 No
Trust plan Self-generated fund Trust company 414.00 Over one year Trust 0.00 12.32 No
Sub-total 2,425.99 0.07 43.85
Held-to-maturity investment
Bank financing Self-generated fund Bank 3,100.00 Less than one year
Financial management
0.00 21.18 No
Trust plan Self-generated fund Trust company 530.00 Less than one year Trust 0.00 15.75 No
Sub-total 3,630.00 0.00 36.94
Held-for-trading financial assets
Monetary fund Self-generated fund Fund company 1,430.01 Less than one year Fund 0.00 0.23 No
Monetary fund Self-generated fund Shanghai Stock Exchange
1.00 Less than one year Fund
-0.03 0.12 No
Bank financing Self-generated fund Bank 8,328.02 Less than one year
Financial management
0.00 7.92 No
Trust plan Self-generated fund Trust company 1,453.00 Less than one year Trust 0.00 2.12 No
同业存单 Self-generated fund Interbank market 295.79 Less than one year Bond 1.90 0.13 No
保险理财 Self-generated fund Insurance company 35.00 Less than one year
Financial management
0.00 0.00 No
Asset management plan Self-generated fund Asset management company
50.00 Less than one year Financial management
0.00 0.00 No
Sub-total 11,592.82 1.87 10.52
Total 17,648.81 1.94 91.31

2016 Semi-annual Report
17 / 151
II. Investment in derivative products
Forwards and Swaps Self-generated fund Bank 10,960.94 Less than one year Derivative -54.22 -54.48 No
Notes:
① All of the above financial management businesses were carried out by the Company’s subsidiary, the Finance Co., and Ouyeel Commerce. ② The “Shares of investment” listed above consisted of the investment cost as at the end of the previous year and the capital investment in this reporting year, and was
not the shares of investment corresponding to the investment types held at the end of the period. ③ The investment in derivative products consists of the forward business carried out by the Company and its subsidiary, Baosteel Singapore PTE Ltd. etc., to avoid the
exchange rate risk of asset liabilities calculated by foreign currencies. Note: Above available-for-sale financial assets involved in lawsuit are 500,000 “11 Tianwei MTN1” bills invested by the Company’s subordinate finance company, and the bill has been due on February 24, 2016. Because the interest of “11 Tianwei MTN2” bill, another medium-term bill issued by Baoding Tianwei, the same issuer as “11 Tianwei MTN1” bill, failed to be paid on April 21, 2015, “11 Tianwei MTN1” bill suffered from the default risk, the finance company brought a lawsuit to Shanghai Pudong New District Court for requesting Tianwei Group to immediately pay the principal and interest of the bill per par value and requiring a property preservation. Baoding Medium People’s Court officially accepted the application for bankruptcy reorganization of Baoding Tianwei Group Co., Ltd on Jan.8, 2016.
3. Use of Funds Raised
(1) Total use of Funds Raised
□Applicable √Not applicable
(2) Commitment Project of Funds Raised
□Applicable √Not applicable
(3) Change Project of Funds Raised
□Applicable √Not applicable
(4) Others
None.
2016 Semi-annual Report
18 / 151
4. Analysis of its Controlled Subsidiaries and Joint Stock Companies
(1) Shanghai Meishan Iron & Steel Co., Ltd. By the end of June, 2016, the Company had 77.0% shareholding of Shanghai Meishan Iron & Steel Co., Ltd. With a registered capital of RMB 7.08 billion, Meishan Steel specializes in black metal metallurgy, rolling processing and sales. By June 30, 2016, it had a total asset of RMB 30.93 billion and a net asset of RMB 9.57 billion, and achieved a net profit of RMB 140 million for the first half of 2016.
(2) Baosteel Zhanjiang Iron & Steel Co., Ltd. By June 30, 2016, the Company had 90% shareholding of Baosteel Zhanjiang Iron & Steel Co., Ltd. With a registered capital of RMB 20 billion, Zhanjiang Steel specializes in black metal metallurgy, rolling processing and sales. Currently, it is under construction. By June 30, 2016, it had a total asset of RMB 57.71 billion and a net asset of RMB 18.43 billion, and reported a net profit of RMB -150 million for the first half of 2016.
(3) Baosteel-NSC/Arcelor Automotive Steel Sheets Co., Ltd. By June 30, 2016, the Company owned 50% of Baosteel-NSC/Arcelor Automotive Steel Sheets Co., Ltd. (BNA). With a registered capital of RMB 3 billion, BNA is mainly engaged in the manufacturing and sales of cold-rolled steel sheets and hot-dip and electrolytic galvanized steel sheets for automobile and automotive parts and other services related to such businesses. By June 30, 2016, BNA had a total asset of RMB 5.36 billion and a net asset of RMB 3.54 billion, and achieved a net profit of RMB 120 million for the first half of 2016.
(4) Yantai Lubao Steel Pipe Co., Ltd. By June 30, 2016, the Company owned 100% of Yantai Lubao Steel Pipe Co., Ltd. With a registered capital of RMB 500 million, Lubao Steel Pipe is mainly engaged in the processing and sales of seamless steel pipe. Its major products include structural seamless steel pipe, low/medium pressure boiler seamless pipe, seamless pipelines for transportation of fluids, hydraulic seamless pipe, high pressure boiler seamless pipe, seamless pipe for oil pipelines, geological drillings, oil pipelines, oxygen canisters, and so on. By June 30, 2016, Lubao Steel Pipe had a total asset of RMB 930 million and a net asset of RMB 600 million, and reported a net profit of RMB -50 million for the first half of 2016.
(5) Baosteel Huangshi Coated and Galvanized Sheet Co., Ltd. By the end of June 30, 2016, the Company owned 58.5% of Baosteel Huangshi Coated and Galvanized Sheet Co., Ltd. (Huangshi). With a registered capital of RMB 170 million, Huangshi specializes in the production and sales of cold-rolled sheets, aluminium coated steel sheets, color-coated steel sheets and related coated steel products. RMB 72 million is planned to be further invested in Huangshi by Huangshi State-owned Assets Operation Co., Ltd., RMB 40 million of which has been first invested in the half year of 2016. After the capital increase is finished, Baosteel’s shareholding in Huangshi shall decrease to 50.63% from 58.45% before the increase. By June 30, 2016, Huangshi had a total asset of RMB 900 million and a net asset of RMB 430 million, and achieved a net profit of RMB 10 million for the first half of 2016.
(6) Shanghai Baosteel International Economic & Trading Co., Ltd. By June 30, 2016, the Company had a full shareholding of Shanghai Baosteel International Economic & Trading Co., Ltd. (Baosteel International). With a registered capital of RMB 2.25 billion, Baosteel International is mainly engaged in independent and agency imports and exports of goods and technology approved by the government, the imports of steel and scrap steel, processing with imported materials and the "three-plus-one" trading-mix. By June 30, 2016, Baosteel International had a total asset of RMB 39.44 billion and a net asset of RMB 14.77 billion, and achieved an a net profit of RMB 670 million for the first half of 2016.
(7) Shanghai Bassinet Software Co., Ltd. By June 30, 2016, the Company owned 55.5% of Shanghai Bassinet Software Co., Ltd. (Bassinet). With a registered capital of RMB 0.39 billion, Bassinet is mainly engaged in the research, design, development, manufacturing and integration of computer, automation, network communication systems and software & hardware products. By June 30, 2016, Bassinet had a total asset of RMB 6.46 billion and a net asset of RMB 4.07 billion, and achieved a net profit of RMB 200 million for the first half of 2016.
(8) Shanghai Baosteel Chemical Co., Ltd. By June 30, 2016, the Company had a full shareholding of Shanghai Baosteel Chemical Co., Ltd. (Baosteel Chemical). With a registered capital of RMB 2.11 billion, Baosteel Chemical is mainly engaged in the production and sales of raw chemical materials and products, “four techniques” services in chemical industry, and import and export activities of self-manufactured products. By June 30, 2016, Baosteel Chemical had a total asset of RMB 5.30 billion and a net asset of RMB 3.77 billion, and achieved a net profit of RMB 0.08 billion for the first half of 2016.

2016 Semi-annual Report
19 / 151
(9) Baosteel Nantong Iron & Steel Co., Ltd. By June 30, 2016, the Company had 95.8% of Nantong Iron & Steel. With a registered capital of RMB 620 million, Nantong Iron & Steel is mainly engaged in the production and sales of deformed steel bars, round steel bars, structural steel, semi-finished steel products (such as billet steel and steel ingot, etc.), as well as other iron & steel products and by-products. By June 30, 2016, Nantong Iron & Steel had a total asset of RMB 0.73 billion (with industrial land of about 1004 mu) and a net asset of RMB -1.44 billion, and reported a net profit of RMB -50 million for the first half of 2016. Baosteel Nantong Iron & Steel Co., Ltd. has been operating economically since April 2014 and stopped production and began asset disposal in October 2015.
(10) Baosteel Group Finance Co., Ltd. By June 30, 2016, the Company had 62.1% of Baosteel Group Finance Co., Ltd. (Finance Co.). With a registered capital of RMB 1.4 billion, Finance Co. is mainly engaged in absorbing deposits from member entities, providing loans to them, conducting internal financial transfers and relevant settlements between them, helping them in entrusted loan and investment, and engaged in deposits from or to other financial institutions. By June 30, 2016, Finance Co. had a total asset of RMB 15.13 billion and a net asset of RMB 1.91 billion, and achieved a net profit of RMB 70 million for the first half of 2016.
(11) Yantai Baosteel Pipe Co., Ltd. By June 30, 2016, the Company owned 80% of Yantai Baosteel Pipe Co., Ltd., with the rest 20% owned by Lubao Steel Pipe. With a registered capital of RMB 4 billion, Yantai Baosteel Pipe is mainly engaged in manufacturing, processing and sales of steel pipe, matching products and by-products, while providing technical consultation, storage, shipping, importing and exporting services of steel pipe rolling technology. By June 30, 2016, Yantai Baosteel Pipe had a total asset of RMB 4.14 billion and a net asset of RMB 1.20 billion, and reported a net profit of RMB -190 million for the first half of 2016.
(12) Ouyeel Commerce Co., Ltd. As of June 30, 2016, the Company (holding 8.67%) and the subsidiaries, Baosteel International, have owned 51% of shares. With registered capital of 2.4 billion Yuan, the Company is mainly engaged in technical consultation, technology development, technology services, technology transfer within the field of e-commerce, industrial investment, investment management, equity investment management, investment consultation, economic information consultation, enterprise management consultation, domestic trade (except special approval), import and export business of goods and technology, etc.. As of June 30, 2016, the company’s total assets have reached 6.18 billion Yuan, net worth reached 2.54 billion Yuan, and net profit reached -110 million Yuan in the first half year.
(13) Overseas Companies By June 30, 2016, the Company had overseas subsidiary companies in the U.S.A., Japan, Germany, Singapore, and Hong Kong China. These overseas subsidiaries extended the Company’s sales and purchase networks, and played a critical role in enhancing the Company’s international competitiveness.
5. Non-fundraising Projects
√ Applicable □ Not applicable
In the first half of 2016, the Company invested RMB 7.34 billion in fixed assets.
Notes for Non-fundraising Projects
① Project under Continued Construction
Zhanjiang Iron and Steel Project: In order to the implement the national Planning for Adjustment and Reviving of the Iron and Steel Industry and realize the iron and steel industry strategic adjustment of both Guangdong and Shanghai, production line of iron-making, steelmaking, hot rolling and cold rolling have been established in Donghai Island, Zhanjiang, Guangdong, with designed annual output of 8.23 million tons of molten iron, 8.928 million tons of molten steel, 8.749 million tons of continuous casting billet, and 6.89 million tons of steel, and it will be completed and put into operation in September 2016. Blast Furnace System #2 of Zhanjiang Steel Project has been installed and finished the debugging as of now with the thermal-loaded trial run starting consecutively.
Strip-to-silo change of coal yard E and F: In order to further improve the coal yard area environment, reduce random dust emission, and decrease material loss, strip-to-silo change of coal yard E and F has been conducted. The project will be completed and put into operation in December 2016. Civil construction of silo has been finished as of now and silo roof structure is under construction and equipment installation.
C-type closed reconstruction of Phase-I and Phase-II OC, OD strip. In order to further improve the raw material mine field environment, reduce random dust emission, and decrease material loss and moisture

2016 Semi-annual Report
20 / 151
content into the furnace, closed reconstruction of open mine has been conducted, and raw material yard will simultaneously realize automatic operation after the reconstruction. The project will be completed and put into operation in July, 2016. Now the installation and debugging have been finished.
Closed reconstruction of Phase-I and Phase-II uniformly mixed material filed BA & BB and
subordinate material filed OA & OB. In order to reduce dust raised from and loss in material at Phase-I and Phase-II uniformly mixed and subordinate material fields, reduce environmental pollution of material against the surrounding, uniformly mixed and open material filed has been performing the closed reconstruction, which is scheduled to be put into operation at the end of June, 2017. Now civil construction and steel structure preparation are in the progress.
II. Profit Distribution Plan or Capital Reserve Capitalization Plan
i. Performance or Adjustment of Profit Distribution Plan Implemented in the Reporting Period
The historical dividend distribution plans of the Company has met the requirements of the Articles of Association and been passed with shareholders' meeting resolution. The Company’s cash dividend standard and ratio are precise and clear, the related decision-making procedures and mechanisms are complete, the independent directors have performed due diligence and played due role, the minority shareholders have full opportunity to express their views and appeals, the legitimate rights and interests of minority shareholders have been fully maintained.
The Company's 2012 annual shareholders meeting passed "Motion on the Amendment of Articles of Association of Baoshan Iron & Steel Co. Ltd", which provides that "When the audited Company statements (unconsolidated) record positive net profit, the accumulated undistributed profit is positive, and the Company's cash flow meets the Company's normal operations and sustainable development, the Company shall distribute cash dividends of the year, which shall be no less than 50% of net profits attributable to the parent company in the annual audited consolidated statements of the Company, the cash dividend amount shall be tax inclusive. The cash paid for stock repurchase in the year shall be deemed as cash dividend.”
According to the Resolution of 2015 General Meeting of Shareholders held on April 28, 2016, 2015 annual profit distribution plan is as follows: with company’s total share capital of 16,466,927,244 shares as the base, each share has 0.06 Yuan of cash dividend (including tax), with total cash dividend amount of 988,015,633.44 Yuan (including tax). In 2015, the company did not implement distribution plan in other forms like capital reserves capitalization. The Board of Directors of the Company released the dividend distribution announcement in China Securities Journal, Shanghai Securities News and Securities Times on April 29, 2016, and determined the equity registration date for distributing dividend as June 7, 2016, ex-dividend day as June 8, 2016, dividend distribution date as June 8, 2016, and dividend distribution object as all the shareholders of the Company registered in Shanghai Branch of China Securities Depository and Clearing Company Limited after Shanghai Stock Exchange closed the transactions in the afternoon of June 7, 2016.
ii. Proposed Profit Distribution Plan and Capital Reserves Capitalization Plan in the First Half of 2015
Distribute or capitalize No
III. Other Disclosure Matters
i. Warnings and Instructions of Forecasting that the Accumulative Net Profit from the Beginning of the Year to the End of Next Reporting Period may be Deficit or There is Substantial Change Compared with the Same Period Last Year
□ Applicable√ Not applicable
ii. Notes to “Non-standard Auditor’s Report” of Accounting Firm from Board of Directors and Board of Supervisors
□ Applicable√ Not applicable
iii. Other Disclosure Events
None

2016 Semi-annual Report
21 / 151
Section V. Significant Events I. Legal Litigation, Arbitration and Wide Criticism from the Media
√ Applicable □ Not applicable
i. Legal Litigation and Arbitration Undisclosed in Temporary Announcement or with Subsequent Progress
□ Applicable √ Not applicable
ii. Other Notes
USSC submitted application to ITC on April 26 for initiating 337 investigations against carbon steel and alloy steel products exported to USA by several Chinese steel companies. ITC officially initiated the investigation against the accusation (anti-monopoly, trade secret and false source) in the application on May 27. The Company has formulated a leading team and relevant working teams as well as a respondent team consisting of selected Chinese and foreign lawyers for this case as soon as possible. The administrative law judge in this case made the first verdict on July 7, indicating that the accusations of the plaintiff overlapped the jurisdiction of DOC, whose comments are required when deciding, and the investigation shall be suspended. ITC Commission made a second verdict on August 5, which canceled the first verdict to re-initiate the investigation.
II. Bankruptcies and Restructuring
□ Applicable √ Not applicable
III. Assets Trading and Enterprise Merger
□ Applicable √ Not applicable
IV. Equity Incentive and Its Impact
√ Applicable □ Not applicable
i. Equity Incentive Undisclosed in Temporary Announcement or with Subsequent Progress
□ Applicable √ Not applicable
ii. Progress of “Share Incentive Scheme” in the reporting period
To establish and perfect the medium and long term incentive mechanism of Baoshan Iron & Steel, and to tightly combine the interest of executives of the Company and core technical personnel and management leaders who have direct impact on the Company’s overall performance and sustainable development with the interest of the Company, the investor and all stockholders to better realize the performance goal of the Company and operating development, according to relevant laws and regulations and provisions of superior competent departments, the Company implemented the First Rewarding of Restricted Stock Plan in 2014. For relevant information please see the Company’s annual report in 2014.
During the reporting period, the Company did not conduct the release and new granting of restricted stock. According to the national policy and the relevant provisions of the Company’s restricted stock, two incentive objects quitted from restricted stock plan according to the deliberation of the 6th meeting of the sixth Board of Directors on March 29, 2016. 590,300 restricted stocks failing to reach the release conditions were repurchased by the Company as per the granting price, and the cancellation was completed on May 25, 2016, decreasing the Company’s share capital by 590,300 Yuan.
As approved by the 7th meeting of the sixth board of directors on April 27, 2016, 1/3 of restricted stock granted to the incentive objects in the first rewarding plan shall not be released and shall be repurchased by the Company due to such indexes as 2015 total operating revenue failing to reach the first release condition.
2016 Semi-annual Report
22 / 151
The specific details on the adjustment of incentive object of restricted stock plan have been disclosed, and please visit the website of Shanghai Stock Exchange, http://www.sse.com.cn
V. Significant Related Party Transactions
√ Applicable □ Not applicable
i. Day-to-day Related Party Transactions
The major related parties of the Company are the legal persons directly controlled by Baosteel Group. In the reporting period, the Company had undertaken the following day-to-day related party transactions with its major related parties:
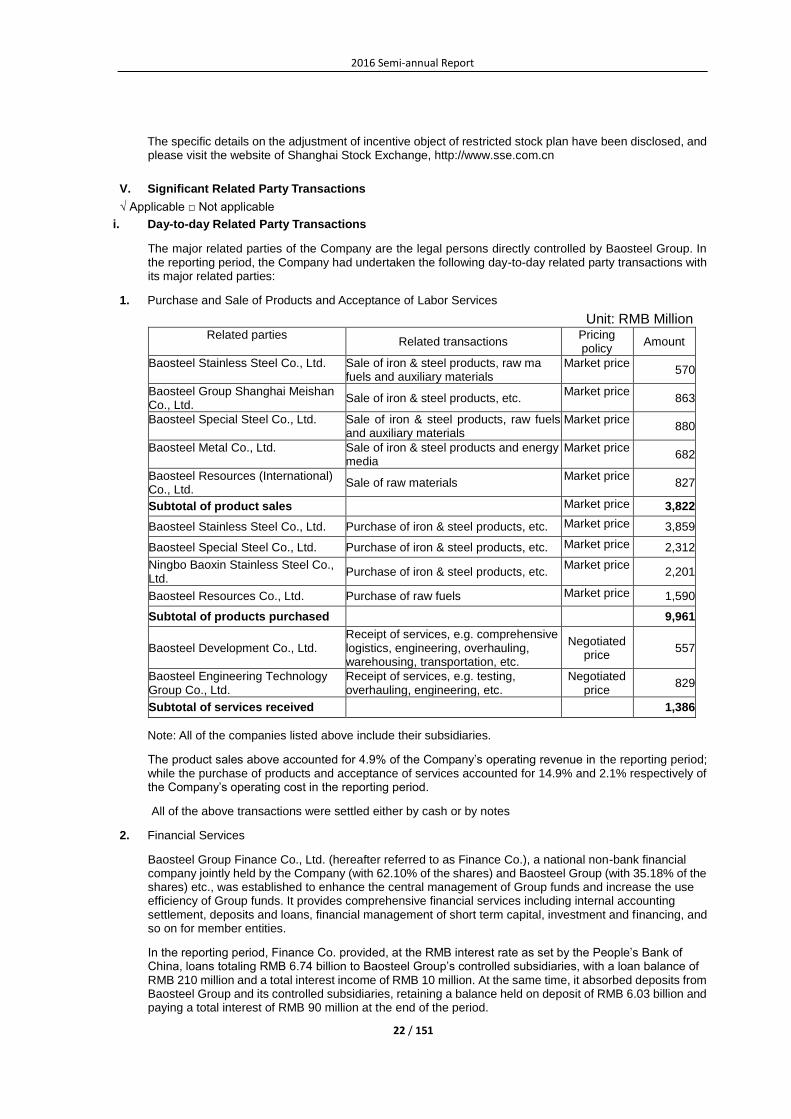
1. Purchase and Sale of Products and Acceptance of Labor Services
Unit: RMB Million Related parties
Related transactions Pricing policy
Amount
Baosteel Stainless Steel Co., Ltd. Sale of iron & steel products, raw ma fuels and auxiliary materials
Market price 570
Baosteel Group Shanghai Meishan Co., Ltd.
Sale of iron & steel products, etc. Market price
863
Baosteel Special Steel Co., Ltd. Sale of iron & steel products, raw fuels and auxiliary materials
Market price 880
Baosteel Metal Co., Ltd. Sale of iron & steel products and energy media
Market price 682
Baosteel Resources (International) Co., Ltd.
Sale of raw materials Market price
827
Subtotal of product sales Market price 3,822
Baosteel Stainless Steel Co., Ltd. Purchase of iron & steel products, etc. Market price 3,859
Baosteel Special Steel Co., Ltd. Purchase of iron & steel products, etc. Market price 2,312
Ningbo Baoxin Stainless Steel Co., Ltd.
Purchase of iron & steel products, etc. Market price
2,201
Baosteel Resources Co., Ltd. Purchase of raw fuels Market price 1,590
Subtotal of products purchased 9,961
Baosteel Development Co., Ltd. Receipt of services, e.g. comprehensive logistics, engineering, overhauling, warehousing, transportation, etc.
Negotiated price
557
Baosteel Engineering Technology Group Co., Ltd.
Receipt of services, e.g. testing, overhauling, engineering, etc.
Negotiated price
829
Subtotal of services received 1,386
Note: All of the companies listed above include their subsidiaries.
The product sales above accounted for 4.9% of the Company’s operating revenue in the reporting period; while the purchase of products and acceptance of services accounted for 14.9% and 2.1% respectively of the Company’s operating cost in the reporting period.
All of the above transactions were settled either by cash or by notes
2. Financial Services
Baosteel Group Finance Co., Ltd. (hereafter referred to as Finance Co.), a national non-bank financial company jointly held by the Company (with 62.10% of the shares) and Baosteel Group (with 35.18% of the shares) etc., was established to enhance the central management of Group funds and increase the use efficiency of Group funds. It provides comprehensive financial services including internal accounting settlement, deposits and loans, financial management of short term capital, investment and financing, and so on for member entities.
In the reporting period, Finance Co. provided, at the RMB interest rate as set by the People’s Bank of China, loans totaling RMB 6.74 billion to Baosteel Group’s controlled subsidiaries, with a loan balance of RMB 210 million and a total interest income of RMB 10 million. At the same time, it absorbed deposits from Baosteel Group and its controlled subsidiaries, retaining a balance held on deposit of RMB 6.03 billion and paying a total interest of RMB 90 million at the end of the period.

2016 Semi-annual Report
23 / 151
The related party transactions between the Company and the related parties mentioned in above items (1) and (2) were conducted based on the principle of mutual maximum profits and optimal operation efficiency, where the Company and the related parties chose each other with a clear aim of making the best of each other’s advantages via professional collaboration. All incurred amount are controlled within total annual estimated amount. And the day-to-day related party transactions between the Company and the related parties will continue.
3. Entrusted Capital for Management
In order to effectively raise the use efficiency of phased-available funds and with maintenance and appreciation of capital value, Baosteel entrusted its financial subsidiary for capital management, including purchasing financial products like funds and trust. During the reporting period, trading volume was RMB 3.12 billion, with RMB 2.69 billion highest closing balance, RMB 120 million confirmed incomes.
4. Undisclosed Matters in Temporary Announcement
□ Applicable √ Not applicable
ii. Related Transactions Resulting From Assets Acquisition and Sales
None
iii. Significant Connected Transaction of Common Foreign Investment
1. In 2016 first half year, the Company and the subordinate Ouyeel Commerce Co., Ltd. together
with Baosteel Group and the subsidiary Hwabao Investment Co., Ltd. increased by RMB 1.1 billion joint investment into Shanghai Ouyeel Financial Information Service Co., Ltd., with RMB 290 million from the Company and RMB 210 million from Ouyeel Commerce. After the capital increment, Shanghai Ouyeel Financial Information Service Co., Ltd. has a registered capital of RMB 1.4 billion, with the Company contributing RMB 290 million, holding 20.91% stock equity and Ouyeel Commerce Co., Ltd. RMB 480 million, holding 34% of stock equity.
2. In 2016 first half year, the Company and the subordinate Ouyeel Commerce Co., Ltd. together
with Baosteel Resources Holding (Shanghai) Co., Ltd. subordinate to Baosteel Group have jointly invested Shanghai Ouyeel Resources E-commerce Co., Ltd., with the registered capital of RMB 100 million, RMB 60 million of which was contributed by Ouyeel Commerce Co., Ltd., holding 60% of stock equity.
iv. Credit and Debt with Related Parties
1. Matters Disclosed in Temporary Announcement and Without Progress or Change in Subsequent Implementation
None.
2. Matters Disclosed in Temporary Announcement but With Progress or Change in Subsequent Implementation
The Company completed transfer of related assets of the subordinate stainless steel and special steel business units on April 1, 2012. The transfer payments of RMB 22.5 billion will be collected in equal installments over five years, or 20% each year. From 2013 onwards, principal and interest of the receivables will be collected on each April 1 until full payment on April 1, 2017. The asset transfer project has been approved by the general meeting of shareholders. At the end of June 2016, the long-term receivable balance was RMB 4.5 billion, including RMB 2.6 billion due from Shanghai Baosteel Stainless Steel Co., Ltd with corresponding installment interest income of RMB 25 million; and RMB 1.9 billion receivable from Baosteel Special Steel Co., Ltd., with installment interest income of RMB 18 million.
3. Matters Undisclosed in Temporary Announcement
□ Applicable√ Not applicable
v. Others
None
VI. Significant Contracts and Performance
1. Custody, Contract or Lease Matters
□ Applicable√ Not applicable

2016 Semi-annual Report
24 / 151
2. Guarantees
√Applicable □Not applicable Unit: RMB
External Guarantee (Excluding guarantee for subsidiaries)
Guarantor
Relation between guarantor and listed company
Secured
party
Amount
guaranteed
Guarantee date
(Execution date of
Agreement)
Duration
Expiry date
Guarantee type
If fully performed
If overdu
e
Overdue
amount
If any counter
guarantee
If guarante
ed by associated party
Association
Total guaranteed amount in the reporting period (excluding guarantees for subsidiaries)
Total guarantee balance at the end of the reporting period (A) (excluding guarantees for subsidiaries)
Guarantee for subsidiaries
Total guaranteed amount for subsidiaries in the reporting period
Total guarantee balance for subsidiaries at the end of the reporting period (B)
3,804,715,531.32
Total guarantee (including guarantee for subsidiaries)
Total guaranteed amount (A+B) 3,804,715,531.32
Total guaranteed amount accounting for net asset of the Company (%)
3.03%
Where:
Guaranteed amount provided to shareholders, actual controller and its associated parties (C)
Debt guaranteed amount provided to warrantee with direct or indirect asset-liability ratio over 70% (D)
Guaranteed amount exceeding 50% of net assets (E)
Total above guaranteed amount (C+D+E)
Note for undue guarantee which would cause joint satisfaction liability
The Company bears joint liability for above guarantees, however, no event which cause the Company to actually perform its joint liability has occurred.
Note for guarantee As of the end of June 2016, the Company has offered two joint liability performance guarantees for subordinate Baosteel Europe Trade Co., with the guaranteed amount of USD 531 million and the duration up to August 2017; the Company offered two joint liability performance guarantees for Baosteel Australia Trading Co., Ltd, a wholly- owned subsidiary of HOWA Trading Co., Ltd. with the amount of USD 14 million and the duration up to January 2018; the Company offered the joint liability performance guarantee for subordinate Baosteel Middle East Co., Ltd, with the amount of USD 29 million and duration to June 2018. Above guaranteed amount totaled to USD 574 million.
3. Other Significant Contracts or Deal
None.

2016 Semi-annual Report
25 / 151
VII. Commitments and Performance
VIII. √ Applicable □ Not applicable
i. Commitments of Listed Companies, Shareholders with over 5% Stock, Controlling Shareholders and Actual Controllers in and Continuing to the Reporting Period
Background Type Party Commitment content Date If any
duration
If strictly
perform in time
Specific reasons for
nonperformance in time
Notes for next plan if
nonperformance in time
Commitments related with the initial public offering (IPO)
Solve related transactions
Baosteel Group Co., Ltd.
Baosteel Group undertook the following two commitments as of the establishment of the Company: (1) All related transactions with the Company will be carried out in compliance with relevant laws, regulations and rules set by the authorities and will not damage the legitimate interest of the Company and its minority shareholders. (2) Baosteel Group promises it will not directly participate in any business activity or directly own interests in any business activity or entity that might pose competition to the Company’s current operating business. However, Baosteel Group can maintain its existing shares in the Company, as well as manage and develop existing business which is or may be in competition with the Company. If Baosteel Group and its subsidiaries are about to engage in any new business, investment or research that might be in competition with the products or services of the Company in the future, the Company has the priority to develop and acquire business said above. Commitments above will stay in force under two conditions: A. the Company is listed in Hong Kong Exchanges and Clearing Limited and domestic stock exchange of China and, B. Baosteel Group owns no less than 30% of the Company’s issued shares. In addition, on June 13, 2001, and September 6, 2002, Baosteel Group further pledged to uphold these two commitments after the Company’s acquisition of the assets related to construction of its phase three project and all remaining assets thereof. These commitments were published on China Securities News, Shanghai Securities News and Securities Times dated 21st June 2001 and 12th September 2002 and the official website of Shanghai Stock Exchange (http://www.sse.com.cn) as well.
February 3, 2000
No Yes
Commitments related with re-financing
Solve related transactions
Baosteel Group Co., Ltd.
Commitments made in the Prospectus of additional public offering by Baosteel Group:
(1) The Company has the right to acquire, at any time it thinks appropriate, Baosteel Group’s assets and businesses which may be in competition with the Company.
August 10, 2004
No Yes
2016 Semi-annual Report
26 / 151
(2) The Company shall enjoy the priority of similar business opportunities acquired by Baosteel Group, who will not invest until the Company gives up the commercial opportunities.
These commitments were publicly posted on official website of the Shanghai Stock Exchange (http://www.sse.com.cn) in April 2005.
Other commitments
Others Baosteel Group Co., Ltd.
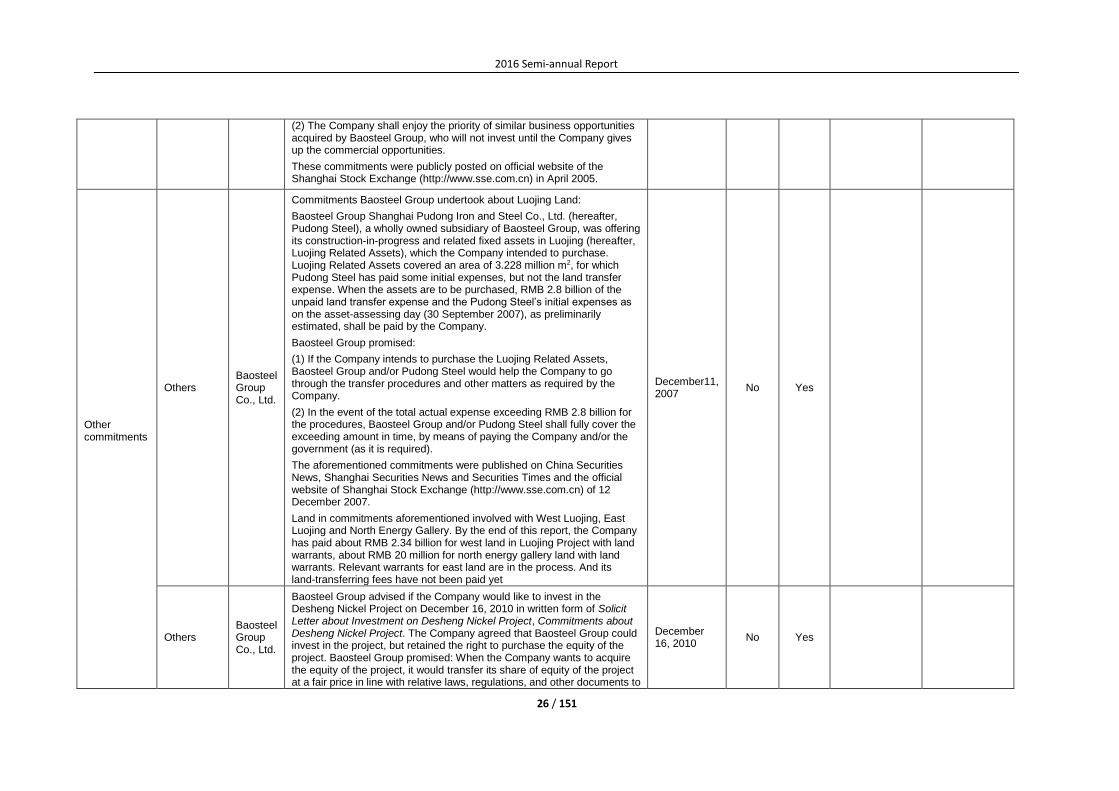
Commitments Baosteel Group undertook about Luojing Land:
Baosteel Group Shanghai Pudong Iron and Steel Co., Ltd. (hereafter, Pudong Steel), a wholly owned subsidiary of Baosteel Group, was offering its construction-in-progress and related fixed assets in Luojing (hereafter, Luojing Related Assets), which the Company intended to purchase. Luojing Related Assets covered an area of 3.228 million m2, for which Pudong Steel has paid some initial expenses, but not the land transfer expense. When the assets are to be purchased, RMB 2.8 billion of the unpaid land transfer expense and the Pudong Steel’s initial expenses as on the asset-assessing day (30 September 2007), as preliminarily estimated, shall be paid by the Company.
Baosteel Group promised:
(1) If the Company intends to purchase the Luojing Related Assets, Baosteel Group and/or Pudong Steel would help the Company to go through the transfer procedures and other matters as required by the Company.
(2) In the event of the total actual expense exceeding RMB 2.8 billion for the procedures, Baosteel Group and/or Pudong Steel shall fully cover the exceeding amount in time, by means of paying the Company and/or the government (as it is required).
The aforementioned commitments were published on China Securities News, Shanghai Securities News and Securities Times and the official website of Shanghai Stock Exchange (http://www.sse.com.cn) of 12 December 2007.
Land in commitments aforementioned involved with West Luojing, East Luojing and North Energy Gallery. By the end of this report, the Company has paid about RMB 2.34 billion for west land in Luojing Project with land warrants, about RMB 20 million for north energy gallery land with land warrants. Relevant warrants for east land are in the process. And its land-transferring fees have not been paid yet
December11, 2007
No Yes
Others Baosteel Group Co., Ltd.
Baosteel Group advised if the Company would like to invest in the Desheng Nickel Project on December 16, 2010 in written form of Solicit Letter about Investment on Desheng Nickel Project, Commitments about Desheng Nickel Project. The Company agreed that Baosteel Group could invest in the project, but retained the right to purchase the equity of the project. Baosteel Group promised: When the Company wants to acquire the equity of the project, it would transfer its share of equity of the project at a fair price in line with relative laws, regulations, and other documents to
December 16, 2010
No Yes

2016 Semi-annual Report
27 / 151
the Company and on basis of asset evaluation results as conducted by an individual assets evaluation agency.
These commitments stay in force under two conditions: (a) the company is listed at a stock exchange and (b) Baosteel Group owns no less than 30% of the Company’s issued shares.
The aforementioned commitments were published on China Securities News, Shanghai Securities News and Securities Times and the official website of Shanghai Stock Exchange (http://www.sse.com.cn) of December 23, 2010.
During the reporting period, Baosteel Group and the Company did not breach any of the aforementioned commitments.
IX. Engagement and/or Termination of Accounting Firm
□ Applicable √Not applicable
X. Punishment and Rectification of the Listed Company and Its Director, Supervisor, Senior Executives, Shareholders Holding over 5%, Actual Controller and Acquirer
□ Applicable √Not applicable
XI. Convertible Corporation Bonds
□ Applicable √Not applicable

2016 Semi-annual Report
28 / 151
XII. Corporate Governance
The Company has established a management structure with Baosteel features, in accordance with characterizations of iron and steel industry to support the strategic development and adapt to the manufacturing and operation. Moreover, the Company strictly stuck to relevant laws and regulations like Corporation Law, Securities Law, Code of Corporate Governance for Listed Companies in China and Rules Governing the Listing of Stocks on Shanghai Stock Exchange Declaration, constantly enhanced standard operation, strengthened scientific management, innovated interaction and communication channels, maintained good investor relationship, kept perfecting internal control system and overall risk management, and rigorously performed the obligation of information disclosure in an effort to improve the quality of operation and running.
All special commissions have fully taken advantage of their roles, enhanced the scientificity in the decisions of the board of directors and further improved the deciding efficiency. During the reporting period, the board of directors reviewed and approved 2016-2021 Development Plan of the Company, clarifying the strategic objectives and focus when the Company develops and giving full play to the board’s role of strategic deciding function.
During the reporting period, the Company has actively cooperated with regulators in various work and finished self-inspection in legitimate rights and interests protection among medium and small investors of listed companies to effectively boost the Company to constantly perfect corporate governance and internal administrative system construction.
XIII. Notes to Other Significant Events
i. Notes to the Reason and Impact of Accounting Policy, Estimation or Method Change from Board of Directors
□ Applicable √ Not applicable
ii. Notes to the Reason and Impact of Previous Important Error Correction from Board of Directors
□ Applicable √ Not applicable
iii. Others
The stock of Baoshan Iron & Steel Co., Ltd. (Company) has been suspended from trading since June 27, 2016 as applied due to strategical restructuring planned by Baosteel Group Corporation, controlling shareholder of the Company, and Wuhan Iron and Steel Corporation. Significant events as planned consisted of material assets reorganization of the Company as discussed and negotiated between interested parties. In order to ensure a fair information disclosure, protect investors’ interests and prevent the Company stock price from abnormal fluctuation, the Company, upon application, has suspended its stock from trading for no longer than 30 days since June 27, 2016 and published Trading Suspension Announcement for Material Assets Reorganization of Baoshan Iron& Steel Co., Ltd. on July 11, 2016. The Company published Continuous Trading Suspension Announcement for Material Assets Reorganization of Baoshan Iron& Steel Co., Ltd. on July 27, 2016 and the stock has been continuously suspended from trading for no longer than estimated 1 month since July 27, 2016. Then 10th session of sixth board of director reviewed and approved the Proposal on Material Assets Reorganization Extension of the Company before Resumption of Trading on August 26, 2016 and the Company published Trading Suspension Announcement for Material Assets Reorganization of Baoshan Iron& Steel Co., Ltd. on August 27, 2016. Upon application, the Company has continuously suspended its stock from trading since August 27, 2016, with the estimated duration no longer than 1 month. During the trading suspension for material assets reorganization, according to Measures for Administration of Material Assets Reorganization of Listed Companies and other relevant regulations, the Company has employed all necessary agencies to perform auditing, legal and financial consulting, etc., sorted out and discussed initial results in due diligence and performed particular research and demonstration concerning relevant significant issues involved. And the Company, according to the progress of material assets reorganization, properly fulfilled its obligation of information disclosure and published the progress of relevant matters every 5 trading days.
XIV. Significant Information Disclosure Index
S/N Items Published Date
1 Baosteel Announcement Concerning Issuing SCP Upon Approval and Registration
January 4, 2016
2 Baosteel Announcement Concerning Resignation of Chairman of Board of Supervisors
January 7, 2016
3 Resolution Announcement of Baosteel 4th Session of Sixth Board of Supervisors
January 7, 2016

2016 Semi-annual Report
29 / 151
4 Resolution Announcement of Baosteel 5th Session of Sixth Board of Directors
January 12, 2016
5 Notice of Baosteel Convening 2016 First Extraordinary General Meeting
January 12, 2016
6 2015 Baosteel Performance Express Announcement January 20, 2016
7 2016 Result Announcement of Baosteel Issuing SCP Phase I January 23, 2016
8 Baosteel 2016 First Extraordinary General Meeting Resolution Announcement
January 28, 2016
9 2016 Result Announcement of Baosteel Issuing SCP Phase II February 25, 2016
10 2016 Result Announcement of Baosteel Issuing MTN Phase I March 23, 2016
11 Pre-announcement for Online Presentation of Baosteel 2015 Annual Performance
March 29, 2016
12 Resolution Announcement of Baosteel 6th Session of Sixth Board of Directors
March 31, 2016
13 Resolution Announcement of Baosteel 5th Session of Sixth Board of Supervisors
March 31, 2016
14 2016 Baosteel Daily Related-Party Transaction Announcement March 31, 2016
15 Notice of Baosteel Convening 2015 Annual General Meeting March 31, 2016
16 Baosteel Notifying Creditors Announcement March 31, 2016
17 Pre-announcement for Online Presentation of Baosteel 2016 First Quarter Performance
April 23, 2016
18 Resolution Announcement of Baosteel 7th Session of Sixth Board of Directors
April 28, 2016
19 Announcement of Baosteel Principal Business Data in 2016 First Quarter
April 28, 2016
20 Resolution Announcement of Baosteel 6th Session of Sixth Board of Supervisors
April 28, 2016
21 Baosteel Announcement Concerning Resignation of Vice General Manager
April 28, 2016
22 Resolution Announcement of Baosteel 2015 Annual General Meeting
April 29, 2016
23 Baosteel Announcement Concerning Resignation of Directors May 24, 2016
24 Baosteel Announcement Concerning Repurchase and Cancel of Part Restricted Stock
May 25, 2016
25 Resolution Announcement of Baosteel 8th Session of Sixth Board of Directors
June 2, 2016
26 Baosteel Announcement Concerning Resignation of Vice General Manager
June 2, 2016
27 Baosteel Announcement Concerning Resignation of CFO and Secretary to Board of Directors
June 2, 2016
28 Baosteel Announcement of Implementing 2015 Annual Profit Distribution Scheme
June 2, 2016
29 Baosteel Trading Suspension Announcement June 27, 2016
The aforementioned announcements may be found in "China Securities Journal", "Shanghai Securities News", "Securities Times" and the Shanghai Stock Exchange website http://www.sse.com.cn.

2016 Semi-annual Report
30 / 151
Section VI. Changes in Shares and Shareholders I. Changes in Capital Stock
i. List of Changes in Shares
1. List of Changes in Shares
Unit: share
Before the change Changes in the period (+, -) After the change
Shares Ratio (%) Shares newly issued
Shares dividend
Share dividend from accumulation
fund
Others Subtotal Shares Ratio (%)
I. Shares subject to conditional sales 43,238,700 0.26 -590,300 -590,300 42,648,400 0.26
1. State-owned shares
2. State-owned legal person shares
3. Other domestic shares
Among which: domestic non-state-owned legal person shares
Domestic natural person shares
43,238,700 0.26 -590,300 -590,300 42,648,400 0.26
4. Foreign shares
Among which: foreign legal person shares
foreign natural person shares
II. Shares not subject to conditional sales
16,424,278,824 99.74 16,424,278,824 99.74
1.RMB ordinary shares 16,424,278,824 99.74 16,424,278,824 99.74
2.Domestic listed international investment shares
3.Overseas listed international investment shares
4. Others
III. Total 16,467,517,524 100.00 -590,300 -590,300 16,466,927,224 100.00

2016 Semi-annual Report
31 / 151
2. Explanation of Changes in shares
Proposal on Adjusting Incentive Object of Restricted Stock Plan was reviewed and approved at the 6th meeting of the sixth Board of Directors held between March 29 and 269930, 2016.
The Company repurchased 590,300 shares of restricted stock failing to reach the unlocking conditions of the incentive object withdrawing from A Restricted Stock Plan on May 23, 2016, and completed cancellation on May 25, 2016. As of June 30, 2016, the Company’s total capital stock has reached 16,466,927,224 shares, including 42,648,400 shares of restricted tradable shares and 16,424,278,824 shares of non-restricted tradable shares.
3. Influence of Share Change upon the Earnings Per Share, Net Asset Per Share and Other Financial Indicators during the Period from the End Date of the Reporting Period to Disclosure Date of Semi-year Report (if any)
None.
4. Other Contents Necessary for the Company or Required by Securities Regulatory Initiations to Disclose
None.
ii. Change of Shares Subject to Conditional Sales
√ Applicable □ Not applicable Unit: share
Name Shares at the beginning of
period
Shares released in the
period
Shares added in the period
Shares at the end of the
period Reason
Releasing date
Stock incentive object
43,238,700 0 -590,300 42,648,400 Stock
incentive
Total 43,238,700 0 -590,300 42,648,400 / /
Note 1: The decrease of shares subject to conditional sales during the reporting period is because the Company repurchased and cancelled 590,300 restricted stocks failing to reach the release conditions of the incentive object withdrawing from A-share restricted stock plan.
Note 2: Date of releasing restricted sales is upon the expiration of two years of restricted period and when the release conditions are met.
II. Shareholders
i. Total Shareholders:
Total number of shareholders at the end of the reporting period (persons)
300,893
Total preferred stock holders whose voting right restored as of the end of the reporting period (persons)
ii. Top 10 Shareholders, Top 10 Tradable Shareholder (or Holders of Shares not Subject to Conditional Sales) by the End of the Reporting Period
Unit: share
Shareholding of top 10 shareholders
Name (Full Name)
Increase or decrease during the
period
Shares at the end of the
reporting period
Ratio (%)
Shares subject to conditional
sales
pledged or frozen
Sharehold
er natur
e Status
Quantity
Baosteel Group Corporation 0 13,130,265,267 79.737 0 None 0 State-owned
China Securities Finance Co., Ltd.
0 444,813,261 2.701 0 None 0 State-owned
Central Huijin Asset Management Co., Ltd
0 122,230,300 0.742 0 None 0 State-owned
Hong Kong Securities Clearing Company Ltd.
66,188,256 89,836,856 0.546 0 None 0 Unknown
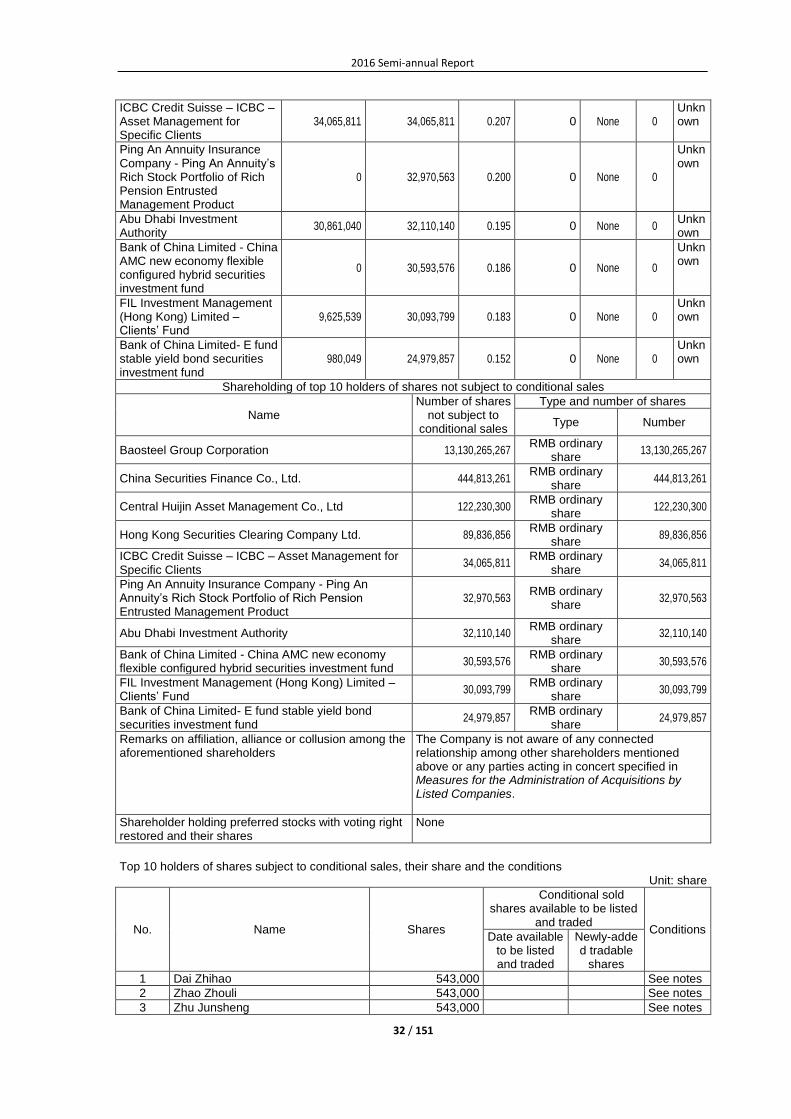
2016 Semi-annual Report
32 / 151
ICBC Credit Suisse – ICBC – Asset Management for Specific Clients
34,065,811 34,065,811 0.207 0 None 0 Unknown
Ping An Annuity Insurance Company - Ping An Annuity’s Rich Stock Portfolio of Rich Pension Entrusted Management Product
0 32,970,563 0.200 0 None 0
Unknown
Abu Dhabi Investment Authority
30,861,040 32,110,140 0.195 0 None 0 Unknown
Bank of China Limited - China AMC new economy flexible configured hybrid securities investment fund
0 30,593,576 0.186 0 None 0
Unknown
FIL Investment Management (Hong Kong) Limited – Clients’ Fund
9,625,539 30,093,799 0.183 0 None 0 Unknown
Bank of China Limited- E fund stable yield bond securities investment fund
980,049 24,979,857 0.152 0 None 0 Unknown
Shareholding of top 10 holders of shares not subject to conditional sales
Name Number of shares
not subject to conditional sales
Type and number of shares
Type Number
Baosteel Group Corporation 13,130,265,267 RMB ordinary
share 13,130,265,267
China Securities Finance Co., Ltd. 444,813,261 RMB ordinary
share 444,813,261
Central Huijin Asset Management Co., Ltd 122,230,300 RMB ordinary
share 122,230,300
Hong Kong Securities Clearing Company Ltd. 89,836,856 RMB ordinary
share 89,836,856
ICBC Credit Suisse – ICBC – Asset Management for Specific Clients
34,065,811 RMB ordinary
share 34,065,811
Ping An Annuity Insurance Company - Ping An Annuity’s Rich Stock Portfolio of Rich Pension Entrusted Management Product
32,970,563 RMB ordinary
share 32,970,563
Abu Dhabi Investment Authority 32,110,140 RMB ordinary
share 32,110,140
Bank of China Limited - China AMC new economy flexible configured hybrid securities investment fund
30,593,576 RMB ordinary
share 30,593,576
FIL Investment Management (Hong Kong) Limited – Clients’ Fund
30,093,799 RMB ordinary
share 30,093,799
Bank of China Limited- E fund stable yield bond securities investment fund
24,979,857 RMB ordinary
share 24,979,857
Remarks on affiliation, alliance or collusion among the aforementioned shareholders
The Company is not aware of any connected relationship among other shareholders mentioned above or any parties acting in concert specified in Measures for the Administration of Acquisitions by Listed Companies.
Shareholder holding preferred stocks with voting right restored and their shares
None
Top 10 holders of shares subject to conditional sales, their share and the conditions
Unit: share
No. Name Shares
Conditional sold shares available to be listed
and traded Conditions
Date available to be listed and traded
Newly-added tradable
shares
1 Dai Zhihao 543,000 See notes
2 Zhao Zhouli 543,000 See notes
3 Zhu Junsheng 543,000 See notes

2016 Semi-annual Report
33 / 151
4 Li Yongxiang 488,700 See notes
5 Zhou Jianfeng 488,700 See notes
6 Wang Jing 488,700 See notes
7 Lu Rong 488,700 See notes
8 Chu Shuangjie 488,700 See notes
9 Zhi Xiwei 488,700 See notes
10 Sheng Genghong 434,400 See notes
11 Zhang Pijun 434,400 See notes
12 Zhang Dianbo 434,400 See notes
13 Zhu Kebing 434,400 See notes
14 Yao linlong 434,400 See notes
15 Wei Chengwen 434,400 See notes
16 Xie Qi 434,400 See notes
17 Wang Qiangmin 434,400 See notes
18 Shi Bing 434,400 See notes
19 Zhong Yongqun 434,400 See notes
Notes on affiliation, alliance or collusion among the aforementioned shareholders
Above shareholders are incentive objectives of Baosteel 2014 First Awarding Scheme of A Share Restricted Share Plan. For the conditions, please refer to Baosteel First Awarding Scheme of A Share Restricted Share Plan on the website of Shanghai Stock Exchange http://www.sse.com.cn
iii. Strategic Investors or General Legal Persons Who Become Top 10 Shareholders Due to Right Issue
□ Applicable √ Not applicable
III. Change of Controlling Shareholders and Actual Controllers
□ Applicable √ Not applicable

2016 Semi-annual Report
34 / 151
Section VII. Preferred Stock □ Applicable √ Not applicable

2016 Semi-annual Report
35 / 151
Section VIII. Directors, Supervisors and Senior Executives
I. Shareholding Change
i. Shareholding of Directors, Supervisors, and Senior Executives in Service or Leaving the Company during the Period:
□ Applicable √ Not applicable
ii. Granted Equity Incentive of Directors, Supervisors and Senior Managements in the Reporting Period
□ Applicable √ Not applicable
II. Change of Directors, Supervisors, and Senior Executives
√ Applicable □ Not applicable
Name Position Change Reason
Zhao Zhouli Director Leave office Resignation in July 2016
Wang Li Director Leave office Resignation in July 2016
Liu An Director Hired Employment in August 2016
Zhang Helei Supervisor Hired Employment in August 2016
Wu Kunzong Supervisor Leave office Resignation in May 2016
Sheng Genghong Vice general manager Hired Employment in June 2016
Wu Kunzong CFO , secretary to board of directors
Hired Employment in June 2016
Zhang Dianbo Vice general manager Leave office Resignation in April 2016
Li Yongxiang Vice general manager Leave office Resignation in May 2016
Zhu Kebing CFO , secretary to board of directors
Leave office Resignation in May 2016
III. Other Notes
None.

2016 Semi-annual Report
36 / 151
Section IX. Corporate Bonds
□ Applicable √ Not applicable

2016 Semi-annual Report
37 / 151
Section X. Financial Statements Audit Report
□ Applicable √ Not applicable
Financial Statements
Consolidated Balance Sheet
June 30, 2016 Name of enterprise: Baoshan Iron & Steel Co., Ltd.
Unit: RMB Yuan Item Note Ending Balance Beginning Balance
Current assets:
Monetary fund (V) 1 13,525,255,671.74 7,816,943,116.11
Financial assets measured at fair value and the change included in current gains and losses
(V) 2 1,658,109,189.61 872,874,998.19
Bill receivable (V) 3 7,778,141,418.40 8,192,598,702.78
Accounts receivable (V) 4 9,106,820,532.55 9,158,063,277.11
Prepayments (V) 5 4,820,917,280.64 4,159,608,819.61
Interest receivable (V) 6 49,019,769.31 294,162,019.29
Dividends receivable (V) 7 23,852,647.00 162,869,833.28
Other receivables (V) 8 1,685,622,939.44 1,057,234,780.61
Purchase of resale of financial assets (V) 9 2,140,000,000.00
Stock (V) 10 26,559,271,113.64 23,515,760,734.54
Non-current assets due within one year (V) 11 4,661,182,224.00 4,500,000,000.00
Other current assets (V) 12 33,117,829,970.79 8,032,867,446.36
Total current assets 102,986,022,757.12 69,902,983,727.88
Non-current assets:
Loans and advances (V) 13 2,005,771,752.70 2,238,404,977.48
Available-for-sale financial assets (V) 14 12,571,338,378.45 10,924,024,795.65
Long-term receivables (V) 15 121,450,485.49 4,579,073,208.90
Long-term equity investment (V) 16 5,147,502,037.47 5,010,366,850.50
Investment property (V) 17 373,154,433.34 373,337,165.32
Fixed assets (V) 18 103,544,012,203.89 91,067,560,315.55
Construction in progress (V) 19 23,283,511,980.46 33,628,389,473.68
Engineering materials (V) 20 39,159,109.48 55,433,580.47
Intangible assets (V) 21 11,694,684,190.44 9,251,464,486.88
Long-term prepaid expenses (V) 22 1,070,087,336.19 1,057,177,388.37
Deferred income tax assets (V) 23 1,680,836,677.52 1,520,955,982.61
Other non-current assets (V) 24 1,747,790,693.49 4,513,975,000.00
Total non-current assets 163,279,299,278.92 164,220,163,225.41
Total assets 266,265,322,036.04 234,123,146,953.29
Current liabilities:
Short-term loan (V) 25 33,610,254,181.49 27,111,031,934.70
Borrowing from the Central Bank 181,809,192.00 130,730,819.70
Deposits-taking and due to banks (V) 26 6,649,755,957.49 10,009,980,135.82
Borrowing money (V) 27 198,000,000.00 198,000,000.00
Financial liabilities measured at fair value and the change included in current gains and losses
57,873,954.55 3,608,651.05
Notes payable (V) 28 4,862,676,183.69 4,433,892,369.95

2016 Semi-annual Report
38 / 151
Accounts payable (V) 29 23,798,446,650.75 21,385,905,275.51
Advances from customers (V) 30 14,243,355,002.77 12,467,881,559.99
Employee benefits payable (V) 31 2,134,781,854.02 1,671,753,461.42
Taxes payable (V) 32 3,640,157,641.80 1,698,315,074.97
Interest payable (V) 33 259,910,503.39 199,607,814.92
Dividends payable (V) 34 40,544,225.23 625,765.44
Other payables (V) 35 2,565,647,608.97 2,283,044,126.16
Non-current liabilities due within one year (V) 36 113,908,628.83 208,114,896.18
Other current liabilities (V) 37 20,334,174,336.32 10,057,344,262.30
Total current liabilities 112,691,295,921.30 91,859,836,148.11
Non-current liabilities:
Long term loan (V) 38 11,680,750,586.32 9,111,026,384.68
Bonds payable (V) 39 13,964,217,441.01 8,747,373,959.29
Long-term payables (V) 40 81,458,444.00 82,585,917.00
Long-term employee benefits payables (V) 41 328,635,121.63 328,307,328.96
Special payables (V) 42 258,570,000.00 292,916,697.81
Deferred gains (V) 43 1,077,892,648.14 1,092,839,458.77
Deferred income tax liabilities (V) 23 487,988,632.80 454,701,623.19
Other non-current liabilities (V) 44 7,923,822.88 7,134,514.14
Total non-current liabilities 27,887,436,696.78 20,116,885,883.84
Total Liabilities 140,578,732,618.08 111,976,722,031.95
Owner’s equity
Share capital (V) 45 16,466,927,224.00 16,467,517,524.00
Capital reserve (V) 46 33,776,012,741.54 33,739,882,090.62
Less: treasury stock (V) 47 81,458,444.00 82,585,917.00
Other comprehensive income (V) 48 -706,678,601.41 -997,587,960.09
Special reserves (V) 49 24,565,723.47 10,915,599.63
Surplus reserve (V) 50 26,516,654,926.34 26,516,654,926.34
Undistributed profit (V) 51 39,628,914,745.00 37,148,447,581.69
Total owners' equity attributable to parent company
115,624,938,314.94 112,803,243,845.19
Minority interests 10,061,651,103.02 9,343,181,076.15
Total owner's equity 125,686,589,417.96 122,146,424,921.34
Total Liabilities and owner's equity 266,265,322,036.04 234,123,146,953.29
Legal representative: Chen Derong Person in charge of accounting work: Wu Kunzong Chief Accountant: Wang Juan

2016 Semi-annual Report
39 / 151
Balance Sheet of Parent Company
June 30, 2016 Name of enterprise: Baoshan Iron & Steel Co., Ltd.
Unit: RMB Yuan
Item Note Ending Balance Beginning Balance
Current assets:
Monetary fund 7,586,762,617.66 2,609,809,152.05
Financial assets measured at fair value and the change included in current gains and losses
Derivative financial assets
Bill receivable 11,100,512,680.89 9,485,523,681.41
Accounts receivable (XV)1 16,477,696,719.74 14,528,789,667.02
Prepayments 1,362,039,023.42 1,253,626,615.28
Interest receivable 84,792,379.91 373,908,851.48
Dividends receivable
Other receivables (XV)2 262,244,600.25 249,886,362.58
Stock 10,098,721,069.07 10,004,843,968.85
Non-current assets due within one year 4,500,000,000.00 4,500,000,000.00
Other current assets 32,532,205,082.99 12,923,012,337.05
Total current assets 84,004,974,173.93 55,929,400,635.72
Non-current assets:
Available-for-sale financial assets 8,844,897,096.20 8,844,897,096.20
Held-to-maturity investments
Long-term receivables 2,187,982,930.56 6,645,532,930.56
Long-term equity investment (XV)3 45,677,085,360.49 46,254,613,054.24
Investment property
Fixed assets 46,776,056,956.48 49,147,433,841.75
Construction in progress 3,395,300,937.35 2,841,837,566.36
Engineering material 7,802,394.07 29,585,906.85
Intangible assets 3,666,532,332.90 3,707,611,299.90
Long-term prepaid expenses 60,035,098.20 73,013,638.42
Deferred income tax assets 1,486,643,086.06 851,482,708.40
Other non-current assets 323,753,436.68 396,867,364.20
Total non-current assets 112,426,089,628.99 118,792,875,406.88
Total assets 196,431,063,802.92 174,722,276,042.60
Current liabilities:
Short-term loan 24,822,256,718.66 19,223,563,658.59
Financial liabilities measured at fair value and the change included in current gains and losses
57,873,954.55
Notes payable 2,395,388,249.49 1,520,322,564.34
Accounts payable 15,401,794,171.53 16,361,219,616.35
Advances from customers 9,911,291,491.64 10,723,769,050.31
Employee benefits payable 1,274,652,358.79 1,102,916,994.13
Taxes payable 3,067,440,325.42 2,040,209,581.28
Interest payable 154,398,115.59 52,052,454.92
Dividends payable
Other payables 210,447,754.72 484,621,748.19
Liabilities classified as held-for-sale
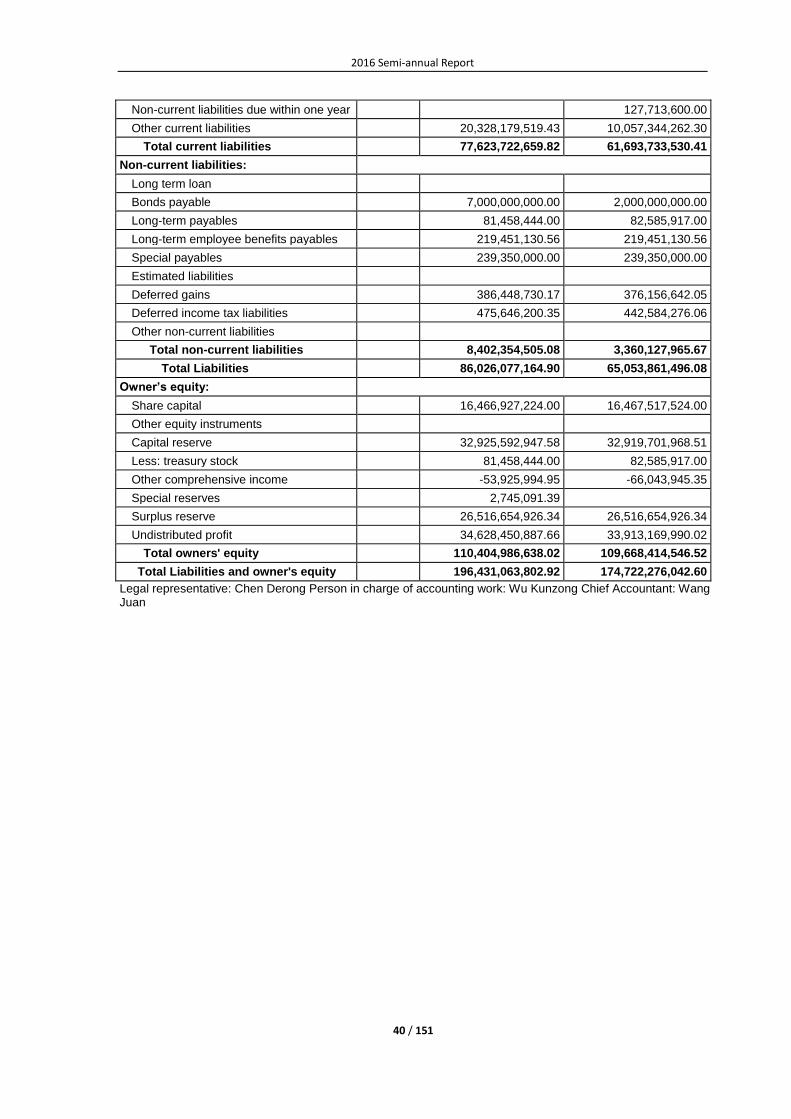
2016 Semi-annual Report
40 / 151
Non-current liabilities due within one year 127,713,600.00
Other current liabilities 20,328,179,519.43 10,057,344,262.30
Total current liabilities 77,623,722,659.82 61,693,733,530.41
Non-current liabilities:
Long term loan
Bonds payable 7,000,000,000.00 2,000,000,000.00
Long-term payables 81,458,444.00 82,585,917.00
Long-term employee benefits payables 219,451,130.56 219,451,130.56
Special payables 239,350,000.00 239,350,000.00
Estimated liabilities
Deferred gains 386,448,730.17 376,156,642.05
Deferred income tax liabilities 475,646,200.35 442,584,276.06
Other non-current liabilities
Total non-current liabilities 8,402,354,505.08 3,360,127,965.67
Total Liabilities 86,026,077,164.90 65,053,861,496.08
Owner’s equity:
Share capital 16,466,927,224.00 16,467,517,524.00
Other equity instruments
Capital reserve 32,925,592,947.58 32,919,701,968.51
Less: treasury stock 81,458,444.00 82,585,917.00
Other comprehensive income -53,925,994.95 -66,043,945.35
Special reserves 2,745,091.39
Surplus reserve 26,516,654,926.34 26,516,654,926.34
Undistributed profit 34,628,450,887.66 33,913,169,990.02
Total owners' equity 110,404,986,638.02 109,668,414,546.52
Total Liabilities and owner's equity 196,431,063,802.92 174,722,276,042.60
Legal representative: Chen Derong Person in charge of accounting work: Wu Kunzong Chief Accountant: Wang Juan

2016 Semi-annual Report
41 / 151
Consolidated Income Statement
January-June 2016 Unit: RMB Yuan
Item Notes Current Amount Amount in previous
period
I. Total operating income 78,111,312,078.24 80,943,653,803.99
Of which: Operating income (V) 52 77,992,799,839.38 80,770,607,226.27
Interest income 112,521,381.10 170,509,030.27
Fee and commission income 5,990,857.76 2,537,547.45
II. Total operating cost 73,307,889,937.47 76,942,236,856.99
Of which: Operating costs (V) 52 67,070,259,897.26 71,525,369,677.10
Interest expense 102,378,949.81 131,851,881.99
Fee and commission expense 557,596.82 277,606.18
Business tax and surcharges (V) 53 297,438,733.14 284,322,204.99
Sales expense (V) 54 1,016,499,666.46 971,497,800.63
Administrative fees (V) 55 3,361,928,932.63 3,494,140,780.11
Financial expenses (V) 56 1,156,766,772.37 444,271,811.61
Assets impairment loss (V) 57 302,059,388.98 90,505,094.38
Plus: Gains form changes in fair value ("-" For loss)
(V) 58 -47,254,658.58 2,213,952.31
Investment income ("-" For loss) (V) 59 355,850,733.29 424,721,526.37
Including: Investment income from associates and joint ventures
110,983,989.20 85,341,686.87
Exchange gains ("-" For loss)
III. Operating profit ('-' for loss) 5,112,018,215.48 4,428,352,425.68
Plus: Non-operating income (V) 60 170,026,365.73 323,907,779.70
Of which: Profit from disposal of non-current assets
20,148,602.92 2,669,489.50
Less: Non-operating expenses (V) 61 260,092,320.26 353,009,386.71
Of which: Loss from disposal of non-current assets
228,547,391.70 333,224,226.52
IV. Total profit ("-" For total loss ) 5,021,952,260.95 4,399,250,818.67
Less: Income tax expense (V) 62 1,400,543,475.44 1,105,475,169.32
V. Net profit ('-' for net loss) 3,621,408,785.51 3,293,775,649.35
Net profit attributable to the owner of parent company
3,468,482,796.75 3,174,482,235.10
Minority gains and losses 152,925,988.76 119,293,414.25
VI. Net of tax of other comprehensive income (V) 63 301,817,859.27 -221,258.02
Net of tax of other comprehensive income attributable to the owner of parent company
290,909,358.68 4,151,541.58
(i) Other comprehensive income which cannot be reclassified in gains and losses in subsequent period
1. Changes in net liabilities and net assets resulting from re-measuring defined benefit plan
2. Shares enjoyed under equity method in investee’s other comprehensive income which cannot be reclassified in gains and losses in subsequent period
(ii) Other comprehensive income which will be reclassified in gains and losses in subsequent
290,909,358.68 4,151,541.58

2016 Semi-annual Report
42 / 151
period
1. Shares enjoyed under equity method in investee’s other comprehensive income which can be reclassified in gains and losses in subsequent period
13,438,470.45 -584,521.41
2.Gains and losses from change in fair value of financial asset available for sale
61,078,731.37 78,501,400.38
3. Gains and losses from held-to-maturity investment reclassified as financial asset available for sale
4. Effective part of gains and losses from cash flow hedging
5. Translation difference of foreign currency financial statements
216,392,156.86 -73,765,337.39
6.Others
Net of tax of other comprehensive income attributable to minority
10,908,500.59 -4,372,799.60
VII. Total comprehensive income 3,923,226,644.78 3,293,554,391.33
Total comprehensive income attributable to the owner of the parent company
3,759,392,155.43 3,178,633,776.68
Total comprehensive income attributable to minority
163,834,489.35 114,920,614.65
VIII. Earnings per share
(i) Basic earnings per share 0.21 0.19
(ii) Diluted earnings per share 0.21 0.19
Legal representative: Chen Derong Person in charge of accounting work: Wu Kunzong Chief Accountant: Wang Juan
Income Statement of Parent Company
January-June 2016 Unit: RMB Yuan
Item Notes Current Amount Amount in previous
period
I. Operating income (XV) 4 43,790,531,505.42 46,280,310,366.96
Less: Operating costs (XV) 4 35,764,237,275.51 40,517,897,173.71
Business tax and surcharges 186,730,845.03 160,929,834.39
Sales expense 303,245,838.57 331,407,910.49
Administrative fees 2,066,467,523.15 2,309,506,302.56
Financial expenses 582,365,534.85 -103,375,774.45
Assets impairment loss 2,539,576,428.19 -74,343,047.05
Plus: Gains form changes in fair value ("-" For loss)
-57,873,954.55 -17,901,082.57
Investment income ("-" For loss) (XV) 5 164,730,167.58 146,750,794.52
Including: Investment income from associates and joint enterprises
63,852,271.11 46,987,962.65
II. Operating profit ('-' for loss) 2,454,764,273.15 3,267,137,679.26
Plus: Non-operating income 33,672,208.31 240,518,723.67
Including: Profit from disposal of non-current assets
Less: Non-operating expenses 207,613,501.21 319,861,413.39
Including: Loss from disposal of non-current assets
196,724,001.21 309,300,180.93
III. Total profit ("-" For total loss ) 2,280,822,980.25 3,187,794,989.54

2016 Semi-annual Report
43 / 151
Less: Income tax expense 577,526,449.17 711,482,274.75
IV. Net profit ('-' for net loss) 1,703,296,531.08 2,476,312,714.79
V. Net of tax of other comprehensive income
12,117,950.40 -533,447.10
(i) Other comprehensive income which cannot be reclassified in gains and losses in subsequent period
1. Changes in net liabilities and net assets resulting from re-measuring defined benefit plan
2. Shares enjoyed under equity method in investee’s other comprehensive income which cannot be reclassified in gains and losses in subsequent period
(ii) Other comprehensive income which will be reclassified in gains and losses in subsequent period
12,117,950.40 -533,447.10
1. Shares enjoyed under equity method in investee’s other comprehensive income which can be reclassified in gains and losses in subsequent period
12,117,950.40 -533,447.10
2.Gains and losses from change in fair value of financial asset available for sale
3. Gains and losses from held-to-maturity investment reclassified as financial asset available for sale
4. Effective part of gains and losses from cash flow hedging
5. Translation difference of foreign currency financial statements
6.Others
VI. Total comprehensive income 1,715,414,481.48 2,475,779,267.69
VII. Earnings per share
(i) Basic earnings per share
(ii) Diluted earnings per share
Legal representative: Chen Derong Person in charge of accounting work: Wu Kunzong Chief Accountant: Wang Juan

2016 Semi-annual Report
44 / 151
Consolidated Cash Flow Statement
January-June 2016 Unit: RMB
Item Notes Current Amount Amount in previous
period
I. Cash flows from operating activities:
Cash received from sales of goods and rendering services
92,322,857,286.20 92,744,158,908.32
Net increase in customer deposits and due to banks
933,040,295.46
Net increase in borrowings from the central bank
51,078,372.30 82,203,201.81
Net decrease in loans and advances to customers
293,023,720.22 435,535,527.44
Net decrease in deposits in central bank and due to bank
46,045,232.52 173,991,662.41
Net increase in borrowing funds from other financial institutions
Net increase in disposal of financial assets measured at fair value and the change included in current gains and losses
Cash received from interest, fees and commissions
120,557,581.84 172,250,619.99
Net increase in borrowing funds
Net increase in repurchase business funds
Tax refund 123,078,464.66 84,351,505.46
Other cash received relating to operating activities
(V) 64(1) 872,444,207.84 424,679,995.68
Subtotal of cash inflows from operating activities
93,829,084,865.58 95,050,211,716.57
Cash paid for purchase of goods and acceptance of services
73,004,286,381.62 76,837,136,444.26
Net decrease in borrowing funds from other financial institutions
50,000,000.00
Net decrease in customer deposits and due to banks
3,359,950,118.39
Net increase in loans and advances to customers
Net increase in deposits in the central bank and due from banks
Cash paid for original insurance contract claim
Cash payment of interest, fees and commissions
109,126,371.03 105,273,085.45
Cash paid for policy dividend
Cash paid to and on behalf of employees 4,218,758,331.56 4,320,024,897.23
Payments of taxes 3,811,673,159.19 3,166,420,769.29
Net decrease in sales of repurchased financial assets
169,528,930.40
Other cash paid relating to operating activities
(V) 64(2) 1,048,454,660.01 995,243,991.28
Subtotal of cash outflows from operating activities
85,552,249,021.80 85,643,628,117.91
Net cash flow from operating activities
(V) 65(1) 8,276,835,843.78 9,406,583,598.66
II. Cash flow from investing activities:

2016 Semi-annual Report
45 / 151
Cash received from investment retrieving 21,369,644,604.51 8,174,632,572.93
Cash received from investment income 343,975,111.85 325,638,866.52
Net cash received from disposal of fixed assets, intangible assets and other long-term assets
17,952,417.88 14,746,311.56
Net cash received from disposal of subsidiaries and other business units
-7,641,688.30
Other cash received relating to investing activities
(V) 64(3) 4,914,510,980.67 5,222,971,937.70
Subtotal of cash inflows from investing activities
26,646,083,114.91 13,730,348,000.41
Cash paid for acquisition and construction of fixed assets, intangible assets and other long-term assets
5,832,520,964.90 12,283,658,800.56
Cash paid for Investment (V) 64(4) 47,813,692,256.28 9,973,304,319.06
Net increase in pledged loans
Net cash paid by subsidiaries and other business units
Other cash paid relating to investing activities
124,379,777.46 57,272,019.38
Subtotal of cash outflows from investing activities
53,770,592,998.64 22,314,235,139.00
Net cash flows from investing activities
-27,124,509,883.73 -8,583,887,138.59
III. Cash flow from financing activities:
Cash received from investors 606,179,874.00 1,089,507,100.00
Including: Cash of subsidiaries received from minority shareholders’ investment
606,179,874.00 1,089,507,100.00
Cash received from borrowings 34,073,362,372.04 38,033,716,920.17
Cash received from issuing bonds 15,000,000,000.00 3,440,003,254.14
Other cash received relating to financing activities
Subtotal of cash inflows from financing activities
49,679,542,246.04 42,563,227,274.31
Cash paid for debt repayment 25,195,148,508.60 34,095,964,771.22
Cash for distribution of dividends, profits or interest payments
2,098,660,338.98 3,796,870,198.70
Where: Dividends, profits paid by subsidiaries to minority shareholders
88,360,990.22 84,973,630.93
Other cash paid for financing activities (V) 64(5) 1,500,000,000.00
Subtotal of cash outflows from financing activities
27,293,808,847.58 39,392,834,969.92
Net cash flow from financing activities
22,385,733,398.46 3,170,392,304.39
IV. Effect of exchange rate changes on cash and cash equivalents
76,282,468.04 -303,275,238.54
V. Net increase in cash and cash equivalents
3,614,341,826.55 3,689,813,525.92
Plus: opening balance of cash and cash equivalents
9,108,888,292.15 11,291,289,583.07
VI. Ending balance of cash and cash equivalents
(V) 65(2) 12,723,230,118.70 14,981,103,108.99
Legal representative: Chen Derong Person in charge of accounting work: Wu Kunzong Chief Accountant: Wang Juan

2016 Semi-annual Report
46 / 151
Cash Flow Statement of Parent Company January-June 2016
Unit: RMB Yuan
Item Notes Current Amount Amount in previous
period
I. Cash flows from operating activities:
Cash received from sales of goods and rendering services
46,015,827,932.52 49,123,034,293.28
Tax refund 76,901,697.11 18,657,137.28
Other cash received relating to operating activities
149,524,335.93 74,713,121.51
Subtotal of cash inflows from operating activities
46,242,253,965.56 49,216,404,552.07
Cash paid for purchase of goods and acceptance of services
37,009,097,912.81 38,704,103,586.17
Cash paid to and on behalf of employees 2,514,623,685.03 2,656,211,728.48
Payments of taxes 2,275,643,586.44 1,645,571,785.33
Other cash paid relating to operating activities 155,059,362.38 182,749,005.81
Subtotal of cash outflows from operating activities
41,954,424,546.66 43,188,636,105.79
Net cash flow from operating activities (XV)7 4,287,829,418.90 6,027,768,446.28
II. Cash flow from investing activities:
Cash received from investment retrieving 8,800,000,000.00 7,765,500,000.00
Cash received from investment income 174,686,896.47 176,499,267.42
Net cash received from disposal of fixed assets, intangible assets and other long-term assets
12,998,427.72 9,573,911.90
Other cash received relating to investing activities
4,982,830,585.25 5,332,310,316.12
Subtotal of cash inflows from investing activities
13,970,515,909.44 13,283,883,495.44
Cash paid for acquisition and construction of fixed assets, intangible assets and other long-term assets
2,268,044,664.47 2,680,003,987.25
Cash paid for Investment 32,126,553,024.00 7,687,000,000.00
Other cash paid relating to investing activities 121,954,777.46 57,272,019.38
Subtotal of cash outflows from investing activities
34,516,552,465.93 10,424,276,006.63
Net cash flows from investing activities -20,546,036,556.49 2,859,607,488.81
III. Cash flow from financing activities:
Cash received from investors
Cash received from borrowings 29,538,407,383.99 17,350,435,675.83
Cash received from issuing bonds 15,000,000,000.00
Other cash received relating to financing activities
2,331,076,896.39
Subtotal of cash inflows from financing activities
46,869,484,280.38 17,350,435,675.83
Cash paid for debt repayment 24,112,122,605.02 16,928,132,212.19
Cash for distribution of dividends, profits or interest payments
1,433,881,878.22 3,141,578,191.16
Other cash paid for financing activities 58,390,700.58 4,776,708,563.40
Subtotal of cash outflows from financing activities
25,604,395,183.82 24,846,418,966.75
Net cash flow from financing activities 21,265,089,096.56 -7,495,983,290.92
IV. Effect of exchange rate changes on cash and cash equivalents
-29,928,493.36 -139,993,829.79
V. Net increase in cash and cash equivalents 4,976,953,465.61 1,251,398,814.38
Plus: opening balance of cash and cash equivalents
2,609,809,152.05 6,283,129,815.02
VI. Ending balance of cash and cash equivalents
7,586,762,617.66 7,534,528,629.40
Legal representative: Chen Derong Person in charge of accounting work: Wu Kunzong Chief Accountant: Wang Juan

2016 Semi-annual Report
47 / 151
Consolidated Statement of Changes in Owners' Equity
January-June 2016 Unit: RMB Yuan
Item
In the period
Owners’ Equity Attributable to Parent Company Minority
shareholders’ equity
Total owners' equity Capital stock Capital reserve
Less: Treasury share
Other comprehensive
income Special reserves Surplus reserves
Generic Risk
Reserve Undistributed profit
I. Ending balance of previous year 16,467,517,524.0
0 33,739,882,090.62 82,585,917.00 -997,587,960.09 10,915,599.63 26,516,654,926.34 37,148,447,581.69 9,343,181,076.15 122,146,424,921.34
Plus: Changes in accounting policies
Error corrections of the last period
Corporate merge under the same control
Others
II. Beginning balance of current period 16,467,517,524.0
0 33,739,882,090.62 82,585,917.00 -997,587,960.09 10,915,599.63 26,516,654,926.34 37,148,447,581.69 9,343,181,076.15 122,146,424,921.34
III. Amount changes of current period (“-” for loss) -590,300.00 36,130,650.92 -1,127,473.00 290,909,358.68 13,650,123.84 2,480,467,163.31 718,470,026.87 3,540,164,496.62
(i)Total comprehensive income 290,909,358.68 3,468,482,796.75 163,834,489.35 3,923,226,644.78
(ii) Shareholders’ contribution and reduction in capital -590,300.00 6,451,348.29 -1,127,473.00 642,996,527.74 649,985,049.03
1.Common shares from shareholders -590,300.00 -537,173.00 642,487,561.41 641,360,088.41
2.Capital from holders of other equity instruments
3.Amount of share payment calculated in owners’ equity
6,458,780.82 - 6,458,780.82
4. Others 529,740.47 -1,127,473.00 508,966.33 2,166,179.80
(III) Profit distribution -988,015,633.44 -88,360,990.22 -1,076,376,623.66
1.Withdrawal of surplus reserves
2.Withdrawal of general risk reserves
3.Distribution to owners (or shareholders) -988,015,633.44 -88,360,990.22 -1,076,376,623.66
4. Others
(IV). Internal carry-over of owners’ equity
1. Capital reserves capitalization (or capital stock)
2. Surplus reserves capitalization (or capital stock)
3. Remedying loss with surplus reserves
4.Others
(V). Special reserves 13,650,123.84 13,650,123.84
1. Current withdrawal 132,955,539.51 3,421,735.85 136,377,275.36
2. Current use 119,305,415.67 3,421,735.85 122,727,151.52
(VI). Others 29,679,302.63 29,679,302.63
IV. Current ending balance 16,466,927,224.0
0 33,776,012,741.54 81,458,444.00 -706,678,601.41 24,565,723.47 26,516,654,926.34 39,628,914,745.00 10,061,651,103.02 125,686,589,417.96

2016 Semi-annual Report
48 / 151
Item
Last period
Owners’ equity attributable to the parent company
Minority shareholders’ equity
Total owners’ equity Capital stock Capital reserve
Less: Treasury share
Other Comprehensive
Income Special reserves Surplus reserves
Generic Risk Reserve
Undistributed profit
I. Ending balance of previous year 16,471,026,024.00 33,253,945,989.75 89,287,152.00 -1,004,817,797.37 10,040,556.78 25,851,173,391.46 - 39,765,842,085.69 9,946,903,048.40 124,204,826,146.71
Plus: Changes in accounting policies
Corrections of the last period errors
Corporate merge under the same control
Others
II. Beginning balance of current period 16,471,026,024.00 33,253,945,989.75 89,287,152.00 -1,004,817,797.37 10,040,556.78 25,851,173,391.46 - 39,765,842,085.69 9,946,903,048.40 124,204,826,146.71
III. Amount changes of current period (“-” for loss)
-3,508,500.00 485,936,100.87 -6,701,235.00 7,229,837.28 875,042.85 665,481,534.88 - -2,617,394,504.00 -603,721,972.25 -2,058,401,225.37
(i)Total Comprehensive income 7,229,837.28 1,012,871,715.20 -304,653,554.20 715,447,998.28
(ii) Shareholders’ contribution and reduction in capital
-3,508,500.00 484,519,058.09 -6,701,235.00 249,859,125.98 737,570,919.07
1.Common shares from shareholders -3,508,500.00 496,407,144.48 2,237,789,781 2,730,688,425.85
2.Capital from holders of other equity instruments
3.Amount of share payment calculated in owners’ equity
4,435,727.42 4,435,727.42
4. Others -6,701,235.00 -471,256,551.39 -464,555,316.39
5. Purchase of minority equity of subsidiaries
-16,323,813.81 -1,516,674,104.00 -1,532,997,917.81
(III) Profit distribution 665,481,534.88 -3,630,266,219.20 -548,817,572.92 -3,513,602,257.24
1.Withdrawal of surplus reserves 665,481,534.88 -665,481,534.88
2.Withdrawal of general risk reserves
3.Distribution to owners (or shareholders) -2,964,784,684.32 -548,817,572.92 -3,513,602,257.24
4. Others
(IV). Internal carry-over of owners’ equity
1. Capital reserves capitalization (or capital stock)
2. Surplus reserves capitalization (or capital stock)
3. Remedying loss with surplus reserves
4.Others
(V). Special reserves 875,042.85 -109,971.11 765,071.74
1. Current withdrawal 479,597,276.10 7,121.35 479,604,397.45
2. Current use 478,722,233.25 117,092.46 478,839,325.71
(VI). Others 1,417,042.78 1,417,042.78
IV. Current ending balance 16,467,517,524.00 33,739,882,090.62 82,585,917.00 -997,587,960.09 10,915,599.63 26,516,654,926.34 - 37,148,447,581.69 9,343,181,076.15 122,146,424,921.34
Legal representative: Chen Derong Person in charge of accounting work: Wu Kunzong Chief Accountant: Wang Juan

2016 Semi-annual Report
49 / 151
Statement of Changes in Owners' Equity of Parent Company
January-June 2016 Unit: RMB Yuan
Item
Current period
Capital stock Capital reserve Less: Treasury share Other
Comprehensive Income
Special reserves Surplus reserves Undistributed profit Total owners' equity
I. Ending balance of previous year 16,467,517,524.00 32,919,701,968.51 82,585,917.00 -66,043,945.35 26,516,654,926.34 33,913,169,990.02 109,668,414,546.52
Plus: Changes in accounting policies
Error corrections of the last period
Others
II. Beginning balance of current period 16,467,517,524.00 32,919,701,968.51 82,585,917.00 -66,043,945.35 26,516,654,926.34 33,913,169,990.02 109,668,414,546.52
III. Amount changes of current period (“-” for loss)
-590,300.00 5,890,979.07 -1,127,473.00 12,117,950.40 2,745,091.39 715,280,897.64 736,572,091.50
(i)Total Comprehensive Income 12,117,950.40 1,703,296,531.08 1,715,414,481.48
(ii) Shareholders’ contribution and reduction in capital
-590,300.00 5,921,607.82 -1,127,473.00 6,458,780.82
1.Common shares from shareholders -590,300.00 -537,173.00 -1,127,473.00
2.Capital from holders of other equity instruments
3.Amount of share payment calculated in owners’ equity
6,458,780.82 6,458,780.82
4. Others -1,127,473.00 1,127,473.00
(III) Profit distribution -988,015,633.44 -988,015,633.44
1.Withdrawal of surplus reserves
2.Distribution to owners (or shareholders) -988,015,633.44 -988,015,633.44
3. Others
(IV). Internal carry-over of owners’ equity
1. Capital reserves capitalization (or capital stock)
2. Surplus reserves capitalization (or capital stock)
3. Remedying loss with surplus reserves
4.Others
(V). Special reserves 2,745,091.39 2,745,091.39
1. Current withdrawal 101,108,800.46 101,108,800.46
2. Current use 98,363,709.07 98,363,709.07
(VI). Others -30,628.75 -30,628.75
IV. Current ending balance 16,466,927,224.00 32,925,592,947.58 81,458,444.00 -53,925,994.95 2,745,091.39 26,516,654,926.34 34,628,450,887.66 110,404,986,638.02

2016 Semi-annual Report
50 / 151
Item
Previous period
Capital stock Capital reserve Less: Treasury
share Other Comprehensive
Income Special reserves Surplus reserves Undistributed profit Total owners' equity
I. Ending balance of previous year 16,471,026,024.00 32,759,853,588.96 89,287,152.00 -102,586,048.25 25,851,173,391.46 34,216,028,534.80 109,106,208,338.97
Plus: Changes in accounting policies
Error corrections of the last period
Others
II. Beginning balance of current period 16,471,026,024.00 32,759,853,588.96 89,287,152.00 -102,586,048.25 25,851,173,391.46 34,216,028,534.80 109,106,208,338.97
III. Amount changes of current period (“-” for loss)
-3,508,500.00 159,848,379.55 -6,701,235.00 36,542,102.90 665,481,534.88 -302,858,544.78 562,206,207.55
(i)Total comprehensive income 36,542,102.90 3,327,407,674.42 3,363,949,777.32
(ii) Shareholders’ contribution and reduction in capital
-3,508,500.00 158,334,461.77 -6,701,235.00 161,527,196.77
1.Common shares from shareholders -3,508,500.00 153,898,734.35 150,390,234.35
2.Capital from holders of other equity instruments
3.Amount of share payment calculated in owners’ equity
4,435,727.42 4,435,727.42
4. Others -6,701,235.00 6,701,235.00
(III) Profit distribution 665,481,534.88 -3,630,266,219.20 -2,964,784,684.32
1.Withdrawal of surplus reserves 665,481,534.88 -665,481,534.88
2.Distribution to owners (or shareholders) -2,964,784,684.32 -2,964,784,684.32
3. Others
(IV). Internal carry-over of owners’ equity
1. Capital reserves capitalization (or capital stock)
2. Surplus reserves capitalization (or capital stock)
3. Remedying loss with surplus reserves
4.Others
(V). Special reserves
1. Current withdrawal 352,081,511.46 352,081,511.46
2. Current use 352,081,511.46 352,081,511.46
(VI). Others 1,513,917.78 1,513,917.78
IV. Current ending balance 16,467,517,524.00 32,919,701,968.51 82,585,917.00 -66,043,945.35 26,516,654,926.34 33,913,169,990.02 109,668,414,546.52
Legal representative: Chen Derong Person in charge of accounting work: Wu Kunzong Chief Accountant: Wang Juan

2016 Semi-annual Report
51 / 151
I. Company Profile
1. Company Profile
Baoshan Iron & Steel Co., Ltd. (hereinafter referred to as “the Company”) is a limited liability company registered in the territory of China in accordance with the laws of the People’s Republic of China (hereinafter referred to as “China”). As per the GJMQG [1999] No. 1266 document issued by the State Economic and Trade Commission of China, the Company was founded solely by Baosteel Group Corporation (originally called “Shanghai Baosteel Group Corporation” and hereinafter referred to as “Baosteel Group”), and was officially registered in Shanghai on February 3, 2000, with Unified Social Credit Code of 91310000631696382C.
The Company took over related businesses, assets and liabilities from Baosteel Group by means of issuing 10,635,000,000 ordinary shares to Baosteel Group with a par value of RMB 1 each on the date of establishment.
The Company issued 1,877,000,000 ordinary shares (A shares) to the general public with a par value of RMB 1 each and an offer price of RMB 4.18 by means of on-line stock exchange listing coupled with off-line rationed subscription, from November 6 to 24, 2000, in compliance with the approval document No. [2000] 140 issued by China Securities Regulatory Commission (the "CSRC").
Following the approval provided in the approval document No. [2005]15 issued by the CSRC on April 13, 2005, April during 21 to 26, 2005, the Company issued five billion shares (A-shares) with a par value of RMB 1 each and an offer price of RMB 5.12 per share, including three billion state-owned shares to Baosteel Group and two billion to the general public, with the latter on a combinatory basis of preferential claiming, pro-rata and on-line and off-line biding inquiry.
As per the Doc. No.[2008] 739 by the CSRC on May 17, 2008, the Company issued RMB 10 billion 6-year convertible loan notes featuring the separation between liability and conversion option components on June 20, 2008. In this issuance, the original circulating shareholders for unlimited sale (of shares) conditions were given the priority for placing, and the rest of the notes were sold to institutional investors through price inquiry and to on-line applicants. The notes were issued based on the face value, which was RMB 100 per share. The dividend was paid once a year and the principal was returned once and for all when it is expired. The annual contract interest rate was 0.8%. The purchaser of the note was able to obtain 16 copies of stock purchase components issued by the issuer, the duration of the component was 24 months from the day when it was listed, and the exercising period was the last 5 trading days of the duration. The exercise proportion was 2:1 and the initial exercise price was RMB 12.50 per stock. The liability and conversion option components were listed and traded on Shanghai Stock Exchange on 4 July 2008. Dividends were paid on May 24, 2010. The exercise price was then adjusted to RMB 11.80 per stock due to dividend. The exercising period was the trading days from June 28 to July 3, 2010. A total of 113,785 components were successfully exercised before the stock market closed on July 2, 2010, the last effective exercise date for "Baosteel CWB1", increasing 48,088 shares of the Company.
According to "The Board's Resolution on the Motion for Repurchasing Shares of the Company Through Centralized Bidding", "The Creditors' Notice About Repurchasing Shares of Baoshan Iron & Steel Co., Ltd.", "The Resolution of the Second Temporary Shareholders’ Meeting of Baoshan Iron & Steel Co., Ltd. in 2012" and the Company's revised Articles of Association, the Company repurchased A-shares on Shanghai Stock Exchange through centralized bidding with a price no more than RMB 5 per share and an amount no more than RMB 5 billion in total. The first repurchase began on September 21, 2012, and the Company has repurchased 414,055,508 shares by the end of 2012. According to the resolution and the Company’s revised Articles of Association, the Company applied for reduction of share capital by RMB 0.39 billion and finished all procedures with China Securities Depository and Clearing Corporation Limited., Shanghai Branch on December 20, 2012. The Company renewed all commercial registration on December 31, 2012, and the updated registered share capital is RMB 17,122,048,088.00 as of December 31, 2012.
In 2013 the Company has repurchased 626,267,656 shares, and completed the implementation of the repurchase scheme. In accordance with the resolution of the general shareholders' meeting of the Company and the regulations of the revised Articles of Association, the Company has applied for the decrease of the capital by RMB 650,323,164, and completed the cancellation of 650,323,164 shares with the Shanghai Branch of China Securities Depository and Clearing Corporation Limited (CSDC) on May 23, 2013. The Company completed the procedure on the industrial and commercial registration on June 24, 2013, and the updated registered share capital is RMB 16,471,724,924.
The Company’s shares have been decreased by 698,900 in 2014 due to repurchasing restricted stock failing to reach the release conditions. The Company completed the change procedures with industrial and

2016 Semi-annual Report
52 / 151
commercial administration on December 31, 2014 with registered capital and capital stock of RMB 16,471,026,024 after change.
The Company’s shares have been decreased by 3,508,500 due to repurchasing restricted stock failing to reach the release conditions. The Company completed the change procedures with industrial and commercial administration on March 21, 2016 with registered capital and capital stock of RMB 16,467,517,524 after change.
The Company’s shares have decreased by 590,300 due to repurchasing restricted stock failing to reach the release conditions during the reporting period, and please see note (V) 45 for the details.
By the end of reporting period, the Company’s registered capital and share capital have reached 16,466,927,224 Yuan. Among which, there are 16,424,278,824 RMB common shares without restricted conditions for sale, and Baosteel Group holds 13,130,265,267 shares, with shareholding ratio of 79.74%.
The business scope of the Company: iron and steel smelting and processing, power generation, coal, industrial gas production, port terminals, warehousing, transportation and other business relating to iron & steel, as well as technology development, technology transfer, technical service, technical management consultation service, automobile maintenance/repair, exporting self-made products and technologies, importing raw/auxiliary materials, instruments, mechanical equipment, fittings and technologies necessary for production and scientific research of the Company (other than those commodities and technologies permitted to be solely dealt by the companies designated by the State, and those prohibited by the State for import/export), processing imported materials, processing and assembly with supplied materials and parts or compensation trade. The Company is mainly engaged in the manufacture and sales of iron & steel products, as well as sales and service of by-products arising from the production and sales of iron & steel products.
The parent company of the Company is Baosteel Group which is a state-owned enterprise supervised by the State-owned Assets Supervision and Administration Commission of the State Council.
The Company and its subsidiaries are hereinafter referred to as “the Group”.
The Company’s consolidated financial statement has been approved by the Company’s Board of Directors on August 30, 2016.
2. Scope of Consolidated Financial Statement
For details of the scope of consolidated financial statement this year please see Note (VII) “Rights and interests in other subjects”.
II. Basis for Preparation of Financial Statements
1. Basis for Preparation
The financial statement is prepared based on the going-concern assumption.
The Group implements the Accounting Standards for Business Enterprises ("ASBE") promulgated by the Ministry of Finance and the relevant regulations. In addition, the Group has disclosed relevant financial information in accordance with Information Disclosure and Presentation Rules for Companies Offering Securities to the Public No. 15-General Provisions on Financial Statement (Revised in 2014).
2. Going-concern
The group conducts the evaluation on the going-concern ability of 12 months from June 30, 2015, and does not find matters and situations producing significant doubt about the going-concern ability. Therefore, the financial statement is prepared based on the going-concern assumption.
III. Important Accounting Policies and Accounting Estimates
The specific accounting policies and accounting estimates tip:
The following disclosure content has covered the specific accounting policies and accounting estimates made by the Company according to the actual production and operation characteristics.

2016 Semi-annual Report
53 / 151
1. Statement of Compliance with the ASBE
The financial statements of the Company have been prepared in accordance with ASBE, and present truly and completely, the Company's financial position, results of operations, changes in equity of shareholders and cash flows.
2. Accounting Period
The Group has adopted the calendar year as its accounting year, i.e. from 1 January to 31 December of each year.
3. Operating Cycle
Operating cycle refers to the period from the enterprise’s purchase of the assets for processing to the realization of cash or cash equivalents. The operating cycle of the Company is 12 months.
4. Basis of Accounting and Principle of Measurement
The Group adopts the accrual basis of accounting. Except for certain financial instruments which are measured at fair value, the Group adopts the historical cost as the principle of measurement in the financial statements. Where assets are impaired, provisions for asset impairment are made in accordance with relevant requirements.
Under the historical cost measurement, assets are measured in accordance with the amount of cash or cash equivalent paid during the purchase or the fair value of the consideration paid. Liabilities are measured in accordance with the amount of money or assets received actually for bearing the current obligation, or contract amount for bearing the current obligation, or amount of cash or cash equivalent paid for repaying estimated liabilities during the daily activities.
Fair value is the price market participants selling the asset or paid for transferring the liability during the orderly transaction occurring on the measurement date. Whether the fair value is observable or estimated by adopting the valuation technique, the fair value measured and disclosed in the financial statement shall be determined on this basis. Fair value measurement is divided into three layers based on the observable degree of the input value of fair value and the importance of such input value for the overall fair value measurement:
·First level input refers to the offer of same assets or liabilities achieved on the measurement date and without adjustment in the active market; ·Second level input refers to the directly or indirectly observable input value of relevant assets or liabilities except for the input value of the first level ·Third level input refers to the non-observable value of relevant assets and liabilities.
5. Bookkeeping Base Currency
Renminbi ("RMB") is the currency of the primary economic environment in which the Company and its domestic subsidiaries operate. Therefore, the Company and its domestic subsidiaries choose RMB as their bookkeeping base currency. The Company's foreign subsidiaries choose their bookkeeping base currency on the basis of the primary economic environment in which they operate. The Group adopts RMB to prepare its financial statements.
6. Accounting Treatment Methods Concerning Business Combination Involving Enterprises Under Common Control and not Under Common Control
Business combinations are classified into the business combinations under common control and the business combinations not under common control.
6.1 Business combinations under common control
Business combination involving enterprises under common control is a business combination in which all of the combining enterprises are ultimately controlled by the same party or the same parties both before and after the business combination and on which the control is not temporary.
The assets and liabilities that the combining party obtains in a business combination shall be measured on the basis of their book value in the combined party on the combining date. As for the balance between the book value of the net assets obtained by the combining party and the book value of the consideration paid

2016 Semi-annual Report
54 / 151
by it (or the total par value of the shares issued), the share premium of the capital reserve shall be adjusted. If the share premium is not sufficient to be offset, the retained earnings shall be adjusted.
The direct cost for the business combination of the combining party shall be recorded into the profits and losses for the current period.
6.2 Business Combinations not Under Common Control
A business combination not involving enterprises under common control is a business combination in which the combining enterprises are not ultimately controlled by the same party or the same parties both before and after the business combination.
The combination costs shall be the fair values of the assets paid, the liabilities incurred or assumed and the equity securities issued by the acquirer in exchange for the control on the acquisition. For a business combination not involving enterprises under common control realized by two or more transactions of exchange, the combination costs shall be the summation of the consideration paid on the acquisition date and the fair values, on the acquisition date, of the equity of the acquired held before the acquisition date. The intermediary costs for audit, legal services, and evaluation and other related overhead costs shall be recorded into the profits and losses for the current period.
The identifiable assets, liabilities and contingent liabilities which meet the recognition conditions and are obtained by the acquirer from the acquired party shall be measured in light of the fair values.
The acquirer shall recognize the positive balance between the combination costs and the fair value of the identifiable net assets it obtains from the acquired party as business reputation and conduct initial measurement on a cost basis. When there is a negative balance between the combination costs and the fair value of various identifiable net assets it obtains from the acquire, and the acquirer shall reexamine the measurement of the fair values of the identifiable assets, liabilities and contingent liabilities it obtains from the acquired party as well as the combination costs. If, after the reexamination, the combination costs are still less than the fair value of the identifiable net assets it obtains from the acquire, it shall record the balance into the profits and losses of the current period.
7. Preparation Method of Consolidated Financial Statements
7.1 Preparation Method of Consolidated Financial Statements
Consolidation scope of consolidated financial statements shall be determined on the basis of control. Control refers to that the investor has power over the investee, enjoys the variable returns by participating in the relevant activities of the investee, and has the ability to use the power over investee to influence its return amount. Once the changes of relevant facts and circumstances lead to the change of relevant factors involved in the control definition, the Group will conduct the reappraisal.
Subsidiary merger begins from the Group gaining the control of the subsidiary and ends at the Group losing the control of the subsidiary. For the subsidiaries disposed by the Group, operating results and cash flow before the disposal date (date of losing the control) have been properly included in the consolidated income statement and consolidated cash flow statement.
Where a subsidiary has been acquired through a business combination not involving enterprises under common control, the subsidiary’s operating results and cash flows after the acquisition date (the date the control is obtained) are appropriately included in the consolidated income statement and the consolidated cash flow statement
For the subsidiary obtained by business combination under the same control or the combined party under the absorption merger, no matter when the business combination occurs at any time point during the reporting period, it shall be deemed as that the subsidiary or the combined party will be included into the consolidation scope of the Group since the date when both are controlled by the final controlling party, and operating results and cash flow obtained from the beginning of the earliest stage of reporting period or from the date of both being controlled by the final controlling party have been properly included in the consolidated income statement and consolidated cash flow statement.
Major accounting policies and accounting periods adopted by the subsidiaries are defined according to the standardized accounting policies and accounting periods established by the Company.
The internal transactions’ impact on consolidated financial statements which is between the Company and its subsidiaries or between subsidiaries shall be eliminated on consolidation. The portion of the subsidiary owners’ equity that is not attributable to the parent company is treated as minority interests and presented as “minority interests” in the consolidated balance sheet within shareholders’’ equity. The portion of net profits or losses of subsidiaries for the period attributable to minority interests is presented in the consolidated income statement below the "net profit" line item as "minority interests". When the amount of loss attributable to the minority shareholders of a subsidiary exceeds the minority shareholders portion of

2016 Semi-annual Report
55 / 151
the beginning balance of owners' equity of the subsidiary, the excess amount is still allocated against minority interests.
Changes in a parent company’s ownership interest in a subsidiary caused by purchase of minority interests or disposal of part of the investment that do not result in the loss of control are accounted for within equity, and the book value of owners' equity attributable to equity holders of the parent company and minority interests should be adjusted to reflect the changes. The difference between the adjustment of minority interests and the fair value of the consideration paid or received is adjusted to capital reserve. If the capital reserve is insufficient to offset, the adjustment shall be made to the retained earnings.
If the stock equity is obtained from the acquiree by multiple transactions step by step, and business combination not under the same control is finally formed, the handling shall be conducted according to whether it belongs to “package deal”. If so, all the transactions shall go through the accounting treatment as the transaction obtaining the control. If not, the transaction shall go through the accounting treatment as the transaction obtaining the control on the purchase date. The stock equity of the acquiree held before the purchase date shall be measured again according to the fair value on the purchase date, and the difference between the fair value and book value shall be included in the current profits and losses. If the stock equity of the acquiree held before the purchase date involves the change of other comprehensive income and other owners’ equity under the equity method accounting, these shall be included into the current profit of the purchase date.
If the control of the original subsidiary was lost due to the disposal of part of the equity investment or other reasons, the remaining stock equity shall be measured again according to its fair value on the date of losing control. The difference of the sum of the consideration obtained from the stock equity disposal and fair value of remaining stock equity subtracting the net asset under the continuous calculation of the original subsidiary with the original shareholding ratio since the purchase date shall be included into the current investment income of losing the control and used to offset the goodwill. Other comprehensive income related to the equity investment of the original subsidiary shall be converted as current investment income when the control is lost.
Through two or more transactions until loss of control of the subsidiary, such transactions are a package of transactions if the terms and conditions of such transactions as well as their economic effects meet one or more of the following conditions: (1) such transactions were concluded at the same time or were concluded taking into consideration their mutual impacts; (2) such transactions could not form a complete business result unless taken as a whole; (3) the occurrence of one transaction depended on the occurrence of at least one other transaction; (4) one transaction, when viewed independently, is not economic, but is economic when considered together with other transactions. Where all the transactions intended for disposal of equity investment in a subsidiary until loss of control of the subsidiary are a package of transactions, each transaction will be treated as one intended for disposal of the equity investment in and resulting in loss of control of the subsidiary. The difference between the price of each disposal and the share of the net assets of the subsidiary corresponding to the disposed investment prior to the loss of control is recognized as “Other comprehensive income” and, after loss of the control, will be recorded into the gains and losses for the period in which the control is lost. When all the transactions intended for disposal of equity investment in a subsidiary until loss of control of the subsidiary are not a package of transactions, each transaction will be recorded as an independent transaction.
8. Joint Venture Arrangement Classification and Joint Operation Accounting Treatment Methods
The joint venture arrangement is classified into joint operation and joint venture. Such classification is determined by considering the arrangement structure, legal form and terms of the contract according to the rights enjoyed and obligations borne by the jointly operated party in the joint venture arrangement. Joint operation is the joint venture arrangement of the jointly operated party enjoying the relevant assets and bearing the relevant liabilities of the arrangement. Joint venture is the joint venture arrangement of the jointly operated party only enjoying the rights of net assets of the arrangement. The Group adopts the equity method accounting for the investment of joint venture, and for details please see the Note (III) “14.3.2. Long-term equity investment under equity method accounting”.
9. Criteria for Determining Cash and Cash Equivalents
Cash refers to cash on hand and deposit available to pay at any time. Cash equivalent refers to the investment held by the group, with short term, strong liquidity, easy conversion into cash with known amount, and small risk in value change.
10. Foreign Currency Transactions and Translation of Foreign Currency Financial Statements
10.1 Foreign Currency Transactions
At the time of initial recognition, a foreign currency transaction is translated by applying the spot exchange rate at the date of the transaction.

2016 Semi-annual Report
56 / 151
At the balance sheet date, foreign currency monetary items are translated to RMB using the spot exchange rate at that date. Exchange differences arising from the differences between the spot exchange rate prevailing at the balance sheet date and those spot rates used on initial recognition or at the previous balance sheet date are recognized in profit or loss for the current period, except for: (1) exchange differences arising from specific-purpose borrowings in foreign currencies that are eligible for capitalization, which are capitalized during the capitalization period and included in the cost of related assets; and (2) exchange differences arising from hedging instruments for foreign currency risk, which are treated under hedge accounting (3) exchange differences arising from foreign currency non-monetary available- for-sale items i.e. stocks and changes in book value of available-for-sale monetary items other than its unamortized cost, which are treated as other comprehensive income.
Where the Consolidated Financial Statements involve overseas businesses, the exchange differences resulting from fluctuation in exchange rates will be listed into “differences from foreign currency translation” under owner’s equities in case of substantial foreign currency monetary items of net overseas investments. And the foreign currency monetary items shall be recorded into current profits and losses when the overseas businesses are disposed.
Foreign currency non-monetary items carried at historical cost continue to be measured at the amounts in functional currency translated using the spot exchange rates at the dates of the transactions; foreign currency non-monetary items carried at fair value are translated using the spot exchange rates at the date when the fair value was determined. Differences between the translated amount and the original amount of functional currency are accounted for as changes in fair value (including changes in foreign exchange rates) and included in profit or loss for the period or capital reserve of shareholders' equity.
10.2 Translation of Financial Statements Denominated in Foreign Currencies
For the purpose of preparing the consolidated financial statements, financial statements of a foreign operation are translated from the foreign currency into RMB using the following method: assets and liabilities on the balance sheet are translated at the spot exchange rate prevailing at the balance sheet date; shareholders' equity items are translated at the spot exchange rates at the dates on which such items arose; all items in the income statement as well as items reflecting the distribution of profits are translated at the average exchange rate of the transaction period; The difference between the translated assets and the aggregate of liabilities and shareholders' equity items is confirmed as other comprehensive income and included in the shareholders' equity.
Cash flows arising from a transaction in foreign currency and the cash flows of an overseas subsidiary are translated at the similar exchange rate in the period of the cash flows. The effect of exchange rate changes on cash and cash equivalents is regarded as a reconciling item and presented separately in the cash flow statement as "Effect of exchange rate changes on cash and cash equivalents".
The opening balances and the comparative figures of previous period are presented at the translated amounts in the previous period's financial statements.
11. Financial Instruments
The Group shall recognize a financial asset or a financial liability when the Group becomes a party to a financial instrument contract. When a financial asset or financial liability is recognized initially, the Group shall measure it at its fair value. In the case of a financial asset or financial liability at fair value through profit or loss, transaction costs shall be charged to the profit or loss for the period. For other financial assets or financial liabilities, transaction costs shall be included in their initially recognized amounts.
11.1 Effective Interest Method
The effective interest method is a method of calculating the amortized cost of a financial asset or a financial liability (or group of financial assets or liabilities) and of allocating the interest income or interest expense over the relevant period, using the effective interest rate. The effective interest rate is the rate that exactly discounts estimated future cash payments or receipts through the expected life of the financial instrument or, when appropriate, a shorter period to the net book value of the financial asset or financial liability.
When calculating the effective interest rate, the Group estimates future cash flows considering all contractual terms of the financial asset or financial liability (without considering any future credit loss). Meanwhile, the calculation of the effective interest rate also considers all fees paid or received between the parties to the contract giving rise to the financial asset and financial liability that are an integral part of the effective interest rate, transaction costs, and premiums or discounts etc.
11.2 Classification, Recognition and Measurement of Financial Assets
On initial recognition, financial assets are classified into the following categories: financial assets at fair value through profit or loss (FVTPL), held-to-maturity investments, loans and receivables and

2016 Semi-annual Report
57 / 151
available-for-sale (AFS) financial assets. Financial assets are initially recognized at fair value. All regular purchases or sales of financial assets are recognized and derecognized on a settlement date basis.
11.2.1 Financial Assets at FVTPL
Financial assets are classified as at FVTPL where the financial asset is either held for trading or it is designated as at FVTPL.
A financial asset is classified as held for trading if: (1) it has been acquired principally for the purpose of selling in the near future; or (2) it is part of a portfolio of identified financial instruments that are managed together and for which there is evidence of a recent actual pattern of short-term profit-taking; or (3) it is a derivative, except for a derivative that is a designated and effective hedging instrument, or a financial guarantee contract, or a derivative that is linked to and must be settled by delivery of an unquoted equity instrument (without a quoted price from an active market) whose fair value cannot be reliably measured.
The financial assets meeting any of the following requirements can be designated, when they are initially recognized, as financial assets or financial liabilities as measured at its fair value and of which the variation is included in the current profits and losses: (1) The designation is able to eliminate or significantly reduce the discrepancies in the recognition or measurement of relevant gains or losses arising from the different basis of measurement of the financial assets or financial liabilities; (2) The official written documents on risk management or investment strategies of the Group have recorded that the combination of said financial assets, the combination of said financial liabilities, or the combination of said financial assets and financial liabilities will be managed and evaluated on the basis of their fair values and be reported to the key management personnel; (3) Qualified mixed instruments, including embedded derivative instruments.
Financial assets at FVTPL are subsequently measured at fair value, with gains or losses arising from changes in fair value as well as dividends and interest income related to such financial assets recognized in profit or loss for the current period.
11.2.2 Held-to-maturity Investments
The term "held-to-maturity investment" refers to a non-derivative financial asset with a fixed date of maturity, a fixed or determinable amount of recoverable price and which the enterprise holds for a definite purpose or the enterprise is able to hold until its maturity.
Investments held until their maturities are subsequently measured at amortized cost using the effective interest method. Gains or losses arising from derecognizing, impairment or amortization are recognized in profit or loss for the current period.
11.2.3 Loans and Receivables
Loans and receivables are non-derivative financial assets with fixed or determinable payments that are not quoted in an active market. The notes receivable, accounts receivable, interests receivable, dividends receivable, other receivables, loans and advances and long-term receivables are included in this category.
Loans and receivables are subsequently measured at amortized cost using the effective interest method. Gains or losses arising from derecognizing, impairment or amortization are recognized in profit or loss for the current period.
11.2.4 AFS financial assets
AFS financial assets are those non-derivative financial assets that are designated as available- or-sale, or the financial assets other than the financial assets at FVTPL, loans and receivables and held-to-maturity investments.
AFS financial assets are subsequently measured at fair value. Gains or losses arising from changes in fair value (other than impairment losses and foreign exchange gains and losses resulting from foreign currency monetary assets and amortized costs which are recognized in profit or loss for the current period) are recognized as the other comprehensive incomes, transferred out and included in profit or loss for the period when such financial assets are derecognized.
Interest received during the period in which the Group holds the AFS financial assets and cash dividends declared by the invested are recognized as the current profits and losses.
Investments in equity instruments that do not have a quoted market price in an active market and whose fair value cannot be reliably measured and derivative financial assets which are linked to and must be settled by delivery of such unquoted equity instruments, which shall be measured at cost.
11.3 Impairment of Financial Assets
The Group assesses the book value of all financial assets other than the financial assets which are measured at their fair values and whose variations are recorded into the current profits and losses, at each balance sheet date. If there is objective evidence that financial assets are impaired the Group determines

2016 Semi-annual Report
58 / 151
the amount of any impairment loss. Objective evidence that a financial asset is impaired is evidence arising from one or more events that occurred after the initial recognition of the asset and that event has an impact on the estimated future cash flows of the financial asset which can be reliably estimated.
Objective evidences that a financial asset is impaired include evidences that might be observed from the following events:
(1) Significant financial difficulty of the issuer or obligor;
(2) A breach of contract, such as a default or delinquency in interest or principal payments;
(3) The Group, for economic or legal or other reasons relating to the borrower’s financial difficulty, granting to the borrower a concession that the Group would not otherwise consider;
(4) It is likely that the borrower will go bankrupt or undergo any other financial restructuring;
(5) It is impossible to continue trading the financial assets of an issuer in an active market due to its serious financial difficulties;
(6) Observable data indicating that there is a measurable decrease in the estimated future cash flows from a group of financial assets since the initial recognition of those assets, although the decrease cannot yet be identified with the individual financial assets in the group, including:
- Deteriorating solvency of the debtor of the group of financial assets;
- Economic conditions in the country or region in which the debtor operates may result in nonpayment of the group of financial assets;
(7) Significant changes with an adverse effect that have taken place in the technological, market, economic or legal environment in which the issuer operates, and indicates that the cost of the investment in the equity instrument may not be recovered;
(8) A significant or prolonged decline in the fair value of an investment in an equity instrument;
(9) Other objective evidences indicating impairment of a financial asset.
- Impairment of financial assets measured at amortized cost
If a financial asset measured at amortized cost is impaired, the book value of the financial asset shall be reduced to the present value of estimated future cash flows (excluding future credit losses that have not been incurred). The written-down amount shall be recognized as an impairment loss in profit or loss.
If, subsequent to the recognition of an impairment loss on a financial asset measured at amortized cost, there is objective evidence of a recovery in value of the financial asset which can be related objectively to an event occurring after the impairment was recognized, the previously recognized impairment loss shall be reversed and recognized in profit or loss. However, the reversal shall not result in a book value of the financial asset that exceeds what the amortized cost would have been had the impairment not been recognized at the date the impairment is reversed.
The Group will separately perform an impairment test on any financial asset with a significant single amount. With regard to the financial assets with insignificant single amounts, a separate impairment test may be carried out, or they may be included in a combination of financial assets with similar credit risk features so as to carry out an impairment-related test. Where, upon the separate test, the financial asset (including those financial assets with significant single amounts and those with insignificant amounts) has not been impaired, it shall be included in a combination of financial assets with similar risk features so as to conduct another impairment test. The financial assets which have suffered from an impairment loss in any single amount shall not be included in any combination of financial assets with similar risk features for any impairment test.
- Impairment of AFS financial assets
For an investment in an AFS equity instrument, objective evidences of impairment include significant or pro-longed decline of the fair value of the said investment. If the fair value is below the cost of the said investment, it is insufficient to indicate an impairment of it. For an investment in an AFS equity instrument held mainly for the purpose of strategic cooperation and not to be sold due to any temporary change in its share price, analysis shall be performed of the basic operation of the invested entity: impairment occurs if the operation of the invested entity seriously deteriorates with operating revenue decreasing 10% or more for three years in concession or with EBITDA (Earnings Before Interest, Tax, Depreciation and Amortization) decreasing 20% or more for three years in concession; for an investment in an AFS equity instrument held mainly for earning profit from share price, etc., an impairment occurs if the fair value of the said investment on the balance sheet date is over 50% less than its initial investment cost or has been lower than its initial investment cost for more than 24 months in concession.
Where an AFS financial asset is impaired, the accumulative losses arising from the decrease of the fair values which has been originally and directly included in the other comprehensive income shall be transferred out and recorded into the profits and losses of the current period. The accumulative losses that

2016 Semi-annual Report
59 / 151
are transferred out shall be the balance obtained from the initially obtained costs of the sold financial asset after deducting the principals as taken back, the current fair value and the impairment-related losses as was recorded into the profits and losses of the current period. Where any financial asset is recognized as having suffered from any impairment loss, if there is any subsequent objective evidence proving that the value of the said financial asset has been restored, and it is objectively related to the events that occur after such loss is recognized, the impairment-related losses as originally recognized shall be reversed, the reversal of impairment losses of AFS equity instruments is recognized in other comprehensive income, and the impairment losses of AFS debt instruments are recognized in profit or loss for the current period.
- Impairment of financial assets measured at cost
Where an equity instrument investment for which there is no quoted price in the active market and whose fair value cannot be reliably measured, or a derivative financial asset which is connected with the equity instrument and which must be settled by delivering the equity instrument, suffers from any impairment, the gap between the book value of the equity instrument investment or the derivative financial asset and the current value of the future cash flow of similar financial assets capitalized according to the returns ratio of the market at the same time shall be recognized as impairment-related losses and be recorded into the profits and losses of the current period. The impairment loss of financial assets, upon recognition, shall not be reversed.
11.4 Transfer of Financial Assets
The Group derecognizes a financial asset only when: (1) the contractual rights to the cash flows from the financial asset expire; or (2) it transfers the financial asset and substantially all the risks and rewards of ownership of the asset to another entity; or (3) it transfers the financial asset, neither transfers nor retains substantially all the risks and rewards of ownership but has not retained control over the financial asset.
If an enterprise neither transfers nor retains substantially all the risks and rewards of ownership of the financial asset, and retains its control of the financial asset, it recognizes the financial asset to the extent of its continuing involvement in the transferred financial asset and recognizes an associated liability. The extent of the enterprises continuing involvement in the transferred asset is the extent to which it is exposed to changes in the value of the transferred asset.
For a transfer of a financial asset in its entirety that satisfies the derecognizing criteria, the difference between the following two amounts is recognized in profit or loss for the current period: (1) the book value of the financial asset transferred; and (2) the sum of the consideration received from the transfer and any cumulative gain or loss that had been recognized directly in other comprehensive incomes.
If a part of the transferred financial asset qualifies for derecognizing, the book value of the transferred financial asset in its entirety is allocated between the part that continues to be recognized and the part that is derecognized, based on the relative fair values of those parts. In this case, the servicing asset retained is treated as a part that continues to be recognized. The difference between the following two amounts is included in profit or loss for the current period: (1) the book value allocated to the part derecognized; and (2) the sum of the consideration received for the part derecognized and (if the transfer involves an available-for-sale financial asset) any cumulative gain or loss allocated to it that had been recognized directly in equity.
11.5 Classification, Recognition and Measurement of Financial Liabilities
The Group classifies the financial instruments or its components as the financial liabilities or equity instruments during the initial recognition according to the contract terms of the financial instruments and its reflected economic essence rather than only by legal form, and by combining with the definition of financial liabilities and equity instruments.
At initial recognition, financial liabilities are classified as either financial liabilities at fair value through profit or loss (FVTPL) or other financial liabilities.
11.5.1 Financial Liabilities at FVTPL
A financial liability is classified as at FVTPL if it is either held for trading or designated as at FVTPL.
A financial liability is classified as held for trading if: (1) the financial liability is undertaken principally for the purpose of repurchase in the near future; or (2) it is part of a portfolio of identified financial instruments that are managed together and for which there is evidence of a recent actual pattern of short-term profit-taking management by the Group; or (3) it is a derivative, except for a derivative that is a designated and effective hedging instrument, or a financial guarantee contract, or a derivative that is linked to and must be settled by delivery of an unquoted equity instrument (without a quoted price from an active market) whose fair value cannot be reliably measured.

2016 Semi-annual Report
60 / 151
The financial liabilities meeting any of the following requirements can be designated, when they are initially recognized, as financial liabilities or financial liabilities as measured at its fair value and of which the variation is included in the current profits and losses: (1) The designation is able to eliminate or significantly reduce the discrepancies in the recognition or measurement of relevant gains or losses arising from the different basis of measurement of the financial liabilities; (2) The official written documents on risk management or investment strategies of the Group have recorded that the combination of said financial liabilities or the combination of financial assets and financial liabilities will be managed and evaluated on the basis of their fair values and be reported to the key management personnel; (3) Qualified mixed instruments, including embedded derivative instruments.
Financial liabilities at FVTPL are subsequently measured at fair value, with gains or losses arising from changes in fair value as well as dividends and interest income related to such financial liabilities recognized in profit or loss for the current period.
11.5.2 Other Financial Liabilities
Derivative financial liabilities linked to and which must be settled by delivery of an unquoted equity instrument (without a quoted price in an active market) whose fair value cannot be measured reliably is subsequently measured at cost. Other financial liabilities except financial guarantee contract liabilities are subsequently measured at amortized cost using the effective interest method; gains or losses arising from derecognizing or amortization is recognized in profit or loss for the period.
11.6 Derecognizing of Financial Liabilities
The Group derecognizes a financial liability (or part of it) only when the underlying present obligation (or part of it) is discharged. An agreement between the Group (an existing borrower) and an existing lender to replace the original financial liability with a new financial liability with substantially different terms is accounted for as an extinguishment of the original financial liability and the recognition of a new financial liability.
When the Group derecognizes a financial liability or a part of it, the Group recognizes the difference between the book value of the financial liability (or part of the financial liability) derecognized and the consideration paid (including any non-cash assets transferred or new financial liabilities assumed) in profit or loss for current period.
11.7 Derivative Instruments and Embedded Derivative Instruments
The derivative financial instruments include forward contracts, interest rate swap contracts and so on. The derivative instruments shall be initially measured at the fair value on the date when the related contracts are signed, and subsequently measured at the fair value. The variation in fair values of the derivative financial instruments shall be included in the current profits and losses.
Where a mixed instrument containing the embedded derivative instrument fails to be designated as a financial asset or financial liability measured at its fair value and of which the variation is included in the current profits and losses; where there is no close relationship between it and the principal contract in terms of economic features and risks; and where it shares the same conditions with that of the embedded derivative instrument, and the independent instrument meets the requirements of the definition of derivative instrument, the embedded derivative instruments shall be separated from the mixed instrument and treated as an independent derivative instrument.
Where it is impossible to make an independent measurement on the acquisition date or subsequent balance sheet date, the mixed instrument shall be designated entirely as a financial asset or financial liability measured at its fair value and of which the variation is included in the current profits and losses.
11.8 Offset of Financial Assets and Financial Liabilities
Financial assets and financial liabilities are presented separately in the balance sheet and are not offset. However, a financial asset and a financial liability is offset and the net amount presented in the balance sheet when both of the following conditions are satisfied: (1) the Group has legal right to set off the recognized amounts and the legal right is currently enforceable; and (2) the Group intends either to settle on a net basis, or to realize the financial asset and settle the financial liability simultaneously.
11.9 Equity Instruments
Equity instrument refers to the contract which can prove that the Group has the residual equity of the assets after deducting all liabilities. The Group issues (including refinancing), repurchases, sells, or

2016 Semi-annual Report
61 / 151
cancels the equity instruments as the handling of the equity change. The Group does not confirm the fair value change of the equity instruments. Transaction cost related to the equity transaction shall be deducted from the equity.
The Group conducts the profit distribution for distribution of the holder of equity, and the stock dividend has no effect upon the shareholders’ total equity.
11.9.1 Repurchase of Shares
Where the consideration and transaction costs paid for the share repurchase minus shareholder’s equity, and the shares of the Company is repurchased, transferred or cancelled, the gains or losses shall not be recognized. The repurchased shares shall, before cancellation or transfer, be controlled as the treasury shares. Total expenditures arising from share repurchase shall be transferred into the treasury share costs. The treasury shares arising from the repurchase ordinary shares repurchased by the Company shall not be involved in the profit distribution of the Company, and shall be presented as provision items of owner’s equity in the balance sheet. Where the reduction of capital is made by means of the acquisition of the shares of the Company upon approval in accordance with the legal procedures, the capital shall be reduced on the basis of the total amount of the par value of cancelled shares. The difference between the costs paid for repurchase of shares (including transaction costs) and the par value of shares shall be used to adjust the owner’s equity. A portion exceeding the total amount of par value shall be used to offset capital reserves (share premium), surplus reserves and undistributed profits; a portion less than the total amount of par value shall be used to increase the capital reserves (share premium).
11.10 Bond with Warrants
When issuing a bond with warrants, the Group shall determine whether it simultaneously contains the compositions of liabilities and equities in accordance with the provisions. Where the issued bonds with warrants contain both compositions of liabilities and equities, the liabilities composition shall be separated from equities composition at the time of initial recognition, and treated separately. For the separation, the priority shall be given to determine the fair value of the liabilities and to use it as the initially recognized amount. Afterwards, the initially recognized amount of the equities shall be determined by the initially recognized amount of the liabilities deducted from the integral issue price of the bond with warrants. The transaction costs shall be amortized between the composition of liabilities and equities according to their respective fair values. The liabilities composition shall be presented as the liabilities and subsequently measured at the amortized costs until cancelled, converted or redeemed. The equity composition shall be presented as the equities, dispensed with subsequent measurement. Where a subscription right holder fails to exercise the right for a bond with warrants issued by the Group, a part of it originally included in the capital reserves at maturity shall be transferred into the capital reserves (share premiums). Where a subscription right holder exercises the right, a part of it originally included in the capital reserves (other capital reserves) shall be transferred into the capital reserves (share premiums) in light of the amount of the equity composition, included into the capital in light of the total amount of par value of shares and par value of shares calculated by the translated shares, and included into the capital reserve (share premium) on the basis of the difference between the total amount of funds raised by warrants and the share capital.
12. Accounts Receivable
(1) Individually Significant Receivables with Bad Debt Provisions Separately Recognized
Criteria for individually significant receivables The Group recognizes the accounts receivable of top five clients as the individually significant receivables.
Provision method for individually significant receivables with bad debt provision separately recognized.
An impairment test shall be independently made on the accounts receivable with significant single amounts. Accounts receivable that are not impaired upon independent test shall be included in a combination of financial assets with similar credit risk features so as to carry out an impairment-related test; The accounts receivables which have suffered from an impairment loss shall not be included in any combination of financial assets with similar risk features for any impairment test.
(2) Account Receivables Which Provision Bad Debt Reserves According to Credit Risk Characteristics Combination:
Calculation and withdrawal method of bad debt reserves according to credit risk feature combination (aging analysis, percentage of balance and other methods)
Account receivables with single amount The Group shall divide the other receivables except
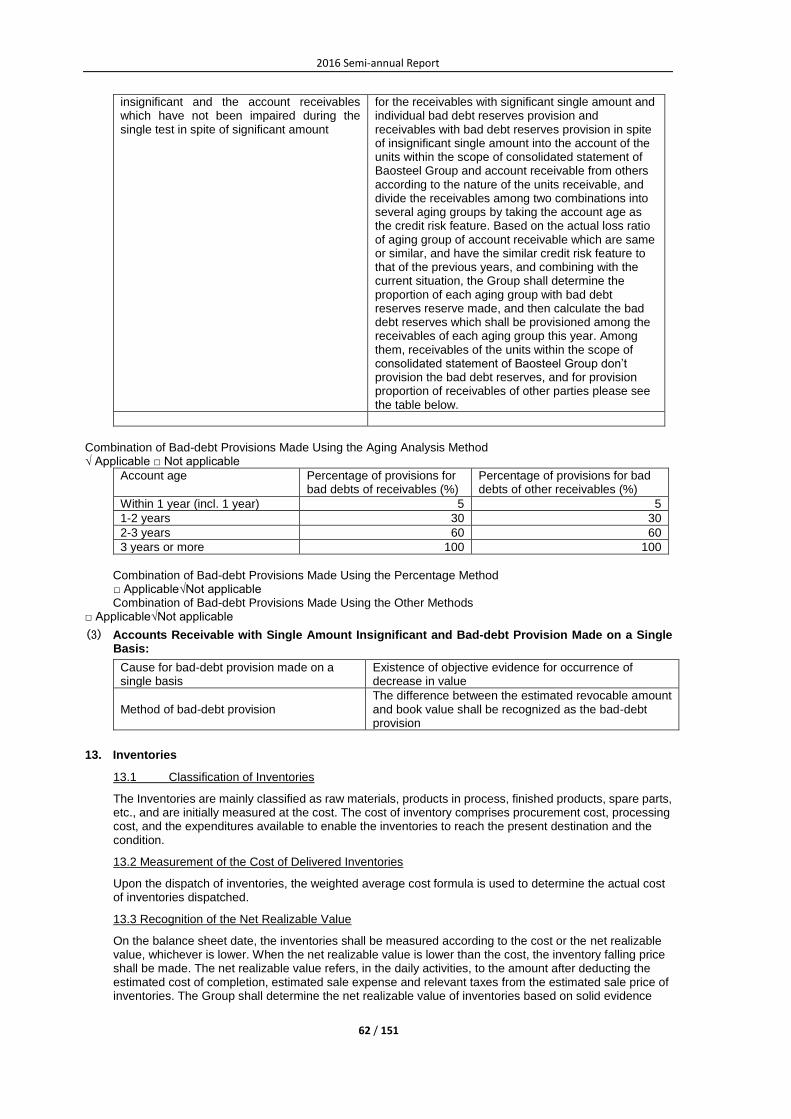
2016 Semi-annual Report
62 / 151
insignificant and the account receivables which have not been impaired during the single test in spite of significant amount
for the receivables with significant single amount and individual bad debt reserves provision and receivables with bad debt reserves provision in spite of insignificant single amount into the account of the units within the scope of consolidated statement of Baosteel Group and account receivable from others according to the nature of the units receivable, and divide the receivables among two combinations into several aging groups by taking the account age as the credit risk feature. Based on the actual loss ratio of aging group of account receivable which are same or similar, and have the similar credit risk feature to that of the previous years, and combining with the current situation, the Group shall determine the proportion of each aging group with bad debt reserves reserve made, and then calculate the bad debt reserves which shall be provisioned among the receivables of each aging group this year. Among them, receivables of the units within the scope of consolidated statement of Baosteel Group don’t provision the bad debt reserves, and for provision proportion of receivables of other parties please see the table below.
Combination of Bad-debt Provisions Made Using the Aging Analysis Method √ Applicable □ Not applicable
Account age Percentage of provisions for bad debts of receivables (%)
Percentage of provisions for bad debts of other receivables (%)
Within 1 year (incl. 1 year) 5 5
1-2 years 30 30
2-3 years 60 60
3 years or more 100 100
Combination of Bad-debt Provisions Made Using the Percentage Method □ Applicable√Not applicable Combination of Bad-debt Provisions Made Using the Other Methods
□ Applicable√Not applicable
(3) Accounts Receivable with Single Amount Insignificant and Bad-debt Provision Made on a Single Basis:
Cause for bad-debt provision made on a single basis
Existence of objective evidence for occurrence of decrease in value
Method of bad-debt provision The difference between the estimated revocable amount and book value shall be recognized as the bad-debt provision
13. Inventories
13.1 Classification of Inventories
The Inventories are mainly classified as raw materials, products in process, finished products, spare parts, etc., and are initially measured at the cost. The cost of inventory comprises procurement cost, processing cost, and the expenditures available to enable the inventories to reach the present destination and the condition.
13.2 Measurement of the Cost of Delivered Inventories
Upon the dispatch of inventories, the weighted average cost formula is used to determine the actual cost of inventories dispatched.
13.3 Recognition of the Net Realizable Value
On the balance sheet date, the inventories shall be measured according to the cost or the net realizable value, whichever is lower. When the net realizable value is lower than the cost, the inventory falling price shall be made. The net realizable value refers, in the daily activities, to the amount after deducting the estimated cost of completion, estimated sale expense and relevant taxes from the estimated sale price of inventories. The Group shall determine the net realizable value of inventories based on solid evidence

2016 Semi-annual Report
63 / 151
obtained and after taking into consideration the purpose for which the inventory is held, and the effect of events occurring after the balance sheet date.
For inventories, the excess of cost over the net realizable value is generally recognized as provision for decline in value of inventories on an item-by-item basis.
After provision for decline in value of inventories has been made, if the circumstances that previously caused inventories to be written down no longer exist which results in the net realizable value is higher than the book value, the amount of the write-down is reversed in profit or loss for the current period.
13.4 Stock Counting System of Inventories
The perpetual inventory system is adopted for stock counting
13.5 Amortization Methods of Low-value Consumables and Wrap Pages
Low-value consumables and wrap pages shall be amortized using the writing-off process.
14. Long-term equity investments
14.1 Criteria of Common Control and Significant Influence
Control refers to that the investor has power over the investee, enjoys the variable returns by participating in the relevant activities of the investee, and has the ability to use the power over investee to influence its return amount. Joint control refers to the mutual control of an arrangement in accordance with the relevant agreement, and the related activities of such arrangement can be decided after getting the unanimous consent of participants sharing the control. Significant impact refers to having the power of participating in decision-making of the financial and operating policies of investee, but failing to control or making joint control with other parties over the making of these policies. When determining whether to conduct the control or exert significant impact on the invested unit, potential voting right factors held by the investors and other parties such as current convertible bond and current executable warrant of the invested unit have been considered.
14.2 Determination of Initial Investment Cost
For the long-term equity investment obtained from the business combination under the same control, the share of the combined party’s owners’ equity in the book value of consolidated financial statement of the final controlling party on the combining date shall be taken as the initial investment cost of long-term equity investment. Difference among the initial investment cost of long-term equity investment and the cash paid, non-cash asset transferred as well as book value of incurred liability is used to adjust the capital reserves. If the capital reserves are insufficient for writing down, the retained earnings shall be adjusted. If taking the issuance of equity securities as the combination consideration, the share of the combined party’s owners’ equity in the book value of consolidated financial statement of the final controlling party on the combining date shall be taken as the initial investment cost of long-term equity investment, total par value of the issued shares shall be taken as the capital stock, and difference between the initial investment cost of long-term equity investment and the total par value of the issued shares shall be used to adjust the capital reserves. If the capital reserves are insufficient for writing down, the retained earnings shall be adjusted. If the stock equity is obtained from the acquire under the same control by multiple transactions step by step, and business combination under the same control is finally formed, the handling shall be conducted according to whether it belongs to “package deal”. If so, all the transactions shall go through the accounting treatment as the transaction obtaining the control. If not, the enjoyed share of book value of the combined party’s owners’ equity in the consolidated financial statement of the final controlling party on the combining date shall be taken as the initial investment cost of long-term equity investment. Difference between the initial investment cost of long-term equity investment and the sum of book value of long-term equity investment before the combination and the book value of newly paid consideration for getting more shares is used to adjust the capital reserves. If the capital reserves are insufficient for writing down, the retained earnings shall be adjusted. Equity investment adopting equity method accounting before the combining date or other comprehensive income confirmed for available-for-sale financial assets will not undergo the accounting treatment temporarily.
For the long-term equity investment obtained from the business combination not under the same control, the combined cost on the purchase date shall be taken as the initial investment cost of long-term equity investment. If the stock equity is obtained from the acquiree by multiple transactions step by step, and business combination not under the same control is finally formed, the handling shall be conducted according to whether it belongs to “package deal”. If so, all the transactions shall undergo the accounting treatment as the transaction obtaining the control. If not, the sum of book value of equity investment originally held in the acquiree and the new investment cost shall be taken as the initial investment cost of long-term equity investment under cost method accounting. If the original stock equity adopts the equity method accounting, other comprehensive income shall not undergo the accounting treatment. If the original equity investment is the available-for-sale financial assets, the difference between fair value and

2016 Semi-annual Report
64 / 151
book value, as well as the cumulative fair value change included into the other comprehensive income shall be transferred to the current profits and losses.
Audit fee, legal service fee, assessment consultation fee and other agency fees as well as other related management fees brought by the combining party or the purchaser for business combination shall be included in the current profits and losses during their occurrence.
Except for those formed by business combination, long-term equity investment obtained by other forms shall go through the initial measurement according to the cost. The cost of long-term equity investment which has significant impact upon the invested unit or implements joint control but does not constitute the control shall be the sum of new investment cost and fair value of the original equity investment determined by Accounting Standard for Business Enterprises No. 22 - Recognition and Measurement of Financial Instruments.
14.3 Subsequent Measurement and Recognition of Profit and Loss
14.3.1 Long-term Equity Investment Using the Cost Method
The Company’s financial statement adopts the cost method for the accounting of the long-term equity investment in the subsidiary. The subsidiary is the invested entity over which the Group can implement the control.
Long-term equity investment accounted by cost method shall be valued according to the initial investment cost. Adding or retrieving investment is to adjust the cost of long-term equity investment. The current investment income shall be confirmed according to the cash dividends or profits declared by the invested unit to issue.
14.3.2 Long-term Equity Investment Using the Equity Method
The Group adopts the equity method for the accounting of the investment in associated enterprises and joint ventures. Associated enterprise is the invested unit upon which the Group can have significant impact, and joint venture is the joint venture arrangement in which the Group only enjoy the right of the net assets of such arrangement.
When the calculation is performed using the equity method, if the initial cost of a long-term equity investment is more than the investor's attributable share of the fair value of the invitee’s identifiable net assets for the investment, the initial cost of the long-term equity investment may not be adjusted; if the initial cost of a long-term equity investment is less than the investing enterprise' attributable share of the fair value of the invitee’s identifiable net assets for the investment, the difference shall be included in the current profits and losses and the cost of the long-term equity investment shall be adjusted simultaneously.
When equity method accounting is adopted, investment income and other comprehensive income shall be confirmed respectively according to the share of net profit or loss and other comprehensive income achieved by the invested unit which shall be enjoyed or shared, and the book value of the long-term equity investment shall be adjusted. Based on the profit or cash dividend declared by the invested unit to distribute, calculate the share which should be enjoyed to accordingly reduce book value of the long-term equity investment. For other changes of owners’ equity of the invested unit except for the net profits and losses, other comprehensive incomes and profit distribution, book value of the long-term equity investment shall be adjusted and included into the capital reserves. When confirming the enjoyed share of net profits or losses of the invested unit, the net profit of the invested unit shall be adjusted and then confirmed on the basis of the fair value of all identifiable assets of the invested unit when obtaining the investment. If the accounting policy and accounting period of the invested unit are not consistent with those of the Company, the financial statement of the invested unit shall be adjusted according to the accounting policy and accounting period of the Company, and investment income and other comprehensive income shall be confirmed on this basis. For the transactions between the Group and associated enterprises and joint ventures, if the assets invested or sold fail to constitute a business, the part of unrealized gains or losses through internal transaction belonging to the Group and calculated according to the shared proportion shall be offset, and the profit and loss on investments shall be confirmed on this basis. If the unrealized losses on internal transaction between the Group and the invested unit belong to the loss from asset devaluation, these shall not be offset.
The Group’s share of net losses of the invested is recognized to the extent that the carrying amount of the long-term equity investment together with any long-term interests that substantially form part of the investors net investment in the invested are reduced to zero. If the Group has to assume additional obligations, the estimated obligation assumed is provided for and charged to the profit or loss as investment loss for the period. Where the invested realizes net profits in subsequent periods, the Group resumes recognizing its share of profits after setting off profits against the unrecognized share of losses.
14.4 Disposal of a Long-term Equity Investment

2016 Semi-annual Report
65 / 151
During the disposal of long-term equity investment, the difference between its book value and actually acquired money shall be included in the current profits and losses. For long-term equity investment accounted with the equity method, if the remaining stock equity after the disposal still adopts the equity method for accounting, other comprehensive income originally confirmed by equity method accounting shall adopt the same basis with the direct disposal of related assets and liabilities of the invested unit to go through the accounting treatment and shall be carried over to the current profits and losses with the corresponding rate. The owners’ equity confirmed by the investee due to the change of other owners’ equity except for the net profit and loss, other comprehensive income and profit distribution shall be carried over to the current profits and losses with the corresponding rate.
For long-term equity investment accounted by cost method, if the remaining stock equity after the disposal still adopts the cost method for accounting, other comprehensive income confirmed due to adopting equity method accounting or recognition and measurement standards of financial instruments before the Group obtains the control of the invested unit shall adopt the same basis with the direct disposal of related assets and liabilities of the invested unit to go through the accounting treatment and shall be carried over to the current profits and losses with the corresponding rate. Other owners’ equity changes in net asset of investee confirmed by equity method accounting except for the net profit and loss, other comprehensive income and profit distribution shall be carried over to the current profits and losses with the corresponding rate.
Because the Group loses the control of the invested unit due to the disposal of part of equity investment, when making the individual financial statements, if the remaining stock equity after the disposal can implement joint control over or have significant impact on the invested unit, the equity method for accounting shall be adopted, and the remaining stock equity shall be adjusted as acquired with the equity method accounting. If the remaining stock equity after the disposal cannot implement joint control over or have significant impact on the invested unit, accounting treatment shall be conducted according to relevant provisions of the financial instruments confirmation and measurement standard, and the difference between the fair value and the book value on the date of losing control shall be included in the current profits and losses. Other comprehensive income confirmed due to adopting equity method accounting or financial instruments confirmation and measurement standard before the Group obtains the control of the invested unit shall adopt the same basis with the direct disposal of related assets and liabilities of the invested unit for accounting treatment when the Group loses the control of the invested unit, and other owners’ equity changes in net asset of investee confirmed by equity method accounting except for the net profit and loss, other comprehensive income and profit distribution shall be carried over to the current profits and losses when the Group loses the control of the invested unit. Among them, if the remaining stock equity after the disposal adopts the equity method accounting, other comprehensive income and other ownership interest shall be carried over with the corresponding rate. If the remaining stock equity after the disposal adopts the accounting treatment according to the financial instruments confirmation and measurement standard, other comprehensive income and other owners’ equity shall be carried over in full.
If the Group loses the joint control over and significant impact on the invested unit due to the disposal of part of equity investment, remaining stock equity after the disposal shall be accounted by financial instruments confirmation and measurement standard, and the difference between the fair value and the book value on the date of losing joint control or significant impact shall be included in the current profits and losses. Other comprehensive income from the original equity investment confirmed due to adopting equity method accounting shall adopt the same basis with the direct disposal of related assets and liabilities of the invested unit for accounting treatment when the equity method accounting is not used any longer, and owners’ equity confirmed due to the change of other owners’ equity except for the net profit and loss, other comprehensive income and profit distribution shall be transferred to the current investment income when the equity method accounting is not used any longer.
The Group conducts the disposal of subsidiary’s stock equity step by step through multiple transaction until lose the control, and if the above transaction belongs to the package deal, accounting treatment should be conducted which take each transaction as the transaction of disposing the subsidiary’s stock equity and losing the control, and the difference between the disposal money and the book value of corresponding long-term equity investment before losing the control shall first be recognized as other comprehensive income, and then transferred to the current profits and losses when the control is lost.
15. Investment Property
(1) Investment Property Measured at Cost:
Depreciation or Amortization Method
Investment property means a property held to earn rentals or for capital appreciation or both, comprising a tenure that is leased out, a building that is leased out, etc.

2016 Semi-annual Report
66 / 151
An investment property shall be initially measured at cost. Subsequent expenditures incurred on an investment property are recognized as cost of the investment property only when: 1) it is probable that economic benefits associated with the investment property will flow to the Group; and 2) the cost of the investment property can be measured reliably. Subsequent expenditures that fail to meet such recognition criteria are recognized in profit or loss in the period in which they are incurred.
The Group uses the cost model for subsequent measurement of an investment property, and adopts the depreciation or amortization policy consistent with that applicable to buildings or tenure.
When an investment property is sold, transferred, retired or damaged, the amount of any proceeds on disposal net of the book value and related taxes is recognized in profit or loss for the current period.
16. Fixed Assets
(1) Conditions for Recognition
Fixed assets mean tangible assets that are held for the sake of producing commodities, rendering labor service, renting or business management, with their useful life in excess of one fiscal year. No fixed asset may be recognized unless it simultaneously meets the conditions as follows: the economic benefits pertinent to the fixed asset are likely to flow into the enterprise; and the cost of the fixed asset can be measured reliably. A fixed asset shall be initially measured at cost.
Subsequent expenditures incurred for a fixed asset that meet the recognition criteria mentioned in the previous paragraph shall be included in the cost of the fixed asset, and the book value of the replaced portions shall be derecognized. Subsequent expenditures that fail to meet the recognition criteria mentioned in the previous paragraph shall be recognized in profit or loss in the period in which they are incurred.
(2) Depreciation Method
Depreciation is provided to write off the cost of each category of fixed assets over their estimated useful lives from the month after they are brought to working condition for the intended use, using the straight-line method. The useful lives, estimated net residual values rates and annual depreciation rates of each class of fixed assets are as follows:
Category of Fixed Assets
Depreciation method
Depreciable Life (Years)
Residual Value (%)
Annual Depreciation (%)
Houses and buildings
Straight-line 15-35 4 2.7-6.4
Machinery equipment
Straight-line 7-15 4 6.4-13.7
Transportation facilities
Straight-line 5-10 4 9.6-19.2
Office facilities and other facilities
Straight-line 4-9 4 10.7-24.0
Estimated net residual value of a fixed asset means the estimated amount that the Group would currently obtain from disposal of the asset, after deducting the estimated costs of disposal, if the asset were already of the age and in the condition expected at the end of its useful life.
(3) Other notes
A fixed asset shall be derecognized on disposal or when no future economic benefits are expected from its use or disposal. When a fixed asset is sold, transferred, discarded or damaged, the book value and relevant taxes shall be deducted from the disposal income arising from the sales, transfer, discard or damage of fixed assets and the difference shall be included in the current profits and losses.
The Group shall review the useful life and estimated net residual value of a fixed asset and the depreciation method applied at least at the end of each financial year. A change in the useful life or estimated net residual value of a fixed asset or the depreciation method used shall be accounted for as a change in an accounting estimate.
17. Construction in Progress
The cost of construction in progress shall be determined at the actual cost, including the expenditure actually incurred for the construction, borrowing costs capitalized before the project reaches the working condition for its intended use and other related expenses. Construction in progress is not subject to depreciation and is carried over to fixed assets when it is ready for its intended use.

2016 Semi-annual Report
67 / 151
18. Borrowing Costs
For borrowing costs that are directly attributable to the acquisition, construction or production of a qualified asset, capitalization of such borrowing costs can commence only when all of the following conditions are satisfied: (1) expenditures for the asset have already been incurred; (2) borrowing costs have already been incurred; and (3) activities relating to the acquisition, construction or production of the asset that are necessary to prepare the asset for its intended use or sale have already commenced. Capitalization of such borrowing costs ceases when the qualified assets acquired, constructed or produced become ready for their intended use or sale. The amount of any other borrowing cost incurred is recognized as an expense in the period in which it is incurred.
Where funds are borrowed under a specific-purpose borrowing, the amount of interest to be capitalized is the actual interest expense incurred on that borrowing for the period less any bank interest earned from depositing the borrowed funds before being used on the asset or any investment income on the temporary investment of those funds. Where funds are borrowed under general-purpose borrowings, the amount of interest to be capitalized on such borrowings is determined by applying a capitalization rate to the weighted average of the excess amounts of cumulative expenditure on the asset over and above the amounts of specific-purpose borrowings. The capitalization rate is the weighted average of the interest rates applicable to the general-purpose borrowings.
19. Intangible Assets
(1) Cost Measurement, Useful Life and Impairment Test
Intangible assets include tenure, software, etc.
The intangible assets shall be initially measured at cost. An intangible asset with a definite service life shall be, on an average basis, amortized using the straight-line method over its service life when the asset is available for use with its original cost less any accumulated impairment losses. An intangible asset with an indefinite service life shall not be amortized.
Amortization method, useful life and estimated net residual values of various intangible assets are as follow:
Category Amortization
method Useful life (Year)
Residual values rates (%)
Land use rights Straight-line 40-70 0%
Software Straight-line 5 0%
Others Straight-line 3-50 0%
At the end of the period, the service life and amortization method of intangible assets with a definite service life shall be rechecked, and adjusted when necessary.
(2) Accounting Policies for Expenditures on Research and Development
The expenditures on research and development shall be recorded into the profits and losses of the current period when they occur.
Expenditures incurred during the development phase shall be recognized as an intangible asset only when they meet the following conditions simultaneously and shall be recognized in profits or losses for the period in which they are incurred if they fail to meet such following conditions simultaneously:
1) It is technically feasible to complete the intangible asset and make it ready for use or sale;
2) There is an intention to complete the intangible asset and use or sell it;
3) There exist the means by which the intangible asset can produce economic benefits, including the evidence of a market for any product produced using this intangible asset or for the intangible asset itself; where the intangible asset is intended for internal use, there exists the evidence of its usability;
4) Sufficient technical, financial and other resources available to support and finish the development of the intangible asset and use or sell it;
5) Research and development expenditures attributable to this intangible asset can be reliably measured.

2016 Semi-annual Report
68 / 151
If it is impossible to differentiate between the expenditures on the research phase and the expenditures on the development phase, all expenditures incurred during the research and development phases shall be recorded into the profit and losses of the current period.
20. Long-term Assets Impairment
The Group shall check whether the long-term equity investment, investment real estate measured by cost method, fixed assets, projects under construction and intangible assets with finite service life have the sign of impairment on the balance sheet date. If such assets have the sign of impairment, their recoverable amounts can be estimated. Intangible assets with uncertain service life and intangible assets having not reached the serviceable condition shall be conducted with the impairment test every year no matter whether there is the sign of impairment.
The estimation of recoverable amount of assets is based on the single asset, and if it is hard to estimate the recoverable amount of single asset, the recoverable amount of asset Group shall be determined based on the asset Group to which the assets belong. The recoverable amount is the higher one between the net amount obtained after the fair value of assets or asset Group subtracts the disposal cost and the present value of expected future cash flow.
If the recoverable amount of assets is lower than its book value, assets impairment reserves shall be made with provision according to the difference and included in the current profits and losses.
Once an impairment loss is recognized on an above mentioned asset, it will not be reversed in any subsequent period
21. Long-term Prepaid Expenses
Long-term prepaid expenses mean various expenditures incurred but that should be allocated over the current and future periods of more than one year. Long-term prepaid expenses shall be evenly amortized over the estimated beneficial period.
22. Assets Transferred Under Repurchase Agreements
22.1 Financial Assets Purchased Under Resale Agreements
Financial assets that have been purchased under agreements with a commitment to resell at a specific future date are not recognized in the balance sheet. The cost of purchasing such assets is presented under "financial assets purchased under resale agreements" in the balance sheet. The difference between the purchasing price and reselling price is recognized as interest income during the term of the agreement using the effective interest method.
22.2 Financial Assets Sold Under Repurchase Agreements
Financial assets sold subject to agreements with a commitment to repurchase at a specific future date are not derecognized in the balance sheet. The proceeds from selling such assets are presented under "financial assets sold under repurchase agreements" in the balance sheet. The difference between the selling price and repurchasing price is recognized as interest expense during the term of the agreement using the effective interest method.
23. Employee Benefits
(1) Accounting Treatment Method of Short-term Benefits
During the accounting period of the employees providing services for the Group, the actually incurred short-term benefits will be recognized as liabilities and included into the current profits and losses or relevant asset costs. Employee services and benefits of the Group shall be included into the current profits and losses or relevant asset costs according to the actual amount incurred during the actual occurrence. Employee services and benefits which belong to the non-monetary benefits shall be measured in accordance with the fair value.
The corresponding employee compensation and corresponding liabilities of the medical insurance premiums, industrial injury insurance premium, birth insurance premium and other social insurance premium and housing accumulation fund paid by the Group for the employee, as well as the labor union expenditure and personnel education fund withdrawn by the Group according to the regulations shall be determined in accordance with the specified provision base and proportion during the accounting period of

2016 Semi-annual Report
69 / 151
the employees providing services for the Group, and shall be included into the current profits and losses or the relevant asset costs.
(2) Accounting Treatment Method of Post-employment Benefits
All post-employment benefits of the Group are based on the defined contribution plan.
During the accounting period of the employees providing services for the Group, the amount payable calculated according to the defined contribution plan shall be recognized as the liabilities and included into the current profits and losses or the relevant asset costs.
(3) Accounting Treatment Method of Termination Benefits
In the case of giving compensation for terminating the labor relation with the employee before the expiration of the employee labor contract or encouraging employees to voluntarily accept the reduction, if the Group has formulated the formal plan on the termination of labor relation or has brought forward the proposal on voluntary reduction and will conduct the implementation, and the Group can’t unilaterally withdraw the plan on the termination of labor relation or proposal on reduction, the estimated liabilities generated from compensating for the termination of labor relation shall be confirmed and included in the current profits and losses.
The Group will provide early retirement benefits for the employee accepting the early retirement arrangement. Early retirement benefits refer to the wage and social insurance premium paid by the Group to the employees who have not reached the retirement age specified by the state but voluntarily quit jobs according to the provisions of the Group management system. For early retirement benefits, the Group shall conduct the accounting treatment according to the termination benefits. When the relevant recognition conditions of early retirement are met, the early retirement benefits to be paid by the Group during the period from the date of the employee who voluntarily quit jobs stopping providing service to the date of normal retirement shall be recognized as the estimated liabilities and included into the current expenses.
(4) Accounting Treatment Method of Other Long-term Employee Benefits
Other long-term employee benefits which are in conformity with the conditions of defined contribution plan shall be dealt with according to the relevant provisions of the above defined contribution plan.
24. Estimated Liabilities
When the obligation related to the contingencies is the current obligation borne by the Group, the performance of such obligation may lead to the outflow of economic interests, and the amount of such obligation can be measured reliably, such obligation shall be recognized as the estimated liabilities.
On the balance sheet date, risks associated with contingencies, uncertainty, time value of money and other factors shall be considered, and the estimated liabilities shall be measured according to the best estimate paid for the performance of current obligation. If the time value of money has significant impact, the best estimate shall be determined according to the discounted amount of the estimated future cash outflow.
25. Share-based Payment
Share-based payment of the Group is the transaction that the Group grants equity instruments or undertakes the liabilities recognized based on the equity instruments for getting the services from the employees. Share-based payment of the Group is the equity-settled share-based payment.
25.1 Equity-settled Share-based Payment
Equity-settled share-based payment granted to the employees: For equity-settled share-based payment for getting the services provided by the employees, the Group shall conduct the measurement according to the fair value of the equity instruments granted to the employee on the grant date. The amount of such fair value shall be based on the best estimate on the number of vesting equity instruments within the waiting period and shall be calculated with straight line method and included in the relevant costs or expenses, and the capital reserves shall be increased accordingly. On each balance sheet date within the waiting period, the Group shall make the best estimate and correct the number of vesting equity instruments according to the latest follow-up information such as the change of number of vesting employees. The impact from the above estimate shall be included in the current relevant costs or expenses, and the capital reserves shall be adjusted accordingly.

2016 Semi-annual Report
70 / 151
25.2 Relevant Accounting Treatment of Implementation, Modification and Termination of Share-based Payment Plan
When the Group changes the share-based payment plan, if such change increases the fair value of the equity instruments granted, the increase of the acquired service shall be confirmed according to the increase of the fair value of the equity instruments. If such change increases the number of the equity instruments granted, the increased fair value of the equity instrument shall be recognized as the increase of the acquired service accordingly. The increase of the fair value of equity instruments refers to the difference of fair value on the change date of equity instruments before and after the change. If such change decreases the total fair value of share-based payment or other ways which are unfavorable to the employee are used to change the terms and conditions of share-based payment plan, the acquired service shall continue to be dealt with the accounting treatment, and it shall be deemed that such change never occur, unless the Group cancels part or all of the equity instruments granted.
Within the waiting period, if the equity instruments granted are canceled, the Group will conduct the acceleration of vesting treatment for the equity instruments of which the grant is canceled, include the amount which should be recognized within the remaining waiting period into the current profits and losses, and recognize the capital reserves. The employee can select those meeting the non-vesting conditions but failing to meet within the waiting period; the Group will conduct the cancellation treatment of equity instruments granted.
25.3 Others
For restricted shares subscription money paid by incentive object, if the releasing condition fails to be met, the subscription money shall be returned to the incentive object. When getting such money, the Group shall confirm the capital stock and capital reserves (capital stock premium) according to the subscription money, and confirm the liability and treasury stock regarding to repurchase obligation.
26. Revenue
26.1 Revenue from Sales of Commodities
No revenue from selling goods may be recognized unless all of the following conditions are met simultaneously: the significant risks and rewards of ownership of the goods have been transferred to the buyer by the enterprise; the enterprise retains neither continuous management right usually relating to the ownership nor effective control over the goods sold; the relevant amount of revenue can be measured in a reliable way; the relevant economic benefits are likely to flow into the enterprise; the relevant costs incurred or to be incurred can be measured in a reliable way.
26.2 Revenue from Rendering of Services
The outcome of a transaction concerning the rendering of labor services can be measured in a reliable way, means that the following conditions shall be met simultaneously: the amount of revenue can be measured in reliable way; the relevant economic benefits are likely to flow into the enterprise; the schedule of completion under the transaction can be confirmed in a reliable way; and the costs incurred or to be incurred in the transaction can be measured in a reliable way. The Group shall recognize the revenue from rendering services employing the percentage-of-completion method. The schedule of completion under the transaction concerning the rendering of labor services shall be determined according to the proportion of the costs incurred against the estimated total cost. If the result of a transaction concerning the rendering of labor services cannot be estimated in a reliable way, the revenue from the rendering of labor services shall be recognized in accordance with the amount of the cost of labor services which has incurred and can be compensated. If no compensation is estimated to be received for the labor service cost incurred, no revenue will be recognized.
26.3 Royalty Revenues
Royalty revenues shall be recognized in accordance with such times and methods as stipulated in the relevant contracts or agreements.
26.4 Interest Revenues
The amount of interest revenue should be measured and determined in accordance with the length of time for which the Group's cash is used by others and with the actual interest rate.

2016 Semi-annual Report
71 / 151
27. Government Subsidies
A government subsidy means the monetary or non-monetary asset obtained free by the Group from the government. Government subsidies are divided into government subsidies pertinent to assets and government subsidies pertinent to incomes, depending on the natures of the subsidy targets as expressly defined in relevant government documents.
No government subsidy may be recognized unless relevant conditions are met simultaneously. If a government subsidy is a monetary asset, it shall be measured in the light of the received or receivable amount.
(1) Judgment Basis and Accounting Treatment Method of Government Subsidies Pertinent to Assets
Government subsidies of the Group mainly include the government subsidies related to technical reform in previous years. Because such government subsidies are pertinent to the fixed assets under acquisition and construction or purchase, these shall be the government subsidies pertinent to assets.
The government subsidies pertinent to assets shall be recognized as deferred income, equally distributed within the useful lives of the relevant assets, and included in the current profits and losses.
(2) Judgment Basis and Accounting Treatment Method of Government Subsidies Pertinent to Income
Government subsidies of the Group mainly include the special funds for foreign economic and technological cooperation, etc. Because such government subsidies are directly pertinent to the period expense incurred, these shall be the government subsidies pertinent to income.
The government subsidies pertinent to incomes shall be treated respectively in accordance with the circumstances as follows: those subsidies used for compensating the related future expenses or losses of the Group shall be recognized as deferred income and shall be included in the current profits and losses during the period when the relevant expenses are recognized; or those subsidies used for compensating the related expenses or losses incurred to the enterprise shall be directly included in the current profits and losses.
If it is necessary to refund any government subsidy which has been recognized, it shall be treated respectively in accordance with the circumstances as follows: if deferred income is concerned, the book balance of the deferred income shall be offset against, but the excessive part shall be included in the current profits and losses; and if no deferred income is concerned, it shall be directly included in the current profits and losses.
Government compensation for relocation of enterprises for public interest
The Group has to be relocated as a result of overall town planning and other public interests so the relocation compensation directly appropriated from the financial budget by the government shall be treated as a special account payable. Where compensation is made for losses on the fixed assets and intangible assets, the cost of expenses, losses on work stoppage during relocation and reconstruction of enterprise and proposed new assets after the relocation of assets, such compensation shall, after the special account payable is transferred to the deferred incomes, be calculated depending on its natures and in light of the government subsidies related to government and to the revenues. Any balance after the amount transferred into the deferred incomes is deducted from the obtained relocation compensation shall be recognized as the capital reserve.
28. Deferred Income Tax Assets and Deferred Income Tax Liabilities
Income tax expenses shall include the current income taxes and the deferred income taxes.
28.1 Current Income Taxes
At the balance sheet date, current income tax liabilities (or assets) for the current and prior periods shall be measured at the amount expected to be paid (or refunded) according to the requirements of tax laws.
28.2 Deferred Tax Assets and Deferred Tax Liabilities
The difference between the carrying amount of an asset or liability and its tax base, and temporary difference between the tax base and the carrying amount of an item which has not been recognized as an asset or liability but its tax base can be determined in light of the tax law, shall be used to recognize the deferred tax assets and deferred tax liabilities using the balance sheet liability method.

2016 Semi-annual Report
72 / 151
In general cases, related deferred income taxes are recognized for all temporary differences. The Group shall recognize the deferred income tax liabilities arising from a deductible temporary difference to the extent of the amount of the taxable income which it is most likely to obtain and which can be deducted from the deductible temporary difference. Besides, the Group shall not recognize the deferred income tax assets or liabilities arising from all taxable temporary differences related to: the initial recognition of business reputation; the initial recognition of assets or liabilities arising from the following transactions which are simultaneously featured by the following: (a) the transaction is not business combination; (b) At the time of transaction, the accounting profits will not be affected, nor will the taxable amount (or the deductible loss) be affected. As for any deductible loss or tax deduction that can be carried forward to subsequent years, the corresponding deferred income tax assets shall be recognized to the extent that the amount of future taxable income to be offset by the deductible loss or tax deduction to be likely obtained.
The taxable temporary differences related to the investments of subsidiary companies, associates and joint ventures shall recognize corresponding deferred income tax liabilities. However, those that can simultaneously meet the following conditions shall be excluded: the Group can control the time of reversing temporary differences; and the temporary differences are unlikely to be reversed in the excepted future. Where the deductible temporary difference related to the investments of the subsidiaries, associates and joint ventures can meet the following requirements simultaneously, the Group shall recognize the corresponding deferred income tax assets: the temporary differences are likely to be reversed in the expected future; and it is likely to acquire any amount of taxable income tax that may be used for offsetting the deductible temporary differences.
On the balance sheet day, the deferred income tax assets and deferred income tax liabilities shall be measured at the tax rate applicable to the period during which the assets are expected to be recovered or the liabilities are expected to be settled.
Except the income taxes of the current period and deferred income tax related to the transactions or events directly recorded in the other consolidated income or shareholder's equities shall be recorded into the other consolidated income or shareholder's equities, and except the book value of business reputation adjusted by the deferred income taxes arising from the business combination, the remaining current income taxes and deferred income tax expenses or proceeds shall be recorded into the current profits and losses.
The book value of deferred income tax assets shall be reexamined on balance sheet date. If it is unlikely to obtain sufficient taxable income taxes to offset the benefit of the deferred income tax assets, the carrying amount of the deferred income tax assets shall be written down. When it is likely to obtain sufficient taxable income taxes, such written-down amount shall be subsequently reversed.
28.3 Offset of Income Tax
When the Group has the statutory right for net settlement, and attempts to conduct net settlement or acquisition of assets and satisfaction of liabilities simultaneously, the current income tax assets and the current income tax liabilities shall be presented as the net amount after offset.
The deferred income tax assets and the deferred income tax liabilities of the Group shall be presented as the net amount after offset if and only if: the Group has a legally enforceable right to set off current tax assets against current tax liabilities; and the deferred tax assets and the deferred tax liabilities relate to income taxes levied by the same taxation authority on either: the same taxable entity; or different taxable entities which intend either to settle current tax liabilities and assets on a net basis, or to realize the assets and settle the liabilities simultaneously, in each future period in which significant amounts of deferred tax liabilities or assets are expected to be settled or recovered.
29. Leasing
The term "financing lease" shall refer to a lease that has transferred substantially all the risks and rewards related to the ownership of an asset. The term "operating lease" shall refer to a lease other than a financing lease.
29.1 Accounting Treatment Methods for Operating Lease
29.1.1 Operating Leases Recorded by the Group as a Lessee
The rental expenses from operating leases shall be recorded by the lessee in the relevant asset costs or the profits and losses of the current period by using the straight-line method over each period of the lease term. The initial direct costs shall be included in the profits and losses of the current period, while contingent rents shall be included in the profits and losses of the period in which they are actually incurred.

2016 Semi-annual Report
73 / 151
29.1.2 Operating Leases Recorded by the Group as a Lessor
The rental incomes from operating leases shall be recognized as the current profits and losses by using the straight-line method over each period of the lease term. The initial direct costs with a relatively large amount shall be capitalized, and recorded into the current profits and losses in more than one phase on the basis same as that of the recognition of rental incomes during the entire lease term; the other initial direct costs with a relatively small amount shall be recorded into the profits and losses in the period in which they are actually incurred. Contingent rents shall be included in the profits and losses of the period in which they are actually incurred.
29.2 Accounting Treatment Methods for Financing Lease
29.2.1 Financing Leases Recorded by the Group as a Lessor
On the date when the lease term starts, the sum of the minimum lease receipts and the initial direct costs shall be treated as the entry values of the financing lease receivable, and the unsecured residual values shall be recorded simultaneously; the difference between the sum of the minimum lease receipts, the initial direct costs and the unsecured residual values thereof, and the sum of the minimum lease receipts, the initial direct costs and the present values thereof shall be recognized as the unrealized financing incomes. During the lease term, unrealized financing incomes shall be recognized during the lease term using the effective interest method. Contingent rents shall be included into the profits or losses of the period in which they are actually incurred.
After the unrealized financing incomes are deducted from the financing lease accounts receivable, the balance shall be presented as the long-term claim and the long-term claim due in one (1) year.
30. Key Assumptions Adopted for and Uncertain Factors Involved in Significant Judgments and Accounting Estimates Made in the Process of Applying Accounting Policies
In the application of the accounting policies described in Note (III), the Group is required to make judgments, estimates and assumptions about the carrying amounts of items in the financial statements that cannot be measured accurately. These judgments, estimates and assumptions are based on historical experience of the Group's management as well as other factors that are considered to be relevant. Actual results may differ from these estimates of the Group.
The aforementioned judgments, estimates and assumptions are reviewed regularly on an ongoing basis. Revisions to accounting estimates are recognized in the period in which the estimate is revised if the revision affects only that period or in the period of the revision and future periods if the revision affects both current and future periods.
Key Assumptions Adopted for and Uncertain Factors Involved in Accounting Estimates
The key accounting estimates and key assumptions that have a significant risk of causing a material adjustment to the carrying amount of assets and liabilities within the future accounting periods are outlined as below.
30.1 Inventory Falling Price Reserve
As mentioned in Note (III), 13, the inventories shall be measured according to the cost or the net realizable value, whichever is lower. The net realizable value refers to the amount after deducting the estimated cost of completion, estimated sale expense and relevant taxes from the estimated sale price of inventories.
Whereas a considerable portion of the operating capitals of the Group is used for inventories, the Group has a special operating procedure to control this risk. On a periodic basis, the Group can implement the all-around stock-taking over the inventories and determine whether there exist obsolete and idle inventories and review their decreases in value. The review procedure involves the determination whether any obsolete and idle inventories need to make provisions in the financial statements by the comparison between the book value of obsolete and idle inventories and their corresponding net realizable value. The appropriate accounting estimate shall be required for the selling price of inventories employed by the net realizable value, the estimated cost of completion, selling expenses, and relevant taxes from the estimated sale price of inventories. The management has ensured the rationality of the accounting estimate in accordance with the optimal estimate, and considering the historical experiences, present production costs and sales expenses. Based on the aforesaid procedure, the falling price reserves have, in the opinion of the management of the Group, been made in full for the obsolete and idle inventories.
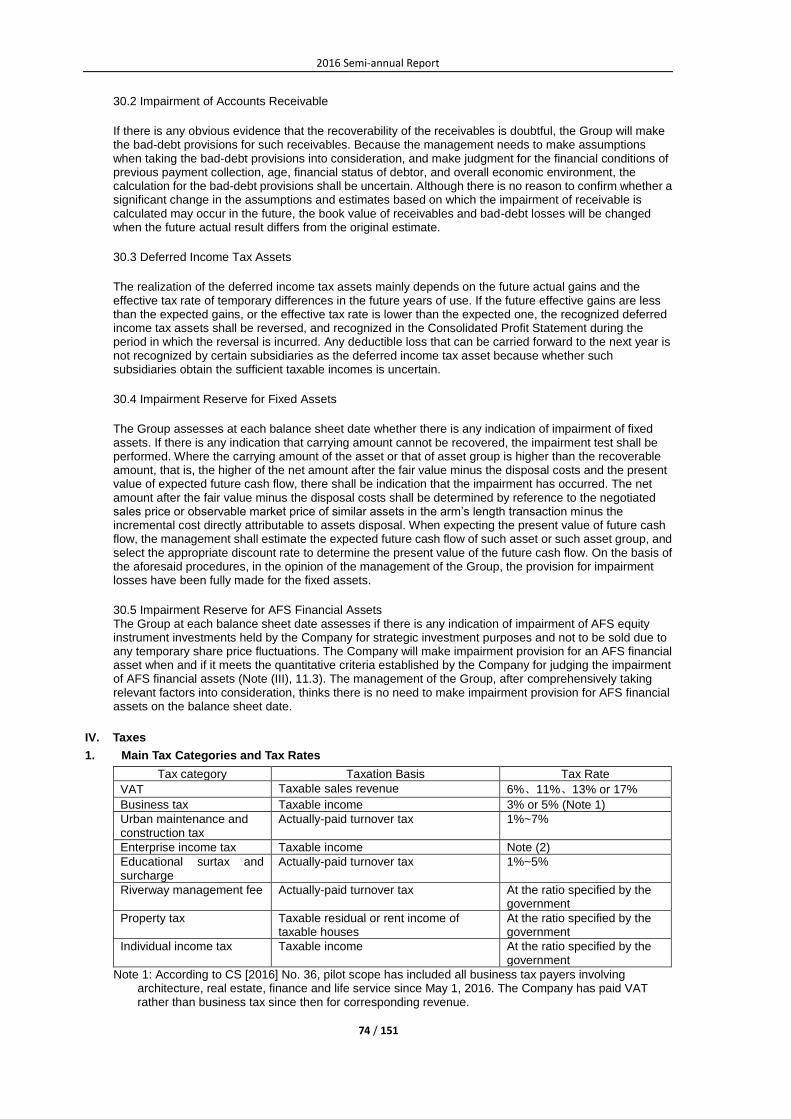
2016 Semi-annual Report
74 / 151
30.2 Impairment of Accounts Receivable
If there is any obvious evidence that the recoverability of the receivables is doubtful, the Group will make the bad-debt provisions for such receivables. Because the management needs to make assumptions when taking the bad-debt provisions into consideration, and make judgment for the financial conditions of previous payment collection, age, financial status of debtor, and overall economic environment, the calculation for the bad-debt provisions shall be uncertain. Although there is no reason to confirm whether a significant change in the assumptions and estimates based on which the impairment of receivable is calculated may occur in the future, the book value of receivables and bad-debt losses will be changed when the future actual result differs from the original estimate.
30.3 Deferred Income Tax Assets
The realization of the deferred income tax assets mainly depends on the future actual gains and the effective tax rate of temporary differences in the future years of use. If the future effective gains are less than the expected gains, or the effective tax rate is lower than the expected one, the recognized deferred income tax assets shall be reversed, and recognized in the Consolidated Profit Statement during the period in which the reversal is incurred. Any deductible loss that can be carried forward to the next year is not recognized by certain subsidiaries as the deferred income tax asset because whether such subsidiaries obtain the sufficient taxable incomes is uncertain.
30.4 Impairment Reserve for Fixed Assets
The Group assesses at each balance sheet date whether there is any indication of impairment of fixed assets. If there is any indication that carrying amount cannot be recovered, the impairment test shall be performed. Where the carrying amount of the asset or that of asset group is higher than the recoverable amount, that is, the higher of the net amount after the fair value minus the disposal costs and the present value of expected future cash flow, there shall be indication that the impairment has occurred. The net amount after the fair value minus the disposal costs shall be determined by reference to the negotiated sales price or observable market price of similar assets in the arm’s length transaction minus the incremental cost directly attributable to assets disposal. When expecting the present value of future cash flow, the management shall estimate the expected future cash flow of such asset or such asset group, and select the appropriate discount rate to determine the present value of the future cash flow. On the basis of the aforesaid procedures, in the opinion of the management of the Group, the provision for impairment losses have been fully made for the fixed assets.
30.5 Impairment Reserve for AFS Financial Assets The Group at each balance sheet date assesses if there is any indication of impairment of AFS equity instrument investments held by the Company for strategic investment purposes and not to be sold due to any temporary share price fluctuations. The Company will make impairment provision for an AFS financial asset when and if it meets the quantitative criteria established by the Company for judging the impairment of AFS financial assets (Note (III), 11.3). The management of the Group, after comprehensively taking relevant factors into consideration, thinks there is no need to make impairment provision for AFS financial assets on the balance sheet date.
IV. Taxes
1. Main Tax Categories and Tax Rates
Tax category Taxation Basis Tax Rate
VAT Taxable sales revenue 6%、11%、13% or 17%
Business tax Taxable income 3% or 5% (Note 1)
Urban maintenance and construction tax
Actually-paid turnover tax 1%~7%
Enterprise income tax Taxable income Note (2)
Educational surtax and surcharge
Actually-paid turnover tax 1%~5%
Riverway management fee Actually-paid turnover tax At the ratio specified by the government
Property tax Taxable residual or rent income of taxable houses
At the ratio specified by the government
Individual income tax Taxable income At the ratio specified by the government
Note 1: According to CS [2016] No. 36, pilot scope has included all business tax payers involving architecture, real estate, finance and life service since May 1, 2016. The Company has paid VAT rather than business tax since then for corresponding revenue.

2016 Semi-annual Report
75 / 151
Note 2: The Company shall have the enterprise income tax rate of 25%. Each subsidiary of the Group shall, in light of their respective income tax rate, make accrual and payment for business income tax in proportion to their respective taxable incomes. The overseas subsidiaries of the Group shall, in accordance with the tax laws of their locations, make accrual and payment for business income tax.
V. Notes to Consolidated Financial Statements
1. Monetary Funds
Unit: RMB
Item Ending balance Beginning balance
Cash on hand 859,578.31 664,508.04
Bank deposit 12,685,876,497.60 6,903,794,819.63
Other monetary funds 838,519,595.83 912,483,788.44
Total 13,525,255,671.74 7,816,943,116.11
Where: total overseas deposit 2,796,874,834.26 1,639,426,680.42
Particulars about restricted monetary funds: Unit: RMB
Item Ending balance Balance at the beginning of
the year
Legal reserves deposited by the Finance Company in the Central Bank of China
802,025,553.04 848,054,823.96
On June 30, 2016, monetary fund of the Group deposited overseas was RMB 2,796,874,834.26 (December 31, 2015: RMB 1,639,426,680.42). By the end of the reporting period, other monetary funds of the Group mainly included RMB 273,610.67 of the Group’s refundable investment funds (December 31, 2015: RMB 316,726.75), RMB 26,677,814.62 of bank acceptance deposit (December 31, 2015: RMB 54,125,398.02), RMB 5,660,557.81 of deposit of letter of guarantee (December 31, 2015: RMB 9,531,943.88), RMB 503,463.29 of credit card deposit (December 31, 2015: RMB 324,915.82), etc..
2. Financial Assets Measured by Fair Value and the Change Calculated in Current Gain and Loss
√ Applicable □Not applicable Unit: RMB
Item Ending balance Beginning balance
Held-for-trading financial assets 1,658,109,189.61 872,874,998.19
Where: Debt instrument investment 301,532,400.00 10,247,756.02
Equity instrument investment 1,395,067.16 52,039,179.96
Derivative financial assets 4,181,722.45
Others 1,351,000,000.00 810,588,062.21
Total 1,658,109,189.61 872,874,998.19
In the opinion of the management of the Company, the realization of the held-for-trading financial asset investment has no major limitation.
3. Notes Receivable
(1) Categories of Notes Receivable
√ Applicable □Not applicable Unit: RMB
Item Ending balance Beginning balance
Bank acceptance 6,900,463,598.40 7,405,501,078.59
Trade acceptance 877,677,820.00 787,097,624.19
Total 7,778,141,418.40 8,192,598,702.78
(2) Notes Receivable that Has Been Pledged by the Company at the End of the Period
□ Applicable √ Not applicable
(3) Notes Receivable That Have Been Endorsed or Discounted by the Company at the End of the Period and not Been Overdue on Balance Sheet Date:
□ Applicable √ Not applicable

2016 Semi-annual Report
76 / 151
(4) Notes That Have Been Converted as Accounts Receivable by the Company at the End of the Period Because the Drawer Has not Performed the Contract
□Applicable √Not applicable
(5) At the end of the period and the beginning of the year, in the balance of notes receivable, there are no arrears owed to the Company by any shareholder holding shares representing 5% or more of voting rights of the Company.
(6) Refer to the Note (X), 6(1) for the notes receivable from the affiliated parties in the balance of notes receivable.
4. Accounts Receivable
(1) Account ages of receivables
Unit: RMB
Age
Ending balance Balance at the beginning of the year
Amount Ratio (%) Bad debt reserves
Book value Ratio (%) Bad debt reserves
Book value 金额
Within 1 year
8,907,903,047.50 93 330,017,583.58 8,577,885,463.92 8,896,959,848.03 92 314,461,324.78 8,582,498,523.25
1-2 years 291,912,616.82 3 20,240,053.21 271,672,563.61 378,613,268.11 4 35,400,252.29 343,213,015.82
2-3 years 176,567,335.38 2 37,104,218.10 139,463,117.28 187,468,604.13 2 42,667,227.20 144,801,376.93
3 years or more
240,095,457.27 2 122,296,069.53 117,799,387.74 218,257,711.54 2 130,707,350.43 87,550,361.11
Total 9,616,478,456.97 100 509,657,924.42 9,106,820,532.55 9,681,299,431.81 100 523,236,154.70 9,158,063,277.11
(2) Accounts Receivables Disclosure by Category
Unit: RMB
Category Ending balance Beginning balance
Book balance Bad-debt provision
Book Value
Book balance Bad-debt provision
Book Value Amount
Proportion (%)
Amount Provision
proportion (%) Amount
Proportion (%)
Amount Provision
proportion (%)
Other accounts receivable with significant single amount and individual bad debt provision
1,650,904,042.83 17 28,972,493.05 2 1,621,931,549.78 1,611,241,932.67 17 40,613,092.34 3 1,570,628,840.33
Other accounts receivable with bad debt provision according to credit risk characteristics combination
7,843,278,344.61 82 358,389,361.84 5 7,484,888,982.77 7,939,350,148.71 82 351,915,711.93 4 7,587,434,436.78
Receivables with bad-debt provisions made individually in spite of insignificant single amounts
122,296,069.53 1 122,296,069.53 100 - 130,707,350.43 1 130,707,350.43 100 -
Total 9,616,478,456.97 / 509,657,924.42 / 9,106,820,532.55 9,681,299,431.81 / 523,236,154.70 / 9,158,063,277.11

2016 Semi-annual Report
77 / 151
EOP accounts receivable with significant single amounts or those for which independent bad-debt provisions already performed in spite of insignificant single amounts √Applicable □Not applicable
Unit: RMB
Accounts receivable (by unit)
Ending Balance
Accounts receivable Bad-debt provision Provision
proportion (%) Reason
Accounts receivable with significant single amounts
1,650,904,042.83 28,972,493.05 2 Note 1
Receivables with relatively long age
122,296,069.53 122,296,069.53 100 Note 2
Total 1,773,200,112.36 151,268,562.58 / /
Unit: RMB
Accounts receivable (by unit)
Beginning Balance
Accounts receivable Bad-debt provision Provision
proportion (%) Reason
Accounts receivable with significant single amounts
1,611,241,932.67 40,613,092.34 3 Note 1
Receivables with relatively long age
130,707,350.43 130,707,350.43 100 Note 2
Total 1,741,949,283.10 171,320,442.77 / /
Note 1: The Group independently performed impairment tests on accounts receivable with significant single amounts and at the end of this reporting period did not make impairment provisions for single accounts receivables (nor did the Group make 2015 impairment provisions for single accounts receivables at the end of Y2015). So, bad-debt provision, RMB 28,972,493.05 (Y2015: RMB 40,613,092.34), was mad by portfolio as per Note (III), 12.
Note 2: Bad-debt provisions are made in full for accounts receivable with relatively long ages and minimum possibility of recovery. In combination, accounts receivable using account age analysis to provision bad debt reserves: √Applicable □Not applicable
Unit: RMB
Account age Ending balance
Accounts receivable Bad debt reserves Provision proportion %
Subtotal of within 1 year 7,256,999,004.67 301,045,090.53 4
1-2 years 291,912,616.82 20,240,053.21 7
2-3 years 176,567,335.38 37,104,218.10 21
Over 3 years 117,799,387.74 - -
Total 7,843,278,344.61 358,389,361.84 5
Unit: RMB
Account age Beginning balance (Note)
Accounts receivable Bad debt reserves Provision proportion (%)
Within 1 year 7,285,717,915.36 273,848,232.44 4
1-2 years 378,613,268.11 35,400,252.29 9
2-3 years 187,468,604.13 42,667,227.20 23
Over 3 years 87,550,361.11 - -
Total 7,939,350,148.71 351,915,711.93 4
Note: Above accounts receivable include those falling in the scope of consolidated finance statements of Baosteel Group, which shall not be provisioned according to bad debt reserves accounting policies of the Group,
(3) Bad Debts Reserves Provisioned, Recovered or Transferred-back in Current Period:
Total bad debts reserves provisioned in current period was 52,753,303.50 Yuan; and bad debts reserves recovered or transferred back was 67,215,540.68 Yuan. Bad debts reserves have decreased by RMB 1,369,661.32 due to the translation of foreign currency statement. Significant bad debts reserves recovered or transferred back: □Applicable √ Not applicable

2016 Semi-annual Report
78 / 151
(4) Actual Written-off Accounts Receivable in Current Period
√Applicable □Not applicable Unit: RMB
Item Amount
Actual written-off accounts receivable 485,654.42
Where: Significant written-off accounts receivable □Applicable √ Not applicable
(5) Accounts Receivable with Top 5 Ending Balance Collected According to the Debtor
On June 30, 2016, for accounts receivable of the Group, total amount of top five units was RMB 1,650,904,042.83, accounting for 17% of the total amount of accounts receivable, with bad debts reserves provision of RMB 28,972,493.05.
(6) Accounts Receivable under Derecognition due to the Transfer of Financial Assets:
None.
(7) Amount of Assets and Liabilities due to Transfer of Accounts Receivable and Formed by Continuous Involvement:
None.
(8) By the end of reporting period and at the beginning of the year, For information on unit of shareholders holding 5% or more of the voting shares among the accounts receivable and information on funds receivable of other related parties, please see note (X), 6 (2).
5. Advance Payments
(1) Advance Payments Presented by Age
Unit: RMB
Age Ending balance Beginning balance
Amount Proportion (%) Amount Proportion (%)
Within 1 year 4,594,876,303.71 95 4,020,560,343.15 97
1-2 years 153,249,625.28 3 79,983,246.13 2
2-3 years 28,091,339.00 1 17,690,997.15 0
3 years or more 44,700,012.65 1 41,374,233.18 1
Total 4,820,917,280.64 100 4,159,608,819.61 100
Notes to advances with account age over 1 year and significant amount that have not been properly settled: By June 30, 2016, the large-amount advance payments by the Group with an age of one year or longer were mainly available for the procurement of large-sized equipment for the construction in progress.
(2) Top 5 Prepayment among Ending Balance Collected according to the Prepayment Object:
On June 30, 2016, total amount of prepayments of top five units was 1,812,380,949.06 Yuan, accounting for 38% of the total prepayments.
(3) At the end of reporting period and the beginning of the year, the balance of prepayment excludes the money of unit of shareholders holding 5% or more voting shares of the Company.
(4) Advance Payments by Customer Category:
Unit: RMB Yuan
Category Ending balance Balance at the beginning of
the year
Advance payments with significant single amounts
1,812,380,949.06 1,670,671,267.03
Other advance payments with insignificant single amounts
3,008,536,331.58 2,488,937,552.58
Total 4,820,917,280.64 4,159,608,819.61
(5) For amounts advanced to the related parties, please refer to Note (X), 6(3).

2016 Semi-annual Report
79 / 151
6. Interest Receivable
√Applicable □Not applicable
(1) Interest Receivable Category
Unit: RMB
Item Ending balance Beginning balance
Time deposit 1,251,045.94 1,949,868.15
Entrusted loans - 1,119,658.85
Securities investment
Interests of gains receivable from assets transfer (see note (V) 15 (note 1))
43,321,721.29 290,967,534.24
Others 4,447,002.08 124,958.05
Total 49,019,769.31 294,162,019.29
By the end of reporting period and at the beginning of the year, account age of interest receivable is within 1 year.
(2) For interest receivable from related parties among interest receivable please see note (X), 6 (4).
7. Dividends Receivable
√Applicable □Not applicable
(1) Dividends Receivable
Unit: RMB
Item (Or Investee) Ending balance Beginning balance
CISDI Engineering Co., Ltd. (Note) 23,852,647.00 23,852,647.00
Yongcheng Coal & Electricity (Group) Co.,Ltd. 127,017,186.28
Henan Pingbao Coal Co., Ltd. 12,000,000.00
Total 23,852,647.00 162,869,833.28
Note: Dividend receivable from CISDI Engineering Co., Ltd. was RMB 11,298,647.00 on June 30, 2016, with the account aging 1-2 years, of the recovery risk considered by the Company management was under control.
(2) Significant Dividends Receivable with Account Age Over 1 Year:
□Applicable √Not applicable

2016 Semi-annual Report
80 / 151
8. Other Receivables
(1) Other Receivables by Account Age
Unit: RMB
Age
Ending balance Balance at the beginning of the year
Amount Proportion
(%) Bad-debt provision Book value Amount
Proportion (%)
Bad-debt provision
Book value
Within 1 year
1,650,887,234.91 89 136,981,477.14 1,513,905,757.77 875,319,421.55 79 8,134,692.17 867,184,729.38
1-2 years 21,267,836.32 1 3,979,413.27 17,288,423.05 37,756,633.22 3 3,554,264.69 34,202,368.53
2-3 years 139,381,764.18 7 5,921,327.69 133,460,436.49 131,301,356.72 12 5,149,058.56 126,152,298.16
3 years or more
63,001,073.39 3 42,032,751.26 20,968,322.13 69,439,480.03 6 39,744,095.49 29,695,384.54
Total 1,874,537,908.80 100 188,914,969.36 1,685,622,939.44 1,113,816,891.52 100 56,582,110.91 1,057,234,780.61
(2) Disclosure of Other Receivables by Category:
Unit: RMB
Category
Ending balance Beginning balance
Book balance Bad debt provision
Book value
Book balance Bad debt provision
Book value Amount
Ratio (%)
Amount Provision proportion
(%) Amount Ratio (%) Amount
Provision proportion
(%)
Other receivables with significant single amount and individual bad debt provision
327,397,604.50 17 3,061,293.64 1 324,336,310.86 306,246,025.49 27 - - 306,246,025.49
Other receivables with bad debt provision according to credit risk characteristics combination
1,378,090,366.76 74 16,803,738.18 1 1,361,286,628.58 767,826,770.54 69 16,838,015.42 2 750,988,755.12
Other receivables for which independent bed debt provision is performed in spite of insignificant single amounts
169,049,937.54 9 169,049,937.54 100 - 39,744,095.49 4 39,744,095.49 100 -
Total 1,874,537,908.80 / 188,914,969.36 / 1,685,622,939.44 1,113,816,891.52 / 56,582,110.91 / 1,057,234,780.61

2016 Semi-annual Report
81 / 151
Other receivables that have significant single amount at the end of the period with individual bad debt reserves provision made √Applicable □Not applicable
Unit: RMB
Ending balance
Other receivables (By units)
Other receivables Bad debt reserves Provision
proportion % Provision cause
Large other receivables
327,397,604.50 3,061,293.64 1 Note 1
Other receivables with long account age
169,049,937.54 169,049,937.54 100 Note2
Total 496,447,542.04 172,111,231.18 / /
Unit: RMB
Other receivables (By units)
Balance at the beginning of the year
Other receivables Bad debt reserves Provision
proportion % Provision cause
Large other receivables 306,246,025.49 - - Note 1
Other receivables with long account age
39,744,095.49 39,744,095.49 100 Note2
Total 345,990,120.98 39,744,095.49
Note 1: Large other receivables are mainly the electricity charge deposit, advances for project and other funds with lower recovery risk, and there was no bad debt reserves provision for receivables of related parties within the Group, so the book balance of other receivables of the Company was RMB 327,397,604.50 (December 31, 2015: RMB 306,246,025.49), and bad debt reserves provision was 3,061,293.64 Yuan.
Note 2: Account age of other receivables is long and the possibility of recovery is very small, so the Company made in full bad debt reserves provision for such other receivables.
In combination, other accounts receivables using account age analysis to provision bad debt reserves: √Applicable □Not applicable
Unit: RMB
Account age Ending balance
Other receivables Bad debt reserves Provision proportion %
Subtotal of within 1 year 1,308,523,084.23 6,902,997.22 1
1-2 years 21,267,836.32 3,979,413.27 19
2-3 years 27,331,124.08 5,921,327.69 22
Over 3 years 20,968,322.13 - -
Total 1,378,090,366.76 16,803,738.18 1
Account age Balance at the beginning of the year
Other receivables Bad debt reserves Provision proportion %
Within 1 year 701,356,412.16 8,134,692.17 1
1-2 years 37,756,633.22 3,554,264.69 9
2-3 years 19,250,716.62 5,149,058.56 27
Over 3 years 9,463,008.54 - -
Total 767,826,770.54 16,838,015.42 2
In combination, other accounts receivables using balance percentage method to provision bad debt reserves: □Applicable √Not applicable In combination, other accounts receivables using other methods to provision bad debt reserves: □Applicable √Not applicable
(3) Bad Debts Reserves Provisioned, Recovered or Transferred back in Current Period:
Bad debts reserves provision in the current period was 132,998,664.05Yuan; and bad debts reserves recovered or transferred back was 665,805.60Yuan. Significant bad debts reserves recovered or transferred back in the current period: □Applicable √Not applicable

2016 Semi-annual Report
82 / 151
(4) Actual Written-Off Other Receivables in Current Period
□Applicable √Not applicable
(5) Classification of Other Receivables according to Nature of Money
□Applicable √Not applicable
(6) Other Receivables with Top 5 Ending Balance Collected according to the Debtor
√Applicable □Not applicable On June 30, 2016, total amount from top 5 units of other receivables of the Company was RMB 327,397,604.50, accounting for 17% of the total amount of other receivables, with RMB 3,061,293.64 of bad debts reserves provision.
(7) Receivables Involving in Government Subsidies
□Applicable √Not applicable
(8) Other Receivables under Derecognition due to the Transfer of Financial Assets:
None.
(9) Amount of Assets and Liabilities Formed by Transfer of Other Receivables and Continuous Involvement:
None.
(10) By the end of reporting period and at the beginning of the year, for funds of unit of shareholders holding 5% (including 5%) voting shares of the Company or more among the other receivables and funds of other related parties receivable please see note (X), 6 (5).
9. Buying Back the Sale of Financial Assets
Unit: RMB
Item Ending balance Balance at the beginning of the year
Buying back the sale of financial assets
- 2,140,000,000.00
10. Inventory
(1) Classification of Inventories
Unit: RMB
Item
Ending balance Beginning balance
Book balance Falling price
reserve Book value Book balance
Falling price reserve
Book value
Raw materials 4,448,176,132.45 110,450,848.91 4,337,725,283.54 2,946,702,429.03 127,758,317.36 2,818,944,111.67
Work-in-progress
7,633,641,238.85 478,618,920.48 7,155,022,318.37 7,228,761,440.83 443,789,510.43 6,784,971,930.40
Stock 12,065,867,431.7
9 796,644,325.27
11,269,223,106.52
11,003,224,858.87
869,320,702.99 10,133,904,155.8
8
Spare parts and others
4,025,755,347.76 228,454,942.55 3,797,300,405.21 3,995,946,319.40 218,005,782.81 3,777,940,536.59
Total 28,173,440,150.8
5 1,614,169,037.2
1 26,559,271,113.6
4 25,174,635,048.1
3 1,658,874,313.5
9 23,515,760,734.5
4
(2) Falling Price Reserve of Inventories
Unit: RMB
Item Beginning balance
Increased amount in the period
Decreased amount in the period
Ending balance
Provision Others
Write-back or Write-off
others
Raw materials
127,758,317.36 6,817,756.51 24,125,224.96 0 110,450,848.91
Work-in-progress
443,789,510.43 208,557,758.36 173,741,890.9
8 -13,542.67 478,618,920.48

2016 Semi-annual Report
83 / 151
Stock 869,320,702.99 165,552,110.51 239,197,013.1
5 -968,524.92 796,644,325.27
Spare parts and others
218,005,782.81 12,104,430.58 1,655,270.84 0 228,454,942.55
Total 1,658,874,313.5
9 393,032,055.96
438,719,399.93
-982,067.59 1,614,169,037.2
1
Item Basis for inventory falling price
reserve Cause of reversing inventory
falling price reserve in this period
Proportion of amount reversed in this period to EOP balance of
this inventory
Raw materials Book value of inventories higher
than net realizable value Rising market price or falling
product cost 1%
Work-in-progress Book value of inventories higher
than net realizable value Rising market price or falling
product cost 2%
Finished goods Book value of inventories higher
than net realizable value Rising market price or falling
product cost 2%
Spare parts and others
Book value of inventories higher than net realizable value
- -
(3) Notes to Ending Balance of Inventories that Includes any Borrowing Capitalization
The EOP balance of inventories does not include any capitalized interest.
(4) Finished Items Which have not been Settled at the End of Period Resulting from Construction Contract
□Applicable √Not applicable
11. Non-current Assets Due Within 1 Year
Unit: RMB
Item Ending Balance Beginning Balance
Proceeds from transfer of assets receivable (Note 1)
4,500,000,000.00 4,500,000,000.00
Trust products due within 1 year (Note 2)
161,182,224.00
Total 4,661,182,224.00 4,500,000,000.00
Note 1: Proceeds from transfer of assets receivable due within one year amount to RMB 4.5 billion, including RMB 2.6 billion due from Shanghai Baosteel Stainless Steel Co., Ltd. and RMB 1.9 billion due from Shanghai Baosteel Special Steel Co., Ltd. Please see Notes (V), 15 Note (1)
Note 2: Trust and financing products available for sale and due within 1 year totaled RMB 161 million, most of which were purchased in the reporting period by Ouyeel Commerce Co., Ltd., the subsidiary of the Company. As regards the accounts due from the related parties in the non-current assets and due within one year, please refer to Note (X), 6(6).
12. Other Current Assets
Unit: RMB
Item Ending balance Beginning balance
Pending deduct VAT on purchase 4,335,370,405.66 2,944,403,352.66
Financial management products (Note)
28,782,459,565.13 5,088,464,093.70
Total 33,117,829,970.79 8,032,867,446.36
Note: Financing products held and classified as available-for-sale financial assets by the Group are such financial instruments as high-credit bond, trust plan (beneficial interests) and instruments with float income but without principal guaranteed or active market quote, which are mainly used in monetary market. The Group listed and presented them as other current assets because they are due within 1 year.

2016 Semi-annual Report
84 / 151
13. Loans and Advances to Customers
(1) Classification of Loans and Advances to Customers
Unit: RMB
Item Ending balance Balance at the beginning of
the year
Loans 389,007,161.96 990,478,072.43
Discount 1,724,742,072.91 1,412,450,723.68
Provision for loan impairment
-107,977,482.17 -164,523,818.63
Total 2,005,771,752.70 2,238,404,977.48
(2) Provision for Loan Impairment
Unit: RMB
Item Balance at the
beginning of the year
Provision amount for the current period
Decrease for the current period
Difference from
foreign currency
translation
Ending balance
Reversed Written-
off
Provision for loan impairment
164,523,818.63 - 56,546,336.
46 - -
107,977,482.17
At the end of this reporting period and the beginning of the current year, no loans or advance payments were made to any shareholder holding shares representing 5% or more of the voting rights of the Company. For particulars of loans and advance payments made to other related parties at the end of this reporting period and the beginning of the current year, please refer to Note (X), 6(7).
14. Available-for-Sale (AFS) Financial Assets
√Applicable □Not applicable
(1) Available-for-Sale (AFS) Financial Assets
Unit: RMB
Item
Ending balance Beginning balance
Book balance Impairment
reserves Book value Book balance
Impairment reserves
Book value
Available-for-sale debt instruments:
2,006,633,621.70 50,240,011.70 1,956,393,610.00 403,945,851.70 50,240,011.70 353,705,840.00
Available-for-sale equity instruments:
10,622,348,970.72 7,404,202.27 10,614,944,768.45 10,577,723,157.92 7,404,202.27 10,570,318,955.65
Where: Measured at fair value
1,021,411,487.95 1,021,411,487.95 977,617,036.31 - 977,617,036.31
Measured at cost
9,600,937,482.77 7,404,202.27 9,593,533,280.50 9,600,106,121.61 7,404,202.27 9,592,701,919.34
Total 12,628,982,592.42 57,644,213.97 12,571,338,378.45 10,981,669,009.62 57,644,213.97 10,924,024,795.65
(2) Available-for-sale Financial Assets Measured at Fair value at the End of the Period
√Applicable □Not applicable Unit: RMB
Available-for-sale financial assets category
Available-for-sale equity instruments
Available-for-sale debt instruments
Total
Cost of equity instruments/ amortized cost of debt instruments
1,423,532,392.40 1,988,488,060.64 3,412,020,453.04
Fair value 1,021,411,487.95 1,956,393,610.00 2,977,805,097.95
Change of fair value accumulatively included in other comprehensive income
-402,120,904.45 18,145,561.06 -383,975,343.39
Provisioned impairment amount - 50,240,011.70 50,240,011.70

2016 Semi-annual Report
85 / 151
(3) Available-for-sale Financial Assets Measured at Cost at the End of the Period
√Applicable □Not applicable Unit: RMB Yuan
Invested unit
Book balance Impairment reserves Shareholding ratio in
invested unit (%)
Current cash dividend
Beginning of the period
Current increase
Current decrea
se
Ending of the period
Beginning of the period
Current
increase
Current decreas
e
Ending of the period
CISDI Engineering Co., Ltd. 9,508,999.34 - - 9,508,999.34 - - - - 6.28% Jinchuan Group Automation Engineering Co., Ltd.
1,000,000.00 - 1,000,000.00 - - - - 7.13%
Shanghai Huayi Information Technology Co., Ltd
3,000,000.00 - - 3,000,000.00 - - - - 15.00%
Henan Longyu Energy Company Limited 370,269,254.56 - - 370,269,254.56 - - - - 12.96% 103,680,755.16 Yongcheng Coal & Power (Group) Co., Ltd.
279,000,000.00 - - 279,000,000.00 - - - - 7.78%
Henan Zhenglong Coal Mining Co., Ltd. 45,569,714.27 - - 45,569,714.27 - - - - 4.91% China Technology & Economy Investment Consulting Co., Ltd.
3,000,000.00 - - 3,000,000.00 666,024.47 - - 666,024.47 5.00%
Yantai Tiezhong Baosteel Ironworking Co., Ltd.
5,600,000.00 - - 5,600,000.00 - - - - 10.00% -
China Resources (Holdings) Company Limited (Beijing)
1,618,750.00 - 1,618,750.00 - - - - 0.09% -
Anhui Huishang Company Limited 3,000,000.00 - - 3,000,000.00 - - - - 3.53% -
Hanyang Parts Co., Ltd 3,311,720.00 - - 3,311,720.00 3,311,720.00 - - 3,311,720.00 20.00% -
Baovale Mineracao S.A. 103,282,213.00 103,282,213.00 - - - - 50.00%
ShangHai LuoJing Ore Terminal Co., Ltd. 88,734,096.00 88,734,096.00 - - - - 12.00% Yangtze River Economic United Development (Group) Co., Ltd.
980,000.00 980,000.00 - - - - 0.15%
Guoqi (Beijing) Auto Lightweight Technology Research Co., Ltd.
3,000,000.00 3,000,000.00 - - - - 6.90%
Beijing Iron Ore Trading Center Corporation
5,000,000.00 5,000,000.00 - - - - 6.25%
Globalore Pte Ltd 16,011,054.60 266,668.80 16,277,723.40 3,426,457.80 - - 3,426,457.80 14.29%
Baometal S.r.L 14,319,532.64 564,692.36 14,884,225.00 - - - - 10.00%
CNPC Pipeline Co., Ltd. 8,643,900,787.20 8,643,900,787.20 - - - - 3.52%
Total 9,600,106,121.61 831,361.16 9,600,937,482.77 7,404,202.27 - - 7,404,202.27 / 103,680,755.16

2016 Semi-annual Report
86 / 151
(4) Impairment Change of Available-for-sale Financial Assets in the Reporting Period
√Applicable □Not applicable Unit: RMB
Available-for-sale financial assets category
Available-for-sale equity instruments
Available-for-sale debt instruments
Total
Provisioned beginning impairment balance
7,404,202.27 50,240,011.70 57,644,213.97
Current provision
Where: Transferred-in from other comprehensive income
Current cuts
Where: Rise of fair value after the period
/
Ending balance of provisioned impairment reserves
7,404,202.27 50,240,011.70 57,644,213.97
(5) Notes to Available-for-sale Equity Instruments Whose Fair Value Undergoes Significant Fall or Prolonged Fall But not yet Provision Impairment Reserves:
√Applicable □Not applicable Unit: RMB
Available-for-sale equity instruments
item Investment cost Ending fair value
Falling degree of fair value against cost (%)
Continuous falling period
(months)
Provisioned impairment
amount
Cause for non-provisioned
impairment
Xishan Coal Electricity Group
941,660,003.69 347,665,193.90 63 / - Note
Total 941,660,003.69 347,665,193.90 63 / - /
Note: The above available-for-sale equity instruments are 42,658,306 shares (000983) of Xishan Coal Electricity Group Co., Ltd. which the Company’s subsidiary - Shanghai Baosteel International Economic & Trading Co., Ltd. bought in Shenzhen Stock Exchange from 2010 to 2011, with investment costs of RMB 941,660,003.69 and average cost of RMB 22.10 per share. As of June 30, 2016, closing price of Xishan Coal Electricity Group was 8.15 Yuan per share, accumulatively decreasing by RMB 593,994,809.79, and final book value was RMB 347,665,193.90. Such equity instrument investment is the investment that the Group takes the strategic holding as the main purpose and doesn’t make the decision of selling out due to the temporary change, and the Group records it in the account by taking it as the available-for-sale financial assets. According to the provisions of the Accounting Standards for Business Enterprises, the Company shall take the equity investment in Xishan Coal Electricity Group as the available-for-sale financial assets for accounting, and stock price fluctuation of Xishan Coal Electricity Group shall be included in other comprehensive income. When the Group evaluates whether there is objective evidence showing that such available-for-sale financial assets have the impairment on the balance sheet date, it mainly conducts the analysis on the basic operation of the invested unit. Xishan Coal Electricity Group is a very large coal enterprise and is the leading coal enterprise of the scarce high-quality metallurgical coke. In addition to the coal business, Xishan Coal Electricity Group has also developed two industry chains – “"coal - electricity – material” and “coal - coke - chemical” based on Shanxi Coking Coal Group. The fall of its share price was mainly affected by domestic capital market downturn and sluggish coal industry. Xishan Coal Electricity Group has stable operation, operating earnings in recent three years and earnings before interest, taxes, depreciation and amortization have no significant decline, operating conditions have not deteriorated seriously, and the purpose of long-term strategic holding of share of Xishan Coal Electricity Group did not change. After taking related factors into consideration, the management personnel thought that such available-for-sale financial assets have no need for impairment reserves provision on June 30, 2016 based on the quantitative criteria (Note III, 11.3) of impairment judgment on available-for-sale financial assets.
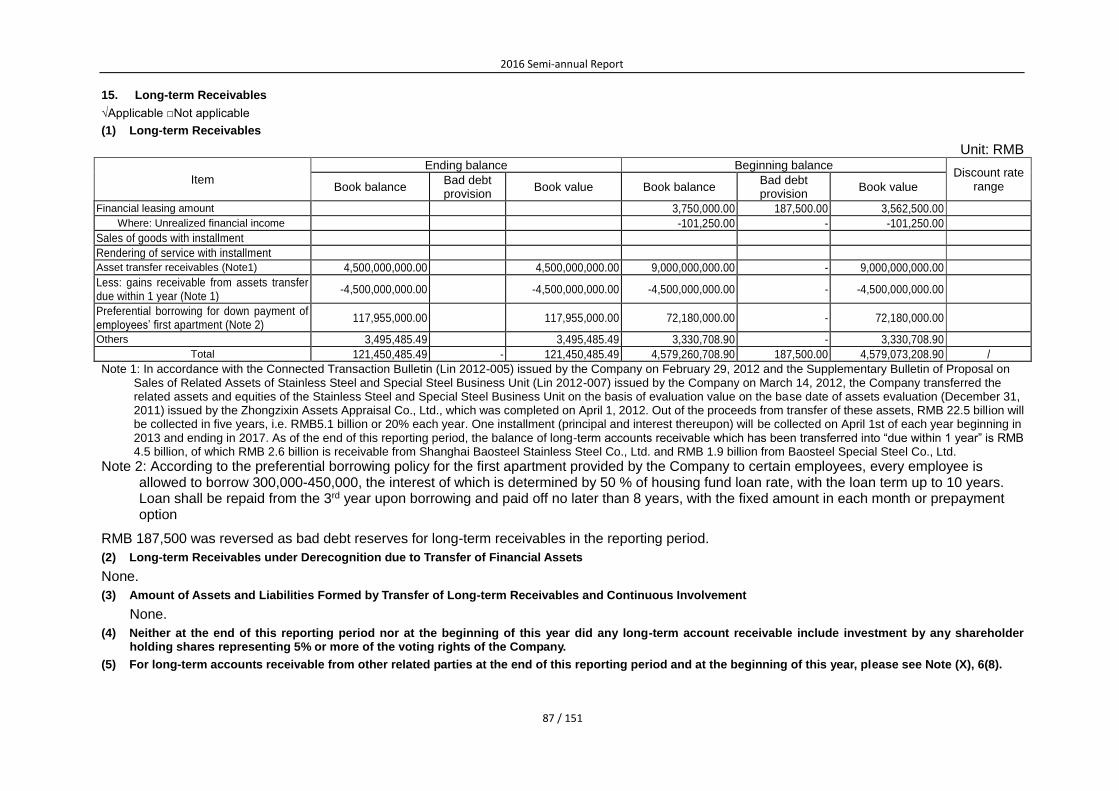
2016 Semi-annual Report
87 / 151
15. Long-term Receivables
√Applicable □Not applicable
(1) Long-term Receivables
Unit: RMB
Item
Ending balance Beginning balance Discount rate
range Book balance Bad debt provision
Book value Book balance Bad debt provision
Book value
Financial leasing amount 3,750,000.00 187,500.00 3,562,500.00
Where: Unrealized financial income -101,250.00 - -101,250.00
Sales of goods with installment
Rendering of service with installment
Asset transfer receivables (Note1) 4,500,000,000.00 4,500,000,000.00 9,000,000,000.00 - 9,000,000,000.00
Less: gains receivable from assets transfer due within 1 year (Note 1)
-4,500,000,000.00 -4,500,000,000.00 -4,500,000,000.00 - -4,500,000,000.00
Preferential borrowing for down payment of employees’ first apartment (Note 2)
117,955,000.00 117,955,000.00 72,180,000.00 - 72,180,000.00
Others 3,495,485.49 3,495,485.49 3,330,708.90 - 3,330,708.90
Total 121,450,485.49 - 121,450,485.49 4,579,260,708.90 187,500.00 4,579,073,208.90 /
Note 1: In accordance with the Connected Transaction Bulletin (Lin 2012-005) issued by the Company on February 29, 2012 and the Supplementary Bulletin of Proposal on Sales of Related Assets of Stainless Steel and Special Steel Business Unit (Lin 2012-007) issued by the Company on March 14, 2012, the Company transferred the related assets and equities of the Stainless Steel and Special Steel Business Unit on the basis of evaluation value on the base date of assets evaluation (December 31, 2011) issued by the Zhongzixin Assets Appraisal Co., Ltd., which was completed on April 1, 2012. Out of the proceeds from transfer of these assets, RMB 22.5 billion will be collected in five years, i.e. RMB5.1 billion or 20% each year. One installment (principal and interest thereupon) will be collected on April 1st of each year beginning in 2013 and ending in 2017. As of the end of this reporting period, the balance of long-term accounts receivable which has been transferred into “due within 1 year” is RMB 4.5 billion, of which RMB 2.6 billion is receivable from Shanghai Baosteel Stainless Steel Co., Ltd. and RMB 1.9 billion from Baosteel Special Steel Co., Ltd.
Note 2: According to the preferential borrowing policy for the first apartment provided by the Company to certain employees, every employee is allowed to borrow 300,000-450,000, the interest of which is determined by 50 % of housing fund loan rate, with the loan term up to 10 years. Loan shall be repaid from the 3rd year upon borrowing and paid off no later than 8 years, with the fixed amount in each month or prepayment option
RMB 187,500 was reversed as bad debt reserves for long-term receivables in the reporting period.
(2) Long-term Receivables under Derecognition due to Transfer of Financial Assets
None.
(3) Amount of Assets and Liabilities Formed by Transfer of Long-term Receivables and Continuous Involvement
None.
(4) Neither at the end of this reporting period nor at the beginning of this year did any long-term account receivable include investment by any shareholder holding shares representing 5% or more of the voting rights of the Company.
(5) For long-term accounts receivable from other related parties at the end of this reporting period and at the beginning of this year, please see Note (X), 6(8).

2016 Semi-annual Report
88 / 151
16. Long-term Equity Investment
√Applicable □Not applicable Unit: RMB
Name of investee Beginning balance
Current change
Ending balance
Ending balance of impairment reserves
Added investment
Reduced
investment
Investment gains and
losses recognized under the
Equity Method
Other comprehensiv
e income adjustment
Other equity
change
Cash dividend or profit
declared to issue
Impairment
reserves
provision
Others
I. Joint Ventures
Baosteel-NSC/Arcelor Automotive Steel Sheets Co., Ltd.
1,709,806,023.00 61,146,741.51 1,469,371.25 1,772,422,135.76
BAO-ISLAND ENTERPRISES LIMITED 571,868,624.40 2,705,529.60 12,117,950.40 586,692,104.40
Shandong Baohua Wear-resistant Steel Co., Ltd.
75,041,834.57 -4,650,767.24 70,391,067.33
Guangzhou JFE Steel Sheet Co., Ltd. 1,528,680,972.01 17,287,883.35 1,545,968,855.36 35,000,000.00
Hangzhou Baowei Auto Parts Co., Ltd. 150,409,079.04 14,831,311.98 165,240,391.02
Changsha Baosheng Steel Processing and Delivery Co., Ltd.
5,741,212.21 -1,581,893.25 4,159,318.96
Changshu Baosheng Fine Blanking Materials Co., Ltd
75,758,737.99 -529,103.16 75,229,634.83
Wuhan Baozhang Automobile Steel Parts Co., Ltd
30,028,626.34 -171,724.26 -13,951.20 29,842,950.88
Wuhan Baohan Welding Equipment Co., Ltd
3,011,680.24 47,391.64 3,059,071.88
Subtotal 4,150,346,789.80 89,085,370.17 12,117,950.40 1,469,371.25 -13,951.20 4,253,005,530.42 35,000,000.00
II. Associated enterprises
Shanghai Baosteel & Arcelor Tailor Metal Co., Ltd.
125,983,674.52 11,931,195.62 -21,356,000.00 116,558,870.14
Shanghai Firsttech Software Co., Ltd. 2,831,840.50 161,863.27 2,993,703.77
Henan Pingbao Coal Industry Co., Ltd. 411,604,835.83 15,189,249.22 426,794,085.05
Tianjin BCM Distribution Co., Ltd. 50,729,313.89 -2,057,394.13 48,671,919.76
Wuxi Baomit Steel Processing and Delivery Co., Ltd.
68,294,250.55 581,828.98 68,876,079.53
Sichuan Daxing Baohua Chemical Co., Ltd.
28,148,728.61 -3,159,080.66 -39,607.00 24,950,040.95
Baosteel Can Making (Vietnam) Co.,Ltd. 62,317,797.88 1,320,520.05 63,638,317.93
Beijing Qingke Chuangtong Information Technology Co., Ltd.
8,695,219.83 708,617.31 9,403,837.14
MIBao Metal Processing Zhengzhou Co., Ltd.
22,706,467.33 742,646.96 23,449,114.29
Guangzhou Automobile Baoshang Steel Processing Co., Ltd.
58,118,195.72 1,596,257.58 -1,247,085.73 58,467,367.57
Wuxi Baomeifeng Steel Processing Co., 27,182,613.20 -780,929.23 26,401,683.97

2016 Semi-annual Report
89 / 151
Ltd.
SFSC-Bassinet Information Technology Co., Ltd
4,994,178.57 -2,133,534.89 2,860,643.68
Guangzhou South China Gangbao Terminal Co., Ltd.
6,600,000.00 -21,525.70 6,578,474.30
Tianjin Zhongzhi Tiancheng Technology Co., Ltd.
8,863,455.09 -860,575.30 8,002,879.79
Cangcang (Shanghai) Supply Chain Management Co., Ltd.
400,000.00 400,000.00
Shanghai Extrame Information Technology Co., Ltd.
3,500,000.00 3,500,000.00
Shanghai Runyi Incubator Management Co., Ltd.
3,000,000.00 3,000,000.00
Guangdong Zhanjiang Ganglongteng Shipping Co., Ltd.
27,000,000.00 27,000,000.00
Transferred-in stock right separation regarding marketability from the original system
7,949,489.18 7,949,489.18
Subtotal 895,020,060.70 33,900,000.00 21,898,619.03 1,320,520.05 -39,607.00 -22,603,085.73 929,496,507.05
Total 5,045,366,850.50 33,900,000.00 110,983,989.20 13,438,470.45 1,429,764.25 -22,617,036.93 5,182,502,037.47 35,000,000.00
When the equity method is employed for calculation, the Group and all of its JVs as well as its affiliated companies have no significant difference in accounting policies, and there is no major limitation on the realization of the long-term investment and the repatriation of returns on investment.

2016 Semi-annual Report
90 / 151
17. Investment Property
√Applicable □Not applicable Measurement mode of investment property
(1) Investment Property Measured at Cost
√Applicable □Not applicable Unit: RMB
Item Houses and buildings Land use right Total
I. The original book value
1.Beginning balance 209,756,400.58 318,321,681.83 528,078,082.41
2. Current adds 15,933,859.14 15,933,859.14
(1) Purchase
(2) Inventory/ fixed assets/ transferred-in from construction in progress
15,933,859.14 15,933,859.14
(3) Adds from corporate merge
3. Current cuts 486,486.00 486,486.00
(1) Disposal 486,486.00 486,486.00
(2) Other transferred-out
4.Ending balance 225,203,773.72 318,321,681.83 543,525,455.55
II. Accumulative depreciation and accumulative amortization
1.Beginning balance 94,344,350.13 60,396,566.96 154,740,917.09
2. Current adds 11,925,368.00 4,124,040.27 16,049,408.27
(1) Provision or amortization 4,034,503.65 4,124,040.27 8,158,543.92
(2) Transferred-in from fixed assets
7,890,864.35 7,890,864.35
3. Current cuts 419,303.15 419,303.15
(1) Disposal 419,303.15 419,303.15
(2) Other transferred-out
4.Ending balance 105,850,414.98 64,520,607.23 170,371,022.21
III. Impairment reserves
1.Beginning balance
2. Current adds
(1) Provision
3. Current cuts
(1) Disposal
(2) Other transferred-out
4.Ending balance
IV. Book value
1. Ending book value 119,353,358.74 253,801,074.60 373,154,433.34
2. Beginning book value 115,412,050.45 257,925,114.87 373,337,165.32
(2) Investment Property Without Proper Certificate of Title
□Applicable √Not applicable

2016 Semi-annual Report
91 / 151
18. Fixed Assets
(1) Fixed Assets
Unit: RMB
Item Houses and
buildings Machinery equipment
Transportation tools
Office and other
equipment Total
I. The original book value
1.Beginning balance 58,192,962,216.19 153,426,584,898.87 18,889,378,362.09 18,039,508,531.23 248,548,434,008.38
2. Current adds 6,022,592,952.38 8,423,818,851.76 742,651,842.50 3,554,438,335.53 18,743,501,982.17
(1) Purchase 1,059,566.31 71,379,216.10 20,097,195.07 85,187,666.23 177,723,643.71
(2) Transferred-in from construction in progress
6,021,046,900.07 8,352,439,635.66 689,306,245.36 3,468,895,395.29 18,531,688,176.38
(3) Transferred-in from investment property
486,486.00 - - - 486,486.00
(4)Transferred-in from
other non-current assets - - 33,248,402.07 355,274.01 33,603,676.08
3. Current cuts 189,995,702.26 1,837,168,596.54 231,909,860.73 394,231,014.95 2,653,305,174.48
(1) Disposal or scrap 34,744,061.27 1,635,642,818.63 233,959,058.23 389,119,035.08 2,293,464,973.21
(2) Transferred to investment property
15,933,859.14 - - - 15,933,859.14
(3) Transferred to other non-current assets
169,664,437.40 225,817,633.66 108,499.97 7,247,270.90 402,837,841.93
(4) Translation difference of foreign financial statements
-30,346,655.55 -24,291,855.75 -2,157,697.47 -2,135,291.03 -58,931,499.80
4.Ending balance 64,025,559,466.31 160,013,235,154.09 19,400,120,343.86 21,199,715,851.81 264,638,630,816.07
II. Accumulative depreciation
1.Beginning balance 28,281,217,809.17 99,082,721,828.18 14,958,916,382.10 14,536,957,014.85 156,859,813,034.30
2. Current adds 1,246,958,346.72 3,453,566,557.10 465,623,603.03 579,097,280.77 5,745,245,787.62
(1) Provision 1,246,539,043.57 3,453,566,557.10 456,095,796.41 578,878,025.97 5,735,079,423.05
(2) Transferred-in from investment property
419,303.15 - - - 419,303.15
(3) Transferred-in from other non-current assets
- - 9,527,806.62 219,254.80 9,747,061.42
3. Current cuts 85,912,723.20 1,472,006,892.99 217,271,884.60 376,818,978.51 2,152,010,479.30
(1) Disposal or scrap 17,083,437.19 1,353,513,645.52 218,111,860.79 371,964,571.43 1,960,673,514.93
(2) Transferred to investment property
7,890,864.35 - - - 7,890,864.35
(3) Transferred to other non-current assets
66,883,053.93 121,080,836.48 104,159.97 6,375,468.82 194,443,519.20
(4) Translation difference of foreign financial statements
-5,944,632.27 -2,587,589.01 -944,136.16 -1,521,061.74 -10,997,419.18
4.Ending balance 29,442,263,432.69 101,064,281,492.29 15,207,268,100.53 14,739,235,317.11 160,453,048,342.62
III. Impairment reserves
1.Beginning balance 86,912,759.34 520,719,316.70 3,311,755.79 10,116,826.70 621,060,658.53
2. Current adds 102,717,303.05 94,279,770.74 22,858,260.62 938,337.45 220,793,671.86
(1) Provision 102,717,303.05 94,279,770.74 - 816,529.19 197,813,602.98
(2) Transferred-in form other non-current assets
- - 22,858,260.62 121,808.26 22,980,068.88
3. Current cuts 102,717,303.05 96,638,598.24 - 928,159.54 200,284,060.83
(1) Disposal or scrap - 2,358,827.50 - 111,630.35 2,470,457.85
(2) Transferred to other 102,717,303.05 94,279,770.74 816,529.19 197,813,602.98

2016 Semi-annual Report
92 / 151
non-current assets
4.Ending balance 86,912,759.34 518,360,489.20 26,170,016.41 10,127,004.61 641,570,269.56
IV. Book value
1. Ending book value 34,496,383,274.28 58,430,593,172.60 4,166,682,226.92 6,450,353,530.09 103,544,012,203.89
2. Beginning book value
29,824,831,647.68 53,823,143,753.99 3,927,150,224.20 3,492,434,689.68 91,067,560,315.55
(2) Temporarily Idle Fixed Assets
□Applicable√Not applicable
(3) Fixed Assets Acquired Through Finance Leasing
□Applicable√Not applicable
(4) Leased Fixed Assets through Operating Leasing
√Applicable □Not applicable Unit: RMB
Item Ending book value Beginning book value
Houses and buildings 529,462,210.50 416,723,646.04
Machinery equipment 347,843,216.38 385,081,696.38
Transportation tools 112,765,785.39 127,315,264.45
Office and other equipment 26,403,025.87 32,516,114.08
Total 1,016,474,238.14 961,636,720.95
(5) Fixed Assets without Proper Certificate of Title
√Applicable □Not applicable Unit: RMB Yuan
Item Book value Reason
Property ownership certificates of houses and buildings
2,917,279,631.87 Note
Note: The Group has been attempting to acquire property ownership certificates of houses and buildings as of June 30, 2016, with the book value of RMB 2,917,279,631.87 (December 31, 2015: RMB 2,868,428,719.17).
Other notes: On June 30, 2016, the Group obtained RMB 25,578,745.19 of long-term loan and RMB 325,988,583.76 of short-term loan by pledging fixed assets with net value of RMB 657,807,385.03 (December 31, 2015: RMB 72,864,992.38) and land use right with net book value of RMB 71,071,569.11 (December 31, 2015: RMB 67,699,345.04), with RMB 351,567,328.95 of total loans (December 31, 2015: RMB 66,654,085.10).

2016 Semi-annual Report
93 / 151
19. Construction in Progress
√Applicable □Not applicable
(1) Construction in Progress
Unit: RMB
Item Ending balance Beginning balance
Book balance Depreciation reserve Book value Book balance Depreciation reserve Book value
Technical innovation and infrastructure
construction projects 24,093,803,621.74 810,291,641.28 23,283,511,980.46 34,438,681,114.96 810,291,641.28 33,628,389,473.68
Total 24,093,803,621.74 810,291,641.28 23,283,511,980.46 34,438,681,114.96 810,291,641.28 33,628,389,473.68
(2) Significant Changes of Construction in Progress
√Applicable □Not applicable Unit: RMB
Item Budget Beginning balance
Increase for the current
period
Transferred-in fixed assets
Other current cuts
Ending balance
Proportion of project
investment in budget
Construction progress
Accumulated amount of
interest capitalization
Including: capitalized amount of interest for the current
period
Capitalization rate of
interest for the current
period
Source of
capital
Technical innovation and infrastructure projects
43,653,249,800.00 34,438,681,114.96 8,468,181,446.36 18,531,688,176.38 281,370,763.20 24,093,803,621.74 55 733,081,452.63 310,928,437.83 3.915-4.725 Self-raised
or borrowing
Total 43,653,249,800.00 34,438,681,114.96 8,468,181,446.36 18,531,688,176.38 281,370,763.20 24,093,803,621.74 / / 733,081,452.63 310,928,437.83 / /
(3) Current Depreciation Reserves Provision for Construction in Progress:
□Applicable √Not applicable

2016 Semi-annual Report
94 / 151
20. Engineering Materials
√Applicable □Not applicable Unit: RMB
Item Ending balance Beginning balance
Special materials 11,597,161.47 5,863,958.76
Special equipment 15,922,861.22 43,945,769.33
Others 11,639,086.79 5,623,852.38
Total 39,159,109.48 55,433,580.47
21. Intangible Assets
(1) Intangible Assets
Unit: RMB
Item Land use right Computer software
Others Total
I. The original book value
1.Beginning balance 10,052,379,524.84 568,733,420.73 271,415,357.72 10,892,528,303.29
2. Current adds 2,580,253,424.28 46,757,494.15 4,950.00 2,627,015,868.43
(1) Purchase 28,085,796.20 4,950.00 28,090,746.20
(2) Transferred-in from construction-in-progress
16,429,672.06 18,598,169.20 35,027,841.26
(3) Transferred-in from other non-current assets
2,561,017,958.00 2,561,017,958.00
(4) Transferred-in from construction in progress
2,805,794.22 73,528.75 2,879,322.97
3.Current cuts
4.Ending balance 12,632,632,949.12 615,490,914.88 271,420,307.72 13,519,544,171.72
II.Accumulative amortization
1.Beginning balance 1,322,402,167.68 238,024,076.08 67,027,419.15 1,627,453,662.91
2.Current adds 120,588,857.65 60,560,132.33 2,647,174.89 183,796,164.87
(1)Provision 120,584,225.54 60,513,561.17 2,647,174.89 183,744,961.60
(2) Translation difference of foreign financial statements
4,632.11 46,571.16 51,203.27
3.Current cuts
4.Ending balance 1,442,991,025.33 298,584,208.41 69,674,594.04 1,811,249,827.78
III.Impairment Reserves
1.Beginning balance 13,610,153.50 13,610,153.50
2.Increased amount in the period
3.Decreased amount in the period
4.Ending balance 13,610,153.50 13,610,153.50
IV. Book value
1.Ending book value 11,189,641,923.79 316,906,706.47 188,135,560.18 11,694,684,190.44
2. Beginning book value 8,729,977,357.16 330,709,344.65 190,777,785.07 9,251,464,486.88
Note: More land use rights were acquired, mainly because Zhanjiang Steel, subordinate to the Group, has obtained in the reporting period the corresponding land use rights according to Pre-deposit Agreement for Land Use and Supplementary to Pre-deposit Agreement for Land Use entered into between Zhanjiang Steel and People’s Government of Zhanjiang. Therefore, the accounts originally included into other non-current assets have been transferred into intangible assets-land use right for accounting. Please see Note (V) 24.
(2) Use Right of Land without Proper Certificate of Title
□Applicable √Not applicable Other notes: On June 30, 2016, the Group obtained RMB 25,578,745.19 of long-term loan and RMB 325,988,583.76 of short-term loan by pledging fixed assets with net value of RMB 657,807,385.03 (December 31, 2015: RMB 72,864,992.38) and land use right with net book value of RMB 71,071,569.11 (December 31, 2015: RMB 67,699,345.04), with RMB 351,567,328.95 of total loans (December 31, 2015: RMB 66,654,085.10).
22. Long-term Unamortized Expenses
√Applicable □Not applicable Unit: RMB

2016 Semi-annual Report
95 / 151
Item Beginning balance
Amount added in the period
Amortization amount in the
period
Other reduced amount
Ending balance
Decoration expenses 150,769,291.99 55,242,055.09 12,843,971.11 - 193,167,375.97
Rental expenses 8,676,914.56 298,119.66 762,867.53 - 8,212,166.69
Relocation payment for environmental protection of coke oven of Meishan Steel (Note)
805,396,557.48 12,683,410.38 - 792,713,147.10
Expenditure on HV power supply of Huangshi Cold Rolling Phase II
1,330,708.50 295,713.00 - 1,034,995.50
Others 91,003,915.84 109,643.16 16,153,908.07 - 74,959,650.93
Total 1,057,177,388.37 55,649,817.91 42,739,870.09 - 1,070,087,336.19
Note: In accordance with “Agreement on relocating residents in health protection area of Shanghai Meishan Iron & Steel Co., Ltd. in the 11th 5-year period” (hereinafter referred to as the “Agreement”) jointly signed by and among Shanghai Meishan Iron & Steel Co., Ltd. (hereinafter referred to as the “Meishan Steel”), Nanjing Yuhuatai Banqiao Sub-district Office and Nanjing Yuhua Administration Committee of ETDZ on October 16, 2012, the relocation compensation shall be made for the residential areas at a protection distance of 1km from the coke oven construction project of the Meishan Steel. Therefore, Meishan Steel shall bear the relocation expenses of RMB 880,000,000.00, including the expenses of RMB 750,000,000.00 which must be paid to the Nanjing Yuhuatai Banqiao Sub-district Office, and the expenses of RMB 130,000,000.00 which must be paid to the Nanjing Yuhua Administration Committee of ETDZ. Pursuant to this Agreement, Meishan Steel paid RMB 120,000,000.00 in 2012, RMB 510,000,000.00 in 2013 and RMB 110,000,000.00 in 2014. RMB 70,000,000.00 has been paid in 2015 and RMB 70,000,000.00 remains outstanding which shall be included in non-current liabilities due within 1year. The aforesaid relocation compensation borne by Meishan Steel shall be amortized according to the remaining service life of the main assets. Please see Notes (V) 36(3)note.
23. Deferred Income Tax Assets/Deferred Income Tax Liabilities
(1) Deferred Income Tax Assets Which Have Not Been Offset
√Applicable □Not applicable Unit: RMB
Item Ending balance Beginning balance
Deductible temporary difference
Deferred income tax assets
Deductible temporary difference
Deferred income tax assets
Depreciation reserves of assets
4,329,055,645.30 1,060,709,038.29 4,049,428,220.68 1,013,353,762.28
Unrealized profits of internal purchase and sale
599,469,156.87 149,867,289.27 48,827,028.32 12,206,757.08
Deductible losses 61,663,786.84 14,212,127.21 50,621,260.76 12,655,315.19
Residual rate difference of fixed assets
214,713.24 53,678.31 214,713.24 53,678.31
Dismissal welfare 413,955,893.44 103,488,973.36 490,283,167.08 122,570,791.77
Losses on variation in fair values
478,116,585.02 119,529,146.26 501,245,019.14 125,311,254.79
Others 935,636,775.05 232,976,424.82 937,187,688.55 234,804,423.19
Total 6,818,112,555.76 1,680,836,677.52 6,077,807,097.77 1,520,955,982.61

2016 Semi-annual Report
96 / 151
(2) Deferred Income Tax Liabilities That Have Not Been Offset
√Applicable □Not applicable Unit: RMB
Item
Ending balance Beginning balance
Taxable temporary differences
Deferred income tax liabilities
Taxable temporary differences
Deferred income tax liabilities
Added value of assets in the merge of enterprises under different controls
Increased tax of investment income
2,656,821,717.34 475,646,200.35 2,484,949,935.95 442,584,276.06
Fair value change in available-for-sale financial assets
38,893,064.32 9,723,266.08 37,807,806.00 9,451,951.50
Others 10,326,666.42 2,619,166.37 10,514,696.00 2,665,395.63
Total 2,706,041,448.08 487,988,632.80 2,533,272,437.95 454,701,623.19
(3) Deferred Income Tax Assets and Liabilities Listed by Net Amount after Offset:
□Applicable √Not applicable
(4) Unconfirmed Deferred Income Tax Assets Report
√Applicable □Not applicable Unit: RMB
Item Ending balance Beginning balance
Deductible temporary difference
Asset impairment reserves 1,640,715,290.20 1,625,271,620.29
Deductible loss 10,716,055,673.89 9,883,597,331.62
Others 2,560,893.97 8,468,952.44
Total 12,359,331,858.06 11,517,337,904.35
(5) Deductible Loss without Deferred Income Tax Assets Recognized will be Due in:
√Applicable □Not applicable Unit: RMB
Year Ending balance Beginning balance Note
2016 723,645,331.03 784,374,042.91
2017 3,196,360,047.92 3,196,360,047.92
2018 1,952,708,976.90 1,952,719,366.97
2019 1,085,489,351.97 1,085,489,351.97
2020 2,863,214,371.18 2,864,654,521.85
2021 894,637,594.89 -
Total 10,716,055,673.89 9,883,597,331.62 /
24. Other Non-current Assets
Unit: RMB
Item Ending balance Beginning balance
Borrowings due from Bao-Island 117,905,780.14 117,905,780.14
Luojing fixed assets to be disposed (Note)
205,847,656.54
Land transfer fee prepaid for Zhanjiang Steel
2,759,830,784.03
Prepaid engineering equipment cost
484,932,256.56 914,569,629.24
Amount for trust and financing products
935,203,263.00 720,039,507.00

2016 Semi-annual Report
97 / 151
Others 3,901,737.25 1,629,299.59
Total 1,747,790,693.49 4,513,975,000.00
Note: The Company has stopped its production in Luojing in 2012 and relevant assets were about to be disposed and recycled. The Company transferred in 2013 Luojing assets originally calculated in other non-current assets into construction in progress for accounting and planned to reuse these assets in the renovation project of fixed assets to generate profits. Remaining Luojing assets were discussed in the reporting period and scheduled to be fully disposed in the future. Therefore, assets which were originally included in the construction in progress (Original book value: RMB 1,988,108,441.46; impairment reserves balance: RMB 1,792,841,504.67; Book value: RMB 195,266,936.79) and fixed assets (Original book value: RMB 208,394,322.73; impairment reserves balance: RMB 197,813,602.98; Book value: RMB 10,580,719.75) have been transferred into other non-current assets for accounting.
25. Short-Term Borrowings
√Applicable □Not applicable
(1) Short-term Borrowing Category
On the balance sheet date, in the short-term borrowing of the Group, the annual interest rate of the RMB borrowings ranges from 3.30% to 5.33% (2015: 3.30% to 5.89%); that of USD borrowings ranges from LIBOR+0.4% (1 month) to LIBOR+2.45% (3 months) (2015: LIBOR+0.6% for 1 month to LIBOR+2.8% for 3 months); that of EUR borrowings ranges from 0.25% to 1.25% (2015: 0.95% to 3.49%).
Unit: RMB
Item Ending balance Beginning balance
Pledged borrowings - 500,000,000.00
Mortgage borrowings 325,988,583.76 350,265,683.94
Secured borrowings
Credit borrowings 33,284,265,597.73 26,260,766,250.76
Total 33,610,254,181.49 27,111,031,934.70
Note1: On June 30, 2016, in the pledged borrowings, the Group obtained borrowing of RMB through factoring accounts receivable (Dec.31, 2015: RMB 500,000,000.00).
Note 2: Please see note (V) 18(5) and note (V) 21 for details.
(2) Bank Loan Credit Lines
As of June 30, 2016, the total amount of bank loan credit lines unused by the Group was about RMB 89.461 billion (December 31, 2015: 85.908 billion). In the opinion of the management of the Group, considering the aforesaid bank loan credit lines and the cash flows from operating activities, the Group will have sufficient funds to pay off various current liabilities which will become due within the next year.
26. Customer Deposits and Deposits from Banks and Other Financial Institutions
Unit: RMB
Item Ending balance Balance at the beginning of the
year
Current deposits 1,297,321,371.76 1,296,771,357.09
Fixed deposits 5,352,434,585.73 8,713,208,778.73
Total 6,649,755,957.49 10,009,980,135.82
For particulars about the deposits received by the end of this reporting period from shareholders each holding shares representing 5% or more of the voting rights of the Company and from other related parties, please refer to Note (X), 6(9).
27. Borrowing funds
Unit: RMB
Item Ending balance Balance at the beginning of the
year
Borrowing funds from domestic banks 198,000,000.00 198,000,000.00
28. Notes Payable
√Applicable □Not applicable Unit: RMB
Category Ending balance Beginning balance
Trade acceptance 4,199,918,496.76 3,339,883,539.09
Bank acceptance 662,757,686.93 1,094,008,830.86

2016 Semi-annual Report
98 / 151
Total 4,862,676,183.69 4,433,892,369.95
Notes payable which is due and remains outstanding at the end of the period is 0 Yuan. Above notes payable will be due in 2016.
Neither at the end of this reporting period nor at the beginning of this year did the balance of notes payable include any notes payable to shareholders each holding shares representing 5% or more of the voting rights of the Company. For notes payable to related parties and included in the balance of notes payable, please see Note (X), 6(10).
29. Accounts Payable
(1) Accounts Payable Statement
√Applicable □Not applicable Unit: RMB
Item Ending balance Beginning balance
Accounts payable for equipment procurement
3,076,213,081.46 5,282,089,642.19
Accounts payable for procurement of raw materials
20,722,233,569.29 16,103,815,633.32
Total 23,798,446,650.75 21,385,905,275.51
As of the end of the period and the beginning of the year, please see note (X) and 6 (11) for shareholder entities or associated parties who hold more than 5% (including 5%) shares of the Company with voting rights in accounts payable.
30. Advance Receipts
(1) Advance Receipts Statement
√Applicable □Not applicable Unit: RMB
Item Ending balance Beginning balance
Advance receipts 14,243,355,002.77 12,467,881,559.99
Total 14,243,355,002.77 12,467,881,559.99
(2) Significant Advance Receipts with Account Age Over 1 Year
□Applicable √Not applicable
(3) At the end of the reporting period and the beginning of the year, there was no balance of advance receipts from shareholders holding more than 5% (including) of voting shares.
(4) For related parties of advance receipts of related parties at the end of the reporting period and the beginning of the year, please see Note (X), 6(12).
31. Employee Benefits Payable
(1) Employee Benefits Payable Statement:
√Applicable □Not applicable Unit: RMB
Item Beginning balance
Current adds Current cuts Ending balance
I. Short-term benefits 1,499,672,917.3
8 4,214,880,533.1
0 3,669,196,293.1
5 2,045,357,157.33
II. Benefits post resignation-defined contribution plan
1,635,753.48 609,382,535.26 609,475,257.83 1,543,030.91
III. Dismissal welfare 170,444,790.56 28,686,181.48 111,249,306.26 87,881,665.78
IV. Other benefits due within in 1 year
Total 1,671,753,461.4
2 4,852,949,249.8
4 4,389,920,857.2
4 2,134,781,854.02

2016 Semi-annual Report
99 / 151
(2) Short-term Benefits Statement
√Applicable □Not applicable Unit: RMB
Item Beginning balance
Current adds Current cuts Ending balance
I. Wages, bonuses, allowances and subsidies
1,143,192,881.44
3,249,565,134.23
2,790,412,983.13
1,602,345,032.54
II. Employees’ welfare expenses - 154,601,337.25 154,601,337.25 -
III. Social insurance charges 1,752,198.55 279,599,714.60 280,356,858.57 995,054.58
Including: Medical insurance 661,028.23 242,119,608.04 242,097,713.81 682,922.46
Work-related injury insurance
39,400.32 10,510,987.12 10,472,069.51 78,317.93
Maternity insurance 51,079.03 22,669,689.36 22,657,950.83 62,817.56
Employment fee for the injured
15,270.14 120,378.14 128,265.54 7,382.74
Others 985,420.83 4,179,051.94 5,000,858.88 163,613.89
IV. Housing accumulation funds 1,713,263.24 305,268,850.95 306,780,644.25 201,469.94
V. Labor union expenditures and personnel education funds
188,686,109.65 100,673,173.38 63,131,045.48 226,228,237.55
VI. Short-term paid absence - 56,733,921.28 56,733,921.28 -
VII. Short-term profit share plan
VIII. Others 164,328,464.50 68,438,401.41 17,179,503.19 215,587,362.72
Total 1,499,672,917.3
8 4,214,880,533.1
0 3,669,196,293.
15 2,045,357,157.33
(3) Defined Contribution Plan Statement
√Applicable □Not applicable Unit: RMB
Item Beginning balance
Current adds Current cuts Ending balance
1.Basic pension insurance
1,139,790.50 482,285,923.32 482,264,902.65 1,160,811.17
2.Unemployment insurance
97,170.59 27,370,460.12 27,381,987.81 85,642.90
3.Enterprise annuity 398,792.39 99,726,151.82 99,828,367.37 296,576.84
Total 1,635,753.48 609,382,535.26 609,475,257.83 1,543,030.91
32. Taxes Payable
Unit: RMB
Item Ending balance Beginning balance
VAT 660,653,096.04 -557,122,801.25
Business tax -1,272,357.31 14,967,514.50
Enterprise income tax 2,418,257,371.13 1,824,943,777.30
Individual income tax 38,941,786.53 94,921,564.31
Urban maintenance and construction tax
33,887,066.51 24,878,561.18
Property tax 35,676,517.78 28,089,124.91
Others 454,014,161.12 267,637,334.02
Total 3,640,157,641.80 1,698,315,074.97
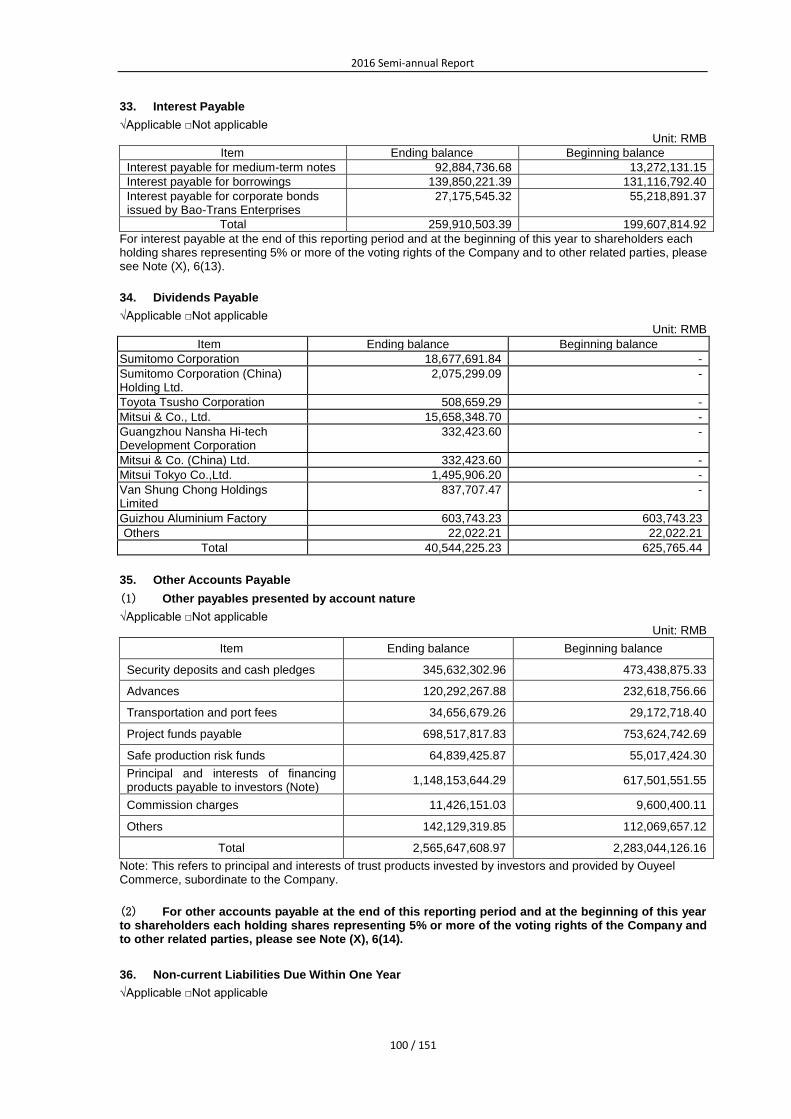
2016 Semi-annual Report
100 / 151
33. Interest Payable
√Applicable □Not applicable Unit: RMB
Item Ending balance Beginning balance
Interest payable for medium-term notes 92,884,736.68 13,272,131.15
Interest payable for borrowings 139,850,221.39 131,116,792.40
Interest payable for corporate bonds issued by Bao-Trans Enterprises
27,175,545.32 55,218,891.37
Total 259,910,503.39 199,607,814.92
For interest payable at the end of this reporting period and at the beginning of this year to shareholders each holding shares representing 5% or more of the voting rights of the Company and to other related parties, please see Note (X), 6(13).
34. Dividends Payable
√Applicable □Not applicable Unit: RMB
Item Ending balance Beginning balance
Sumitomo Corporation 18,677,691.84 -
Sumitomo Corporation (China) Holding Ltd.
2,075,299.09 -
Toyota Tsusho Corporation 508,659.29 -
Mitsui & Co., Ltd. 15,658,348.70 -
Guangzhou Nansha Hi-tech Development Corporation
332,423.60 -
Mitsui & Co. (China) Ltd. 332,423.60 -
Mitsui Tokyo Co.,Ltd. 1,495,906.20 -
Van Shung Chong Holdings Limited
837,707.47 -
Guizhou Aluminium Factory 603,743.23 603,743.23
Others 22,022.21 22,022.21
Total 40,544,225.23 625,765.44
35. Other Accounts Payable
(1) Other payables presented by account nature
√Applicable □Not applicable Unit: RMB
Item Ending balance Beginning balance
Security deposits and cash pledges 345,632,302.96 473,438,875.33
Advances 120,292,267.88 232,618,756.66
Transportation and port fees 34,656,679.26 29,172,718.40
Project funds payable 698,517,817.83 753,624,742.69
Safe production risk funds 64,839,425.87 55,017,424.30
Principal and interests of financing products payable to investors (Note)
1,148,153,644.29 617,501,551.55
Commission charges 11,426,151.03 9,600,400.11
Others 142,129,319.85 112,069,657.12
Total 2,565,647,608.97 2,283,044,126.16
Note: This refers to principal and interests of trust products invested by investors and provided by Ouyeel Commerce, subordinate to the Company.
(2) For other accounts payable at the end of this reporting period and at the beginning of this year to shareholders each holding shares representing 5% or more of the voting rights of the Company and to other related parties, please see Note (X), 6(14).
36. Non-current Liabilities Due Within One Year
√Applicable □Not applicable

2016 Semi-annual Report
101 / 151
(1) Details about the Non-current Liabilities Due Within One Year are Listed as Follows:
Unit: RMB
Item Ending balance Beginning balance
Long-term borrowings due within 1 year
43,908,628.83 138,114,896.18
Long-term accounts payable due within 1 year
70,000,000.00 70,000,000.00
Bonds payable due within 1 year -
Total 113,908,628.83 208,114,896.18
(2) Long-term Borrowings Due Within 1 Year
On June 30, 2016, the Group’s long-term loan amount due within one year is RMB 43,908,628.83 (December 31, 2015: RMB 138,114,896.18). For details on mortgage loan of long-term loan please see note (V) 18, (5).
(3) Long-term Accounts Payable Due Within One Year
Unit: RMB
Item Ending balance Balance at the beginning of the
year
Compensation funds payable for relocation (Note)
70,000,000.00 70,000,000.00
Total 70,000,000.00 70,000,000.00
Note: Please see Note (V), Note 22.

2016 Semi-annual Report
102 / 151
37. Other Current Liabilities
Unit: RMB
Item Ending balance Beginning balance
Short-term bonds payable 20,328,179,519.43 10,057,344,262.30
Others 5,994,816.89
Total 20,334,174,336.32 10,057,344,262.30
Change in short-term bonds payable √Applicable □Not applicable
Unit: RMB
Name Par value Issuing date Term Issue value Beginning balance
Issuance in the period
Provisioned interests per
par value
Amortization of premium
and discount
Repayment in the period
Ending balance
Bonds payable- short- term financing bond
10,000,000,000.00 October 26, 2015 1 year 10,000,000,000.00 10,057,344,262.30 158,131,147.54 10,215,475,409.84
Bonds payable- short-SCP
5,000,000,000.00 January 20, 2016 270 days 5,000,000,000.00 5,000,000,000.00 63,958,904.11 5,063,958,904.11
Bonds payable- short-SCP
5,000,000,000.00 February 22,2016 270days 5,000,000,000.00 5,000,000,000.00 48,745,205.48 5,048,745,205.48
Total / / / 20,000,000,000.00 10,057,344,262.30 10,000,000,000.00 270,835,257.13 20,328,179,519.43
Note: According to the Proposal on Carrying out Direct Financing in Domestic and Overseas Markets reviewed and approved by the First Extraordinary General Meeting of Shareholders held on January 26, 2015, the Company was allowed to register with National Association of Financial Market Institutional Investors and issue short-term financing bonds, the total amount of which shall not exceed RMB 10 billion (including RMB 10 billion). The Company issued short-term financing bonds Phase I on October 26, 2015, with the amount of RMB 10 billion, the term of 366 days, unit par value of RMB 100 and annual interest rate of 3.18%. The principal shall be return and interests paid when due.
According to the Proposal on Carrying out Direct Financing in Domestic and Overseas Markets reviewed and approved by the First Extraordinary General Meeting of Shareholders held on January 26, 2015, the Company was allowed to register with National Association of Financial Market Institutional Investors and issue SCP, the total amount of which shall not exceed RMB 10 billion (including RMB 10 billion). The Company issued SCP Phase I on January 20, 2016, with the amount of RMB 5 billion, the term of 270 days, unit par value of RMB 100 and annual interest rate of 2.9%. The Company issued SCP Phase II on February 22, 2016, with the amount of RMB 5 billion, the term of 270 days, unit par value of RMB 100 and annual interest rate of 2.78%.
38. Long-term Borrowings
√Applicable □Not applicable
(1) Classification of Long-term Borrowings
Item Ending balance Beginning balance

2016 Semi-annual Report
103 / 151
Pledged borrowing
Credit borrowings 11,654,342,450.00 9,088,269,188.03
Mortgaged borrowings 25,578,745.19 21,995,157.86
Guaranteed borrowing 829,391.13 762,038.79
Total 11,680,750,586.32 9,111,026,384.68
Note: For details of mortgage loan please see note (V) 18(3) and note (V) 21. Other notes, including interest rate range: Among the above loan, annual interest rate of USD loan ranges from LIBOR+0.45% for 1 month to LIBOR+2.55% for 3 months; JPY is 1%; KRW loan is 3.05%; and RMB loan is from 4.18% to 5.39%.
(2) Long-term Borrowings with Its Amount among Top 5
Long-term borrowings with the amount among Top 5 across the Group were RMB 3,670,000,000 equivalent on June 30, 2016 (December 31, 2015: RMB 2,367,500,000.00).
39. Bonds Payable
√Applicable □Not applicable
(1) Bonds Payable
Unit: RMB
Item Ending balance Beginning balance
Medium-term note (Note1, 2) 7,000,000,000.00 2,000,000,000.00
Bao-Trans Corporate Bond (Note 3, 4) 6,964,217,441.01 6,747,373,959.29
Total 13,964,217,441.01 8,747,373,959.29
(2) Bond Payable Change: (Excluding Preferred Stock, Perpetual Liabilities and Other Financial Instruments Classified as Financial Liabilities)
√Applicable □Not applicable Unit: RMB
Bond name Nominal value Issue date Term Total amount Beginning balance Current
issuance Interest provision per nominal value
Amortization of premiums and
discounts
Current payments
Ending balance
Bao-Trans Bonds (Note1)
USD 500,000,000.00 December 5, 2013 5 years USD 500,000,000.00 3,218,167,625.69 62,192,698.56 72,908,450.78 62,192,698.56 3,291,076,076.47
Bao-Trans Bonds (Note2)
EUR 500,000,000.00 February 22, 2015 3 years EUR 500,000,000.00 3,529,206,333.60 29,479,796.40 172,841,569.92 58,386,335.38 3,673,141,364.54
Total / / / 6,747,373,959.29 91,672,494.96 245,750,020.70 120,579,033.94 6,964,217,441.01

2016 Semi-annual Report
104 / 151
Note 1: In December 2013, Bao-Trans Co., Ltd ("Bao-Trans"), a subsidiary of the Company was approved by the 2012 general shareholders' meeting held on April 26, 2013 to issue bonds denominated in US dollar in Hong Kong with the amount of USD 0.5 billion and duration of 5 years in accordance with the resolution of the shareholders' meeting of Developing Direct Financing. Bao-Trans issued USD 500 million of bonds with issuing price 99.199% of par value and fixed interest rate 3.75% per annum on December 5, 2013. Interest will be paid semi-annually on June 12 and December 12 respectively. The bond will be due on 12 December, 2018.
Note 2: According to the Proposal on Carrying out Direct Financing in Domestic and Overseas Markets reviewed and approved by the First Extraordinary General Meeting of Shareholders held on January 26, 2015, the Group’s subsidiary Bao-Trans was allowed to issue the euro bonds which do not exceeds 1 billion euros (including 1 billion euros) overseas by several times. Bao-Trans issued the euro bonds according to 99.713% of the principal on February 23, 2015, with issuing amount of 500 million euros, interest calculation method of fixed interest rate for interest payment, and nominal interest rate at 1.625%. The method of repaying principal and interest was adopted for paying the interest on February 23 every year and paying off the principle upon the expiration. The bonds will expire on February 23, 2018.
Unit: RMB
Name Par value Issuance date Term Total amount Balance at the
beginning of the year
Current issuance
Interest provision per nominal
value
Current payments
Interests payable at the end of the period
Ending balance
Medium note (15 Baosteel MMT001)
(Note1) 2,000,000,000.00 October 26, 2015 3 years 2,000,000,000.00 2,000,000,000.00 36,598,907.10 49,871,038.25 2,000,000,000.00
Medium note (16 Baosteel MMT001) (Note 2)
5,000,000,000.00 March 22,2016 3 years 5,000,000,000.00 5,000,000,000.00 43,013,698.63 43,013,698.63 5,000,000,000.00
Total / / / 7,000,000,000.00 2,000,000,000.00 5,000,000,000.00 79,612,605.73 92,884,736.88 7,000,000,000.00
Note 1: Baosteel convened the 2015 First Extraordinary General Meeting of Shareholders on January 26, 2015 which reviewed and approved the Proposal on Carrying out Direct Financing in Domestic and Overseas Markets, the Company was allowed to register with National Association of Financial Market Institutional Investors and apply to issue medium term note, the total amount of which shall not exceed RMB 20 billion (including RMB 20 billion). The Company issued medium term note at par in the reporting period, with the amount of RMB 2 billion, nominal interest rate of 3.68% and the term of 3 years. The principal shall be returned as a lump sum and interests paid annually, with the value date on
Baosteel convened the 2015 First Extraordinary General Meeting of Shareholders on January 6, 2015 which reviewed and approved the Proposal on Carrying out Direct Financing in Domestic and Overseas Markets, the Company was allowed to register with National Association of Financial Market Institutional Investors and apply to issue medium term note, the total amount of which shall not exceed RMB 20 billion (including RMB 20 billion). The Company issued medium term note at par in the reporting period, with the amount of RMB 5 billion, nominal interest rate of 3.14% and the term of 3 years. The principal shall be returned as a lump sum and interests paid annually, with the value date on March 22, 2016 and the redemption date on March 22, 2019.

2016 Semi-annual Report
105 / 151
40. Long-term Payables
√Applicable □Not applicable
(1) Long-term payables listed according to the nature of money:
Unit: RMB
Item Beginning balance Ending balance
Relocation compensation payable for environmental protection project of Meishan Steel coke oven
70,000,000.00 70,000,000.00
Less: Long-term payable due within one year
70,000,000.00 70,000,000.00
Repurchase obligations under stock incentive plan (note)
82,585,917.00 81,458,444.00
Total 82,585,917.00 81,458,444.00
Note: On June 30, 2016, amount of liabilities recognized by the repurchase obligation under restricted stock incentive plan of the Company was RMB 81,458,444.00 Yuan. For details please see the note (XI),1.
41. Long-term Employee Benefits Payable
√Applicable □Not applicable
(1) Statement of Long-term Employee Benefits Payable
√Applicable □Not applicable Unit: RMB
Item Ending balance Beginning balance
I. Benefits after resignation-net liabilities of defined benefit plans
II. Dismissal benefits 328,635,121.63 328,307,328.96
III. Other long-term benefits
Total 328,635,121.63 328,307,328.96
42. Special Payables
√Applicable □Not applicable Unit: RMB
Item Beginning balance Current adds Current cuts Ending balance Cause
Government grants
292,916,697.81 - 34,346,697.81 258,570,000.00
Total 292,916,697.81 - 34,346,697.81 258,570,000.00 /
43. Deferred Income
√Applicable □Not applicable Unit: RMB
Item Beginning balance Current adds Current cuts Ending balance Cause
Government grants
1,092,839,458.77 64,101,063.36 79,047,873.99 1,077,892,648.14
Total 1,092,839,458.77 64,101,063.36 79,047,873.99 1,077,892,648.14 /
Items related to government subsidies:
Unit: RMB
Liability item Beginning balance
New current subsidiary
amount
Current amount
included in non-operating
income
Other changes
Ending balance
Related to assets/ income
Major industries revitalization and overall technical innovation projects
735,125,069.31 3,669,326.06 20,402,050.02 - 718,392,345.35 Related to
assets
Interest subsidies for special loans
129,612,595.96 - 4,650,116.04 - 124,962,479.92 Related to
assets
Relocation compensation
95,377,267.33 - - - 95,377,267.33 Related to
assets
Infrastructure subsidies
96,470,782.40 - - - 96,470,782.40 Related to
assets

2016 Semi-annual Report
106 / 151
Subsidies for Bassinet Hi-tech
34,671,618.71 454,859.00 21,799,357.19 - 13,327,120.52 Related to
income
Others 1,582,125.06 59,976,878.30 30,079,915.22 2,116,435.52 29,362,652.62 Related to
assets
Total 1,092,839,458.77 64,101,063.36 76,931,438.47 2,116,435.52 1,077,892,648.14 /
44. Other Non-current Liabilities
Unit: RMB
Item Ending balance Beginning balance
Others 7,923,822.88 7,134,514.14
Total 7,923,822.88 7,134,514.14
45. Share Capital
Unit: RMB
Beginning balance
Current change (+,-)
Ending balance
New issue
of share
s
Share dividend
Capitalization of accumul
ation funds
Others Subtotal
Total shares
16,467,517,524.00 -590,300.00 -590,300.00 16,466,927,224.00
Other notes:
In accordance with the Agreement for Proposal on Repurchase of Shares of the Company by Centralized Competitive Price Transaction, the Notification to Creditors of Baoshan Iron & Steel Co., Ltd. on Repurchase of Shares, and the Resolution of the 2nd Extraordinary General Meeting 2012 of Baoshan Iron & Steel Co., Ltd. as well as the regulations of the revised Articles of Associations, the Company will repurchase A-share stocks through centralized competitive price transactions at Shanghai Stock Exchange. The repurchase price per share shall not exceed RMB 5, and the maximum total amount available for repurchase shall not exceed RMB 5 billion. On September 21, 2012, the Company implemented the repurchase for the first time, and totally repurchased 414,055,508 shares up to December 31, 2012. In accordance with the resolutions of General Meeting and the regulations of the revised articles of association, the Company has applied for the decrease of capital of RMB 390,000,000, and completed the cancellation of 390,000,000 shares with the Shanghai Branch of the China Securities Depository and Clearing Corporation Limited (CSDC) on December 20, 2012. The Company completed the procedure on the industrial and commercial registration on December 31, 2012. After change, the registered capital and the capital amount to RMB 17,122,048,088. The equity changes in 2012 were verified by Deloitte Touche Tohmatsu CPA LLP., for which the DSB (Y) Z (12) No. 0078 Capital Verification Report has been issued.
As of May 21, 2013, the Company had completed the implementation of the share repurchase scheme, and repurchased 1,040,323,164 shares, and the number of repurchased shares will be 650,323,164 after the 390,000,000 cancelled shares are deducted from the total repurchased shares. In accordance with the resolution of the general meeting of the Company and the regulations of the revised articles of association, the Company has applied for the decrease of the capital of RMB 650,323,164, and completed the cancellation of 650,323,164 shares with the Shanghai Branch of the China Securities Depository and Clearing Corporation Limited (CSDC) on May 23, 2013. The Company completed the procedure on the industrial and commercial registration on June 24, 2013. After change, the registered capital and the capital amount to RMB 16,471,724,924.00. The equity changes in 2013 were verified by Deloitte Touche Tohmatsu CPA LLP., for which the DSB (Y) Z (13) No. 0103 Capital Verification Report has been issued.
In 2014, 698,900 shares were reduced due to the incentive plan of repurchasing restricted stock which fails to reach the unlocking conditions. The Company completed the procedure on the industrial and commercial registration change on December 31, 2014. After change, the registered capital and the capital amount to RMB 16,471,026,024.
In 2015, 3,508,500 shares were reduced due to the incentive plan of repurchasing restricted stock which fails to reach the unlocking conditions. On December 31, 2015, the registered capital and the capital amount to RMB 16,467,517,524.
In 2016, 590,300 shares were reduced due to the incentive plan of repurchasing restricted stock which fails to reach the unlocking conditions. For details, please see note XI. By the end of reporting period, the registered capital and the capital amount to RMB16,466,927,224.00, among 16,424,278,824 RMB common shares without restricted conditions, Baosteel Group holds 13,130,265,267shares, with shareholding ratio of 79.74%.

2016 Semi-annual Report
107 / 151
46. Capital Reserves
Unit: RMB
Item Beginning balance Current adds Current cuts Ending balance
Capital premium (Share capital premium)
32,053,868,293.15 6,988,521.29 537,173.00 32,060,319,641.44
Others Capital reserves
1,686,013,797.47 29,679,302.63 - 1,715,693,100.10
Total 33,739,882,090.62 36,667,823.92 537,173.00 33,776,012,741.54
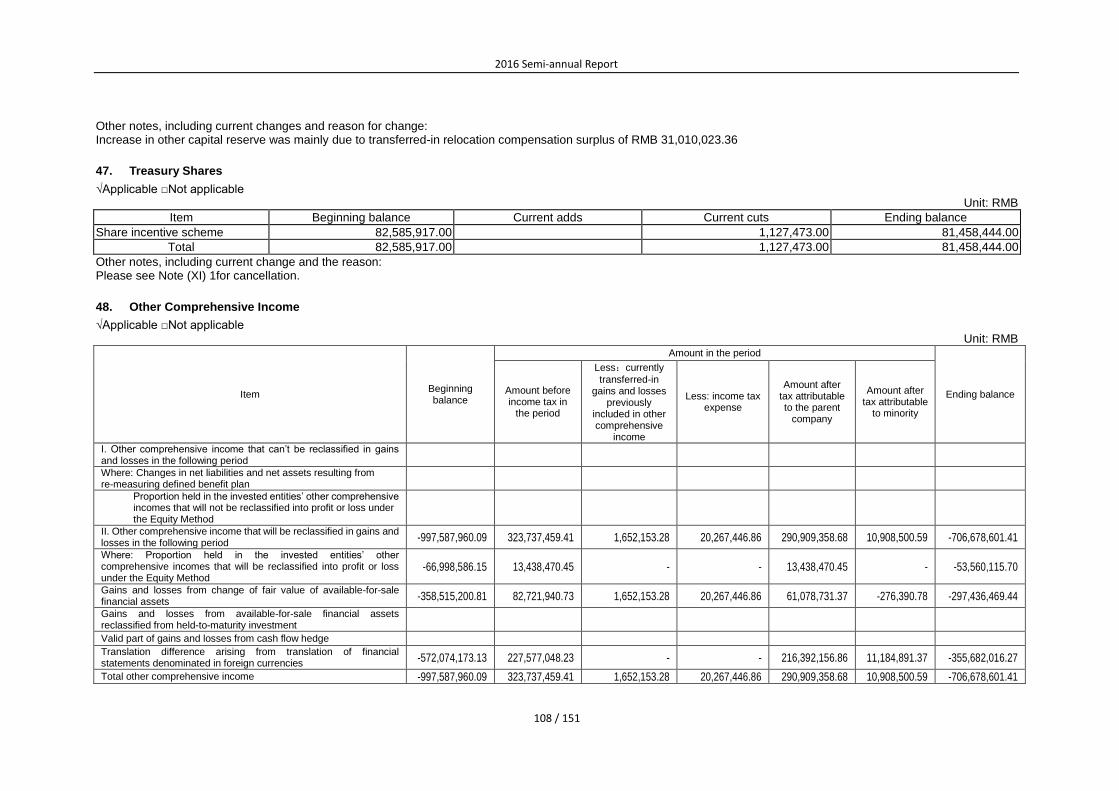
2016 Semi-annual Report
108 / 151
Other notes, including current changes and reason for change: Increase in other capital reserve was mainly due to transferred-in relocation compensation surplus of RMB 31,010,023.36
47. Treasury Shares
√Applicable □Not applicable Unit: RMB
Item Beginning balance Current adds Current cuts Ending balance
Share incentive scheme 82,585,917.00 1,127,473.00 81,458,444.00
Total 82,585,917.00 1,127,473.00 81,458,444.00
Other notes, including current change and the reason: Please see Note (XI) 1for cancellation.
48. Other Comprehensive Income
√Applicable □Not applicable Unit: RMB
Item Beginning balance
Amount in the period
Ending balance Amount before income tax in
the period
Less:currently
transferred-in gains and losses
previously included in other comprehensive
income
Less: income tax expense
Amount after tax attributable to the parent
company
Amount after tax attributable
to minority
I. Other comprehensive income that can’t be reclassified in gains and losses in the following period
Where: Changes in net liabilities and net assets resulting from re-measuring defined benefit plan
Proportion held in the invested entities’ other comprehensive incomes that will not be reclassified into profit or loss under the Equity Method
II. Other comprehensive income that will be reclassified in gains and losses in the following period
-997,587,960.09 323,737,459.41 1,652,153.28 20,267,446.86 290,909,358.68 10,908,500.59 -706,678,601.41
Where: Proportion held in the invested entities’ other comprehensive incomes that will be reclassified into profit or loss under the Equity Method
-66,998,586.15 13,438,470.45 - - 13,438,470.45 - -53,560,115.70
Gains and losses from change of fair value of available-for-sale financial assets
-358,515,200.81 82,721,940.73 1,652,153.28 20,267,446.86 61,078,731.37 -276,390.78 -297,436,469.44
Gains and losses from available-for-sale financial assets reclassified from held-to-maturity investment
Valid part of gains and losses from cash flow hedge Translation difference arising from translation of financial statements denominated in foreign currencies
-572,074,173.13 227,577,048.23 - - 216,392,156.86 11,184,891.37 -355,682,016.27
Total other comprehensive income -997,587,960.09 323,737,459.41 1,652,153.28 20,267,446.86 290,909,358.68 10,908,500.59 -706,678,601.41

2016 Semi-annual Report
109 / 151
49. Special Reserves
√Applicable □Not applicable Unit: RMB
Item Beginning balance Current adds Current cuts Ending balance
Safe production expenses
10,915,599.63 136,377,275.36 122,727,151.52 24,565,723.47
Total 10,915,599.63 136,377,275.36 122,727,151.52 24,565,723.47
The Group appropriates special reserves in accordance with the provisions of the Measures on the Appropriation and Use of Production Safety Expenses (CQ [2012] No. 16) as the expenditure on production safety.
50. Surplus Reserves
Unit: RMB
Item Beginning balance Current adds Current cuts Ending balance
Statutory surplus reserves
11,622,601,293.28 - - 11,622,601,293.28
Arbitrary surplus reserves
14,894,053,633.06 - - 14,894,053,633.06
Reserve fund
Enterprise development fund
Others
Total 26,516,654,926.34 - - 26,516,654,926.34
51. Undistributed Profits
Unit: RMB
Item Current period Last period
Previous ending undistributed profit before adjustment
37,148,447,581.69 39,765,842,085.69
Total number of adjusting beginning undistributed
profits (more+, less-) -
Beginning undistributed profits after adjustment 37,148,447,581.69 39,765,842,085.69
Plus: Net profit attributable to owners of parent company in the period
3,468,482,796.75 3,174,482,235.10
Less: Provisions for statutory surplus reserves -
Provisions for mandatory surplus reserves -
Withdrawal of general risk reserves
Common stock dividends payable 988,015,633.44 2,964,784,684.32
Common stock dividends converted to stock capital
Ending undistributed profits 39,628,914,745.00 39,975,539,636.47
Note: According to 2015 Annual General Meeting held by the Company on April 28, 2016, 2015 Profit Distribution Scheme shall be: based on the Company’s total capital stock of 16,466,927,244 shares (please see note (V), 45) , cash dividend shall be distributed RMB 0.06 (tax included) per share, totaling RMB 988,015,633.44 (tax included).
52. Operating Incomes and Operating Costs
Unit: RMB
Item Amount in the period Amount in last period
Revenue Cost Revenue Cost
Principal business
77,592,837,577.47 66,730,428,989.17 80,222,406,130.37 70,868,464,721.93
Other business 399,962,261.91 339,830,908.09 548,201,095.90 656,904,955.17
Total 77,992,799,839.38 67,070,259,897.26 80,770,607,226.27 71,525,369,677.10

2016 Semi-annual Report
110 / 151
53. Business Tax and Surcharges
Unit: RMB
Item Amount in the period Amount in last period
Excise tax
Business tax 23,277,797.35 31,122,817.91
Urban construction and maintenance tax
139,231,515.11 128,188,466.65
Education surcharge 126,822,633.01 114,218,374.44
Others 8,106,787.67 10,792,545.99
Total 297,438,733.14 284,322,204.99
Note: For the business tax payment criterion, see Note (IV)
54. Sales Expense
Unit: RMB
Item Amount in the period Amount in last period
Transportation and storage charge 500,899,312.76 491,432,461.60
Employee benefits 313,541,533.41 300,300,971.96
Depreciation and amortization 39,584,044.80 30,084,772.57
Others 162,474,775.49 149,679,594.50
Total 1,016,499,666.46 971,497,800.63
55. Administrative Expense
Unit: RMB
Item Amount in the period Amount in last period
Technical development expense 1,592,303,435.18 1,787,166,640.67
Employee benefits 811,034,345.04 853,191,224.50
Taxes 291,107,058.24 268,014,326.65
Depreciation and amortization 279,219,895.61 281,643,903.22
Inventory gains and losses of current assets 112,489,437.25 -3,508,917.39
Others 275,774,761.31 307,633,602.46
Total 3,361,928,932.63 3,494,140,780.11
56. Financial Expense
Unit: RMB
Item Amount in the period Amount in last period
Interest expense 1,365,499,930.77 717,393,365.25
Less: capitalized interest costs -310,928,437.83 -281,947,158.58
Less: interest incomes -166,565,167.72 -284,906,184.26
Exchange losses (gains) 242,390,783.93 273,311,215.91
Others 26,369,663.22 20,420,573.29
Total 1,156,766,772.37 444,271,811.61

2016 Semi-annual Report
111 / 151
57. Loss on Assets Impairment
√Applicable □Not applicable Unit: RMB
Item Amount in the period Amount in last period
I. Loss on bad debts 117,683,121.27 651,233.27
II. Loss on inventory falling price -39,457,267.18 42,995,430.55
III. Impairment loss of available-for-sale financial assets
IV. Impairment loss of held-to-maturity investment
V. Impairment loss of long-term equity investment
VI. Impairment loss of investment property
VII. Impairment loss of fixed assets
VIII. Impairment loss of engineering materials
IX. Impairment loss of construction in progress
X. Impairment loss of productive biological assets
XI. Impairment loss of oil and gas assets
XII. Impairment loss of intangible assets
XIII. Impairment loss of goodwill
XIV. Others 223,833,534.89 46,858,430.56
Total 302,059,388.98 90,505,094.38
Others mean loan impairment reserve.
58. Gains from Changes in Fair Values
√Applicable □Not applicable Unit: RMB
Source of gains from changes in fair values Amount in the period Amount in last
period
Financial assets measured at fair value and the change included in current gains and losses
10,619,295.97 20,115,034.88
Where: Gains from change in fair value of derivative financial instruments
Financial liabilities measured at fair value and the change included in current gains and losses
-57,873,954.55 -17,901,082.57
Investment property measured at fair value
Total -47,254,658.58 2,213,952.31
59. Investment Income
√Applicable □Not applicable Unit: RMB
Item Amount in the period Amount in last period
Investment income from available-for-sale financial assets
103,680,755.16 266,378,172.29
Long-term equity investment incomes calculated using the equity method
110,983,989.20 85,341,686.87
Share investment income /(Loss) 6,795,686.95 529,860.36
Bond investment income /( Loss) 13,521,558.43 40,826,778.82
Fund investment income /( Loss) 8,200,085.39 15,780,962.62
Trust investment income /( Loss) 131,180,771.22 10,100,082.00
Income /( Loss) arising from disposal of -73,809,000.00 -76,736,435.55
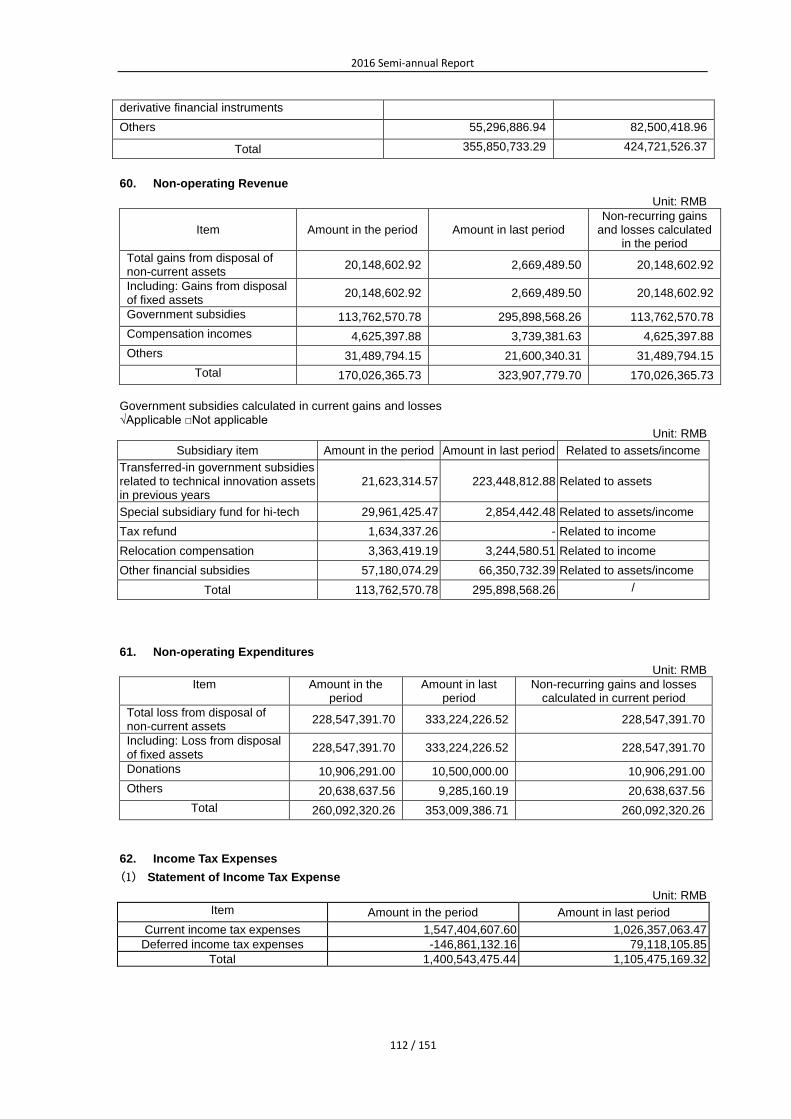
2016 Semi-annual Report
112 / 151
derivative financial instruments
Others 55,296,886.94 82,500,418.96
Total 355,850,733.29 424,721,526.37
60. Non-operating Revenue
Unit: RMB
Item Amount in the period Amount in last period Non-recurring gains
and losses calculated in the period
Total gains from disposal of non-current assets
20,148,602.92 2,669,489.50 20,148,602.92
Including: Gains from disposal of fixed assets
20,148,602.92 2,669,489.50 20,148,602.92
Government subsidies 113,762,570.78 295,898,568.26 113,762,570.78
Compensation incomes 4,625,397.88 3,739,381.63 4,625,397.88
Others 31,489,794.15 21,600,340.31 31,489,794.15
Total 170,026,365.73 323,907,779.70 170,026,365.73
Government subsidies calculated in current gains and losses √Applicable □Not applicable
Unit: RMB
Subsidiary item Amount in the period Amount in last period Related to assets/income
Transferred-in government subsidies related to technical innovation assets in previous years
21,623,314.57 223,448,812.88 Related to assets
Special subsidiary fund for hi-tech 29,961,425.47 2,854,442.48 Related to assets/income
Tax refund 1,634,337.26 - Related to income
Relocation compensation 3,363,419.19 3,244,580.51 Related to income
Other financial subsidies 57,180,074.29 66,350,732.39 Related to assets/income
Total 113,762,570.78 295,898,568.26 /
61. Non-operating Expenditures
Unit: RMB
Item Amount in the period
Amount in last period
Non-recurring gains and losses calculated in current period
Total loss from disposal of non-current assets
228,547,391.70 333,224,226.52 228,547,391.70
Including: Loss from disposal of fixed assets
228,547,391.70 333,224,226.52 228,547,391.70
Donations 10,906,291.00 10,500,000.00 10,906,291.00
Others 20,638,637.56 9,285,160.19 20,638,637.56
Total 260,092,320.26 353,009,386.71 260,092,320.26
62. Income Tax Expenses
(1) Statement of Income Tax Expense
Unit: RMB
Item Amount in the period Amount in last period
Current income tax expenses 1,547,404,607.60 1,026,357,063.47
Deferred income tax expenses -146,861,132.16 79,118,105.85
Total 1,400,543,475.44 1,105,475,169.32

2016 Semi-annual Report
113 / 151
63. Other Comprehensive Income
Please see note (V) 48.
64. Items of Cash Flow Statement
(1) Other Cash Receipts Related to Operating Activities
Unit: RMB
Item Amount in the period Amount in last period
Non-operating incomes, government subsidies and other incomes
341,792,115.10 424,679,995.68
Others 530,652,092.74 -
Total 872,444,207.84 424,679,995.68
(2) Other Cash Payments Related to Operating Activities
Unit: RMB
Item Amount in the period Amount in last period
Sales expenses 404,246,271.15 442,509,120.97
Administrative expenses 443,910,347.27 431,834,529.46
Other 200,298,041.59 120,900,340.85
Total 1,048,454,660.01 995,243,991.28
(3) Other Cash Receipts Related to Investment Activities
Unit: RMB
Item Amount in the period Amount in last period
Proceeds from disposal of Wusong Lot 4,879,536,386.73 5,208,894,246.60
Interest incomes 34,670,574.69 14,077,691.10
Other 304,019.25 -
Total 4,914,510,980.67 5,222,971,937.70
(4) Other Cash Payments Related to Investment Activities
Unit: RMB
Item Amount in the period Amount in last period
Cash paid for settlement of derivative instruments
78,904,777.46 57,272,019.38
Other 45,475,000.00 -
Total 124,379,777.46 57,272,019.38
(5) Other Cash Payments Related to Fundraising Activities
Unit: RMB
Item Amount in the period Amount in last period
Returned purchase money paid by the Group Corporation -
1,500,000,000.00
Total - 1,500,000,000.00
65. Supplementary Data for Cash Flow Statement
(1) Supplementary Data for Cash Flow Statement
Unit: RMB

2016 Semi-annual Report
114 / 151
Supplementary data Amount in the period Amount in last period
1. Reconciliation of net profit to cash flow from operating activities:
Net profit 3,621,408,785.51 3,293,775,649.35
Plus: Provision for impairment losses of assets 302,059,388.98 90,505,094.38
Fixed assets depreciation, oil and gas assets depletion and productive biological assets depreciation
5,038,909,674.81 5,183,714,652.94
Amortization of intangible assets 183,744,961.60 134,192,941.94
Amortization of long-term deferred expenses 42,739,870.09 37,740,892.30
Losses on disposal of fixed, intangible and other long-term assets (with "-"for gains)
208,398,788.78 330,554,737.02
Scrap loss of fixed assets (With “-” for gains)
Losses on the changes in fair value (with "-"for gains) 47,254,658.58 -2,213,952.31
Financial expenses (with "-"for gains) 1,130,397,109.15 423,851,238.32
Investment losses (with "-"for gains) -355,850,733.29 -424,721,526.37
Decrease in deferred tax assets (with "-"for increase) -180,131,292.08 121,415,693.34
Increase in deferred tax liabilities (with "-"for decrease) 33,270,159.92 -1,472,373.89
Decrease in inventory (with "-"for increase) -3,004,053,111.92 834,638,014.79
Decrease in receivables from operating activities (with "-"for increase)
-1,652,356,369.45 -631,567,331.16
Increase in payables for operating activities (with "-"for decrease)
2,861,043,953.10 16,169,868.01
Others
Net cash flow from operating activities 8,276,835,843.78 9,406,583,598.66
2.Investing and financing activities that do not involve
in cash receipts and payments
Debt capitalization
Convertible corporate bond due within 1 year
Fixed assets acquired under finance leases
3. Net changes in cash and cash equivalents:
EOP balance of cash 12,723,230,118.70 13,170,099,197.20
Less: BOY balance of cash 6,968,888,292.15 10,550,257,587.98
Plus: EOP balance of cash equivalents - 1,811,003,911.79
Less: BOY balance of cash equivalents 2,140,000,000.00 741,031,995.09
Net increase in cash and cash equivalents 3,614,341,826.55 3,689,813,525.92
(2) Constitution of Cash and Cash Equivalents
Unit: RMB
Item Ending balance Beginning balance
I. Cash 12,723,230,118.70 6,968,888,292.15
Including: cash on hand 859,578.31 664,508.04
Bank deposits available for payment at any time
12,685,876,497.60 6,903,794,819.63
Other monetary funds available for payment at any time
36,494,042.79 64,428,964.48
Deposit in Central Bank of China for payments
Due from banks
Call loan to banks
II. Cash equivalents - 2,140,000,000.00
III. EOP balance of cash and cash equivalents 12,723,230,118.70 9,108,888,292.15
Cash and cash equivalents exclude such cash and cash equivalents which the parent company or the subsidiaries within the group are restricted to use.
66. Assets Whose Ownership or Use Right is Restricted
√Applicable □Not applicable Unit: RMB
Item Ending book value Reason
Monetary fund 802,025,553.04 Legal reserves deposited by the Finance

2016 Semi-annual Report
115 / 151
Company in the Central Bank of China
Fixed assets 657,807,385.03 Pledged borrowings
Intangible assets 71,071,569.11 Pledged borrowings
Total 1,530,904,507.18 /
67. Foreign Monetary Items
√Applicable □Not applicable
(1). Foreign Monetary Items:
Unit: Yuan
Item Ending balance of foreign currency
Translation exchange rate
Ending balance of translated RMB
Monetary fund
Where: USD 397,978,595.76 6.631200 2,639,075,664.21
JPA 4,687,857,636.26 0.064491 302,324,626.82
EUO 64,718,684.09 7.375000 477,300,295.13
HKD 6,312,647.76 0.854670 5,395,230.66
Others 84,786,556.38
Accounts receivable
Where: USD 131,818,627.80 6.631200 874,115,684.67
EUO 103,154,602.33 7.375000 760,765,192.19
JPA 1,472,338,793.94 0.064491 94,952,601.16
KRW 22,887,508,849.83 0.005747 131,534,513.36
Long-term borrowing
Where: USD 31,829,802.28 6.631200 211,069,784.91
JPA 12,860,571.71 0.064491 829,391.13
KRW 3,989,689,403.17 0.005747 22,928,745.00
Short-term borrowing
USD 242,329,259.72 6.631200 1,606,933,787.07
EUO 57,525,274.86 7.375000 424,248,902.09
KRW 5,000,000,000.00 0.005747 28,735,000.00
VI. Consolidated Scope Change
1. Merge Under Different Controls
□Applicable √Not applicable
2. Merge Under the Same Control
□Applicable √Not applicable

2016 Semi-annual Report
116 / 151
VII. Equity in Other Entities
1. Equity in Subsidiaries
√Applicable □Not applicable
(1). Constitution of the Enterprise Group
Subsidiaries name Principal business territory
Registration address
Business nature Shareholding ratio (%)
Acquisition method Direct Indirect
Yantai Lubao Steel Pipe Co., Ltd. (“Lubao Steel Pipe”) China Yantai Manufacturing 100% - Merge under the same control
Baosteel Huangshi Coated & Galvanized Sheets Co., Ltd. (Huangshi Coating & Galvanizing)
China Huangshi Manufacturing
50.63% - Merge under the same control
Shanghai Baosteel International Economic & Trading Co., Ltd. (“Baosteel International”)
China Shanghai Iron and steel trading
100% - Merge under the same control
Shanghai Meishan Iron & Steel Co., Ltd.(“Meishan Steel”) China Nanjing Manufacturing 77.04% - Merge under the same control
Shanghai Bassinet Software Co., Ltd. (“Bassinet Software”) China Shanghai Information technology 55.5% - Merge under the same control
Baosteel America Inc. (“Baosteel America”) USA Texas, USA Iron and steel trading 100% - Merge under the same control
Howa Trading Co.,Ltd. (“Howa Trading”) Japan Tokyo, Japan Iron and steel trading 100% - Merge under the same control
Baosteel Europe Gmbh (“Baosteel Europe”) Germany Hamburg, Germany Iron and steel trading 100% - Merge under the same control
Baosteel Singapore PTE Ltd. (“Baosteel Singapore”) Singapore Singapore Iron and steel trading 100% - Merge under the same control
Bao-Trans Enterprises Ltd. (Bao-Trans Enterprises) China Hong Kong
China Hong Kong Iron and steel trading
100% - Merge under the same control
Shanghai Baosteel Chemical Co., Ltd. (“Baosteel Chemical”) China Shanghai Manufacturing 100% - Merge under the same control
Baosteel Group Finance Co., Ltd. (“Finance Company”) China Shanghai Finance 62.1% - Merge under the same control
Nantong Baosteel Iron & Steel Co., Ltd. (“Baotong Iron & Steel”)
China Nantong Manufacturing
95.82% - Merge under the same control
Baosteel Zhanjiang Iron & Steel Co., Ltd. (“Zhanjiang Steel”) China Zhanjiang Manufacturing 90% - Merge under the same control
Yantai Baosteel Steel Pipe Co., Ltd. (“Yanbao Steel Pipe”) China
Yantai Production and sale of steel pipes
80% 20% Establishment, investment and others
Shanghai Huagongbao E-commerce Co.,Ltd. (Huagongbao) China
Shanghai E-commerce - 53.85%
Establishment, investment and others
Xinjiang Karamay Steel Pipe Ltd. (Baoma Tube) China
Karamay Production and sale of steel pipes
75% - Establishment, investment and others
Poly Pipe (Thailand) Co., Ltd. (Poly Pipe) (Note1) Thailand Thailand Processing of steel pipes - 51%
Establishment, investment and others
BGM Co., Ltd. (BGM) (Note 1) South Korea Gyeonggi-do, Korea
processing and sale of iron and steel products
- 50% Establishment, investment and others
Ouyeel Commerce Co., Ltd (Ouyeel Commerce) China Shanghai E-commerce 8.67% 42.33% Establishment, investment and others

2016 Semi-annual Report
117 / 151
Note 1: On the balance sheet date, the Group’s proportion of investment in BGM was 50%, but the Group held more than half of majority vote in the Board of Directors.
Therefore, the Group included BGM into the consolidated statement scope for accounting by taking it as the subsidiary.
(2). Important Non-wholly-owned Subsidiaries
The Company disclosed the investee with long term equity investment balance at the end of the period over RMB 5 billion and Finance Co., the finance segment of the Group, as important non-wholly-owned subsidiaries.
Unit: RMB 1,000
Subsidiaries name Shareholding ratio of
minority Current gains and losses attributable
to minority Current dividend declared to issue to
minority Ending equity balance of
minority
Meisteel Co. 22.96% 32,323 2,201,486
Financial Co. 37.90% 25,034 15,930 723,571
Zhanjiang Steel 10.00% -13,755 1,927,250
(3). Main Financial Data of Important Non-wholly-owned Subsidiaries
Unit: RMB 1,000
Subsidiaries name
Ending balance Beginning balance
Current assets
Non-current assets
Total assets
Current liabilities
Non-current liabilities
Total liabilities
Current assets
Non-current assets
Total assets
Current liabilities
Non-current liabilities
Total liabilities
Meisteel Co.
7,086,493 23,840,976 30,927,469 21,173,368 188,969 21,362,337 4,902,620 24,480,962 29,383,582 19,760,453 198,366 19,958,819
Financial Co.
6,876,513 8,256,252 15,132,765 13,214,522 9,085 13,223,607 5,434,504 8,886,162 14,320,666 12,429,397 8,814 12,438,211
Zhanjiang Steel
7,784,793 49,928,591 57,713,384 25,570,829 13,713,246 39,284,075 5,992,409 45,466,151 51,458,560 21,937,141 10,947,042 32,884,183
Unit: RMB 1,000
Subsidiaries name
Amount in the period Amount in last period
Operating revenue
Net profit Total
comprehensive income
Cash flow from operating activities
Operating revenue
Net profit Total
comprehensive income
Cash flow from operating activities
Meisteel Co. 8,824,477 140,369 140,369 626,248 10,810,760 38,711 38,711 208,165
Financial Co. 187,028 66,053 68,735 1,630,054 259,471 79,762 85,726 2,519,853
Zhanjiang Steel 983,218 -145,068 -145,068 -1,046,199 162,927 -94,765 -94,765 3,883 The above subsidiaries have no major restrictions in using the enterprise Group assets and repayment enterprise Group debts.

2016 Semi-annual Report
118 / 151
2. Relevant Data of Structured Entity Included in Consolidated Scope of Financial Statement
The following trust products, entrusted by Ouyeel Commerce to Hwabao Trust for issuance and management, have been included as structured entities in the consolidated scope of financial statements at the end of the reporting period.
Unit: RMB
Name Type Trustee agency
Business nature and operation
scope
Registered capital (RMB)
Actual contribution by the Group at the end of the
period (RMB)
If consolidated financial statement
Baosteel #1 Trust
product Hwabao Trust
Securities investment
NA 7,027,531.15 Yes
Baosteel #11 Trust
product Hwabao Trust
Securities investment
NA 1,350,143,524.34 Yes
Baosteel #13 Trust
product Hwabao Trust
Securities investment
NA 308,873,000.00 Yes
Total / / / / 1,666,044,055.49 /
3. Equity in the Joint Venture or Associated Enterprise
√Applicable □Not applicable
(1) Important Joint Venture or Associated Enterprise
The Company takes the invested unit with year-end balance of long-term equity investment more than six hundred million Yuan as the important joint ventures for disclosure and the invested unit with year-end balance of long-term equity investment more than one hundred million Yuan as the important associated enterprises for disclosure.
Unit: RMB Yuan
JVs and associated enterprises name
Principal business territory
Registration address
Business nature
Shareholding ratio (%)
Accounting treatment
method for investment in
JVs and associated enterprises
Direct Indirect
I. JVs
Baosteel-NSC/Arcelor Automotive Steel Sheets Co., Ltd.(“BNA”)
China Shanghai Manufacturing 50 - Equity Method accounting
BAO-ISLAND ENTERPRISES LIMITED (“BAO-ISLAND”)
China Hong Kong Ship leasing 50 -
Equity Method accounting
Guangzhou JFE Steel Sheet Co., Ltd. (Guangzhou JFE)
China Guangzhou
Production of iron and steel
- 50 Equity Method accounting
II. Associated enterprises
Shanghai Baosteel & Arcelor Tailor Metal Co., Ltd. (“Welding Co.”)
China Shanghai Manufacturing - 38
Equity Method accounting
Henan Pingbao Coal Industry Co., Ltd. (“Henan Pingbao”)
China Xuchang Mining - 40
Equity Method accounting
(2) Main Financial Data of Important JVs
Unit: RMB 1,000
Ending balance/Amount in the period Beginning balance/Amount in last period
BNA Bao-Island Enterprise
Guangzhou JFE
BNA Bao-Island Enterprise
Guangzhou JFE
Current assets 3,141,242 331,925 1,361,129 2,742,477 510,468 1,353,706
Including: Cash and cash equivalent
1,182,453 250,984 391,355 962,741 437,051 398,124
Non-current assets 2,215,291 1,176,547 3,945,932 2,377,932 1,132,763 4,115,260
Total assets 5,356,533 1,508,472 5,307,061 5,120,409 1,643,231 5,468,966
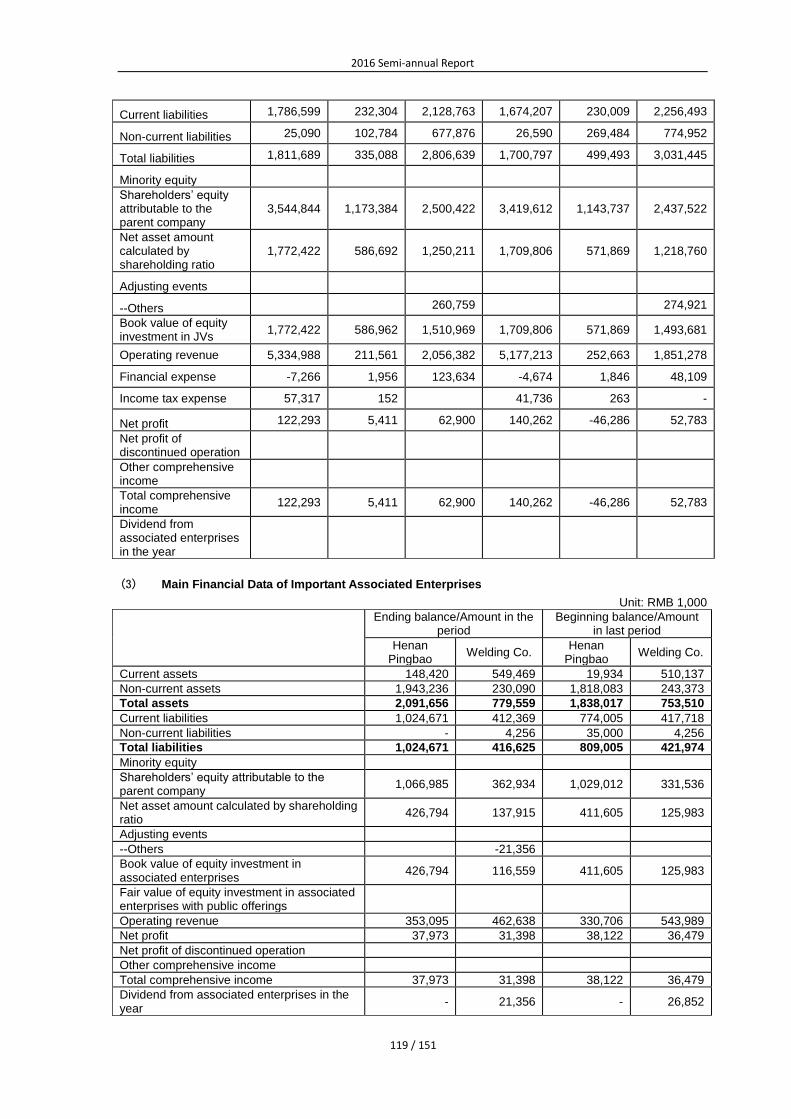
2016 Semi-annual Report
119 / 151
Current liabilities 1,786,599 232,304 2,128,763 1,674,207 230,009 2,256,493
Non-current liabilities 25,090 102,784 677,876 26,590 269,484 774,952
Total liabilities 1,811,689 335,088 2,806,639 1,700,797 499,493 3,031,445
Minority equity
Shareholders’ equity attributable to the parent company
3,544,844 1,173,384 2,500,422 3,419,612 1,143,737 2,437,522
Net asset amount calculated by shareholding ratio
1,772,422 586,692 1,250,211 1,709,806 571,869 1,218,760
Adjusting events
--Others 260,759 274,921
Book value of equity investment in JVs
1,772,422 586,962 1,510,969 1,709,806 571,869 1,493,681
Operating revenue 5,334,988 211,561 2,056,382 5,177,213 252,663 1,851,278
Financial expense -7,266 1,956 123,634 -4,674 1,846 48,109
Income tax expense 57,317 152 41,736 263 -
Net profit 122,293 5,411 62,900 140,262 -46,286 52,783
Net profit of discontinued operation
Other comprehensive income
Total comprehensive income
122,293 5,411 62,900 140,262 -46,286 52,783
Dividend from associated enterprises in the year
(3) Main Financial Data of Important Associated Enterprises
Unit: RMB 1,000
Ending balance/Amount in the period
Beginning balance/Amount in last period
Henan Pingbao
Welding Co. Henan
Pingbao Welding Co.
Current assets 148,420 549,469 19,934 510,137
Non-current assets 1,943,236 230,090 1,818,083 243,373
Total assets 2,091,656 779,559 1,838,017 753,510
Current liabilities 1,024,671 412,369 774,005 417,718
Non-current liabilities - 4,256 35,000 4,256
Total liabilities 1,024,671 416,625 809,005 421,974
Minority equity
Shareholders’ equity attributable to the parent company
1,066,985 362,934 1,029,012 331,536
Net asset amount calculated by shareholding ratio
426,794 137,915 411,605 125,983
Adjusting events
--Others -21,356
Book value of equity investment in associated enterprises
426,794 116,559 411,605 125,983
Fair value of equity investment in associated enterprises with public offerings
Operating revenue 353,095 462,638 330,706 543,989
Net profit 37,973 31,398 38,122 36,479
Net profit of discontinued operation
Other comprehensive income
Total comprehensive income 37,973 31,398 38,122 36,479
Dividend from associated enterprises in the year
- 21,356 - 26,852

2016 Semi-annual Report
120 / 151
(4) Summary Financial Data of Non-important JVs and Associated Enterprises
Unit: RMB
Ending balance/Amount in the period
Beginning balance/Amount in last period
JVs:
Total book value of investment 347,922 339,991
Total number of following items calculated based on shareholding proportions
--Net profit 7,954 -3,631
--Other comprehensive income
-- Total comprehensive income 7,954 -3,631
Associated enterprises:
Total book value of investment 378,194 349,482
Total number of following items calculated based on shareholding proportions
--Net profit -5,222 -642
--Other comprehensive income 1,321
-- Total comprehensive income -3,901 -642
(5) Explanation about Major Restrictions on the Ability of Joint Venture or Associated Enterprise Transferring Funds to the Company:
When equity method is used for accounting, accounting policies between the Group and all joint ventures and associated companies of the Group have no significant difference, and there are no major restrictions on the investment realization of such long-term investment and repatriation of investment income.
VIII. Risks Associated with Financial Instruments
√Applicable □Not applicable
The Group’s major financial instruments include the monetary funds, financial asset measured at fair value and the change included in the current profits and losses, notes receivable, accounts receivable, interest receivable, dividends receivable, other receivables, redemptory monetary capital for sale, non-current assets due within a year, finance management products in other current assets, loan granted and advances, available-for-sale financial assets, long-term receivables, short-term loans, borrowings from the central bank, deposits from customers and interbank, borrowing funds, financial liabilities measured at fair value with change included in current gains and losses, notes payable, accounts payable, financial assets sold for repurchase, interests payable, dividends payable, other payables, non-current liabilities due within one year, other current liabilities, long-term loans, bonds payable, etc. For details of all the financial instruments please see note (V). Risks associated with these financial instruments as well as risk management policy taken by the group for reducing these risks are as described below. The Group management personnel conduct the management and monitoring of these risk exposure in order to ensure the above risks are controlled within the limited scope.
The Group conducts the analysis on the possible impact of the reasonable and possible change of risk variables upon the current profits and losses and shareholders’ equity with the sensitivity analysis technique. Because any risk variables rarely change separately, and the correlation among variables will have a significant effect upon the eventual impact amount of a risk variable, the following content is given under the assumption that the change of each variable is independent.
1. Risk Management Objectives and Policies
The objective of the Group engaging in the risk management is to achieve the right balance between the risks and benefits, reduce the negative impact on the Group’s business performance to the lowest level, and maximize the interests of shareholders and other equity investors. Based on the risk management objectives, the basic strategy of the Group’s risk management is to determine and analyze all kinds of risks faced by the Group, set up the appropriate bottom line of risk exposure, conduct the risk management, and supervise various risks timely and reliably, controlling the risk within the limited scope.
1.1Market Risk

2016 Semi-annual Report
121 / 151
Market risk refers to the change of fair value of financial instruments being sensitive to market risk caused by the change of foreign currency exchange rate(foreign exchange risk), market price (price risk), market interest rate (interest rate risk) or other factors. Such change is caused by the effect on the single financial instrument or issuer, or financial instruments of all transaction of the whole market.
1.1.1.Foreign Exchange Risk
Foreign exchange risk refers to the risk of losses arising from change in exchange rate. The foreign exchange risk borne by the Group is mainly associated with the business activities of the Group (when the income and expenses are settled with the foreign currency which is different from the recording currency of the Group).
The Group has the large-scale procurement demand for imported iron ore and needs to settle in dollars, also income and expenses in dollars have big deficit. For the dollar gap, the Company takes the most favorable RMB financing cost ratio obtained in the current period as the comparison basis, and makes the superior selection out of dollar or RMB financing. Meanwhile, the Company closely follows the trend of exchange rate of RMB against dollar, and conducts the dynamic assessment on the exchange rate risk of dollar debts. Under the market environment that the two-way fluctuation of exchange rate of RMB against dollar is aggravated, the Group avoids the fluctuation risk of exchange rate by carrying out the supporting forward foreign exchange purchase business of dollar financing or converting financing currencies.
Based on the control idea of interest rate controlling objective, comprehensive financing cost level within the duration of loan is determined at the beginning of the Company borrowing the loan, namely, consolidate the net profit or loss for the interest expense from dollar financing and delivery profit and loss of supporting forward foreign exchange purchase transaction. Within the duration of loan, the business has no substantial effect upon the Group’s operation, but there will be impact due to the revaluation on exchange rate change at the end of different reporting periods.
1.1.2. Interest Rate Risk
Interest rate risk refers to the risk that fair value of financial instruments or future cash flow will fluctuate due to the change of market interest rate. The risk from the fluctuation of market interest rate faced by the Group is mainly associated with the liabilities with interest calculated by floating interest rate. The Group conducts the management of interest cost by maintaining proper fixed interest debt and variable rate debt portfolio.
Risk of the change of fair value of financial instruments caused by the change of interest rate is mainly associated with the available-for-sale bond investment. Risk of changes in future cash flow of financial instruments of the Group due to change in interest rate is mainly associated with loans and long-term receivables.
The table below is the interest rate risk of financial instruments listed by the due date and actual interest rate:
Unit: RMB
June 30, 2016 June 30, 2015
Available-for-sale financial assets Available-for-sale financial assets
Over 1 year 348,833,621.70 403,945,851.70
Total 348,833,621.70 403,945,851.70
Actual rate (Annual interest rate) 2.60%-4.61% 3.41%-4.65%
Unit: RMB
June 30, 2016
Lendings to Banks and
Other Financial
Institutions
Buying back the sale of financial assets
Loan granted Long-term receivables (including
within 1 year)
Within 1 year - - - 4,500,000,000.00

2016 Semi-annual Report
122 / 151
Over 1 year - - 2,113,749,234.87 121,450,485.49
Total - - 2,113,749,234.87 4,621,450,485.49
Actual rate (Annual interest rate)
- - 3.915%-5.4% 3.915%
Unit: RMB
December 31, 2015
Lendings to Banks and
Other Financial Institutions
Buying back the sale of financial
assets Loan granted
Long-term receivables (including within 1 year)
Within 1 year - - - 4,500,000,000.00
Over 1 year - - 2,402,928,796.11 4,579,260,708.90
Total - - 2,402,928,796.11 9,079,260,708.90
Actual rate (Annual interest rate)
- - 2.7881%-7.92% 3.915%-5.04%
Unit: RMB
June 30, 2016
Short-term financing
debt Borrowing
Borrowings from band or
other financial
institutions
Deposit taking Bonds payable
Sales of repurch
ased financial assets
Accounts payable
Long-term payables (including within 1
year)
Within 1 year
20,328,179,519.43
33,654,162,810.32 198,000,000.00 6,649,755,957.49 - - 70,000,000.00
Over 1 year 11,680,750,586.32 13,964,217,441.01 - - 81,458,444.00
Total 20,328,179,519.4
3 45,334,913,396.64 198,000,000.00 6,649,755,957.49 13,964,217,441.01 - - 151,458,444.00
Actual rate (Annual interest rate)
2.78%-3.18% 0.26%-5.665% 3.40% 0.455%-4.25% 1.920%-4.070% - - -
Unit: RMB
December 31, 2015
Short-term financing debt
Borrowing
Borrowings from band or other financial
institutions
Deposit taking Bonds
payable
Sales of repurch
ased financial assets
Account
s payable
Long-term payables (including within 1
year)
Within 1 year
10,057,344,262.30
27,249,146,830.88 198,000,000.00 10,009,980,135.82 - - - 70,000,000.00
Over 1 year - 9,111,026,384.68 - - 8,747,373,959.29 - - 82,585,917.00
Total 10,057,344,262.30 36,360,173,215.56 198,000,000.00 10,009,980,135.82 8,747,373,959.29 - - 152,585,917.00
Actual rate (Annual interest rate)
3.18% 0.56%-6.22% 3.40% 0.4550%-4.6750% 1.920%-4.070% - - -
1.1.3. Other Price Risks
Investment of available-for-sale financial assets and trading financial assets held by the Group are measured with fair value on the balance sheet date. Therefore, the Group assumes the risk of the change of financial market. The Group holds various equity security portfolios to reduce the price risk of equity securities investment.
Equity instrument investment price risk
Equity instrument investment price risk refers to the risk that the fair value of the equity securities will fluctuate due to the change of stock index level and value of individual securities. On December 31, 2015, the Group was exposed to the equity instrument investment price risk caused by the individual equity instrument investment which is classified as trading equity instrument investment (Note V, 2) and available-for-sale equity instrument investment (Note V, 14). The listed equity instrument investment held by the Group is listed in Shanghai Stock Exchange and Shenzhen Stock Exchange, and is measured on the balance sheet date with quoted market price. Market stock index of following stock exchanges when

2016 Semi-annual Report
123 / 151
the market closed on the trading day which is the most close to the balance sheet date this year, as well as their respective highest and the lowest closing price this year are as follows:
2016 High/low 2015 High/low
June 30 The first half of 2016 December 31 2015
Shanghai - Shanghai securities composite index
2,930 3,362/2,656 3,539 5,166/2,927
Shenzhen – Shenzhen securities composite index
10,490 11,725/9,083 12,665 18,098/9,291
The table below reflects the sensibility of pre-tax profit and equity to each 5% of change of fair value of equity instruments (based on the book value on the balance sheet date) in the case of keeping all other variables same and before any taxation impact. In terms of sensitivity analysis, for available-for-sale equity instrument investment, such impact is deemed as the impact upon the change of fair value of available-for-sale equity instrument investment, regardless of factors affecting the impairment of the income statement.
Unit: RMB 1,000
First half year of 2016 Book amount of equity
investment Increase/decrease
of pre-tax profit
Increase/decrease of other
comprehensive income
Investment listed in the following stock exchange
Shanghai- equity instrument investment
208,092 63.46 10,341.15
Shenzhen- equity instrument investment
359,718 6.29 17,979.59
Unit: RMB 1,000
2015 Book amount of
equity investment Increase/decrease
of pre-tax profit
Increase/decrease of other comprehensive
income
Investment listed in the following stock exchange
Shanghai - Available-for-sale investment
212,337 - 10,616.85
Shenzhen - Available-for-sale investment
270,044 - 13,502.20
1.2. Credit Risk
Credit risk refers to the risk that brings financial loss to the party when the other party of financial instruments fails to perform its obligation. For fixed income investment, credit risk refers to the economic loss risk because the Group’s debtor fails to pay the principal or interest when it is due. For equity investment, credit risk refers to the loss risk resulting from operation failure of the invested Group.

2016 Semi-annual Report
124 / 151
The Group’s credit risk mainly comes from all kinds of receivables, as well as loans granted and advances. The Group controls the credit risk by conducting the transaction with the authorized and reputable third party. According to the policy of this Group, the Group shall conduct the credit check of all the customers who require conducting the transaction with the form of credit. In addition, the Group shall conduct the continuous monitoring on balances receivable in order to ensure that the Group will not face the significant risk of bad debts. In the relevant sales trade settlement, the way of picking up goods with full advances received or earnest money and loan is used for settlement. In settlement of relevant trade selling, the Group only conducts the credit assessment on a small number of strategic customers and then determines the credit line and period, and conducts the settlement through the bank acceptance as far as possible. In the settlement of relevant purchase trade, the way of cash on delivery or payment with letter of credit is used for settlement. The Group only gives certain advance payment to the project contractors, some equipment suppliers with long construction cycle and suppliers with shortage of resources through the credit line and period.
All the Group’s loans granted and advances is the main business of financial Company, the debtor is only limited to the member unit of Baosteel Group with good credit assessment, and credit risk is controlled in the appropriate level.
The credit risk of other financial assets and liabilities of the Group comes from the risk of the other party’s breach of contract. In the absence of available guaranty or other credit enhancement, the Group’s largest exposure to risk is equal to the book value of these financial instruments. The Group does not provide any other guarantee which may make the Group suffer from the credit risk. 17% of accounts receivable of the Group on June 30, 2016 is the account receivable of top five big customers.
1.3. Liquidity Risk
Liquidity risk refers to the risk that the enterprise suffers from the shortage of funds when performing the obligations associated with financial liabilities. The Group keeps the balance between financing persistence and flexibility with the trade financing, convertible bonds, medium-term notes, short - and long-term loans and other interest-bearing loans, and get the credit with full specified amount from major financial institutions to meet the short-term and long-term capital requirements. The Group conducts the real-time monitoring of short-term and long-term capital requirements to ensure and maintain enough cash reserves and negotiable securities for realization at any time. On June 30, 2016, the Group’s current liabilities were 9.705 billion Yuan more than total amount of current assets. The Group can take the bank loan as the capital source of the difference between current liabilities and current assets. On June 30, 2016, the Group’s credit line having not been used was 8.9461 billion Yuan. Therefore, the Company management holds the opinion that there is no major liquidity risk.
IX. Disclosure of the Fair Value
√ Applicable □ Not applicable
Fair value refers to the price received by the market participants through selling an asset or paid for transferring a liability in the orderly transaction occurring on the measurement date. Whether fair value is observable or is estimated by adopting the valuation technique, fair value measured and/or disclosed in the financial statements has been determined on this basis.
Fair value of financial assets and financial liabilities of the Group shall be determined in accordance with the following methods: fair value of financial assets and financial liabilities having standard terms and conditions and existing in the active market shall be determined by referring to the corresponding current bid and the current offer of active market; fair value of other financial assets and financial liabilities (excluding derivatives) shall be determined with the common pricing model based on the future cash flow discount method or determined according to the observable current market transaction price; and fair value of derivative instruments shall be determined with the public offer of active market. If there is no public offer, fair value of derivative tools without option shall be estimated and determined with the future cash flow discount method on the basis of the applicable yield curve, and fair value of derivatives with option shall be determined with the option pricing model (such as binomial model).
For financial assets and financial liabilities measured with the fair value, the Group shall divide the fair value of such financial instruments into three different levels according to the observable degree of input value of fair value and the importance of input value to overall fair value measurement. The details are as follows:

2016 Semi-annual Report
125 / 151
First level: Fair value measurement refers to the offer of same assets or liabilities achieved on the measurement date and without adjustment in the active market, mainly including listed and tradable equity instruments (stocks, funds), listed bonds in stock exchange, etc.;
Second level: Fair value measurement refers to the directly or indirectly observable input value of relevant assets or liabilities except for the input value of the first level, mainly including derivative financial instruments of curb exchange;
Third level: Fair value measurement refers to the non-observable value of relevant assets and liabilities.
1. Ending Fair Value of Assets or Liabilities Measured at Fair Value
Unit: RMB Yuan
Item
Ending fair value
Fair value measurement at
first level
Fair value measurement at second level
Fair value measurement at third level
Total
I. Continuous fair value measurement
(I) Financial asset measured at fair value and the change included in the current profits and losses
1,653,927,467.16 4,181,722.45 - 1,658,109,189.61
1. Trading financial assets 1,653,927,467.16 4,181,722.45 - 1,658,109,189.61
(1) Debt instruments investment 301,532,400.00 301,532,400.00
(2) Equity instruments investment 1,395,067.16 1,395,067.16
(3) Derivative financial assets 4,181,722.45 4,181,722.45
(4) Fund and other money management and investment
1,351,000,000.00 1,351,000,000.00
2. Financial asset designatedly measured at fair value and the change included in the current profits and losses
(1) Debt instruments investment
(2) Equity instruments investment
(II) Available-for-sale financial assets 2,977,805,097.95 - - 2,977,805,097.95
(1) Debt instruments investment 1,956,393,610.00 1,956,393,610.00
(2) Equity instruments investment 1,021,411,487.95 1,021,411,487.95
(III) Investment real estate
1. Land use right for rental
2. Building for rental
(IV) Biological assets
Total assets measured at fair value continuously
4,631,732,565.11 4,181,722.45 - 4,635,914,287.56
(V) Trading financial liabilities
Among them: issued trading bonds
Derivative financial liabilities
(VI) Financial liabilities designatedly measured at fair value and the change included in the current profits and losses
(1) Derivative financial liabilities 57,873,954.55 57,873,954.55
Total liabilities continuously measured at fair value
57,873,954.55 57,873,954.55
II. Non-sustainable fair value measurement
(I) Assets held-for-trading
Total assets discontinuously measured at fair value
Total liabilities discontinuously measured at fair value
2. Continuous Fair Value Measurement Item, Current Conversion between All Levels, Reason of Conversion and Policy for Determining Conversion Time Point
There was no transfer between the first level and second level in this year and the previous years.

2016 Semi-annual Report
126 / 151
X. Related Parties and Connected Transactions
1. Particulars about the Parent Company of the Company
Unit: RMB 10,000
Name of parent
company
Registration place
Nature of business
Registered capital
Shareholding ratio of parent
company in the Company (%)
Voting right ratio of parent
company in the Company (%)
Baosteel Group Corporation
Shanghai Steel smelting and processing
5,279,110.10 79.74 79.74
The final controlling party of the Company is State-owned Assets Supervision and Administration Commission of the State Council.
2. Particulars about the Subsidiaries of the Group
For particulars about the subsidiaries of the Group, please see Note (VII).
3. Particulars about JVs and the Associated Enterprises of the Group
For the particulars about important JVs and the associated enterprises, please see Note (VII).
4. Particulars about Other Related Parties
√Applicable □Not applicable
Name of related party Relationship of
related party with the Company
Baosteel Resources (International) Co., Ltd.(“Baosteel Resources (International) and its subsidiaries”)”
Brother corporation
Baosteel Metal Co., Ltd. and its subsidiaries (“Baosteel Metal and its subsidiaries”) Brother corporation
Shanghai Baosteel Engineering & Technology Group Co., Ltd. and its subsidiaries(“Engineering & Technology Co. and its subsidiaries”)
Brother corporation
Hwabao Trust Co., Ltd.(“Hwabao Trust”) Brother corporation
Hwabao Investment Co., Ltd. (“Hwabao Investment”) Brother corporation
Baosteel Group Baoshan Hotel(“Baoshan Hotel”) Brother corporation
Baoshan Development Co., Ltd. And its subsidiaries(“Baosteel Development” and its subsidiaries”)
Brother corporation
Baosteel Group Shanghai No. 2 Iron & Steel Co., Ltd. and its subsidiaries(“No. 2 Iron & Steel Co., Ltd. and its subsidiaries”)
Brother corporation
Baosteel Group Shanghai No. 1 Iron & Steel Co., Ltd. and its subsidiaries(“No. 1 Iron & Steel Co., Ltd. and its subsidiaries”)
Brother corporation
Baosteel Group Shanghai Steel Pipe Co., Ltd. (“Steel Pipe Company”) Brother corporation
Baosteel Group Shanghai Meishan Co., Ltd. and its subsidiaries(“Meishan Company and its subsidiaries”)
Brother corporation
Baosteel Group Shanghai Pudong Iron & Steel Co., Ltd. and its subsidiaries(“Pudong Steel and its subsidiaries”)
Brother corporation
Baosteel Group Shanghai No. 5 Co., Ltd and its subsidiaries(“No. 5 Steel Company and its subsidiaries”)
Brother corporation
Baosteel Group Xinjiang Bayi Iron & Steel Co., Ltd. and its subsidiaries(“Xinjiang Bayi and its subsidiaries”)
Brother corporation
Baosteel Resources Co., Ltd. and its subsidiaries(“Baosteel Resources and its subsidiaries”)
Brother corporation
Shanghai Iron & Steel Research Institute(“Iron & Steel Research Institute”) Brother corporation
Baosteel Desheng Stainless Steel Co., Ltd.(“Baosteel Desheng”) Brother corporation
Guangdong Baosteel Properties Co., Ltd.(“Guangdong Properties”) Brother corporation
Guangdong Shaoguan Iron & Steel Group Co., Ltd.(“Guangdong Shaosteel and its subsidiaries”)
Brother corporation
Shanghai Baosteel Stainless Steel Co., Ltd.(“Shanghai Stainless”) Brother corporation
Baosteel Stainless Steel Co., Ltd.(“Baosteel Stainless”) Brother corporation
Baosteel Special Steel Co., Ltd.(“Baosteel Special Steel and its subsidiaries”) Brother corporation
Shanghai Baohua International Tendering Co., Ltd.(“Baohua Tendering”) Brother corporation

2016 Semi-annual Report
127 / 151
Beijing Huili Property Development Co., Ltd.(“Beijing Huili”) Brother corporation
Shanghai Baosteel Technical and Economic Development Co., Ltd. (“Technical & Economic and its subsidiaries”)
Brother corporation
Baosteel (Australia) Mining Co., Ltd. (“Baosteel Australia Mining”) Brother corporation
Ningbo Baoxin Stainless Steel Co., Ltd. (“Ningbo Baoxin”) Brother corporation
Baosteel Group (Shanghai) Properties Co., Ltd (“Baosteel Properties (Shanghai) ”) Brother corporation
Fujian Baosteel Properties Co., Ltd.(“Fujian Properties”) Brother corporation
Baosteel Hong Kong Investment Co., Ltd. (“Baosteel Hong Kong”) Brother corporation
Shanghai Baoland Co, Ltd. (“Baoland”) Brother corporation
Shanghai Baosteel Aeronautical Materials Co., Ltd (Aeronautical Materials) Brother corporation
5. Particulars about Connected Transactions
(1) Connected Transactions of Purchases and Sales of Commodities and Provisions and Acceptance of Labor Services
√Applicable □Not applicable Procurement of Commodities
Unit: RMB 1,000
Related party Details of connected
transaction Amount in the period Amount in last period
Xinjiang Bayi and its subsidiaries
Iron & steel products, etc. 30,393 420,811
Baosteel Development and its subsidiaries
Iron & steel products, auxiliary materials, etc.
476,626 553,501
Engineering & Technology Co. and its subsidiaries
Equipment, etc. 851,762 1,124,261
Baosteel Metal and its subsidiaries
auxiliary materials, etc. 52,194 177,724
Meishan Company and its subsidiaries
Raw materials, auxiliary materials, etc.
233,014 368,903
Baosteel Resources and its subsidiaries
Raw materials 1,589,744 1,706,038
Baosteel Resources (International) Co., Ltd.
Raw materials
Baosteel Stainless Iron & steel products, etc. 3,859,281 5,529,333
Baosteel Special Steel and its subsidiaries
Iron & steel products 2,311,674 2,766,851
Baosteel Desheng Iron & steel products 227,121 178,385
Ningbo Baoxin Iron & steel products 2,200,589 2,907,944
Ningbo Steel Iron & steel products
BNA Iron & steel products, etc. 4,982,458 4,557,970
Guangzhou JFE Iron & steel products, etc. 259,389 298,302
Guangdong Shaoguan and its subsidiaries
Iron & steel products, etc. 91,099
Others Auxiliary materials, energy, etc.
13,931 19,923
Total 17,179,275 20,609,946
Acceptance of Labor Services
Unit: RMB 1,000
Related party Details of connected transaction Amount in the
period
Amount in the same
period last year
Baosteel Development and its subsidiaries
Comprehensive logistics, engineering, transportation, maintenance service, etc.
556,687 565,646
Engineering & Technology Co. and its subsidiaries
Engineering, maintenance, detection service, etc.
829,009 905,087
Meishan Group and its subsidiaries
Comprehensive logistics, engineering, transportation, maintenance service, etc.
369,566 443,640
Baosteel Resources and its subsidiaries
Comprehensive logistics, engineering, transportation, maintenance service, etc.
263,193 227,533

2016 Semi-annual Report
128 / 151
Related party Details of connected transaction Amount in the
period
Amount in the same
period last year
Bao-Island Comprehensive logistics, engineering, transportation, maintenance service, etc.
85,900 44,195
BNA Processing, etc. 69,632 102,109
Baosteel Group Education, training, etc. 5,018 14,168
Baosteel Special Steel and its subsidiaries
Processing service, etc. 1,740 10,191
Others Transportation service, etc. 31,388 26,957
Total 2,212,134 2,339,526
Sales of Commodities
Unit: RMB 1,000
Related party Details of connected transaction Amount in the
period Amount in last
period
Baosteel Group Energy, auxiliary materials 2,460 3,556
Xinjiang Bayi and its subsidiaries
Auxiliary materials, etc. - 242
Baosteel Development and its subsidiaries
Iron and steel products, auxiliary materials, energy, etc.
322,037 441,069
Engineering & Technology Co. and its subsidiaries
Iron and steel products, energy, auxiliary materials, etc.
110,475 123,672
Baosteel Metal and its subsidiaries
Iron and steel products, energy, etc. 681,545 440,527
Meishan Company and its subsidiaries
Iron and steel products, energy and auxiliary materials
863,018 1,062,754
Baosteel Resources and its subsidiaries
Raw materials 78,765 155,679
Baosteel Resources (International)
Raw materials 827,173 550,466
Baosteel Stainless Raw materials, auxiliary materials, energy, etc.
569,924 825,540
Baosteel Special Steel and its subsidiaries
Raw materials, auxiliary materials, energy, etc.
879,941 1,057,281
Baosteel Desheng Raw materials 176 5,138
Ningbo Baoxin Iron and steel products, etc. 70,556 107,560
Guangdong Shaosteel and its subsidiaries
Raw materials, etc. 69,957 106,737
BNA Iron and steel products, energy and auxiliary materials
4,442,395 4,253,636
Welding Co. Iron and steel products, etc. 154,367 206,367
Tianjin BCM Iron and steel products, etc. 56,998
Guangzhou JFE Iron and steel products, etc. 215,913 178,954
Others auxiliary materials, etc. 47,578 41,976
Total 9,336,280 9,618,152
Provision of Transportation and Technical Services, etc.
Unit: RMB 1,000
Related party Details of connected transaction
Amount in the period
Amount in the same period last year
Baosteel Resources and its subsidiaries
Transportation and technical services, etc.
33,648 40,096
Engineering & Technology Co. and its subsidiaries
Technical services 56,338 27,170
Meishan Company and its Transportation and 68,088 24,729

2016 Semi-annual Report
129 / 151
Related party Details of connected transaction
Amount in the period
Amount in the same period last year
subsidiaries technical services
Baosteel Special Steel and its subsidiaries
Transportation and technical services
21,404 38,300
Baosteel Stainless Transportation and technical services
19,216 40,753
Baosteel Development and its subsidiaries
Technical services 9,671 13,719
Baosteel Group Technical services 21,573 9,916
Baosteel Resources (International) and its subsidiaries
Transportation and technical services
14,824 91,797
Ningbo Baoxin Technical services 11,170 8,882
Xinjiang Bayi and its subsidiaries Technical services 19,411 21,445
Guangdong Shaoguan Transportation service
1,609
BNA Transportation and technical services
71,986 53,267
Guangzhou JFE Steel Sheet Company Ltd.
Transportation and technical service
10,253
Others Transportation and technical services
66,457 37,957
Total 424,041 409,640
(2) Related Commissioned Management/Contracting and Entrusted Management/Contract Awarding
√Applicable □Not applicable The Company’s entrusted management/contracting
Unit: RMB 1,000
Name of commissioni
ng party
Name of commissione
d party
Type of commissioned
assets
Amount of commissioned management
assets at the end of the reporting
period
Amount of accumulative commissioned
management assets at the end of the reporting period
Income achieved in
this reporting
period
Baoshan Iron & Steel
Hwabao Trust
Funds and trust financial
management products
2,680,000 3,108,000 115,000
Baoshan Iron & Steel
Hwabao Investment
Funds and trust financial
management products
13,000 13,500 0
(3) Related Lease
□Applicable √Not applicable
(4) Related Guarantee
□Applicable √Not applicable
(5) Borrowing Funds of Related Parties
□Applicable √Not applicable
(6) Asset Transfer and Debt Restructuring of Related Parties
□Applicable √Not applicable
(7) Remuneration of Critical Management
□Applicable √Not applicable
(8) Other Connected Transactions
Unit: RMB 1,000

2016 Semi-annual Report
130 / 151
Category of connected transaction Note Amount in the
period Amount in the same
period last year
Payment for land use rights and leasing of houses, vehicles and equipment
Note 1 165,748
235,059
Income from land use rights and leasing of houses and equipment
Note 1 47,050
24,622
Financial service revenues Note 2 25,480 84,411
Financial service expenditures Note 3 86,441 126,967
Note 1: Upon the establishment of the Company, a 20-year Lease Agreement was entered into by and between Baosteel Group and the Company, whereby Baosteel Group will rent out the plant land to the Company. In September 2001, Baosteel Group signed another 20-year Lease Agreement with the Company for the plant land under the phase-III assets acquisition project. In November 2002, Baosteel Group signed another 20-year Lease Agreement with the Company for the plant land of some newly-acquired assets under custody. In November 2010, due to the increase in the tenure tax, the Supplementary Agreement on Tenure Lease was signed by and between Baosteel Group and the Company, whereby the land-use fees of the Company have been increased.
The Group rents houses from Baosteel Group, Baosteel-NSC/Arcelor Automotive Steel Sheets Co., Ltd. and Baosteel Metal Co., Ltd., rents automobile from Baosteel Developing Co., Ltd. and its subsidiaries as well as Baosteel Metal Co., Ltd. and its subsidiaries, and rents equipment from Shanghai Baosteel Stainless Steel Trading Co., Ltd. Meanwhile, Baosteel Resources Limited and its subsidiaries, Baosteel-NSC/Arcelor Automotive Steel Sheets Co., Ltd. rent the house from the Group, Shanghai Meishan Iron & Steel Co., Ltd. rents land use right from the Group, and Baosteel Special Steel rents the equipment from the Group.
Note 2: The Group, through the Finance Co., a subsidiary of the Company, provides Baosteel Group and its subsidiaries with financial services (loans, discounting, entrusted loans, etc.), and as a result receives interest incomes from loans, discount interest incomes, entrusted loan handling charges, etc.
Note 3: The Group takes the deposits from Baosteel Group and its subsidiaries and pays them the interest thereon. The RMB deposit interest rates are subject to the interest rates specified by the People’s Bank of China.
6. Accounts Receivable and Payable of Related Parties
√Applicable □Not applicable
(1) Notes Receivable
Unit: RMB 1,000
Item Related party
Ending balance Beginning balance
Book balance Bad debt reserve
Book balance Bad debt reserve
Notes receivable
Baosteel Special Steel and its subsidiaries
103,530 274,390
Notes receivable
Baosteel Development and its subsidiaries
44,375 39,157
Notes receivable
Meishan Company and its subsidiaries
83,002 900
Notes receivable
Baosteel Metal and its subsidiaries
174,270 85,568
Notes receivable
Engineering & Technology Co. and its subsidiaries
13,959 23,502
Notes receivable
Ningbo Baoxin and its subsidiaries
1,632 7,206
Notes receivable
Xinjiang Bayi and its subsidiaries 1,470 2,100
Notes receivable
Baosteel Resource and its subsidiaries
1,704 500
Notes receivable
Desheng Stainless Steel and its subsidiaries
100
Notes receivable
Guangdong Shaoguan Steel and its subsidiaries
128,857
Notes receivable
Guangzhou JFE 586 288
Notes receivable
Other 1,000 49,420

2016 Semi-annual Report
131 / 151
Notes receivable
Total 554,385 483,131
(2) Accounts Receivable
Unit: RMB 1,000
Item Related party
Ending balance Beginning balance
Book balance Bad debt reserve
Book balance Bad debt reserve
Accounts receivable
Meishan Company and its subsidiaries
605,947 464,442
Accounts receivable
Guangdong Shaosteel and its subsidiaries
57,127 86,068
Accounts receivable
Baosteel Special Steel and its subsidiaries
534,955 356,413
Accounts receivable
BNA 282,013 152,377
Accounts receivable
Baosteel Stainless 86,888 138,277
Accounts receivable
Engineering & Technology Co. and its subsidiaries
160,881 137,454
Accounts receivable
Baosteel Metal and its subsidiaries
19,087 18,048
Accounts receivable
Baosteel Development” and its subsidiaries
97,177 76,873
Accounts receivable
Ningbo Baoxin and its subsidiaries
13,068 13,146
Accounts receivable
Baosteel Group 12,868 14,266
Accounts receivable
Baosteel Resources and its subsidiaries
139,079 103,932
Accounts receivable
Desheng Stainless Steel and its subsidiaries
6,933 12,477
Accounts receivable
Welding Co. 10,280 27,180
Accounts receivable
Xinjiang Bayi and its subsidiaries
73,740 78,489
Accounts receivable
Hwabao Trust 9,304 10,077
Accounts receivable
Guangzhou JFE 8,433 8,708
Accounts receivable
Beijing Youth 1,315 1,314
Accounts receivable
Others 82,943 5,066
Accounts receivable
Total 2,202,038 1,704,607
(3) Prepayment
Unit: RMB 1,000
Item Related party
Ending balance Beginning balance
Book balance Bad debt reserve
Book balance Bad debt reserve
Prepayment BNA 576,254 986,836
Prepayment Baosteel Resources and its subsidiaries
230,063 107,173
Prepayment Xinjiang Bayi and its subsidiaries
44,565 91,343
Prepayment Guangdong Shaosteel and its subsidiaries
523,860 240,611
Prepayment Baosteel Stainless 8,453 82,191
Prepayment Engineering & Technology Co. and its subsidiaries
63,701 81,632
Prepayment Baosteel Metal and its 139,752 33,176

2016 Semi-annual Report
132 / 151
subsidiaries
Prepayment Baosteel Special Steel and its subsidiaries
6,832 7,343
Prepayment Meishan Company and its subsidiaries
231,139 9,533
Prepayment Ningbo Baoxin and its subsidiaries
- 90,637
Prepayment Guangzhou JFE 13,364 37,015
Prepayment Others 26,329 134
Prepayment Total 1,864,312 1,767,624
(4) Interest Receivable
Unit: RMB 1,000
Item Related party
Ending balance Beginning balance
Book balance Bad debt reserve
Book balance Bad debt reserve
Interest Receivable
Shanghai Stainless (note)
25,030 168,115
Interest Receivable
Baosteel Special Steel (note)
18,291 122,853
Interest Receivable
Total 43,321 290,968
Note: For interests receivable from Shanghai Stainless and Baosteel Special Steel, please see note (V), 6(1).
(5) Other Accounts Receivable
Unit: RMB 1,000
Item Related party
Ending balance Beginning balance
Book balance
Bad debt reserve
Book balance Bad debt reserve
Other Accounts Receivable
Baosteel Stainless 20,972 20,119
Other Accounts Receivable
Baosteel Development and its subsidiaries
10,252 11,462
Other Accounts Receivable
Baosteel Special Steel and its subsidiaries
199 171
Other Accounts Receivable
Welding Co. 2,026 1,166
Other Accounts Receivable
Guangdong Shaosteel and its subsidiaries
850 2,020
Other Accounts Receivable
Meishan Company and its subsidiaries
9,875 3,389
Other Accounts Receivable
Shandong Baohua 314 -
Other Accounts Receivable
Xinjiang Bayi and its subsidiaries 245 692
Other Accounts Receivable
Engineering & Technology Co. and its subsidiaries
512 -
Other Accounts Receivable
Baosteel Group - 5,960
Other Accounts Receivable
Baohua International 1,253 1,753
Other Accounts Receivable
Hwabao Trust 3,032 3,231
Other Accounts Receivable
Ningbo Baoxin and its subsidiaries 269 126
Other Accounts Receivable
Others 21,883 4,666
Other Accounts Receivable
Total 71,682 54,755
(6) Non-current Assets Due Within One Year
Unit: RMB 1,000

2016 Semi-annual Report
133 / 151
Item Related party
Ending balance Beginning balance
Book balance Bad debt reserve
Book balance Bad debt reserve
Non-current Assets Due Within One Year
Shanghai Stainless (Note)
2,600,000 2,600,000
Non-current Assets Due Within One Year
Baosteel Special Steel (Note)
1,900,000 1,900,000
Non-current Assets Due Within One Year
Total 4,500,000 4,500,000
Notes: Please see Note (V) 11 and note 1 for non-current assets due within one year of Shanghai Stainless and Baosteel Special Steel.
(7) Loans and Advances to Customers
Unit: RMB 1,000
Item Related party
Ending balance Beginning balance
Book balance
Bad debt reserve
Book balance Bad debt reserve
Loan and discount
Xinjiang Bayi and its subsidiaries - 500,000
Loan and discount
Baosteel Resources and its subsidiaries
165,844 350,715
Loan and discount
Engineering & Technology Co. and its subsidiaries
182,140 62,197
Loan and discount
Baosteel Metal and its subsidiaries 32,000 32,000
Loan and discount
Welding Co. 60,000 80,000
Loan and discount
Guangdong Shaosteel and its subsidiaries
18 149,127
Loan and discount
Wuhan BaoHan Welding 2,000
Loan and discount
Total 442,002 1,174,039
(8) Long-term Accounts Receivable
Unit: RMB 1,000
Item Related party
Ending balance Beginning balance
Book balance
Bad debt reserve
Book balance Bad debt reserve
Long-term Accounts
Receivable Shanghai Stainless (note) - 2,600,000
Long-term Accounts
Receivable Baosteel Special Steel (note) - 1,900,000
Long-term Accounts
Receivable
Engineering & Technology Co. and its subsidiaries
- 3,750
Long-term Accounts
Receivable
Total - 4,503,750
Notes: Please see Note (V) 15 note 1 for long-term accounts receivable of Shanghai Stainless and Baosteel Special Steel.
(9) Deposits and Due to Banks
Unit: RMB 1,000
Item Related party
Ending balance Beginning balance
Book balance
Bad debt reserve
Book balance
Bad debt reserve
Deposits and Due to Banks
Baosteel Group 5,099,106 8,150,003
Deposits and Due to BNA 531,626 910,436

2016 Semi-annual Report
134 / 151
Banks
Deposits and Due to Banks
Hwabao Trust 130,471 170,637
Deposits and Due to Banks
Baosteel Development 134,702 137,219
Deposits and Due to Banks
Engineering & Technology Co. and its subsidiaries
3,836 27,716
Deposits and Due to Banks
Iron & Steel Research Institute 50,311 51,002
Deposits and Due to Banks
Baosteel Resources and its subsidiaries
15,424 58,217
Deposits and Due to Banks
Hwabao Investment 480,211 160,006
Deposits and Due to Banks
Guangdong Shaosteel and its subsidiaries
111,484 190,321
Deposits and Due to Banks
Others 9,570 45,501
Deposits and Due to Banks
Total 6,566,741 9,901,058
(10) Notes Payable
Unit: RMB 1,000
Item Related party Ending book balance Beginning book balance
Notes Payable BNA 738,563 805,214
Notes Payable Meishan Company and its subsidiaries
1,629 32,726
Notes Payable Ningbo Baoxin and its subsidiaries
118,945 150,608
Notes Payable Baosteel Special Steel and its subsidiaries
11,186 19,475
Notes Payable Baosteel Stainless 9,047 54,707
Notes Payable Engineering & Technology Co. and its subsidiaries
141,113 175,050
Notes Payable Baosteel Development and its subsidiaries
75,790 103,788
Notes Payable Guangdong Shaosteel and its subsidiaries
- 1,451
Notes Payable Baosteel Resources and its subsidiaries
597,722 399,302
Notes Payable Xinjiang Bayi and its subsidiaries - 6,040
Notes Payable Total 1,693,995 1,748,361
(11) Accounts Payable
Unit: RMB 1,000
Item Related party Ending book balance Beginning book balance
Accounts Payable
Baosteel Stainless 870,149 878,033
Accounts Payable
Baosteel Resources and its subsidiaries
664,801 450,535
Accounts Payable
Engineering & Technology Co. and its subsidiaries
936,510 820,478
Accounts Payable
Meishan Company and its subsidiaries
804,200 730,804
Accounts Payable
Baosteel Development and its subsidiaries
479,623 349,414
Accounts Payable
BNA 153,972 148,273
Accounts Payable
Ningbo Baoxin and its subsidiaries
240,230 403,923
Accounts Payable
Baosteel Group 121,041 5,599
Accounts Payable
Baosteel Special Steel and its subsidiaries
138,988 143,378

2016 Semi-annual Report
135 / 151
Accounts Payable
Shanghai Stainless 41,010 -
Accounts Payable
Welding Co. 4,935 14,468
Accounts Payable
Others 82,936 65,533
Accounts Payable
Total 4,538,395 4,010,438
(12) Advance Receipts
Unit: RMB 1,000
Item Related party Ending book balance Beginning book balance
Advance Receipts Baosteel Metal and its subsidiaries 213,692 229,862
Advance Receipts Baosteel Development and its subsidiaries
49,476 46,295
Advance Receipts Engineering & Technology Co. and its subsidiaries
28,713 20,351
Advance Receipts Guangzhou JFE 12,775 42,850
Advance Receipts Meishan Company and its subsidiaries
73,562 73,859
Advance Receipts Xinjiang Bayi and its subsidiaries 9,655 10,593
Advance Receipts Tianjin BCM 14 1,263
Advance Receipts Hangzhou Baowei 106,240 79,614
Advance Receipts Wuxi Baomit 6,303 6,402
Advance Receipts Guangdong Shaogang and its subsidiaries
55,039 193
Advance Receipts Ningbo Baoxin and its subsidiaries 4,548 4,649
Advance Receipts Baosteel Special Steel and its subsidiaries
6,608 6,608
Advance Receipts Ergang and its subsidiaries 200 200
Advance Receipts Pudong Steel and its subsidiaries 153 153
Advance Receipts Baosteel Stainless - 7,731
Advance Receipts Welding Co. 1,392 1,428
Advance Receipts Others 93,223 36,893
Advance Receipts Total 661,593 568,944
(13) Interest Payable
Unit: RMB 1,000
Item Related party Ending book balance Beginning book balance
Interest Payable Baosteel Group 48,160 55,616
Interest Payable Iron & Steel Research Institute
707 434
Interest Payable Others 519 647
Interest Payable Total 49,386 56,697
(14) Other Accounts Payable
Unit: RMB 1,000
Item Related party Ending book balance Beginning book balance
Other Accounts Payable
Baosteel Group 5,806 5,842
Other Accounts Payable
Engineering & Technology Co. and its subsidiaries
2,008 3,449
Other Accounts Payable
Baosteel Resources and its subsidiaries
2,103 2,108
Other Accounts Payable
Baosteel Development and its subsidiaries
1,990 2,085

2016 Semi-annual Report
136 / 151
Other Accounts Payable
Baosteel Metal and its subsidiaries
706 665
Other Accounts Payable
Meishan Company and its subsidiaries
1,127 924
Other Accounts Payable
Baosteel Special Steel and its subsidiaries
200 200
Other Accounts Payable
No. 5 Steel Company and its subsidiaries
10 3
Other Accounts Payable
Others 1,530 313
Other Accounts Payable
Total 15,480 15,589
XI. Share-based payment
1. Share-based payment
√Applicable □Not applicable
At the 1st temporary general meeting of shareholders of 2014 held on May 20, 2014, A-Share Restricted Stock Ownership Incentive Scheme of Baoshan Iron & Steel Co., Ltd., the Phase-I Grant Program Under the A-Share Restricted Stock Ownership Incentive Scheme of Baoshan Iron & Steel Co., Ltd. and relevant proposals were reviewed and approved. At the 15th meeting of the 5th Board of Directors of the Company held on May 22, 2014, the Proposal for Determination of the Incentive Targets and Respective Grant Quantities of A-Share Restricted Stock Ownership Incentive Scheme and the Proposal for the Implementation of Phase I Program of the A-Share Restricted Stock Ownership Incentive Scheme were reviewed and approved. According to the incentive object list and granting quantity authorized by the Board of Directors, the Company repurchased A ordinary share of the Company from Shanghai Stock Exchange through the open bidding for taking it as the source of the incentive object getting the restricted stock since May 23, 2014. According to the regulations of restricted stock plan, two years after the grant date of restricted stock is lock-up period. Within the lock-up period, the granted restricted stock of incentive object will be locked according to the plan and shall not be transferred. Three years after the next day upon the expiry of lock-up period are the unlocking period. In any year within the unlocking period, if the unlocking conditions of restricted stock are reached, incentive object can apply for unlocking and legal transfer of the restricted stock held through the plan at constant unlocking speed (i.e., unlock with the proportion of 1/3 of each year within the unlocking period). Restricted stocks which are not unlocked due to failing to reach the unlocking conditions of the year shall be repurchased by the Company with the granting price.
As of June 11, 2014, the stock repurchase for equity incentive plan has been completed. The Company repurchased 47,446,100 shares with RMB 187,734,750.08 of repurchase cost. These shall be included in the treasury stock.
According to the provisions of the first granting scheme, the number of incentive object under equity incentive plan to whom the Company grants the repurchased stock was 136, total number of shares was 47,446,100, granting price was 1.91 Yuan/share, and incentive objects paid RMB 90,622,051.00 Yuan for subscription of restricted stock. The Company conducted the confirmation of a liability in full regarding to the repurchase obligation of restricted stock and handled as acquired the treasury stock. As of June 24, 2014, 47,446,100 shares initially granted have changed from non-restricted outstanding shares to restricted outstanding shares, and all the transfer procedures of initial share grant have been completed.
On December 16, 2014, the Company repurchased with the granting price and canceled 434,400 shares and 264,500 shares of restricted stock having not reached the unlocking conditions and respectively held by Mr. Zhang Yong and Ms. Zhang Xiaobo who are the incentive object under the initial granting scheme of the restricted stock plan, with repurchase cost of RMB 1,334,899.00. A few days ago, 698,900 shares among the above restricted stock have been transferred to the special security account for repurchase opened by the Company, and have been canceled on December 16, 2014. Meanwhile, the Company has reduced capital stock and capital reserve by 698,900 Yuan and 635,999 Yuan respectively, and reduced treasury stock by 1,334,899 Yuan.
In 2015, the Company repurchased with the granting price and canceled 488,700 shares held by Li Shiping, 434,400 shares held by Fu Jianguo, 434,400 shares held by Hu Yuliang, 380,100 shares held by Jia Yiyun, 264,500 shares respectively held by Pei Shibing, Sun Dale and Lu Junyong, and 488,700 shares respectively held by Guo Bin and Hou Angui of restricted stock having not reached the unlocking conditions and respectively, who are the incentive objects under the initial granting scheme of the restricted stock plan. Therefore, the Company has reduced stock capital of RMB 3,508,500.
During the reporting period, the Company did not have restricted stock released and newly granted.

2016 Semi-annual Report
137 / 151
According to China’s policies and relevant provisions of the Company’s restricted stock, 2 incentive objects have been adjusted to exit the restricted stock scheme, as reviewed and approved by 6th session of sixth Board of Directors on March 29, 2016. 590,300 shares of restricted stock failing to reach the releasing conditions shall be purchased back by the Company at the granting price and cancelled on May 25, 2016. Therefore, the Company’s stock capital has reduced by RMB 590,300, with registered capital of RMB 16,466,927,224 then.
As approved by the 7th meeting of the sixth board of directors on April 27, 2016, 1/3 of restricted stock granted to the incentive objects in the first rewarding plan shall not be released and shall be repurchased by the Company (which is now in progress) due to such indexes as 2015 total operating revenue failing to reach the first release condition.
Specific situations on adjustment of above incentive object of restricted stock plan have been disclosed, and for details please visit the website of Shanghai Stock Exchange, http://www.sse.com.cn
Unite: share Currency: RMB
Total amount of equity instruments granted by the Company in the reporting period
Total amount of equity instruments exercised by the Company in the reporting period
Total amount of equity instruments of the Company which become invalid in the reporting period
590,300
Exercise price range and reaming contract term of outstanding stock option issued by the Company at the end of the period
Exercise price range and reaming contract term of other outstanding equity instruments issued by the Company at the end of the period
2. Stock Payment Measured at Equity
√Applicable □Not applicable Unit: RMB
Determination method of fair value of equity instruments on grant date
Based on performance conditions estimate of each unlocking period as stipulated in the restricted stock plan
Basis of determining the number of investing equity instruments
Based on unlocking conditions of each unlocking period as stipulated in the restricted stock plan
Reason for significant difference of estimate between current period and prior period
Total equity-settled share-based payment in exchange of employee service
43,970,875.32
Aggregate amount of equity-settled share-based payment included in capital reserves
26,911,586.73
Total expenses recognized by equity-settled share-based payment in current period
6,458,780.82
3. Method for Determination of Fair Value of Equity Instruments at the Grant Date
For any equity instrument granted by the Group, the fair value at the grant date is calculated and determined using the “Black Scholes Option Pricing Model” based on the market value of the Company’s stock at the grant date, as well as estimated in combination with conditions and terms of stock option. Parameters selected for the model are as follows:
Estimated share price fluctuation rate (%) 18.3-22.9
Risk-free interest rate (%) 2.7-2.9
Estimated waiting period (year) 2-5
Share price at grant date (RMB/share) 3.86
The fluctuation ratio is the historical stock price fluctuation ratio of the Company, and estimated unlocking period is a forecast according to the annual transfer rate of the shares held by the incentive object, but probably is not the actual result.
Fair value of the restricted stock on grant date is shown in the table below:
Restricted stock which can be unlocked within 1 year 3.59 yuan/ per share

2016 Semi-annual Report
138 / 151
after the expiry of lock-up period
Restricted stock which can be unlocked within 2 year after the expiry of lock-up period
3.51 yuan/ per share
Restricted stock which can be unlocked within 3 year after the expiry of lock-up period
3.36 yuan/ per share
4. Share-based Payment by Cash Settlement
□Applicable√Not applicable
5. Modification and Termination of Share-based Payment
None.
XII. Commitments and Contingencies
1. Important Commitments
√Applicable □Not applicable Important commitments with the nature and amount on the date of balance sheet (1) Capital Commitments
Unit: RMB 1,000
Ending balance Balance at the beginning of
the year
Capital commitments that have been entered into but have not been recognized in the financial statements:
Contracted but not provided 10,150,214 15,863,814
Approved by the Board but not contracted 5,563,004 2,715,314
Total 15,713,218 18,579,128
(2) Operating Lease Commitments
As of the balance sheet date, the non-cancellable operating leases signed by the Group with external parties are listed as follows:
Unit: RMB 1,000
Ending balance Balance at the beginning of
the year
Minimum lease payment for irrevocable operating lease:
1st year after the balance sheet date 317,395 401,927
2nd year after the balance sheet date 289,724 382,436
3rd year after the balance sheet date 267,694 351,049
Subsequent years 1,269,012 1,238,037
Total 2,143,825 2,373,449
2. Contingencies
□Applicable √Not applicable
XIII. Events post the Balance Sheet Date
1. Significant non-adjusting events
□Applicable √Not applicable
2. Profit Distribution
□Applicable √Not applicable
3. Sales Return
□Applicable √Not applicable
4. Notes to Other Events Post Balance Sheet Date
None
XIV. Other Significant Events
1. Previous Accounting Error Correction
□Applicable √Not applicable

2016 Semi-annual Report
139 / 151
2. Debt Restructuring
□Applicable √Not applicable
3. Asset Replacement
□Applicable √Not applicable
4. Annuity Plan
√Applicable □Not applicable
In accordance with the Reply to Trial Implementation of Enterprise Annuity System by Baosteel Group (GZFP [2008] No. 1268) issued by the State-owned Assets Supervision and Administration Commission of the State Council and the Notification on Clarifying Relevant Issues on Ratio of Enterprise Annuity Payment Made by Enterprise issued by the HR Dept. of Baosteel Group, since January 1, 2008, the Company has implemented the enterprise annuity plan. Wherein, the portions paid by enterprises shall be accrued by 4% of the base of payment made by employees in person (wage incomes in the previous year subject to capping and minimum guarantee); the portions paid by employees in person shall be paid by 1%-7% of the base of payment made by employees in person and for the account of employees in person. Since 2009, Hwabao Trust Co., Ltd., a subsidiary of Baosteel Group, has been authorized to conduct management for the aforesaid enterprises annuities.
5. Discontinued Operations
□Applicable √Not applicable
6. Segments
□Applicable √Not applicable
(1) Determination Basis and Accounting Policy of Reporting Segments
According to the internal organizational structure, management requirement and internal reporting system of the Group, the operating business is classified into six operating segments, whose operating results are regularly evaluated by the management personnel of the Group to determine the allocated resources and business performance. Six reporting segments are determined on the basis of operating segments, including the iron & steel manufacturing segment, processing and distribution segment, IT segment, e-commerce segment, chemical segment and financial segment. The day-to-day activities of Finance Co. are of a financial nature, so the operating revenue of each segment includes investment incomes of the Finance Co. These reporting segments are determined based on the business structure of the Group.
Segments are summarized as follows:
Operating segments include the following subsidiaries (1) Iron & steel manufacturing subsidiaries: the Company, Meishan Steel, Lubao Steel Tube, Huangshi Coating
& Galvanizing, Yantai Lubao Steel Tube, Baosteel Nantong Steel, Baoma Steel Pipe, Poly Pipe, Zhanjiang Steel and so on;
(2) Iron & steel sales trading subsidiaries: Baosteel International, Baosteel America, Baosteel Europe, Baosteel Singapore, Howa Trading, Bao-Island Enterprises, BGM and other trading subsidiaries;
(3) IT: Bassinet Software;
(4) E-commerce: Ouyeel, B-chem;
(5) Chemical: Baosteel Chemical; (6) Finance: Finance Co. For the disclosure of the operating information of the Group, the revenues shall be disclosed by the regions where the customers are located; the assets shall be disclosed by the regions where assets are located.
The operating profit of each segment does not include financial costs, assets impairment losses, changes in fair value recognized in profit or loss, and investment incomes (other than the Finance Co.) incurred by each segment. The assets of each segment do not include deferred income tax assets. The liabilities of each segment do not include short-term borrowings, non-current liabilities due in one year, long-term borrowings, long-term accounts payable, bonds payable and deferred income tax liabilities.
The information contained in the segmental report shall be disclosed according to the accounting policies and measuring criterion with which each segment reports to the management. The measuring basis remains identical with the accounting and measuring basis for the compilation of the financial statements.
The sales to individual customer of the Group has not accounted for more than 10% of the total revenue.

2016 Semi-annual Report
140 / 151
(2) Financial Information of Reporting Segments
Unit: RMB 1,000
Item (Current period) Iron and steel manufacture
Processing and distribution
Information technology
E-commerce Chemical Finance Inter-segment
offset Total
Operating revenues
Revenues from transactions with external parties
9,503,569 55,547,417 1,154,024 10,538,568 1,249,169 178,776 78,171,523
Revenues from inter-segment transactions
38,947,347 11,337,127 562,951 1,445,013 2,318,483 68,463 54,679,384
Total operating revenue of segments
48,450,916 66,884,544 1,716,975 11,983,581 3,567,652 247,239 54,679,384 78,171,523
Operating expenses 43,065,359 65,338,000 1,557,271 12,108,093 3,456,285 152,650 53,828,594 71,849,064
Operating profit 5,385,558 1,546,544 159,704 -124,513 111,367 94,589 850,790 6,322,459
Total assets of segments
241,269,126 54,711,767 6,423,475 6,176,203 5,308,104 15,064,613 64,368,803 264,584,485
Total liabilities of segments
46,936,655 26,356,380 2,346,517 2,940,740 1,382,221 13,208,625 32,865,158 60,305,980
Supplementary information:
0
5,391,616 302,089 57,305 34,999 179,087 4,627 0 5,969,723
Depreciation and amortization expenses
121,552 304,565 -22,880 1,076 -7,374 14,596 109,476 302,059
Losses on impairment recognized for the current period
7,994,109 311,698 264,185 33,495 70,477 32 0 8,673,996
Unit: RMB 1,000
Item (Same period last year)
Iron and steel manufacture
Processing and
distribution
Information technology
E-commerce Chemical Finance Inter-segment offset Total
Operating revenues
Revenues from transactions with external parties
9,845,027 61,194,179 1,031,347 7,280,135 1,416,913 238,548 81,006,149
Revenues from inter-segment transactions
41,591,779 11,613,030 577,685 426,016 2,477,646 83,418 56,769,574
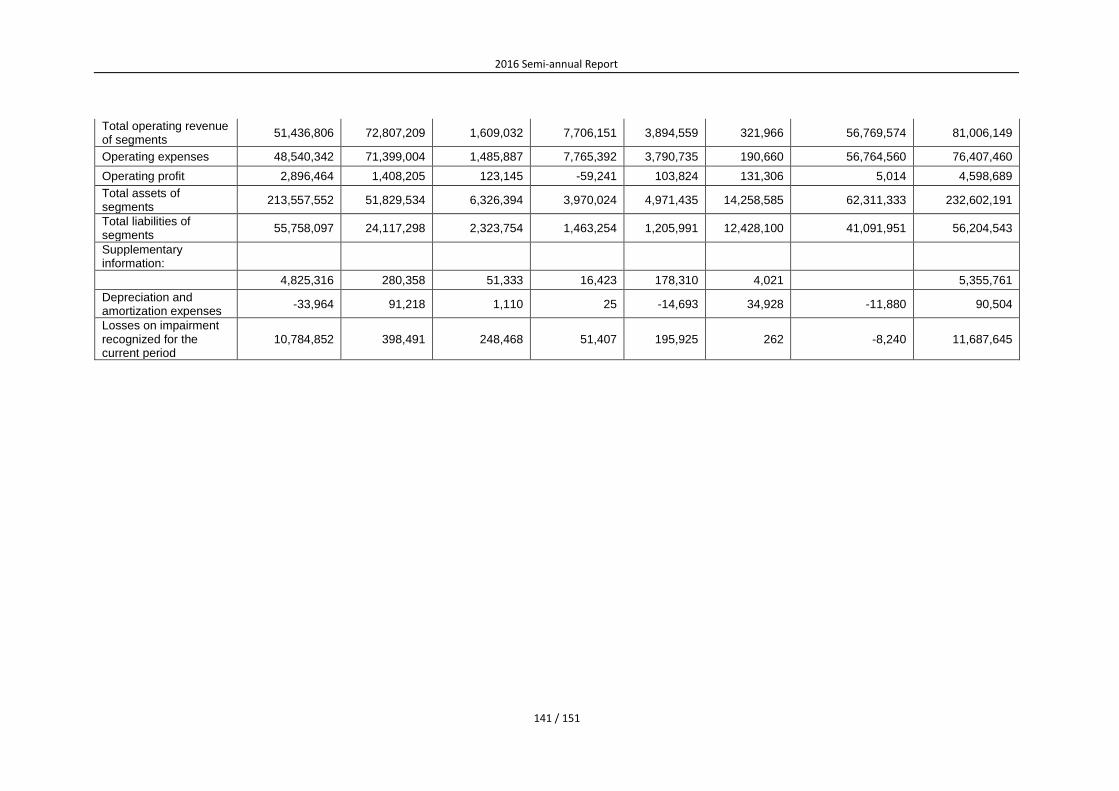
2016 Semi-annual Report
141 / 151
Total operating revenue of segments
51,436,806 72,807,209 1,609,032 7,706,151 3,894,559 321,966 56,769,574 81,006,149
Operating expenses 48,540,342 71,399,004 1,485,887 7,765,392 3,790,735 190,660 56,764,560 76,407,460
Operating profit 2,896,464 1,408,205 123,145 -59,241 103,824 131,306 5,014 4,598,689
Total assets of segments
213,557,552 51,829,534 6,326,394 3,970,024 4,971,435 14,258,585 62,311,333 232,602,191
Total liabilities of segments
55,758,097 24,117,298 2,323,754 1,463,254 1,205,991 12,428,100 41,091,951 56,204,543
Supplementary information:
4,825,316 280,358 51,333 16,423 178,310 4,021 5,355,761
Depreciation and amortization expenses
-33,964 91,218 1,110 25 -14,693 34,928 -11,880 90,504
Losses on impairment recognized for the current period
10,784,852 398,491 248,468 51,407 195,925 262 -8,240 11,687,645

2016 Semi-annual Report
142 / 151
(3) Foreign Transaction Revenue by Income Source and Non-current Assets by Location
Unit: RMB 1,000
Item Amount in the period
Amount in the same period last year
Revenues from transactions with external parties in China
68,848,402 71,423,485
Revenues from transactions with external parties outside China
9,323,121 9,582,664
Total 78,171,523 81,006,149
Unit: RMB 1,000
Item Ending balance
Balance at the beginning of the year
Non-current assets located in China 159,558,794 162,207,582
Non-current assets located outside China 3,720,505 2,012,581
Total 163,279,299 164,220,163
` Revenues from transactions with external parties include:
Unit: RMB 1,000
Item Amount in the period Amount in the same
period last year
Investment incomes of the Finance Company 60,211 62,495
Items not included in segment-specific operating profits, assets and liabilities are presented as follows:
Segment-specific operating profits do not include:
Unit: RMB 1,000
Item Amount in the period
Amount in the same period last year
Financial costs 1,156,767 444,272
Losses from assets impairment/(write-back) 302,059 90,505
Losses/gains on variation in fair values 47,255 -2,214
Investment incomes (other than the Finance Company)
-295,640 -368,283
Total 1,210,441 164,280
Segment-specific assets do not include:
Unit: RMB 1,000
Item Ending balance Balance at the
beginning of the year
Deferred income tax assets 1,680,837 1,520,956
Segment-specific liabilities do not include: Unit: RMB 1,000
Item Ending balance Balance at the
beginning of the year
Short-term borrowings 33,610,254 27,111,032
Non-current liabilities due within one year 113,909 208,115
Other current liabilities 20,334,174 10,057,344
Long-term borrowings 11,680,751 9,111,026
Long-term payables 81,458 82,586
Bonds payable 13,964,217 8,747,374
Deferred income tax liabilities 487,989 454,702
Total 80,272,752 55,772,179

2016 Semi-annual Report
143 / 151
XV. Notes to Main Items of the Financial Statement of the Parent Company
1. Accounts Receivable
(1) Account Age of Accounts Receivable
Unit: RMB
Age
Ending balance Balance at the beginning of the year
Amount Ratio (%) Bad debt reserve Book value Amount Ratio (%) Bad debt reserve Book value
Within 1 year 13,742,113,094.03 83 18,681,780.17 13,723,431,313.86 13,397,632,571.61 92 13,791,861.10 13,383,840,710.51
1-2 years 2,212,322,253.86 14 239,451.14 2,212,082,802.72 777,498,367.05 5 87,572.16 777,410,794.89
2-3 years 391,300,519.64 2 16,319.75 391,284,199.89 275,909,400.52 2 164,881.58 275,744,518.94
Over 3years 179,679,667.41 1 28,781,264.14 150,898,403.27 113,880,332.49 1 22,086,689.81 91,793,642.68
Total 16,525,415,534.94 100 47,718,815.20 16,477,696,719.74 14,564,920,671.67 100 36,131,004.65 14,528,789,667.02
(2) Accounts Receivable Disclosed by Category:
Unit: RMB
Category
Ending balance Beginning balance
Book balance Bad-debt provision
Book Value
Book balance Bad-debt provision
Book Value Amount
Proportion (%)
Amount Provision proportion
(%) Amount
Proportion (%)
Amount Provision proportion
(%)
Other accounts receivable with significant single amount and individual bad debt provision 13,641,433,583.84 83 - - 13,641,433,583.84 12,575,050,722.06 86 - - 12,575,050,722.06
Other accounts receivable with bad debt provision according to credit risk characteristics combination 2,855,200,686.96 17 18,937,551.06 1 2,836,263,135.90 1,967,783,259.80 14 14,044,314.84 1 1,953,738,944.96
Receivables with bad-debt provisions made individually in spite of insignificant single amounts 28,781,264.14 28,781,264.14 100 - 22,086,689.81 - 22,086,689.81 100 -
Total 16,525,415,534.94 / 47,718,815.20 / 16,477,696,719.74 14,564,920,671.67 / 36,131,004.65 / 14,528,789,667.02

2016 Semi-annual Report
144 / 151
EOP accounts receivable with significant single amounts or without significant single amount but with individual bad-debt provisions
√Applicable □Not applicable Unit: RMB
Accounts receivables (By unit)
Ending balance
Accounts receivables
Bad-debt provisions
Provision proportion (%)
Cause
Large-amount receivables 13,641,433,583.84 - 注 1
Receivables with relatively long age
28,781,264.14 28,781,264.14 100 注 2
Total 13,670,214,847.98 28,781,264.14 / /
Unit: RMB
Accounts receivables (By unit)
Beginning balance
Accounts receivables Bad-debt provisions
Provision proportion (%)
Cause
Large-amount receivables 12,575,050,722.06 - - 注 1
Receivables with relatively long age
22,086,689.81 22,086,689.81 100 注 2
Total 12,597,137,411.87 22,086,689.81 / /
Note 1: There is no major problem in making collections within a year of account age, and large receivables are all from related parties. According to Company’s provision policy of bad debts reserves, bad debts reserves will not be made with provision.
Note 2: Account age is long and possibility of recovery is small, so receivables with long account age beyond the related parties shall conduct the provision of bad debts reserves in full.
In the combination, receivables using account age for bad debts reserves provision:
√Applicable □Not applicable Unit: RMB
Account age
Ending balance
Accounts receivable Bad-debt provisions Provision proportion
(%)
Subtotal of within 1 year 2,430,368,025.80 18,681,780.17 1
1-2 years 33,118,519.53 239,451.14 1
2-3 years 366,499,770.11 16,319.75 -
3 years or more 25,214,371.52 - -
Total 2,855,200,686.96 18,937,551.06 1
(3) Bad Debts Reserves Provisioned, Recovered or Transferred back in Current Period:
Bad debts reserves provision in the current period was 20,482,497.49 Yuan; and bad debts reserves recovered or transferred back was 8,894,686.94 Yuan.
(4) Actual Written-off Accounts Receivable in the Reporting Period
□Applicable√Not applicable
(5) Particulars about the accounts receivable, in this reporting period, due from the shareholders each holding shares representing 5% or more of voting rights of the Company
Unit: RMB
Name of Entity Ending balance Balance at the beginning of the year
Amount
Amount of bad-debt provision Amount
Amount of bad-debt provision
Baosteel Group 294,607.18 1,125,650.91 -
(6) Accounts Receivable with Top Five Ending Balance Collected according to the Debtor:
On June 30, 2016, total amounts receivable of top five units was RMB 13,641,433,583.84, accounting for 83% of the total amount of receivables.
(7) Accounts Receivable under Derecognition due to the Transfer of Financial Assets:
There was no accounts receivable under derecognition due to the transfer of financial assets in the current reporting period.

2016 Semi-annual Report
145 / 151
(8) Amount of Assets and Liabilities Formed by Transfer of Accounts Receivable and Continuous Involvement:
There was no amount of assets and liabilities formed by transfer of accounts receivable and continuous involvement in the current reporting period.
2. Other Accounts Receivable
(1) Account Age of Other Accounts Receivable
Unit: RMB
Age
Ending amount Beginning amount
Amount Ratio (%)
Bad debt reserve
Book value Amount Ratio (%)
Bad debt reserve
Book value
Within 1 year
129,975,556.75 48 2,900,967.87 127,074,588.88 112,192,571.16 44 3,075,599.82 109,116,971.34
1-2 years 1,923,973.39 1 190,069.13 1,733,904.26 1,178,114.95 - 164,606.35 1,013,508.60
2-3 years 117,525,179.10 43 271,884.00 117,253,295.10 120,278,558.42 47 755,051.78 119,523,506.64
Over 3years
21,125,966.01 8 4,943,154.00 16,182,812.01 23,955,910.36 9 3,723,534.36 20,232,376.00
Total 270,550,675.25 100 8,306,075.00 262,244,600.25 257,605,154.89 100 7,718,792.31 249,886,362.58
(2) Other Accounts Receivable Disclosed by Category:
Unit: RMB
Category
Ending balance Beginning balance
Book balance Bad-debt provision
Book Value
Book balance Bad-debt provision
Book Value Amount
Proportion (%)
Amount Provision Proportion
(%) Amount
Proportion (%)
Amount Provision Proportion
(%)
Other accounts receivable with significant single amount and individual bad debt provision
207,386,556.05 77 1,676,150.00 1 205,710,406.05 169,651,203.67 66 - - 169,651,203.67
Other accounts receivable with bad debt provision according to credit risk characteristics combination
58,220,965.20 21 1,686,771.00 3 56,534,194.20 84,230,416.86 33 3,995,257.95 5 80,235,158.91
Receivables with bad-debt provisions made individually in spite of insignificant single amounts
4,943,154.00 2 4,943,154.00 100 - 3,723,534.36 1 3,723,534.36 100 -
Total 270,550,675.25 / 8,306,075.00 / 262,244,600.25 257,605,154.89 / 7,718,792.31 / 249,886,362.58
Other EOP accounts receivable with significant single amounts or without significant single amounts but with individual bad-debt provision:
√Applicable □Not applicable Unit: RMB
Accounts receivables (By unit)
Ending balance
Other accounts receivables
Bad debt provision Provision proportion (%)
Cause
Other large-amount receivables 207,386,556.05 1,676,150.00 1 Note 1
Other receivables with bad debt fully provisioned
4,943,154.00 4,943,154.00 100
Total 212,329,710.05 6,619,304.00 / /
Unit: RMB
Accounts receivables (By unit)
Beginning balance
Other accounts receivables
Bad debt provision Provision proportion (%)
Cause
Other large-amount receivables 169,651,203.67 - - Note

2016 Semi-annual Report
146 / 151
Note 1: Such large-amount other accounts receivable were advances for projects, electricity charge deposit, etc., which were with low recovery risk. And the bad debt has not been provisioned against receivables from related parties across the Group. Therefore, other accounts receivable of the Company had a book value balance of RMB 207,386,556.05 (December 31, 2015: RMB 69,651,203.67), with bad debt reserves of RMB 1,676,150.00 provisioned.
In combination, other receivables using account age for bad debt reserves provision:
√Applicable □Not applicable Unit: RMB
Account age
Ending balance
Other accounts receivable
Bad-debt reserve Provision proportion (%)
Subtotal of within 1 year 48,872,016.80 1,224,817.87 3
1-2 years 1,923,973.39 190,069.13 10
2-3 years 5,474,539.00 271,884.00 5
Over 3 years 1,950,436.01 - -
Total 58,220,965.20 1,686,771.00 3
Unit: RMB
Account age
Beginning balance
Other accounts receivable
Bad-debt reserve Provision proportion (%)
Within 1 year 80,252,717.78 3,075,599.82 4
1-2 years 749,780.76 164,606.35 22
2-3 years 3,227,918.32 755,051.78 23
Total 84,230,416.86 3,995,257.95 5
(3) Bad Debts Reserves Provisioned, Recovered or Transferred back in Current Period:
Bad debts reserves provision in the current period was 1,109,049.54Yuan; and bad debts reserves recovered or transferred back was 521,766.85 Yuan.
(4) Other Actual Written-off Account Receivable in the Reporting Period
□Applicable √Not applicable
(5) Particulars about the accounts receivable, in this reporting period, due from the shareholders each holding shares representing 5% or more of voting rights of the Company
Unit: RMB
Entity Name Ending balance Balance at the beginning of the year
Amount Bad-debt provisions Amount Bad-debt provisions
Baosteel Group - - 5,959,916.60 -
(6) Other Receivables with Top Five Ending Balance Collected according to the Debtor:
√Applicable □Not applicable On June 30, 2016, total amount of top five units of amounts receivable of the Company was RMB
207,386,556.05, accounting for 77% of the total amount of receivables.
3. Long-term Equity Investment
√Applicable □Not applicable Unit: RMB
Item
Ending balance Beginning balance
Book balance Impairment provision
Book value Book balance Impairment provision
Book value
Investment in subsidiaries
44,266,491,430.84 948,520,310.51 43,317,971,120.33 43,972,938,406.84 - 43,972,938,406.84
Investment in JV and associated enterprises
2,359,114,240.16 - 2,359,114,240.16 2,281,674,647.40 - 2,281,674,647.40
Total 46,625,605,671.00 948,520,310.51 45,677,085,360.49 46,254,613,054.24 - 46,254,613,054.24
Other receivables with bad debt fully provisioned
3,723,534.36 3,723,534.36
Total 173,374,738.03 3,723,534.36 -

2016 Semi-annual Report
147 / 151
(1) Investment in Subsidiaries
√Applicable □Not applicable Unit: RMB
Investee Beginning balance Current adds Current cuts Ending balance Current provision for
impairment Ending balance of
reserves for impairment
Lubao Steel Tube 872,484,905.16 872,484,905.16
Huangshi Coating & Galvanizing
175,658,477.39 175,658,477.39
Baosteel International 6,013,886,552.67 6,013,886,552.67
Meishan Steel 8,938,982,988.14 8,938,982,988.14
Bassinet Software 1,291,314,360.40 1,291,314,360.40
Baosteel America 187,562,180.98 187,562,180.98
Howa Trading 221,975,780.12 221,975,780.12
Baosteel Europe 328,631,981.58 328,631,981.58
Baosteel Singapore 154,883,364.09 154,883,364.09
Bao-Trans Enterprises 370,550,495.27 370,550,495.27
Baosteel Chemical 3,006,227,819.74 3,006,227,819.74
Finance Co. 754,570,003.65 754,570,003.65
Zhanjiang Steel 17,262,206,889.41 17,262,206,889.41
Yantai Lubao Steel Tube 3,200,000,000.00 3,200,000,000.00
Baosteel Nantong Steel 948,520,310.51 948,520,310.51 948,520,310.51 948,520,310.51
Baoma Steel Pipe 36,673,650.00 36,673,650.00
Baosteel Brazil Trading (Note 1)
728,647.73 728,647.73
Ouyeel Commerce Co., Ltd (Note 2)
208,080,000.00 208,080,000.00
Ouyeel Finance (Note 3) 293,553,024.00 293,553,024.00
Total 43,972,938,406.84 293,553,024.00 44,266,491,430.84 948,520,310.51 948,520,310.51
Note 1: The Company indirectly held 73.04% of stock equity of Baosteel Brazil, which accordingly was considered as a subsidiary and accounted in long term equity investment as per cost method. Note 2: 8.67% of stock equity is directly held by the Company and 42.33% of stock equity is held by Baosteel International, a wholly-owned subsidiary of the Company.
Therefore, the Company has indirectly and directly held 51% stock equity of Ouyeel Commerce, which accordingly was considered as a subsidiary to the Company and accounted in long term equity investment as per cost method.
Note 3: Ouyeel Commerce held 34% stock equity of Ouyeel Finance. Therefore, the Company has indirectly and directly held 54.91% stock equity of Ouyeel Finance, which accordingly was considered as a subsidiary to the Company and accounted in long term equity investment as per cost method.
(2) Investment in JV and Associated Enterprises
√Applicable □Not applicable

2016 Semi-annual Report
148 / 151
Unit: RMB
Investor Beginning balance
Current change
Ending balance
Ending balance of impairment
reserve
Added
investment
Reduced investme
nt
Investment gains and
losses confirmed under the
Equity Method
Other comprehensiv
e income adjustment
Other equity
change
Cash dividend or
profit declared to
issue
Provision for
depreciation
reserve
Others
I.JV
BNA 1,709,806,023.00 61,146,741.51 1,469,371.25 1,772,422,135.76 -
Bao-Island 571,868,624.40 2,705,529.60 12,117,950.40 586,692,104.40 -
Subtotal 2,281,674,647.40 63,852,271.11 12,117,950.40 1,469,371.25 2,359,114,240.16 -
II.associated Enterprises
Total 2,281,674,647.40 63,852,271.11 12,117,950.40 1,469,371.25 2,359,114,240.16 -
4. Operating Revenues and Operating Costs
Unit: RMB
Item Amount in the period Amount in last period
Revenues Costs Revenues Costs
Main operating revenues 43,635,442,094.92 35,641,695,134.28 46,153,469,127.53 40,241,416,896.77
Other operating revenues 155,089,410.50 122,542,141.23 126,841,239.43 276,480,276.94
Total 43,790,531,505.42 35,764,237,275.51 46,280,310,366.96 40,517,897,173.71

2016 Semi-annual Report
149 / 151
5. Investment Income
√Applicable □Not applicable Unit: RMB Yuan
Item Amount in the period Amount in last period
Long-term equity investment incomes calculated using the cost method
80,442,935.49 54,568,841.13
Long-term equity investment incomes calculated using the equity method
63,852,271.11 46,987,962.65
Incomes from held-to-maturity investments 94,243,960.98 67,247,564.47 Incomes/(losses) from disposal of derivative financial instruments
-73,809,000.00 -76,736,435.55
Incomes from financial assets available-for-sale 54,682,861.82 Total 164,730,167.58 146,750,794.52
Note: Losses from above derivative financial instruments are mainly investment losses from forward exchange transactions and ore swap transactions.
6. Bank Lines of Credit
Up to June 30, 2016, the bank lines of credit not used had amounted to RMB 67.338 billion. In the opinion of the management of the Company, in view of the cash flows arising from the bank lines of credit and operating activities, the Company will have sufficient funds in the next year to pay various current liabilities at maturity.
7. Supplements to Cash Flow statement
Unit: RMB
Supplementary data Amount in the period Amount last year
1. Reconciliation of net profit to cash flow from operating activities:
Net profit 1,703,296,531.08 2,476,312,714.79
Add: Provision for impairment losses of assets 2,539,576,428.19 -74,343,047.05
Depreciation of fixed assets and investment property
3,354,653,962.21 3,484,365,643.31
Amortization of intangible assets 41,084,183.00 41,072,239.68
Amortization of long-term deferred expenses 12,978,540.22 12,978,541.92
Losses (gains) on disposal of fixed, intangible and other long-term assets
196,689,299.36 307,906,302.94
Losses (gains) on the changes in fair value 57,873,954.55 17,901,082.57
Financial expenses 573,539,387.72 -106,492,476.19
Investment losses -164,730,167.58 -146,750,794.52
Increase in deferred tax assets -635,160,377.66 92,240,073.05
Increase in deferred tax liabilities 33,061,924.29 -1,525,550.54
Decrease in inventory 49,177,885.36 1,920,197,286.97
Decrease (increase) in receivables from operating activities
-3,801,220,287.83 -3,153,286,123.70
Increase (decrease) in payables for operating activities
327,008,155.99 1,157,192,553.05
Net cash flow from operating activities 4,287,829,418.90 6,027,768,446.28
2. Net changes in cash and cash equivalents:
EOP balance of cash and cash equivalents 7,586,762,617.66 7,534,528,629.40
Less: Balance of cash and cash equivalents at the beginning of the year
2,609,809,152.05 6,283,129,815.02
Net decrease of cash and cash equivalents 4,976,953,465.61 1,251,398,814.38

2016 Semi-annual Report
150 / 151
XVI. Supplements
1. List of Non-current Profits and Losses
Unit: RMB Million Item Amount Notes
Profits and losses on disposal of non-current assets
-208
Government subsidies recognized in profits or losses of current period (excluding government subsidies closely related to corporate operations, or granted on a quota or quantitative basis in accordance with the uniform criteria of the government)
114
Profits and losses from changes in fair value of held-for-trading financial assets and held-for-trading financial liabilities, as well as investment revenue from disposal of held-for-trading financial assets and held-for-trading financial liabilities, available-for-sale financial assets, in addition to the effective hedging operations related to the normal operating business of the Company
110
Other non-operating revenue and expenses except above items
4
Other non-operating incomes and expenditures than various items mentioned above
-280
Effect of income tax 69 Effect of minority interests -22
Total -213
Note: Since the principal business scope of Finance Co. and Ouyeel Commerce included financial instrument investment, the investment income of relevant financing products has not been included in non-current gains and losses.
2. Return on Net Assets and EPS
The following calculation table of return on net assets and EPS is prepared based on relevant regulations of No. 9 Preparation and Report Rules for IPO Companies’ Information Disclosure-Calculation and Disclosure of Return on Net Assets and Earning Per Share (Revised in 2010) promulgated by China Securities Regulatory Commission.
Profits in the reporting period Weighted average
return on net assets (%)
EPS
Basic EPS Diluted EPS
Net profits attributable to ordinary shareholders of the Company
3.03 0.21 0.21
Net profit after deduction of non-recurring profits or losses attributable to ordinary shareholders of the Company
3.21 0.22 0.22
3. Accounting Data Difference between Accounting Standards Inside and Outside China
□Applicable √Not applicable

2016 Semi-annual Report
151 / 151
Section XI. Reference Documents Dictionary
Reference Documents Dictionary
Financial statement bearing the signature and seal of legal representative, person responsible for accounting work and person in charge of accounting department
The original copies of all documents and manuscripts of announcements disclosed on the newspaper specified by China Securities Regulatory Commission in the reporting period
Chairman: Chen Derong Submission date approved by Board of Directors: August 30, 2016
Revision
Report edition No. Release date of
announcements for correction and supplements
Announcements content for correction and supplements