Bank of Cyprus Groupbankofcyprus.com/globalassets/investor-relations/...19.7 19.0 18.8 Dec 2013 Jun...
45
Bank of Cyprus Group Investor presentation January 2017
Transcript of Bank of Cyprus Groupbankofcyprus.com/globalassets/investor-relations/...19.7 19.0 18.8 Dec 2013 Jun...
Bank of Cyprus Group
Investor presentation
January 2017
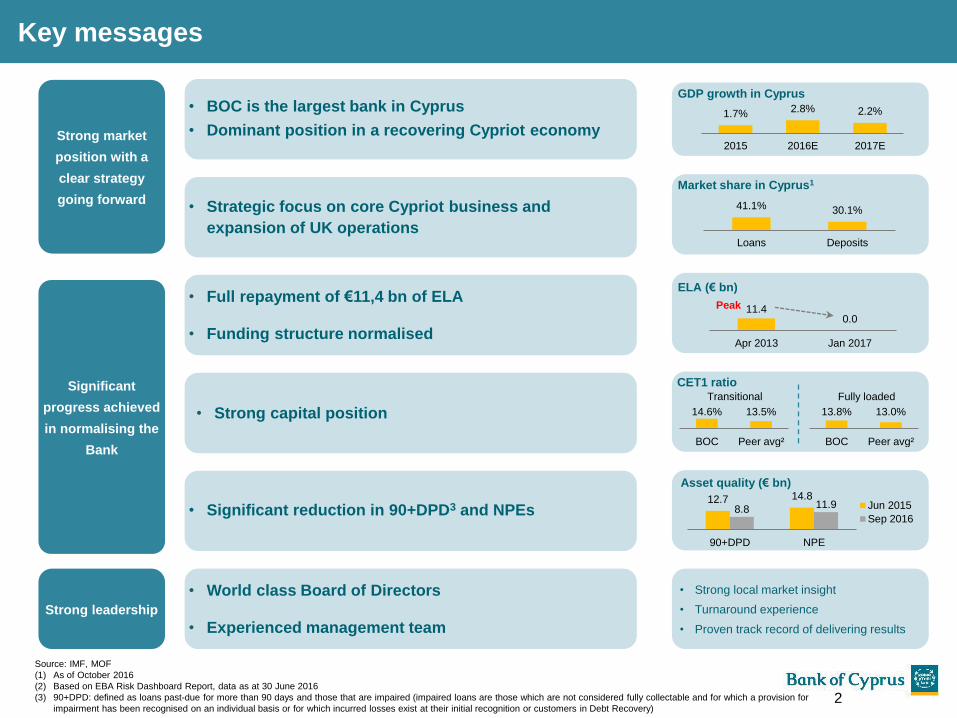
Key messages
• BOC is the largest bank in Cyprus
• Dominant position in a recovering Cypriot economy
• Significant reduction in 90+DPD3 and NPEs
• Strategic focus on core Cypriot business and
expansion of UK operations
• World class Board of Directors
• Experienced management team
• Full repayment of €11,4 bn of ELA
• Funding structure normalised
• Strong capital position
Significant
progress achieved
in normalising the
Bank
Strong market
position with a
clear strategy
going forward
• Strong local market insight
• Turnaround experience
• Proven track record of delivering results
11.40.0
Apr 2013 Jan 2017
ELA (€ bn)
GDP growth in Cyprus
CET1 ratio
Asset quality (€ bn)
12.7 14.8
8.8 11.9
90+DPD NPE
14.6% 13.5%
BOC Peer avg²
1.7% 2.8% 2.2%
2015 2016E 2017E
Market share in Cyprus1
41.1% 30.1%
Loans Deposits
Peak
Strong leadership
Source: IMF, MOF
(1) As of October 2016
(2) Based on EBA Risk Dashboard Report, data as at 30 June 2016
(3) 90+DPD: defined as loans past-due for more than 90 days and those that are impaired (impaired loans are those which are not considered fully collectable and for which a provision for
impairment has been recognised on an individual basis or for which incurred losses exist at their initial recognition or customers in Debt Recovery)
Jun 2015
Sep 2016
13.8% 13.0%
BOC Peer avg²
Transitional Fully loaded
2

Introduction: The journey so far…
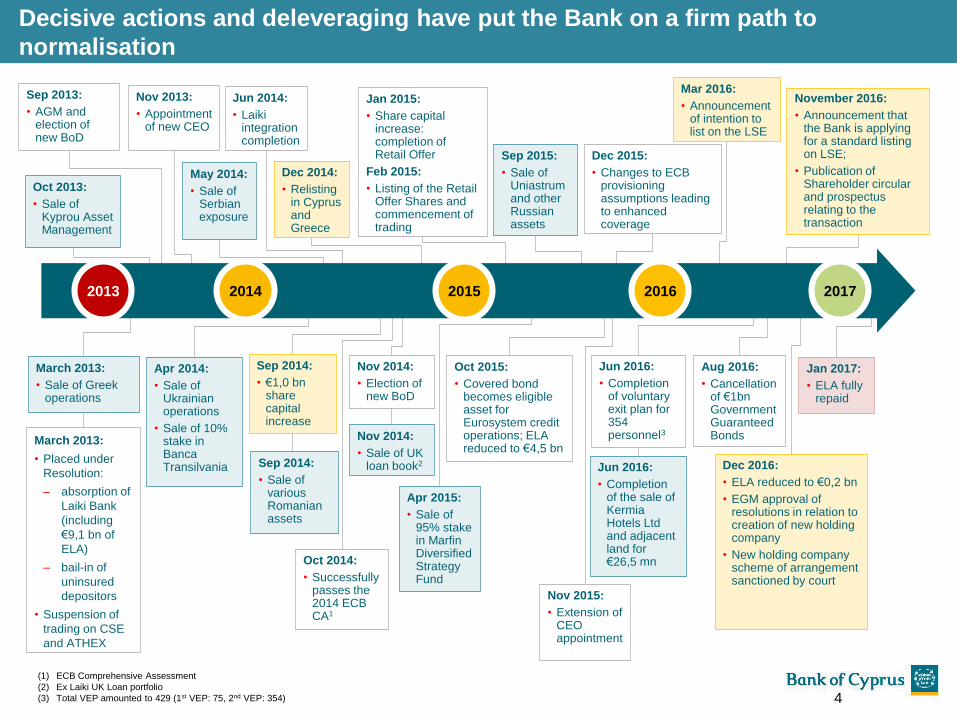
Decisive actions and deleveraging have put the Bank on a firm path to
normalisation
March 2013:
• Sale of Greek operations
Sep 2013:
• AGM and election of new BoD
Nov 2013:
• Appointment of new CEO
Nov 2015:
• Extension of CEO appointment
Dec 2014:
• Relisting in Cyprus and Greece
Sep 2014:
• €1,0 bnshare capital increase
Nov 2014:
• Election of new BoD
Mar 2016:
• Announcement of intention to list on the LSE
Dec 2015:
• Changes to ECB provisioning assumptions leading to enhanced coverage
Sep 2015:
• Sale of Uniastrumand other Russian assets
Jun 2014:
• Laikiintegration completion
Sep 2014:
• Sale of various Romanian assets
May 2014:
• Sale of Serbian exposure
Apr 2015:
• Sale of 95% stake in MarfinDiversified Strategy Fund
Apr 2014:
• Sale of Ukrainian operations
• Sale of 10% stake in BancaTransilvania
Oct 2013:
• Sale of Kyprou Asset Management
2013 2014 2015 2016
Jan 2015:
• Share capital increase: completion of Retail Offer
Feb 2015:
• Listing of the Retail Offer Shares and commencement of trading
Oct 2015:
• Covered bond becomes eligible asset for Eurosystem credit operations; ELA reduced to €4,5 bn
Oct 2014:
• Successfully passes the 2014 ECB CA1
(1) ECB Comprehensive Assessment
(2) Ex Laiki UK Loan portfolio
(3) Total VEP amounted to 429 (1st VEP: 75, 2nd VEP: 354)
Jun 2016:
• Completion of voluntary exit plan for 354 personnel3
Aug 2016:
• Cancellation of €1bn Government Guaranteed Bonds
Jun 2016:
• Completion of the sale of KermiaHotels Ltd and adjacent land for €26,5 mn
March 2013:
• Placed under
Resolution:
– absorption of
Laiki Bank
(including
€9,1 bn of
ELA)
– bail-in of
uninsured
depositors
• Suspension of
trading on CSE
and ATHEX
Nov 2014:
• Sale of UK loan book2
November 2016:
• Announcement that the Bank is applying for a standard listing on LSE;
• Publication of Shareholder circular and prospectus relating to the transaction
Jan 2017:
• ELA fully repaid
Dec 2016:
• ELA reduced to €0,2 bn
• EGM approval of resolutions in relation to creation of new holding company
• New holding company scheme of arrangement sanctioned by court
2017
4
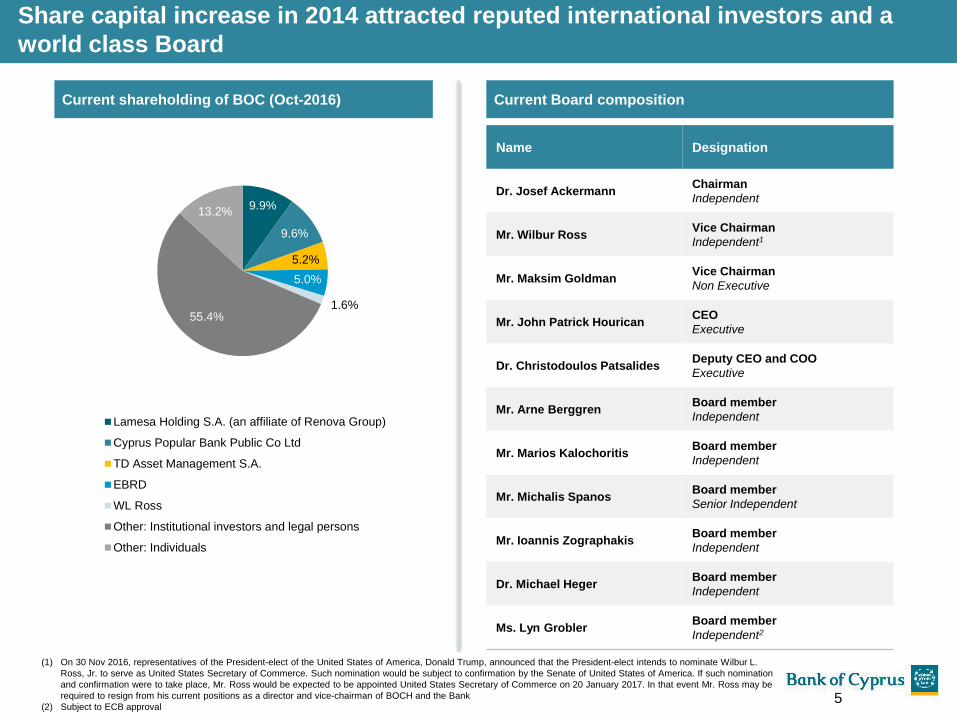
Current shareholding of BOC (Oct-2016) Current Board composition
9.9%
9.6%
5.2%
5.0%
1.6%55.4%
13.2%
Lamesa Holding S.A. (an affiliate of Renova Group)
Cyprus Popular Bank Public Co Ltd
TD Asset Management S.A.
EBRD
WL Ross
Other: Institutional investors and legal persons
Other: Individuals
Name Designation
Dr. Josef AckermannChairman
Independent
Mr. Wilbur RossVice Chairman
Independent1
Mr. Maksim GoldmanVice Chairman
Non Executive
Mr. John Patrick HouricanCEO
Executive
Dr. Christodoulos PatsalidesDeputy CEO and COO
Executive
Mr. Arne BerggrenBoard member
Independent
Mr. Marios KalochoritisBoard member
Independent
Mr. Michalis SpanosBoard member
Senior Independent
Mr. Ioannis ZographakisBoard member
Independent
Dr. Michael HegerBoard member
Independent
Ms. Lyn GroblerBoard member
Independent2
Share capital increase in 2014 attracted reputed international investors and a
world class Board
(1) On 30 Nov 2016, representatives of the President-elect of the United States of America, Donald Trump, announced that the President-elect intends to nominate Wilbur L.
Ross, Jr. to serve as United States Secretary of Commerce. Such nomination would be subject to confirmation by the Senate of United States of America. If such nomination
and confirmation were to take place, Mr. Ross would be expected to be appointed United States Secretary of Commerce on 20 January 2017. In that event Mr. Ross may be
required to resign from his current positions as a director and vice-chairman of BOCH and the Bank
(2) Subject to ECB approval5
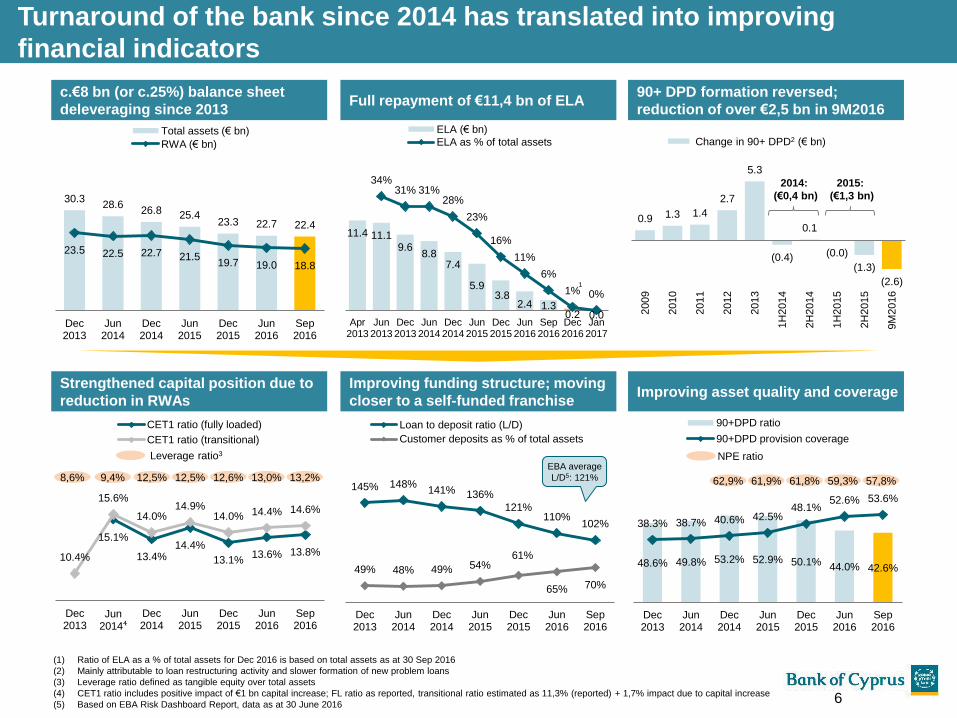
Strengthened capital position due to
reduction in RWAs
c.€8 bn (or c.25%) balance sheet
deleveraging since 2013
Improving funding structure; moving
closer to a self-funded franchise
Turnaround of the bank since 2014 has translated into improving
financial indicators
(1) Ratio of ELA as a % of total assets for Dec 2016 is based on total assets as at 30 Sep 2016
(2) Mainly attributable to loan restructuring activity and slower formation of new problem loans
(3) Leverage ratio defined as tangible equity over total assets
(4) CET1 ratio includes positive impact of €1 bn capital increase; FL ratio as reported, transitional ratio estimated as 11,3% (reported) + 1,7% impact due to capital increase
(5) Based on EBA Risk Dashboard Report, data as at 30 June 2016
30.328.6
26.8 25.423.3 22.7 22.4
23.5 22.5 22.7 21.519.7 19.0 18.8
Dec2013
Jun2014
Dec2014
Jun2015
Dec2015
Jun2016
Sep2016
Total assets (€ bn)
RWA (€ bn)
145% 148%141% 136%
121%110%
102%
49% 48% 49% 54%61%
65% 70%
Dec2013
Jun2014
Dec2014
Jun2015
Dec2015
Jun2016
Sep2016
Loan to deposit ratio (L/D)
Customer deposits as % of total assets
Full repayment of €11,4 bn of ELA90+ DPD formation reversed;
reduction of over €2,5 bn in 9M2016
Improving asset quality and coverage
0.9 1.3 1.4
2.7
5.3
(0.4)
0.1
(0.0)
(1.3)
(2.6)
2009
2010
2011
2012
2013
1H
2014
2H
2014
1H
2015
2H
2015
9M
2016
48.6% 49.8% 53.2% 52.9% 50.1% 44.0% 42.6%
38.3% 38.7% 40.6% 42.5%48.1%
52.6% 53.6%
Dec2013
Jun2014
Dec2014
Jun2015
Dec2015
Jun2016
Sep2016
90+DPD ratio
90+DPD provision coverage
15.1%
13.4%14.4%
13.1%13.6% 13.8%
10.4%
15.6%
14.0%14.9%
14.0% 14.4% 14.6%
Dec2013
Jun2014⁴
Dec2014
Jun2015
Dec2015
Jun2016
Sep2016
CET1 ratio (fully loaded)
CET1 ratio (transitional)
Change in 90+ DPD2 (€ bn)
EBA average
L/D5: 121%
2014:
(€0,4 bn)
2015:
(€1,3 bn)
62,9% 61,9% 61,8% 59,3% 57,8%
NPE ratio
11.4 11.19.6
8.87.4
5.93.8
2.4 1.30.2 0.0
34%31% 31%
28%
23%
16%
11%
6%
1% 0%
Apr2013
Jun2013
Dec2013
Jun2014
Dec2014
Jun2015
Dec2015
Jun2016
Sep2016
Dec2016
Jan2017
ELA (€ bn)
ELA as % of total assets
1
12,5% 12,5% 12,6% 13,0% 13,2%
Leverage ratio3
9,4%8,6%
6
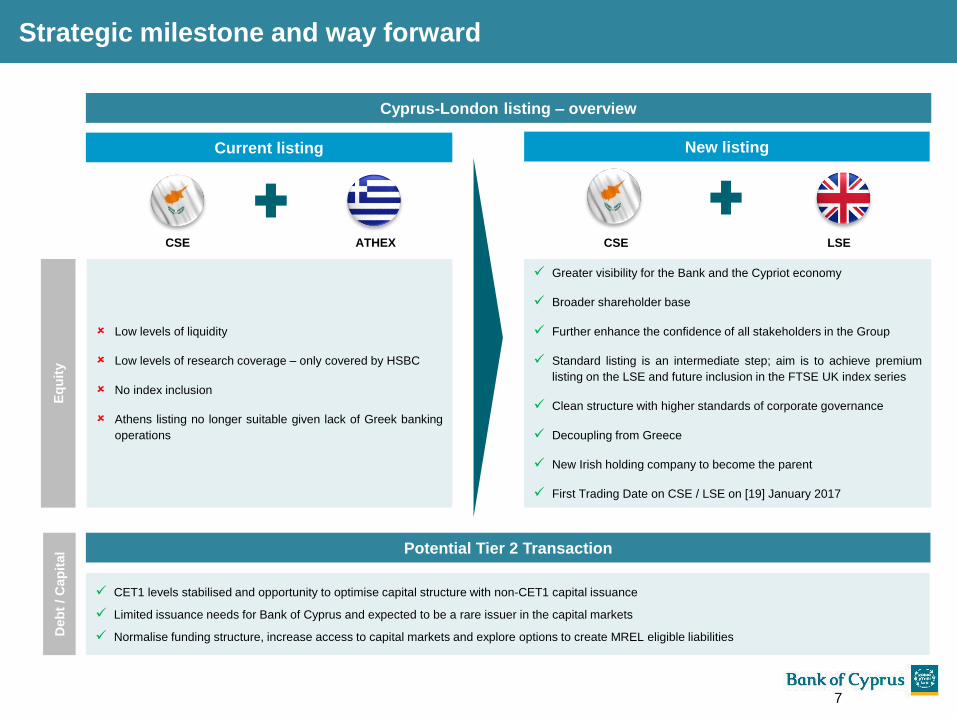
Strategic milestone and way forward
Low levels of liquidity
Low levels of research coverage – only covered by HSBC
No index inclusion
Athens listing no longer suitable given lack of Greek banking
operations
Greater visibility for the Bank and the Cypriot economy
Broader shareholder base
Further enhance the confidence of all stakeholders in the Group
Standard listing is an intermediate step; aim is to achieve premium
listing on the LSE and future inclusion in the FTSE UK index series
Clean structure with higher standards of corporate governance
Decoupling from Greece
New Irish holding company to become the parent
First Trading Date on CSE / LSE on [19] January 2017
Current listing New listing
CSE ATHEX CSE LSE
Potential Tier 2 Transaction
CET1 levels stabilised and opportunity to optimise capital structure with non-CET1 capital issuance
Limited issuance needs for Bank of Cyprus and expected to be a rare issuer in the capital markets
Normalise funding structure, increase access to capital markets and explore options to create MREL eligible liabilities
Cyprus-London listing – overview
Eq
uit
yD
eb
t / C
ap
ital
7

Key Investment Highlights
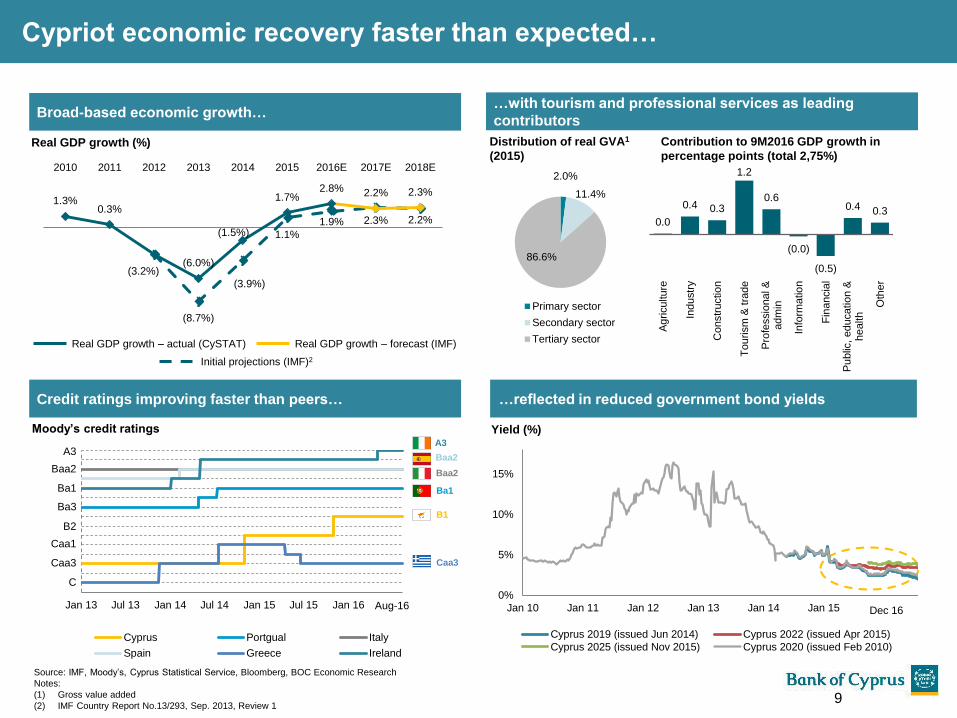
Cypriot economic recovery faster than expected…
Real GDP growth (%) Contribution to 9M2016 GDP growth in
percentage points (total 2,75%)
Source: IMF, Moody’s, Cyprus Statistical Service, Bloomberg, BOC Economic Research
Notes:
(1) Gross value added
(2) IMF Country Report No.13/293, Sep. 2013, Review 1
Broad-based economic growth……with tourism and professional services as leading
contributors
…reflected in reduced government bond yields
(8.7%)
(3.9%)
1.1%
1.9% 2.3% 2.2%
1.3%0.3%
(3.2%)(6.0%)
(1.5%)
1.7%2.8% 2.2% 2.3%
2010 2011 2012 2013 2014 2015 2016E 2017E 2018E
Yield (%)
Jan 13 Jul 13 Jan 14 Jul 14 Jan 15 Jul 15 Jan 16 Jul 16
Cyprus Portgual Italy
Spain Greece Ireland
Baa2
Ba1
Ba3
B2
Caa1
C
A3
B1
Baa2
Ba1
Baa2
Caa3
Moody’s credit ratings
Caa3
Credit ratings improving faster than peers…
A3
Aug-16
0.0
0.4 0.3
1.2
0.6
(0.0)
(0.5)
0.4 0.3
Ag
riculture
Industr
y
Constr
uctio
n
To
urism
& tra
de
Pro
fessio
nal &
adm
in
Info
rma
tio
n
Fin
ancia
l
Pu
blic
, educatio
n &
health
Oth
er
0%
5%
10%
15%
Jan 10 Jan 11 Jan 12 Jan 13 Jan 14 Jan 15 Jan 16
Cyprus 2019 (issued Jun 2014) Cyprus 2022 (issued Apr 2015)
Cyprus 2025 (issued Nov 2015) Cyprus 2020 (issued Feb 2010)
Dec 16
2.0%
11.4%
86.6%
Primary sector
Secondary sector
Tertiary sector
Distribution of real GVA1
(2015)
Initial projections (IMF)2
Real GDP growth – actual (CySTAT) Real GDP growth – forecast (IMF)
9
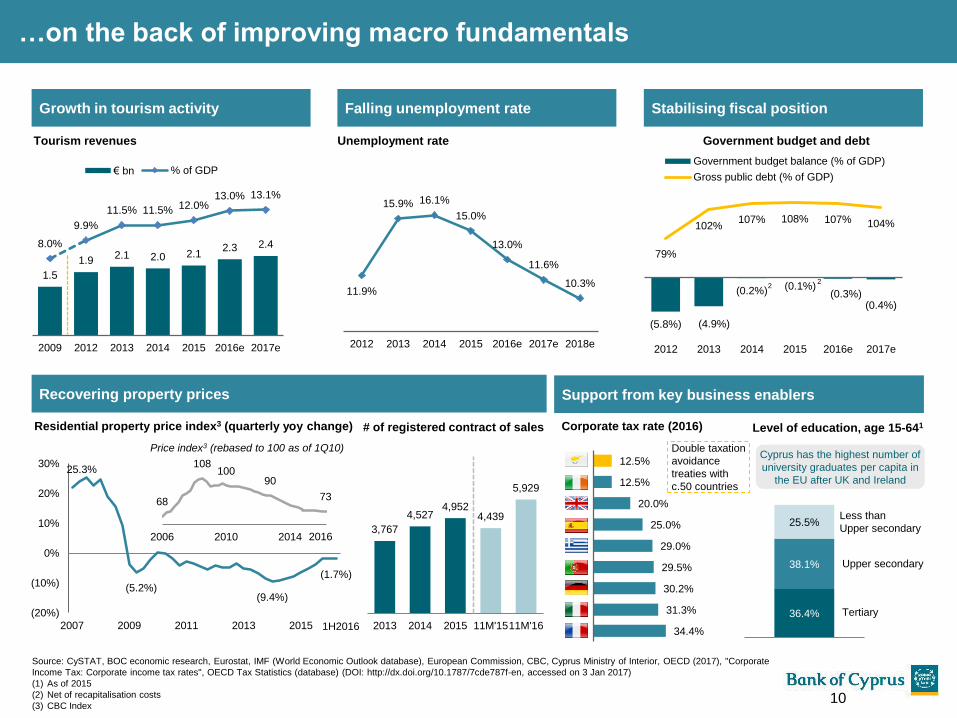
…on the back of improving macro fundamentals
Falling unemployment rateGrowth in tourism activity
Tourism revenues
1.5
1.9 2.1 2.0 2.1
2.3 2.4 8.0%
9.9%
11.5% 11.5% 12.0%13.0% 13.1%
2009 2012 2013 2014 2015 2016e 2017e
€ bn % of GDP
(5.8%) (4.9%)
(0.2%) (0.1%)(0.3%)
(0.4%)
79%
102%107% 108% 107% 104%
2012 2013 2014 2015 2016e 2017e
Government budget balance (% of GDP)
Gross public debt (% of GDP)
Government budget and debt
Stabilising fiscal position
Support from key business enablers
Unemployment rate
11.9%
15.9% 16.1%
15.0%
13.0%
11.6%
10.3%
2012 2013 2014 2015 2016e 2017e 2018e
Recovering property prices
Residential property price index3 (quarterly yoy change)
1H2016
3,767
4,527 4,952
4,439
5,929
2013 2014 2015 11M'1511M'16
# of registered contract of sales
68
108 100
90
73
2006 2010 2014
Price index3 (rebased to 100 as of 1Q10)
2016
34.4%
31.3%
30.2%
29.5%
29.0%
25.0%
20.0%
12.5%
12.5%
Corporate tax rate (2016)
Double taxation
avoidance
treaties with
c.50 countries
Source: CySTAT, BOC economic research, Eurostat, IMF (World Economic Outlook database), European Commission, CBC, Cyprus Ministry of Interior, OECD (2017), "Corporate
Income Tax: Corporate income tax rates", OECD Tax Statistics (database) (DOI: http://dx.doi.org/10.1787/7cde787f-en, accessed on 3 Jan 2017)
(1) As of 2015
(2) Net of recapitalisation costs
(3) CBC Index
22
25.3%
(5.2%)(9.4%)
(1.7%)
(20%)
(10%)
0%
10%
20%
30%
2007 2009 2011 2013 201536.4%
38.1%
25.5%
Upper secondary
Less than
Upper secondary
Tertiary
Level of education, age 15-641
Cyprus has the highest number of
university graduates per capita in
the EU after UK and Ireland
10
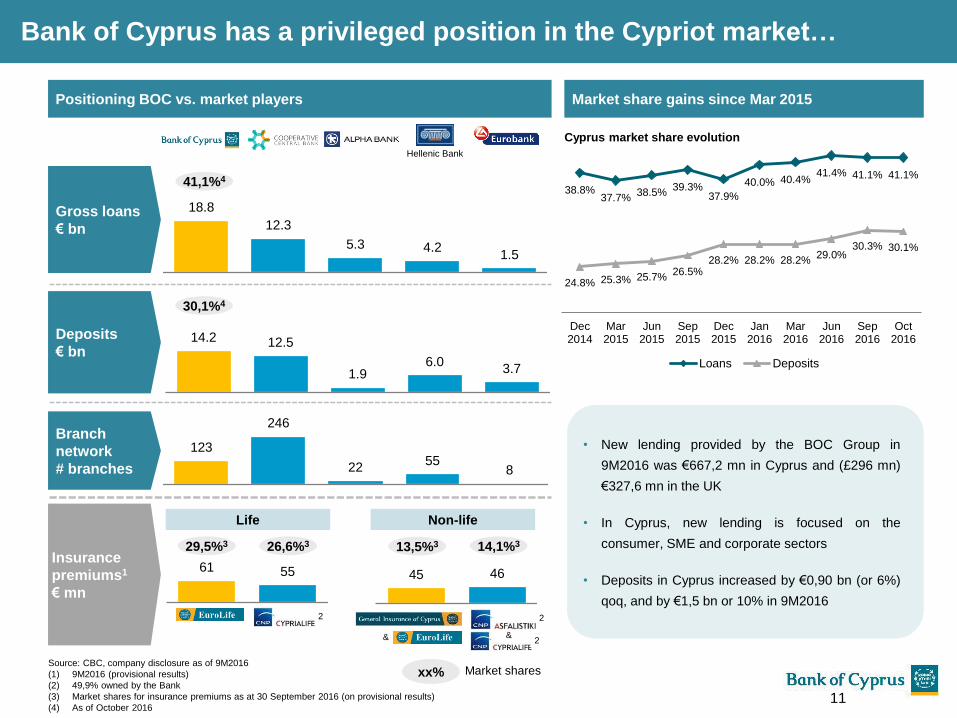
45 46
Non-life
18.8
12.3
5.3 4.21.5
61 55
Gross loans
€ bn
Branch
network
# branches
Deposits
€ bn
29,5%3
Insurance
premiums1
€ mn
Source: CBC, company disclosure as of 9M2016
(1) 9M2016 (provisional results)
(2) 49,9% owned by the Bank
(3) Market shares for insurance premiums as at 30 September 2016 (on provisional results)
(4) As of October 2016
Life
13,5%3
2 2
14.2 12.5
1.96.0
3.7
123
246
2255
8
41,1%4
30,1%4
xx% Market shares
Bank of Cyprus has a privileged position in the Cypriot market…
Hellenic Bank
& &2
38.8%37.7%
38.5%39.3%
37.9%
40.0% 40.4%41.4% 41.1% 41.1%
24.8% 25.3% 25.7%26.5%
28.2% 28.2% 28.2%29.0%
30.3% 30.1%
Dec2014
Mar2015
Jun2015
Sep2015
Dec2015
Jan2016
Mar2016
Jun2016
Sep2016
Oct2016
Loans Deposits
Cyprus market share evolution
Positioning BOC vs. market players Market share gains since Mar 2015
• New lending provided by the BOC Group in
9M2016 was €667,2 mn in Cyprus and (£296 mn)
€327,6 mn in the UK
• In Cyprus, new lending is focused on the
consumer, SME and corporate sectors
• Deposits in Cyprus increased by €0,90 bn (or 6%)
qoq, and by €1,5 bn or 10% in 9M2016
26,6%3 14,1%3
11
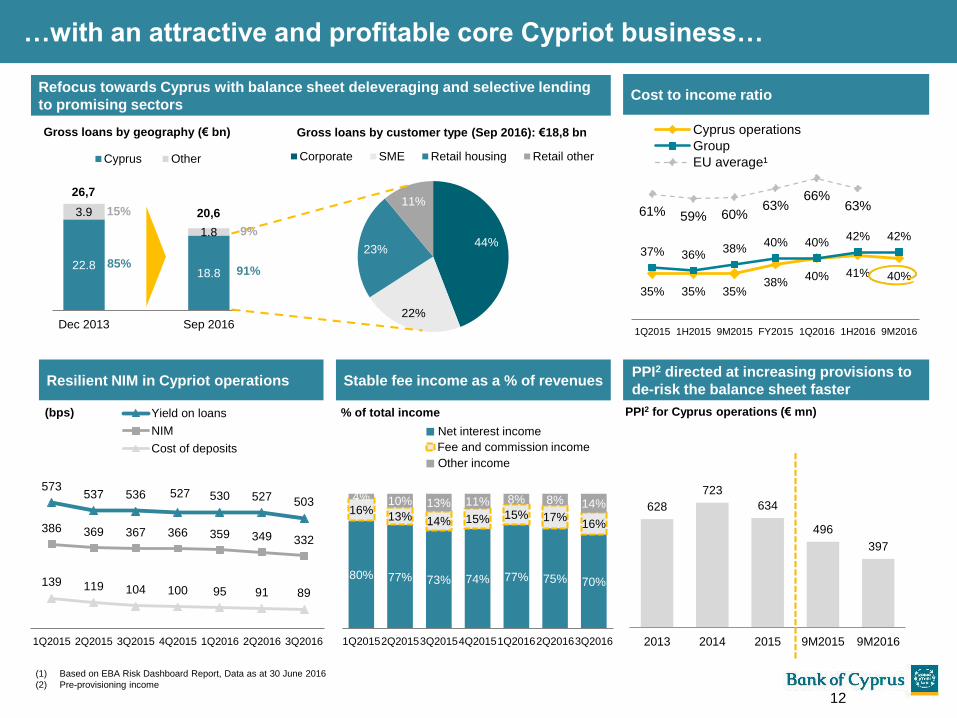
44%
22%
23%
11%
Corporate SME Retail housing Retail other
Resilient NIM in Cypriot operations
573537 536 527 530 527 503
386 369 367 366 359 349 332
139 119 104 100 95 91 89
1Q2015 2Q2015 3Q2015 4Q2015 1Q2016 2Q2016 3Q2016
Yield on loans
NIM
Cost of deposits
Refocus towards Cyprus with balance sheet deleveraging and selective lending
to promising sectors
80% 77% 73% 74% 77% 75% 70%
16%13% 14% 15% 15% 17%
16%
4% 10% 13% 11% 8% 8% 14%
1Q20152Q20153Q20154Q20151Q20162Q20163Q2016
Stable fee income as a % of revenues
(bps)
12
…with an attractive and profitable core Cypriot business…
PPI2 directed at increasing provisions to
de-risk the balance sheet faster
Gross loans by geography (€ bn) Gross loans by customer type (Sep 2016): €18,8 bn
Cost to income ratio
22.818.8
3.9
1.8
Dec 2013 Sep 2016
Cyprus Other
15%
85%91%
9%
26,7
20,6
Net interest income
Fee and commission income
Other income
% of total income
628
723
634
496
397
2013 2014 2015 9M2015 9M2016
PPI2 for Cyprus operations (€ mn)
35% 35% 35%38%
40% 41% 40%
37% 36%38%
40% 40%42% 42%
61% 59% 60%63%
66%63%
1Q2015 1H2015 9M2015 FY2015 1Q2016 1H2016 9M2016
Cyprus operations
Group
EU average¹
(1) Based on EBA Risk Dashboard Report, Data as at 30 June 2016
(2) Pre-provisioning income
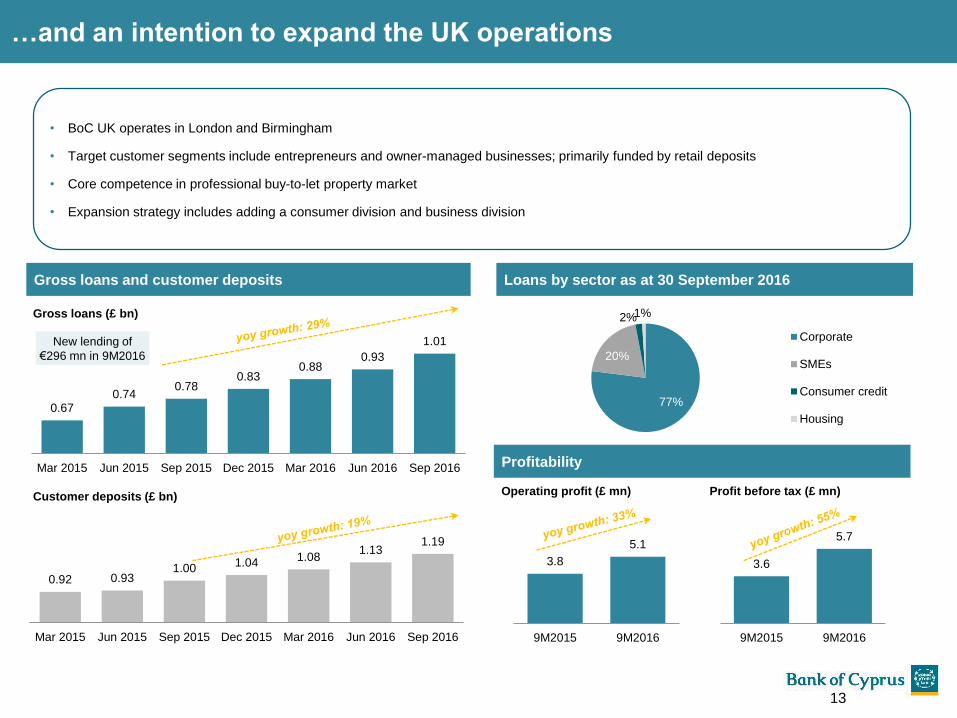
…and an intention to expand the UK operations
• BoC UK operates in London and Birmingham
• Target customer segments include entrepreneurs and owner-managed businesses; primarily funded by retail deposits
• Core competence in professional buy-to-let property market
• Expansion strategy includes adding a consumer division and business division
Gross loans and customer deposits Loans by sector as at 30 September 2016
0.67 0.74
0.78 0.83
0.88 0.93
1.01
Mar 2015 Jun 2015 Sep 2015 Dec 2015 Mar 2016 Jun 2016 Sep 2016
77%
20%
2%1%
Corporate
SMEs
Consumer credit
Housing
0.92 0.93 1.00 1.04 1.08
1.13 1.19
Mar 2015 Jun 2015 Sep 2015 Dec 2015 Mar 2016 Jun 2016 Sep 2016
Gross loans (£ bn)
Customer deposits (£ bn)
3.8
5.1
9M2015 9M2016
Profitability
Operating profit (£ mn) Profit before tax (£ mn)
3.6
5.7
9M2015 9M2016
New lending of
€296 mn in 9M2016
13
14
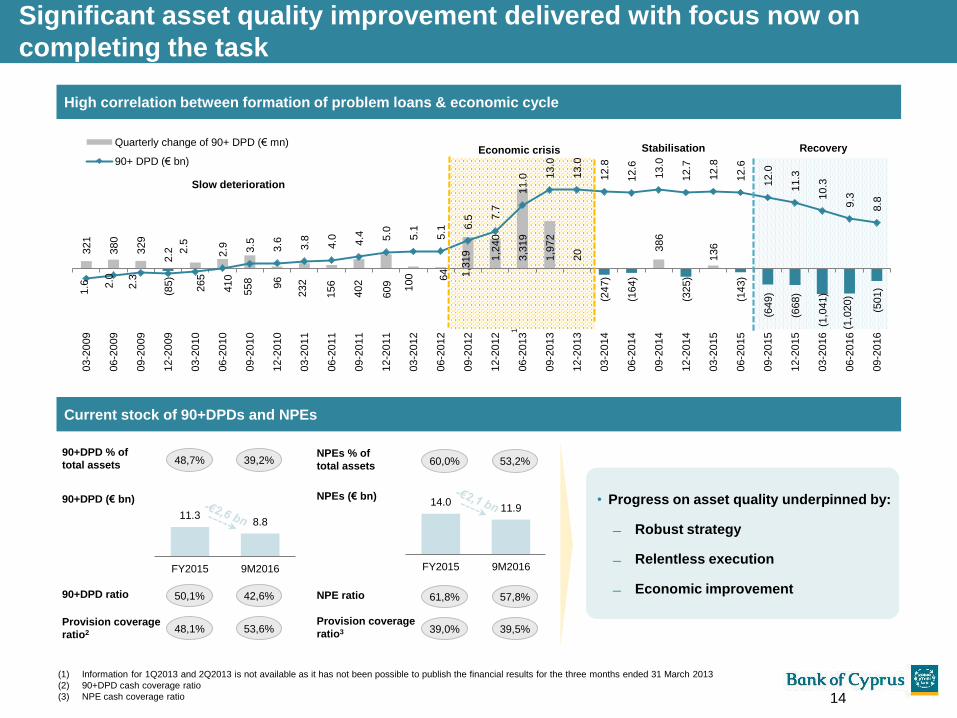
Significant asset quality improvement delivered with focus now on
completing the task
321
380
329
(85)
265
410
558 96
232
156
402
609 100 64 1,3
19 1,2
40
3,3
19
1,9
72
20
(247)
(164)
386
(325)
136
(143)
(649)
(668)
(1,0
41)
(1,0
20)
(501)1.6 2
.0
2.3
2.2 2
.5
2.9 3.5
3.6 3.8 4.0 4.4 5.0
5.1
5.1 6
.5 7.7
11.0 1
3.0
13.0
12.8
12.6
13.0
12.7
12.8
12.6
12.0
11.3
10.3
9.3
8.8
03-2
009
06-2
009
09-2
009
12-2
009
03-2
010
06-2
010
09-2
010
12-2
010
03-2
011
06-2
011
09-2
011
12-2
011
03-2
012
06-2
012
09-2
012
12-2
012
06-2
013
09-2
013
12-2
013
03-2
014
06-2
014
09-2
014
12-2
014
03-2
015
06-2
015
09-2
015
12-2
015
03-2
016
06-2
016
09-2
016
Quarterly change of 90+ DPD (€ mn)
90+ DPD (€ bn)
1
Slow deterioration
Economic crisis Stabilisation Recovery
High correlation between formation of problem loans & economic cycle
(1) Information for 1Q2013 and 2Q2013 is not available as it has not been possible to publish the financial results for the three months ended 31 March 2013
(2) 90+DPD cash coverage ratio
(3) NPE cash coverage ratio
Current stock of 90+DPDs and NPEs
• Progress on asset quality underpinned by:
Robust strategy
Relentless execution
Economic improvement
11.38.8
FY2015 9M2016
50,1% 42,6%90+DPD ratio
48,1% 53,6%Provision coverage
ratio2
90+DPD (€ bn) 14.011.9
FY2015 9M2016
61,8% 57,8%NPE ratio
39,0% 39,5%Provision coverage
ratio3
NPEs (€ bn)
48,7% 39,2%90+DPD % of
total assets 60,0% 53,2%NPEs % of
total assets
15
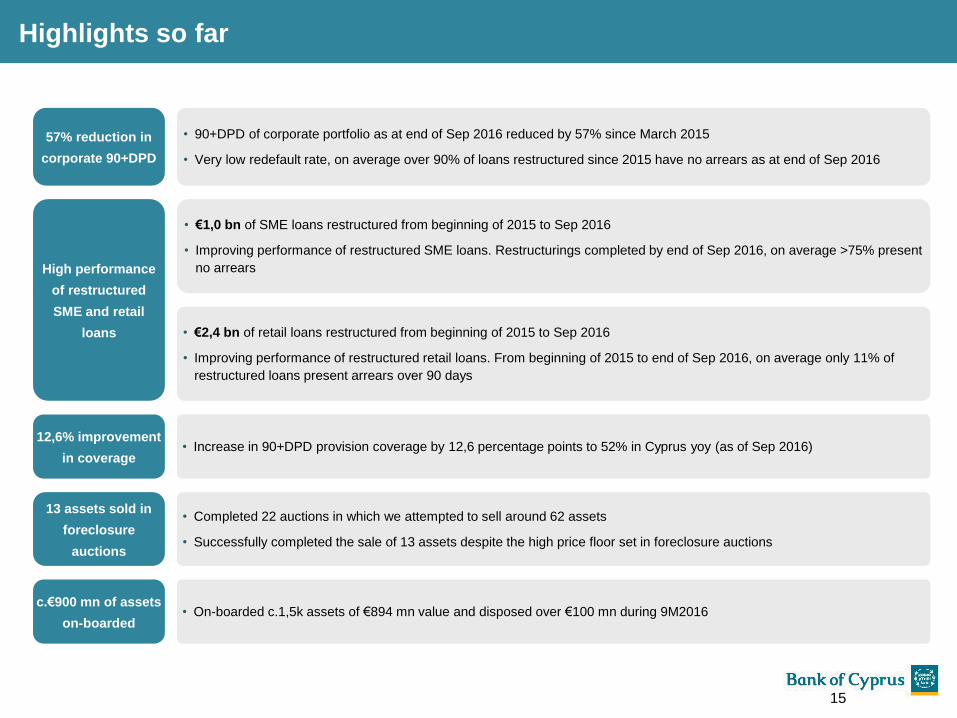
Highlights so far
• 90+DPD of corporate portfolio as at end of Sep 2016 reduced by 57% since March 2015
• Very low redefault rate, on average over 90% of loans restructured since 2015 have no arrears as at end of Sep 2016
57% reduction in
corporate 90+DPD
• €1,0 bn of SME loans restructured from beginning of 2015 to Sep 2016
• Improving performance of restructured SME loans. Restructurings completed by end of Sep 2016, on average >75% present
no arrearsHigh performance
of restructured
SME and retail
loans • €2,4 bn of retail loans restructured from beginning of 2015 to Sep 2016
• Improving performance of restructured retail loans. From beginning of 2015 to end of Sep 2016, on average only 11% of
restructured loans present arrears over 90 days
• Increase in 90+DPD provision coverage by 12,6 percentage points to 52% in Cyprus yoy (as of Sep 2016)12,6% improvement
in coverage
• Completed 22 auctions in which we attempted to sell around 62 assets
• Successfully completed the sale of 13 assets despite the high price floor set in foreclosure auctions
13 assets sold in
foreclosure
auctions
• On-boarded c.1,5k assets of €894 mn value and disposed over €100 mn during 9M2016c.€900 mn of assets
on-boarded
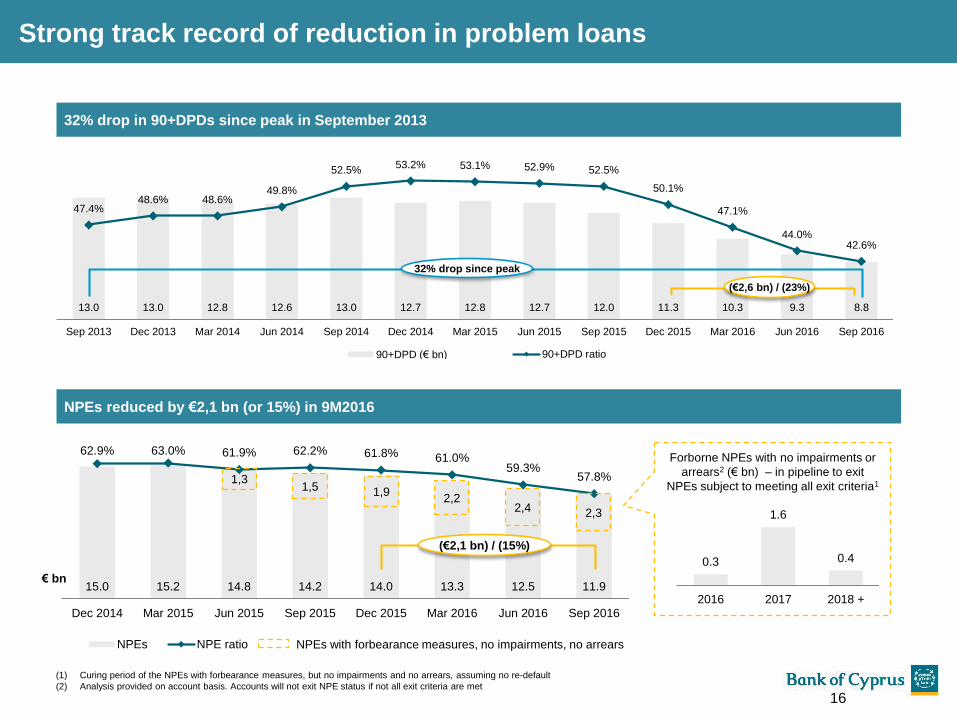
16
32% drop in 90+DPDs since peak in September 2013
13.0 13.0 12.8 12.6 13.0 12.7 12.8 12.7 12.0 11.3 10.3 9.3 8.8
47.4%48.6% 48.6%
49.8%
52.5%53.2% 53.1% 52.9% 52.5%
50.1%
47.1%
44.0%42.6%
Sep 2013 Dec 2013 Mar 2014 Jun 2014 Sep 2014 Dec 2014 Mar 2015 Jun 2015 Sep 2015 Dec 2015 Mar 2016 Jun 2016 Sep 2016
90+DPD (€ bn) 90+DPD ratio
(€2,6 bn) / (23%)
32% drop since peak
NPEs reduced by €2,1 bn (or 15%) in 9M2016
15.0 15.2 14.8 14.2 14.0 13.3 12.5 11.9
62.9% 63.0% 61.9% 62.2% 61.8% 61.0%59.3%
57.8%
Dec 2014 Mar 2015 Jun 2015 Sep 2015 Dec 2015 Mar 2016 Jun 2016 Sep 2016
NPEs NPE ratio
€ bn
2,4
Forborne NPEs with no impairments or
arrears2 (€ bn) – in pipeline to exit
NPEs subject to meeting all exit criteria1
0.3
1.6
0.4
2016 2017 2018 +
2,21,9
(€2,1 bn) / (15%)
2,3
(1) Curing period of the NPEs with forbearance measures, but no impairments and no arrears, assuming no re-default
(2) Analysis provided on account basis. Accounts will not exit NPE status if not all exit criteria are met
1,51,3
NPEs with forbearance measures, no impairments, no arrears
Strong track record of reduction in problem loans
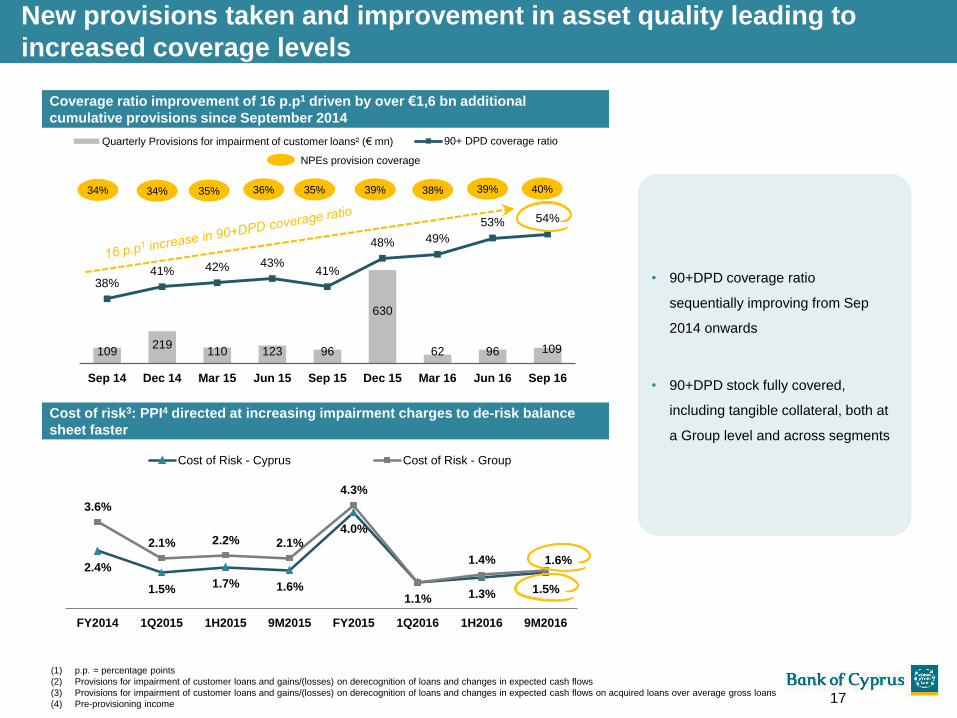
New provisions taken and improvement in asset quality leading to
increased coverage levels
Cost of risk3: PPI4 directed at increasing impairment charges to de-risk balance
sheet faster
2.4%
1.5% 1.7% 1.6%
4.0%
1.1% 1.3% 1.5%
3.6%
2.1% 2.2% 2.1%
4.3%
1.4% 1.6%
FY2014 1Q2015 1H2015 9M2015 FY2015 1Q2016 1H2016 9M2016
Cost of Risk - Cyprus Cost of Risk - Group
Coverage ratio improvement of 16 p.p1 driven by over €1,6 bn additional
cumulative provisions since September 2014
(1) p.p. = percentage points
(2) Provisions for impairment of customer loans and gains/(losses) on derecognition of loans and changes in expected cash flows
(3) Provisions for impairment of customer loans and gains/(losses) on derecognition of loans and changes in expected cash flows on acquired loans over average gross loans
(4) Pre-provisioning income
109219
110 123 96
630
62 96 109
38%41% 42% 43%
41%
48% 49%
53% 54%
Sep 14 Dec 14 Mar 15 Jun 15 Sep 15 Dec 15 Mar 16 Jun 16 Sep 16
Quarterly Provisions for impairment of customer loans² (€ mn) 90+ DPD coverage ratio
34% 34% 35% 36% 35% 39% 38% 39% 40%
NPEs provision coverage
• 90+DPD coverage ratio
sequentially improving from Sep
2014 onwards
• 90+DPD stock fully covered,
including tangible collateral, both at
a Group level and across segments
17
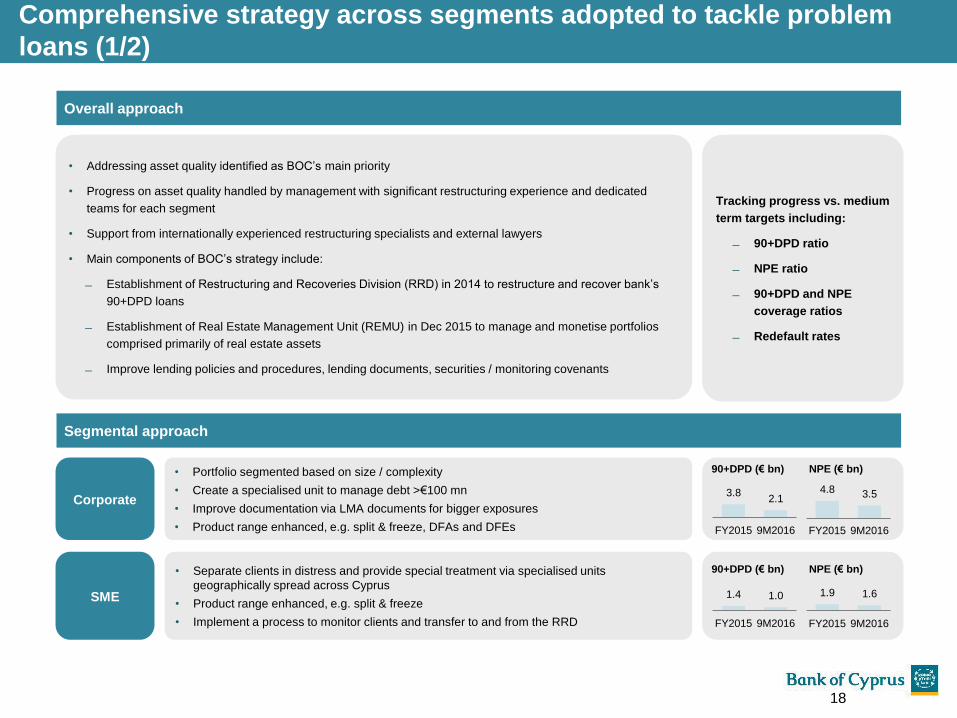
Comprehensive strategy across segments adopted to tackle problem
loans (1/2)
• Portfolio segmented based on size / complexity
• Create a specialised unit to manage debt >€100 mn
• Improve documentation via LMA documents for bigger exposures
• Product range enhanced, e.g. split & freeze, DFAs and DFEs
Corporate
• Separate clients in distress and provide special treatment via specialised units
geographically spread across Cyprus
• Product range enhanced, e.g. split & freeze
• Implement a process to monitor clients and transfer to and from the RRD
SME
3.82.1
FY2015 9M2016
90+DPD (€ bn) NPE (€ bn)
4.8 3.5
FY2015 9M2016
1.4 1.0
FY2015 9M2016
90+DPD (€ bn) NPE (€ bn)
1.9 1.6
FY2015 9M2016
Segmental approach
Overall approach
• Addressing asset quality identified as BOC’s main priority
• Progress on asset quality handled by management with significant restructuring experience and dedicated
teams for each segment
• Support from internationally experienced restructuring specialists and external lawyers
• Main components of BOC’s strategy include:
Establishment of Restructuring and Recoveries Division (RRD) in 2014 to restructure and recover bank’s
90+DPD loans
Establishment of Real Estate Management Unit (REMU) in Dec 2015 to manage and monetise portfolios
comprised primarily of real estate assets
Improve lending policies and procedures, lending documents, securities / monitoring covenants
18
Tracking progress vs. medium
term targets including:
90+DPD ratio
NPE ratio
90+DPD and NPE
coverage ratios
Redefault rates
19
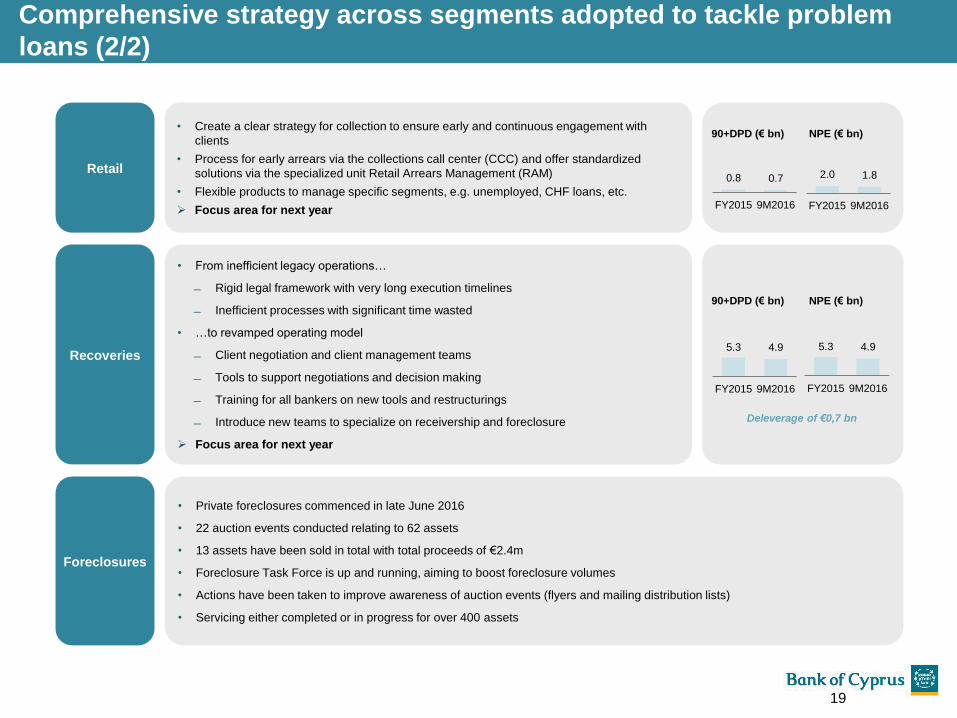
Comprehensive strategy across segments adopted to tackle problem
loans (2/2)
• From inefficient legacy operations…
Rigid legal framework with very long execution timelines
Inefficient processes with significant time wasted
• …to revamped operating model
Client negotiation and client management teams
Tools to support negotiations and decision making
Training for all bankers on new tools and restructurings
Introduce new teams to specialize on receivership and foreclosure
Focus area for next year
Recoveries
• Private foreclosures commenced in late June 2016
• 22 auction events conducted relating to 62 assets
• 13 assets have been sold in total with total proceeds of €2.4m
• Foreclosure Task Force is up and running, aiming to boost foreclosure volumes
• Actions have been taken to improve awareness of auction events (flyers and mailing distribution lists)
• Servicing either completed or in progress for over 400 assets
Foreclosures
5.3 4.9
FY2015 9M2016
90+DPD (€ bn) NPE (€ bn)
• Create a clear strategy for collection to ensure early and continuous engagement with
clients
• Process for early arrears via the collections call center (CCC) and offer standardized
solutions via the specialized unit Retail Arrears Management (RAM)
• Flexible products to manage specific segments, e.g. unemployed, CHF loans, etc.
Focus area for next year
Retail0.8 0.7
FY2015 9M2016
90+DPD (€ bn) NPE (€ bn)
2.0 1.8
FY2015 9M2016
5.3 4.9
FY2015 9M2016
Deleverage of €0,7 bn
20
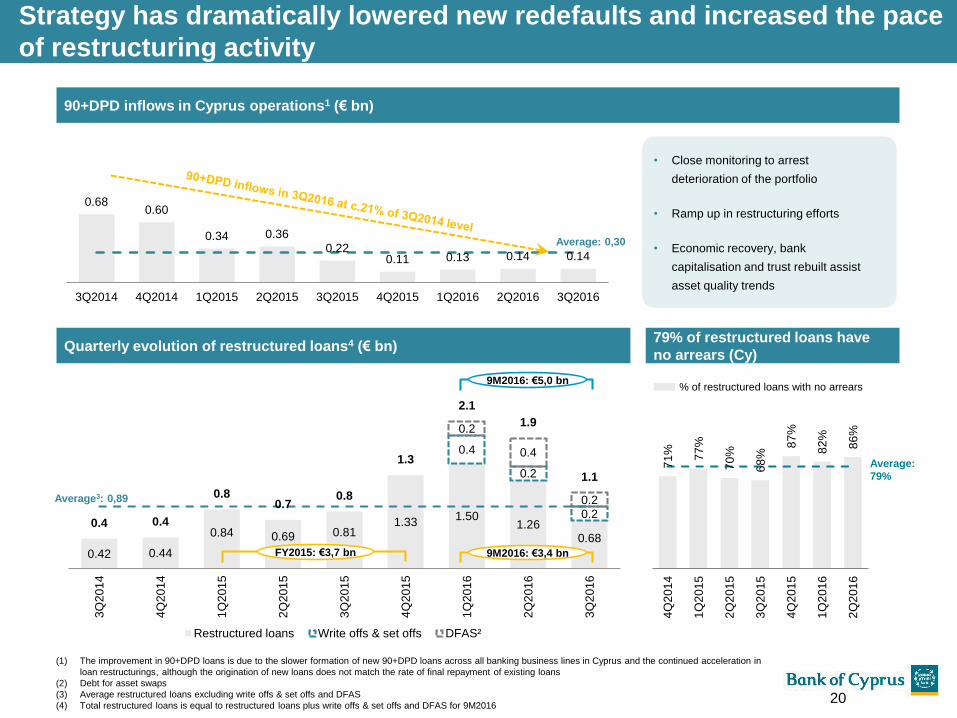
Strategy has dramatically lowered new redefaults and increased the pace
of restructuring activity
90+DPD inflows in Cyprus operations1 (€ bn)
• Close monitoring to arrest
deterioration of the portfolio
• Ramp up in restructuring efforts
• Economic recovery, bank
capitalisation and trust rebuilt assist
asset quality trends
79% of restructured loans have
no arrears (Cy)
0.680.60
0.34 0.36
0.220.11 0.13 0.14 0.14
3Q2014 4Q2014 1Q2015 2Q2015 3Q2015 4Q2015 1Q2016 2Q2016 3Q2016
Average: 0,30
0.42 0.44
0.84 0.69 0.811.33
1.501.26
0.68
0.4
0.2
0.2
0.2
0.4
0.2
0.4 0.4
0.80.7
0.8
1.3
2.1
1.9
1.1
3Q
201
4
4Q
201
4
1Q
201
5
2Q
201
5
3Q
201
5
4Q
201
5
1Q
201
6
2Q
201
6
3Q
201
6
Restructured loans Write offs & set offs DFAS²
71
%
77
%
70
%
68
%
87
%
82
%
86
%
4Q
201
4
1Q
201
5
2Q
201
5
3Q
201
5
4Q
201
5
1Q
201
6
2Q
201
6
Average:
79%
% of restructured loans with no arrears
(1) The improvement in 90+DPD loans is due to the slower formation of new 90+DPD loans across all banking business lines in Cyprus and the continued acceleration in
loan restructurings, although the origination of new loans does not match the rate of final repayment of existing loans
(2) Debt for asset swaps
(3) Average restructured loans excluding write offs & set offs and DFAS
(4) Total restructured loans is equal to restructured loans plus write offs & set offs and DFAS for 9M2016
Quarterly evolution of restructured loans4 (€ bn)
Average3: 0,89
FY2015: €3,7 bn 9M2016: €3,4 bn
9M2016: €5,0 bn
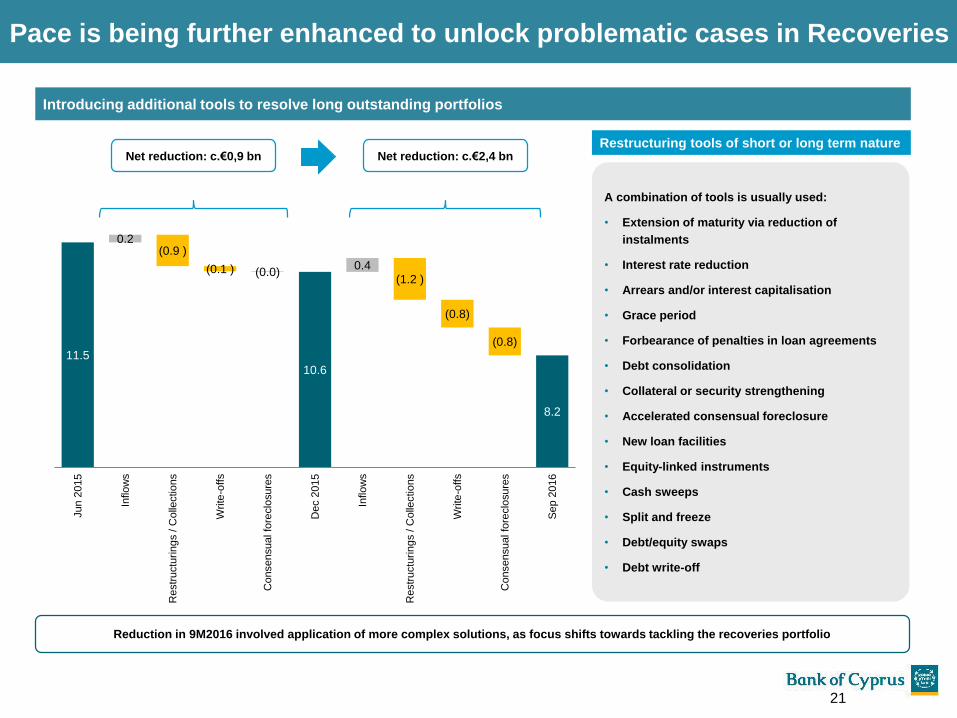
Pace is being further enhanced to unlock problematic cases in Recoveries
Introducing additional tools to resolve long outstanding portfolios
Reduction in 9M2016 involved application of more complex solutions, as focus shifts towards tackling the recoveries portfolio
A combination of tools is usually used:
• Extension of maturity via reduction of
instalments
• Interest rate reduction
• Arrears and/or interest capitalisation
• Grace period
• Forbearance of penalties in loan agreements
• Debt consolidation
• Collateral or security strengthening
• Accelerated consensual foreclosure
• New loan facilities
• Equity-linked instruments
• Cash sweeps
• Split and freeze
• Debt/equity swaps
• Debt write-off
Restructuring tools of short or long term nature
11.5
10.6 10.6
8.2
0.2 (0.9 )
(0.1 ) (0.0) 0.4
(1.2 )
(0.8)
(0.8)
Jun
2015
Inflo
ws
Restr
uctu
ring
s / C
olle
ctio
ns
Write
-offs
Consensual fo
reclo
sure
s
Dec 2
015
Inflo
ws
Restr
uctu
ring
s / C
olle
ctio
ns
Write
-offs
Consensual fo
reclo
sure
s
Se
p 2
016
Net reduction: c.€0,9 bn Net reduction: c.€2,4 bn
21
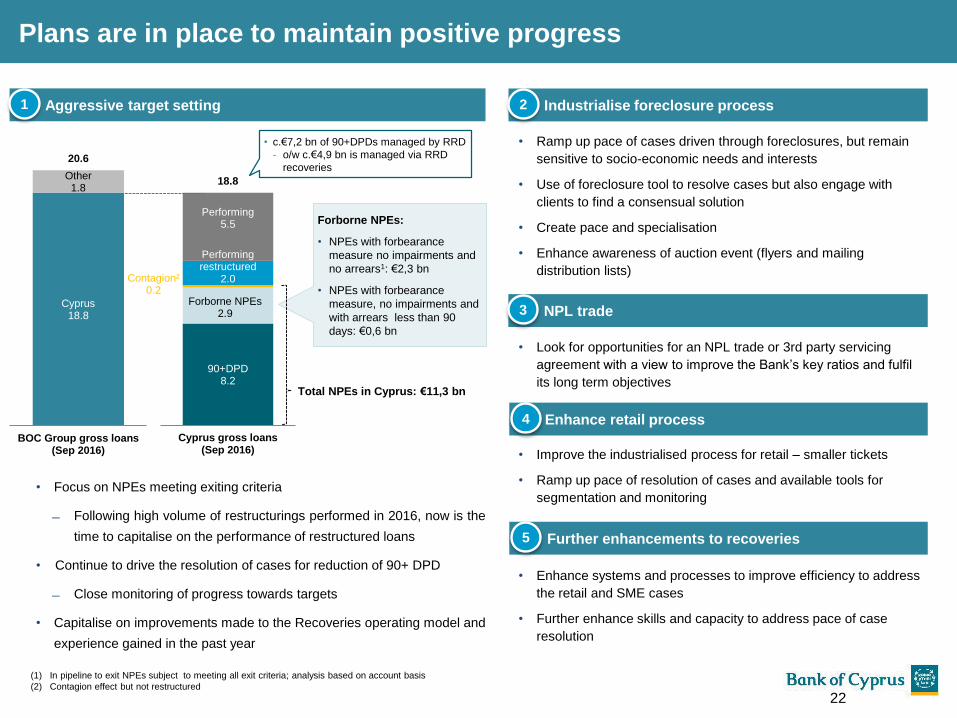
Aggressive target setting
Cyprus18.8
Other1.8
20.6
BOC Group gross loans(Sep 2016)
90+DPD8.2
Forborne NPEs2.9
Contagion²0.2
Performing restructured
2.0
Performing5.5
18.8
Cyprus gross loans(Sep 2016)
Total NPEs in Cyprus: €11,3 bn
• c.€7,2 bn of 90+DPDs managed by RRD
- o/w c.€4,9 bn is managed via RRD
recoveries
Forborne NPEs:
• NPEs with forbearance
measure no impairments and
no arrears1: €2,3 bn
• NPEs with forbearance
measure, no impairments and
with arrears less than 90
days: €0,6 bn
• Focus on NPEs meeting exiting criteria
Following high volume of restructurings performed in 2016, now is the
time to capitalise on the performance of restructured loans
• Continue to drive the resolution of cases for reduction of 90+ DPD
Close monitoring of progress towards targets
• Capitalise on improvements made to the Recoveries operating model and
experience gained in the past year
Industrialise foreclosure process
• Ramp up pace of cases driven through foreclosures, but remain
sensitive to socio-economic needs and interests
• Use of foreclosure tool to resolve cases but also engage with
clients to find a consensual solution
• Create pace and specialisation
• Enhance awareness of auction event (flyers and mailing
distribution lists)
1 2
NPL trade3
Enhance retail process4
• Look for opportunities for an NPL trade or 3rd party servicing
agreement with a view to improve the Bank’s key ratios and fulfil
its long term objectives
• Improve the industrialised process for retail – smaller tickets
• Ramp up pace of resolution of cases and available tools for
segmentation and monitoring
Plans are in place to maintain positive progress
(1) In pipeline to exit NPEs subject to meeting all exit criteria; analysis based on account basis
(2) Contagion effect but not restructured
Further enhancements to recoveries5
• Enhance systems and processes to improve efficiency to address
the retail and SME cases
• Further enhance skills and capacity to address pace of case
resolution
22
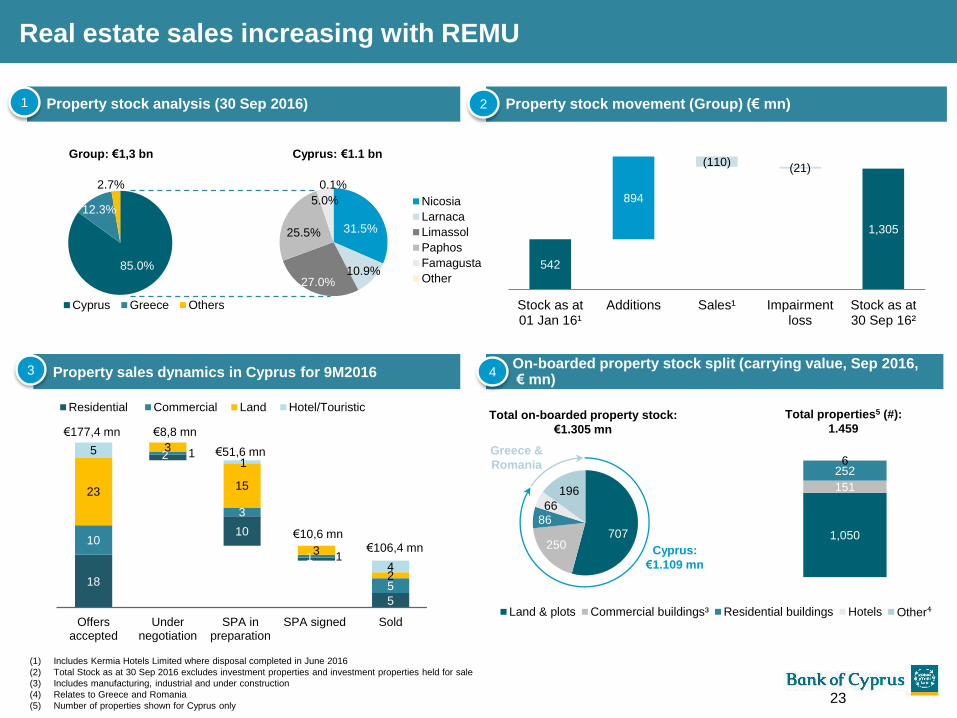
85.0%
12.3%
2.7%
Cyprus Greece Others
707250
86
66
196
Land & plots Commercial buildings³ Residential buildings Hotels Other⁴
Real estate sales increasing with REMU
(1) Includes Kermia Hotels Limited where disposal completed in June 2016
(2) Total Stock as at 30 Sep 2016 excludes investment properties and investment properties held for sale
(3) Includes manufacturing, industrial and under construction
(4) Relates to Greece and Romania
(5) Number of properties shown for Cyprus only
Cyprus: €1.1 bn
Property stock analysis (30 Sep 2016)
Group: €1,3 bn
31.5%
10.9% 27.0%
25.5%
5.0%
0.1%
Nicosia
Larnaca
Limassol
Paphos
Famagusta
Other
On-boarded property stock split (carrying value, Sep 2016,€ mn)
Cyprus:
€1.109 mn
Total properties5 (#):
1.459
Greece &
Romania
Property sales dynamics in Cyprus for 9M2016
18
2
10
1
5
10
1
3
1
5
23
3
15
3
2
51
4
Offersaccepted
Undernegotiation
SPA inpreparation
SPA signed Sold
Residential Commercial Land Hotel/Touristic
€106,4 mn€10,6 mn
€8,8 mn€177,4 mn
€51,6 mn
Property stock movement (Group) (€ mn)
542
1,305
894
(110)(21)
Stock as at01 Jan 16¹
Additions Sales¹ Impairmentloss
Stock as at30 Sep 16²
1 2
43
Total on-boarded property stock:
€1.305 mn
1,050
151
252 6
23
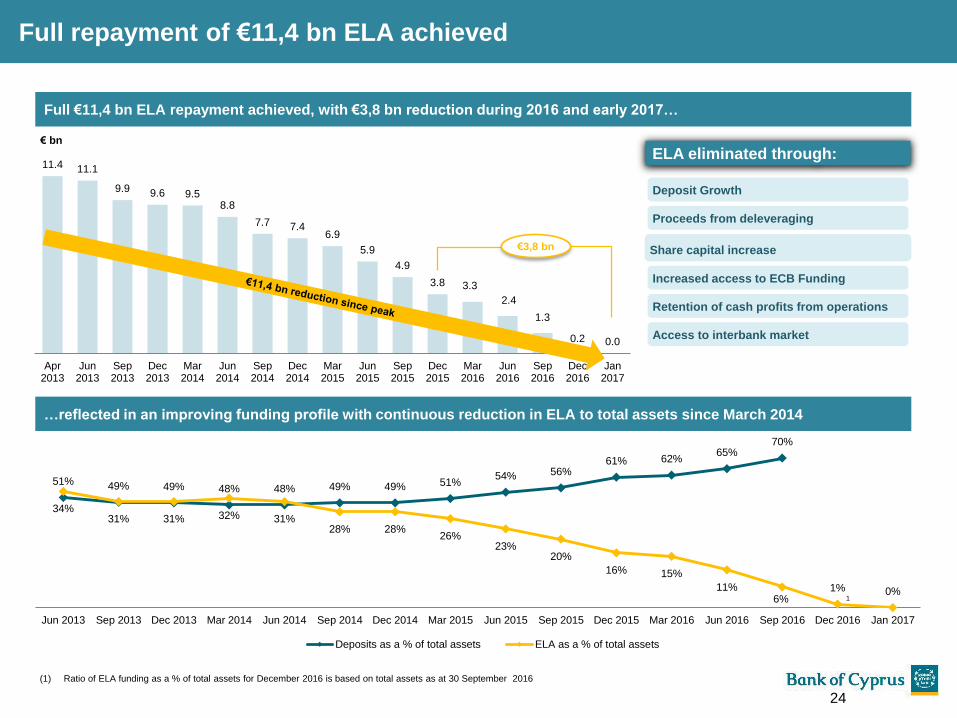
Full repayment of €11,4 bn ELA achieved
(1) Ratio of ELA funding as a % of total assets for December 2016 is based on total assets as at 30 September 2016
Full €11,4 bn ELA repayment achieved, with €3,8 bn reduction during 2016 and early 2017…
11.4 11.1
9.9 9.6 9.58.8
7.7 7.46.9
5.9
4.9
3.8 3.3
2.4
1.3
0.2 0.0
Apr2013
Jun2013
Sep2013
Dec2013
Mar2014
Jun2014
Sep2014
Dec2014
Mar2015
Jun2015
Sep2015
Dec2015
Mar2016
Jun2016
Sep2016
Dec2016
Jan2017
€ bn
1
…reflected in an improving funding profile with continuous reduction in ELA to total assets since March 2014
€3,8 bn
51% 49% 49% 48% 48% 49% 49% 51%54% 56%
61% 62%65%
70%
34%31% 31% 32% 31%
28% 28%26%
23%20%
16% 15%
11%6%
1% 0%
Jun 2013 Sep 2013 Dec 2013 Mar 2014 Jun 2014 Sep 2014 Dec 2014 Mar 2015 Jun 2015 Sep 2015 Dec 2015 Mar 2016 Jun 2016 Sep 2016 Dec 2016 Jan 2017
Deposits as a % of total assets ELA as a % of total assets
Deposit Growth
Proceeds from deleveraging
Share capital increase
Increased access to ECB Funding
Retention of cash profits from operations
Access to interbank market
ELA eliminated through:
24
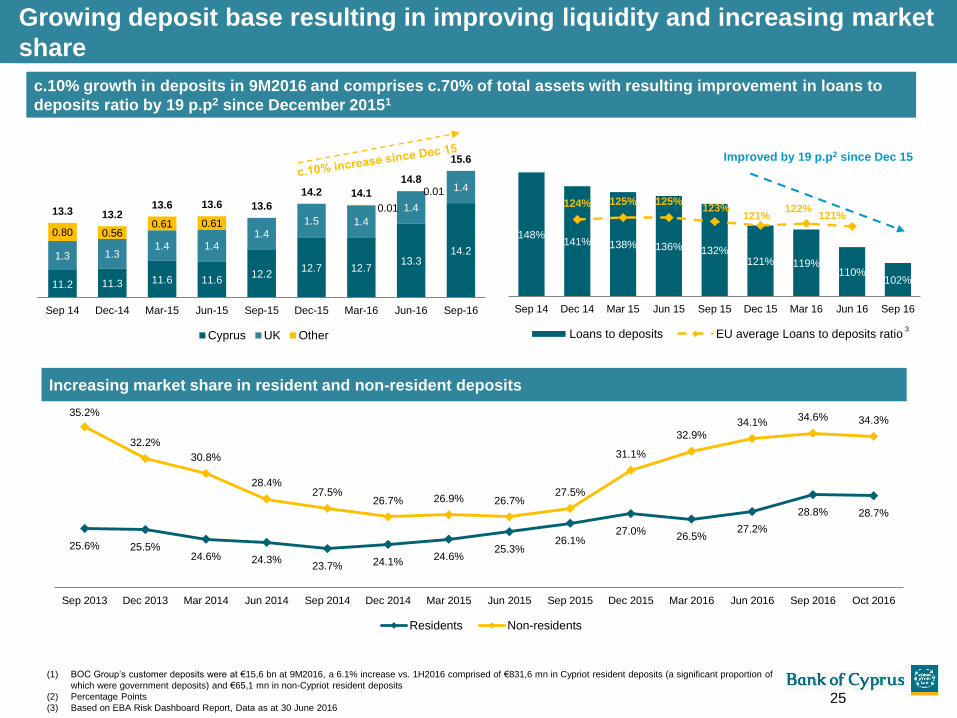
148% 141% 138% 136% 132%
121% 119% 110%
102%
124% 125% 125% 123%
121% 122%
121%
Sep 14 Dec 14 Mar 15 Jun 15 Sep 15 Dec 15 Mar 16 Jun 16 Sep 16
Loans to deposits EU average Loans to deposits ratio
Improved by 19 p.p2 since Dec 15
Growing deposit base resulting in improving liquidity and increasing market
share
Increasing market share in resident and non-resident deposits
(1) BOC Group’s customer deposits were at €15,6 bn at 9M2016, a 6.1% increase vs. 1H2016 comprised of €831,6 mn in Cypriot resident deposits (a significant proportion of
which were government deposits) and €65,1 mn in non-Cypriot resident deposits
(2) Percentage Points
(3) Based on EBA Risk Dashboard Report, Data as at 30 June 2016
c.10% growth in deposits in 9M2016 and comprises c.70% of total assets with resulting improvement in loans to
deposits ratio by 19 p.p2 since December 20151
11.2 11.3 11.6 11.612.2
12.7 12.713.3
14.21.3 1.31.4 1.4
1.4
1.5 1.4
1.4
1.4
0.80 0.560.61 0.61
0.01
0.01
13.3 13.213.6 13.6 13.6
14.2 14.1
14.8
15.6
Sep 14 Dec-14 Mar-15 Jun-15 Sep-15 Dec-15 Mar-16 Jun-16 Sep-16
Cyprus UK Other
25.6% 25.5% 24.6% 24.3%
23.7% 24.1% 24.6%
25.3% 26.1%
27.0% 26.5%
27.2%
28.8% 28.7%
35.2%
32.2%
30.8%
28.4% 27.5%
26.7% 26.9% 26.7% 27.5%
31.1%
32.9%
34.1% 34.6% 34.3%
Sep 2013 Dec 2013 Mar 2014 Jun 2014 Sep 2014 Dec 2014 Mar 2015 Jun 2015 Sep 2015 Dec 2015 Mar 2016 Jun 2016 Sep 2016 Oct 2016
Residents Non-residents
3
25
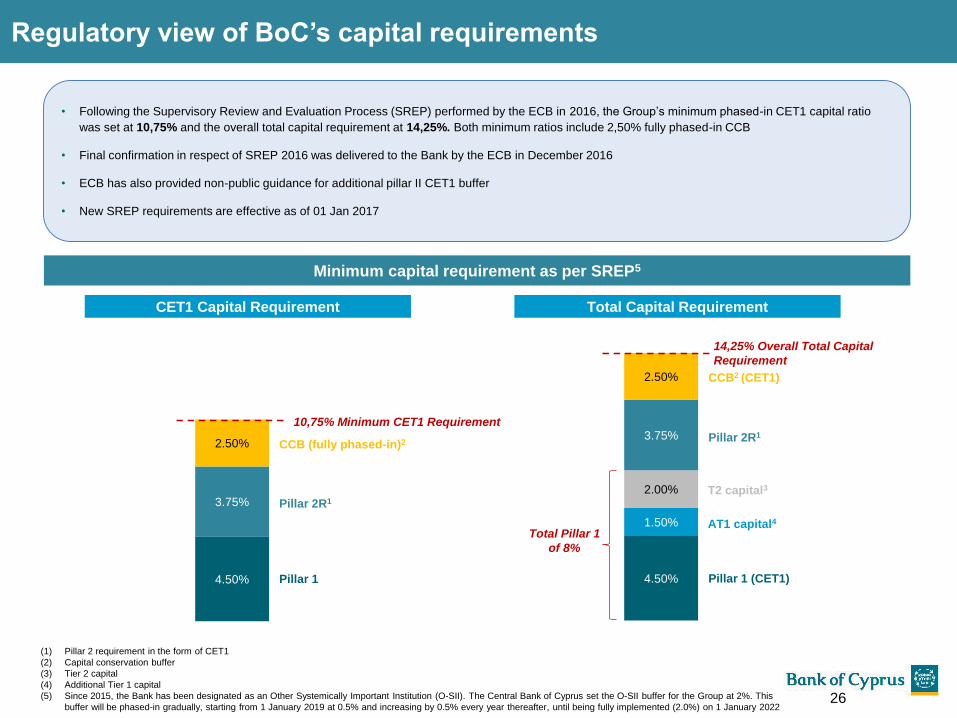
4.50%
1.50%
2.00%
3.75%
2.50%
14,25% Overall Total Capital
Requirement
CCB2 (CET1)
4.50%
3.75%
2.50%
26
Regulatory view of BoC’s capital requirements
Minimum capital requirement as per SREP5
CET1 Capital Requirement Total Capital Requirement
Pillar 1
Pillar 2R1
CCB (fully phased-in)2
(1) Pillar 2 requirement in the form of CET1
(2) Capital conservation buffer
(3) Tier 2 capital
(4) Additional Tier 1 capital
(5) Since 2015, the Bank has been designated as an Other Systemically Important Institution (O-SII). The Central Bank of Cyprus set the O-SII buffer for the Group at 2%. This
buffer will be phased-in gradually, starting from 1 January 2019 at 0.5% and increasing by 0.5% every year thereafter, until being fully implemented (2.0%) on 1 January 2022
10,75% Minimum CET1 Requirement
Pillar 2R1
Pillar 1 (CET1)
AT1 capital4
T2 capital3
Total Pillar 1
of 8%
• Following the Supervisory Review and Evaluation Process (SREP) performed by the ECB in 2016, the Group’s minimum phased-in CET1 capital ratio
was set at 10,75% and the overall total capital requirement at 14,25%. Both minimum ratios include 2,50% fully phased-in CCB
• Final confirmation in respect of SREP 2016 was delivered to the Bank by the ECB in December 2016
• ECB has also provided non-public guidance for additional pillar II CET1 buffer
• New SREP requirements are effective as of 01 Jan 2017
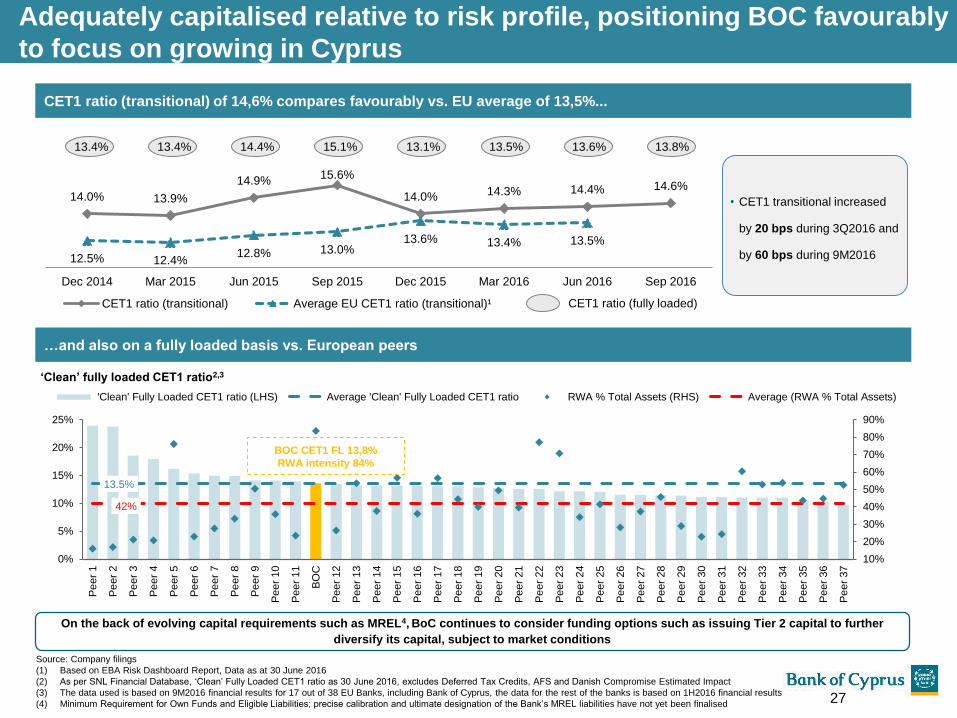
13.4% 13.4% 14.4% 15.1% 13.1% 13.5% 13.6% 13.8%
Adequately capitalised relative to risk profile, positioning BOC favourably
to focus on growing in Cyprus
Source: Company filings
(1) Based on EBA Risk Dashboard Report, Data as at 30 June 2016
(2) As per SNL Financial Database, ‘Clean’ Fully Loaded CET1 ratio as 30 June 2016, excludes Deferred Tax Credits, AFS and Danish Compromise Estimated Impact
(3) The data used is based on 9M2016 financial results for 17 out of 38 EU Banks, including Bank of Cyprus, the data for the rest of the banks is based on 1H2016 financial results
(4) Minimum Requirement for Own Funds and Eligible Liabilities; precise calibration and ultimate designation of the Bank’s MREL liabilities have not yet been finalised
14.0% 13.9%
14.9% 15.6%
14.0% 14.3% 14.4% 14.6%
12.5% 12.4% 12.8% 13.0%
13.6% 13.4% 13.5%
Dec 2014 Mar 2015 Jun 2015 Sep 2015 Dec 2015 Mar 2016 Jun 2016 Sep 2016
CET1 ratio (transitional) Average EU CET1 ratio (transitional)¹
CET1 ratio (transitional) of 14,6% compares favourably vs. EU average of 13,5%...
CET1 ratio (fully loaded)
…and also on a fully loaded basis vs. European peers
‘Clean’ fully loaded CET1 ratio2,3
On the back of evolving capital requirements such as MREL4, BoC continues to consider funding options such as issuing Tier 2 capital to further
diversify its capital, subject to market conditions
• CET1 transitional increased
by 20 bps during 3Q2016 and
by 60 bps during 9M2016
13.5%
42%
10%
20%
30%
40%
50%
60%
70%
80%
90%
0%
5%
10%
15%
20%
25%
Pe
er
1
Pe
er
2
Pe
er
3
Pe
er
4
Pe
er
5
Pe
er
6
Pe
er
7
Pe
er
8
Pe
er
9
Pe
er
10
Pe
er
11
BO
C
Pe
er
12
Pe
er
13
Pe
er
14
Pe
er
15
Pe
er
16
Pe
er
17
Pe
er
18
Pe
er
19
Pe
er
20
Pe
er
21
Pe
er
22
Pe
er
23
Pe
er
24
Pe
er
25
Pe
er
26
Pe
er
27
Pe
er
28
Pe
er
29
Pe
er
30
Pe
er
31
Pe
er
32
Pe
er
33
Pe
er
34
Pe
er
35
Pe
er
36
Pe
er
37
'Clean' Fully Loaded CET1 ratio (LHS) Average 'Clean' Fully Loaded CET1 ratio RWA % Total Assets (RHS) Average (RWA % Total Assets)
BOC CET1 FL 13,8%
RWA intensity 84%
27
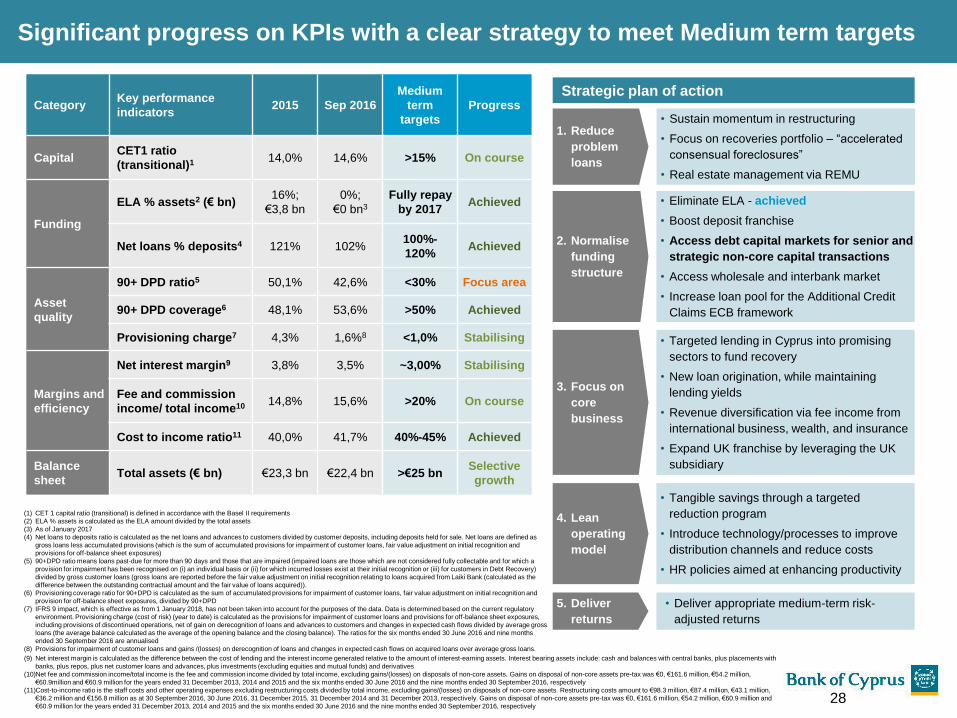
Significant progress on KPIs with a clear strategy to meet Medium term targets
(1) CET 1 capital ratio (transitional) is defined in accordance with the Basel II requirements
(2) ELA % assets is calculated as the ELA amount divided by the total assets
(3) As of January 2017
(4) Net loans to deposits ratio is calculated as the net loans and advances to customers divided by customer deposits, including deposits held for sale. Net loans are defined as
gross loans less accumulated provisions (which is the sum of accumulated provisions for impairment of customer loans, fair value adjustment on initial recognition and
provisions for off-balance sheet exposures)
(5) 90+DPD ratio means loans past-due for more than 90 days and those that are impaired (impaired loans are those which are not considered fully collectable and for which a
provision for impairment has been recognised on (i) an individual basis or (ii) for which incurred losses exist at their initial recognition or (iii) for customers in Debt Recovery)
divided by gross customer loans (gross loans are reported before the fair value adjustment on initial recognition relating to loans acquired from Laiki Bank (calculated as the
difference between the outstanding contractual amount and the fair value of loans acquired)).
(6) Provisioning coverage ratio for 90+DPD is calculated as the sum of accumulated provisions for impairment of customer loans, fair value adjustment on initial recognition and
provision for off-balance sheet exposures, divided by 90+DPD
(7) IFRS 9 impact, which is effective as from 1 January 2018, has not been taken into account for the purposes of the data. Data is determined based on the current regulatory
environment. Provisioning charge (cost of risk) (year to date) is calculated as the provisions for impairment of customer loans and provisions for off-balance sheet exposures,
including provisions of discontinued operations, net of gain on derecognition of loans and advances to customers and changes in expected cash flows divided by average gross
loans (the average balance calculated as the average of the opening balance and the closing balance). The ratios for the six months ended 30 June 2016 and nine months
ended 30 September 2016 are annualised
(8) Provisions for impairment of customer loans and gains /(losses) on derecognition of loans and changes in expected cash flows on acquired loans over average gross loans.
CategoryKey performance
indicators2015 Sep 2016
Medium
term
targets
Progress
CapitalCET1 ratio
(transitional)1 14,0% 14,6% >15% On course
Funding
ELA % assets2 (€ bn)16%;
€3,8 bn
0%;
€0 bn3
Fully repay
by 2017Achieved
Net loans % deposits4 121% 102%100%-
120%Achieved
Asset
quality
90+ DPD ratio5 50,1% 42,6% <30% Focus area
90+ DPD coverage6 48,1% 53,6% >50% Achieved
Provisioning charge7 4,3% 1,6%8 <1,0% Stabilising
Margins and
efficiency
Net interest margin9 3,8% 3,5% ~3,00% Stabilising
Fee and commission
income/ total income10 14,8% 15,6% >20% On course
Cost to income ratio11 40,0% 41,7% 40%-45% Achieved
Balance
sheetTotal assets (€ bn) €23,3 bn €22,4 bn >€25 bn
Selective
growth
Strategic plan of action
• Sustain momentum in restructuring
• Focus on recoveries portfolio – “accelerated
consensual foreclosures”
• Real estate management via REMU
1. Reduce
problem
loans
• Eliminate ELA - achieved
• Boost deposit franchise
• Access debt capital markets for senior and
strategic non-core capital transactions
• Access wholesale and interbank market
• Increase loan pool for the Additional Credit
Claims ECB framework
2. Normalise
funding
structure
• Targeted lending in Cyprus into promising
sectors to fund recovery
• New loan origination, while maintaining
lending yields
• Revenue diversification via fee income from
international business, wealth, and insurance
• Expand UK franchise by leveraging the UK
subsidiary
3. Focus on
core
business
• Tangible savings through a targeted
reduction program
• Introduce technology/processes to improve
distribution channels and reduce costs
• HR policies aimed at enhancing productivity
4. Lean
operating
model
• Deliver appropriate medium-term risk-
adjusted returns
5. Deliver
returns
(9) Net interest margin is calculated as the difference between the cost of lending and the interest income generated relative to the amount of interest-earning assets. Interest bearing assets include: cash and balances with central banks, plus placements with
banks, plus repos, plus net customer loans and advances, plus investments (excluding equities and mutual funds) and derivatives
(10)Net fee and commission income/total income is the fee and commission income divided by total income, excluding gains/(losses) on disposals of non-core assets. Gains on disposal of non-core assets pre-tax was €0, €161.6 million, €54.2 million,
€60.9million and €60.9 million for the years ended 31 December 2013, 2014 and 2015 and the six months ended 30 June 2016 and the nine months ended 30 September 2016, respectively
(11)Cost-to-income ratio is the staff costs and other operating expenses excluding restructuring costs divided by total income, excluding gains/(losses) on disposals of non-core assets. Restructuring costs amount to €98.3 million, €87.4 million, €43.1 million,
€36.2 million and €156.8 million as at 30 September 2016, 30 June 2016, 31 December 2015, 31 December 2014 and 31 December 2013, respectively. Gains on disposal of non-core assets pre-tax was €0, €161.6 million, €54.2 million, €60.9 million and
€60.9 million for the years ended 31 December 2013, 2014 and 2015 and the six months ended 30 June 2016 and the nine months ended 30 September 2016, respectively28
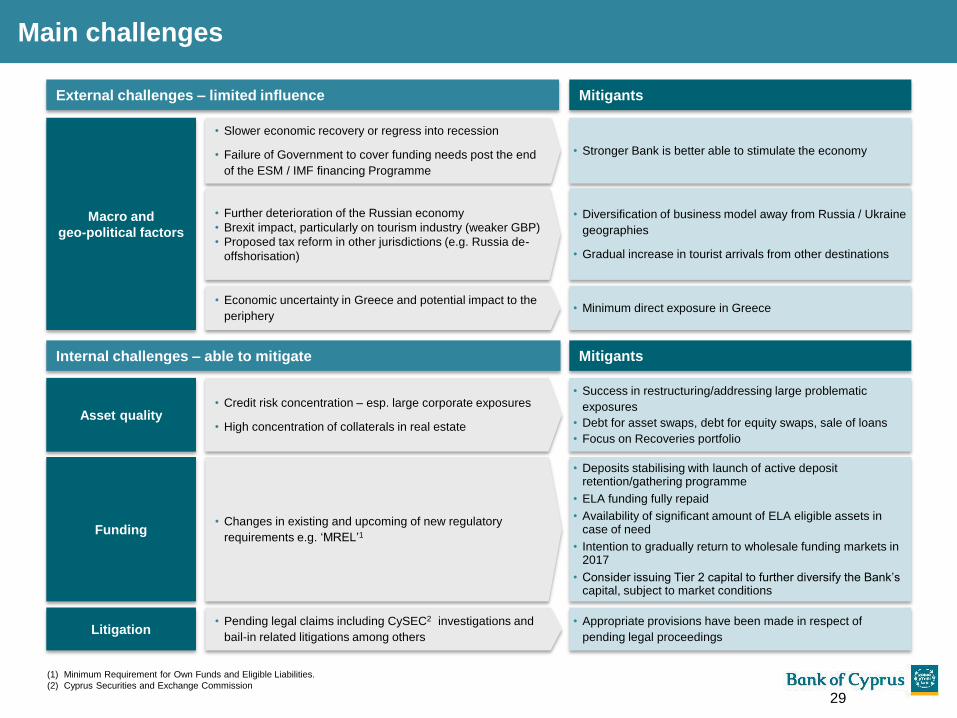
Macro and
geo-political factors
• Slower economic recovery or regress into recession
• Failure of Government to cover funding needs post the end
of the ESM / IMF financing Programme
Asset quality• Credit risk concentration – esp. large corporate exposures
• High concentration of collaterals in real estate
• Success in restructuring/addressing large problematic
exposures
• Debt for asset swaps, debt for equity swaps, sale of loans
• Focus on Recoveries portfolio
Funding
External challenges – limited influence
• Further deterioration of the Russian economy
• Brexit impact, particularly on tourism industry (weaker GBP)
• Proposed tax reform in other jurisdictions (e.g. Russia de-
offshorisation)
Internal challenges – able to mitigate Mitigants
• Changes in existing and upcoming of new regulatory
requirements e.g. ‘MREL’1
• Deposits stabilising with launch of active deposit retention/gathering programme
• ELA funding fully repaid
• Availability of significant amount of ELA eligible assets in case of need
• Intention to gradually return to wholesale funding markets in 2017
• Consider issuing Tier 2 capital to further diversify the Bank’s capital, subject to market conditions
Litigation• Pending legal claims including CySEC2 investigations and
bail-in related litigations among others
• Appropriate provisions have been made in respect of
pending legal proceedings
• Diversification of business model away from Russia / Ukraine
geographies
• Gradual increase in tourist arrivals from other destinations
Mitigants
• Stronger Bank is better able to stimulate the economy
• Economic uncertainty in Greece and potential impact to the
periphery • Minimum direct exposure in Greece
Main challenges
(1) Minimum Requirement for Own Funds and Eligible Liabilities.
(2) Cyprus Securities and Exchange Commission
29

Appendices
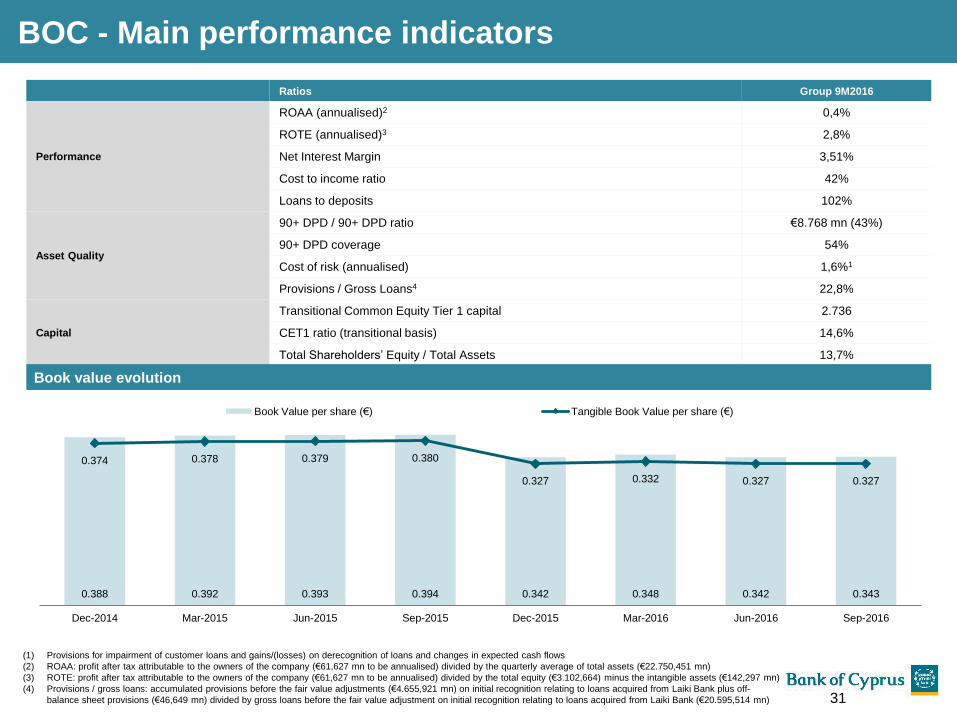
BOC - Main performance indicators
Ratios Group 9M2016
Performance
ROAA (annualised)2 0,4%
ROTE (annualised)3 2,8%
Net Interest Margin 3,51%
Cost to income ratio 42%
Loans to deposits 102%
Asset Quality
90+ DPD / 90+ DPD ratio €8.768 mn (43%)
90+ DPD coverage 54%
Cost of risk (annualised) 1,6%1
Provisions / Gross Loans4 22,8%
Capital
Transitional Common Equity Tier 1 capital 2.736
CET1 ratio (transitional basis) 14,6%
Total Shareholders’ Equity / Total Assets 13,7%
(1) Provisions for impairment of customer loans and gains/(losses) on derecognition of loans and changes in expected cash flows
(2) ROAA: profit after tax attributable to the owners of the company (€61,627 mn to be annualised) divided by the quarterly average of total assets (€22.750,451 mn)
(3) ROTE: profit after tax attributable to the owners of the company (€61,627 mn to be annualised) divided by the total equity (€3.102,664) minus the intangible assets (€142,297 mn)
(4) Provisions / gross loans: accumulated provisions before the fair value adjustments (€4.655,921 mn) on initial recognition relating to loans acquired from Laiki Bank plus off-
balance sheet provisions (€46,649 mn) divided by gross loans before the fair value adjustment on initial recognition relating to loans acquired from Laiki Bank (€20.595,514 mn)
0.388 0.392 0.393 0.394 0.342 0.348 0.342 0.343
0.374 0.378 0.379 0.380
0.327 0.332 0.327 0.327
Dec-2014 Mar-2015 Jun-2015 Sep-2015 Dec-2015 Mar-2016 Jun-2016 Sep-2016
Book Value per share (€) Tangible Book Value per share (€)
Book value evolution
31
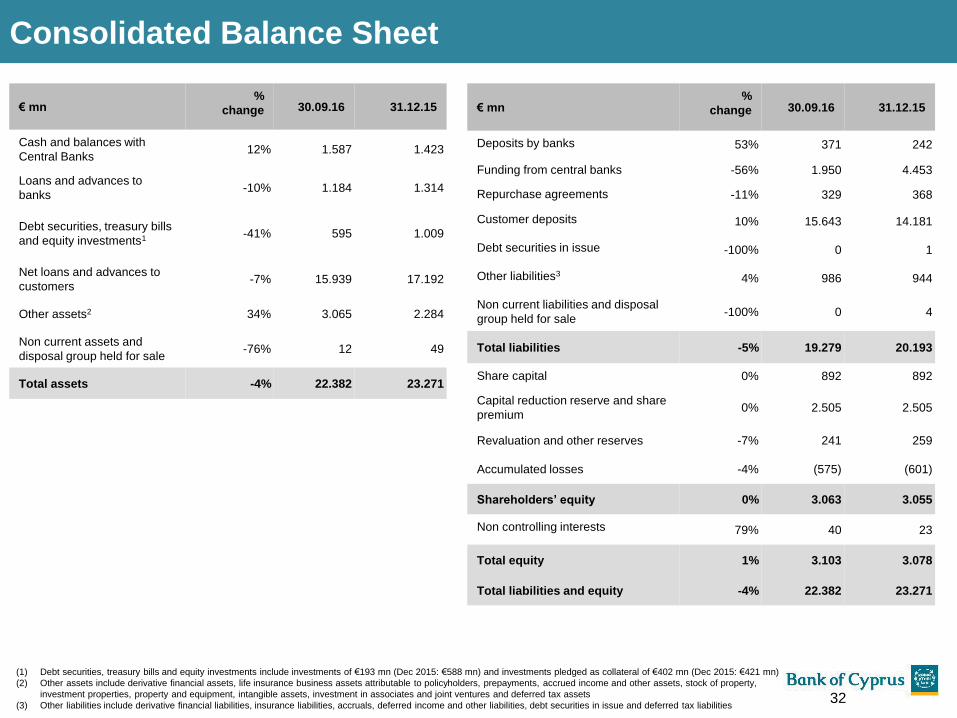
€ mn%
change 30.09.16 31.12.15
Cash and balances with
Central Banks12% 1.587 1.423
Loans and advances to
banks-10% 1.184 1.314
Debt securities, treasury bills
and equity investments1 -41% 595 1.009
Net loans and advances to
customers-7% 15.939 17.192
Other assets2 34% 3.065 2.284
Non current assets and
disposal group held for sale-76% 12 49
Total assets -4% 22.382 23.271
€ mn%
change 30.09.16 31.12.15
Deposits by banks 53% 371 242
Funding from central banks -56% 1.950 4.453
Repurchase agreements -11% 329 368
Customer deposits 10% 15.643 14.181
Debt securities in issue -100% 0 1
Other liabilities34% 986 944
Non current liabilities and disposal
group held for sale-100% 0 4
Total liabilities -5% 19.279 20.193
Share capital 0% 892 892
Capital reduction reserve and share
premium 0% 2.505 2.505
Revaluation and other reserves -7% 241 259
Accumulated losses -4% (575) (601)
Shareholders’ equity 0% 3.063 3.055
Non controlling interests 79% 40 23
Total equity 1% 3.103 3.078
Total liabilities and equity -4% 22.382 23.271
Consolidated Balance Sheet
(1) Debt securities, treasury bills and equity investments include investments of €193 mn (Dec 2015: €588 mn) and investments pledged as collateral of €402 mn (Dec 2015: €421 mn)
(2) Other assets include derivative financial assets, life insurance business assets attributable to policyholders, prepayments, accrued income and other assets, stock of property,
investment properties, property and equipment, intangible assets, investment in associates and joint ventures and deferred tax assets
(3) Other liabilities include derivative financial liabilities, insurance liabilities, accruals, deferred income and other liabilities, debt securities in issue and deferred tax liabilities32
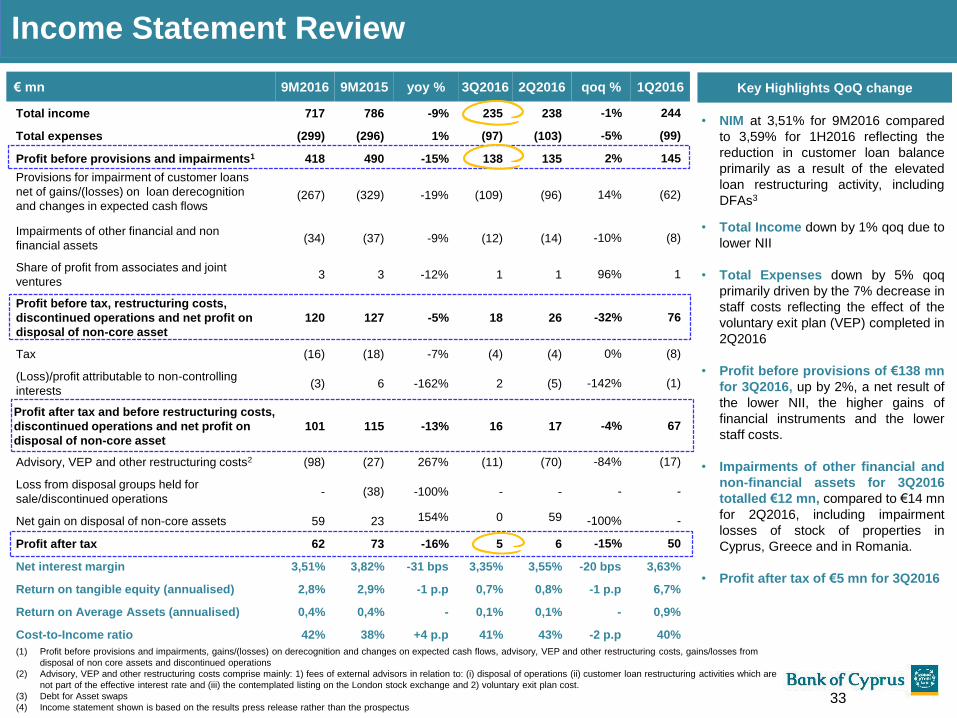
€ mn 9M2016 9M2015 yoy % 3Q2016 2Q2016 qoq % 1Q2016
Total income 717 786 -9% 235 238 -1% 244
Total expenses (299) (296) 1% (97) (103) -5% (99)
Profit before provisions and impairments1 418 490 -15% 138 135 2% 145
Provisions for impairment of customer loans
net of gains/(losses) on loan derecognition
and changes in expected cash flows(267) (329) -19% (109) (96) 14% (62)
Impairments of other financial and non
financial assets(34) (37) -9% (12) (14) -10% (8)
Share of profit from associates and joint
ventures3 3 -12% 1 1 96% 1
Profit before tax, restructuring costs,
discontinued operations and net profit on
disposal of non-core asset
120 127 -5% 18 26 -32% 76
Tax (16) (18) -7% (4) (4) 0% (8)
(Loss)/profit attributable to non-controlling
interests(3) 6 -162% 2 (5) -142% (1)
Profit after tax and before restructuring costs,
discontinued operations and net profit on
disposal of non-core asset
101 115 -13% 16 17 -4% 67
Advisory, VEP and other restructuring costs2 (98) (27) 267% (11) (70) -84% (17)
Loss from disposal groups held for
sale/discontinued operations- (38) -100% - - - -
Net gain on disposal of non-core assets 59 23 154% 0 59 -100% -
Profit after tax 62 73 -16% 5 6 -15% 50
Net interest margin 3,51% 3,82% -31 bps 3,35% 3,55% -20 bps 3,63%
Return on tangible equity (annualised) 2,8% 2,9% -1 p.p 0,7% 0,8% -1 p.p 6,7%
Return on Average Assets (annualised) 0,4% 0,4% - 0,1% 0,1% - 0,9%
Cost-to-Income ratio 42% 38% +4 p.p 41% 43% -2 p.p 40%
Income Statement Review
(1) Profit before provisions and impairments, gains/(losses) on derecognition and changes on expected cash flows, advisory, VEP and other restructuring costs, gains/losses from
disposal of non core assets and discontinued operations
(2) Advisory, VEP and other restructuring costs comprise mainly: 1) fees of external advisors in relation to: (i) disposal of operations (ii) customer loan restructuring activities which are
not part of the effective interest rate and (iii) the contemplated listing on the London stock exchange and 2) voluntary exit plan cost.
(3) Debt for Asset swaps
(4) Income statement shown is based on the results press release rather than the prospectus
Key Highlights QoQ change
• NIM at 3,51% for 9M2016 compared
to 3,59% for 1H2016 reflecting the
reduction in customer loan balance
primarily as a result of the elevated
loan restructuring activity, including
DFAs3
• Total Income down by 1% qoq due to
lower NII
• Total Expenses down by 5% qoq
primarily driven by the 7% decrease in
staff costs reflecting the effect of the
voluntary exit plan (VEP) completed in
2Q2016
• Profit before provisions of €138 mn
for 3Q2016, up by 2%, a net result of
the lower NII, the higher gains of
financial instruments and the lower
staff costs.
• Impairments of other financial and
non-financial assets for 3Q2016
totalled €12 mn, compared to €14 mn
for 2Q2016, including impairment
losses of stock of properties in
Cyprus, Greece and in Romania.
• Profit after tax of €5 mn for 3Q2016
33
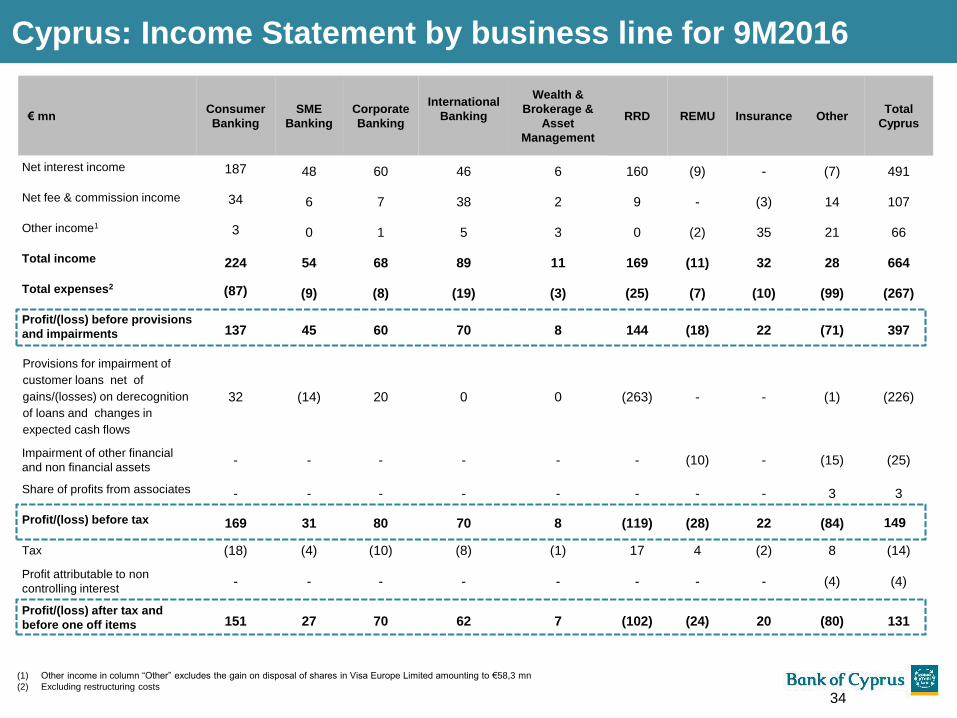
€ mnConsumer
Banking
SME
Banking
Corporate
Banking
International
Banking
Wealth &
Brokerage &
Asset
Management
RRD REMU Insurance OtherTotal
Cyprus
Net interest income 187 48 60 46 6 160 (9) - (7) 491
Net fee & commission income 34 6 7 38 2 9 - (3) 14 107
Other income1 3 0 1 5 3 0 (2) 35 21 66
Total income 224 54 68 89 11 169 (11) 32 28 664
Total expenses2 (87) (9) (8) (19) (3) (25) (7) (10) (99) (267)
Profit/(loss) before provisions
and impairments 137 45 60 70 8 144 (18) 22 (71) 397
Provisions for impairment of
customer loans net of
gains/(losses) on derecognition
of loans and changes in
expected cash flows
32 (14) 20 0 0 (263) - - (1) (226)
Impairment of other financial
and non financial assets- - - - - - (10) - (15) (25)
Share of profits from associates - - - - - - - - 3 3
Profit/(loss) before tax 169 31 80 70 8 (119) (28) 22 (84) 149
Tax (18) (4) (10) (8) (1) 17 4 (2) 8 (14)
Profit attributable to non
controlling interest- - - - - - - - (4) (4)
Profit/(loss) after tax and
before one off items 151 27 70 62 7 (102) (24) 20 (80) 131
Cyprus: Income Statement by business line for 9M2016
(1) Other income in column “Other” excludes the gain on disposal of shares in Visa Europe Limited amounting to €58,3 mn
(2) Excluding restructuring costs
34
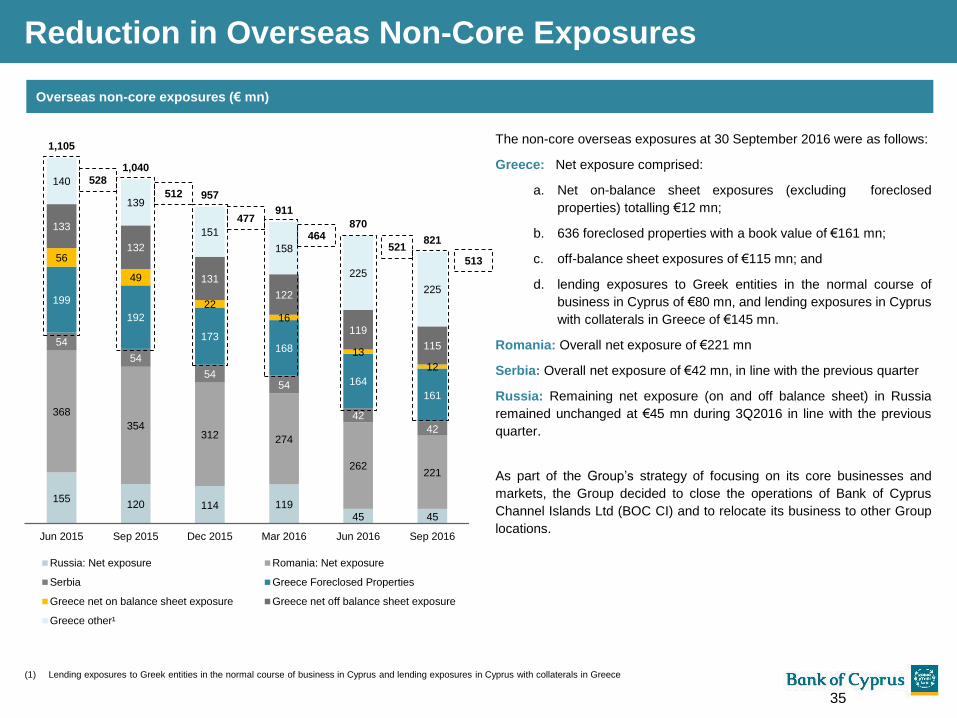
Reduction in Overseas Non-Core Exposures
Overseas non-core exposures (€ mn)
The non-core overseas exposures at 30 September 2016 were as follows:
Greece: Net exposure comprised:
a. Net on-balance sheet exposures (excluding foreclosed
properties) totalling €12 mn;
b. 636 foreclosed properties with a book value of €161 mn;
c. off-balance sheet exposures of €115 mn; and
d. lending exposures to Greek entities in the normal course of
business in Cyprus of €80 mn, and lending exposures in Cyprus
with collaterals in Greece of €145 mn.
Romania: Overall net exposure of €221 mn
Serbia: Overall net exposure of €42 mn, in line with the previous quarter
Russia: Remaining net exposure (on and off balance sheet) in Russia
remained unchanged at €45 mn during 3Q2016 in line with the previous
quarter.
As part of the Group’s strategy of focusing on its core businesses and
markets, the Group decided to close the operations of Bank of Cyprus
Channel Islands Ltd (BOC CI) and to relocate its business to other Group
locations.
(1) Lending exposures to Greek entities in the normal course of business in Cyprus and lending exposures in Cyprus with collaterals in Greece
155120 114 119
45 45
368
354312 274
262221
54
54
5454
42
42
199
192
173168
164
161
56
49
22
16
13
12
133
132
131
122
119
115
140
139
151
158
225
225
1,105
1,040
957
911
870
821
Jun 2015 Sep 2015 Dec 2015 Mar 2016 Jun 2016 Sep 2016
Russia: Net exposure Romania: Net exposure
Serbia Greece Foreclosed Properties
Greece net on balance sheet exposure Greece net off balance sheet exposure
Greece other¹
528
512
477
464521
513
35
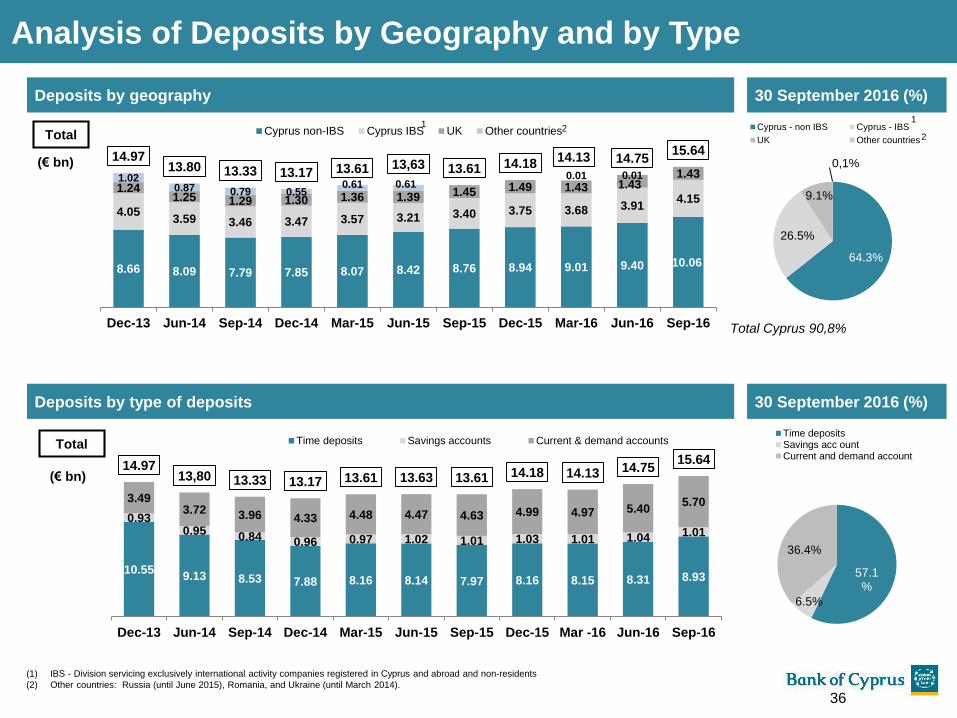
8.66 8.09 7.79 7.85 8.07 8.42 8.76 8.94 9.01 9.40 10.06
4.053.59 3.46 3.47 3.57 3.21 3.40 3.75 3.68 3.91
4.151.24
1.25 1.29 1.30 1.36 1.39 1.45 1.49 1.43 1.431.431.02
0.87 0.79 0.550.61 0.61
0.01 0.01
14.9713.80 13.33 13.17 13.61 13,63 13.61 14.18
14.13 14.7515.64
Dec-13 Jun-14 Sep-14 Dec-14 Mar-15 Jun-15 Sep-15 Dec-15 Mar-16 Jun-16 Sep-16
Cyprus non-IBS Cyprus IBS UK Other countriesTotal
(€ bn)
(1) IBS - Division servicing exclusively international activity companies registered in Cyprus and abroad and non-residents
(2) Other countries: Russia (until June 2015), Romania, and Ukraine (until March 2014).
Deposits by geography
Analysis of Deposits by Geography and by Type
30 September 2016 (%)
64.3%
26.5%
9.1%
0,1%
Cyprus - non IBS Cyprus - IBS
UK Other countries
Total Cyprus 90,8%
1
2
10.559.13 8.53 7.88 8.16 8.14 7.97 8.16 8.15 8.31 8.93
0.930.95
0.84 0.96 0.97 1.02 1.01 1.03 1.01 1.04 1.01
3.493.72 3.96 4.33 4.48 4.47 4.63 4.99 4.97 5.40
5.70
14.9713,80 13.33 13.17 13.61 13.63 13.61 14.18 14.13 14.75
15.64
Dec-13 Jun-14 Sep-14 Dec-14 Mar-15 Jun-15 Sep-15 Dec-15 Mar -16 Jun-16 Sep-16
Time deposits Savings accounts Current & demand accountsTotal
(€ bn)
Deposits by type of deposits 30 September 2016 (%)
57.1%
6.5%
36.4%
Time depositsSavings acc ountCurrent and demand account
12
36
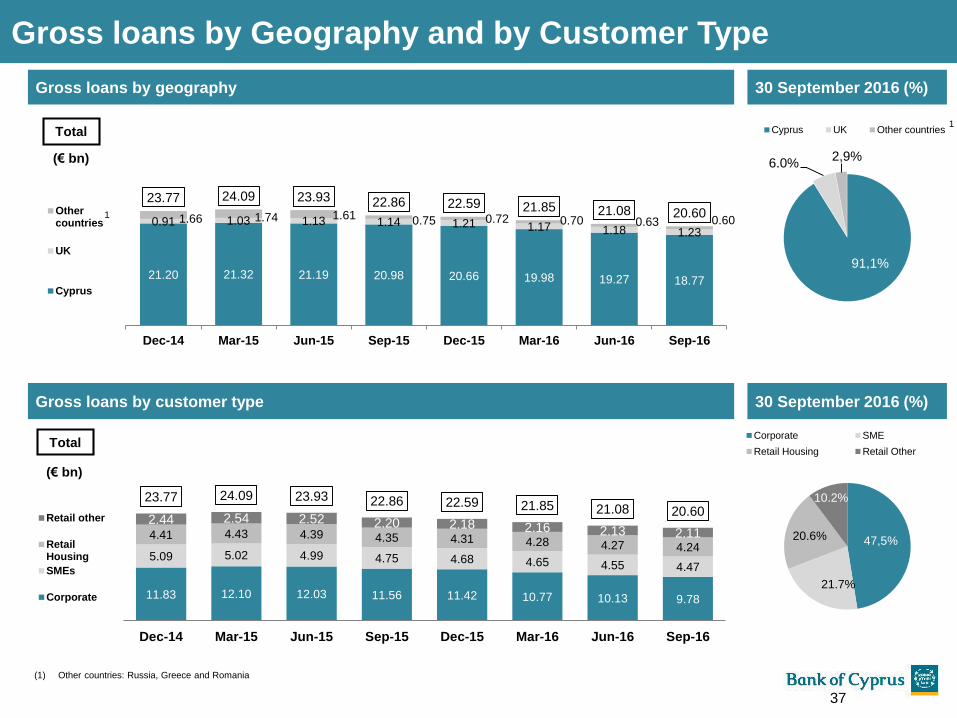
21.20 21.32 21.19 20.98 20.66 19.98 19.27 18.77
0.91 1.03 1.13 1.14 1.21 1.17 1.18 1.231.66 1.74 1.61 0.75 0.72 0.70 0.63 0.60
23.77 24.09 23.93 22.86 22.59 21.85 21.08 20.60
Dec-14 Mar-15 Jun-15 Sep-15 Dec-15 Mar-16 Jun-16 Sep-16
Othercountries
UK
Cyprus
1
Total
(€ bn)
(1) Other countries: Russia, Greece and Romania
Gross loans by geography
Gross loans by Geography and by Customer Type
91,1%
6.0%2,9%
Cyprus UK Other countries1
11.83 12.10 12.03 11.56 11.42 10.77 10.13 9.78
5.09 5.02 4.99 4.75 4.68 4.65 4.55 4.47
4.41 4.43 4.39 4.35 4.31 4.28 4.27 4.24
2.44 2.54 2.52 2.20 2.18 2.16 2.13 2.11
23.77 24.09 23.93 22.86 22.59 21.85 21.08 20.60
Dec-14 Mar-15 Jun-15 Sep-15 Dec-15 Mar-16 Jun-16 Sep-16
Retail other
RetailHousing
SMEs
Corporate
(€ bn)
Total
47,5%
21.7%
20.6%
10.2%
Corporate SME
Retail Housing Retail Other
30 September 2016 (%)
30 September 2016 (%)Gross loans by customer type
37
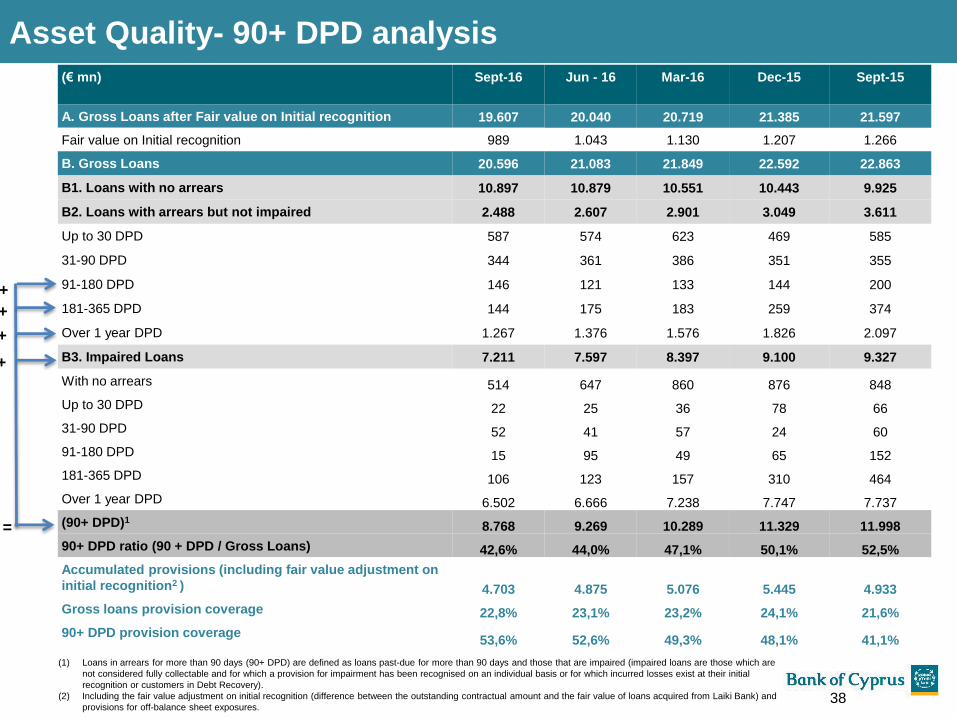
Asset Quality- 90+ DPD analysis
(€ mn) Sept-16 Jun - 16 Mar-16 Dec-15 Sept-15
A. Gross Loans after Fair value on Initial recognition 19.607 20.040 20.719 21.385 21.597
Fair value on Initial recognition 989 1.043 1.130 1.207 1.266
B. Gross Loans 20.596 21.083 21.849 22.592 22.863
B1. Loans with no arrears 10.897 10.879 10.551 10.443 9.925
B2. Loans with arrears but not impaired 2.488 2.607 2.901 3.049 3.611
Up to 30 DPD 587 574 623 469 585
31-90 DPD 344 361 386 351 355
91-180 DPD 146 121 133 144 200
181-365 DPD 144 175 183 259 374
Over 1 year DPD 1.267 1.376 1.576 1.826 2.097
B3. Impaired Loans 7.211 7.597 8.397 9.100 9.327
With no arrears 514 647 860 876 848
Up to 30 DPD 22 25 36 78 66
31-90 DPD 52 41 57 24 60
91-180 DPD 15 95 49 65 152
181-365 DPD 106 123 157 310 464
Over 1 year DPD 6.502 6.666 7.238 7.747 7.737
(90+ DPD)18.768 9.269 10.289 11.329 11.998
90+ DPD ratio (90 + DPD / Gross Loans) 42,6% 44,0% 47,1% 50,1% 52,5%
Accumulated provisions (including fair value adjustment on
initial recognition2 ) 4.703 4.875 5.076 5.445 4.933
Gross loans provision coverage 22,8% 23,1% 23,2% 24,1% 21,6%
90+ DPD provision coverage53,6% 52,6% 49,3% 48,1% 41,1%
(1) Loans in arrears for more than 90 days (90+ DPD) are defined as loans past-due for more than 90 days and those that are impaired (impaired loans are those which are
not considered fully collectable and for which a provision for impairment has been recognised on an individual basis or for which incurred losses exist at their initial
recognition or customers in Debt Recovery).
(2) Including the fair value adjustment on initial recognition (difference between the outstanding contractual amount and the fair value of loans acquired from Laiki Bank) and
provisions for off-balance sheet exposures.
+
+
+
+
=
38

90+ DPD by business line (€ bn)
1.31 1.23 0.95 0.88 0.84 0.67 0.59
0.58 0.560.41 0.35 0.32 0.31 0.26
0.63 0.590.54 0.48 0.45 0.43 0.43
0.56 0.53
0.370.33 0.31
0.28 0.28
2.41 2.43
2.382.00
1.651.26 1.12
1.26 1.20
1.10
0.97
0.60
0.440.41
1.121.10
1.12
1.02
0.94
0.840.74
2.202.24
2.31
2.40
2.23
2.132.04
2.72 2.77
2.82
2.90
2.95
2.912.90
12.79 12.65
12.00
11.33
10.29
9.278.77
Mar 15 Jun 15 Sep 15 Dec 15 Mar 16 Jun 16 Sep-16
Corporate SMEs Housing
Consumer Credit RRD-Major Corporations RRD- Corporates
RRD-SMEs RRD-Recoveries corporates RRD-Recoveries SMEs & Retail
(1) As part of the restructuring of the Group, management is currently monitoring the loan portfolio of the Group using new business line definitions. An important component
of the Group’s new operational structure is the establishment of the RRD for the purposes of centralising and streamlining the management of its delinquent loans.
Analysis 90+ DPD by Business Line1
39
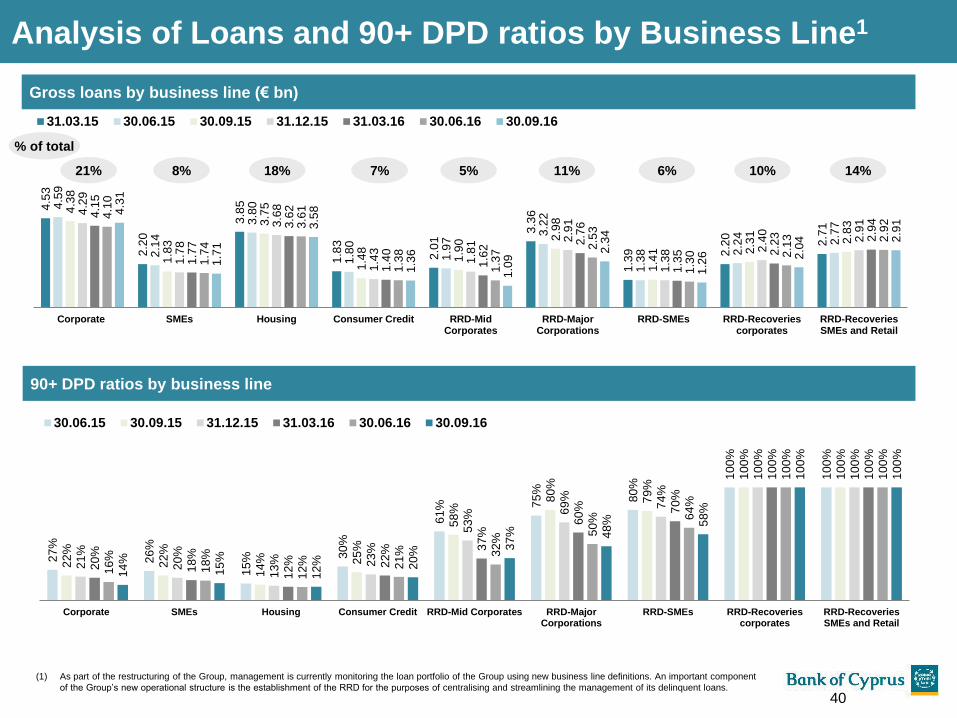
90+ DPD ratios by business line
Gross loans by business line (€ bn)
27
%
26
%
15
% 30
%
61
% 75
%
80
%
10
0%
10
0%
22
%
22
%
14
% 25
%
58
%
80
%
79
%
10
0%
10
0%
21
%
20
%
13
% 23
%
53
% 69
%
74
%
10
0%
10
0%
20
%
18
%
12
% 22
% 37
%
60
% 70
%
10
0%
10
0%
16
%
18
%
12
% 21
% 32
%
50
% 64
%
10
0%
10
0%
14
%
15
%
12
% 20
%
37
% 48
% 58
%
10
0%
10
0%
Corporate SMEs Housing Consumer Credit RRD-Mid Corporates RRD-MajorCorporations
RRD-SMEs RRD-Recoveriescorporates
RRD-RecoveriesSMEs and Retail
30.06.15 30.09.15 31.12.15 31.03.16 30.06.16 30.09.16
4.5
3
2.2
0
3.8
5
1.8
3
2.0
1
3.3
6
1.3
9 2.2
0
2.7
1
4.5
9
2.1
4
3.8
0
1.8
0
1.9
7
3.2
2
1.3
8 2.2
4
2.7
7
4.3
8
1.8
3
3.7
5
1.4
8
1.9
0 2.9
8
1.4
1 2.3
1
2.8
3
4.2
9
1.7
8
3.6
8
1.4
3
1.8
1 2.9
1
1.3
8 2.4
0
2.9
1
4.1
5
1.7
7
3.6
2
1.4
0
1.6
2
2.7
6
1.3
5 2.2
3 2.9
4
4.1
0
1.7
4
3.6
1
1.3
8
1.3
7
2.5
3
1.3
0 2.1
3 2.9
2
4.3
1
1.7
1
3.5
8
1.3
6
1.0
9
2.3
4
1.2
6 2.0
4 2.9
1
Corporate SMEs Housing Consumer Credit RRD-MidCorporates
RRD-MajorCorporations
RRD-SMEs RRD-Recoveriescorporates
RRD-RecoveriesSMEs and Retail
31.03.15 30.06.15 30.09.15 31.12.15 31.03.16 30.06.16 30.09.16
% of total
(1) As part of the restructuring of the Group, management is currently monitoring the loan portfolio of the Group using new business line definitions. An important component
of the Group’s new operational structure is the establishment of the RRD for the purposes of centralising and streamlining the management of its delinquent loans.
21% 8% 18% 5% 10%6%
Analysis of Loans and 90+ DPD ratios by Business Line1
7% 11% 14%
40
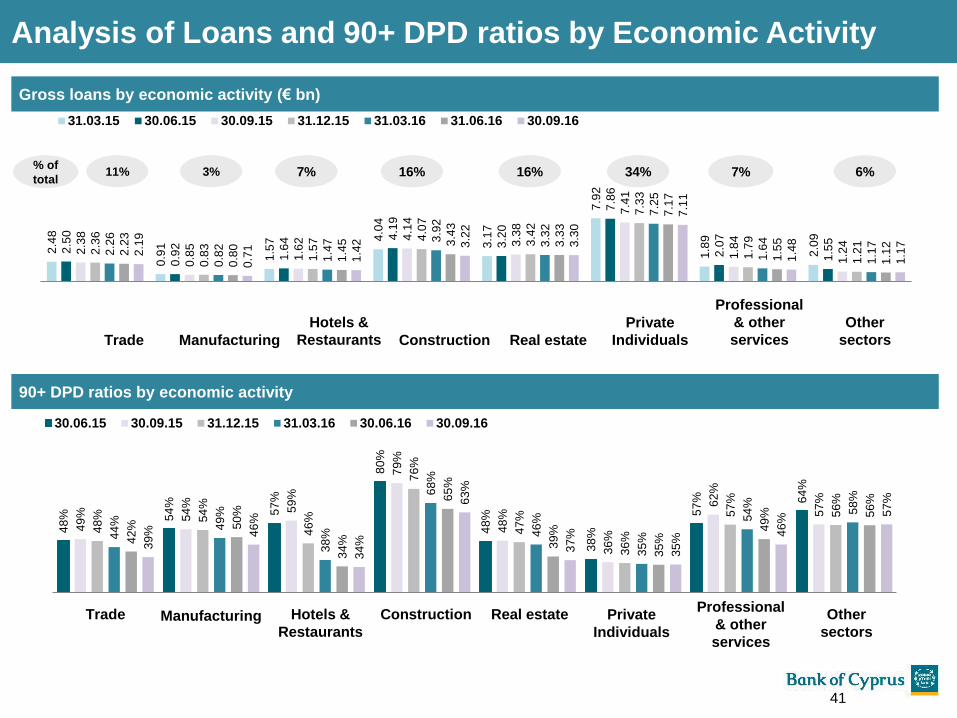
90+ DPD ratios by economic activity
48
% 54
%
57
%
80
%
48
%
38
%
57
% 64
%
49
% 54
% 59
%
79
%
48
%
36
%
62
%
57
%
48
% 54
%
46
%
76
%
47
%
36
%
57
%
56
%
44
% 49
%
38
%
68
%
46
%
35
%
54
%
58
%
42
% 50
%
34
%
65
%
39
%
35
%
49
% 56
%
39
% 46
%
34
%
63
%
37
%
35
%
46
%
57
%
30.06.15 30.09.15 31.12.15 31.03.16 30.06.16 30.09.16
Gross loans by economic activity (€ bn)
Trade Manufacturing Hotels &
Restaurants
Construction Real estate Private
Individuals
Professional
& other
services
Other
sectors
Analysis of Loans and 90+ DPD ratios by Economic Activity 2
.48
0.9
1
1.5
7 4.0
4
3.1
7
7.9
2
1.8
9
2.0
9
2.5
0
0.9
2
1.6
4 4.1
9
3.2
0
7.8
6
2.0
7
1.5
5
2.3
8
0.8
5
1.6
2 4.1
4
3.3
8
7.4
1
1.8
4
1.2
4
2.3
6
0.8
3
1.5
7 4.0
7
3.4
2
7.3
3
1.7
9
1.2
1
2.2
6
0.8
2
1.4
7 3.9
2
3.3
2
7.2
5
1.6
4
1.1
7
2.2
3
0.8
0
1.4
5 3.4
3
3.3
3
7.1
7
1.5
5
1.1
2
2.1
9
0.7
1
1.4
2 3.2
2
3.3
0
7.1
1
1.4
8
1.1
7
31.03.15 30.06.15 30.09.15 31.12.15 31.03.16 31.06.16 30.09.16
Trade Manufacturing
Hotels &
Restaurants Construction Real estate
Private
Individuals
Professional
& other
services
Other
sectors
16%11% 34% 7% 6%% of
total16%7%3%
41
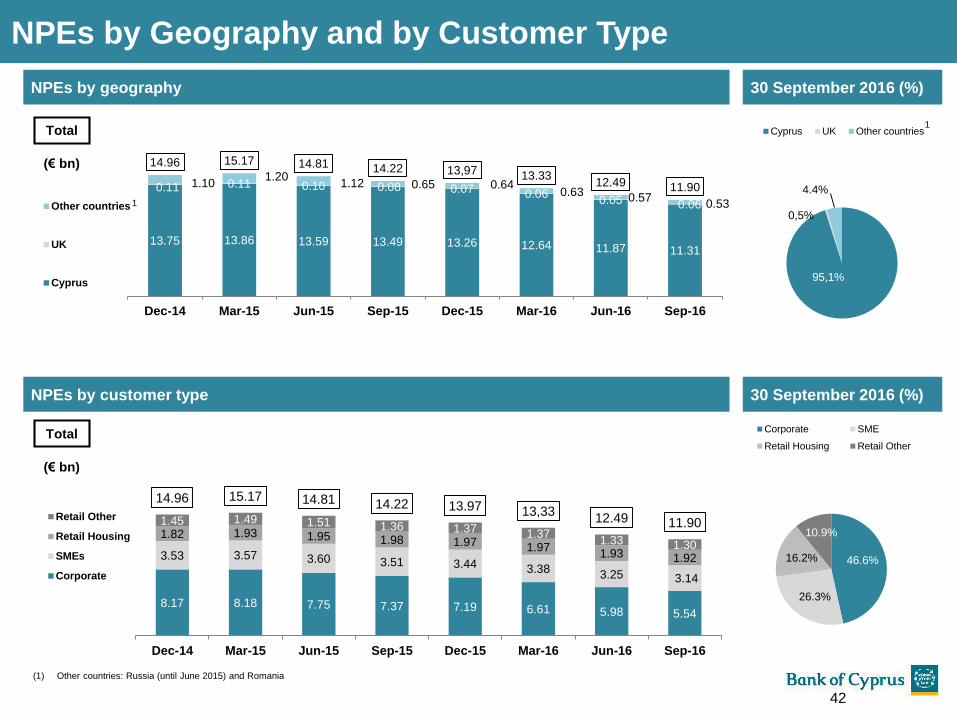
13.75 13.86 13.59 13.49 13.26 12.64 11.87 11.31
0.11 0.11 0.10 0.08 0.07 0.060.05 0.06
1.101.20
1.12 0.65 0.640.63 0.57
0.53
14.96 15.17 14.81 14.22 13,97 13.3312.49 11.90
Dec-14 Mar-15 Jun-15 Sep-15 Dec-15 Mar-16 Jun-16 Sep-16
Other countries
UK
Cyprus
1
Total
(€ bn)
(1) Other countries: Russia (until June 2015) and Romania
NPEs by geography
NPEs by Geography and by Customer Type
95,1%
0,5%
4.4%
Cyprus UK Other countries1
46.6%
26.3%
16.2%
10.9%
Corporate SME
Retail Housing Retail Other
30 September 2016 (%)
30 September 2016 (%)NPEs by customer type
8.17 8.18 7.75 7.37 7.19 6.61 5.98 5.54
3.53 3.57 3.60 3.51 3.44 3.383.25 3.14
1.82 1.93 1.95 1.98 1.97 1.971.93 1.92
1.45 1.49 1.51 1.36 1.37 1.371.33 1.30
14.96 15.17 14.81 14.22 13.97 13,3312.49 11.90
Dec-14 Mar-15 Jun-15 Sep-15 Dec-15 Mar-16 Jun-16 Sep-16
Retail Other
Retail Housing
SMEs
Corporate
Total
(€ bn)
42
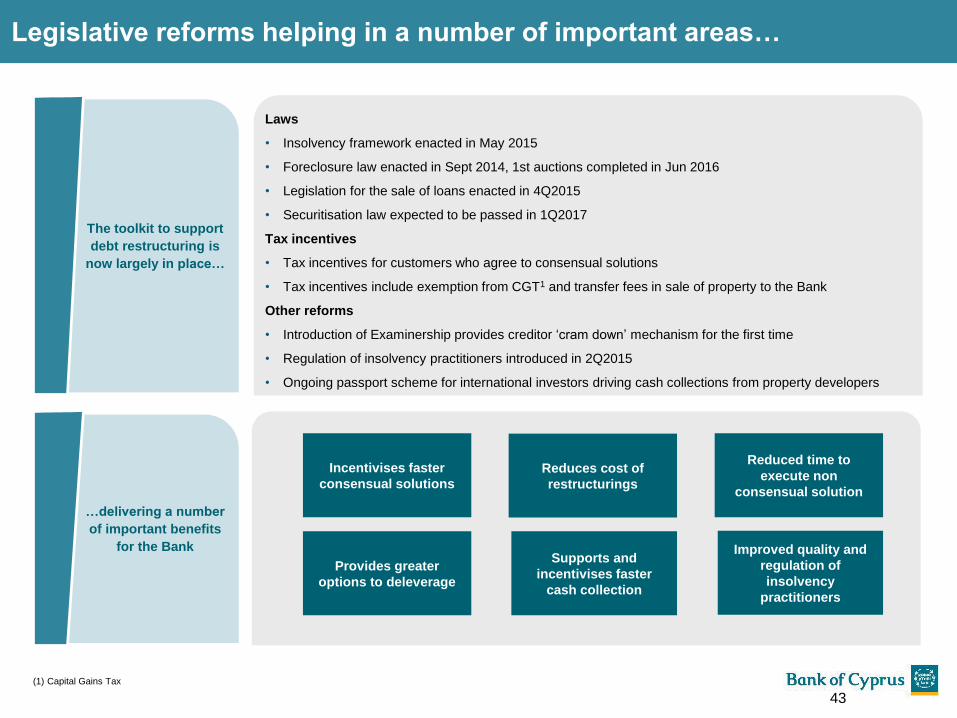
Legislative reforms helping in a number of important areas…
Laws
• Insolvency framework enacted in May 2015
• Foreclosure law enacted in Sept 2014, 1st auctions completed in Jun 2016
• Legislation for the sale of loans enacted in 4Q2015
• Securitisation law expected to be passed in 1Q2017
Tax incentives
• Tax incentives for customers who agree to consensual solutions
• Tax incentives include exemption from CGT1 and transfer fees in sale of property to the Bank
Other reforms
• Introduction of Examinership provides creditor ‘cram down’ mechanism for the first time
• Regulation of insolvency practitioners introduced in 2Q2015
• Ongoing passport scheme for international investors driving cash collections from property developers
The toolkit to support
debt restructuring is
now largely in place…
…delivering a number
of important benefits
for the Bank
Incentivises faster
consensual solutions
Reduced time to
execute non
consensual solution
Reduces cost of
restructurings
Provides greater
options to deleverage
Supports and
incentivises faster
cash collection
Improved quality and
regulation of
insolvency
practitioners
(1) Capital Gains Tax
43
Non-Performing Loans definition
Non-Performing Exposures (NPEs) –as per the EBA definition: In 2014 the European Banking Authority (EBA) published its reporting standards on
forbearance and non-performing exposures (NPEs). According to the EBA standards, a loan is considered a non-performing exposure if:
i. the debtor is assessed as unlikely to pay its credit obligations in full without the realisation of the collateral, regardless of the existence of any past
due amount or of the number of days past due, for example in case of a write off, a legal action against the borrower, or bankruptcy
ii. the exposures are impaired i.e. in cases where there is a specific provision, or
iii. there are material exposures which are more than 90 days past due, or
iv. there are performing forborne exposures under probation for which additional forbearance measures are extended, or
v. there are performing forborne exposures under probation that present more than 30 days past due within the probation period.
The exit criteria of NPE forborne are the following:
1. The extension of forbearance measures does not lead to the recognition of impairment or default
2. One year has passed since the forbearance measures were extended
3. There is not, following the forbearance measures, any past due amount or concerns regarding the full repayment of the exposure according to the
post forbearance conditions.
90+DPD: Loans in arrears for more than 90 days (90+ DPD) are defined as loans past-due for more than 90 days and those that are impaired
(impaired loans are those which are not considered fully collectable and for which a provision for impairment has been recognised on an individual
basis or for which incurred losses exist at their initial recognition or customers in Debt Recovery).
44
Disclaimer
This presentation has been prepared for information and background purposes only. It is confidential and neither it nor any part of it may be
reproduced (electronically or otherwise) or redistributed, passed on, or the contents otherwise divulged, directly or indirectly, to any other person
(excluding the recipient's professional advisers) or published in whole or in part for any purpose without the prior written consent of the Bank of
Cyprus Public Company Ltd (the "Bank"). This presentation does not purport to be all-inclusive or to contain all of the information that a person
considering the purchase of any securities of the Bank may require to make a full analysis of the matters referred to herein. Certain statements,
beliefs and opinions in this presentation are forward-looking. Such statements can be generally identified by the use of terms such as “believes”,
“expects”, “may”, “will”, “should”, “would”, “could”, “plans”, “anticipates” and comparable terms and the negatives of such terms. By their nature,
forward-looking statements involve risks and uncertainties and assumptions about the Group that could cause actual results and developments to
differ materially from those expressed in or implied by such forward-looking statements. These risks, uncertainties and assumptions could adversely
affect the outcome and financial effects of the plans and events described herein. We have based these forward-looking statements on our current
expectations and projections about future events. Any statements regarding past trends or activities should not be taken as a representation that
such trends or activities will continue in the future. Readers are cautioned not to place undue reliance on forward-looking statements, which are
based on facts known to and/ or assumptions made by the Group only as of the date of this presentation. The Bank's ability to achieve its projected
results depends on many factors which are outside management's control. Actual results may differ materially from those contained or implied in the
forward-looking statements. We assume no obligation to update such forward-looking statements or to update the reasons that actual results could
differ materially from those anticipated in such forward-looking statements. This presentation does not constitute an offer to sell, or a solicitation of
an offer to buy, any security in the United States, or any other jurisdiction. The delivery of this presentation shall under no circumstances imply that
there has been no change in the affairs of the Group or that the information set forth herein is complete or correct as of any date. This presentation
shall not be used in connection with any investment decision regarding any of our securities, which should only be made based on expressly
authorised materials from us identified as such, nor in connection with any decision whether or how to vote on any matter submitted to our
stockholders. The securities issued by the Bank have not been, and will not be, registered under the US Securities Act of 1933 (“the Securities
Act”), or under the applicable securities laws of any other jurisdiction.
45