2010documents.wfp.org/stellent/groups/public/documents/ena/...West Bank and Gaza Strip, occupied...
26
Socio-Economic and Food Security Survey West Bank and Gaza Strip, occupied Palestinian territory 2010 A survey carried out by: World Food Programme (WFP) Food and Agriculture Organization (FAO) Palestinian Central Bureau of Statistics (PCBS) Ancel Kats/WFP Data collection: July-August 2010 Publication date: February 2011
Transcript of 2010documents.wfp.org/stellent/groups/public/documents/ena/...West Bank and Gaza Strip, occupied...

oPt 2010 Socio-Economic and Food Security Survey
Socio-Economic and Food Security Survey West Bank and Gaza Strip, occupied Palestinian territory
2010
A survey carried out by:
World Food Programme (WFP) Food and Agriculture Organization (FAO)
Palestinian Central Bureau of Statistics (PCBS)
Ancel Kats/WFP
Data collection: July-August 2010
Publication date: February 2011

oPt 2010 Socio-Economic and Food Security Survey
2
Disclaimer
The designations employed and the representation of material in this publication do not imply the expression of
any opinion whatsoever on the part of the WFP, FAO, or their donors, concerning the legal or development status
of any country, territory, city or area or its authorities, or concerning of delimitation of its frontiers and
boundaries.

oPt 2010 Socio-Economic and Food Security Survey
3
Table of contents
1. Introduction Page 4
2. Methodology Page 5
3. Estimation of oPt food security levels Page 6
3.1 Food security levels in the oPt (2010) Page 6
3.2 Changes in food security levels in the oPt Page 7
4. Estimation of West Bank and Gaza Strip food security levels Page 8
4.1 Regional food security levels (2010) Page 8
4.2 Changes in the regional food security levels Page 8
4.3 Sub-regional food security levels (2010) Page 9
4.4 Changes in sub-regional food security levels Page 10
5. Comparison between food security levels in rural/urban areas Page 11
and refugee camps
5.1 Food security levels by locality type (2010) Page 11
5.2 Changes in food security Levels between 2009 and 2010 by locality type Page 13
5.3 Comparison of Food Insecurity Levels by Consumption of Own Production Page 14
6. Comparison between food security levels among refugees and non-refugees Page 15
7. Consumption and expenditure patterns among food insecure households Page 15
7.1 Household expenditure on food Page 15
7.2 Food consumption patterns Page 15
7.3 Livelihoods and coping strategies Page 16
8. Profiling of Food Insecure Households Page 17
9. Gender and food insecurity levels Page 19
10. Conclusions Page 20
11. Annex Page 23
12. Acronyms and abbreviations Page 24
Shareef Sarhan/WFP

oPt 2010 Socio-Economic and Food Security Survey
4
The Socio-Economic and Food Security (SEFSec) survey is part of a broader monitoring
system in the occupied Palestinian territory (oPt) to be institutionalized within the
Palestinian Central Bureau of Statistics (PCBS). The purpose of the SEFSec is to gauge
changes in the living conditions of Palestinian households by monitoring socio-economic and
food security indicators which emerged out of a need for timely information complementing
the Palestinian Expenditure and Consumption Survey (PECS). This initiative is supported by
the Food and Agriculture Organization of the United Nations (FAO) and the World Food
Programme (WFP) in collaboration with PCBS. Similar to the 2009 SEFSec, the survey con-
ducted in 2010 provides an update on a series of indicators including:
Food security (food acquisition¹, dietary diversity, Household Food Insecurity Access
Scale²);
Income and consumption/expenditure patterns;
Coping mechanisms.
The following report provides a summary of the basic food security findings of the SEFSec
survey conducted in 2010 with comparisons to data available from the 2009 SEFSec survey.
This report will be complemented by a series of thematic reports to provide further in-depth
analysis related to a series of indicators. These indicators are:
Assistance by type, value and source;
Socio-economic characteristics of households;
Analysis of households on the basis of the Proxy Means Testing Formula (PMTF); and
Household resilience levels based on the resilience module designed by FAO.
The analysis of these indicators will provide thematic focus on household food insecurity
profiling, analysis of humanitarian assistance on households and the application of the PMTF
to the SEFSec data.
1. Introduction
¹ Food acquisition includes food purchased, self-production and gifts (both formal and informal assistance).
² The HFIAS is composed of a set of nine questions that have been used in several countries and appear to distinguish food
insecure from food secure households across different cultural contexts. These questions represent universal domains of the experience of insecure access to food that can be used to assign households and populations along a continuum of severity. The information generated by the HFIAS can be used to assess the prevalence of household food insecurity (access component) (e.g. for geographic targeting) and to detect changes in the food insecurity situation of a population over a period of time.
Simona Caleo/WFP

oPt 2010 Socio-Economic and Food Security Survey
5
6
6
Data was collected on a sample of 6,871 households between July and August 2010³. In the
oPt, SEFSec estimates food insecurity on the basis of household income, expenditure and
socio-economic vulnerability. The socio-economic vulnerability is determined through
clustering households against seven socio-economic indicators (including refugee status,
household size, receiving aid, future expectations on financial resources, and impact on food,
non-food and total expenditures). The three resulting clusters (highly, medium and low
impacted population groups) are then cross tabulated with household incomes and
expenditures on per adult equivalent basis. Finally, the food insecurity levels are determined
on the basis of the PCBS deep and relative poverty thresholds . As such, the estimation of the
oPt food security levels considers mainly the problem of economic access to food and
essential non-food items.
The timing of this round of analysis coincided with the publication of the PECS 2009 by
PCBS, where a new poverty methodology, thresholds and a set of revised time series poverty
estimates have been developed. The revision of the series manifested in two main changes:
1. PCBS constructed and used a regional Consumer Price Index (CPI) for the West Bank,
Gaza Strip and East Jerusalem in order to account for the difference in the New Israeli
Shekel purchasing power as a result of the variation in price levels in each of these areas. This
CPI was used to deflate the consumption and expenditure levels for the population according
to the price levels prevailing in their geographical region.
2. Since it is crucial to have a comparable set of poverty estimates from one year to the other
in order to measure the changes in living conditions and the impact of social support policies
to reduce the poverty prevalence, there is a need to use fixed poverty thresholds. This has
also been introduced by the new methodology adopted by PCBS; the poverty thresholds will
only vary according to the changes in price levels in order to induce the inflation impact on
accessing the basic needs. The poverty line used is the one constructed in 1997 and adjusted
for annual inflation rate.
Accordingly, the methodology adopted in calculating the SEFSec food insecurity estimates
was revised. This entailed deflating consumption/income data using the regional CPI, and
adopting the newly-released PCBS consumption and income poverty thresholds updated for
CPI for 2010. Also for comparability reasons, these sets of changes were also applied to the
2009 SEFSec data set in order to generate comparable food security figures for 2009 and
2010.
2. Methodology
³ The sampling is statistically representative to inform programming at governorate/sub-group levels. The quantitative survey on
oPt households (HH) had the following coverage: 3,875 HH in the West Bank, 500 (HH) in East Jerusalem and 2,496 HH in the Gaza Strip.
Food insecurity exists when people lack secure access to sufficient amounts of safe and nutritious food for normal growth and
development and an active and healthy life.
See Annex 1 on the methodology for the 4 food security thresholds used in the oPt.
SEFSec 2009 data was collected in January/February 2009 for the West Bank, (covering the 2nd half of 2008) and in April/June 2009 for the Gaza Strip (covering the 1st half of 2009).

oPt 2010 Socio-Economic and Food Security Survey
6
7
3.1 Food Security Levels in the oPt (2010)
Based on the revised SEFSec methodology, the prevalence of food security in the oPt is the
following: 33 percent of the total Palestinian household population continues to be food
insecure, 13 percent are vulnerable to food insecurity, 21 percent are marginally secure and
33 percent are food secure.
In absolute terms, it is estimated that 1.43 million people in the oPt are food insecure.
PCBS has tried to tackle the problem of underestimating poverty levels in East Jerusalem using
the regional CPI. The recently published 2009 PCBS poverty data showed that in East Jerusa-
lem (annexed area) a purchasing power of 1.13 NIS is equivalent to the value of 1 NIS on
average in the oPt, which may not fully reflect the higher cost of living. The new poverty
methodology deflates the poverty levels in East Jerusalem from 5 percent in 2007 to 0 percent
in 2009 prompting PCBS to undergo a further revision of the methodology to better reflect
poverty levels in East Jerusalem. For this reason, references made to the West Bank exclude
the annexed area of East Jerusalem. Further analysis is needed to update the typical
Palestinian food basket and the standard Palestinian Household size and composition.
3. Estimation of oPt food security levels
SEFSec is a household survey. Levels of food security are therefore always referring to household figures and the prevalence of food security. However, the absolute number of the food insecure was calculated by summing up the number of individuals which better reflects the larger household sizes among food insecure households. The same methodology has been applied for the household figures and individual figures by regions, for refugee / non-refugee disclosed later in the document.
Marco Longari/FAO
7

oPt 2010 Socio-Economic and Food Security Survey
7
8
The definition of food insecurity in the oPt combines income and consumption levels
measured in USD per adult equivalent per day. It also includes whether there has been no
change or a decrease in food and non-food expenditures. As such, the measurement of food
insecurity considers only the problem of economic access to food and essential non-food
items resulting from the lack of income-earning possibilities for Palestinian households.
Other dimensions of food security, including food availability and food consumption, are
generally less problematic. Food is generally supplied in sufficient quantities and with an
acceptable variety in local markets, mainly from imports. Yet, current availability of food on
the market could be hampered given the volatility of the peace process and the high
dependency on Israeli and international markets.
3.2 Changes in Food Insecurity Levels in the oPt
In 2010, there was a slight decline in the overall food insecurity levels. The changes could be
attributed to the following: food security levels in 2009 were calculated when the Gaza Strip
population faced the highest peak in food insecurity in the aftermath of Operation Cast Lead;
localized economic improvement occurred in some of the West Bank governorates due to
changes in the closure regime during 2009-2010; the current Palestinian Authority (PA)
conducted reforms and government spending was massively supported by external assistance
in the West Bank. In spite of the decrease in the level of food insecurity at the country level,
after years of conflict most of the food insecure households in the oPt are now chronically
food insecure. The severity of food insecurity deepens as the conflict escalates or additional
shocks occur as witnessed in the aftermath of Cast Lead Operation in the Gaza Strip.
As shown in the following figure, the prevalence of food insecurity decreased by 3 percent
between 2009 and 2010 in the oPt. There was also a slight increase in the percentage of the
population who are food secure and a slight lift in the percentage of the population who are
vulnerable to food insecurity, likely due to a shift of those who were within the food insecure
threshold moving to the vulnerable to food insecurity threshold.
For details on the food security thresholds see Annex 1. 8
oPt 2010 Socio-Economic and Food Security Survey
8
9
10
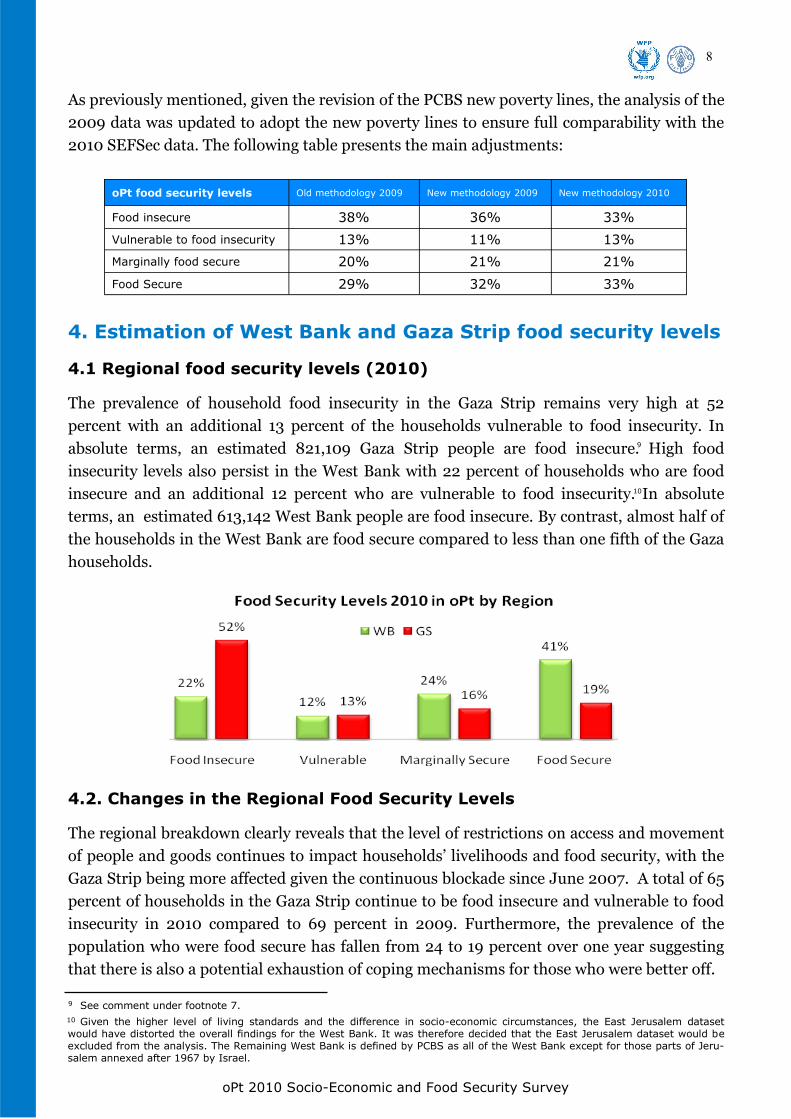
As previously mentioned, given the revision of the PCBS new poverty lines, the analysis of the
2009 data was updated to adopt the new poverty lines to ensure full comparability with the
2010 SEFSec data. The following table presents the main adjustments:
4. Estimation of West Bank and Gaza Strip food security levels
4.1 Regional food security levels (2010)
The prevalence of household food insecurity in the Gaza Strip remains very high at 52
percent with an additional 13 percent of the households vulnerable to food insecurity. In
absolute terms, an estimated 821,109 Gaza Strip people are food insecure. High food
insecurity levels also persist in the West Bank with 22 percent of households who are food
insecure and an additional 12 percent who are vulnerable to food insecurity. In absolute
terms, an estimated 613,142 West Bank people are food insecure. By contrast, almost half of
the households in the West Bank are food secure compared to less than one fifth of the Gaza
households.
4.2. Changes in the Regional Food Security Levels
The regional breakdown clearly reveals that the level of restrictions on access and movement
of people and goods continues to impact households‟ livelihoods and food security, with the
Gaza Strip being more affected given the continuous blockade since June 2007. A total of 65
percent of households in the Gaza Strip continue to be food insecure and vulnerable to food
insecurity in 2010 compared to 69 percent in 2009. Furthermore, the prevalence of the
population who were food secure has fallen from 24 to 19 percent over one year suggesting
that there is also a potential exhaustion of coping mechanisms for those who were better off.
oPt food security levels Old methodology 2009 New methodology 2009 New methodology 2010
Food insecure 38% 36% 33%
Vulnerable to food insecurity 13% 11% 13%
Marginally food secure 20% 21% 21%
Food Secure 29% 32% 33%
See comment under footnote 7.
Given the higher level of living standards and the difference in socio-economic circumstances, the East Jerusalem dataset would have distorted the overall findings for the West Bank. It was therefore decided that the East Jerusalem dataset would be excluded from the analysis. The Remaining West Bank is defined by PCBS as all of the West Bank except for those parts of Jeru-salem annexed after 1967 by Israel.
9
10

oPt 2010 Socio-Economic and Food Security Survey
9
11
4.3 Sub-regional food security levels (2010)
A sub-regional break down of the food security levels show that food insecurity is highest in
South Gaza Strip at 56 percent. The Middle Gaza Strip and North Gaza Strip have an even
prevalence of food insecurity at 50 percent. In the West Bank, the highest level of food
insecurity is found in the South at 26 percent followed by the North at 24 percent. The
Middle West Bank shows the lowest level of food insecurity at 13 percent.
The North West Bank includes Qalqilya, Nablus, Jenin, Tulkarm, Tubas and Salfit governorates. The Middle West Bank includes
Ramallah, Jericho and Jerusalem governorate excluding the annexed area. South West Bank includes Hebron and Bethlehem gov-
ernorates. The North Gaza Strip includes North Gaza governorate, Middle Gaza Strip includes Gaza and Deir el-Balah gover-
norates and South Gaza Strip includes Khan Younis and Rafah governorates.
11

oPt 2010 Socio-Economic and Food Security Survey
10
13
12
4.4 Changes in Sub-Regional Food Insecurity Levels in the West Bank
and Gaza Strip
In the South Gaza Strip, prevalence of food insecurity has decreased from 63 percent to 56
percent and in the North, trends show that there has been an 11 percent decrease in the level
of food insecurity. Since the 2009 SEFSec data was collected in the first half of 2009 to
reflect the impact of Operation Cast Lead, the decrease in food insecurity can be explained by
the higher intensity of the Operation Cast Lead in these areas, further hampering households‟
food security in the course of 2009. In 2010, the prevalence of food insecurity has returned to
the pre-Cast Lead Operation level and has been accompanied by some non-sustainable
coping mechanisms (alternative livelihood sources such as the tunnel economy, rubble
collection cushioned the population from deeper humanitarian crises). In fact, the root
causes of food insecurity in the Gaza Strip have remained unchanged. The blockade is still in
place, the private sector is still moribund and the economy is relying almost entirely on the
public sector and humanitarian assistance. There is no sustainable economic growth in the
present conditions in the Gaza Strip. Humanitarian food assistance only mitigates the impact
of the blockade and the consequences of Operation Cast Lead, enabling almost half of Gazan
households to secure a diet with an acceptable amount and diversity of food.
Given the survey reflects the first half of 2010, the impact of the June 2010 Israeli cabinet decision to relax the trade policy in
the Gaza Strip is not yet reflected.
The impact of food assistance on food consumption patterns and household food insecurity profiling are described later in the document.
12
13
Ancel Kats/WFP

oPt 2010 Socio-Economic and Food Security Survey
11
16
15
14
As previously mentioned, in the West Bank, the localized economic improvement in some of
the West Bank governorates, changes in the closure regime witnessed between 2009 and
2010 as well as the PA reforms, all contribute to the overall improvement in the level of food
security. As shown above, while the North West Bank suffers from a 2 percent increase and
the South West Bank a 1 percent increase in food insecurity, the Middle West Bank show a
significant decrease with a 7 percent decline in levels of food insecurity. These findings
confirm the analysis conducted by the World Bank where construction, trade and consumer
services appears to be the main sectors of economic growth, owing to the consumer-led
economy based on government spending with the support of external assistance. The Middle
West Bank seems to benefit directly from this growth as indicated in the decrease in the
prevalence of households classified as food insecure. The same positive trend did not register
in the North and South West Bank given that those regions rely more on a productive
economy (i.e. manufacture industries, agriculture). In fact, the situation has slightly
worsened in these areas explaining the similar prevalence of food insecurity at 22 percent in
the overall West Bank between 2009 and 2010.
5. Comparison between food security levels in rural/urban areas and refugee camps
5.1. Food Security Levels by locality type (2010)
The rural population in the Gaza Strip suffered from major destruction in assets during
Operation Cast Lead in December 2008 to January 2009. In addition, over one third of rural
areas are affected by restrictions in access to land close to the border, which contributes to
their level of food insecurity. Fishermen‟s livelihoods are also affected by the access
restrictions to the sea with fishing activities beyond 3 nautical miles prohibited by Israeli
authorities. Farm lands in restricted areas face frequent leveling by the Israeli military,
directly impacting rural house-
hold income and the type of
crops they are able to continue
to grow . This is aggravated by
the lack of water available in
sufficient quality and the
agricultural inputs available
limiting their productive
capacity. Furthermore, farmers
and herders are frequently shot
at in areas up to 1.5 km from
the border, reducing their
ability to access land.
The World Bank, The Underpinnings of the Future Palestinian State: Sustainable Growth and Institutions/Economic Monitoring Report to the Ad Hoc Liaison Committee, 21 September 2010.
Land restricted area is estimated at 17 percent of the total land mass of the Gaza Strip and 35 percent of its agricultural land. Palestinians are totally prevented from accessing 85 percent of the sea areas on which they are entitled to carry out maritime activities, including fishing, according to the 1994 Gaza-Jericho Agreement. Further information detailed in OCHA/WFP, Between the Fence and a Hard place: the Humanitarian Impact of Israeli-Imposed Restrictions on Access to Land and Sea in the Gaza Strip, August 2010.
Ibid.
15
14
16
Shareef Sarhan/WFP

oPt 2010 Socio-Economic and Food Security Survey
12
18
17
These problems have manifested in high levels of food insecurity in rural areas of the Gaza
Strip given that access restrictions have not improved since January 2009. The rural
population in the Gaza Strip had the highest prevalence of food insecurity out of any other
group. A 69 percent level of food insecurity existed among the Gazan rural population, which
was significantly higher compared to the Gaza Strip average of 52 percent. No significant
differences were found in the prevalence of food insecurity between urban and the refugee
camp dwellers, with the prevalence of food insecurity slightly higher among urban areas at 51
and 50 percent respectively. In absolute numbers, levels of food insecurity among the urban
population were higher.
In the West Bank, refugee households – particularly those living in refugee camps – have
consistently had the highest prevalence of food insecurity and vulnerability to food
insecurity. Thirty-three percent of refugee camp households were food insecure and an
additional 16 percent were vulnerable to food insecurity. The urban and rural population
showed equal levels of food insecurity at 22 percent. Meanwhile, as in the Gaza Strip, the
percentage of households who were food secure was highest in urban areas.
Out of the total number of households in the Gaza Strip, a total of 82 percent of Gaza population live in urban centres while 15 percent live in refugee camps and only 3 percent live in rural areas.
Out of the total number of households in the West Bank, 70 percent live in urban areas, 25 percent live in rural areas and 5 percent live in refugee camps.
17
18

oPt 2010 Socio-Economic and Food Security Survey
13
19
As witnessed in the previous SEFSec, living close to or within an access-restricted area
directly impacts the food security conditions of Palestinian households. Forty percent of
those living in the Seam Zone (the closed area between the Green Line and the Barrier) were
either food insecure or vulnerable to food insecurity, compared to 32 percent outside the
Seam Zone. Forty-two percent of those living outside the Seam Zone were food secure
compared to only 33 percent living inside the Seam Zone. Furthermore, a joint programme
assessment conducted by WFP/UNRWA on specific populations living in access-restricted
areas estimated that 55 percent of herding households living or having their livelihoods in
Area C was food insecure.
5.2 Changes in food security levels between 2009 and 2010, by locality type
The food insecurity levels among the rural population of the Gaza Strip have slightly
increased contrary to the overall decrease at country-wide and regional level. However, in the
rural areas of the West Bank food insecurity levels have decreased while an increase in food
insecurity levels was evident among refugee camps.
WFP/UNRWA, Follow-up survey on herding communities, June/July 2010. While the SEFSec methodology has been applied, the sampling frame is not similar given that the survey population comprises only the herding or Bedouin population enrolled in the WFP and UNRWA joint food assistance programme. Prior to the joint intervention of WFP/UNRWA, the level of food insecurity reached 79 percent at household level.
19

oPt 2010 Socio-Economic and Food Security Survey
14
5.3. Comparison of food insecurity levels by consumption of own production
Twenty-eight percent of households in the West Bank and 14 percent of households in the
Gaza Strip consumed their own production. In both the West Bank and the Gaza Strip,
production of own consumption does not significantly contribute to household food security.
This is due to the contribution of household‟s own consumption of their production out of
their total consumption. In the West Bank, the share of household‟s consumption of their
own production out of a total consumption is only 8 percent and in the Gaza Strip, this share
represents only 7 percent. Furthermore, in both the West Bank and the Gaza Strip, the food
secure households who consumed their own food production have a higher average
expenditure per adult/day compared to the food insecure households emphasizing that food
security is determined by household socio-economic status. For example, the average
expenditures among food secure households who consume their own production in the West
Bank is USD 10.4 per adult/day and in the Gaza Strip it is USD 8 per adult/day. Among food
insecure households in the West Bank, the average expenditure is USD 0.3 per adult/day and
in the Gaza Strip, this is USD 0.2 per adult/day. Consumption of household‟s own production
could potentially improve household food security if the average cash value of own
production was significant to meet gaps in consumption. In the West Bank, this value is only
240 NIS while in the Gaza Strip, the value is much lower at 84 NIS.
Marco Longari/FAO

oPt 2010 Socio-Economic and Food Security Survey
15
22
21
20
Similar to trends in 2009, non-refugees in the Gaza Strip are worst off with higher levels of
food insecurity compared to the refugee population. The opposite is true for the West Bank,
wherein the refugee population is worst off. In the Gaza Strip, the level of food insecurity
among the non-refugee households is 55 percent (305,383 people) compared to 50 percent
among the refugee households (515,726 people). In the West Bank, food insecurity levels are
significantly higher among refugee households at 27 percent (225,400 people) compared to
20 percent among non-refugee households (387,742 people) .
7. Consumption and expenditure patterns among food insecure households
7.1 Household expenditure on food
By dedicating more than half of their total cash expenditure to food (53 percent), Palestinian
households are particularly vulnerable to the current hike in food prices and income
fluctuations. In the West Bank, food expenditure in the first half of 2010 represented 48
percent of total cash expenditure of households. For food insecure households, food
expenditure was higher at 52 percent. In the Gaza Strip, the share of food expenditure
represented 61 percent of total cash expenditures. This share increased to 63 percent for food
insecure households.
7.2 Food Consumption Patterns
By the first half of 2010, 16 percent of Palestinian households reported a decrease in
expenditure levels. Of this group, 89 percent (or 14 percent of the total population) reported
that the decrease in expenditures was on food.
6. Comparison between food security levels among
refugees and non refugees
See footnote 7.
To avoid artificially inflating the percentage of expenditure devoted to food vs. household overall expenditures, the in-kind assistance and the own production have not been factored in. Household’s food expenditures are based on total cash expendi-tures on food vs. total cash expenditures.
Food consumptions patterns are to be further analyzed in a foreseen report related to humanitarian assistance.
20
21
22
Expenditure Change
Decreased 16%
Increased 27%
Stayed the same 57%
Total 100%

oPt 2010 Socio-Economic and Food Security Survey
16
23
The majority of households who decreased their expenditures on food reported decreasing
the quantity of food consumed (86 percent), in particular meat and milk.
In the West Bank, the level of food consumption did not vary between the second half of
2008 and the first half of 2010. By the end of the first half of 2010, 11 percent of households
had “poor” food consumption, 18 percent “borderline” and 71 percent “acceptable”.
Assistance continues to be a crucial complement to food insecure household‟s own coping
mechanisms, especially in relation to the coverage of their staple food.
In the Gaza Strip, by the end of the first half of 2010, 10 percent of households had “poor”
food consumption, 19 percent “borderline” and 71 percent “acceptable”. In 2009, 14 percent
had “poor” food consumption, 23 percent “borderline” and 63 percent “acceptable”. Food
assistance is playing a major role to enable Gaza households to secure a diet with an
acceptable amount and diversity of food. A removal of the assistance to households may be at
the expense of the current low prevalence of “poor/borderline” food consumption and dietary
diversity, while also enhancing the risk to increase levels of food insecurity.
7.3 Livelihoods and Coping Strategies
The most commonly used strategy for households to cope with economic crisis is to defer the
payment of utility bills, to purchase food on credit, consume lower quality food and consume
lower quantities of food. Forty-three percent of households reported deferring payment of
utility bills and 42 percent of households reported purchasing food on credit. The third
highest reported coping strategy is consuming lower-quality food (32 percent) followed by
consuming less food (29 percent). Most of these coping strategies, even if they are reversible,
can have a permanent cost on lives and livelihoods through poorer health and nutritional
status, excessive indebtedness and loss of future opportunities for higher skills and better
paid jobs.
Coping Strategy Used Percentage of
households
Percentage of households reporting coping strategy
still available
Food
Consume less quantity of food 29% 26%
Consume less quality food 32% 29%
Relied on food received from relatives and friends 11% 9%
Purchase food on credit 42% 39%
Restrict consumption by adults in order to feed children 11% 10%
Reduce the number of meals eaten/day to steadfast
financially 13% 12%
Non-food
Not paying utility bills 43% 39%
Sell off assets, jewelry, furniture, productive assets 11% 7%
Used life savings 13% 11%
Regrouping family members 10% 10%
Reduce health and education expenditures 9% 8%
Change place of residence 1% 1%
See Annex 2 for details on the food consumption score methodology. 23

oPt 2010 Socio-Economic and Food Security Survey
17
24
Forty-two percent of Palestinian households reported that they purchase food on credit. Out
of those, 45 percent of households reported an increase in the purchase of food on credit, 48
percent reported that the credit they use to purchase food has stayed the same and only 7
percent reported it has decreased.
8. Profiling of Food Insecure Households
The following table provides a comparison between food insecure and food secure
households in the West Bank and Gaza Strip identifying the typical characteristics of food
insecure households (regardless of their refugee status). A more in-depth analysis profiling
food insecure households will be presented in a separate thematic paper. In general, the
typical characteristics of food insecure households in the West Bank show the following:
An average household size of 6.4 members, with the prevalence of food insecurity
increasing to 26 percent with those households who have between 6 to 9 members and 41
percent for those with above 9 members, compared to a 22 percent prevalence among
the West Bank household average;
An average of 2 income sources is available to food insecure households, however, the
income per adult per day, is much lower at USD 3.1 among food insecure households
compared to USD 12 per adult per day among the food secure;
An expenditure per adult per day which is only 31 percent of the food secure expenditure;
An expenditure pattern which shows 52 percent of total expenditures is spent on food
compared to 45 percent for food secure households;
Thirteen percent of staple food items consumed by food insecure households are sourced
from food assistance compared to 3 percent among food secure households ;
The food consumption score is typically worse compared to food secure households .
Purchase food on credit
Yes 42%
No 58%
Purchase food on credit
Increased 45%
Decreased 7%
Stayed the same 48%
Food assistance to refugees/non-refugee households comprises food received through vouchers, gifts, family, and food aid. As staple food, the following commodities have been taken into consideration: wheat flour, rice, sugar, vegetable oil, bread and pulses. For those that responded positively to receiving assistance in the West Bank (regardless of their food security status), the share of food assistance as a source for households staple food raises to 22 percent.
24
Household Profiling West Bank
Food Insecure Food Secure
Total average household size 6.4 5.3
Cash expenditure on food out of total cash expenditures
52% 45%
Food Assistance share for staple food basket
13% 3.1%
Income per adult per day ($US) 3.1 12
Expenditures per adult per day ($US) 3.5 11.3
Percentage of poor and borderline food consumption
50 % 15 %

oPt 2010 Socio-Economic and Food Security Survey
18
25
The typical characteristics of food insecure households in the Gaza Strip show the following:
An average household size of 6.9 members compared to 4.6 for food secure households,
with the prevalence of food insecurity rising up to 64 percent among those who have
between 6 to 9 members, and the prevalence of food insecurity increasing up to 82
percent for those above 9 members;
Sixty-three percent expenditure on food out of total cash expenditures compared to the
Gaza Strip food secure household who spend on average 58 percent on food out of total
cash expenditures;
An average of 2 sources of income available to the household, similar to the Gaza Strip
average; however the income per adult per day is USD 2.3 compared to food secure
households who earn USD 10.6 per adult per day;
An expenditure per adult per day of 3 USD compared to food secure households who
spend 9.2 USD per adult per day;
Forty-two percent of staple food items consumed by food insecure households are
sourced from food assistance compared to 9 percent among food secure households ;
The food consumption score is typically worse compared to the Gaza Strip food secure
household average.
Household Profiling Gaza Strip
Food Insecure Food Secure
Total average household size 6.9 4.6
Cash expenditure on food out of total
cash expenditures 63% 58%
Food Assistance share for staple food basket
42.2% 9.1%
Income per adult per day ($US) 2.3 10.6
Expenditures per adult per day ($US) 3.0 9.2
Percentage of poor and borderline food consumption
39 % 11 %
See previous footnote for the definition of food assistance, and staple food. For those who responded positively to receiving assistance in the Gaza Strip (regardless of their food security status), the share of food assistance as a source for households staple food raises to 55 percent.
25
Simona Caleo/WFP

oPt 2010 Socio-Economic and Food Security Survey
19
The survey shows that gender composition correlates with households‟ food security in the
West Bank. Significant differences can be found in the prevalence of food insecurity between
male-headed and female-headed households. Twenty-two percent of male-headed
households are food insecure compared to 30 percent of female-headed households. In the
Gaza Strip, there are fewer disparities in the prevalence of food insecurity among female- and
male-headed households given that food insecurity is high amongst the general Gaza Strip
population. The prevalence of food insecurity among female- and male-headed households
stands at 48 and 52 percent respectively. However, in both the West Bank and the Gaza
Strip, households with a higher number of female adult members are more likely to be food
insecure, due to limited access to job opportunities and lower salary for women. A further
detailed analysis on the gender dimensions of food insecurity will be published in a thematic
working paper.
9. Gender and Food Insecurity Levels
Eman Mohammed/WFP

oPt 2010 Socio-Economic and Food Security Survey
20
The survey findings show a slight overall decrease in the level of food insecurity between
2009 and 2010. Considering the overall political dimensions have remained unchanged,
Palestinians continue to experience a protracted livelihood crisis with households who have
remained food insecure now living in chronic food insecurity.
The West Bank regional breakdown shows that these improvements are unevenly spread,
favouring only Central West Bank, while the level of food insecurity even deteriorated in the
North and South West Bank. The refugee population is showing the highest prevalence of
food insecurity and those living in seam zone are also affected by higher levels of food
insecurity. The food insecurity level in the Gaza Strip remains significantly high, and the
decrease is due to the peak of food insecurity faced in the Gaza Strip in 2009 in the aftermath
of the Operation Cast Lead, and the subsequent massive international aid injection has
protected access to food. A removal of the assistance to households may be at the expense of
the current low prevalence of “poor/borderline” food consumption and dietary diversity,
while also enhancing the risk to increase levels of food insecurity. In addition, the rural
population reliant on agriculture and the fishermen in the Gaza Strip has been hard hit by
Operation Cast Lead and no significant recovery has occurred due to land/sea access
restrictions. While in absolute terms the rural population size is much smaller compared to
urban areas, this increase reflects a chronic and deepening level of poverty due to the
restrictions in accessing land which has remained insufficiently addressed.
10. Conclusions
Marco Longari/FAO

oPt 2010 Socio-Economic and Food Security Survey
21
26
Generally, households appear to be able to preserve their coping mechanisms while around
one third of the population have reduced the quantity and quality of food they consume.
Despite households reporting that coping mechanisms remain available, the reduction in the
quantity and quality of food may potentially have detrimental effects on the household
wellbeing if these coping strategies are sustained for a long period of time.
The high cash expenditure on food among Palestinian households makes them highly
vulnerable to food price and income fluctuations. A close monitoring of the market prices, as
well as the unemployment rate will continue to be instrumental to allow timely response
from the humanitarian community to ensure the right level of assistance should the current
situation deteriorate. A negative impact on household‟s purchasing power will directly reflect
on household‟s food consumption patterns.
Furthermore, the identification of the population numbers falling within each food security
thresholds helps to design the possible actions to appropriately address the depth of poverty
experienced by households in order to work towards securing a sustainable livelihood. As a
general recommendation, and in line with the PA Safety Net reform and the building-up of a
Social Assistance System led by the Ministry of Social Affairs, there is a potential for food
security stakeholders to fit their activities within a Social/Productive Safety Net continuum
whereby:
The marginally secure are more receptive to productive safety net interventions which
protect/restore livelihoods and generate sustainable income; and
Households vulnerable to food insecurity require a combination of social and productive
safety net interventions to protect/restore their livelihoods while directly supporting their
food security;
Food insecure households are more reliant on income transfers and social safety net such
as the cash assistance/food parcels programme developed by the Ministry of Social
Affairs .
The programme reaches the poorest Palestinian families below the deep poverty line. The Ministry of Social Affairs (MoSA) is using a proxy means test formula (PMTF) as poverty proxy to select the beneficiaries for MoSA’s assistance. The MoSA Safety Net helps households living in extreme poverty to meet an acceptable level of living standards by providing assistance via comple-mentary programmes (cash transfer/food parcels).
26

oPt 2010 Socio-Economic and Food Security Survey
22
The impact of the recent Israeli decision in June 2010 to “relax” the flow of goods into and
out of the Gaza Strip has not been captured by the survey which covers the first half of 2010.
The impact of the new policy will not be reflected until the next SEFSec survey or an ad hoc
survey that would utilise the SEFSec methodology and similar sampling. The findings of the
survey demonstrate the importance of the provision of timely and updated socio-economic
indicators capable of monitoring the living conditions of Palestinians and the assistance
delivered to meet their changing needs. SEFSec is timely and enables the socio-economic
profiling of households in order to inform planners in tailoring programmes. Therefore,
continued support is needed to ensure the process of institutionalisation of the SEFSec
monitoring system within PCBS is completed.
Marco Longari/FAO

oPt 2010 Socio-Economic and Food Security Survey
23 11. Annex
The food security estimates are based on income and consumption levels classified against
the absolute and relative poverty lines and cross tabbed with household clusters established
based on specific groups of socio-economic variable. The table below provides a description
of the four food security groups identified.
The Food Consumption Score estimates the amount and variety of food consumed in the
households during the 7 days preceding the survey, by counting the number of times specific
food items (grouped in specific food groups) are consumed. Three groups are constructed by
applying thresholds that define a „poor‟ food consumption pattern, „borderline‟ food
consumption, and „acceptable‟ food consumption. Essentially:
A „poor‟ food consumption consists of cereals (bread and rice), potatoes, sugar and oil
consumed on a nearly daily basis, vegetables 4 times during the 7 days prior to the survey
and very rare consumption of animal products and fruits; quantities are also likely to be
low and below kilocalorie requirements for household members with additional needs
(pregnant and lactating women, physically active adults);
A „borderline‟ diet is similar but includes a slightly more frequent consumption of
vegetables (5 times during the 7-day period), meat and eggs (3 to 4 times) and fruits
(twice); quantities are probably just sufficient to meet kilocalorie requirements;
An „acceptable‟ diet is yet more diversified with consumption of the various food groups
on a nearly daily basis; the amounts consumed are expected to be sufficient.
1. Food Security Levels
Food Secure Marginally Secure Vulnerable Food Insecure
Households with income and consumption above USD 6.2 per adult equivalent/day
OR
Households with income and consumption
between USD 5.1 and USD 6.2 per adult equivalent/day and show no decrease in total food and non-food expendi-tures
Households showing either income or consumption above USD 6.2 per adult equivalent/day (not both)
OR
Households with both
income and consumption between USD 5.1 and USD 6.2 per adult equiva-lent per day with no decrease in expenditure patterns
Households showing both income and consumption below USD 6.2 per adult equivalent per day EXCEPT house-
holds showing no decrease in expenditure patterns (categorize as marginally secure)
Households with income and consump-tion below USD 5.1 per
adult equivalent/day
OR
Households showing
decrease in total food
and non-food expendi-
tures, including house-
holds unable to further
decrease their expen-
diture patterns
2. Food Consumption Score

oPt 2010 Socio-Economic and Food Security Survey
24
CPI Consumer Price Index
FAO Food and Agriculture Organization of the United Nations
GDP Gross Domestic Product
GS Gaza Strip
HFIAS Household Food Insecurity Access Scale
HH Household
ILO International Labour Organization
Kg Kilogram
MoSA Ministry of Social Affairs
NGO Non Governmental Organization
NIS New Israeli Shekel
OCHA United Nations Office for the Coordination of Humanitarian Affairs
oPt occupied Palestinian territory
PA Palestinian Authority
PCBS Palestinian Central Bureau of Statistics
PECS Palestinian Expenditure and Consumption Survey
PMTF Proxy Means Test Formula
PNA Palestinian National Authority
SEFSec Socio-Economic and Food Security Monitoring System
UNRWA United Nations Relief and Works Agency
UN United Nations
USD United States Dollar
WB West Bank
WFP United Nations World Food Programme
12. Acronyms and abbreviations
oPt 2010 Socio-Economic and Food Security Survey
25
This publication was produced with the financial assistance of the multiple donors of the United Nations World Food
Programme (WFP).
The Food and Agriculture Organization of the United Nations (FAO) was supported by the UK Department for
International Development.

oPt 2010 Socio-Economic and Food Security Survey
26
2010 Socio-Economic and Food Security Survey WFP, FAO, PCBS