BACKGROUND REPORT AP-42 SECTION 6.10 … · BACKGROUND REPORT AP-42 SECTION 6.10 PHOSPHATE...
50
i [Note: with the publication of the Fifth Edition of AP-42, the Chapter and Section number for Phosphate Fertilizers was changed to 8.5.] BACKGROUND REPORT AP-42 SECTION 6.10 PHOSPHATE FERTILIZERS Prepared for U.S. Environmental Protection Agency OAQPS/TSD/EIB Research Triangle Park, NC 27711 1-96 Pacific Environmental Services, Inc. P.O. Box 12077 Research Triangle Park, NC 27709 919/941-0333
Transcript of BACKGROUND REPORT AP-42 SECTION 6.10 … · BACKGROUND REPORT AP-42 SECTION 6.10 PHOSPHATE...

i
[Note: with the publication of the Fifth Edition of AP-42, the Chapter and Section number forPhosphate Fertilizers was changed to 8.5.]
BACKGROUND REPORT
AP-42 SECTION 6.10
PHOSPHATE FERTILIZERS
Prepared for
U.S. Environmental Protection AgencyOAQPS/TSD/EIB
Research Triangle Park, NC 27711
1-96
Pacific Environmental Services, Inc.P.O. Box 12077
Research Triangle Park, NC 27709919/941-0333

1-96
AP-42 Background Report
TECHNICAL SUPPORT DIVISION
U.S. ENVIRONMENTAL PROTECTION AGENCYOffice of Air Quality Planning and Standards
Research Triangle Park, NC 27711
iii
This report has been reviewed by the Technical Support Division of the Office of Air QualityPlanning and Standards, EPA. Mention of trade names or commercial products is not intended toconstitute endorsement or recommendation for use. Copies of this report are available throughthe Library Services Office (MD-35), U.S. Environmental Protection Agency, Research TrianglePark, NC 27711.

iv
TABLE OF CONTENTS
1.0 INTRODUCTION . . . . . . . . . . . . . . . . . . . . . . . . . . . . . . . . . . . . . . . . . . . . . . . . . . . . . . . 1
2.0 INDUSTRY DESCRIPTION . . . . . . . . . . . . . . . . . . . . . . . . . . . . . . . . . . . . . . . . . . 22.1 GENERAL . . . . . . . . . . . . . . . . . . . . . . . . . . . . . . . . . . . . . . . . . . . . . . 22.2 PROCESS DESCRIPTION . . . . . . . . . . . . . . . . . . . . . . . . . . . . . . . . . 32.3 EMISSIONS AND CONTROLS . . . . . . . . . . . . . . . . . . . . . . . . . . . . . 92.4 REVIEW OF REFERENCES . . . . . . . . . . . . . . . . . . . . . . . . . . . . . . . 122.5 REFERENCES FOR CHAPTER 2 . . . . . . . . . . . . . . . . . . . . . . . . . . 15
3.0 GENERAL EMISSION DATA REVIEW AND ANALYSIS PROCEDURES . . . . . . . . . . . . . . . . . . . . . . . . . . . . . . . . . . . . . . . . . . . . . . . . . . . . . . . . 16
3.1 LITERATURE SEARCH AND SCREENING . . . . . . . . . . . . . . . . . 163.2 EMISSION DATA QUALITY RATING SYSTEM . . . . . . . . . . . . . 173.3 EMISSION FACTOR QUALITY RATING SYSTEM . . . . . . . . . . . 183.4 REFERENCES FOR CHAPTER 3 . . . . . . . . . . . . . . . . . . . . . . . . . . 20
4.0 POLLUTANT EMISSION FACTOR DEVELOPMENT . . . . . . . . . . . . . . . . . . . 214.1 REVIEW OF SPECIFIC DATA SETS . . . . . . . . . . . . . . . . . . . . . . . . . . . . . . 214.2 CRITERIA POLLUTANT EMISSIONS DATA . . . . . . . . . . . . . . . . 264.3 NONCRITERIA POLLUTION EMISSION DATA . . . . . . . . . . . . . 344.4 DATA GAP ANALYSIS . . . . . . . . . . . . . . . . . . . . . . . . . . . . . . . . . . 404.5 REFERENCES FOR CHAPTER 4 . . . . . . . . . . . . . . . . . . . . . . . . . . 41
APPENDICES FOR AP-42 SECTIONS 6.10.1, 6.10.2, and 6.10.3 . . . . . . . . . . . . . . . . . . . . . 44
v
LIST OF TABLES
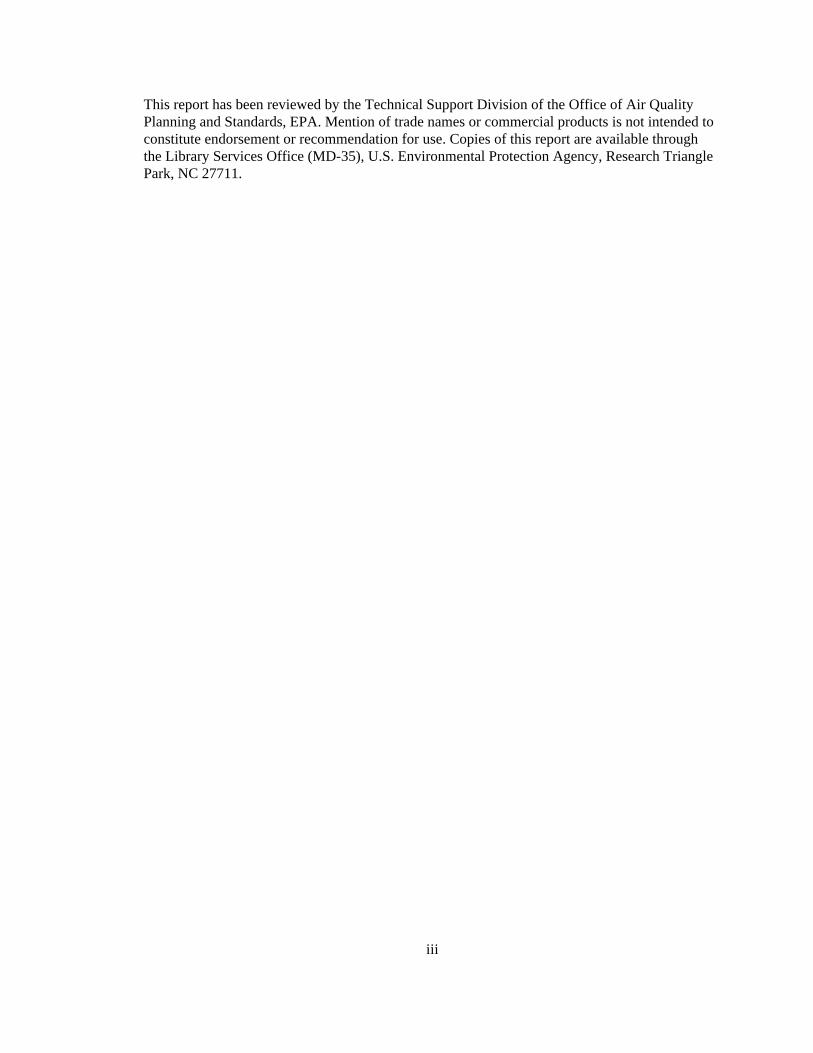
TABLE 4.2-1 (METRIC): SULFUR DIOXIDE . . . . . . . . . . . . . . . . . . . . . . . . . . . . . . . . . . . . 27TABLE 4.2-1 (ENGLISH): SULFUR DIOXIDE . . . . . . . . . . . . . . . . . . . . . . . . . . . . . . . . . . . 27TABLE 4.2-2 (METRIC): FILTERABLE PARTICULATE MATTER . . . . . . . . . . . . . . . . . . 30TABLE 4.2-2 (ENGLISH): FILTERABLE PARTICULATE MATTER . . . . . . . . . . . . . . . . . 32TABLE 4.3-1 (METRIC): HAZARDOUS AIR POLLUTANTS . . . . . . . . . . . . . . . . . . . . . . . 36TABLE 4.3-1 (ENGLISH): HAZARDOUS AIR POLLUTANTS . . . . . . . . . . . . . . . . . . . . . . 38TABLE 4.5-1: LIST OF CONVERSION FACTORS . . . . . . . . . . . . . . . . . . . . . . . . . . . . . . . . 43
LIST OF FIGURES
2.2-1: NORMAL SUPERPHOSPHATE PROCESS FLOW . . . . . . . . . . . . . . . . . . . . . . . . . . . . 42.2-2: DORR-OLIVER PROCESS FLOW . . . . . . . . . . . . . . . . . . . . . . . . . . . . . . . . . . . . . . . . . 62.2-3: AMMONIUM PHOSPHATE PROCESS FLOW . . . . . . . . . . . . . . . . . . . . . . . . . . . . . . . 8

1
1.0 INTRODUCTION
The document "Compilation of Air Pollutant Emission Factors" (AP-42) has been
published by the U.S. Environmental Protection Agency (the EPA) since 1972. Supplements to
AP-42 have been routinely published to add new emission source categories and to update
existing emission factors. AP-42 is routinely updated by the EPA to respond to new emission
factor needs of the EPA, State, and local air pollution control programs and industry.
An emission factor relates the quantity (weight) of pollutants emitted to a unit of activity
of the source. The uses for the emission factors reported in AP-42 include: 1.
Estimates of area-wide emissions;
2. Emission estimates for a specific facility; and
3. Evaluation of emissions relative to ambient air quality.
The purpose of this report is to provide background information from process information
obtained from industry comment and 9 test reports to support revision of emission factors for
sections 6.10.1, "Normal superphosphates," 6.10.2 "Triple Superphosphates," and 6.10.3,
"Ammonium Phosphates."
Including the introduction (Chapter 1), this report contains four chapters. Chapter 2 gives
descriptions of the normal superphosphates, triple superphosphates, and ammonium phosphates
industries. It includes a characterization of the industry, an overview of the different process
types, a description of emissions, and a description of the technology used to control emissions
resulting from the production of normal superphosphates, triple superphosphates and ammonium
phosphates productions, and a review of references.
Chapter 3 is a review of emissions data collection and analysis procedures. It describes the
literature search, the screening of emission data reports, and the quality rating system for both
emission data and emission factors. Chapter 4 includes the review of specific data sets, details
criteria and noncriteria pollutant emission factor development, and contains the results of a data
gap analysis. Appendix A presents AP-42 Sections 6.10.1, 6.10.2, and 6.10.3.
2
2.0 INDUSTRY DESCRIPTION
2.1 GENERAL
The phosphate fertilizer industry is divided into three segments: phosphoric acid and
superphosphoric acid, normal and triple superphosphate, and granular ammonium phosphate.
Only normal superphosphate, triple superphosphate, and ammonium phosphate are discussed in
this background report.
Normal Superphosphates
Normal superphosphate refers to fertilizer material containing 15 to 21 percent
phosphorous as phosphorous pentoxide (P2O5). As defined by the Census Bureau, normal
superphosphate contains not more than 22 percent of available P2O5. There are currently about
eight fertilizer facilities producing normal superphosphates in the U.S. with an estimated total
production of about 273,000 megagrams (300,000 tons) per year.
Triple Superphosphates
Triple superphosphate, also known as double, treble, or concentrated superphosphate, is a
fertilizer material with a phosphorus content of over 40 percent, measured as phosphorus
pentoxide (P2O5). Triple superphosphate is produced in only six fertilizer facilities in the U.S. In
1989, there were an estimated 3.2 million megagrams (3.5 million tons) of triple superphosphate
produced. Production rates from the various facilities range from 23 to 92 megagrams (25 to 100
tons) per hour.
Ammonium Phosphates
Ammonium phosphate (NH4H2PO4) is produced by reacting phosphoric acid (H3PO4) with
anhydrous ammonia (NH3). Ammoniated superphosphates are produced by adding normal
superphosphate or triple superphosphate to the mixture. The production of liquid ammonium
phosphate and ammoniated superphosphates in fertilizer mixing plants is considered a separate
process. Both solid and liquid ammonium phosphate fertilizers are produced in the U.S. and the
most common ammonium phosphate fertilizer grades are monoammonium phosphate (MAP) and
diammonium phosphate (DAP). This discussion covers only the granulation of phosphoric acid
3
with anhydrous ammonia to produce granular fertilizer. Total ammonium phosphate production
in the U.S. in 1992 was estimated to be 7.7 million megagrams (8.5 million tons).
2.2 PROCESS DESCRIPTION
Normal Superphosphates
Normal superphosphates are prepared by reacting ground phosphate rock with 65 to 75
percent sulfuric acid. An important factor in the production of normal superphosphates is the
amount of iron and aluminum in the phosphate rock. Aluminum (as Al2O3) and iron (as Fe2O3)
above five percent imparts an extreme stickiness to the superphosphate and makes it difficult to
handle.
The two general types of sulfuric acid used in superphosphate manufacture are virgin and
spent acid. Virgin acid is produced from elemental sulfur, pyrites, and industrial gases and is
relatively pure. Spent acid is a recycled waste product from various industries that use large
quantities of sulfuric acid. Problems encountered with using spent acid include unusual color,
unfamiliar odor, and toxicity.
A generalized flow diagram of normal superphosphate production is shown in Figure 2.2-
1. Ground phosphate rock and acid are mixed in a reaction vessel, held in an enclosed area for
about 30 minutes until the reaction is partially completed, and then transferred, using an enclosed
conveyer known as the den, to a storage pile for curing (the completion of the reaction).
Following curing, the product is most often used as a high-phosphate additive in the production
of granular fertilizers. It can also be granulated for sale as granulated superphosphate or granular
mixed fertilizer. To produce granulated normal superphosphate, cured superphosphate is fed
through a clod breaker and sent to a rotary drum granulator where steam, water, and acid may be
added to aid in granulation. Material is processed through a rotary drum granulator, a rotary
dryer, a rotary cooler, and is then screened to specification. Finally, it is stored in bagged or bulk
form prior to being sold.
Triple Superphosphates
Two processes have been used to produce triple superphosphate: run-of-the-pile (ROP-
TSP) and granular (GTSP). At this time, no facilities in the U.S. are currently producing ROP-
TSP, but a process description is given.

4
The ROP-TSP material is essentially a pulverized mass of variable particle size produced
in a manner similar to normal superphosphate. Wet-process phosphoric acid (50 to 55 percent
P2O5) is reacted with ground phosphate rock in a cone mixer. The resultant slurry begins to
solidify on a slow moving conveyer en route to the curing area. At the point of discharge from
the den, the material passes through a rotary mechanical cutter that breaks up the solid mass.
Coarse ROP-TSP product is sent to a storage pile and cured for three to five weeks. The product
is then mined from the storage pile to be crushed, screened, and shipped in bulk.
Granular triple superphosphate yields larger, more uniform particles with improved
storage and handling properties. Most of this material is made with the Dorr-Oliver slurry
granulation process, illustrated in Figure 2.2-2.

5
UNLOADING
PARTICULATEEMISSIONS
BAGHOUSE
ROCKPHOSPHATE ROCKGROUND
PHOSPHORIC ACIDWET PROCESS
ROCKBIN
ACIDCONTROL
SCRUBBER
BAGHOUSE
PARTICULATEEMISSIONS
SCRUBBER
PARTICULATEAND FLUORIDEEMISSIONS
SCRUBBER
SCRUBBER
DUSTCYCLONE
DUSTCYCLONE
PARTICULATE
CRUSHER
AIROVER-SIZESCREEN
PRODUCTSCREEN COOLER
CYCLONE
SCRUBBER
RECYCLEDPOND WATER
EMISSIONSAND FLUORIDEPARTICULATE
CURING BUILDING(STORAGE & SHIPPING)
ELEVATOR
DRYERAIR
FUEL
GRANULATOR
REACTOR
WEIGHERFEEDER
RECYCLED
GRANULAOR
TO
ROCK DUST
Figure 2.2-2 Dorr-O
liver process for granular triple superphosphate production1

6
In this process, ground phosphate rock or limestone is reacted with phosphoric acid in one or
two reactors in series. The phosphoric acid used in this process is appreciably lower in
concentration (40 percent P2O5) than that used to manufacture ROP-TSP product. The lower
strength acid maintains the slurry in a fluid state during a mixing period of one to two hours. A
small sidestream of slurry is continuously removed and distributed onto dried, recycled fines,
where it coats the granule surfaces and builds up its size.
Pugmills and rotating drum granulators have been used in the granulation process. Only
one pugmill is currently operating in the U.S. A pugmill is composed of a U-shaped trough
carrying twin counter-rotating shafts, upon which are mounted strong blades or paddles. The
blades agitate, shear, and knead the liquefied mix and transport the material along the trough.
The basic rotary drum granulator consists of an open-ended, slightly inclined rotary cylinder,
with retaining rings at each end and a scraper or cutter mounted inside the drum shell. A rolling
bed of dry material is maintained in the unit while the slurry is introduced through distributor
pipes set lengthwise in the drum under the bed. Slurry-wetted granules are then discharged onto a
rotary dryer, where excess water is evaporated and the chemical reaction is accelerated to
completion by the dryer heat. Dried granules are then sized on vibrating screens. Oversize
particles are crushed and recirculated to the screen, and undersize particles are recycled to the
granulator. Product-size granules are cooled in a countercurrent rotary drum, then sent to a
storage pile for curing. After a curing period of three to five days, granules are removed from
storage, screened, bagged and shipped.
7
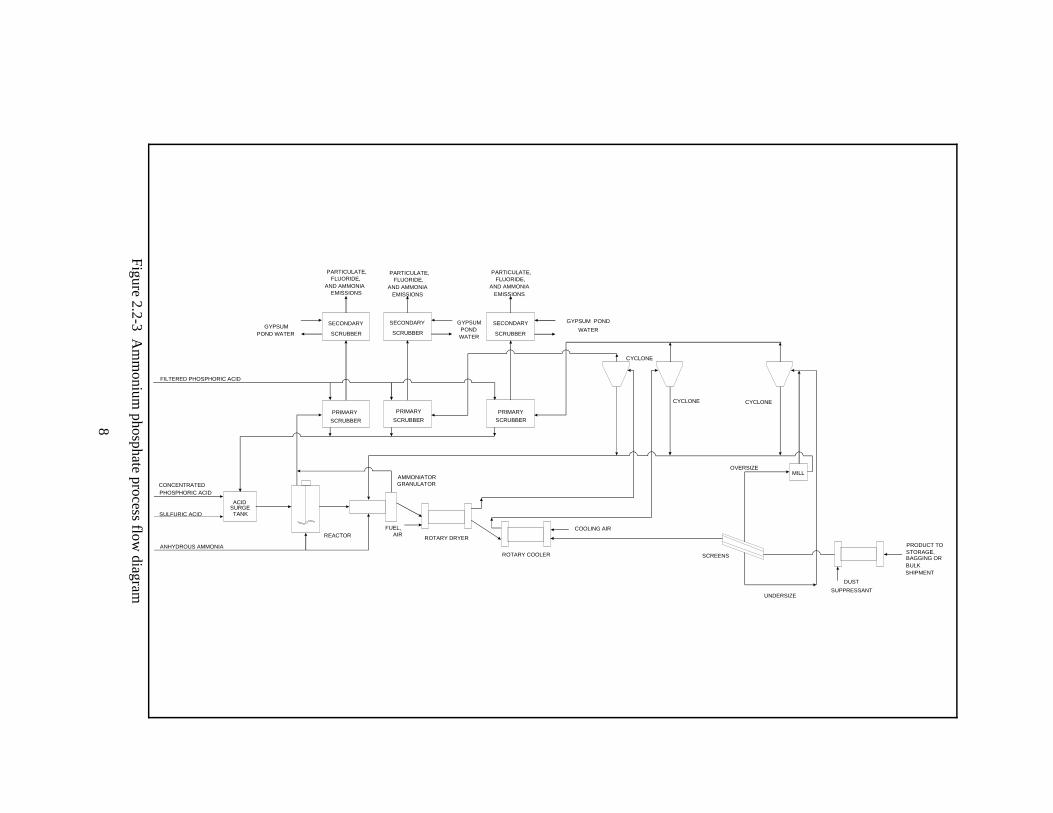
Ammonium phosphates
Two basic mixer designs are used by ammoniation-granulation plants: the pugmill
ammoniator and the rotary drum ammoniator. Approximately 95 percent of ammoniation-
granulation plants in the United States use a rotary drum mixer developed and patented by the
Tennessee Valley Authority (TVA). The basic rotary drum ammoniator-granulator consists of a
slightly inclined open-end rotary cylinder with retaining rings at each end, and a scrapper or
cutter mounted inside the drum shell. A rolling bed of recycled solids is maintained in the unit.
Ammonia-rich offgases pass through a wet scrubber before exhausting to the atmosphere.
Primary scrubbers use raw materials mixed with acids (such as scrubbing liquor), and secondary
scrubbers use gypsum pond water.
In the TVA process, phosphoric acid is mixed in an acid surge tank with 93 percent
sulfuric acid (H2SO4), which is used for product analysis control, and with recycled acid from
wet scrubbers. (A schematic diagram of the ammonium phosphate process flow diagram is
shown in Figure 2.2-3.)
8
PARTICULATE,FLUORIDE,
AND AMMONIAEMISSIONS
PARTICULATE,FLUORIDE,
AND AMMONIAEMISSIONS
SECONDARY
SCRUBBER
SECONDARY
SCRUBBER
PARTICULATE,FLUORIDE,
AND AMMONIAEMISSIONS
SCRUBBER
SECONDARYGYPSUMPOND
WATER
GYPSUM POND
WATER
CYCLONE CYCLONE
CYCLONE
PRIMARY
SCRUBBER SCRUBBER
PRIMARY
SCRUBBER
PRIMARY
FILTERED PHOSPHORIC ACID
SULFURIC ACID
ANHYDROUS AMMONIA
CONCENTRATEDPHOSPHORIC ACID
ACIDSURGETANK
REACTOR
AMMONIATORGRANULATOR
FUEL,AIR
ROTARY DRYER
ROTARY COOLER
COOLING AIR
SCREENS
OVERSIZEMILL
PRODUCT TOSTORAGE,BAGGING ORBULKSHIPMENT
DUST
SUPPRESSANTUNDERSIZE
GYPSUMPOND WATER
Figure 2.2-3 Am
monium
phosphate process flow diagram

9
Mixed acids are then partially neutralized with liquid or gaseous anhydrous ammonia in a brick-
lined acid reactor. All of the phosphoric acid and approximately 70 percent of the ammonia are
introduced into this vessel. A slurry of ammonium phosphate and 22 percent water are produced
and sent through steam-traced lines to the ammoniator-granulator. Slurry from the reactor is
distributed on the bed, the remaining ammonia (approximately 30 percent) is sparged underneath.
Granulation, by agglomeration and by coating particulate with slurry, takes place in the rotating
drum and is completed in the dryer. Ammonia-rich offgases pass through a wet scrubber before
exhausting to the atmosphere. Primary scrubbers use raw materials mixed with acid (such as
scrubbing liquor), and secondary scrubbers use pond water.
Moist ammonium phosphate granules are transferred to a rotary concurrent dryer and then
to a cooler. Before being exhausted to the atmosphere, these offgases pass through cyclones and
wet scrubbers. Cooled granules pass to a double-deck screen, in which oversize and undersize
particles are separated from product particles. The product ranges in granule size from 1 to 4
millimeters (mm). The oversized granules are crushed, mixed with the undersized, and recycled
back to the ammoniator-granulator.

10
2.3 EMISSIONS AND CONTROLS
Normal Superphosphates
Sources of emissions at a normal superphosphate plant include rock unloading and
feeding, mixing operations (in the reactor), storage (in the curing building), and fertilizer
handling operations. Rock unloading, handling and feeding generate particulate emissions of
phosphate rock dust. The mixer, den and curing building emit gases in the form of silicon
tetrafluoride (SiF4), hydrogen fluoride (HF) and particulates composed of fluoride and phosphate
material. Hydrogen fluoride is identified as one of hazardous air pollutants defined in the 1990
Clean Air Act Amendments. Fertilizer handling operations release fertilizer dust.
At a typical normal superphosphate plant, emissions from the rock unloading, handling
and feeding operations are controlled by a baghouse. Baghouse cloth filters have reported
efficiencies of over 99 percent under ideal conditions. Collected dust is recycled. Emissions from
the mixer and den are controlled by a wet scrubber. The curing building and fertilizer handling
operations normally are not controlled.
Silicon tetrafluoride (SiF4) and hydrogen fluoride (HF) emissions, and particulate from the
mixer, den and curing building are controlled by scrubbing the offgases with recycled water.
Gaseous silicon tetrafluoride in the presence of moisture reacts to form gelatinous silica, which
has a tendency to plug scrubber packings. The use of conventional packed-countercurrent
scrubbers and other contacting devices with small gas passages for emissions control is therefore
limited. Controls that can be used are cyclones and venturi, impingement, jet ejector and spray-
crossflow packed scrubbers. Spray towers are also used as precontactors for fluorine removal at
relatively high concentration levels of greater than 4.67 g/m3 (3000 ppm).
Air pollution control techniques vary with particular plant designs. The effectiveness of
abatement systems in removing fluoride and particulate also varies from plant to plant,
depending on a number of factors. The effectiveness of fluorine abatement is determined by the
inlet fluorine concentration, outlet or saturated gas temperature, composition and temperature of
the scrubbing liquid, scrubber type and transfer units, and the effectiveness of entrainment
separation. Control efficiency is enhanced by increasing the number of scrubbing stages in series
and by using a fresh water scrub in the final stage. Reported efficiencies for fluoride control
range from less than 90 percent to over 99 percent, depending on inlet fluoride concentrations
and the system employed. An efficiency of 98 percent for particulate control is achievable.

11
Triple Superphosphates
Sources of particulate emissions include the reactor, granulator, dryer, screens, cooler,
mills, and transfer conveyors. Additional emissions of particulate result from the unloading,
grinding, storage, and transfer of ground phosphate rock. One facility uses limestone, which is
received in granulated form and does not require additional milling.
Emissions of fluorine compounds and dust particles occur during the production of GTSP
triple superphosphate. Silicon tetrafluoride (SiF4) and hydrogen fluoride (HF) are released by the
acidulation reaction and they evolve from the reactors, den, granulator, and dryer. Hydrogen
fluoride is identified as one of hazardous air pollutants defined in the 1990 Clean Air Act
Amendments. Evolution of fluoride is essentially finished in the dryer and there is little fluoride
evolved from the storage pile in the curing building.
At a typical plant, baghouses are used to control the fine rock particles generated by the
rock grinding and handling activities. Emissions from the reactor, den and granulator are
controlled by scrubbing the effluent gas with recycled gypsum pond water in cyclonic scrubbers.
Emissions from the dryer, cooler, screens, mills, product transfer systems, and storage building
are sent to a cyclone separator for removal of a portion of the dust before going to wet scrubbers
to remove fluorides.
Particulate emissions from ground rock unloading, storage and transfer systems are
controlled by baghouse collectors. These baghouse cloth filters have reported efficiencies of over
99 percent. Collected solids are recycled to the process. Emissions of silicon tetrafluoride,
hydrogen fluoride, and particulate from the production area and curing building are controlled by
scrubbing the offgases with recycled water. Exhausts from the dryer, cooler, screens, mills, and
curing building are sent first to a cyclone separator and then to a wet scrubber. Tailgas wet
scrubbers perform final cleanup of the plant offgases.
Gaseous silicon tetrafluoride in the presence of moisture reacts to form gelatinous silica,
which has a tendency to plug scrubber packings. Therefore, the use of conventional packed
countercurrent scrubbers and other contacting devices with small gas passages for emissions
control is not feasible. Scrubber types that can be used are 1) spray tower, 2) cyclone, 3) venturi,
4) impingement, 5) jet ejector, and 6) spray-crossflow packed.
The effectiveness of abatement systems for the removal of fluoride and particulate varies
from plant to plant, depending on a number of factors. The effectiveness of fluorine abatement is
determined by: 1) inlet fluorine concentration, 2) outlet or saturated gas temperature, 3)

12
composition and temperature of the scrubbing liquid, 4) scrubber type and transfer units, and 5)
effectiveness of entrainment separation. Control efficiency is enhanced by increasing the number
of scrubbing stages in series and by using a fresh water scrub in the final stage. Reported
efficiencies for fluoride control range from less than 90 percent to over 99 percent, depending on
inlet fluoride concentrations and the system employed. An efficiency of 98 percent for
particulate control is achievable.
Ammonium Phosphates
Sources of air emissions from the production of ammonium phosphate fertilizers include
the reactor, the ammoniator-granulator, the dryer and cooler, product sizing and material transfer,
and the gypsum pond. The reactor and ammoniator-granulator produce emissions of gaseous
ammonia, gaseous fluorides such as hydrogen fluoride (HF) and silicon tetrafluoride (SiF4), and
particulate ammonium phosphates. These two exhaust streams are generally combined and
passed through primary and secondary scrubbers. Hydrogen fluoride is identified as one of the
hazardous air pollutants defined in the 1990 Clean Air Act Amendments.
Exhaust gases from the dryer and cooler also contain ammonia, fluorides and particulates,
and these streams are commonly combined and passed through cyclones and primary and
secondary scrubbers. Particulate emissions and low levels of ammonia and fluorides from
product sizing and material transfer operations are controlled the same way.
Exhaust streams from the reactor and ammoniator-granulator pass through a primary
scrubber, in which phosphoric acid is used to recover ammonia and particulate. Exhaust gases
from the dryer, cooler and screen first go to cyclones for particulate recovery, and then to
primary scrubbers. Materials collected in the cyclone and primary scrubbers are returned to the
process. The exhaust is sent to secondary scrubbers, where recycled gypsum pond water is used
as a scrubbing liquid to control fluoride emissions. The scrubber effluent is returned to the
gypsum pond.
Primary scrubbing equipment commonly includes venturi and cyclonic spray towers.
Impingement scrubbers and spray-crossflow packed bed scrubbers are used as secondary
controls. Primary scrubbers generally use phosphoric acid of 20 to 30 percent as scrubbing
liquor, principally to recover ammonia. Secondary scrubbers generally use gypsum and pond
water for fluoride control.

13
Throughout the industry, however, there are many combinations and variations. Some
plants use reactor-feed concentration phosphoric acid (40 percent P2O5) in both primary and
secondary scrubbers, and some use phosphoric acid near the dilute end of the 20 to 30 percent
P2O5 range in only a single scrubber. Existing plants are equipped with ammonia recovery
scrubbers on the reactor, ammoniator-granulator and dryer, and particulate controls on the dryer
and cooler. Additional scrubbers for fluoride removal exist, but they are not typical. Only 15 to
20 percent of installations contacted in an EPA survey were equipped with spray-crossflow
packed bed scrubbers or their equivalent for fluoride removal.
Emission control efficiencies for ammonium phosphate plant control equipment are
reported as 94 to 99 percent for ammonium, 75 to 99.8 percent for particulates, and 74 to 94
percent for fluorides.
2.4 REVIEW OF REFERENCES
Pacific Environmental Services (PES) contacted the following sources to obtain the most
up-to-date information on process descriptions and emissions for these industries:
1) Cargill Fertilizer Inc., Tampa, FL.
2) CF Industries, Inc., Plant City, FL.
3) Farmland Industries, Inc. Bartow, FL.
4) Florida Department of Environmental Regulation, Bureau of Air Quality
Management, Tallahassee, FL.
5) IMC Fertilizer, Mulberry, FL.
6) J.R. Simplot Co., Pocatello, ID.
7) North Carolina Department of Environment, Raleigh, NC.
8) Occidental Chemical Corp., White Springs, FL.
9) Royster Company, Mulberry, FL.
10) Seminole Fertilizer, Bartow, FL.
11) Texasgulf, Inc., Aurora, NC.
Of the eleven sources contacted, no responses were received for normal and triple
superphosphates. Responses were received from two state agencies (Sources #4 and #7) and
three fertilizer plants (Sources #3, #5 and #9) for ammonium phosphates. No responses were
received from the remaining sources. A source test report received from Farmland Industries

14
(Source #3) contained only a stack sample summary sheet. It did not provide any description of
the testing procedure, and the sampling done using Methods 2, 3 and 4 is incomplete. There was
no documentation on sample preparation, nozzle calibration or phosphate feed or production
rates. Therefore, this report could not be used to revise the emission factors in the previous AP-
42 document (October 1980). Florida Department of Environmental Regulation (Source #4) sent
computer printouts of summaries of source tests performed at fertilizer plants located in Florida.
The printouts only summarized the type of pollutant, the actual emissions, the maximum
processing rate and the permit allowable emissions, but there was no information on how the
emission tests were performed. Therefore, the printouts could not be used to revise or add to the
existing emission factors. A source test report received from Royster Company (Source #9) could
not be used to revise the existing emission factors since the test methods used were no longer
approved. IMC Fertilizer (Source #5) sent four separate source test reports; one of the reports
was done in 1973 and the remaining three were done in 1991. The 1973 report did not provide
production or feed rates, calibration data and boiler tests data. Therefore, it could not be used in
the emission factor calculation. The North Carolina Department of Environmental Resources
(Source #7) provided six source test reports for Texasgulf, Inc. located in Aurora. All of these six
source test reports and three reports from IMC will be discussed in further detail in Chapter 4.
Reference #1: Source Assessment: Phosphate Fertilizer Industry
This document was obtained from AP-42 Background File for Sections 6.10.1, 6.10.2, and
6.10.3 and was used in the process description and emissions and controls sections.
Reference #2: AP-40 Revisions - Normal and Triple Superphosphates
These reports, obtained from Mr. Horace Mann of the Tennessee Valley Authority (TVA),
were used to rewrite the process descriptions and emissions and controls sections for normal and
triple superphosphates.
Reference #3: North American Fertilizer Capacity Data
This report, obtained from the Tennessee Valley Authority (TVA), contained information
on the name of phosphate fertilizer companies, plant status, locations and estimated productions
from 1987 through 1997. The report was used in estimating the superphosphates and phosphates
fertilizer production for 1992.

15
Reference #4: Background Information for Standards of Performance: Phosphate Fertilizer
Industry: Volume 1: Proposed Standards
This report was obtained from AP-42 Background File for Sections 6.10.1 and 6.10.2 and
provided process descriptions and emissions and controls information.
Reference #5: Background Information for Standards of Performance: Phosphate Fertilizer
Industry: Volume 2: Test Data Summary
This report provided the basis for the emission factors calculated in the previous revision
(October 1980). It was also reviewed for process descriptions, emissions and controls, but was
not used directly in modifying the AP-42 superphosphates fertilizer sections. This document also
contained fluoride emission test summaries for normal superphosphates, triple superphosphates,
and ammonium phosphates. The tests were undertaken to evaluate the best fluoride control
equipment available. Due to lack of documentation, the test results were not used to revise the
emission factors for normal superphosphates, triple superphosphates, or ammonium phosphates.
Reference #6: Final Guideline Document: Control of Fluoride Emissions from Existing
Phosphate Fertilizer Plants
This report was obtained from AP-42 Background File for Sections 6.10.1 and 6.10.2 and
was reviewed for the process descriptions and emissions and controls information.
16
2.5 REFERENCES FOR CHAPTER 2
1. J.M. Nyers, et al., Source Assessment: Phosphate Fertilizer Industry, EPA-600/2-79-019c,U.S. Environmental Protection Agency, Research Triangle Park, NC, May 1979.
2. H.C. Mann, Phosphate Fertilizers, National Fertilizer & Environmental Research Center,Tennessee Valley Authority, Muscle Shoals, Alabama, February 1992.
3. North American Fertilizer Capacity Data (including supplement), Tennessee ValleyAuthority, Muscle Shoals, AL,. December 1991.
4. Background Information for Standards of Performance: Phosphate Fertilizer Industry:Volume 1: Proposed Standards, EPA-450/2-74-019a, U.S. Environmental ProtectionAgency, Research Triangle park, NC, October 1974.
5. Background Information for Standards of Performance: Phosphate Fertilizer Industry:Volume 2: Test Data Summary, EPA-450/2-74-019b, U.S. Environmental ProtectionAgency, Research Triangle park, NC, October 1974.
6. Final Guideline Document: Control of Fluoride Emissions from Existing PhosphateFertilizer Plants, EPA-450/2-77-005, U.S. Environmental Protection Agency, ResearchTriangle park, NC, March 1977.

17
3.0 GENERAL EMISSION DATA REVIEW AND ANALYSIS PROCEDURES
3.1 LITERATURE SEARCH AND SCREENING
The first step of this investigation involved a search of available literature relating to
criteria and noncriteria pollutant emissions associated with normal superphosphates, triple
superphosphates, and ammonium phosphates. This search included the following references:
AP-42 background files maintained by the Emission Factor and Methodologies Section.
PES was able to use the information in these files to ascertain that the emission factors were
correctly taken from the cited references. No new information was found.
Information in the Air Facility Subsystems (AFS) of the EPA Aerometric Information
Retrieval System (AIRS), Clearinghouse for Inventories and Emission Factors (CHIEF) and
National Air Toxics Information Clearinghouse (NATICH), VOC/Particulate Matter (PM)
Speciation Database Management System (SPECIATE), the Crosswalk/Air Toxic Emission
Factor Data Base Management System (XATEF). No unique information was found from these
sources.
To reduce the amount of literature collected to a final group of references pertinent to this
report, the following general criteria were used:
1. Emissions data must be from a primary reference; i.e., the document must constitute
the original source of test data. For example, a technical paper was not included if
the original study was contained in a previous document.
2. The referenced study must contain test results based on more than one test run.
3. The report must contain sufficient data to evaluate the testing procedures and source
operating conditions (e.g., one-page reports were generally rejected).
The emission factors in the previous revision (October 1980) utilized data that were
obtained from primary reference material such as source tests. However, only summaries of
source tests were provided in the appendix of the primary reference document. PES was unable
to obtain full reports of these source tests. Therefore, the emission factor ratings were
downgraded from "A" to "E."
A final set of reference materials was compiled after a thorough review of the pertinent
reports, documents, and information according to these criteria. The final set of reference
materials is given in Chapter 4.

18
3.2 EMISSION DATA QUALITY RATING SYSTEM
As part of Pacific Environmental Services' analysis of the emission data, the quantity and
quality of the information contained in the final set of reference documents were evaluated. The
following data were always excluded from consideration.
1. Test series averages reported in units that cannot be converted to the selected
reporting units;
2. Test series representing incompatible test methods (e.g., comparison of the EPA
Method 5 front-half with the EPA Method 5 front- and back-half);
3. Test series of controlled emissions for which the control device is not specified;
4. Test series in which the source process is not clearly identified and described; and
5. Test series in which it is not clear whether the emissions were measured before or
after the control device.
Data sets that were not excluded were assigned a quality rating. The rating system used
was that specified by the OAQPS for the preparation of AP-42 sections. The data were rated as
follows:
A
Multiple tests performed on the same source using sound methodology and reported in
enough detail for adequate validation. These tests do not necessarily conform to the
methodology specified in either the inhalable particulate (IP) protocol documents or the
EPA reference test methods, although these documents and methods were certainly used as
a guide for the methodology actually used.
B
Tests that were performed by a generally sound methodology but lack enough detail for
adequate validation.

19
C
Tests that were based on an untested or new methodology or that lacked a significant
amount of background data.
D
Tests that were based on a generally unacceptable method but may provide an order-of-
magnitude value for the source.
The following criteria were used to evaluate source test reports for sound methodology
and adequate detail:
1. Source operation. The manner in which the source was operated is well documented
In the report. The source was operating within typical parameters during the test.
2. Sampling procedures. The sampling procedures conformed to a generally acceptable
methodology. If actual procedures deviated from accepted methods, the deviations
are well documented. When this occurred, an evaluation was made of the extent to
which such alternative procedures could influence the test results.
3. Sampling and process data. Adequate sampling and process data are documented in
the report. Many variations can occur unnoticed and without warning during testing.
Such variations can induce wide deviations in sampling results. If a large spread
between test results cannot be explained by information contained in the test report,
the data are suspect and were given a lower rating.
4. Analysis and calculations. The test reports contain original raw data sheets. The
nomenclature and equations used were compared to those (if any) specified by the
EPA to establish equivalency. The depth of review of the calculations was dictated
by the reviewer's confidence in the ability and conscientiousness of the tester, which
in turn was based on factors such as consistency of results and completeness of other
areas of the test report.
3.3 EMISSION FACTOR QUALITY RATING SYSTEM
The quality of the emission factors developed from analysis of the test data was rated
utilizing the following general criteria:

20
A (Excellent)
Developed only from A-rated test data taken from many randomly chosen facilities in the
industry population. The source category is specific enough so that variability within the
source category population may be minimized.
B (Above average)
Developed only from A-rated test data from a reasonable number of facilities. Although no
specific bias is evident, it is not clear if the facilities tested represent a random sample of
the industries. As in the A-rating, the source category is specific enough so that variability
within the source category population may be minimized.
C (Average)
Developed only from A- and B-rated test data from a reasonable number of facilities.
Although no specific bias is evident, it is not clear if the facilities tested represent a
random sample of the industry. As in the A-rating, the source category is specific enough
so that variability within the source category population may be minimized.
D (Below average)
The emission factor was developed only from A- and B-rated test data from a small
number of facilities, and there is reason to suspect that these facilities do not represent a
random sample of the industry. There also may be evidence of variability within the source
category population. Limitations on the use of the emission factor are noted in the
emission factor table.
E (Poor)
The emission factor was developed from C- and D-rated test data, and there is reason to
suspect that the facilities tested do not represent a random sample of the industry. There
also may be evidence of variability within the source category population. Limitations on
the use of these factors are always noted.
The use of these criteria is somewhat subjective and depends to an extent on the individual
reviewer.

21
3.4 REFERENCES FOR CHAPTER 3
1. Technical Procedures for Developing AP-42 Emission Factors and Preparing AP-42Sections. U.S. Environmental Protection Agency, Emissions Inventory Branch, Office ofAir Quality Planning and Standards, Research Triangle Park, NC, 27711, April 1992.[Note: this document is currently being revised at the time of this printing.]
2. AP-42, Supplement A, Appendix C.2, "Generalized Particle Size Distributions." U.S.Environmental Protection Agency, October 1986.
22
4.0 POLLUTANT EMISSION FACTOR DEVELOPMENT
4.1 REVIEW OF SPECIFIC DATA SETS
The emission factors for normal superphosphates, triple superphosphates, and ammonium
phosphates in the previous (October 1980) AP-42 document were taken from Reference 1. They
were derived from source test data provided by Florida Department of Environmental Regulation
in Winter Haven. Appendix B in Reference 1 summarized emission factors calculated from these
source data. However it did not provide any information on how the tests were performed and
how the existing emission factors were calculated from these data. PES was unable to obtain the
source test reports to evaluate the accuracy of the test data. Therefore, the emission factors for
normal superphosphates, triple superphosphates, and ammonium phosphates remained
unchanged. However, as described in Section 3.1, the ratings were downgraded from A to E.
Three reports from IMC Fertilizer (References 13, 14 and 15) and six reports from the
North Carolina Department of Environmental Resources (References 7 through 12) were used to
revise the total plant particulate and fluoride emission factors in the previous ammonium
phosphates section (October 1980). A sulfur dioxide (SO2) emission factor for the total plant will
also be included. The rest of the emission factors in the existing AP-42 document remained
unchanged.
The source test data received (References 7 through 15) report all air emissions as "total
plant" emissions. Therefore, total plant emission factors from these data were used to revise the
total plant emission factors in the previous revision (October 1980).
Most of the emission tests used to develop the new total plant emission factors for
ammonium phosphates were performed in 1990 and 1991; only two were done in 1987 and 1989.
Since the test reports were received from two different plants, the emission factors for the
individual plants were averaged separately. The average total emission factors were then
combined to generate the final emission factors used to revise the existing factors.
One of the source tests from IMC (Reference 14) reported that SO2 and nitrogen oxide
(NOx) were emitted during diammonium phosphate manufacturing. The sulfur dioxide emission
factor was added to the revised section of AP-42. However, the NOx emission factor could not be
used since the report did not have any raw field data or the calculations used to generate this
emission factor.

23
The emission factors calculated in this document were reported in units of kilograms per
megagram and pounds per ton of P2O5 input, P2O5 output, and product. All P2O5 except losses
due to emissions was assumed to reach the product. Therefore, input and output emission factors
are equivalent. All of the emission factors developed for this report are expressed in units of
kilograms per megagram and pounds per ton of P2O5.
The nine test reports used to generate total plant particulate and fluoride emission factors
for ammonium phosphates are discussed separately below.
Reference #7: Compliance Source Test Report: Texasgulf Inc., Granular Triple Super Phosphate
Plant, Aurora, NC, May 1987.
Two compliance tests were conducted at the granular triple superphosphate plant
producing monoammonium phosphate. The first test was performed using EPA Method 5 to
determine particulate emissions. The second test was done using EPA Method 13B to determine
fluoride emissions. Both emissions were measured at the outlet of the fume scrubber stack. This
report was given an "A" rating. Particulate emissions for three runs were 21.16, 16.82, and 17.43
pounds per hour and the production rates were 1574, 1556, and 1587 tons per day. Since the
monoammonium phosphate contained 48 percent phosphate and assuming the plant operated 24
hours per day, the average particulate emission factor is thus
[(21.16/31.48) + (16.82/31.12) + (17.43/31.74)]/3 = 0.59 pounds per ton.
Fluoride emissions for three runs were 2.46, 2.41, and 3.57 pounds per day and phosphate feed
rates were 1349, 1300, and 1422 tons per day. The average fluoride emission factor is thus
[(0.10/26.98) + (0.10/26.00) + (0.15/28.44)]/3 = 0.004 pounds per ton.
Reference #8: Compliance Source Test Report: Texasgulf Inc., Diammonium Phosphate Plant
No.2, Aurora, NC, August 1989.
The test was conducted using EPA Method 13B to determine fluoride emissions. The
sample analyses were performed using an Orion 901 Specific Ion Electrode Analyzer. The report
was rated "A." Fluoride emission rates for three runs were 8.36, 6.48, and 8.72 pounds per day
and P2O5 feed rates were 836.79, 836.54, and 850.85 tons per day. The average fluoride emission
factor is thus
[(8.36/836.79) + (6.48/836.54) + (8.72/850.85)]/3 = 0.009 pounds per ton.

24
Reference #9: Compliance Source Test Report: Texasgulf Inc., Diammonium Phosphate Plant
#2, Aurora, NC, December 1991.
The test was conducted using EPA Reference Method 5 to determine particulate
emissions. Particulate emission rates for three runs were 20.65, 16.50, and 19.53 pounds per hour
and P2O5 production rates were 757, 872, and 863 tons per day. The report did not include any
description of control devices or calibration data for the pitot tube or nozzle. Therefore, the
report was given a "B" rating. Assuming the plant operated 24 hours per day, the average
particulate emission factor is thus
[(20.65/31.54) + ( 16.50/36.33) + (19.53/35.96)]/3 = 0.55 pounds per ton.
Reference #10: Compliance Test Report: Texasgulf, Inc., Diammonium Phosphate #1, Aurora,
NC, September 1990.
Two sampling analyses were conducted to determine particulate emissions using EPA
Method 5 and fluoride emissions using EPA Method 13B. The report contained all necessary
information and was thus rated "A." Particulate emissions rates for three runs were 45.72, 39.92,
and 38.45 pounds per hour and P2O5 feed rates were 395, 395, and 393 tons per day. Fluoride
emissions rates were 1.74, 4.15, and 3.59 pounds per hour and P2O5 feed rates were 293, 321 and
350 tons per day. Assuming the plant operated 24 hours per day, the average particulate emission
factor is thus
[(45.72/16.46) + (39.92/16.46) + (38.45/16.38)]/3 = 2.52 pounds per ton,
and the average fluoride emission factor is
[(1.74/12.21) + (4.15/13.38) + (3.59/14.58)]/3 = 0.23 pounds per ton.
Reference #11: Compliance Source Test Report: Texasgulf Inc., Ammonium Phosphate Plant #2,
Aurora, NC, November 1990.
The test was conducted using EPA Method 13B to determine total fluoride emissions. The
sample analysis was performed using an Orion 901 Specific Ion Electrode Analyzer. The
instrument had the ability to compute a calibration slope from the calibration samples and display
the output directly as parts per million total fluoride. The report provided all necessary
documentation and was rated "A." The total fluoride emissions for three runs were 1.14, 0.83,
and 0.94 pounds per hour and P2O5 feed rates were 889, 938, and 926 tons per day. Assuming the
plant operated 24 hours per day, the average fluoride emission factor is thus

25
[(1.14/37.04) + (0.83/39.08) + (0.94/38.58)]/3 = 0.025 pounds per ton.
Reference #12: Compliance Source Test Report: Texasgulf Inc., Diammonium Phosphate Plant
#2, Aurora, NC, November 1991.
The test was conducted to determine total fluoride emissions using EPA Reference
Method 13B. The sample analysis was performed using an Orion 901 Specific Ion Electrode
Analyzer. The instrument had the ability to compute a calibration slope from the calibration
samples and display the output directly as parts per million total fluoride. The report provided all
necessary documentation and was rated "A." The total fluoride emissions for three runs were
0.61, 0.88, and 1.14 pounds per hour and P2O5 feed rates were 798, 856, and 914 tons per day.
Assuming the plant operated 24 hours per day, the average fluoride emission factor is thus
[(0.61/33.25) + (0.88/35.67) + (1.14/38.08)]/3 = 0.024 pounds per ton.
Reference #13: Compliance Source Test Report: IMC Fertilizer, Inc., #1 DAP plant, Western
Polk County, FL, October 1991.
The test was performed using EPA Reference Method 5 to measure particulate emissions,
and Method 5 was modified to determine fluoride emissions. The front half catch consisting of
the probe wash and filtered particulate were combined with the impinger water and analyzed for
fluoride content. The recoverable fluoride in the particulate was then used to calculate fluoride
emissions by relating it back to the standard volume of the gas sampled. This report contained all
necessary documentation and was thus rated "A." The phosphate (P2O5) feed rate for three runs
was 40.54 tons per hour. Particulate emissions for three runs were 290.5, 302.4, and 272.7
pounds per day and fluoride emissions were 26.7, 27.8, and 27.9 pounds per day. Assuming the
plant operated 24 hours per day, the average particulate emission factor is thus
[(12.10/40.54) + (12.60/40.54) + (11.36/40.54)]/3 = 0.30 pounds per ton,
and the average fluoride emission factor is
[(1.11/40.54) + (1.16/40.54) +(1.16/40.54)]/3 = 0.028 pounds per ton.
Reference #14: Compliance Source Test Report: IMC Fertilizer, Inc., #2 DAP Plant, Western
Polk County, FL, June 1991.
The test was conducted to determine particulate and fluoride emissions using EPA
Reference Method 5. The test was modified to determine fluoride emissions. The front-half catch

26
consisting of the probe rinse and filtered particulate was combined with the impinger water and
analyzed for fluoride content. The recoverable fluoride in the particulate was then used to
calculate fluoride emissions by relating it back to the standard volume of gas sampled. The test
was also conducted to determine NOX and SO2 emissions. Although there were NOx emissions
reported during the test, no test data and calculations were available to evaluate the validity of
the test. Therefore, no NOx emission factor has been included in the revision section. This report
was rated "A." The P2O5 feed rate for the test was 62.55 tons per hour. The total particulate
emissions rates were 136.7, 112.9, and 103.0 pounds per day and the total fluoride emission rates
were 28.7, 23.6, and 25.4 pounds per day. The total SO2 emission rates were 149, 104, and 108
pounds per day. Assuming the plant operated 24 hours per day, the total particulate emission
factor is thus:
[(5.70/62.55) + (4.70/62.55) + (4.29/62.55)]/3 = 0.078 pounds per ton;
the average fluoride emission factor is
[(1.20/62.55) + (0.98/62.55) + (1.06/62.55)]/3 = 0.017 pounds per ton;
and the average sulfur dioxide emission factor is
[(6.21/62.55) + (4.33/62.55) + (4.50/62.55)]/3 = 0.080 pounds per ton.
Reference #15: Compliance Source Test Report: IMC Fertilizer, Inc., Western Polk County, FL,
April 1991.
The test was conducted on the MAP plant scrubber to determine the total fluoride and
particulate emissions. The test was performed in accordance with EPA Reference Method 5 to
determine particulate and fluoride emissions. The test was modified to determine fluoride
emissions. The front-half catch consisting of the probe rinse and filtered particulate was
combined with the impinger water and analyzed for fluoride content. The recoverable fluoride in
the particulate was then used to calculate fluoride emissions by relating it back to the standard
volume of gas sampled. The report was given an "A" rating. The plant was producing 1,200 tons
per day of monoammonium phosphate. Assuming monoammonium phosphate contains 48
percent phosphate, the total amount of phosphate produced was 576 tons per day. The total
particulate emission rates for three runs were 16.6, 17.0, and 15.4 pounds per day and fluoride
emission rates were 3.6, 4.3, and 2.9 pounds per day. The average total particulate emission
factor is
[(16.6/576) + (17.0/576) + (15.4/576)]/3 = 0.028 pounds per ton;

27
and the average total fluoride emission factor is
[(3.6/576) + (4.3/576) + (2.9/576)]/3 = 0.006 pounds per ton.
Reference #16: AIRS Emission Factor Listing for Criteria Air Pollutants
This document did not contain sufficient information to revise the emission factors in the
existing section.
4.2 CRITERIA POLLUTANT EMISSIONS DATA
No data on emissions of volatile organic compounds, lead, or carbon monoxide were
found nor expected for the superphosphates and ammonium phosphates fertilizer processes.
Sulfur Dioxide.
No SO2 emission factor was reported in the previous revision (October 1980) of
ammonium sulfate. However, one of the source tests received from IMC (Reference 14) reported
sulfur dioxide (SO2) emissions. Reference 1 discussed that SO2 might be emitted during
ammonium phosphate manufacturing. The emissions can result from dissolved SO2 in phosphoric
acid and released during a reaction with ammonia. Sulfur dioxide in phosphoric acid is formed
from reactions of the phosphate rock with sulfuric acid. SO2 could also be emitted from the acid
surge tank (for the TVA process). The SO2 emission factor calculated from Reference 14 was
given an "E" rating since the report did not indicate the type of method used to measure the
emissions and one test did not represent a random sample of the industry. A summary of SO2
emission factors is presented in Table 4.2-1.

28
TABLE 4.2-1 (METRIC UNITS)SULFUR DIOXIDE
ControlEquipment
TestRating
TestMethod
Run#
ProductionRatea
EmissionRateb
EmissionFactorc
Reference 14. Exhaust stack
Scrubber A unknown 1 56.74 2.82 0.050
2 56.74 1.96 0.034
3 56.74 2.04 0.036
Average 56.74 2.27 0.040
aUnits in Mg/hr.
bUnits in kg/hr.
cUnits in kg/Mg of P2O5.
TABLE 4.2-1 (ENGLISH UNITS)SULFUR DIOXIDE
ControlEquipment
TestRating
TestMethod
Run#
ProductionRatea
EmissionRateb
EmissionFactorc
Reference 14. Exhaust stack
Scrubber A unknown 1 62.55 6.21 0.099
2 62.55 4.33 0.069
3 62.55 4.50 0.071
Average 62.55 5.01 0.080
aUnits in ton/hr.
bUnits in lb/hr.
cUnits in lb/ton of P2O5.

29
Nitrogen oxides.
Reference 14 also reported nitrogen oxides (NOx) emissions during ammonium phosphate
production. Since the report did not provide a description of how the test was performed or any
raw field data, no NOx emission factor could be included the revised section. However,
Reference 14 did contain sufficient information and raw data to warrant inclusion of the SO2
emission factor as discussed above.
Particulate Matter.
Particulates are emitted from rock unloading, rock handling and feeding, the den and
curing building, and from fertilizer handling. As mentioned in Section 4.1, the particulate and
fluoride emission factors in the previous revision (October 1980) were derived from source test
data provided by the Florida Department of Environmental Regulation. Due to a lack of
documentation, the emission factors were not changed but the rating were downgraded from "A"
to "E." PM10 emission factors for normal and triple superphosphates were taken from the AIRS
Listing of Criteria Air Pollutants which is also rated "E."
As discussed in Section 2.3, particulate matter from ammonium phosphate processing is
emitted in ammoniator-granulator, dryer, cooler, product sizing and material transfer. Particulate
emission species may also include ammonium fluoride and ammonium fluosilicates. Particulate
emission factor for the total plant in the previous section (October 1980) of AP-42 document was
revised with the new emission factor generated from three source tests from Texasgulf
(References 7, 9 and 10) and three from IMC (References 13, 14 and 15). The total plant
particulate emission factor in the revised section was calculated by taking the average of the
average total plant particulate emission factors from Texasgulf and IMC. The average particulate
emission factor from Texasgulf was
[0.59 + 0.55 + 2.52]/3 = 1.22 pounds per ton.
The average particulate emission factor from IMC was
[0.30 +0.078 +0.029]/3 = 0.14 pounds per ton.
The average total plant particulate emission factor is thus
[1.22 + 0.14]/2 = 0.68 pounds per ton.
The new particulate emission factor for the total plant was derived from five "A" rated
reports and one "B" rated report. The "B" rating was given due to lack of some calibration data
30
and the average emission factor is very close to the one from the "A"-rated report. Therefore, the
particulate emission factor for the total plant is given an "A" rating.

31
TABLE 4.2-2 (METRIC UNITS)FILTERABLE PARTICULATE MATTER
ControlEquipment
TestRating
TestMethod
Run#
ProductionRatea
EmissionRateb
EmissionFactorc
Reference 7. Exhaust stack
Scrubber A 5 1 28.56 9.60 0.34
2 28.23 7.63 0.27
3 28.79 7.91 0.28
Average 28.53 8.38 0.30
Reference 9. Exhaust stack
Scrubber B 5 1 28.61 9.37 0.33
2 32.96 7.48 0.23
3 32.62 8.86 0.27
Average 31.40 8.57 0.27
Reference 10. Exhaust stack
Scrubber A 5 1 14.93 20.74 1.39
2 14.93 18.11 1.21
3 14.86 17.44 1.17
Average 14.91 18.76 1.26
Reference 13. Exhaust stack
Scrubber A 5 1 36.78 5.49 0.15
2 36.78 5.71 0.16
3 36.78 5.15 0.14
Average 36.78 5.45 0.15
aUnits in Mg/hr.
bUnits in kg/hr.
c Units in kg/Mg of P2O5
32
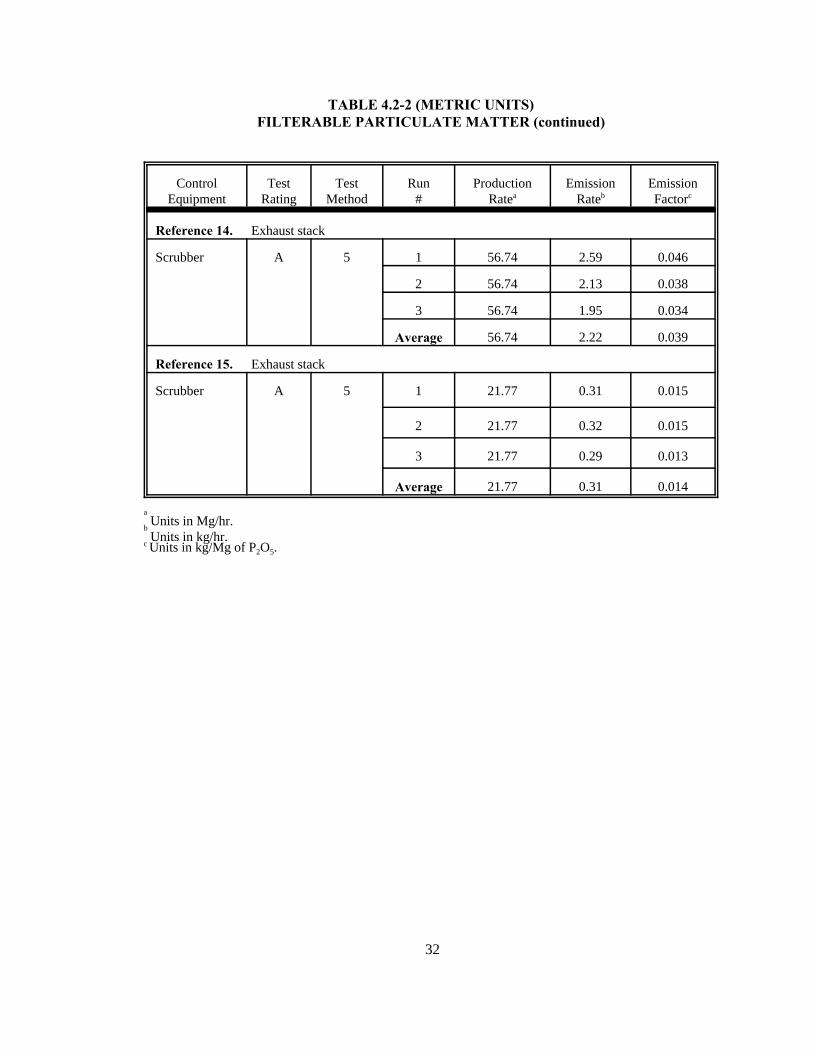
TABLE 4.2-2 (METRIC UNITS)FILTERABLE PARTICULATE MATTER (continued)
ControlEquipment
TestRating
TestMethod
Run#
ProductionRatea
EmissionRateb
EmissionFactorc
Reference 14. Exhaust stack
Scrubber A 5 1 56.74 2.59 0.046
2 56.74 2.13 0.038
3 56.74 1.95 0.034
Average 56.74 2.22 0.039
Reference 15. Exhaust stack
Scrubber A 5 1 21.77 0.31 0.015
2 21.77 0.32 0.015
3 21.77 0.29 0.013
Average 21.77 0.31 0.014
aUnits in Mg/hr.
bUnits in kg/hr.
c Units in kg/Mg of P2O5.

33
TABLE 4.2-2 (ENGLISH UNITS)FILTERABLE PARTICULATE MATTER
ControlEquipment
TestRating
TestMethod
Run#
ProductionRatea
EmissionRateb
EmissionFactorc
Reference 7. Exhaust stack
Scrubber A 5 1 31.48 21.16 0.67
2 31.12 16.82 0.54
3 31.74 17.43 0.55
Average 31.45 18.47 0.59
Reference 9. Exhaust stack
Scrubber B 5 1 31.54 20.65 0.65
2 36.33 16.50 0.45
3 35.96 19.53 0.54
Average 34.61 18.89 0.55
Reference 10. Exhaust stack
Scrubber A 5 1 16.46 45.72 2.78
2 16.46 39.92 2.42
3 16.38 38.45 2.35
Average 16.43 41.36 2.52
Reference 13. Exhaust stack
Scrubber A 5 1 40.54 12.10 0.30
2 40.54 12.60 0.31
3 40.54 11.36 0.28
Average 40.54 12.02 0.30
aUnits in ton/hr.
bUnits in lb/hr.
cUnits in lb/ton of P2O5.

34
TABLE 4.2-2 (ENGLISH UNITS)FILTERABLE PARTICULATE MATTER (continued)
ControlEquipment
TestRating
TestMethod
Run#
ProductionRatea
EmissionRateb
EmissionFactorc
Reference 14. Exhaust stack
Scrubber A 5 1 62.55 5.70 0.091
2 62.55 4.70 0.075
3 62.55 4.29 0.069
Average 62.55 4.90 0.078
Reference 15. Exhaust stack
Scrubber A 5 1 24.00 0.69 0.029
2 24.0 0.71 0.030
3 24.00 0.64 0.027
Average 24.00 0.68 0.029
aUnits in ton/hr.
bUnits in lb/hr.
cUnits in lb/ton of P2O5.
35
4.3 NONCRITERIA POLLUTION EMISSION DATA
No data on emissions of global warming gases or ozone depletion gases were found
nor expected for the superphosphates and phosphates fertilizer processes.
Hazardous Air Pollutants.
Hazardous air pollutants (HAPs) are defined in Title III of the 1990 Clean Air Act
Amendments. Gaseous fluoride is emitted in the form of hydrogen fluoride, a HAP, during
normal superphosphates, triple superphosphates, and ammonium phosphates processing.
Ammonia, also a HAP, is emitted from ammonium phosphates processing and is volatilized from
the reactor and ammoniator-granulator due to incomplete chemical reactions and excess free
ammonia. Ammonia is also emitted from the dryer and cooler as a result of dissociation of
fertilizer product. The ammonia emission factor in the previous section (October 1980) was
derived from source test data provided by the Florida Department of Regulation. Since complete
test reports were not available to verify the validity of the tests, the total plant ammonia emission
factor remained unchanged. However, its rating was downgraded from "A" to "E."
In normal and triple superphosphate processing, gaseous and particulate fluoride is
emitted. Gaseous fluoride is emitted in the form of hydrogen fluoride, a HAP, and silicon
tetrafluoride from the mixer, den, and curing building. Fluoride emission factors in the previous
sections were derived from source test data provided by the Florida Department of Regulation.
Since complete test reports were not available to determine the validity of the tests, the fluoride
emission factors were not changed. However, the ratings were downgraded from A to E.
In ammonium phosphates processing, fluoride vapor that evolves as hydrogen fluoride
originates from the fluoride content of phosphoric acid. The total plant fluoride emission factor
in the October 1980 revision (0.08 lb/ton of P2O5) was revised with the new factor derived from
new source tests received from Texasgulf (References 7, 8, 10, 11 and 12) and IMC (References
13, 14 and 15). These reports provided only fluoride emissions, which consist of hydrogen
fluoride, silicon tetrafluoride, and other impurities. Since only hydrogen fluoride is identified as
a HAP, it was assumed that fluoride emissions contain only hydrogen fluoride. Table 4.3-1
presents a summary of the emission factors calculated from these source tests. The average
fluoride emission factor for the total plant from Texasgulf was
[0.004 + 0.009 + 0.233 + 0.025 + 0.024]/5 = 0.059 pounds per ton;
and the average fluoride emission factor for the total plant from IMC was

36
[0.028 + 0.017 + 0.006]/3 = 0.017 pounds per ton.
The final average of the fluoride emission factor for the total plant is thus
[0.059 + 0.017]/2 = 0.038 pounds per ton.
The fluoride emission factor for the total plant in the revised section was developed from
A-rated source test reports. No specific bias in the data is evident and the facilities tested were
representative of the industry. Therefore, an "A" rating was assigned.

37
TABLE 4.3-1 (METRIC UNITS)HAZARDOUS AIR POLLUTANTS
ControlEquipment
TestRating
TestMethod
Run#
ProductionRatea
EmissionRateb
EmissionFactorc
Reference 7. Exhaust stack
Scrubber A 13B 1 24.48 0.045 0.002
2 23.59 0.045 0.002
3 25.80 0.068 0.003
Average 24.62 0.054 0.002
Reference 8. Exhaust stack
A 13B 1 31.63 0.16 0.005
2 31.62 0.12 0.004
3 32.16 0.16 0.005
Average 31.81 0.15 0.005
Reference 10. Exhaust stack
A 13B 1 11.08 0.79 0.072
2 12.14 1.88 0.155
3 13.20 1.63 0.123
Average 12.14 1.43 0.117
Reference 11. Exhaust stack
A 13B 1 33.60 0.52 0.016
2 35.45 0.38 0.011
3 35.00 0.43 0.012
Average 34.68 0.44 0.013
aUnits in ton/hr.
bUnits in lb/hr.
cUnits in lb/ton of P2O5.

38
TABLE 4.3-1 (METRIC UNITS) (concluded)HAZARDOUS AIR POLLUTANTS
ControlEquipment
TestRating
TestMethod
Run#
ProductionRatea
EmissionRateb
EmissionFactorc
Reference 12. Exhaust stack
A 13B 1 30.16 0.28 0.009
2 32.36 0.40 0.012
3 34.55 0.52 0.015
Average 32.36 0.40 0.012
Reference 13. Exhaust stack
A 13B 1 36.78 0.50 0.014
2 36.78 0.53 0.015
3 36.78 0.53 0.015
Average 36.78 0.52 0.015
Reference 14. Exhaust stack
A 13B 1 56.74 0.54 0.010
2 56.74 2.16 0.008
3 56.74 2.34 0.008
Average 56.74 2.38 0.009
Reference 15. Exhaust stack
A 13B 1 26.45 0.07 0.003
2 26.45 0.08 0.003
3 26.45 0.05 0.002
Average 26.45 0.07 0.003
aUnits in ton/hr.
bUnits in lb/hr.
cUnits in lb/ton of P2O5.

39
TABLE 4.3-1 (ENGLISH UNITS)HAZARDOUS AIR POLLUTANTS
ControlEquipment
TestRating
TestMethod
Run#
ProductionRatea
EmissionRateb
EmissionFactorc
Reference 7. Exhaust stack
A 13B 1 26.98 0.10 0.004
2 26.00 0.10 0.004
3 28.44 0.15 0.005
Average 27.14 0.12 0.004
Reference 8. Exhaust stack
A 13B 1 34.87 0.35 0.010
2 34.86 0.27 0.008
3 35.45 0.36 0.010
Average 35.06 0.33 0.009
Reference 10. Exhaust stack
A 13B 1 12.21 1.74 0.143
2 13.38 4.15 0.310
3 14.55 3.59 0.247
Average 13.38 3.16 0.233
Reference 11. Exhaust stack
A 13B 1 37.04 1.14 0.031
2 39.08 0.83 0.021
3 38.58 0.94 0.024
Average 38.23 0.97 0.025
aUnits in ton/hr.
bUnits in lb/hr.
cUnits in lb/ton of P2O5.

40
TABLE 4.3-2 (ENGLISH UNITS) (concluded)HAZARDOUS AIR POLLUTANTS
ControlEquipment
TestRating
TestMethod
Run#
ProductionRatea
EmissionRateb
EmissionFactorc
Reference 12. Exhaust stack
A 13B 1 33.25 0.61 0.018
2 35.67 0.88 0.025
3 38.08 1.14 0.030
Average 35.67 0.88 0.024
Reference 13. Exhaust stack
A 13B 1 40.54 1.11 0.027
2 40.54 1.16 0.029
3 40.54 1.16 0.029
Average 40.54 1.14 0.028
Reference 14. Exhaust stack
A 13B 1 62.55 1.20 0.019
2 62.55 0.98 0.016
3 62.55 1.06 0.017
Average 62.55 1.08 0.017
Reference 15. Exhaust stack
A 13B 1 24.00 0.15 0.006
2 24.00 0.18 0.007
3 24.00 0.12 0.005
Average 24.00 0.15 0.006
aUnits in ton/hr.
bUnits in lb/hr.
cUnits in lb/ton P2O5.
41
4.4 DATA GAP ANALYSIS
The emission factors presented for normal and triple superphosphates are unchanged from
the previous revision but have been downgraded from "A" to "E" quality due to a lack of
documented source tests. Current source tests of operating normal and triple superphosphate
processing facilities are required to either verify the current emission factors or to generate new
ones.
Only one source test report received (Reference 14) provided SO2 and NOx emissions from
ammonium phosphate production, because these emissions are rarely measured at fertilizer
plants. In order to confirm these emission factors, more source tests are suggested.

42
4.5 REFERENCES FOR CHAPTER 4
1. J.M. Nyers, et al., Source Assessment: Phosphate Fertilizer Industry, EPA-600/2-79-019c,U.S. Environmental Protection Agency, Research Triangle Park, NC, May 1979.
2. H.C. Mann, Normal Superphosphate, National Fertilizer & Environmental Research Center,Tennessee Valley Authority, Muscle Shoals, AL, February 1992.
3. North American Fertilizer Capacity Data (including supplement), Tennessee ValleyAuthority, Muscle Shoals, AL, December 1991.
4. Background Information for Standards of Performance: Phosphate Fertilizer Industry:Volume 1: Proposed Standards, EPA-450/2-74-019a, U.S. Environmental ProtectionAgency, Research Triangle park, NC, October 1974.
5. Background Information for Standards of Performance: Phosphate Fertilizer Industry:Volume 2: Test Data Summary, EPA-450/2-74-019b, U.S. Environmental ProtectionAgency, Research Triangle park, NC, October 1974.
6. Final Guideline Document: Control of Fluoride Emissions from Existing PhosphateFertilizer Plants, EPA-450/2-77-005, U.S. Environmental Protection Agency, ResearchTriangle park, NC, March 1977.
7. Compliance Source Test Report: Texasgulf Inc., Granular Triple Super Phosphate Plant,Aurora, NC, May 1987.
8. Compliance Source Test Report: Texasgulf Inc., Diammonium Phosphate Plant No.2,Aurora, NC, August 1989.
9. Compliance Source Test Report: Texasgulf Inc., Diammonium Phosphate Plant #2, Aurora,NC, December 1991.
10. Compliance Test Report: Texasgulf, Inc., Diammonium Phosphate #1, Aurora, NC,September 1990.
11. Compliance Source Test Report: Texasgulf Inc., Ammonium Phosphate Plant #2, Aurora,NC, November 1990.
12. Compliance Source Test Report: Texasgulf Inc., Diammonium Phosphate Plant #2, Aurora,NC, November 1991.
13. Compliance Source Test Report: IMC Fertilizer, Inc., #1 DAP plant, Western Polk County,FL, October 1991.
14. Compliance Source Test Report: IMC Fertilizer, Inc., #2 DAP Plant, Western Polk County,FL, June 1991.

43
15. Compliance Source Test Report: IMC Fertilizer, Inc., Western Polk County, FL, April1991.
16. AIRS Facility Subsystem Source Classification Codes and Emission Factor Listing forCriteria Air Pollutants. Prepared for the U.S. Environmental Protection Agency, ResearchTriangle Park, NC. EPA Number 450/4-90-003. March 1990.

44
TABLE 4.5-1
LIST OF CONVERSION FACTORS
Multiply: by: To obtain:
mg/dscm 4.37 x 10⁻⁴ gr/dscf
m2 10.764 ft2
acm/min 35.31 acfm
m/s 3.281 ft/s
kg/hr 2.205 lb/hr
kPa 1.45 x 10⁻¹ psia
kg/Mg 2.0 lb/ton
Mg 1.1023 ton
Temperature conversion equations:
Fahrenheit to Celsius:
EC '(EF&32)
1.8
Celsius to Fahrenheit:
EF ' 1.8(EC) % 32

5/92 Chemical Process Industry 6.10.1-1
A-1
APPENDIX A.
AP-42 SECTION 6.10.1
[Not presented here. See instead current AP-42 Section 8.5.]