BACKGROUND REPORT AP-42 SECTION 12-11 - … · 2015-09-10 · BACKGROUND REPORT AP-42 SECTION 12-11...
52
i BACKGROUND REPORT AP-42 SECTION 12-11 SECONDARY LEAD PROCESSING Prepared for U.S. Environmental Protection Agency OAQPS/TSD/EIB Research Triangle Park, NC 27711 1-103 Pacific Environmental Services, Inc. 5001 South Miami Boulevard P.O. Box 12077 Research Triangle Park, NC 27709
Transcript of BACKGROUND REPORT AP-42 SECTION 12-11 - … · 2015-09-10 · BACKGROUND REPORT AP-42 SECTION 12-11...
i
BACKGROUND REPORT
AP-42 SECTION 12-11
SECONDARY LEAD PROCESSING
Prepared for
U.S. Environmental Protection AgencyOAQPS/TSD/EIB
Research Triangle Park, NC 27711
1-103
Pacific Environmental Services, Inc.5001 South Miami Boulevard
P.O. Box 12077Research Triangle Park, NC 27709
ii
919/941-0333
1-103
AP-42 Background Report
TECHNICAL SUPPORT DIVISION

iii
U.S. ENVIRONMENTAL PROTECTION AGENCYOffice of Air Quality Planning and Standards
Research Triangle Park, NC 27711This report has been reviewed by the Technical Support Division of the Office of Air QualityPlanning and Standards, EPA. Mention of trade names or commercial products is not intended toconstitute endorsement or recommendation for use. Copies of this report are available through theLibrary Services Office (MD-35), U.S. Environmental Protection Agency, Research Triangle Park,NC 27711.
iv
TABLE OF CONTENTS
1.0 INTRODUCTION . . . . . . . . . . . . . . . . . . . . . . . . . . . . . . . . . . . . . . . . . . . . . . . . . 1
2.0 INDUSTRY DESCRIPTION . . . . . . . . . . . . . . . . . . . . . . . . . . . . . . . . . . . . . . . . . 2 2.1 GENERAL . . . . . . . . . . . . . . . . . . . . . . . . . . . . . . . . . . . . . . . . . . . . 2 2.2 PROCESS DESCRIPTION . . . . . . . . . . . . . . . . . . . . . . . . . . . . . . . . 2 2.3 EMISSIONS AND CONTROLS . . . . . . . . . . . . . . . . . . . . . . . . . . . . 8 2.4 REVIEW OF SPECIFIC DATA SETS . . . . . . . . . . . . . . . . . . . . . . . 192.5 REFERENCES FOR CHAPTER 2 . . . . . . . . . . . . . . . . . . . . . . . . . . 23
3.0 GENERAL EMISSION DATA REVIEW AND ANALYSIS PROCEDURES . . . . 263.1 LITERATURE SEARCH AND SCREENING . . . . . . . . . . . . . . . . . . 263.2 EMISSION DATA QUALITY RATING SYSTEM . . . . . . . . . . . . . . 273.3 EMISSION FACTOR QUALITY RATING SYSTEM . . . . . . . . . . . 293.4 REFERENCES FOR CHAPTER 3 . . . . . . . . . . . . . . . . . . . . . . . . . . 31
4.0 POLLUTANT EMISSION FACTOR DEVELOPMENT . . . . . . . . . . . . . . . . . . . . 324.1 CRITERIA POLLUTANT EMISSIONS DATA . . . . . . . . . . . . . . . . 324.2 NONCRITERIA POLLUTANT EMISSIONS DATA . . . . . . . . . . . . 384.3 REVIEW OF SPECIFIC DATA SETS . . . . . . . . . . . . . . . . . . . . . . . 404.4 DATA GAP ANALYSIS . . . . . . . . . . . . . . . . . . . . . . . . . . . . . . . . . . 414.5 REFERENCES FOR CHAPTER 4 . . . . . . . . . . . . . . . . . . . . . . . . . . 43
v
LIST OF TABLES
TABLE 2.3-1 (METRIC): EMISSION FACTORS FOR SECONDARY LEAD PROCESSING . . . . . . . . . . . . . . . . . . . . . . . . . . . . . . . . . . . . . . . . . . . . . . . . . 9TABLE 2.3-1 (ENGLISH): EMISSION FACTORS FOR SECONDARY LEAD PROCESSING . . . . . . . . . . . . . . . . . . . . . . . . . . . . . . . . . . . . . . . . . . . . . . . . 10TABLE 2.3-2 (METRIC): FUGITIVE EMISSION FACTORS FOR SECONDARY LEAD PROCESSING . . . . . . . . . . . . . . . . . . . . . . . . . . . . . . . . . . . . 11TABLE 2.3-2 (ENGLISH): FUGITIVE EMISSION FACTORS FOR SECONDARY LEAD PROCESSING . . . . . . . . . . . . . . . . . . . . . . . . . . . . . . . . . . . . 12TABLE 2.3-3 EMISSION FACTORS AND PARTICLE SIZE DISTRIBUTION FOR UNCONTROLLED BLAST FURNACE VENTILATION . . . . . . . . . . . . . . . . . . . . 14TABLE 2.3-4 EMISSION FACTORS AND PARTICLE SIZE DISTRIBUTION FOR BAGHOUSE CONTROLLED BLAST FURNACE FLUE GASES . . . . . . . . . . . . . . 16TABLE 2.3-5 EFFICIENCIES OF PARTICULATE CONTROL EQUIPMENT ASSOCIATED WITH SECONDARY LEAD SMELTING FURNACES . . . . . . . . . . . . . . . . . . . . . . . . . . . . . . . . . . . . . . . . . . . . . 18TABLE 4.1-1 (METRIC): LEAD . . . . . . . . . . . . . . . . . . . . . . . . . . . . . . . . . . . . . . . . . . . . . 33TABLE 4.1-1 (ENGLISH): LEAD . . . . . . . . . . . . . . . . . . . . . . . . . . . . . . . . . . . . . . . . . . . . 34TABLE 4.1-2 (METRIC): SULFUR DIOXIDE . . . . . . . . . . . . . . . . . . . . . . . . . . . . . . . . . . . 36TABLE 4.1-2 (ENGLISH): SULFUR DIOXIDE . . . . . . . . . . . . . . . . . . . . . . . . . . . . . . . . . . 36TABLE 4.1-3 (METRIC): TOTAL SUSPENDED PARTICULATE . . . . . . . . . . . . . . . . . . . . 37TABLE 4.1-3 (ENGLISH): TOTAL SUSPENDED PARTICULATE . . . . . . . . . . . . . . . . . . . 37TABLE 4.2-1 (METRIC): GLOBAL WARMING GASES . . . . . . . . . . . . . . . . . . . . . . . . . . 39TABLE 4.2-1 (ENGLISH): GLOBAL WARMING GASES . . . . . . . . . . . . . . . . . . . . . . . . . 39TABLE 4.5-1 LIST OF CONVERSION FACTORS . . . . . . . . . . . . . . . . . . . . . . . . . . . . . . . . 46
vi
LIST OF FIGURES
FIGURE 2.2-1A PROCESS FLOW FOR TYPICAL SECONDARYLEAD SMELTING . . . . . . . . . . . . . . . . . . . . . . . . . . . . . . . . . . . . . . . 3
FIGURE 2.2-1B PROCESS FLOW FOR TYPICAL SECONDARYLEAD SMELTING . . . . . . . . . . . . . . . . . . . . . . . . . . . . . . . . . . . . . . . 4
FIGURE 2.2-1C PROCESS FLOW FOR TYPICAL SECONDARYLEAD SMELTING . . . . . . . . . . . . . . . . . . . . . . . . . . . . . . . . . . . . . . . 5
FIGURE 2.3-1 EMISSION FACTORS LESS THAN STATEDPARTICLE SIZE FOR UNCONTROLLEDAND BAGHOUSE CONTROLLED BLAST FURNACEVENTILATION . . . . . . . . . . . . . . . . . . . . . . . . . . . . . . . . . . . . . . . . 15
FIGURE 2.3-2 EMISSION FACTORS LESS THAN STATED PARTICLESIZE FOR BAGHOUSE CONTROLLED BLAST FURNACEFLUE GASES . . . . . . . . . . . . . . . . . . . . . . . . . . . . . . . . . . . . . . . . . . 17
FIGURE 12.11-1A PROCESS FLOW FOR TYPICAL SECONDARYLEAD SMELTING . . . . . . . . . . . . . . . . . . . . . . . . . . . . . . . . . . . . . . 49
FIGURE 12.11-1B PROCESS FLOW FOR TYPICAL SECONDARYLEAD SMELTING . . . . . . . . . . . . . . . . . . . . . . . . . . . . . . . . . . . . . . 50
FIGURE 12.11-1C PROCESS FLOW FOR TYPICAL SECONDARYLEAD SMELTING . . . . . . . . . . . . . . . . . . . . . . . . . . . . . . . . . . . . . . 51
1
1.0 INTRODUCTION
The document "Compilation of Air Pollutant Emission Factors" (AP-42) has been published
by the U.S. Environmental Protection Agency (EPA) since 1972. Supplements to AP-42 have been
routinely published to add new emission source categories and to update existing emission factors.
AP-42 is routinely updated by the EPA to respond to new emission factor needs of the EPA, State
and local air pollution control programs, and industry.
An emission factor relates the quantity (weight) of pollutants emitted to a unit of activity of
the source. The uses for the emission factors reported in AP-42 include:
1. Estimates of area-wide emissions;
2. Emission estimates for a specific facility; and
3. Evaluation of emissions relative to ambient air quality.
The purpose of this report is to provide background documentation of process information
obtained from industry comment and 9 test reports to support revision of emission factors for the
secondary lead processing industry.
Including the introduction (Chapter 1), this report contains four chapters. Chapter 2 gives a
description of the secondary lead processing industry. It includes a characterization of the industry,
an overview of the different process types, a description of emissions, and a description of the
technology used to control emissions resulting from secondary lead processing.
Chapter 3 is a review of emissions data collection and analysis procedures. It describes the
literature search, the screening of emission data reports, and the quality rating system for both
emission data and emission factors. Chapter 4 details criteria and noncriteria pollutant emission
factor development. It includes the review of specific data sets and the results of data analyses.
Particle size determination and particle size data analysis methodology are described when
applicable.
2
2.0 INDUSTRY DESCRIPTION
2.1 GENERAL
Secondary lead smelters produce elemental lead and lead alloys from lead-bearing scrap
material. More than 60 percent of all secondary lead is derived from scrap automobile batteries.
Each battery contains approximately 11.8 kg (26 lbs) of lead, consisting of 40 percent lead alloys
and 60 percent lead oxide.21 Other raw materials used in secondary lead smelting include wheel
balance weights, pipe, solder, drosses, and lead sheathing. Lead produced by secondary smelting
accounts for half of the lead produced in the U.S. As of 1989, there were 42 companies operating
50 plants with individual capacities ranging from 900 Mg (992 tons) to 110,000 Mg (121,000
tons) per year.21
2.2 PROCESS DESCRIPTION
Secondary lead smelting includes three major operations: scrap pretreatment, smelting, and
refining. These are shown schematically in Figures 2.2-1A, 2.2-1B, and 2.2-1C, respectively.
2.2.1 Scrap Pretreatment
Scrap pretreatment is the partial removal of metal and nonmetal contaminants from lead-
bearing scrap and residue. Processes used for scrap pretreatment include battery breaking (SCC#
3-04-004-10), crushing (SCC# 3-04-004-11), and sweating (SCC#
3-04-004-12). Battery breaking is the draining and crushing of batteries, followed by manual
separation of the lead from nonmetallic materials. Lead plates, posts, and intercell connectors are
collected and stored in a pile for subsequent charging to the furnace. Oversized pieces of scrap and
residues are usually put through jaw crushers. This separated lead scrap is then sweated in a gas-
or oil-fired reverberatory (SCC# 3-04-004-05) or rotary furnace (SCC# 3-04-004-04). The
sweating process separates lead from metals with higher melting points. Rotary furnaces are
usually used to process low lead

3
Figure 2.2-1A G
eneralized process flow for secondary lead processing
4
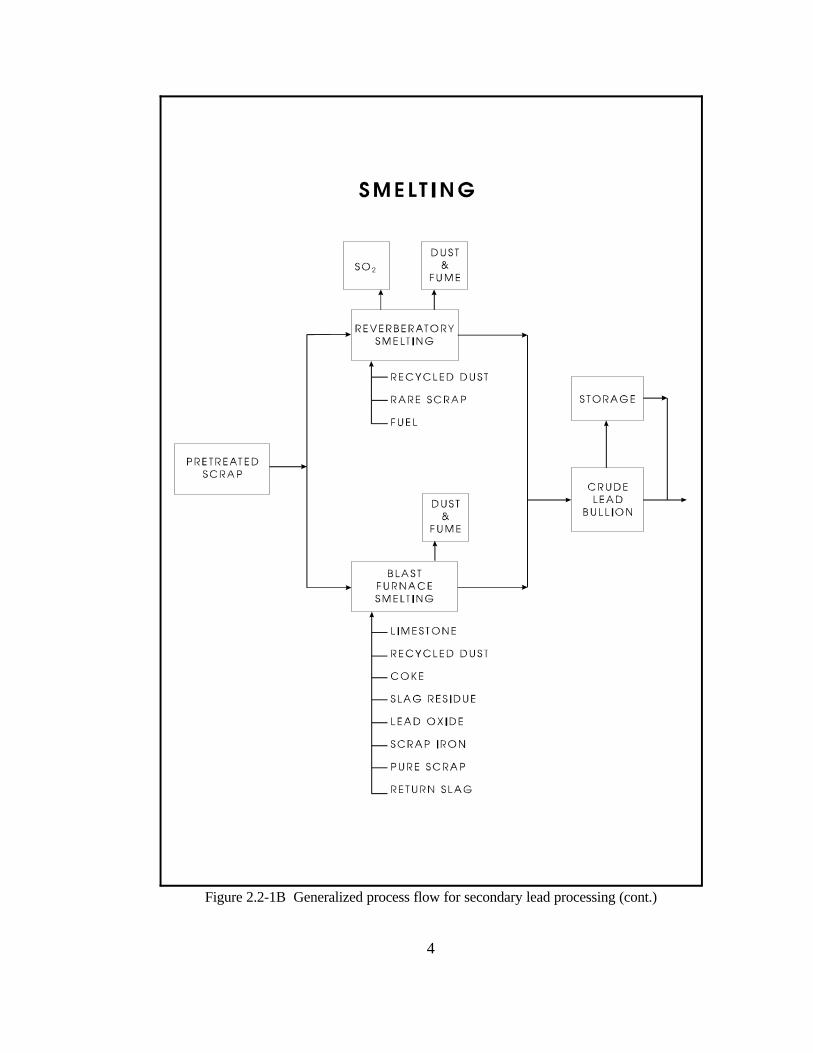
Figure 2.2-1B Generalized process flow for secondary lead processing (cont.)
5
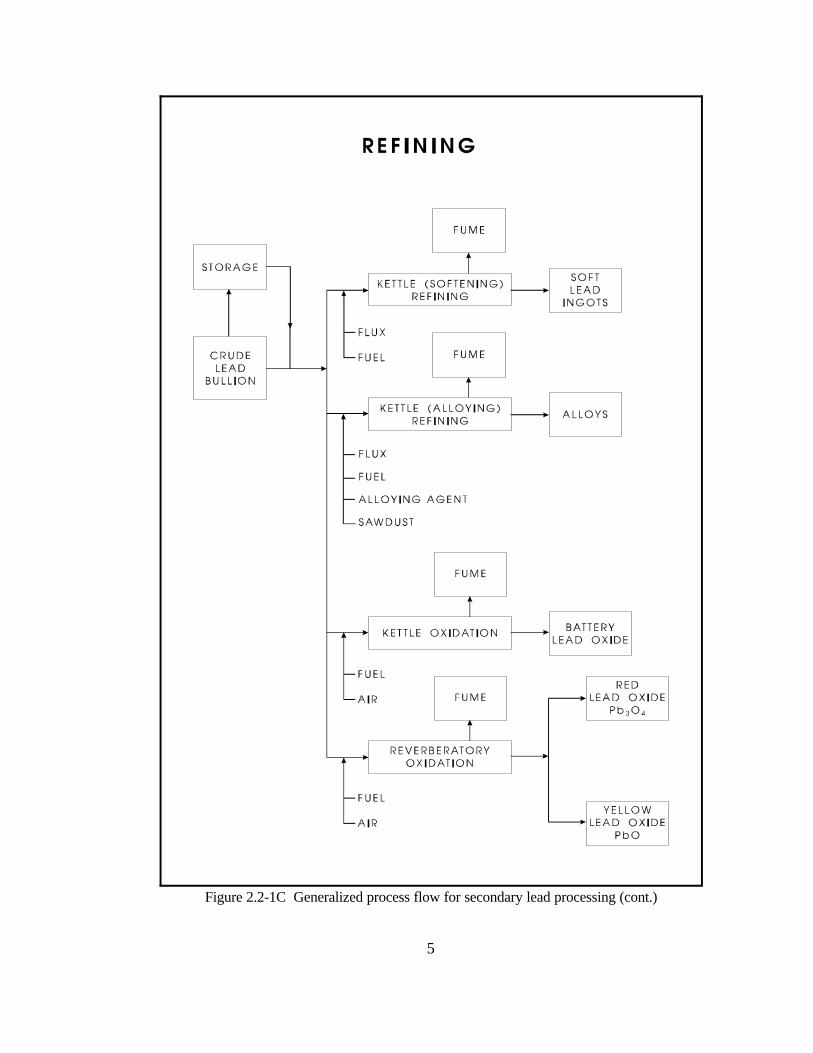
Figure 2.2-1C Generalized process flow for secondary lead processing (cont.)
6
content scrap and residue, while reverberatory furnaces are used to process high lead content scrap.
The partially purified lead is periodically tapped from these furnaces for further processing in
smelting furnaces or pot furnaces.
2.2.2 Smelting
Smelting produces lead by melting and separating the lead from metal and nonmetallic
contaminants and by reducing oxides to elemental lead. Smelting is carried out in blast (SCC# 3-
04-004-03), reverberatory (SCC# 3-04-004-02), and rotary kiln (SCC#
3-04-004-99) furnaces. Blast furnaces produce hard or antimonial lead containing about 10 percent
antimony. Reverberatory and rotary kiln furnaces are used to produce semisoft lead containing
three to four percent antimony; however, rotary kiln furnaces are rarely used in the U.S. and will
not be discussed in detail.
In blast furnaces pretreated scrap metal, rerun slag, scrap iron, coke, recycled dross (as
byproduct waste or impurities), flue dust, and limestone are used as charge materials to the
furnace. The process heat needed to melt the lead is produced by the reaction of the charged coke
with blast air that is blown into the furnace. Some of the coke combusts to melt the charge, while
the remainder reduces lead oxides to elemental lead. The furnace is charged with combustion air at
3.4 to 5.2 kPa (0.5 to 0.75 psi) with an exhaust temperature ranging from 650 to 730EC (1200 to
1350EF).
As the lead charge melts, limestone and iron float to the top of the molten bath and form a
flux that retards oxidation of the product lead. The molten lead flows from the
furnace into a holding pot at a nearly continuous rate. The product lead constitutes roughly 70
percent of the charge. From the holding pot, the lead is usually cast into large
ingots called pigs or sows. About 18 percent of the charge is recovered as slag, with about 60
percent of this being a sulfurous slag called matte. Roughly 5 percent of the charge is retained for
reuse, and the remaining 7 percent of the charge escapes as dust or fumes. Processing capacity of
the blast furnace ranges from 18 to 73 megagrams per day (20 to 80 tons per day).
The reverberatory furnace used to produce semisoft lead is charged with lead scrap, metallic
battery parts, oxides, drosses, and other residues. The charge is heated directly to a temperature of
1260EC (2300EF) using either natural gas, oil, or coal. The average furnace capacity is about 45
megagrams (50 tons) per day. About 47 percent of the charge is recovered as lead product and is
7
periodically tapped into molds or holding pots. Forty-six percent of the charge is removed as slag
and is later processed in blast furnaces. The remaining seven percent of the furnace charge escapes
as dust or fumes.
2.2.3 Refining
Refining (SCC# 3-04-004-14) and casting (SCC# 3-04-004-09) the crude lead from the
smelting furnaces consists of softening, alloying, and oxidation depending on the degree of purity
or alloy type desired. These operations are batch processes requiring from two hours to three days.
These operations can be performed in reverberatory furnaces; however, kettle-type furnaces are
most commonly used. The remelting process is usually applied to lead alloy ingots that require no
further processing before casting. Kettle furnaces used for alloying, refining and oxidizing are
usually oil- or gas-fired (SCC# 3-04-004-06 and 3-04-004-07, respectively) and have typical
capacities of 23 to 136 megagrams (25 to 150 lbs) per day. Refining and alloying operating
temperatures range from 320 to 700EC (600 to 1300EF). Alloying furnaces simply melt and mix
ingots of lead and alloy materials. Antimony, tin, arsenic, copper, and nickel are the most common
alloying materials.
Refining furnaces are used to either remove copper and antimony for soft lead production or
to remove arsenic, copper, and nickel for hard lead production. Sulfur may be added to the molten
lead bath to remove copper. Copper sulfide skimmed off as dross may subsequently be processed
in a blast furnace to recover residual lead. Aluminum chloride flux may be used to remove copper,
antimony, and nickel. The antimony content
can be reduced to about 0.02 percent by bubbling air through the molten lead. Residual antimony
can be removed by adding sodium nitrate and sodium hydroxide to the bath and skimming off the
resulting dross. Dry drossing consists of adding sawdust to the agitated mass of molten metal. The
sawdust supplies carbon to help separate globules of lead suspended in the dross and to reduce
some of the lead oxide to elemental lead.
Oxidizing furnaces, either kettle or reverberatory units, are used to oxidize lead and to
entrain the product lead oxides in the combustion air stream for subsequent recovery in high
efficiency baghouses.
8
2.3 EMISSIONS AND CONTROLS
Emission factors for controlled and uncontrolled processes and for fugitive particulate
matter are given in Tables 2.3-1 and 2.3-2, respectively. Particulate emissions from most processes
were obtained from the previous AP-42 section (October 1986) which were based on accumulated
test data. Process fugitive emissions presented in Table 2.3-2 were also derived from the previous
AP-42 document except for the smelting operation lead emission factor. The smelting operation
fugitive lead emission factor was developed from a recent source test received for the industry, and
the remaining fugitive emissions presented in Table 2.3-2 were based on the assumption that 5
percent of uncontrolled stack emissions are released as fugitive emissions.
Reverberatory and blast furnaces account for the vast majority of the total lead
emissions from the secondary lead industry. The lead blast furnace is also referred to as cupola.
The relative quantities emitted from these two smelting processes cannot be specified, because of a
lack of complete information. Most of the remaining processes are small emission sources with
undefined emission characteristics.
Emissions from battery breaking are mainly of sulfuric acid mist and dusts containing dirt,
battery case material, and lead compounds. Emissions from crushing are also mainly dusts.
Emissions from sweating operations are fumes, dust, soot particles, and combustion
products, including sulfur dioxide (SO2). The SO2 emissions come from combustion of sulfur
compounds in the scrap and fuel. Dust particles range in size from 5 to 20 micrometers (µm) and
unagglomerated lead fumes range in size from 0.07 to 0.4 µm, with an average diameter of 0.3 µm.
Baghouses are usually used to control sweating emissions, with removal efficiencies exceeding 99
percent. The emission factors for lead sweating in Table 2.3-1 are based upon measurements at
similar sweating furnaces in other secondary metal processing industries, not on measurements at
lead sweating furnaces.
Reverberatory smelting furnaces emit particulate and oxides of sulfur and nitrogen.
Particulate consists of oxides, sulfides and sulfates of lead, antimony, arsenic, copper, and tin, as
well as unagglomerated lead fumes. Emissions are generally controlled with settling and cooling
chambers, followed by a baghouse. Control efficiencies generally exceed 99 percent. Wet
scrubbers are sometimes used to reduce SO2 emissions. However, because of

9
TABLE 2.3-1. (METRIC UNITS)EMISSION FACTORS FOR SECONDARY LEAD PROCESSING
All Emission Factors are in kg/Mg of Product, Unless NotedRatings (A-E) Follow Each Factor
Particulate Lead SO2
Process Uncontrolled Controlled Uncontrolled Controlled Uncontrolled
Sweatinga (kg/Mgcharge)(SCC# 3-04-004-04 and 3-04-004-05)
16-35 E 4-8b E
Reverberatory smelting(SCC# 3-04-004-02)
162(87-242)c
E 0.50(0.26-0.77)d
E 32(17-48)e
E 40(36-44)d
E
Blast (cupola)smeltingf
(SCC# 3-04-004-03)
153(92-207)g
E 1.12(0.11-2.49)h
E 52(31-70)i
E 0.15(0.02-0.32)j
E 27(9-55)c
E
Kettle refining(SCC# 3-04-004-99)
0.02k E 0.006k E
Kettle Oxidation(SCC# 3-04-004-08)
# 20l E
Casting(SCC# 3-04-004-09)
0.02k E 0.007k E
aReference 1. Estimated from sweating furnace emissions from nonlead secondary nonferrous processingindustries. Based on quantity of material charged to furnace.bReferences 3, 5. Based on assumption that uncontrolled reverberatory furnace flue emissions are 23% lead.cReferences 8-11.dReferences 6, 8-11.eReference 13. Uncontrolled reverberatory furnace flue emissions assumed to be 23% lead. Blast furnace emissions have lead content of 34%, based on single uncontrolled plant test.fBlast furnace emissions are combined flue gases and associated ventilation hood streams (charging andtapping).gReferences 8, 11-12.hReferences 6, 8, 11-12, 14-15.iReference 13. Blast furnace emissions have lead content of 26%, based on single controlled plant test.jBased on quality of material charged to furnace.kReference 13. Lead content of kettle refining emissions is 40% and of casting emissions is 36%.lReferences 1-2. Essentially all product lead oxide is entrained in an air stream and subsequently recovered bybaghouse with average collection efficiency >99%. Factor represents emissions of lead oxide that escape abaghouse used to collect the lead oxide product. Represents approximate upper limit for emissions.
10
TABLE 2.3-1. (ENGLISH UNITS)EMISSION FACTORS FOR SECONDARY LEAD PROCESSING
All Emission Factors are in lb/ton of Product, Unless NotedRatings (A-E) Follow Each Factor
Particulate Lead SO2
Process Uncontrolled Controlled Uncontrolled Controlled Uncontrolled
Sweatinga (lb/toncharged)(SCC# 3-04-004-04 and 3-04-004-05)
32-70 E 7-16b E
Reverberatory smelting(SCC# 3-04-004-02)
323(173-483)c
E 1.01(0.53-1.55)d
E 65(35-97)e
E 80(71-88)d
E
Blast (cupola)smeltingf
(SCC# 3-04-004-03)
307(184-413)g
E 2.24(0.22-4.88)h
E 104(64-140)i
E 0.29(0.03-0.64)j
E 53(18-110)c
E
Kettle refining(SCC# 3-04-004-99)
0.03k E 0.01k E
Kettle Oxidation(SCC# 3-04-004-08)
# 40l E
Casting(SCC# 3-04-004-09)
0.04k E 0.01k E
aReference 1. Estimated from sweating furnace emissions from nonlead secondary nonferrous processingindustries. Based on quantity of material charged to furnace.bReferences 3, 5. Based on assumption that uncontrolled reverberatory furnace flue emissions are 23% lead.cReferences 8-11.dReferences 6, 8-11.eReference 13. Uncontrolled reverberatory furnace flue emissions assumed to be 23% lead. Blast furnace emissionshave lead content of 34%, based on single uncontrolled plant test.fBlast furnace emissions are combined flue gases and associated ventilation hood streams (charging andtapping).gReferences 8, 11-12.hReferences 6, 8, 11-12, 14-15.iReference 13. Blast furnace emissions have lead content of 26%, based on single controlled plant test.jBased on quality of material charged to furnace.kReference 13. Lead content of kettle refining emissions is 40% and of casting emissions is 36%.lReferences 1-2. Essentially all product lead oxide is entrained in an air stream and subsequently recovered bybaghouse with average collection efficiency >99%. Factor represents emissions of lead oxide that escape abaghouse used to collect the lead oxide product. Represents approximate upper limit for emissions.
11
TABLE 2.3-2 (METRIC UNITS)FUGITIVE EMISSION FACTORS FOR SECONDARY LEAD PROCESSINGa
All Emission Factors are in kg/Mg of ProductRatings (A-E) Follow Each Factor
Operation Particulate Lead
Sweating(SCC# 3-04-004-12)
0.8-1.8b E 0.2-0.9c E
Smelting(SCC# 3-04-004-13)
4.35-12.1 E 0.1-0.3d D
Kettle refining(SCC# 3-04-004-14)
0.001 E 0.0003e E
Casting(SCC# 3-04-004-99)
0.001 E 0.0004e E
aReference 16. Based on amount of lead product, except for sweating, which is based on quantity ofmaterial charged to furnace. Fugitive emissions estimated to be 5 percent of uncontrolled stackemissions.bReference 1. Sweating furnace emissions estimated from nonlead secondary nonferrous processingindustries.cReferences 3, 5. Assumes 23 percent lead content of uncontrolled blast furnace flue emissions.dReference 24.eReference 13.
12
TABLE 2.3-2 (ENGLISH UNITS)FUGITIVE EMISSION FACTORS FOR SECONDARY LEAD PROCESSINGa
All Emission Factors are in lb/ton of ProductRatings (A-E) Follow Each Factor
Operation Particulate Lead
Sweating(SCC# 3-04-004-12)
1.6-3.5b E 0.4-1.8c E
Smelting(SCC# 3-04-004-13)
8.7-24.2 E 0.2-0.6d D
Kettle refining(SCC# 3-04-004-14)
0.002 E 0.0006e E
Casting(SCC# 3-04-004-99)
0.002 E 0.0007e E
aReference 16. Based on amount of lead product, except for sweating, which is based on quantity ofmaterial charged to furnace. Fugitive emissions estimated to be 5 percent of uncontrolled stackemissions.bReference 1. Sweating furnace emissions estimated from nonlead secondary nonferrous processingindustries.cReferences 3, 5. Assumes 23 percent lead content of uncontrolled blast furnace flue emissions.dReference 24.eReference 13.
13
the small particles emitted from reverberatory furnaces, baghouses are used more often than scrubbers for
particulate control.
Two chemical analyses by electron spectroscopy have shown the particulate to consist of 38 to 42
percent lead, 20 to 30 percent tin, and about 1 percent zinc.17 Particulate emissions from reverberatory
smelting furnaces are estimated to contain 20 percent lead.
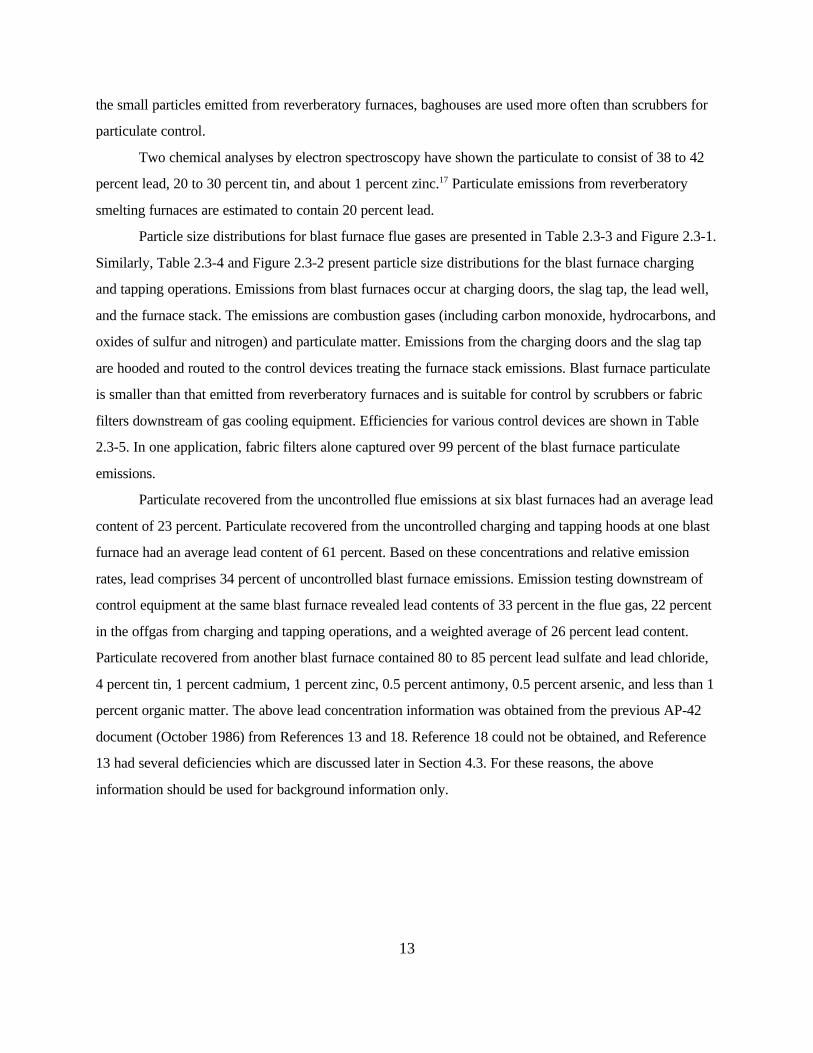
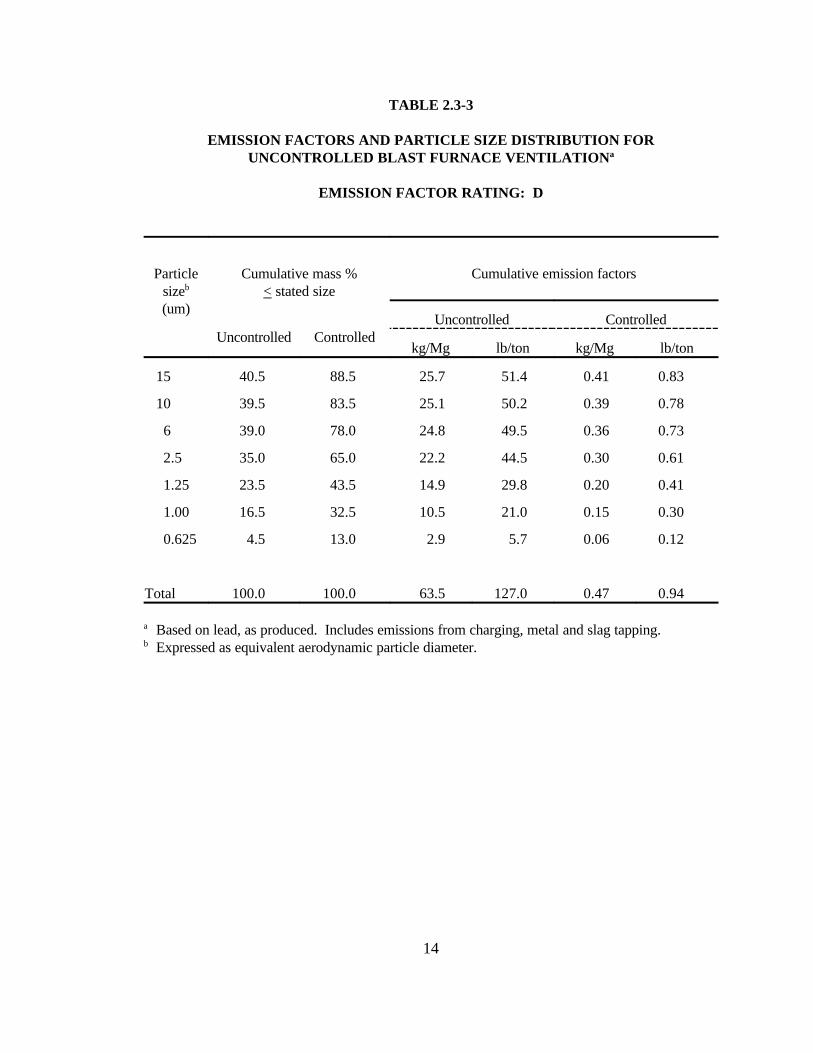
Particle size distributions for blast furnace flue gases are presented in Table 2.3-3 and Figure 2.3-1.
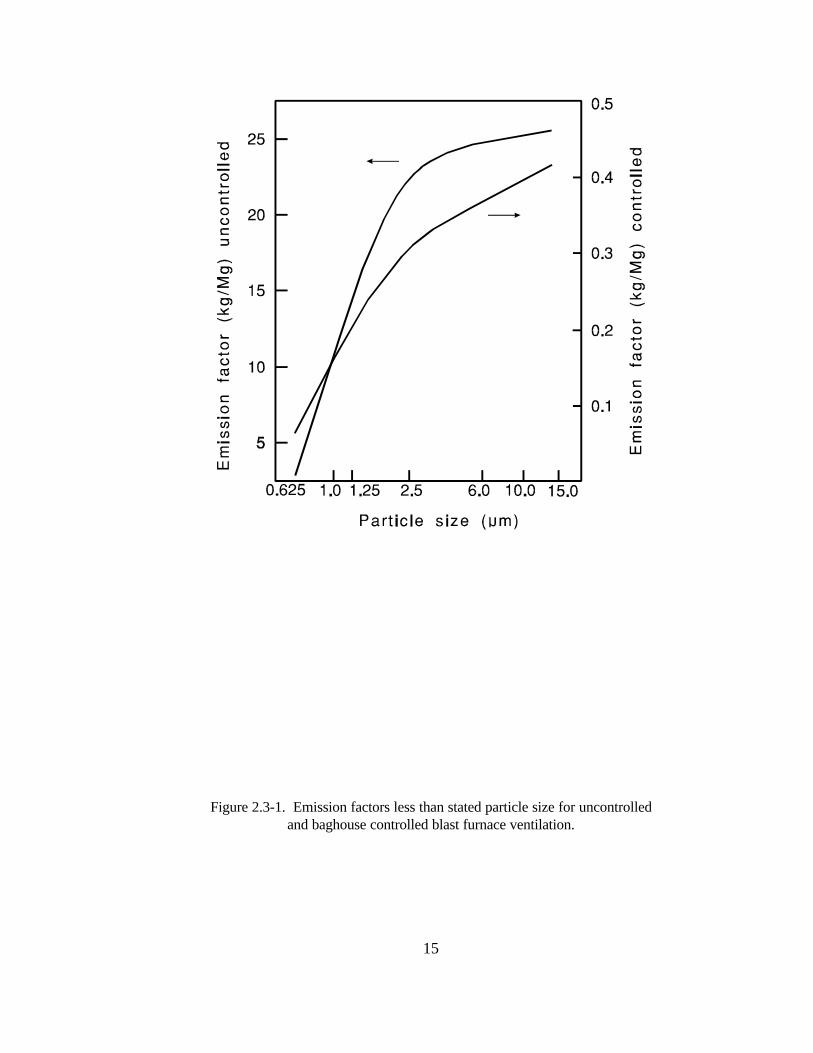
Similarly, Table 2.3-4 and Figure 2.3-2 present particle size distributions for the blast furnace charging
and tapping operations. Emissions from blast furnaces occur at charging doors, the slag tap, the lead well,
and the furnace stack. The emissions are combustion gases (including carbon monoxide, hydrocarbons, and
oxides of sulfur and nitrogen) and particulate matter. Emissions from the charging doors and the slag tap
are hooded and routed to the control devices treating the furnace stack emissions. Blast furnace particulate
is smaller than that emitted from reverberatory furnaces and is suitable for control by scrubbers or fabric
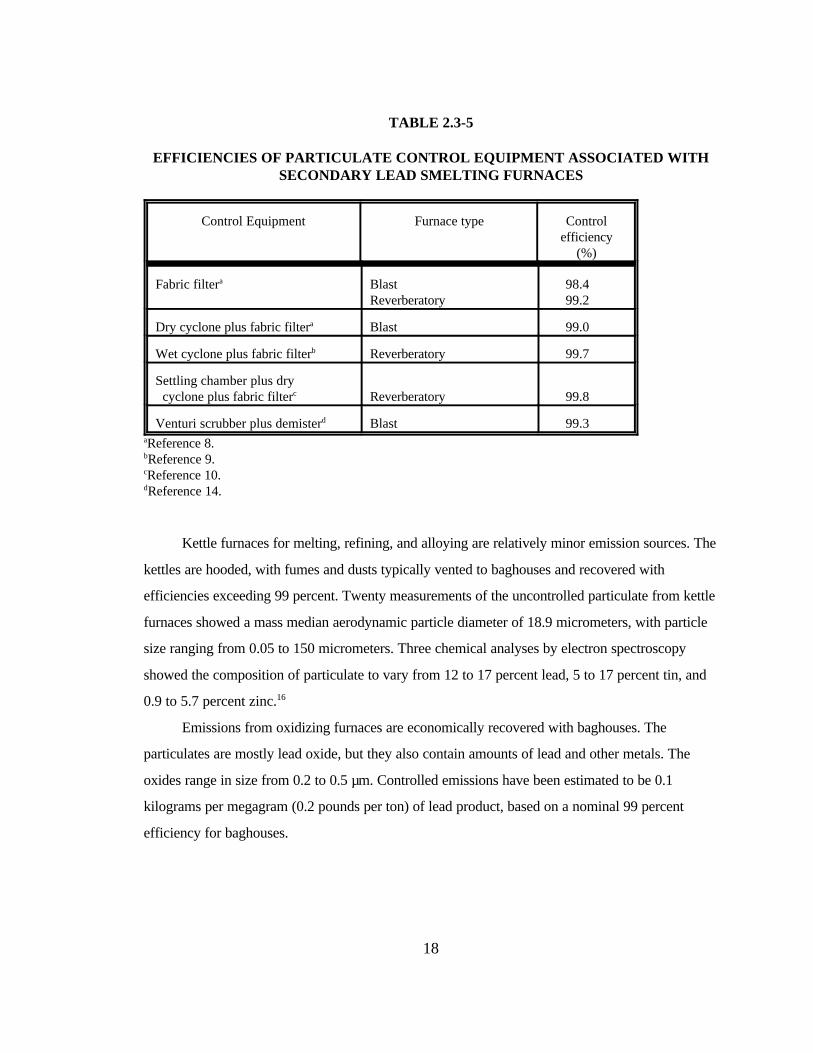
filters downstream of gas cooling equipment. Efficiencies for various control devices are shown in Table
2.3-5. In one application, fabric filters alone captured over 99 percent of the blast furnace particulate
emissions.
Particulate recovered from the uncontrolled flue emissions at six blast furnaces had an average lead
content of 23 percent. Particulate recovered from the uncontrolled charging and tapping hoods at one blast
furnace had an average lead content of 61 percent. Based on these concentrations and relative emission
rates, lead comprises 34 percent of uncontrolled blast furnace emissions. Emission testing downstream of
control equipment at the same blast furnace revealed lead contents of 33 percent in the flue gas, 22 percent
in the offgas from charging and tapping operations, and a weighted average of 26 percent lead content.
Particulate recovered from another blast furnace contained 80 to 85 percent lead sulfate and lead chloride,
4 percent tin, 1 percent cadmium, 1 percent zinc, 0.5 percent antimony, 0.5 percent arsenic, and less than 1
percent organic matter. The above lead concentration information was obtained from the previous AP-42
document (October 1986) from References 13 and 18. Reference 18 could not be obtained, and Reference
13 had several deficiencies which are discussed later in Section 4.3. For these reasons, the above
information should be used for background information only.
14
TABLE 2.3-3
EMISSION FACTORS AND PARTICLE SIZE DISTRIBUTION FORUNCONTROLLED BLAST FURNACE VENTILATIONa
EMISSION FACTOR RATING: D
Particlesizeb
(um)
Cumulative mass %< stated size
Cumulative emission factors
Uncontrolled ControlledUncontrolled Controlled
kg/Mg lb/ton kg/Mg lb/ton
15 40.5 88.5 25.7 51.4 0.41 0.83
10 39.5 83.5 25.1 50.2 0.39 0.78
6 39.0 78.0 24.8 49.5 0.36 0.73
2.5 35.0 65.0 22.2 44.5 0.30 0.61
1.25 23.5 43.5 14.9 29.8 0.20 0.41
1.00 16.5 32.5 10.5 21.0 0.15 0.30
0.625 4.5 13.0 2.9 5.7 0.06 0.12
Total 100.0 100.0 63.5 127.0 0.47 0.94
a Based on lead, as produced. Includes emissions from charging, metal and slag tapping.b Expressed as equivalent aerodynamic particle diameter.
15
Figure 2.3-1. Emission factors less than stated particle size for uncontrolledand baghouse controlled blast furnace ventilation.
16
TABLE 2.3-4
EMISSION FACTORS AND PARTICLE SIZE DISTRIBUTION FORBAGHOUSE CONTROLLED BLAST FURNACE FLUE GASESa
EMISSION FACTOR RATING: D
Particle sizeb
(um)Cumulative mass %
< stated sizeCumulative emission factors
UncontrolledUncontrolled
kg/Mg lb/ton
15 93.0 0.22 0.45
10 89.0 0.21 0.43
6 83.5 0.20 0.40
2.5 71.0 0.17 0.34
1.25 44.5 0.11 0.21
1.00 33.0 0.08 0.16
0.625 14.5 0.03 0.07
Total 100.0 0.24 0.48
a Units are for lead, as produced.b Expressed as equivalent aerodynamic particle diameter.
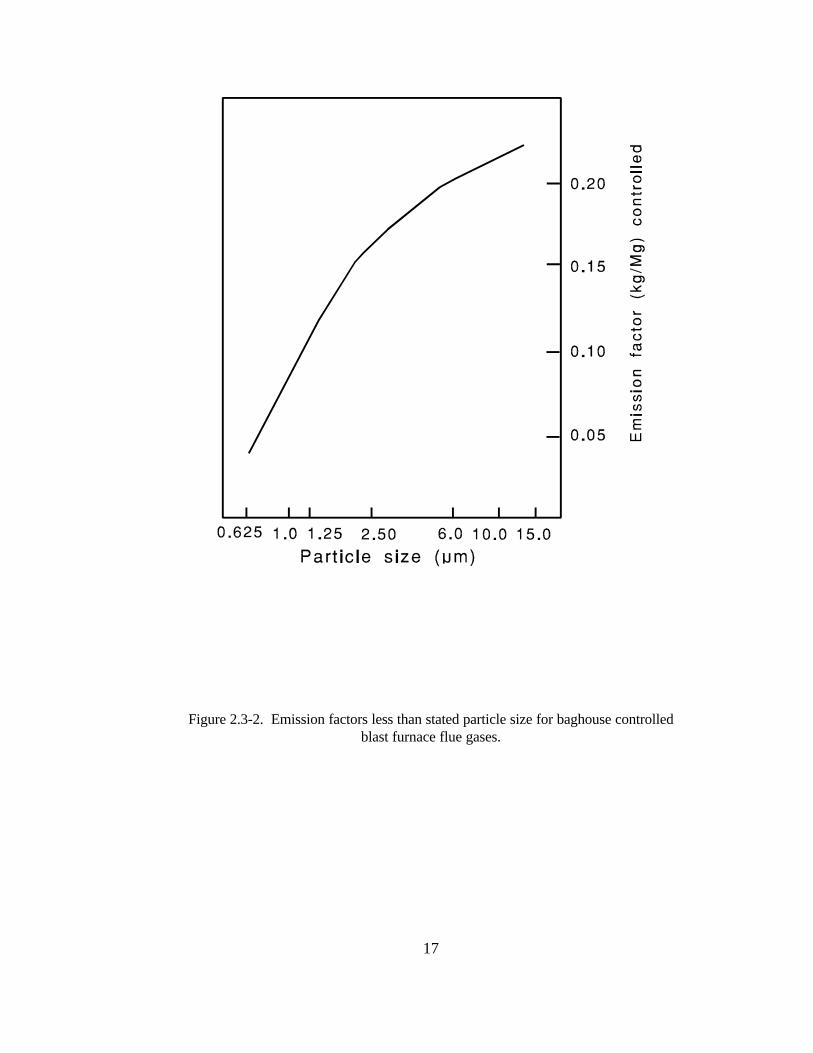
17
Figure 2.3-2. Emission factors less than stated particle size for baghouse controlledblast furnace flue gases.
18
TABLE 2.3-5
EFFICIENCIES OF PARTICULATE CONTROL EQUIPMENT ASSOCIATED WITHSECONDARY LEAD SMELTING FURNACES
Control Equipment Furnace type Controlefficiency
(%)
Fabric filtera BlastReverberatory
98.499.2
Dry cyclone plus fabric filtera Blast 99.0
Wet cyclone plus fabric filterb Reverberatory 99.7
Settling chamber plus dry cyclone plus fabric filterc Reverberatory 99.8
Venturi scrubber plus demisterd Blast 99.3aReference 8.bReference 9.cReference 10.dReference 14.
Kettle furnaces for melting, refining, and alloying are relatively minor emission sources. The
kettles are hooded, with fumes and dusts typically vented to baghouses and recovered with
efficiencies exceeding 99 percent. Twenty measurements of the uncontrolled particulate from kettle
furnaces showed a mass median aerodynamic particle diameter of 18.9 micrometers, with particle
size ranging from 0.05 to 150 micrometers. Three chemical analyses by electron spectroscopy
showed the composition of particulate to vary from 12 to 17 percent lead, 5 to 17 percent tin, and
0.9 to 5.7 percent zinc.16
Emissions from oxidizing furnaces are economically recovered with baghouses. The
particulates are mostly lead oxide, but they also contain amounts of lead and other metals. The
oxides range in size from 0.2 to 0.5 µm. Controlled emissions have been estimated to be 0.1
kilograms per megagram (0.2 pounds per ton) of lead product, based on a nominal 99 percent
efficiency for baghouses.
19
2.4 REVIEW OF SPECIFIC DATA SETS
Pacific Environmental Services (PES) contacted the following sources to obtain the
most up-to-date information on processes, emissions, and control techniques for this industry.
1) Alabama Department of Environmental Mangement, Air Division, Montgomery AL;
2) Association of Battery Recyclers, Washington, DC;
3) Dellate Metals, Ponchatoula, LA;
4) East Penn Manufacturing Co. Inc., Lyon Station, PA;
5) Exide Corporation, Muncie, IN;
6) Federated Fry Metals, Altoona, PA;
7) Florida Department of Environmental Regulation, Tallahassee, FL;
8) Georgia Department of Natural Resources, Atlanta, GA;
9) Indiana Air Pollution Control Bureau, Indianapolis, IN;
10) Jefferson County Department of Health, Birmingham, AL;
11) Kansas Department of Health and Environment, Topeka, KS;
12) Master Metals, Inc., Cleveland, OH;
13) Michigan Department of Natural Resources, Lansing, MI;
14) Missouri Department of Natural Resources, Jefferson City, MO;
15) Pennsylvania Department of Environmental Resources, Harrisburg, PA;
16) RSR Corporation, Dallas, TX;
17) Sanders Lead Company, Inc., Troy, AL;
18) Schuylkill Metals Corporation, Forest City, MO;
19) Shelby County Air Pollution Control Bureau, Shelby County, TN; and
20) U.S. Department of the Interior, Bureau of Mines, Washington, DC.
Responses were received from eight sources, contacts 2, 4, 9, 10, 12, 18, 19, and 20. The
data received from contact 2, Association of Battery Recyclers (Reference 24), consisted of a
source test conducted to quantify fugitive blast furnace emissions from smelting operations. PES
modified the previous AP-42 fugitive emission factors to reflect the results of this test. General
process information and a description of control devices employed were received from contact 4,
East Penn Manufacturing, Inc. (Reference 25). A process emission list without any primary
sources (i.e., source tests) was also included in the information received from contact 4. PES was
20
unable to use the emission data included; however, general process information was included in the
section revision. Three source tests were received from contact 9, Indiana Air Pollution Control
Bureau (References 30, 31, and 32); one source test was received from contact 10, Jefferson
County Department of Health (Reference 29); one source test from contact 12, Master Metals
(Reference 28); and one source test from contact 18, Schuylkill Metals Corporation (Reference
27). All six tests were missing process information needed for emission factor development.
Therefore, PES was unable to use these sources in the emission factor revision. Information
received from contact 19, Shelby County Air Pollution Control Bureau (Reference 26), consisted
of a source test conducted on a blast furnace process baghouse. Information obtained from this
source test is discussed later in this section and in Section 4.3 of this background report. Finally, a
list of the current secondary smelters operating in the U.S. with production capacity of at least
6,000 tons/yr was received from contact 20, Bureau of Mines. References 20, 21, 22, 23, and 33
were obtained from a literature search conducted by PES pursuant to the update of AP-42 Section
12.11. References 1 through 19 were the cited references in the previous AP-42 section (October
1986). Only six references were found, and one of them was missing process information needed to
develop emission factors. As a result, the emission factors obtained from the previous AP-42
document were downrated (from a "C" rating to an "E" rating) and are presented unverified and
unchanged. The OAQPS emission factor rating system is discussed in Chapter 3 of this
background report.
A brief discussion of the references used in revising the AP-42 section is given below.
Reference 20
Detailed descriptions of each process in the secondary lead processing industry were given in
Reference 20, Control of Arsenic Emissions from the Secondary Lead Smelting Industry. PES has
incorporated this information when applicable, along with the identification of the control devices
used for each process, and their corresponding efficiencies when available.
Reference 21
Reference 21, Minerals Yearbook, included annual production capacity of refined lead and
lead alloys from secondary lead smelters. Amount of lead recovered from scrap processed in the
21
U.S. by kind of scrap and form of recovery were presented. Also, total number of plants, individual
production range, lead consumption levels, and U.S. lead pricing trends were discussed.
Reference 22
Reference 22, AIRS Facility Subsystem Source Classification Codes and Emission Factors,
was used to verify emission factors for the secondary lead processing industry, and to identify
process SCC codes. Two discrepancies were found for the presented emission factors. Both
discrepancies corresponded to lead smelting emission factors for both the reverberatory and blast
furnaces. This is discussed further in Section 3.1 of this background report, "Literature Search
And Screening."
Reference 23
Reference 23, Inspection and Operating and Maintenance Guidelines for Secondary Lead
Smelters Air Pollution Control, was used in updating the process description. Detailed process
flow operations were discussed, and equipment operating parameters were presented. Process
fugitive emission factors for particulate matter, lead, and sulfur dioxide were provided. The
emission data presented were in close agreement to the AP-42 emission factors.
Reference 24
Reference 24, Association of Battery Recyclers, included comments on the previous AP-42
section and a source test conducted by Lake Engineering to develop fugitive blast furnace
emissions. Test results reflected a significantly lower emission factor for lead than the lowest end
of the range previously cited in the AP-42 document (October 1986). PES reviewed the process
description comments and incorporated the information in the document revision when applicable.
Also, the blast furnace fugitive emission factor was modified to represent the source test result
obtained by Lake Engineering. This is discussed in Section 4.1 of this background report.
Reference 33
Reference 33 is a source test performed for General Motors on their lead reclaiming
operations. PES received this test from a separate project which is not linked to the AP-42
document revision. Emission data from this source could not be used in the section revision,

22
because the exhaust stack tested contained the effluent of multiple processes, and it was impossible
to estimate individual process emissions.
23
2.5 REFERENCES FOR CHAPTER 2
1. William M. Coltharp, et al., Multimedia Environmental Assessment of the SecondaryNonferrous Metal Industry (Draft), Contract No. 68-02-1319, Radian Corporation, Austin,TX, June 1976.
2. H. Nack, et al., Development of an Approach to Identification of Emerging Technology andDemonstration Opportunities, EPA-650/2-74-048, U.S. Environmental Protection Agency,Cincinnati, OH, May 1974.
3. J. M. Zoller, et al., A Method of Characterization and Quantification of Fugitive LeadEmissions from Secondary Lead Smelters, Ferroalloy Plants and Gray Iron Foundries(Revised), EPA-450/3-78-003 (Revised), U.S. Environmental Protection Agency, ResearchTriangle Park, NC, August 1978.
4. Air Pollution Engineering Manual, Second Edition, AP-40, U.S. Environmental ProtectionAgency, Research Triangle Park, NC, May 1973. Out of Print.
5. Control Techniques for Lead Air Emissions, EPA-450/2-77-012, U.S. EnvironmentalProtection Agency, Research Triangle Park, NC, January 1978.
6. Background Information for Proposed New Source Performance Standards, Volumes I andII: Secondary Lead Smelters and Refineries, APTD-1352a and b, U.S. EnvironmentalProtection Agency, Research Triangle Park, NC, June 1973.
7. J. W. Watson and K. J. Brooks, A Review of Standards of Performance for New StationarySource - Secondary Lead Smelters, Contract No. 68-02-2526, Mitre Corporation, McLean,VA, January 1979.
8. J. E. Williamson, et al., A Study of Five Source Tests on Emissions from Secondary LeadSmelters, County of Los Angeles Air Pollution Control District, Los Angeles, CA, February1972.
9. Emission Test No. 72-CI-8, Office of Air Quality Planning and Standards, U.S.Environmental Protection Agency, Research Triangle Park, NC, July 1972.
10. Emission Test No. 72-CI-7, Office of Air Quality Planning and Standards, U.S.Environmental Protection Agency, Research Triangle Park, NC, August 1972.
11. A. E. Vandergrift, et al., Particulate Pollutant Systems Study, Volume I: Mass Emissions,APTD-0743, U.S. Environmental Protection Agency, Research Triangle Park, NC, May1971.
12. Emission Test No. 71-CI-34, Office of Air Quality Planning and Standards, U.S.Environmental Protection Agency, Research Triangle Park, NC, July 1972.

24
13. Emission and Emission Controls at a Secondary Lead Smelter (Draft), Contract No. 68-03-2807, Radian Corporation, Durham, NC, January 1981.
14. Emission Test No. 71-CI-33, Office of Air Quality Planning and Standards, U.S.Environmental Protection Agency, Research Triangle Park, NC, August 1972.
15. Secondary Lead Plant Stack Emission Sampling at General Battery Corporation, Reading,Pennsylvania, Contract No. 68-02-0230, Battelle Institute, Columbus, OH, July 1972.
16. Technical Guidance for Control of Industrial Process Fugitive Particulate Emissions, EPA-450/3-77-010, U.S. Environmental Protection Agency, Research Triangle Park, NC, March1977.
17. E. I. Hartt, An Evaluation of Continuous Particulate Monitors at A Secondary LeadSmelter, M. S. Report No. O. R. -16, Environment Canada, Ottawa, Canada. Dateunknown.
18. J. E. Howes, et al., Evaluation of Stationary Source Particulate Measurement Methods,Volume V: Secondary Lead Smelters, Contract No. 68-02-0609, Battelle Laboratories,Columbus, OH, January 1979.
19. Silver Valley/Bunker Hill Smelter Environmental Investigation (Interim Report), ContractNo. 68-02-1343, Pedco, Inc., Cincinnati, OH, February 1975.
20. Rives, G.D. and A.J. Miles, Control of Arsenic Emissions from the Secondary LeadSmelting Industry, Technical Document. Prepared under EPA contract No. 68-02-3816.Office of Air Quality Planning and Standards, U.S. Environmental Protection Agency,Research Triangle Park, NC, May 1985.
21. W.D. Woodbury, "Lead," Minerals Yearbook. United States Department of the Interior,Bureau of Mines, Washington, DC, 1989.
22. AIRS Facility Subsystem Source Classification Codes and Emission Factor Listing forCriteria Air Pollutants, EPA 450/4-90-003, U.S. Environmental Protection Agency,Research Triangle Park, NC, March 1990.
23. F. Hall, et al. Inspection and Operating and Maintenance Guidelines for Secondary LeadSmelter Air Pollution Control. Pedco-Environmental, Inc., Cincinnati, OH, 1984.
24. Quantification of Fugitive Lead Emissions from Smelter and Oxide Plant Sources for GNBInc., preformed by Lake Engineering, Inc., Atlanta, GA, April 1992.
25. Letter from R. A. Leiby, Jr. of East Penn Manufacturing Co., Inc., to B. Richani of PacificEnvironmental Services, Inc., RTP, NC, June 1992.
26. Report of Particulate/Lead/SO2 Emission Tests for Refined Metals Corporation, performedby Environmental Monitoring Laboratories, Ridgeland, MS, July 1991.
25
27. Source Test Report for Schuylkill Metals Corporation at Cannon Hollow Facility, ForestCity, MO, performed by Burnes & McDonnell Engineering Company, Kansas City, MO,November 1990.
28. Source Evaluation Results at Master Metals, Inc., prepared by Envisage Environmental,Inc., Richfield, OH, March 1991.
29. Particulate, Lead, & SO2 Emission Tests Conducted on the Refinery, Blast Furnace, andReverberatory Ventilation Systems in Leeds, AL, for Interstate Lead Company, Inc.,performed by Guardian Systems, Inc., Leeds, AL, June 1987.
30. Report on Compliance Testing, Performed for RSR Corporation, Dallas, TX, Conducted atQuemetco, Inc., Indianapolis, IN, performed by Clean Air Engineering, Palatine, IL, May1991.
31. Report of Particulate/Lead Emissions Test for Refined Metals Corporation Secondary LeadSmelter, Beech Grove, IN, performed by Environmental Monitoring Laboratories,Ridgeland, MS, June 1989.
32. Source Emission Survey of Quemetco Inc., Indianapolis, IN, performed by MetcoEnvironmental, Addison, TX, October 1988.
33. Stack Emissions from a Baghouse Serving Scrap Lead Reclaiming Operations at Delco-Remy Division, GM Corporation, New Brunswick, New Jersey, performed by RMCEnvironmental Services, Inc., Spring City, PA, March 1992.
26
3.0 GENERAL EMISSION DATA REVIEW AND ANALYSIS PROCEDURES
3.1 LITERATURE SEARCH AND SCREENING
The first step of this investigation involved a search of available literature relating to criteria
and noncriteria pollutant emissions associated with the secondary lead processing industry. This
search included the following references:
AP-42 background files maintained by the Emission Factor and Methodologies Section.
Some of the references used to develop the emission factors presented in the 1986 version were
missing. Therefore, PES could not redevelop the previous emission factors, and they are presented
unverified and unchanged except for the blast furnace fugitive emission factor which was
developed from a recent source test received from the Association of Battery Recyclers. See
Section 4.3 of this background report for a more detailed discussion.
"Locating and Estimating" reports published by the Emission Factor and Methodologies
Section. PES obtained one report, "Locating and Estimating Air Emissions From Sources of
Polycyclic Organic Matter (POM)" (EPA-450/4-84-007p). PES did not obtain any original
information from this source.
PM10 "gap filling" documents such as, "PM10 Emission Factor Listing Developed by
Technology Transfer" (EPA-450/4-89-022), "Gap Filling PM10 Emission Factors for Selected
Open Area Dust Sources" (EPA-450/88-003), and "Generalized Particle Size Distributions for Use
in Preparing Size Specific Particulate Emission Inventories" (EPA-450/4-86-013). PES found
applicable emission factors which were developed on assumptions and not source test results. The
accuracy of the assumed PM10 data is in doubt.
Information in the Air Facility Subsystems (AFS) of the EPA Aerometric Information
Retrieval System (AIRS). PES compared data in the AIRS to the AP-42 Section (October 1986).
Two discrepancies were found for the presented emission factors. Both discrepancies corresponded
to lead smelting emission factors for the reverberatory and blast furnaces. In both cases, the AIRS
emission factor was lower than the lowest end of the range cited in the previous AP-42 document.
Also, it was noticed that the emissions presented in the AIRS document were for uncontrolled
processes. Therefore, PES recommends that the blast and reverberatory furnaces emission factor in
AIRS document be corrected to coincide with the AP-42 section, and that the AIRS be updated to
represent both controlled and uncontrolled emission factors whenever possible. Also, note that the
27
emission factors presented for PM10 in the AIRS were obtained based on assumptions and not
source test results; therefore, PES recommends modifying AIRS to reflect the changes made to the
emission factors per this revision, and the PM10 emission factors for the industry be verified.
EPA databases including Clearinghouse for Inventories and Emission Factors (CHIEF),
the National Air Toxics Information Clearinghouse (NATICH), the VOC/Particulate Matter
(PM) Speciation Database Management System (SPECIATE), and the Crosswalk/Air Toxic
Emission Factor Data Base Management System (XATEF). PES did not obtain any origional
information from these sources for the secondary lead processing industry.
To reduce the amount of literature collected to a final group of references pertinent to this
report, the following general criteria were used:
1. Emissions data must be from a primary reference; i.e., the document must constitute
the original source of test data. For example, a technical paper was not included if the
original study was contained in the previous document.
2. The referenced study must contain test results based on more than one test run.
3. The report must contain sufficient data to evaluate the testing procedures and source
operating conditions (e.g., one-page reports were generally rejected).
If no primary data were found and the previous update utilized secondary data, these
secondary data were still used and the Emission Factor Rating lowered, if needed. A final set of
reference materials was compiled after a thorough review of the pertinent reports, documents, and
information according to these criteria. The final set of reference materials is given in Chapter 4 of
this background report.
3.2 EMISSION DATA QUALITY RATING SYSTEM
As part of Pacific Environmental Services' analysis of the emission data, the quantity and
quality of the information contained in the final set of reference documents were evaluated. The
following data were always excluded from consideration.
1. Test series averages reported in units that cannot be converted to the selected reporting
units;
2. Test series representing incompatible test methods (e.g., comparison of the EPA
Method 5 front-half with the EPA Method 5 front- and back-half);
28
3. Test series of controlled emissions for which the control device is not specified;
4. Test series in which the source process is not clearly identified and described; and
5. Test series in which it is not clear whether the emissions were measured before or after
the control device.
Data sets that were not excluded were assigned a quality rating. The rating system used was
that specified by the OAQPS for the preparation of AP-42 sections. The data were rated as
follows:
A
Multiple tests performed on the same source using sound methodology and reported in
enough detail for adequate validation. These tests do not necessarily conform to the
methodology specified in the EPA reference test methods, although these methods were
certainly used as a guide for the methodology actually used.
B
Tests that were performed by a generally sound methodology but lack enough detail for
adequate validation.
C
Tests that were based on an untested or new methodology or that lacked a significant
amount of background data.
D
Tests that were based on a generally unacceptable method but may provide an order-of-
magnitude value for the source.
The following criteria were used to evaluate source test reports for sound methodology and
adequate detail:
1. Source operation. The manner in which the source was operated is well documented In
the report. The source was operating within typical parameters during the test.
2. Sampling procedures. The sampling procedures conformed to a generally acceptable
methodology. If actual procedures deviated from accepted methods, the deviations are
well documented. When this occurred, an evaluation was made of the extent such
alternative procedures could influence the test results.
29
3. Sampling and process data. Adequate sampling and process data are documented in the
report. Many variations can occur unnoticed and without warning during testing. Such
variations can induce wide deviations in sampling results. If a large spread between test
results cannot be explained by information contained in the test report, the data are
suspect and were given a lower rating.
4. Analysis and calculations. The test reports contain original raw data sheets. The
nomenclature and equations used were compared to those (if any) specified by the EPA
to establish equivalency. The depth of review of the calculations was dictated by the
reviewer's confidence in the ability and conscientiousness of the tester, which in turn
was based on factors such as consistency of results and completeness of other areas of
the test report.
3.3 EMISSION FACTOR QUALITY RATING SYSTEM
The quality of the emission factors developed from analysis of the test data was rated
utilizing the following general criteria:
A (Excellent)
Developed only from A-rated test data taken from many randomly chosen facilities in the
industry population. The source category is specific enough so that variability within the
source category population may be minimized.
B (Above average)
Developed only from A-rated test data from a reasonable number of facilities. Although no
specific bias is evident, it is not clear if the facilities tested represent a random sample of the
industries. As in the A-rating, the source category is specific enough so that variability
within the source category population may be minimized.
C (Average)
Developed only from A- and B-rated test data from a reasonable number of facilities.
Although no specific bias is evident, it is not clear if the facilities tested represent a random
sample of the industry. As in the A-rating, the source category is specific enough so that
variability within the source category population may be minimized.
30
D (Below average)
The emission factor was developed only from A- and B-rated test data from a small number
of facilities, and there is reason to suspect that these facilities do not represent a random
sample of the industry. There also may be evidence of variability within the source category
population. Limitations on the use of the emission factor are noted in the emission factor
table.
E (Poor)
The emission factor was developed from C- and D-rated test data, and there is reason to
suspect that the facilities tested do not represent a random sample of the industry. There also
may be evidence of variability within the source category population. Limitations on the use
of these factors are always noted.
The use of these criteria is somewhat subjective and depends to an extent on the individual
reviewer.
31
3.4 REFERENCES FOR CHAPTER 3
1. Technical Procedures for Developing AP-42 Emission Factors and Preparing AP-42Sections. U.S. Environmental Protection Agency, Emissions Inventory Branch, Office ofAir Quality Planning and Standards, Research Triangle Park, NC, 27711, April 1992.[Note: this document is currently being revised at the time of this printing.]
2. AP-42, Supplement A, Appendix C.2, "Generalized Particle Size Distributions." U.S.Environmental Protection Agency, Research Triangle Park, NC, October 1986.
3. AIRS Facility Subsystem Source Classification Codes and Emission Factor Listing forCriteria Air Pollutants, EPA 450/4-90-003, U.S. Environmental Protection Agency,Research Triangle Park, NC, March 1990.
32
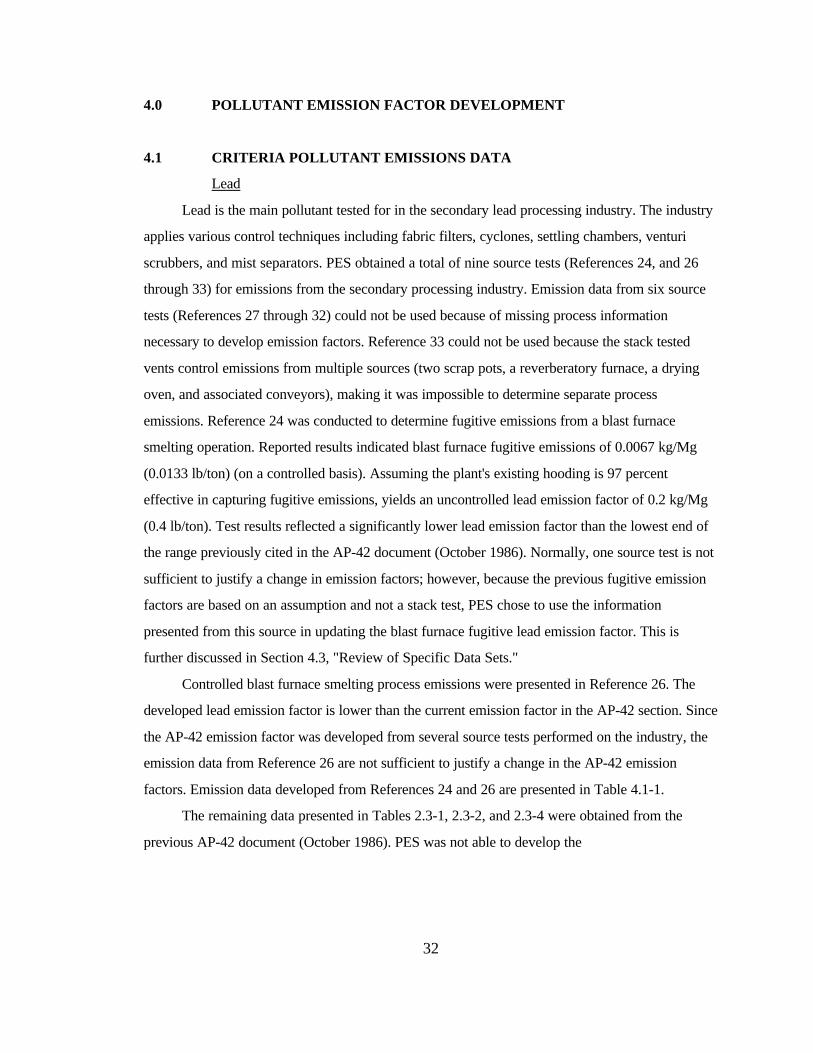
4.0 POLLUTANT EMISSION FACTOR DEVELOPMENT
4.1 CRITERIA POLLUTANT EMISSIONS DATA
Lead
Lead is the main pollutant tested for in the secondary lead processing industry. The industry
applies various control techniques including fabric filters, cyclones, settling chambers, venturi
scrubbers, and mist separators. PES obtained a total of nine source tests (References 24, and 26
through 33) for emissions from the secondary processing industry. Emission data from six source
tests (References 27 through 32) could not be used because of missing process information
necessary to develop emission factors. Reference 33 could not be used because the stack tested
vents control emissions from multiple sources (two scrap pots, a reverberatory furnace, a drying
oven, and associated conveyors), making it was impossible to determine separate process
emissions. Reference 24 was conducted to determine fugitive emissions from a blast furnace
smelting operation. Reported results indicated blast furnace fugitive emissions of 0.0067 kg/Mg
(0.0133 lb/ton) (on a controlled basis). Assuming the plant's existing hooding is 97 percent
effective in capturing fugitive emissions, yields an uncontrolled lead emission factor of 0.2 kg/Mg
(0.4 lb/ton). Test results reflected a significantly lower lead emission factor than the lowest end of
the range previously cited in the AP-42 document (October 1986). Normally, one source test is not
sufficient to justify a change in emission factors; however, because the previous fugitive emission
factors are based on an assumption and not a stack test, PES chose to use the information
presented from this source in updating the blast furnace fugitive lead emission factor. This is
further discussed in Section 4.3, "Review of Specific Data Sets."
Controlled blast furnace smelting process emissions were presented in Reference 26. The
developed lead emission factor is lower than the current emission factor in the AP-42 section. Since
the AP-42 emission factor was developed from several source tests performed on the industry, the
emission data from Reference 26 are not sufficient to justify a change in the AP-42 emission
factors. Emission data developed from References 24 and 26 are presented in Table 4.1-1.
The remaining data presented in Tables 2.3-1, 2.3-2, and 2.3-4 were obtained from the
previous AP-42 document (October 1986). PES was not able to develop the

33
TABLE 4.1-1 (METRIC UNITS)LEAD
SourceTest #
TestRating
TestMethod
Run#
ProductionRatea
EmissionRateb
EmissionFactorc
Control device: Sanitary Hooding (97 % effective)
124BlastFurnaceFugitive
A * 1 2,721 0.023 0.0084
2 2,721 0.010 0.0037
Average
2,721 0.017 0.0061
Control device: None
124BlastFurnaceFugitive
A * 1 2,721 0.767 0.282
2 2,721 0.333 0.122
Average
2,721 0.550 0.202
Control device: Baghouse
226BlastFurnace
A 12 1 4,637 0.059 0.013
2 4,637 0.041 0.0090
3 4,637 0.027 0.0058
Average
4,637 0.042 0.0093
aUnits in kg/hr bUnits in kg/hr cUnits in kg/Mg *See Section 4.3
34
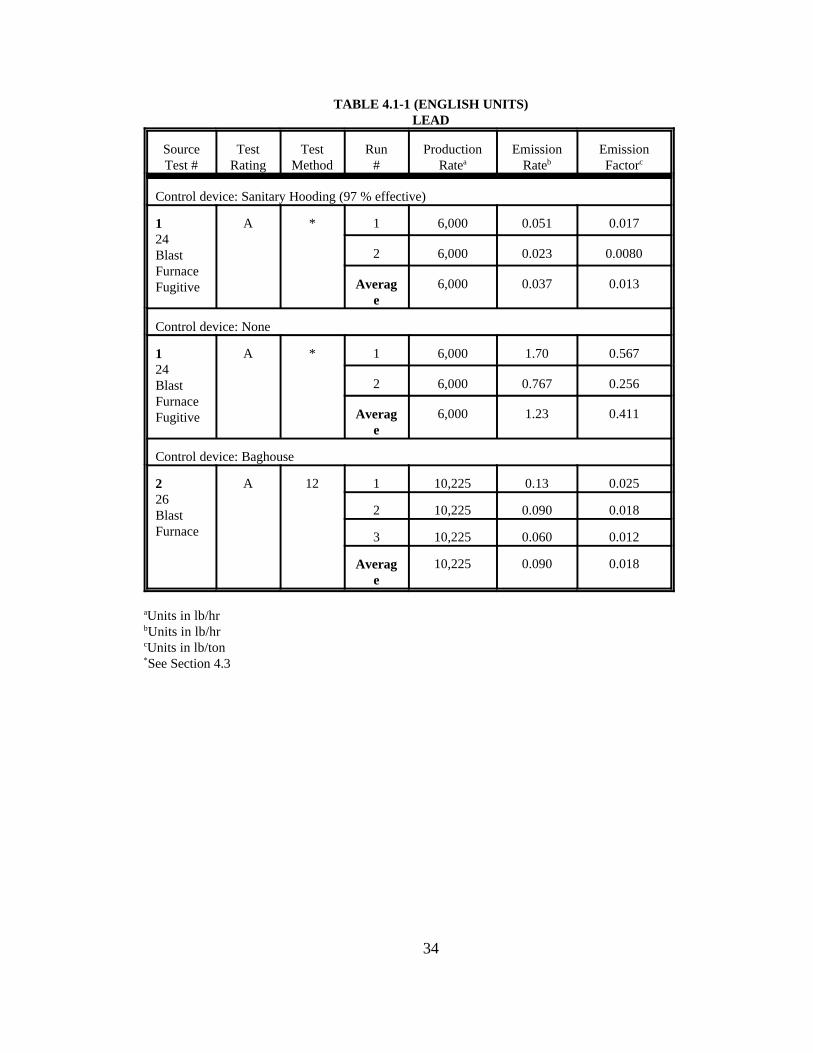
TABLE 4.1-1 (ENGLISH UNITS)LEAD
SourceTest #
TestRating
TestMethod
Run#
ProductionRatea
EmissionRateb
EmissionFactorc
Control device: Sanitary Hooding (97 % effective)
124BlastFurnaceFugitive
A * 1 6,000 0.051 0.017
2 6,000 0.023 0.0080
Average
6,000 0.037 0.013
Control device: None
124BlastFurnaceFugitive
A * 1 6,000 1.70 0.567
2 6,000 0.767 0.256
Average
6,000 1.23 0.411
Control device: Baghouse
226BlastFurnace
A 12 1 10,225 0.13 0.025
2 10,225 0.090 0.018
3 10,225 0.060 0.012
Average
10,225 0.090 0.018
aUnits in lb/hrbUnits in lb/hrcUnits in lb/ton*See Section 4.3
35
presented emission factors in these tables because some of the references could not be obtained,
and some were missing necessary information for emission factor development
such as production data (Reference 13). Only References 8, 9, 10, 13, and 15 were obtained from
the previous AP-42 section.
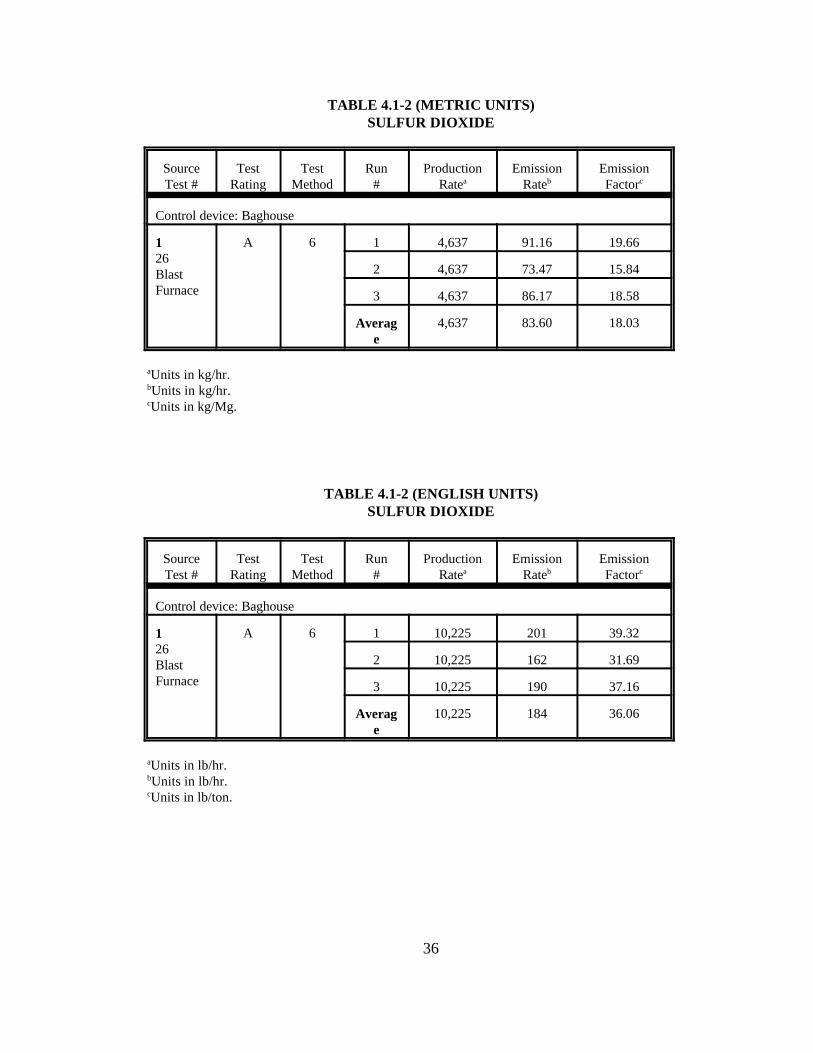
Sulfur dioxide.
Not enough information was received from the sources that PES contacted to justify a
change in the sulfur dioxide emission factors for this industry. Necessary information needed to
develop SO2 process emission factors were included in Reference 26 only. Reference 26
corresponded to the controlled blast furnace smelting operation, and the developed SO2 emission
factors are presented in Table 4.1-2.
As discussed earlier in the lead emission section, the current AP-42 SO2 emission factors
could not be verified because of missing references. Note that the emission factors presented in the
AP-42 section correspond to uncontrolled processes. Currently, all of the secondary lead facilities
are required to meet stringent SO2 levels set by the U.S. Environmental Protection Agency.
Therefore, it is expected that all secondary lead facilities employ control devices to limit SO2
emissions, and that the SO2 emission factors presented in the AP-42 section are not representative
of the current industry emission levels.
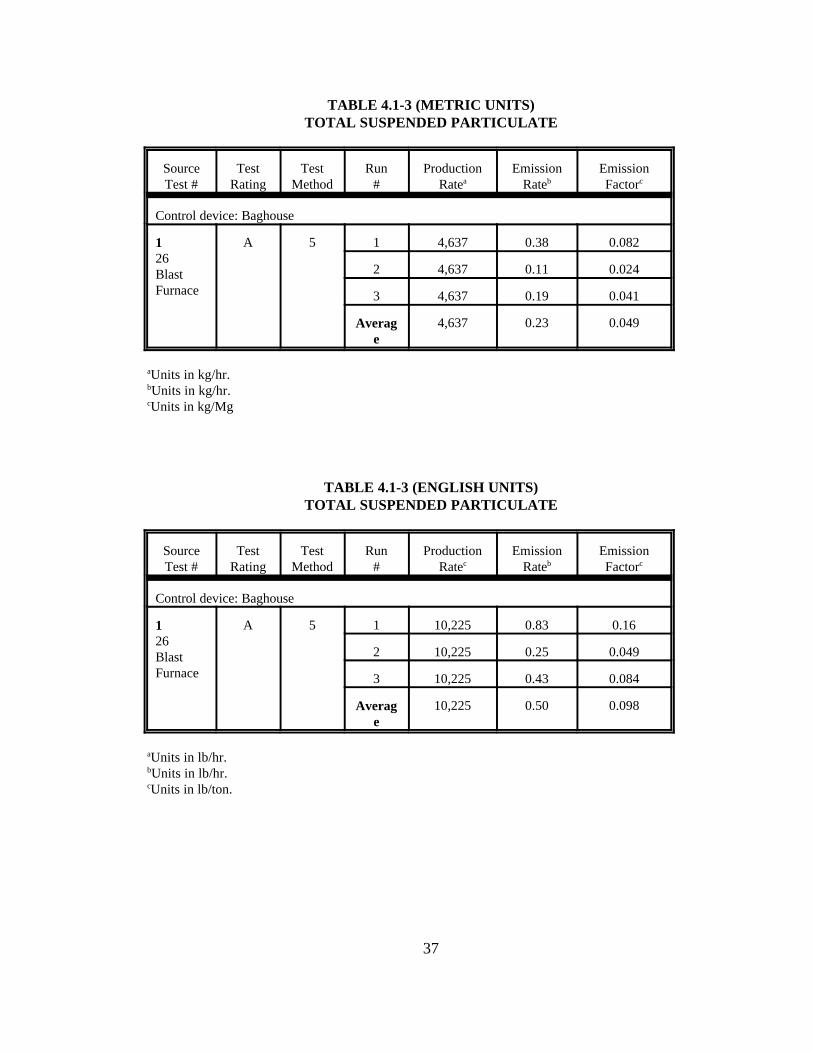
Particulate Matter
Particulate emission factors were developed from Reference 26 only. The blast furnace
controlled particulate emission factor was determined to be lower than the current emission factor
in the AP-42 section. As discussed earlier in the lead section, emission data from one source test is
not sufficient to justify a change in the AP-42 emission data. The data obtained from Reference 26
are presented in Table 4.1-3.
Again, the current AP-42 emission factors for the secondary lead processing industry were
obtained from the previous AP-42 section (October 1986), and are presented unverified and
unchanged for reasons discussed earlier in this chapter.
36
TABLE 4.1-2 (METRIC UNITS)SULFUR DIOXIDE
SourceTest #
TestRating
TestMethod
Run#
ProductionRatea
EmissionRateb
EmissionFactorc
Control device: Baghouse
126BlastFurnace
A 6 1 4,637 91.16 19.66
2 4,637 73.47 15.84
3 4,637 86.17 18.58
Average
4,637 83.60 18.03
aUnits in kg/hr. bUnits in kg/hr. cUnits in kg/Mg.
TABLE 4.1-2 (ENGLISH UNITS)SULFUR DIOXIDE
SourceTest #
TestRating
TestMethod
Run#
ProductionRatea
EmissionRateb
EmissionFactorc
Control device: Baghouse
126BlastFurnace
A 6 1 10,225 201 39.32
2 10,225 162 31.69
3 10,225 190 37.16
Average
10,225 184 36.06
aUnits in lb/hr. bUnits in lb/hr. cUnits in lb/ton.
37
TABLE 4.1-3 (METRIC UNITS)TOTAL SUSPENDED PARTICULATE
SourceTest #
TestRating
TestMethod
Run#
ProductionRatea
EmissionRateb
EmissionFactorc
Control device: Baghouse
126BlastFurnace
A 5 1 4,637 0.38 0.082
2 4,637 0.11 0.024
3 4,637 0.19 0.041
Average
4,637 0.23 0.049
aUnits in kg/hr. bUnits in kg/hr. cUnits in kg/Mg
TABLE 4.1-3 (ENGLISH UNITS)TOTAL SUSPENDED PARTICULATE
SourceTest #
TestRating
TestMethod
Run#
ProductionRatec
EmissionRateb
EmissionFactorc
Control device: Baghouse
126BlastFurnace
A 5 1 10,225 0.83 0.16
2 10,225 0.25 0.049
3 10,225 0.43 0.084
Average
10,225 0.50 0.098
aUnits in lb/hr. bUnits in lb/hr. cUnits in lb/ton.
38
Other Criteria Pollutants
No data on emissions of nitrogen oxides, carbon monoxide, or non-methane organic
compounds, all of which are criteria pollutants, were found for the secondary lead processing
industry.
4.2 NONCRITERIA POLLUTANT EMISSION DATA
Hazardous Air Pollutants.
Hazardous Air Pollutants (HAPs) are defined in the 1990 Clean Air Act Amendments. Lead
compounds are identified as HAPs. Lead emissions were previously discussed in Section 4.1.
Chlorofluorocarbons have been found to contribute to stratospheric ozone depletion. No data
on emissions of these pollutants were found for the secondary lead processing industry.
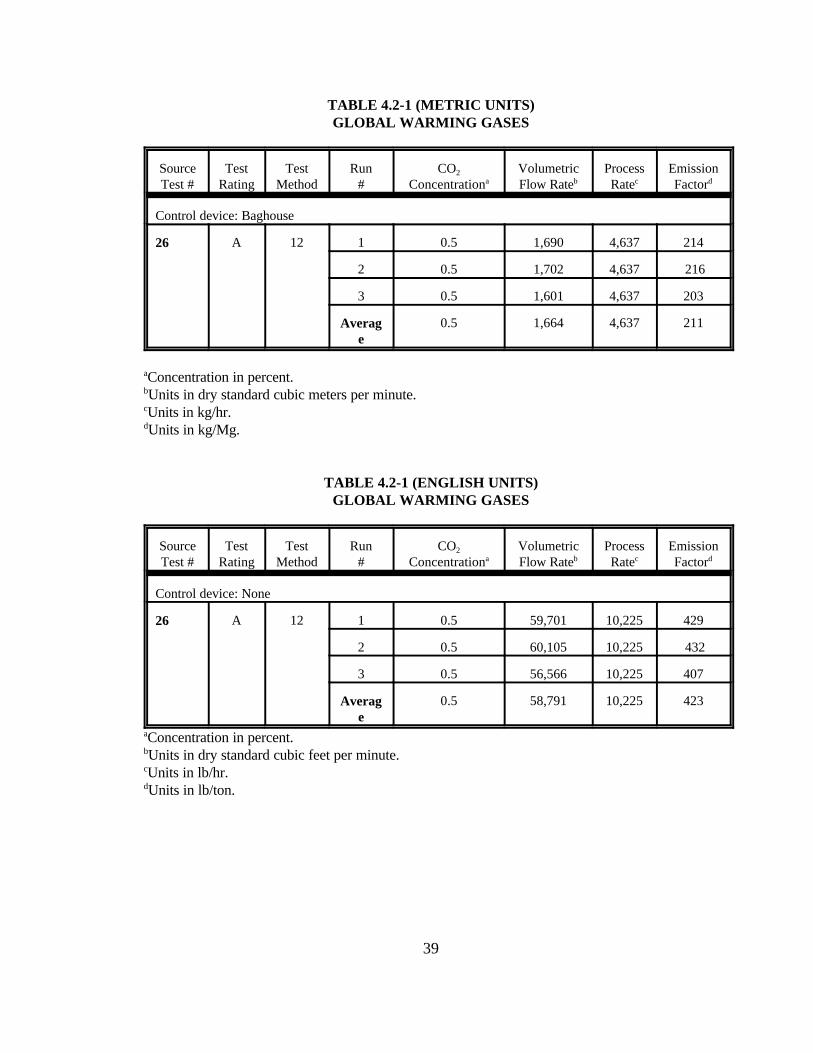
Global Warming Gases.
Pollutants such as methane (CH4), carbon dioxide (CO2), and nitrous oxide (N2O) have been
found to contribute to overall global warming. Carbon dioxide emissions were documented in
Reference 26 for the blast furnace outlet. The reaction of blast air (sometimes oxygen-enriched)
with coke in the charge produces CO2, and the reaction of carbon and carbon monoxide with lead
sulfates, oxides, and carbonates in the furnace tuyeres forms CO2.
For source testing purposes, the concentration of CO2 in the stack gas being tested is
measured in order to approximate the molecular weight of the stack gas. The CO2 concentration
measurement is performed in such a way that its level of accuracy is less than that of the primary
pollutants of interest. It is for this reason that the concentration for CO2 is usually undocumented
as shown in this industry. The emission rate of a gas such as carbon dioxide can readily be
calculated, given the volumetric rate of the stack gas at standard conditions and the concentration
of carbon dioxide in the stack gas, and using ideal gas laws. The carbon dioxide emission data
obtained from Reference 26 are summarized in Table 4.2-1.
39
TABLE 4.2-1 (METRIC UNITS)GLOBAL WARMING GASES
SourceTest #
TestRating
TestMethod
Run#
CO2
ConcentrationaVolumetricFlow Rateb
ProcessRatec
EmissionFactord
Control device: Baghouse
26 A 12 1 0.5 1,690 4,637 214
2 0.5 1,702 4,637 216
3 0.5 1,601 4,637 203
Average
0.5 1,664 4,637 211
aConcentration in percent.bUnits in dry standard cubic meters per minute.cUnits in kg/hr.dUnits in kg/Mg.
TABLE 4.2-1 (ENGLISH UNITS)GLOBAL WARMING GASES
SourceTest #
TestRating
TestMethod
Run#
CO2
ConcentrationaVolumetricFlow Rateb
ProcessRatec
EmissionFactord
Control device: None
26 A 12 1 0.5 59,701 10,225 429
2 0.5 60,105 10,225 432
3 0.5 56,566 10,225 407
Average
0.5 58,791 10,225 423
aConcentration in percent.bUnits in dry standard cubic feet per minute.cUnits in lb/hr.dUnits in lb/ton.
40
4.3 REVIEW OF SPECIFIC DATA SETS
A total of nine source tests were received for the secondary lead processing industry. Only
two of these sources contained all necessary information for developing emission factors. These
sources are References 24 and 26, which correspond to blast furnace fugitive and process
emissions, respectively. The data obtained from Reference 24 were used in updating the AP-42
emission factors, while the results of Reference 26 were insufficient to justify a change in the AP-
42 emission factors. This was discussed earlier in Section 4.1. Therefore, the current AP-42
emission factors were obtained from the previous AP-42 document (October 1986) except for the
fugitive blast furnace lead emissions.
PES could not verify the current AP-42 emission factors, because of missing sources used in
developing these emission factors. Only References 8, 9, 10, 13, and 15 were obtained. Validation
of these references showed that Reference 13 has several deficiencies which would make it
unacceptable for emission factor development. These deficiencies are discussed below. No other
deficiencies were found in any of the reviewed sources.
The following section provides a more detailed discussion of the source tests used in
developing and verifying the current AP-42 emission factors.
Reference 13: A Domestic Lead Smelter, January, 1981
Reference 13 is a source test report that presents results of an interagency control
technology demonstration and research study conducted at a domestic secondary lead smelter. In
the previous AP-42 document (October 1986) several emission factors were referenced to
Reference 13. Test results included lead emission rates, and did not document any production
information. Therefore, emission factors from this reference could not be developed. This report
contained other deficiencies: the test report stated that Method 12 and modified Method 12 were
the sampling procedures utilized without presenting any documentation or explanation of these
methods; no documentation of sampling Methods 1 through 4 were found; and the test stated that
all the runs were sampled isokinetically, but did not include any data to verify this. Emission
factors obtained from this reference were downgraded to "E".
41
Reference 24: GNB, Inc., Columbus, GA, April 1992
This test was conducted by Lake Engineering, Inc. to quantify the blast furnace fugitive
emissions. The area tested included two conventional blast furnaces, and the plant existing sanitary
hooding was assumed to be 97 percent effective in capturing fugitive emissions. The lead fugitive
emission factor (controlled) was determined to be 0.0133 lb/ton, which yields an uncontrolled
emission factor of 0.4 lb/ton. This is significantly lower than the lowest end of the range previously
cited in the AP-42 document. The lead emission factor was developed according to the following
concept:
Lead Emission Factor = Indoor Air Concentration of lead x Exhaust Air Flow Rate,
where the air velocity was measured using a hand-held velometer. The concept and procedures
were approved by the Georgia Environmental Protection Division, and the test included a detailed
description of the suggested method and included all necessary data needed to quantify emission
factors. The test is rated "A"; however, since this is the only source test available for this emission
source, the developed emission factor is rated "D".
Reference 26: Refined Metals Corporation, Memphis, TN, July 1991
This test was conducted to quantify particulate, lead, and sulfur dioxide emissions from a
blast furnace baghouse. The baghouse was tested twice, once under normal operation and another
during an accelerated mode. For the purpose of this report, only the normal mode data were used.
The test was conducted using EPA Methods 1 through 4. Sulfur dioxide concentrations were
determined according to Method 6, while particulate and lead emissions were determined according
to Methods 5 and 12, respectively. Carbon dioxide (CO2) concentrations in the flue gases,
calibration, and field data were documented. The test was performed by Environmental Monitoring
Laboratories, and the emission factors developed from this reference are rated "A".
4.4 DATA GAP ANALYSIS
The secondary lead processing industry consists of several processes. PES received only two
source tests that contained sufficient information for emission factor development. Data from these
source tests reflected considerably lower emission factors than those previously documented in the
AP-42 section, especially for fugitive emissions. Recall that the current fugitive emissions were

42
determined based on the assumption that 5 percent of process uncontrolled emissions exists as
fugitive emissions. Also, note that new regulations are currently in effect for SO2 emissions;
therefore, PES suspects that the current emission factors presented in the AP-42 section are not an
accurate representation of the industry emissions. In conclusion, more source tests for all processes
and better estimation for fugitive emissions (or source tests as in Reference 24) are needed for the
secondary lead processing industry.

43
4.5 REFERENCES FOR CHAPTER 4
1. William M. Coltharp, et al., Multimedia Environmental Assessment of the SecondaryNonferrous Metal Industry (Draft), Contract No. 68-02-1319, Radian Corporation, Austin,TX, June 1976.
2. H. Nack, et al., Development of an Approach to Identification of Emerging Technology andDemonstration Opportunities, EPA-650/2-74-048, U.S. Environmental Protection Agency,Cincinnati, OH, May 1974.
3. J. M. Zoller, et al., A Method of Characterization and Quantification of Fugitive LeadEmissions from Secondary Lead Smelters, Ferroalloy Plants and Gray Iron Foundries(Revised), EPA-450/3-78-003 (Revised), U.S. Environmental Protection Agency, ResearchTriangle Park, NC, August 1978.
4. Air Pollution Engineering Manual, Second Edition, AP-40, U.S. Environmental ProtectionAgency, Research Triangle Park, NC, May 1973. Out of Print.
5. Control Techniques for Lead Air Emissions, EPA-450/2-77-012, U.S. EnvironmentalProtection Agency, Research Triangle Park, NC, January 1978.
6. Background Information for Proposed New Source Performance Standards, Volumes I andII: Secondary Lead Smelters and Refineries, APTD-1352a and b, U.S. EnvironmentalProtection Agency, Research Triangle Park, NC, June 1973.
7. J. W. Watson and K. J. Brooks, A Review of Standards of Performance for New StationarySource - Secondary Lead Smelters, Contract No. 68-02-2526, Mitre Corporation, McLean,VA, January 1979.
8. J. E. Williamson, et al., A Study of Five Source Tests on Emissions from Secondary LeadSmelters, County of Los Angeles Air Pollution Control District, Los Angeles, CA, February1972.
9. Emission Test No. 72-CI-8, Office of Air Quality Planning and Standards, U.S.Environmental Protection Agency, Research Triangle Park, NC, July 1972.
10. Emission Test No. 72-CI-7, Office of Air Quality Planning and Standards, U.S.Environmental Protection Agency, Research Triangle Park, NC, August 1972.
11. A. E. Vandergrift, et al., Particulate Pollutant Systems Study, Volume I: Mass Emissions,APTD-0743, U.S. Environmental Protection Agency, Research Triangle Park, NC, May1971.
12. Emission Test No. 71-CI-34, Office of Air Quality Planning and Standards, U.S.Environmental Protection Agency, Research Triangle Park, NC, July 1972.
44
13. Emission and Emission Controls at a Secondary Lead Smelter (Draft), Contract No. 68-03-2807, Radian Corporation, Durham, NC, January 1981.
14. Emission Test No. 71-CI-33, Office of Air Quality Planning and Standards, U.S.Environmental Protection Agency, Research Triangle Park, NC, August 1972.
15. Secondary Lead Plant Stack Emission Sampling at General Battery Corporation, Reading,Pennsylvania, Contract No. 68-02-0230, Battelle Institute, Columbus, OH, July 1972.
16. Technical Guidance for Control of Industrial Process Fugitive Particulate Emissions, EPA-450/3-77-010, U.S. Environmental Protection Agency, Research Triangle Park, NC, March1977.
17. E. I. Hartt, An Evaluation of Continuous Particulate Monitors at A Secondary LeadSmelter, M. S. Report No. O. R. -16, Environment Canada, Ottawa, Canada. Dateunknown.
18. J. E. Howes, et al., Evaluation of Stationary Source Particulate Measurement Methods,Volume V: Secondary Lead Smelters, Contract No. 68-02-0609, Battelle Laboratories,Columbus, OH, January 1979.
19. Silver Valley/Bunker Hill Smelter Environmental Investigation (Interim Report), ContractNo. 68-02-1343, Pedco, Inc., Cincinnati, OH, February 1975.
20. Rives, G.D. and A.J. Miles, Control of Arsenic Emissions from the Secondary LeadSmelting Industry, Technical Document. Prepared under EPA contract No. 68-02-3816.Office of Air Quality Planning and Standards, U.S. Environmental Protection Agency,Research Triangle Park, NC, May 1985.
21. W.D. Woodbury, "Lead," Minerals Yearbook. United States Department of the Interior,Bureau of Mines, Washington, DC, 1989.
22. AIRS Facility Subsystem Source Classification Codes and Emission Factor Listing forCriteria Air Pollutants, EPA 450/4-90-003, U.S. Environmental Protection Agency,Research Triangle Park, NC, March 1990.
23. F. Hall, et al. Inspection and Operating and Maintenance Guidelines for Secondary LeadSmelter Air Pollution Control. Pedco-Environmental, Inc., Cincinnati, OH, 1984.
24. Quantification of Fugitive Lead Emissions from Smelter and Oxide Plant Sources for GNBInc., preformed by Lake Engineering, Inc., Atlanta, GA, April 1992.
25. Letter from R. A. Leiby, Jr. of East Penn Manufacturing Co., Inc., to B. Richani of PacificEnvironmental Services, Inc., RTP, NC, June 1992.
26. Report of Particulate/Lead/SO2 Emission Tests for Refined Metals Corporation, performedby Environmental Monitoring Laboratories, Ridgeland, MS, July 1991.

45
27. Source Test Report for Schuylkill Metals Corporation at Cannon Hollow Facility, ForestCity, MO, performed by Burnes & McDonnell Engineering Company, Kansas City, MO,November 1990.
28. Source Evaluation Results at Master Metals, Inc., prepared by Envisage Environmental,Inc., Richfield, OH, March 1991.
29. Particulate, Lead, & SO2 Emission Tests Conducted on the Refinery, Blast Furnace, andReverberatory Ventilation Systems in Leeds, AL, for Interstate Lead Company, Inc.,performed by Guardian Systems, Inc., Leeds, AL, June 1987.
30. Report on Compliance Testing, Performed for RSR Corporation, Dallas, TX, Conducted atQuemetco, Inc., Indianapolis, IN, performed by Clean Air Engineering, Palatine, IL, May1991.
31. Report of Particulate/Lead Emissions Test for Refined Metals Corporation Secondary LeadSmelter, Beech Grove, IN, performed by Environmental Monitoring Laboratories,Ridgeland, MS, June 1989.
32. Source Emission Survey of Quemetco Inc., Indianapolis, IN, performed by MetcoEnvironmental, Addison, TX, October 1988.
33. Stack Emissions from a Baghouse Serving Scrap Lead Reclaiming Operations at Delco-Remy Division, GM Corporation, New Brunswick, New Jersey, performed by RMCEnvironmental Services, Inc., Spring City, PA, March 1992.
46
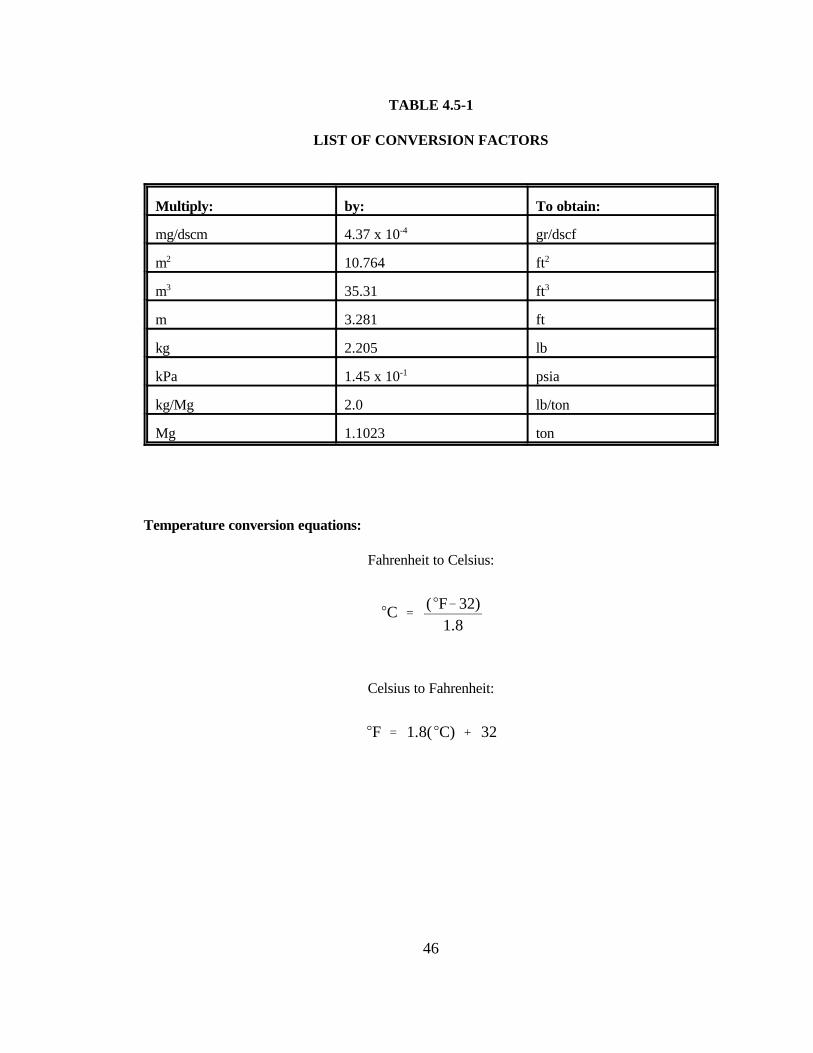
TABLE 4.5-1
LIST OF CONVERSION FACTORS
Multiply: by: To obtain:
mg/dscm 4.37 x 10⁻⁴ gr/dscf
m2 10.764 ft2
m3 35.31 ft3
m 3.281 ft
kg 2.205 lb
kPa 1.45 x 10⁻¹ psia
kg/Mg 2.0 lb/ton
Mg 1.1023 ton
Temperature conversion equations:
Fahrenheit to Celsius:
EC '(EF&32)
1.8
Celsius to Fahrenheit:
EF ' 1.8(EC) % 32