BABY-BOOMERS SURVEY · baby-boomer cohort. As well, a larger proportion of males among this group...
88
BABY-BOOMERS SURVEY This report was prepared by A/P Angelique Chan (Department of Sociology, National University of Singapore) and Dr Yap Mui Teng (Institute of Policy Studies, Lee Kuan Yew School of Public Policy, National University of Singapore) for the Ministry of Community Development, Youth and Sports.
Transcript of BABY-BOOMERS SURVEY · baby-boomer cohort. As well, a larger proportion of males among this group...
BABY-BOOMERS SURVEY This report was prepared by A/P Angelique Chan (Department of Sociology, National University of Singapore) and Dr Yap Mui Teng (Institute of Policy Studies, Lee Kuan Yew School of Public Policy, National University of Singapore) for the Ministry of Community Development, Youth and Sports.

CONTENTS
EXECUTIVE SUMMARY.................................................................................................. 3 CHAPTER 1: Profile of Baby-boomers ....................................................................... 10
1.1 Gender Differences in Demographic Characteristics & Socioeconomic Status of Baby-boomers.................................................................................................................................... 10
1.2 Differences in Demographic Characteristics and Socioeconomic Status between Early Baby-boomers and Late baby-boomers ................................................................................... 14
1.3 Differences n Demographic Characteristics and Socioeconomic Status between Baby-boomers with Different Levels of Education ............................................................................. 18
1.4 Differences in Demographic Characteristics and Socioeconomic Status between Baby-boomers who are Singapore Citizens and Singapore Permanent Residents........................... 26
CHAPTER 2: Retirement Perceptions and Aspirations of Baby-boomers .............. 31 2.1 General Perceptions of Retirement/ Old Age................................................................ 31
2.1.1 Gender Differences................................................................................................. 31 2.1.2 Differences between Early Baby-boomers and Late Baby-boomers ..................... 36 2.1.3 Differences between Baby-boomers with Different Levels of Education ............... 38
2.2 Employment Perceptions/Expectations of Economically-active Baby-boomers ......... 444 2.2.1 Gender Differences............................................................................................... 444
2.2.2 Differences between Early Baby-boomers and Late Baby-boomers…………….....50 2.2.3 Differences between Baby-boomers with Different Levels of Education ................ 52
2.3 Perceptions of Financial Security During Retirement/Old Age ...................................... 60 2.3.1 Gender Differences................................................................................................. 60 2.3.2 Differences between Early and Late Baby-boomers .............................................. 62 2.3.3 Differences between Baby-boomers with different levels of Education .................. 64
2.4 Living Arrangements and Perceptions of Social Support in Retirement/Old Age...........68 2.4.1 Gender Differences................................................................................................. 68 2.4.2 Differences between Early Baby-boomers and Late Baby-boomers ...................... 73 2.4.3 Differences between Baby-boomers with Different Levels of Education ................ 74
CHAPTER 3: PRODUCTS & SERVICES FOR BABY-BOOMERS IN RETIREMENT/OLD AGE............................................................................................... 84 The Silver Market...............................................................................................................84
3.1 Baby Boomers’ Potential Demand for Products and Services in Retirement/Old Age... 84
3.2 Estimating Baby-boomers’ Effective Demand for Silver Products and Services ........... 87
2
EXECUTIVE SUMMARY
Background
1. In Singapore, there are about 1 million1 baby-boomers, defined as those born between
1947 and 1964. They constitute a sizeable proportion (about 30%) of the resident population
comprising Singapore citizens and permanent residents. The first batch of these baby-boomers
will reach 65 years old by 2012. The baby-boomers will form the largest aged population
Singapore has ever experienced.
2. Attention has been focused on policies for the aged since the Committee on the Problems
of the Aged, headed by then Health Minister Howe Yoon Chong, in the early 1980s. Existing
cohorts of elderly are mostly uneducated, worked in low paying occupations or have never
worked (especially elderly women), have little CPF coverage, and rely heavily on family support.
The profile and concerns of Singapore’s baby-boomers are likely to be different from those of the
earlier cohorts of elderly.
3. There is preliminary evidence, however, that Singapore’s baby-boomers are like those
elsewhere, being better-educated (especially the late baby-boomers) and having higher incomes
and higher skilled jobs.
4. We know very little about their attitudes and expectations and the resources that they will
possess in old age. Given this, there is a need to understand their profile and aspirations and
devise strategies to address the needs and concerns as well as opportunities that arise with the
ageing of the baby-boomers.
1 Based on Census 2000 resident population, comprising citizens and permanent residents
3
Objectives 5. The objectives of this study are to:
i. Understand the aspirations (lifestyle choices, family network and relationships, social
networks, third-age pursuits, financial security and employment) of baby-boomers2.
ii. Assess the purchasing power and level of consumerism of the baby-boomers to
determine the potential of the silver industry.
iii. Profile the different batches of baby-boomers viz. the early versus late baby-boomers
(defined as those born 1947-1954 and those born 1955-64 respectively).
Methodology
6. A survey was carried out on a nationally representative sample of 3000 Singapore
citizens and Permanent Residents born between 1947 and 1964.
7. The sampling frame was derived from the Ministry of Home Affairs. MHA
randomly sampled individuals according to year of birth, ethnicity, and citizenship.
8. Pilot testing was conducted on 32 respondents specifically chosen by gender,
age group, education level, and ethnicity. The questionnaire was then revised to take into
account issues raised in the pilot test.
9. The survey was conducted between August and November 2007 by Market
Probe Incorporated. The response rate was a respectable 70%.
2 The findings will be inputs for reviewing the Government’s policy approach of ensuring “ageing in place” and that family remains the first line of care and support.
4

Findings
10. Gender and Cohort Profiles. The majority (83%) of the baby-boomers are married. A
significantly larger proportion of females (8%) than males (2%) have been widowed in the early
baby-boomer cohort. As well, a larger proportion of males among this group (9%) are
single/never married as compared to females (6%). Late baby-boomers of both genders are more
likely to be single/never married compared to the early baby-boomers – a reflection of the general
trend towards later marriage and increased singlehood. Interestingly, the university-educated
baby-boomers are not the most likely to remain single; rather,it is those with secondary and
upper secondary qualifications that are most likely to have never married. They are also more
likely to have divorced or separated. On average, the baby-boomers have 2.2 children, with early
baby-boomers averaging 2.4 and the late baby-boomers only 2.1. Baby-boomers with upper
secondary and secondary education are more likely to have no children than even their better-
educated counterparts, this being probably related to their marital status.
11. Some interesting findings associated with the above gender and cohort profiles include:
• The gender gap in educational attainment remains although it has narrowed among the
late cohorts. As well, gender differentials in employment remain. These have implications
for men’s and women’s financial security in old age, in particular, their access to Central
Provident Fund (CPF) savings and CPF-related financial instruments.
• Men are more likely to report their own earnings as their major source of household
income during retirement/ old age while women are more likely to report children/siblings.
• A significantly larger proportion of females expect their spouse to support them in
retirement compared to males. Women are also more likely to expect their children to
support them. Significantly more men expect no support from family members.
• A significantly larger proportion of males expect physical care support from their family
members as compared to females. More females expect monetary support, probably due
5

to the fact that a large proportion of the women do not or have not worked and so have
little personal savings for their old age.
12. Education. Most baby-boomers have some education. Only 12% of baby boomer
females and 4% of males have no education (as compared to 80% and 60% respectively of
current elderly). There are significant differences in educational attainment between cohorts of
baby-boomers. Specifically, the late baby-boomers are more likely to have polytechnic and
higher qualifications compared to the early baby-boomers. Baby-boomers who are Permanent
Residents also have higher educational attainment than citizens due probably to the selective
immigration policy.
13. Differences in the needs and aspirations among baby-boomers with various educational
attainment include:
• Baby-boomers with no formal qualification (59%) are more likely to be economically
inactive compared to those with university qualifications (6%).
• Almost all baby-boomers (93%) of those with university education want to maintain their
household independently/ with their spouses compared to only 67% of those with no
formal education and 73% of those with primary education.
• Half of baby-boomers with no formal or primary qualifications expect to live with their
children compared to less than 1 in 5 university graduates.
• Among the economically active, those with primary or no formal qualifications are the
most likely to feel compelled to forego retirement; on the other hand, a sizeable proportion
of the university-educated expect to retire before age 65 despite having the skills for
continued engagement in the work force. The former are more likely to emphasise income
consideration as the most important reason for post-retirement employment but the
motivations among the latter are to keep active, do something meaningful and to have a
sense of self-worth.
6
• Flexible work arrangement is a key work place factor for maintaining employment during
retirement. For the university-educated, having a stimulating work place and ability to
guide or mentor younger workers are more important than income continuity or work
hours which are important for the other educational groups. These findings have
important implications for the labour market and planners strategising to promote
continued employment among baby-boomers.
• There is a strong correlation between educational attainment and expected retirement
income. The majority of baby-boomers with below secondary education expect to receive
less than $1000 monthly while the majority of those with university degrees expect to
have $2000 or more. This is likely to affect their spending power and future consumption,
including ‘silver’ products and services.
14. Substantive findings regarding the study include the following:
15. Retirement expectations.
i. Expectations of family support in old age continue to remain high (although the
expectation of financial support from children is lower than among Singaporeans
currently aged 65 and over). There are key differences in expectations of social support
depending on gender, educational status and baby-boomer cohort.
Gender differences: A significantly higher proportion of females expect
support from their children and spouses compared to males.
Educational differences: The expectation of child support is significantly
higher among those baby-boomers with no formal education compared to
those with any other level of education.
Differences between early and late baby-boomers: A significantly higher
proportion of early baby-boomers expect their children to support them
compared to late baby-boomers.
7

ii. Types of social support. Baby-boomers expect different types of support from
children. Foremost is emotional support, followed by physical care and then financial
support. The importance of emotional support and physical care is notable and
suggests that baby-boomers prefer family care in old age.
Gender differences: A significantly larger proportion of males expect physical
care support compared to their female counterparts. On the other hand,
more females expect monetary support from their family members during
retirement or old age than the males.
Educational differences: Those baby-boomers with no formal education
expect mostly financial support from their children whereas those with
university education mostly expect emotional support from their children.
Differences between early and late baby-boomers: Emotional support is the
most common support expected by both early and late baby-boomers.
Slightly more early baby-boomers expect monetary support compared to late
baby-boomers.
iii. Ageing in place. Most baby-boomers would like to maintain their own homes
independently or with spouse. However, 25% would not mind staying in a retirement
village, and 14% would not mind staying in a nursing home. This suggests a market
for such institutions to cater to the changing expectations regarding living
arrangements among baby-boomers. About half of baby-boomers want to live with
their children.
Gender differences: There are no gender differences in the proportion of
males and females who would not mind living in a nursing home or in a
retirement village. However, a significantly higher proportion of female than
male baby-boomers expect to live near/ with at least one of their children.
Educational differences: Half of the baby-boomers with no formal
qualifications expect to live with their children during retirement or old age,
8

whereas only 18% of the baby-boomers with university and higher education
expect the same.
Differences between early and late baby-boomers: A significantly higher
proportion of the early baby-boomers expect to live with their children
compared to late baby-boomers and significantly fewer of them want to
maintain their own household independently.
16 Estimating the Silver Market. There appears to be a ready market for “fun” (leisure,
travel) and educational activities and programmes. However, the market for more high-tech
items such as robots, telemedicine and smart homes require relatively more awareness-raising
effort. Cost is also a consideration, particularly for items such as travel and high tech assistive
devices. As a start, market success appears to be more likely to be among the highly educated
as they are more disposed towards such items, and probably have the financial wherewithal to
pay for them. With regard to their purchasing power propensity, it is noted that most baby-
boomers expect their household income to decline post-retirement.
9
CHAPTER 1: Profile of Baby-boomers
1. In Singapore, there are about 1 million3 baby-boomers, defined as those born between
1947 and 19644. They constitute a sizeable proportion (about 30%) of the resident population
comprising Singapore citizens and permanent residents. There is preliminary evidence that
Singapore’s baby-boomers are like those elsewhere, being more highly educated (especially the
later born baby-boomers) and holding more highly skilled jobs which give them higher incomes
than their parents5.
2. The first batch of baby-boomers, born in 1947, will begin to enter retirement years/ old
age in 2012 when they turn 65. Thereafter, baby-boomers will swell the ranks of the elderly
population in Singapore until 2030. As such, there is a need for Singapore to understand the
profile, perceptions and aspirations of this group, and devise strategies to address the needs and
concerns as well as opportunities that arise with the ageing of the baby-boomers. The baby-
boomers in this study are divided into two broad groups, namely, the early baby-boomers (born
1947-54) and late baby-boomers (born 1955-64)6.
1.1 Gender Differences in Demographic Characteristics & Socioeconomic Status of Baby-boomers
3. Table 1-1-1 shows that 83% of the baby-boomers are married. However, a significantly
larger proportion of females (8%) than males (2%) have been widowed in the early baby-boomer
cohort. As well, a larger proportion of males among this group (9%) are single/never married as
compared to females (6%).
3 Based on Census 2000 resident population, comprising Singapore citizens and permanent residents. 4 For comparability, the definition of the baby boom in this study follows that used by the Department of Statistics (DOS) in The Baby-boomers in Singapore, Occasional Paper on Social Statistics 2000. 5 ibid. 6 Again, this nomenclature follows DOS (ibid.).
10

Table 1-1-1: Gender Differences in Marital Status of Baby-boomers
Marital Status Early Baby-boomers
Late Baby -boomers
Total
Male (%)
Female(%)
Male (%)
Female (%)
Male (%)
Female (%)
Total (%)
Single/Never married 9 6 13 12 11 10 11 Married 84 81 84 82 83 82 83 Divorced/Separated 5 5 4 5 5 4 4 Widowed 2 8 0.2 2 1 3 2 Total 100 100 100 100 100 100 100 4. The socioeconomic status (SES) of the baby-boomers, namely, highest educational level
attained, work history, current work status, occupation and gross monthly household income, also
vary across gender and cohort. As depicted in Table 1-1-2 below, in line with socio-cultural norms
of the time, male baby-boomers tend to have significantly higher levels of education than
females. Overall, more males (31%) completed tertiary education (diploma and university or
higher education) compared to females (16%); a larger proportion of females completed only
primary education (23%) or do not possess any formal qualification (12%) compared to males
(16% and 4% respectively). Notably, a significantly higher proportion of females (23%) from the
early baby-boomer cohort have no formal qualification compared to males (7%). Though the later
born baby-boomers of both genders made progress in educational attainment as compared to
their early boomer counterparts, the gender gap remains, and this is especially at the tertiary
level.
11

Table 1-1-2: Gender Differences in Highest level of education attained by Baby-boomers
Highest Educational level
Early Baby-boomers
Late Baby-boomers
Total
Male (%)
Female (%)
Male (%)
Female (%)
Male (%)
Female (%)
Total (%)
No formal qualification 7 23 2 6 4 12 8 Completed primary school 22 27 13 20 16 23 19 Completed lower secondary education
17 14 15 16 15 15 15
Completed secondary school
22 22 28 28 26 26 26
Completed upper secondary education
7 6 9 10 8 8 8
Completed polytechnic/other diploma
11 5 18 13 16 10 13
Completed university or higher education
14 4 16 8 15 6 11
Total 100 100 100 100 100 100 100
5. There is also a significant gender differentials in work history, with nearly 100% of the
males having ever worked as compared to only 70% of the females. (Table 1-1-3). Work status
at the time of study also differs by gender, with more males (92%) being employed full-time or
part-time than females (49%). Gender differentials exist for both the early and late baby-boomer
cohorts although the gap is closing among the latter group. These gender differences in
employment patterns are likely due to gender role norms, where men are expected to be the
breadwinner and women are expected to perform household chores and care-giving duties.
They have implications for men’s and women’s financial security in old age, in particular, their
access to Central Provident Fund (CPF) savings and CPF-related financial instruments. It is also
noteworthy that 11% of the male and 2% of the female early baby-boomers studied claim to have
retired, even though they have not reached the retirement age of 62.
12

Table 1-1-3: Gender Differences in Work History and Status of Baby-boomers
Early Baby-boomers
Late Baby-boomers
Total
Male (%)
Female (%)
Male (%)
Female (%)
Male (%)
Female (%)
Total (%)
Work History Worked before 99.5 56 100 78 100 70 85 Never worked before 0.5 44 0 22 0 30 15 Total 100 100 100 100 100 100 100 Current Work Status Working full-time (30 hrs or more a week) 80 23 95 51 89 41 65
Working part-time (less than 30 hrs a week)
4 7 3 8 3 8 6
Retired 11 2 0.6 0.2 4 1 3 Not working 5 68 1.4 41 3 50 26 Total 100 100 100 100 100 100 100
6. Baby boomer men and women also differ significantly in their occupational status. As
shown in Table 1-1-4 below, overall more males are in professional, managerial and associate
professional/technical positions (52%) as compared to females (36%). The latter are more likely
to hold lower-level white collar positions such as clerical workers or service/sales workers. This
pattern is seen in both cohorts of baby-boomers.
Table 1-1-4: Gender Differences in Occupation of Baby-boomers
Occupation Early Baby-boomers
Late Baby-boomers
Total
Male (%)
Female (%)
Male (%)
Female (%)
Male (%)
Female (%)
Total (%)
Legislators, Senior Managers 19 9 15 10 16 10 14 Professionals 10 6 15 9 13 8 11 Associate Professionals/Technicians
16 14 26 20 23 18 21
Clerical workers 3 15 4 22 4 20 10 Service/Sales workers 11 18 10 18 10 18 13 Production/Craftsman/ Agriculture & related workers
12 7 10 5 11 6 9
Cleaners/Labourers/General workers
19 9 14 5 16 6 12
Workers not classified by occupation
10 23 4 11 6 14 9
Don’t know/ refused 1 0.3 1 0.9 1 1 1 Total 100 100 100 100 100 100 100
13

7. The pattern of gross monthly household income is shown in Table 1-1-5 below. In the
early baby-boomer cohort, a higher proportion of males (48%) than females (36%) report
household incomes of $4000 and above. However, there is no difference between the
proportions of male and female late baby-boomers reporting this level of income.
Table 1-1-5: Gender Differences in Gross Monthly Income of Baby-boomers
Gross Monthly Household Income
Early Baby-boomers
Late Baby-boomers
Total
Male (%)
Female (%)
Male (%)
Female (%)
Male (%)
Female (%)
Total (%)
No income 5 8 0.6 5 2 6 4 Less than $2000 19 16 15 16 17 16 16 $2000 - $3999 33 34 45 39 41 37 39 $4000 - $7499 36 26 24 23 25 24 25 $7500 and above 12 10 12 12 12 11 12 No fixed income 0.9 0.4 0.4 0.2 0.6 0.3 0.4 Don’t know 5 5 3 5 3 5 4 Total 100 100 100 100 100 100 100
1.2 Differences in Demographic Characteristics and Socioeconomic Status between Early Baby-boomers and Late baby-boomers
8. As shown in Table 1-2-1 below, there is a significant difference in the ethnic profile of
early and late baby-boomers with fewer Chinese and more Malays, Indians and ‘Others’ amongst
the late baby-boomers as compared to the early group. Also, there are more singles who have
never been married (12%) in the later cohort as compared to the early baby-boomers (8%). In
line with this difference in marital status, there are significantly more early baby-boomers with
children (91%). The average number of children for early baby-boomers (2.4) is higher than that
for late baby-boomers (2.1). (Refer to Table 1-2-1).
14

Table 1-2-1: Key Demographic Differences between Early and Late Baby-boomers
Characteristics Total (%) Early Baby Boomers (%)
Late Baby Boomers(%)
Ethnic Group Chinese 78 82 77 Malay 12 10 13 Indian 8 7 8 Others 2 2 3 Total 100 100 100 Marital Status Single/Never married 11 8 12 Married 83 82 83 Divorced/Separated 4 5 4 Widowed 2 5 1 Total 100 100 100 Number of Children None 13 9 15 1 child 13 11 14 2 children 38 36 39 3 or more children 36 44 32 Total 100 100 100 Average Number 2.2 2.4 2.1
9. There are key differences in the socioeconomic status (SES) of the early and late baby-
boomer cohorts. As shown in Table 1-2-2, most of the early baby-boomers completed only
primary to secondary education (61%), whereas a significantly larger proportion of late baby-
boomers completed polytechnic and higher education (28% as against 17% of early baby-
boomers). There is also significant disparity in the proportions of early (15%) and late (4%) baby-
boomers without formal qualification. This may be a concern especially for the early baby-
boomers who may need to continue working after the retirement age for financial reasons and yet
are unlikely to retain their current jobs or obtain new ones due to a lack of qualification.
15
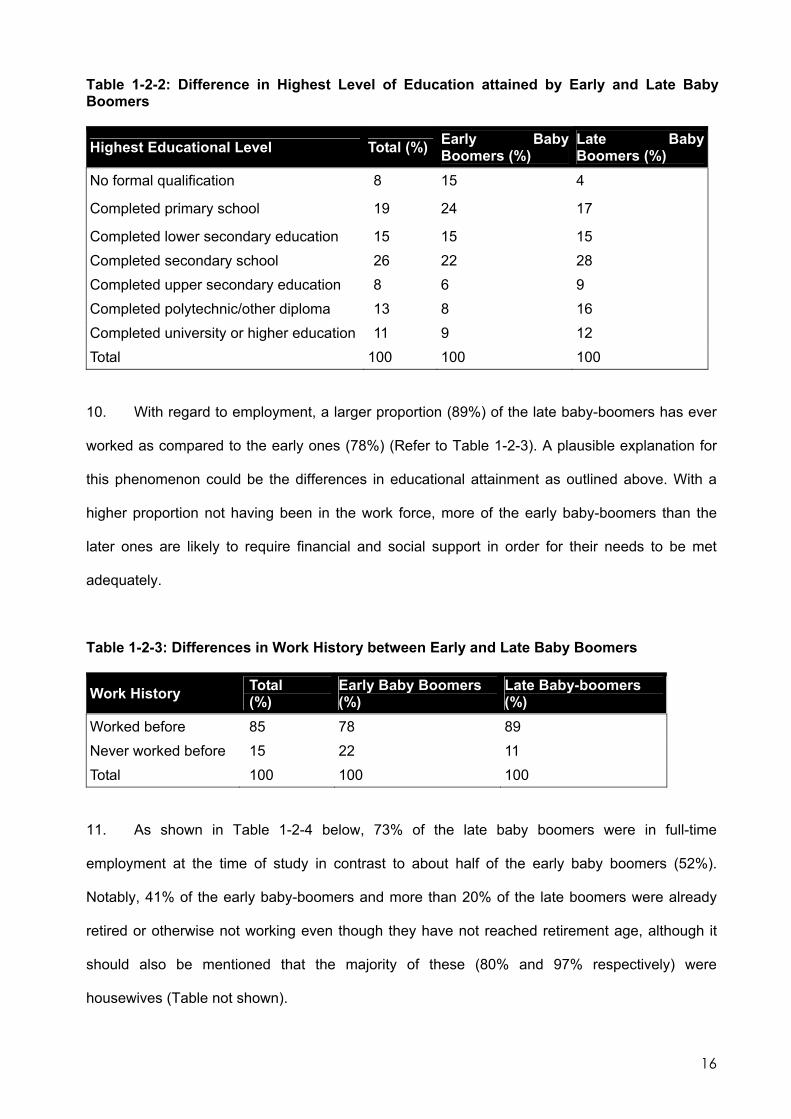
Table 1-2-2: Difference in Highest Level of Education attained by Early and Late Baby Boomers
Highest Educational Level Total (%) Early Baby Boomers (%)
Late BabyBoomers (%)
No formal qualification 8 15 4
Completed primary school 19 24 17
Completed lower secondary education 15 15 15 Completed secondary school 26 22 28 Completed upper secondary education 8 6 9 Completed polytechnic/other diploma 13 8 16 Completed university or higher education 11 9 12 Total 100 100 100
10. With regard to employment, a larger proportion (89%) of the late baby-boomers has ever
worked as compared to the early ones (78%) (Refer to Table 1-2-3). A plausible explanation for
this phenomenon could be the differences in educational attainment as outlined above. With a
higher proportion not having been in the work force, more of the early baby-boomers than the
later ones are likely to require financial and social support in order for their needs to be met
adequately.
Table 1-2-3: Differences in Work History between Early and Late Baby Boomers
Work History Total (%)
Early Baby Boomers (%)
Late Baby-boomers (%)
Worked before 85 78 89 Never worked before 15 22 11 Total 100 100 100
11. As shown in Table 1-2-4 below, 73% of the late baby boomers were in full-time
employment at the time of study in contrast to about half of the early baby boomers (52%).
Notably, 41% of the early baby-boomers and more than 20% of the late boomers were already
retired or otherwise not working even though they have not reached retirement age, although it
should also be mentioned that the majority of these (80% and 97% respectively) were
housewives (Table not shown).
16
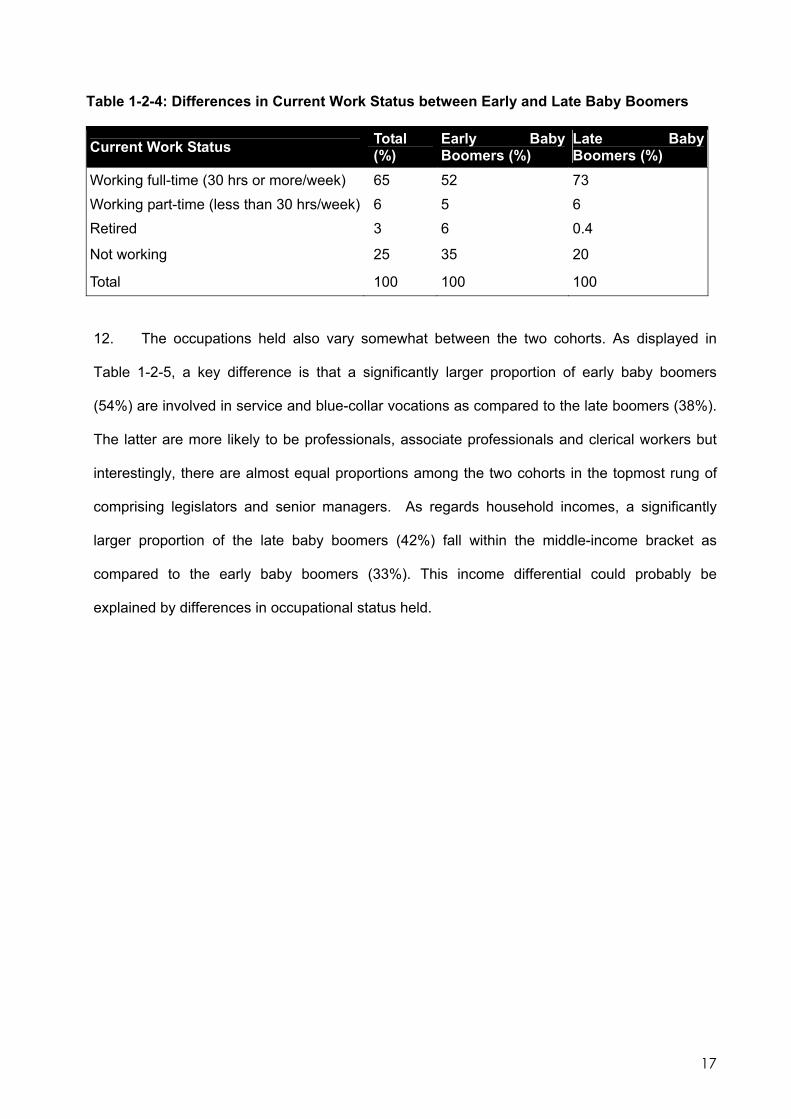
Table 1-2-4: Differences in Current Work Status between Early and Late Baby Boomers
Current Work Status Total (%)
Early Baby Boomers (%)
Late BabyBoomers (%)
Working full-time (30 hrs or more/week) 65 52 73 Working part-time (less than 30 hrs/week) 6 5 6 Retired 3 6 0.4
Not working 25 35 20
Total 100 100 100
12. The occupations held also vary somewhat between the two cohorts. As displayed in
Table 1-2-5, a key difference is that a significantly larger proportion of early baby boomers
(54%) are involved in service and blue-collar vocations as compared to the late boomers (38%).
The latter are more likely to be professionals, associate professionals and clerical workers but
interestingly, there are almost equal proportions among the two cohorts in the topmost rung of
comprising legislators and senior managers. As regards household incomes, a significantly
larger proportion of the late baby boomers (42%) fall within the middle-income bracket as
compared to the early baby boomers (33%). This income differential could probably be
explained by differences in occupational status held.
17

Table 1-2-5: Differences in Occupation and Gross Monthly Household Income between Early and Late Baby Boomers
Characteristics Total (%)
Early Baby Boomers (%)
Late Baby Boomers (%)
Occupation Legislators, Senior Managers/ Officers 14 15 13 Professionals 11 9 12 Associate Professionals/Technicians 21 15 24 Clerical workers 11 7 12 Service/Sales workers 17 18 16 Production/Craftsman/Agriculture and related workers 11 14 10
Cleaners/Labourers/General workers 15 22 12 Total 100 100 100 Gross Monthly Household Income No income 4 6 3 Less than $2000 16 18 16 $2000 to $3999 39 33 42 $4000 to $7499 25 26 24 $7500 and above 12 11 12 No fixed income 0.4 0.6 0.3 Don't know/Refused to answer 4 5 4 Total 100 100 100
1.3 Differences in Demographic Characteristics and Socioeconomic Status between Baby-boomers with Different Levels of Education
13. There are several significant demographic differences between baby-boomers of
different educational backgrounds. One key difference is that between genders. There are
disproportionately more males among those who have completed tertiary education - 62% and
71% of the baby-boomers who have completed polytechnic diplomas and university degrees
respectively are males -- whereas females are disproportionately represented among those with
primary or no qualifications (58% and 75% respectively). (Refer to Table 1-3-1).
18
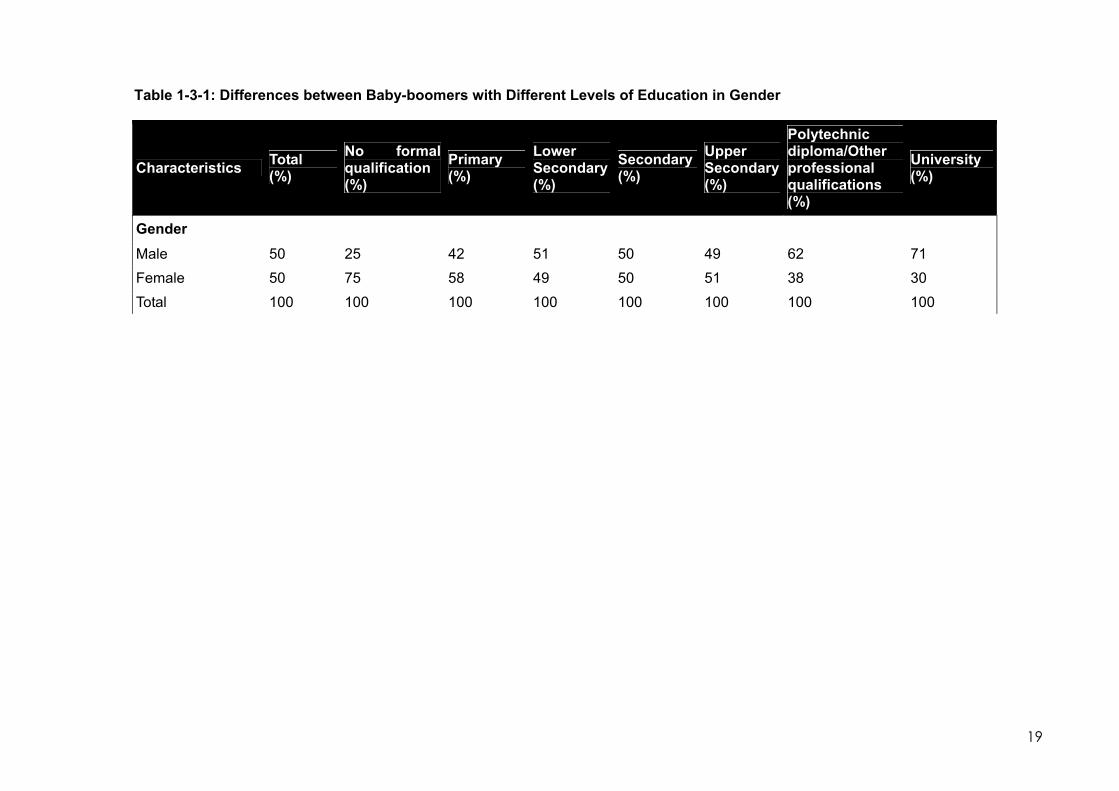
Table 1-3-1: Differences between Baby-boomers with Different Levels of Education in Gender
Characteristics Total (%)
No formal qualification (%)
Primary (%)
Lower Secondary (%)
Secondary (%)
Upper Secondary (%)
Polytechnic diploma/Other professional qualifications (%)
University (%)
Gender
Male 50 25 42 51 50 49 62 71Female 50 75 58 49 50 51 38 30Total 100 100 100 100 100 100 100 100
19

14. Marital status and the educational level of a baby-boomer are also significantly related.
Interestingly, the university educated baby-boomers are not more likely to remain single as
compared to the other educational groups; rather, it is the baby-boomers with secondary and
upper secondary qualifications that are most likely to have never married. Notably, they are
also the most likely to have divorced or separated. (Refer to Table 1-3-2).
15. The number of children also varies with educational attainment. Significantly baby-
boomers who have the lowest educational attainment, i.e. no formal qualification or completed
primary to lower secondary education are disproportionately more likely to have three or more
children. In comparison, diploma and degree holders are more likely to have only one or two.
The higher proportion of secondary and upper secondary baby-boomers who have no children
is probably related to the fact that they are more likely to be single, as mentioned above. (Refer
to Table 1-3-2).
20
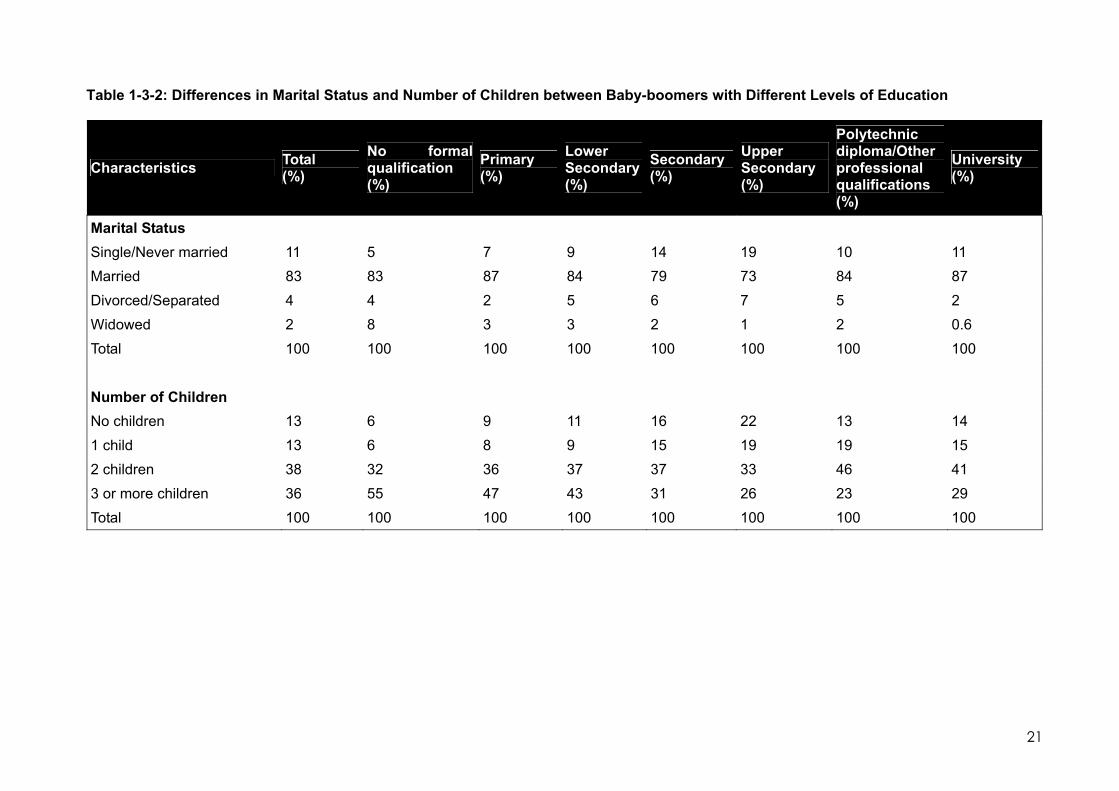
Table 1-3-2: Differences in Marital Status and Number of Children between Baby-boomers with Different Levels of Education
Characteristics Total (%)
No formal qualification (%)
Primary (%)
Lower Secondary (%)
Secondary (%)
Upper Secondary (%)
Polytechnic diploma/Other professional qualifications (%)
University (%)
Marital Status Single/Never married 11 5 7 9 14 19 10 11Married 83 83 87 84 79 73 84 87Divorced/Separated 4 4 2 5 6 7 5 2Widowed 2 8 3 3 2 1 2 0.6Total 100 100 100 100 100 100 100 100
Number of Children No children 13 6 9 11 16 22 13 14 1 child 13 6 8 9 15 19 19 152 children 38 32 36 37 37 33 46 413 or more children 36 55 47 43 31 26 23 29 Total 100 100 100 100 100 100 100 100
21
16. The employment status of baby-boomers is directly influenced by the educational level
they attain. As shown in Table 1-3-3, almost all the polytechnic diploma-holders have worked
before (99%), whereas a significantly smaller proportion of baby-boomers with no formal
qualification have ever done so (61%). The latter is most likely due to a lack of the necessary
skills in order to hold down a job. Likewise, most of the diploma-holders (91%) were working full-
time at the time of study but only 23% of the baby-boomers with no formal qualification were
similarly employed. Baby-boomers with low or no formal qualifications were much more likely to
be economically inactive at the time of study as compared to the better qualified. (Refer to Table
1-3-3).
22

Table 1-3-3: Differences in Work History and Current Work Status between Baby-boomers with Different Levels of Education
Characteristics Total (%)
No formal qualification (%)
Primary (%)
Lower Secondary (%)
Secondary (%)
Upper Secondary (%)
Polytechnic diploma/Other professional qualifications (%)
University (%)
Work History Worked before 85 61 71 80 92 93 99 96Never worked before 15 39 29 20 8 7 1 4 Total 100 100 100 100 100 100 100 100 Current Work Status Working full-time (30 hrs or more/week) 65 23 47 61 71 73 91 88
Working part-time (less than 30 hrs/week) 6 9 6 7 7 4 2 4
Retired 3 6 3 2 2 5 1 2Not working 25 59 43 30 19 18 6 6Not working but looking for work 1 2 2 1 2 0.4 0.3 1 Total 100 100 100 100 100 100 100 100
23
17. Education imposes constraint as well as advantage in the type of occupation baby-
boomers are engaged in. Significantly more baby-boomers with tertiary education (84%) hold
senior managerial and professional positions. More middle-level, secondary educated baby-
boomers obtain jobs as clerks (45%) and service/sales workers (62%) while lower educated
baby-boomers with no formal qualification (59%) or up to primary school education (35%) tend to
hold odd jobs like cleaners or general workers. (Refer to Table 1-3-4).
18. As shown in Table 1-3-4, significantly more baby-boomers with university or higher
education (53%) hail from households with a gross monthly income of $7500 and above,
whereas a similar proportion of baby-boomers with lower secondary education (51%) fall into a
substantially lower income bracket of $2000 to $3999.
24

Table 1-3-4: Differences in Occupation and Gross Monthly Household Income between Baby-boomers with Different Levels of Education
Characteristics Total (%)
No formal qualification (%)
Primary (%)
Lower Secondary (%)
Second-ary (%)
Upper Secondary (%)
Polytechnic diploma/Other professional qualifications (%)
Univer-sity (%)
Occupation Legislators, Senior Managers 14 4 5 4 12 16 27 32 Professionals 11 0 1 1 4 6 20 52 Associate Professionals/Technicians 21 0 4 14 27 39 40 13
Clerical workers 10 0 5 9 20 16 8 1 Service/Sales workers 17 19 24 32 20 10 4 1 Production/Craftsman/Agriculture and related workers 11 19 26 15 11 7 1 0.3
Cleaners/Labourers/General Workers 15 59 35 26 7 6 0.3 0.3
Total 100 100 100 100 100 100 100 100
Gross Monthly Household Income
No income 4 12 6 4 3 3 1 0.6
Less than $2000 16 27 26 25 17 8 3 0.6 $2000 - $3999 39 34 45 51 47 47 21 8 $4000 - $7499 25 18 14 16 22 27 51 35 $7500 and above 12 4 2 1 7 12 18 53 No fixed income 0.4 0 1 0 1 0 0.3 0.3 Do not know/Refused to answer 4 4 6 3 4 3 5 3 Total 100 100 100 100 100 100 100 100
25

1.4 Differences in Demographic Characteristics and Socioeconomic Status between Baby-boomers who are Singapore Citizens and Singapore Permanent Residents
19. The profiles of baby-boomers who are citizens of Singapore and those who are
Singapore Permanent Residents differ in terms of the ethnic groups they belong to, their marital
status and the number of children they have. Unlike citizens, Permanent Residents (PRs) are
disproportionately more likely to belong to the ‘Others’ ethnic group while Malays are significantly
under-represented among PRs. This is illustrated in Table 1-4-1 below.
Table 1-4-1: Distribution of Ethnic Groups among Baby-boomers who are Singapore Citizens (SCs) and Singapore Permanent Residents (SPRs) Ethnic Group Total (%) Singapore Citizens (%) Singapore PRs (%) Chinese 78 78 80 Malay 12 13 2 Indian 8 8 7 Others 2 1 12 Total 100 100 100
20. With regard to marital status, PRs are more likely than citizens to be married (87 as
against 82%) while the proportions of the divorced/separated and widowed are higher among
citizens (Refer to Table 1-4-2 below). PRs also have fewer children than citizens. As displayed
in Table 1-4-2, more PRs have only one or two children (59 versus 50%) whereas citizens are
more likely to have three or more (37 compared to 28%). Both groups are, however, equally
likely to have no children (13%). These differences in marital status and family sizes are
probably related to differences in the age distribution of the two groups as citizens tend to be
older than PRs (Table not shown).
26

Table 1-4-2: Differences between Baby-boomers who are Singapore Citizens and Singapore PRs in Marital Status and Number of Children Characteristics Total (%) Singapore Citizens (%) Singapore PRs (%)Marital Status Single/Never married 11 11 11 Married 83 82 87 Divorced/Separated 4 5 0.3 Widowed 2 3 1 Total 100 100 100 Number of Children None 13 13 13 1 child 13 13 18 2 children 38 37 41 3 or more children 36 37 28 Total 100 100 100
21. As regards their socioeconomic status, a significantly larger proportion of PRs (29%) than
citizens (8%) completed university or higher education. On the other hand, double the proportion of
citizens (14%) compared to PRs (7%) completed polytechnic or other diplomas (Refer to Table 1-
4-3). The higher proportion of university educated among PRs is probably due to the selective
immigration policy adopted (at least up to 2004).
27

Table 1-4-3: Differences between Baby-boomers who are Singapore Citizens and Singapore PRs in the Highest Level of Education attained
Highest Educational Level Total (%)
Singapore Citizens (%)
Singapore PRs(%)
No formal qualification 8 8 6 Completed primary school 19 19 20 Completed lower secondary education 15 16 13 Completed secondary school 26 27 17 Completed upper secondary education 8 8 7 Completed polytechnic/other diploma 13 14 7 Completed university or higher education 11 8 29 Total 100 100 100
22. As citizens and PRs vary significantly in their level of academic qualifications, this in turn
influences the relationship between citizenship and the type of occupations they are involved in.
As shown in Table 1-4-4 below, more PRs (57%) than citizens (44%) hold associate professional
or higher positions whereas more citizens (29%) compared to PRs (14%) hold junior-type
positions like clerical and service workers. However it is notable that more PRs (15%) are in
production and related occupations as compared to citizens (11%).
Table 1-4-4: Differences in Occupation between Baby-boomers who are Singapore Citizens and Singapore Permanent Residents
Occupation Total (%)
Singapore Citizens(%)
Singapore PRs (%)
Legislators, Senior Managers/Officers 14 13 18 Professionals 11 10 16 Associate Professionals/Technicians 21 21 23 Clerical workers 11 11 5 Service/Sales workers 17 18 9 Production/Craftsman/Agriculture and related workers 11 11 15
Cleaners/Labourers/General workers 15 13 13 Total 100 100 100
23. A significant correlation between citizenship and gross monthly household income is
observed. Table 1-4-5 below illustrates this difference where a significantly larger proportion of
28

PRs (23%) fall into the high-income bracket of $7500 and above, in contrast to 10% of citizens in
the same bracket. Significantly more citizens (65%) than PRs (53%) fall into the income brackets
of $2000 to $3999 and $4000 to $7499.
Table 1-4-5: Differences between Baby-boomers who are Singapore Citizens and Singapore PRs in Gross Monthly Household Income and Type of Housing Lived In Gross Monthly Household Income Total (%) Singapore Citizens (%) Singapore PRs (%)
No income 4 4 3 Less than $2000 16 16 16 $2000 to $3999 39 40 34 $4000 to $7499 25 25 19 $7500 and above 12 10 23 No fixed income 0.4 0.5 0.3 Don’t know/Refused to answer 4 4 5 Total 100 100 100
24. Following the differences in occupation and income levels is the type of housing lived in
by citizen and PR baby-boomers. As shown in Table 1-4-6 below, a significantly larger proportion
of PRs (14%) live in private property as compared to citizens (5%). Also, more citizens (72%)
than PRs (57%) amongst the baby-boomers live in the average 4 and 5-room HDB flats in
Singapore.
29

Table 1-4-6: Differences between Baby-boomers who are Singapore Citizens and Singapore Permanent Residents in Type of Housing Lived In Type of Housing Total (%) Singapore Citizens (%) Singapore PRs
(%) 1 or 2 room HDB flat 2 2 3 3 room HDB flat 19 19 22 4 room HDB flat 44 45 35 5 room HDB flat/Executive/ Maisonette 26 27 22
Other flats 0.3 0.3 1 Private Apt/Condominium 6 5 14 Landed property 3 3 4
Total 100 100 100
30
CHAPTER 2: Retirement Perceptions and Aspirations of Baby-boomers
2.1 General Perceptions of Retirement/ Old Age
1. When asked about their general perceptions of retirement /old age, Table 2-1-1 below
shows the baby-boomers’ responses to be mostly positive. Although 85% see it as a time of
“increased concern and attention to health”, a large majority also associate it with having more
time to spend with their families (77%) and a time to pursue hobbies and leisure activities (70%).
Baby-boomers who view retirement/ old age negatively are proportionately smaller, with 11%
associating this period with being no longer useful, 13% with social isolation and 19% with
boredom. Retirement/ old age means fewer responsibilities for about one third.
2.1.1 Gender Differences
2. Baby-boomers’ perceptions of retirement and old age differ significantly by gender in
some respects. Table 2-1-1 below shows that significantly more females (88%) than males (83%)
see retirement or old age as a time of increased concern and attention to health.
3. Women are also significantly more likely than men to see retirement as having more time
to socialise (65% as compared to 61% respectively) and having fewer responsibilities (34%
versus 31%). These differences in responses are likely to stem from the fact that women often
have to bear the double-burden of work and domestic duties if they are employed, and even if
they are not employed, motherhood is often considered a 24/7 responsibility. These are likely to
lighten once the children are independent.
4. In contrast to the above, more males (20%) than females (17%) perceive boredom when
they retire. This could be because employment typically takes up a significant part of men’s lives
prior to retirement. Formal stoppage of work leaves them with considerably less activity to
occupy themselves, hence the perception that they may get bored.
31

Table 2-1-1: Gender Differences in General Perceptions of Retirement/Old Age**
Response Statements Total (%) Males (%)
Females (%)
Retirement/old age means increased isolation from society. 13 12 13
Retirement/old age means time to pursue my interests and hobbies. 70 69 70
*Retirement/old age means fewer responsibilities. 32 31 34 *Retirement/old age means boredom. 19 20 17 Retirement/old age means spending more timewith my family. 77 76 78
Retirement/old age means I am no longer useful. 11 12 11 *Retirement means more time for socializing. 63 61 65 *Retirement/old age means increased concern and attention to health. 85 83 88
* indicates significance between genders in their response ** multiple response
5. As regards their most important lifestyle goal in retirement/ old age, Table 2-1-2 below
shows that about one third of the baby-boomers consider being financially secure or debt-free to
be their most important goal. Other goals include more leisure travel (17%), pursuit of a hobby
(17%) and volunteering (12%). There is little difference by gender, except in two respects. More
males than females (35% versus 29%) see financial security or being debt-free as their most
important goal while females are more likely than males to see volunteering as their most
important goal (15% as compared to 9%). This is likely to be the reflection of the provider versus
nurturer roles that men and women play respectively.
32

Table 2-1-2: Gender Differences in Most Important Lifestyle Goal in Retirement/Old Age
Lifestyle Goals Total (%) Males (%)
Females (%)
*To be financially secure/To pay off debt 32 35 29 To learn more/To pursue a course 7 8 7 To travel more for leisure. 17 17 17 To have more/better material things (which could not afford earlier) 9 9 9
To pursue a hobby or interest 17 16 18 *To do volunteer work 12 9 15 Not sure/Don’t know 6 6 5 Total 100 100 100
* indicates significance between genders in their response
6. The baby-boomers’ most Important physical and spiritual well-being goals in
retirement or old age are shown in Table 2-1-3 below. Not surprisingly, the majority (58%),
regardless of gender, seek to be healthy in their retirement, this being the most frequently selected
goal. On the other hand, gender differences may be observed in the areas of spirituality and being
successful. A significantly larger proportion of women (13%) indicate a desire to be more spiritual
and closer to God as compared to men (9%). In contrast, more than double the proportion of men
(11%) want foremost to be more successful and accomplished in their retirement or old age as
compared to women (5%).
33
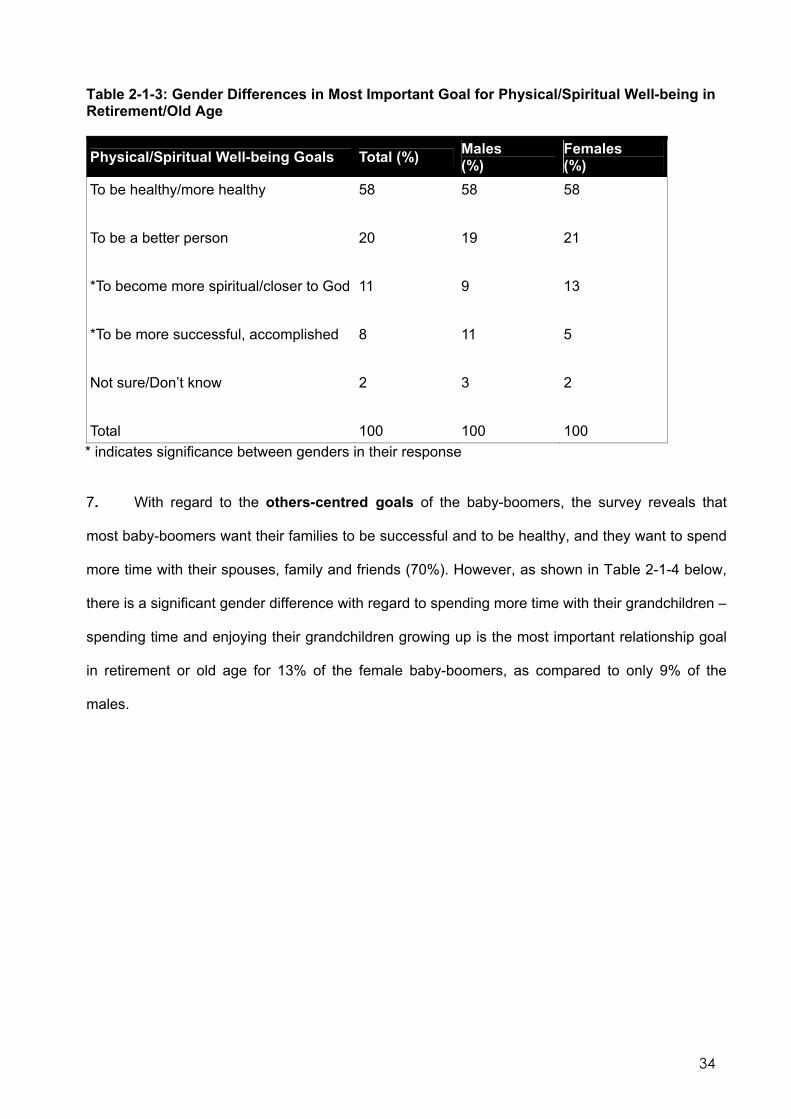
Table 2-1-3: Gender Differences in Most Important Goal for Physical/Spiritual Well-being in Retirement/Old Age
Physical/Spiritual Well-being Goals Total (%) Males (%)
Females (%)
To be healthy/more healthy 58 58 58 To be a better person 20 19 21 *To become more spiritual/closer to God 11 9 13 *To be more successful, accomplished 8 11 5 Not sure/Don’t know 2 3 2 Total 100 100 100
* indicates significance between genders in their response
7. With regard to the others-centred goals of the baby-boomers, the survey reveals that
most baby-boomers want their families to be successful and to be healthy, and they want to spend
more time with their spouses, family and friends (70%). However, as shown in Table 2-1-4 below,
there is a significant gender difference with regard to spending more time with their grandchildren –
spending time and enjoying their grandchildren growing up is the most important relationship goal
in retirement or old age for 13% of the female baby-boomers, as compared to only 9% of the
males.
34

Table 2-1-4: Gender Differences in Most Important Goal for Relationship with Others in Retirement/Old Age
Goals for Relationship with Others Total (%) Males (%)
Females (%)
For my family to be successful in life 16 17 15 For my family to be healthy/more healthy 32 31 32 For my family to become more spiritual 6 5 6 Spend more time with family/spouse/ friends 22 23 21 Find a relationship/mate/get married 3 3 2 To have grandchildren/more grandchildren 9 8 9 *Spend more time with grandchildren 11 9 13 Not sure/Don’t know 3 4 2 Total 100 100 100 *indicates significance between genders in their responses
8. The study also asks if the baby-boomers perceive an increase, decrease or constancy in
their standard of living during their retirement years or old age. Table 2-1-5 shows that about half
foresee their standard of living to remain unchanged while another nearly four in ten even see it
improving during retirement/ old age. Only one in ten see a decline in living standard, with a
larger proportion of males (12%) than females (8%) sharing this view. This perception among the
men is likely a result of retirement from formal work which implies a significant drop in income.
35
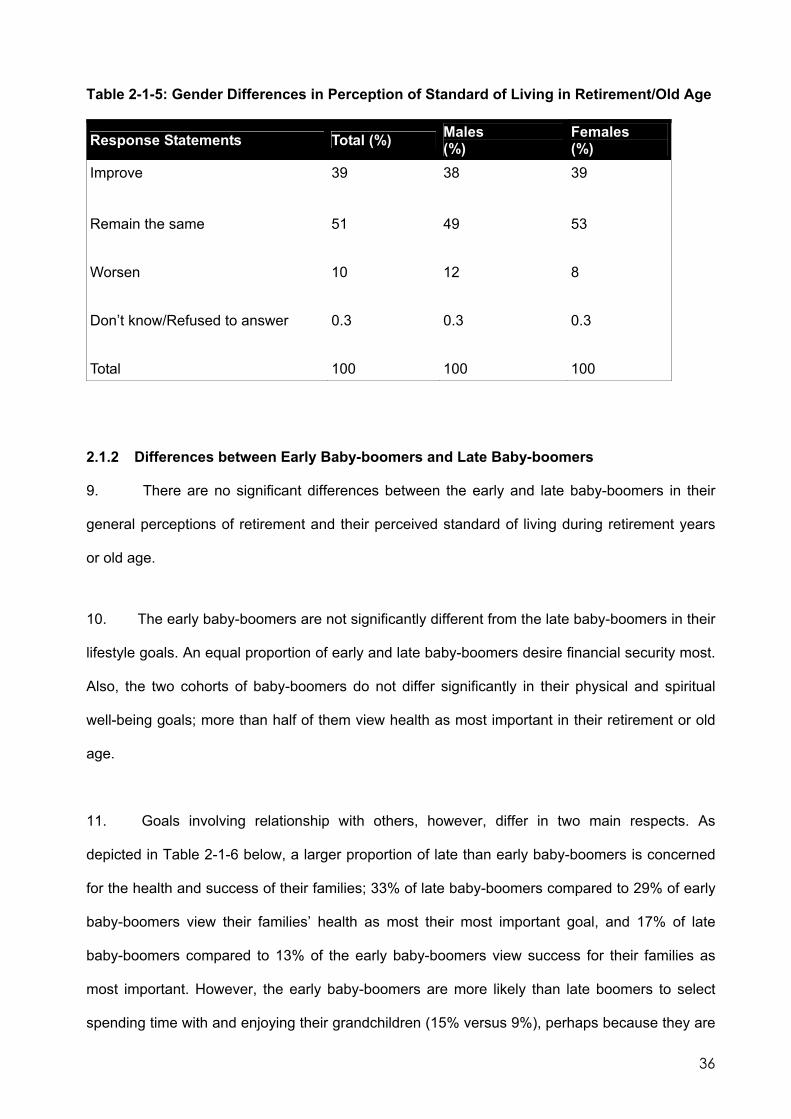
Table 2-1-5: Gender Differences in Perception of Standard of Living in Retirement/Old Age
Response Statements Total (%) Males (%)
Females (%)
Improve 39 38 39
Remain the same 51 49 53 Worsen 10 12 8 Don’t know/Refused to answer 0.3 0.3 0.3 Total 100 100 100
2.1.2 Differences between Early Baby-boomers and Late Baby-boomers
9. There are no significant differences between the early and late baby-boomers in their
general perceptions of retirement and their perceived standard of living during retirement years
or old age.
10. The early baby-boomers are not significantly different from the late baby-boomers in their
lifestyle goals. An equal proportion of early and late baby-boomers desire financial security most.
Also, the two cohorts of baby-boomers do not differ significantly in their physical and spiritual
well-being goals; more than half of them view health as most important in their retirement or old
age.
11. Goals involving relationship with others, however, differ in two main respects. As
depicted in Table 2-1-6 below, a larger proportion of late than early baby-boomers is concerned
for the health and success of their families; 33% of late baby-boomers compared to 29% of early
baby-boomers view their families’ health as most their most important goal, and 17% of late
baby-boomers compared to 13% of the early baby-boomers view success for their families as
most important. However, the early baby-boomers are more likely than late boomers to select
spending time with and enjoying their grandchildren (15% versus 9%), perhaps because they are
36
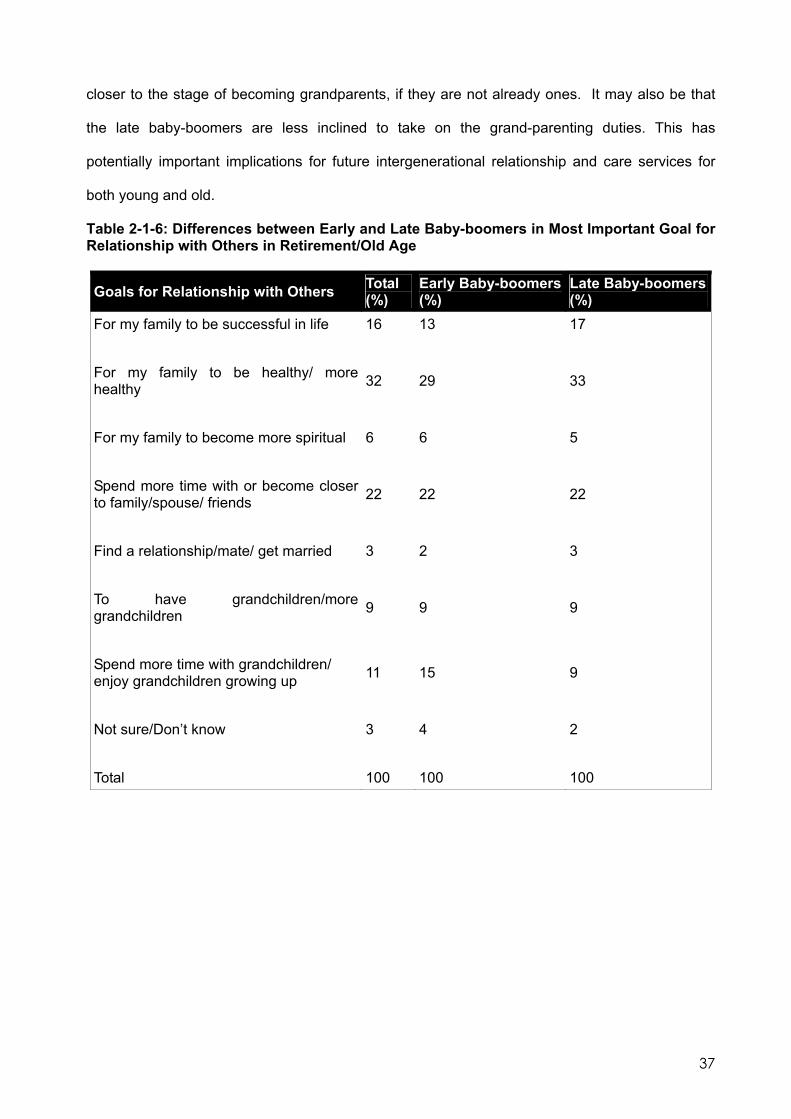
closer to the stage of becoming grandparents, if they are not already ones. It may also be that
the late baby-boomers are less inclined to take on the grand-parenting duties. This has
potentially important implications for future intergenerational relationship and care services for
both young and old.
Table 2-1-6: Differences between Early and Late Baby-boomers in Most Important Goal for Relationship with Others in Retirement/Old Age
Goals for Relationship with Others Total (%)
Early Baby-boomers (%)
Late Baby-boomers(%)
For my family to be successful in life 16 13 17 For my family to be healthy/ more healthy 32 29 33
For my family to become more spiritual 6 6 5 Spend more time with or become closer to family/spouse/ friends 22 22 22
Find a relationship/mate/ get married 3 2 3 To have grandchildren/more grandchildren 9 9 9
Spend more time with grandchildren/ enjoy grandchildren growing up 11 15 9
Not sure/Don’t know 3 4 2 Total 100 100 100
37

2.1.3 Differences between Baby-boomers with Different Levels of Education
12. Education has always been a determinant in many aspects of sociological perceptions
and trends. Likewise, perceptions and aspirations toward retirement and old age in this study are
significantly influenced by the educational levels attained by the baby-boomers. The findings
show that half the baby-boomers with polytechnic and higher education levels perceive
improvement in their standard of living during retirement, whereas a similar proportion of
relatively lower educated baby-boomers (those who completed up to upper secondary education)
expect it to remain unchanged.
13. The general perception towards retirement of baby-boomers of the various educational
levels differs significantly in the following aspects. As shown in Table 2-1-7 below, fewer diploma-
holder baby-boomers (75%), as compared to those with lower educational levels (77% - 91%)
and higher educational levels (86%) perceive retirement as increased concern towards one’s
health. In contrast, significantly more of this group of baby-boomers (24%) than baby-boomers
with lower educational qualifications (16% - 21%) and higher educational qualifications (14%)
perceive retirement as boredom.
14. On the other hand, Table 2-1-7 also shows that significantly more university graduates
perceive retirement as having time for personal hobbies (79%) and socializing (69%) whereas
only 59% and 58% of baby-boomers with no formal qualifications respectively, perceive likewise.
This may be explained by the latter having to continue working and/or having little time and
savings from work to pursue their hobbies and personal interests even when they retire.
38

Table 2-1-7: Differences between Baby-boomers with Different Levels of Education in General Perceptions of Retirement/Old Age*
No formal qualification (%)
Response Statements Total (%) Primary (%)
Lower Secondary (%)
Secondary (%)
Upper Secondary (%)
Polytechnic diploma/Other professional qualifications (%)
University (%)
Retirement/old age means increased isolation from society. 13 15 12 12 9 19 8
Retirement/old age means time to pursue my interests and hobbies. 70 59 75 66 68 63 79
12
73
Retirement/old age means fewer responsibilities. 32 30 33 24 34 35 34 37
Retirement/old age means boredom 19 16 17 17 21 20 24 14
Retirement/old age means spending more time with my family. 77 82 81 81 76 69 67 80
Retirement/old age means I am no longer useful. 11 13 12 9 13 10 17 6
Retirement means more time for socializing. 63 58 64 65 64 59 55 69
Retirement/old age means increased concern and attention to health. 86 83 91 91 86 77 75 86
* Multiple response
39

15. Baby-boomers with different educational levels also differ significantly in some of their
lifestyle goals for retirement. Significantly fewer of the more highly educated baby-boomers –
diploma and degree holders (18 to 24%) view financial security or being debt-free as most
important in retirement or old age than those with relatively lower educational qualifications (33 to
37%). In addition, amongst the baby-boomers, only 5% of university graduates compared to 11%
and 14% of baby-boomers with primary to lower secondary education respectively, desire for
more or better material wealth in their retirement years (Refer to Table 2-1-8). In line with this
pattern, significantly more diploma and degree-holder baby-boomers (23 to 27%) aspire to travel
for leisure in their retirement years. This is double that of baby-boomers with no formal
qualifications to secondary school education (11 to 17%).
16. Selected physical and spiritual well-being life goals also differ significantly between these
baby-boomers of different levels of education. Amongst them, significantly fewer diploma and
degree holders (47 to 48%) than those with no formal and with primary school education (65%
and 67% respectively), perceive good health as their most important physical goal in retirement
or old age. On the other hand, a significantly larger proportion of diploma and degree holders,
18% and 25% respectively desire to be more successful and accomplished in their retirement
years, as compared to baby-boomers with no or lower educational qualifications (3 to 8%) (Refer
to Table 2-1-9).
17. Goals regarding relationship with others vary according to level of education attained by
the baby-boomers. Amongst the tertiary graduates, about 21% of these baby-boomers desire for
their families to be successful in life, as compared to 12% of those without formal education or
primary school education. On the contrary, baby-boomers completing up to upper secondary (33
to 39%) education, as compared to only a quarter of tertiary graduates wanted most for their
families to be in good health. In addition, 16 to 23% of the lower educated baby-boomers as
compared to a significantly smaller percentage of baby-boomers with secondary education and
above (5 to 8%), aspire to spend more time with their grandchildren in their retirement years or
old age (Refer to Table 2-1-10).
40

Table 2-1-8: Differences between Baby-boomers with Different Levels of Education in Important Lifestyle Goals in Retirement/Old Age
Lifestyle Goals Total (%)
No formal qualification (%)
Primary (%)
Lower Secondary (%)
Secondary (%)
Upper Secondary (%)
Polytechnic diploma/Other professional qualifications (%)
University (%)
To be financially secure/To pay off debt 32 35 37 33 37 34 24 18
To learn more/To pursue a course 7 5 3 6 8 7 9 14
To travel more for leisure. 17 12 12 11 17 19 23 27
To have more/better material things (which could not afford earlier) 9 13 11 14 6 5 10 5
To pursue a hobby or interest 17 13 19 19 15 17 14 20
To do volunteer work 12 14 13 12 10 9 16 13
Not sure/Don’t know 6 9 6 5 6 9 4 2
Total 100 100 100 100 100 100 100 100
41
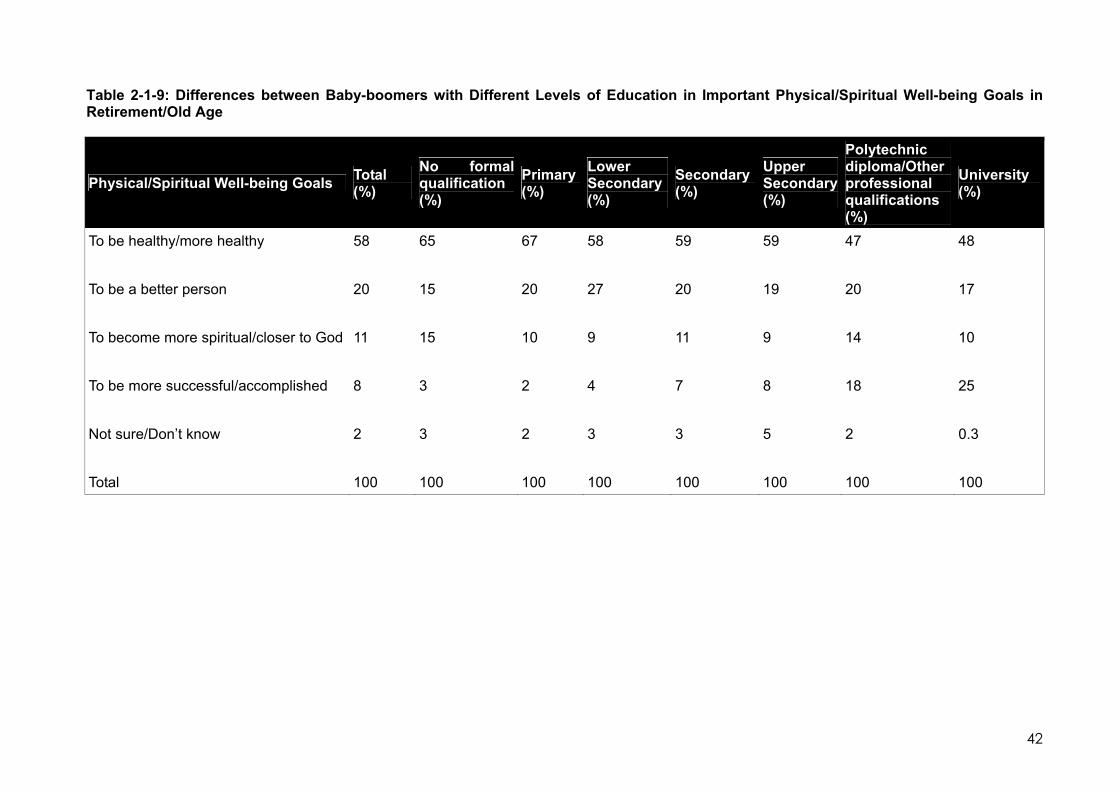
Table 2-1-9: Differences between Baby-boomers with Different Levels of Education in Important Physical/Spiritual Well-being Goals in Retirement/Old Age
Physical/Spiritual Well-being Goals Total (%)
No formal qualification (%)
Primary (%)
Lower Secondary (%)
Secondary (%)
Upper Secondary (%)
Polytechnic diploma/Other professional qualifications (%)
University (%)
To be healthy/more healthy 58 65 67 58 59 59 47 48
To be a better person 20 15 20 27 20 19 20 17
To become more spiritual/closer to God 11 15 10 9 11 9 14 10
To be more successful/accomplished 8 3 2 4 7 8 18 25
Not sure/Don’t know 2 3 2 3 3 5 2 0.3
Total 100 100 100 100 100 100 100 100
42

Table 2-1-10: Differences between Baby-boomers with Different Levels of Education in Important Goals for Relationship with Others in Retirement/Old Age
Goals for Relationship with Others Total (%)
No formal qualification (%)
Primary (%)
Lower Secondary (%)
Secondary (%)
Upper Secondary (%)
Polytechnic diploma/Other professional qualifications (%)
University (%)
For my family to be successful in life 16 12 12 13 17 18 20 22
For my family to be healthy/more healthy 32 27 36 33 33 39 23 27
For my family to become more spiritual 6 6 4 5 6 5 8 5
Spend more time with or become closer to family/spouse/friends 22 20 19 19 23 19 26 28
Find a relationship/mate/get married 3 1 2 2 4 5 3 3
To have grandchildren/more grandchildren 9 11 9 10 7 5 10 9
Spend more time with grandchildren/ enjoy grandchildren growing up 11 23 15 16 8 5 7 6
Not sure/Don’t know 3 2 3 3 3 5 3 1
Total 100 100 100 100 100 100 100 100
43

2.2 Employment Perceptions/Expectations of Economically-active Baby-boomers
2.2.1 Gender Differences 18. As mentioned in Section 1.1, more than 70% of the baby-boomers surveyed were
employed at the time of the study while another 1% was unemployed and looking for work.
Together, these are the economically active baby-boomers who are the subject of this section.
As shown earlier (refer to Table 1-1-3), there were significant gender differences in economic
activity status at the time of study with more than nine out of ten of the males being economically
active as compared to only 50% of the females.
19. Responses to the question of age at retirement show the following: just over half (55%)
have a definite age by which they expect to retire while about one third (34%) want to work until
they are no longer able to and 11% would have to work until they are no longer able. (Refer to
Table 2-2-1). The modal age group at which economically active baby-boomers expect to retire
(among those who gave a specific age) is 60-64 years old. The median expected retirement age
is 62, which is also the current legal retirement age in Singapore.
20. More male baby-boomers (17%) compared to females (14%) expect to retire at age 65 or
older. (Refer to Table 2-2-1) More females, on the other hand, expect to retire before age 60. A
slightly higher proportion of females than males want to work till they can no longer do so (37%
compared to 33%). There is no difference in the proportions who feel they will have to continue
employment for as long as possible, presumably for financial reasons.
44

Table 2-2-1: Gender Differences in Expectations of Retirement and Retirement Age
Response Statements Total (%) Males (%) Females (%)
<60 10 6 16 60-64 29 33 23
Expected retirement age (years) >=65 16 17 14 Want to continue working as long as able
34 33 37
Have to continue working as long as able
11 11 11
Total 100 100 100
21. As regards their ideal post-retirement employment, a large proportion (42%) prefers to
retire completely and not work at all. (Refer to Table 2-2-2 below). Part-time work is also strongly
preferred over full-time work and self-employment (36% compared to 13% and 9% respectively).
22. In this regard, it is worth noting that the concept of gradual retirement, i.e. moving
gradually from full-time to part-time work before retiring completely, appears to have taken hold
only among a minority of the baby-boomers. (Refer to Table 2-2-2) Only one third of the baby-
boomers in full-time employment at the time of study prefer part-time employment after
retirement whereas nearly half (45%) would ideally not work at all. Another 13% want to
continue to work full-time (13%) while 9% prefer to go into self-employment (9%). The majority
of part-timers however prefer to continue on the same basis.
45
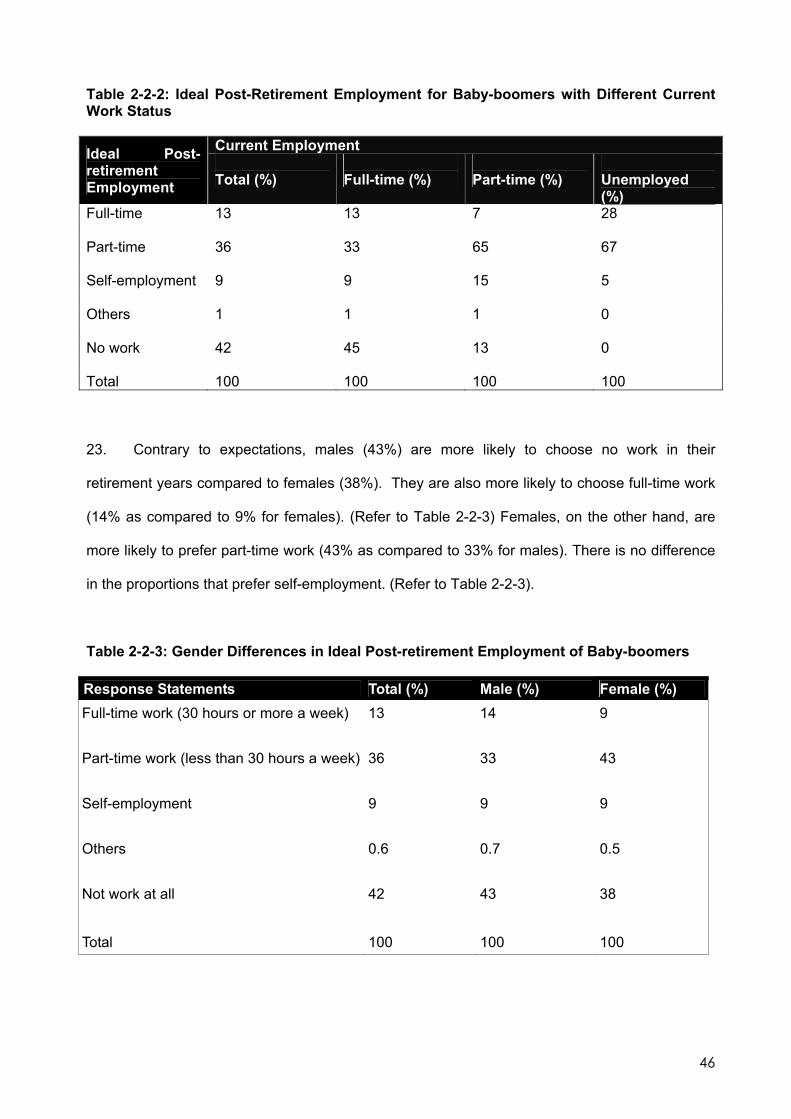
Table 2-2-2: Ideal Post-Retirement Employment for Baby-boomers with Different Current Work Status
Current Employment Ideal Post-retirement Employment
Total (%)
Full-time (%)
Part-time (%)
Unemployed (%)
Full-time 13 13 7 28 Part-time 36 33 65 67 Self-employment 9 9 15 5 Others 1 1 1 0 No work 42 45 13 0 Total 100 100 100 100 23. Contrary to expectations, males (43%) are more likely to choose no work in their
retirement years compared to females (38%). They are also more likely to choose full-time work
(14% as compared to 9% for females). (Refer to Table 2-2-3) Females, on the other hand, are
more likely to prefer part-time work (43% as compared to 33% for males). There is no difference
in the proportions that prefer self-employment. (Refer to Table 2-2-3).
Table 2-2-3: Gender Differences in Ideal Post-retirement Employment of Baby-boomers
Response Statements Total (%) Male (%) Female (%) Full-time work (30 hours or more a week) 13 14 9
Part-time work (less than 30 hours a week) 36 33 43
Self-employment 9 9 9
Others 0.6 0.7 0.5
Not work at all 42 43 38 Total 100 100 100
46
24. The most important reason for post-retirement employment is to receive an income
(32%). This is followed by a desire to keep active mentally and physically (22%) and to have
something meaningful to do (12%). Other reasons, such as staying connected, having a sense
of self-worth, escaping boredom and receiving health benefits are cited by not more than 10%.
(Refer to Table 2-2-4). There is no significant gender differences in the reasons cited.
47
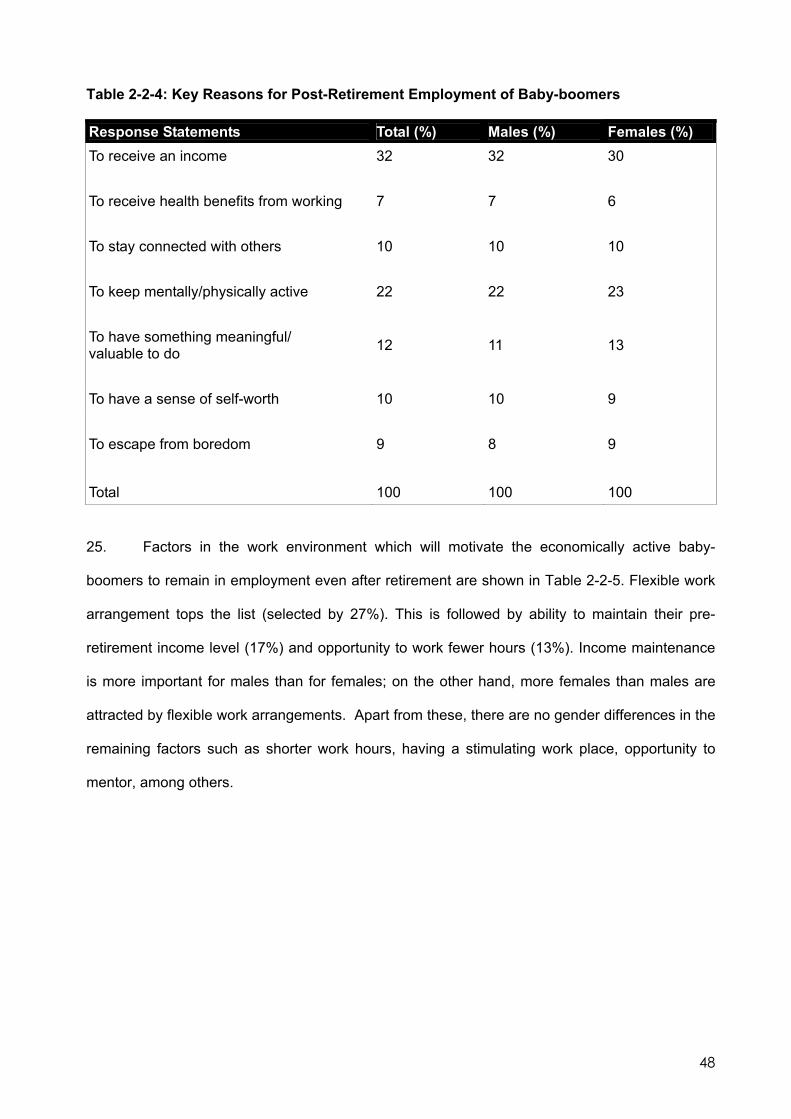
Table 2-2-4: Key Reasons for Post-Retirement Employment of Baby-boomers
Response Statements Total (%) Males (%) Females (%) To receive an income 32 32 30
To receive health benefits from working 7 7 6
To stay connected with others 10 10 10
To keep mentally/physically active 22 22 23
To have something meaningful/ valuable to do 12 11 13
To have a sense of self-worth 10 10 9
To escape from boredom 9 8 9 Total 100 100 100
25. Factors in the work environment which will motivate the economically active baby-
boomers to remain in employment even after retirement are shown in Table 2-2-5. Flexible work
arrangement tops the list (selected by 27%). This is followed by ability to maintain their pre-
retirement income level (17%) and opportunity to work fewer hours (13%). Income maintenance
is more important for males than for females; on the other hand, more females than males are
attracted by flexible work arrangements. Apart from these, there are no gender differences in the
remaining factors such as shorter work hours, having a stimulating work place, opportunity to
mentor, among others.
48

Table 2-2-5: Gender Differences in the Most Important Workplace Factor for Post-retirement Employment of Baby-boomers Workplace Factors Total (%) Male (%) Female (%) Work fewer hours 13 13 13
Flexible work arrangements 27 25 28
Ability to continue earning the same income 17 18 14
Ability to guide and teach younger workers 7 7 6
Able to learn new skills 6 6 6
Ability to undertake less physically-demanding work 10 10 9
Enjoyable and stimulating workplace 11 10 12
New kinds of work 4 4 5
Ability to continue in the same job/position 7 7 7 Full-time position 0 0.1 0 Total 100 100 100
26. Despite a sizeable proportion of baby-boomers expressing a desire to continue working
after retirement, they too have their own concerns about post-retirement employment. Some of
the concerns are primarily skills obsolescence (33%), followed by skills mismatch or under-
utilisation of their skills (30%), not getting a worthwhile pay (29%) and lack of information about
job opportunities (27%). There is significantly less concern about being supervised by a younger
person (19%). There are no marked gender differences except for small statistically significant
gender differences in two aspects: more females (32%) than males (28%) are concerned about
not finding a job that pays enough to make it worth her while and about finding a job that will
make good use of her skills (33% of females versus 28% of males) (Refer to Table 2-2-6).
49

Table 2-2-6: Gender differences in Concerns about Post-retirement Employment*
Response Statements Total (%) Male (%) Female (%) My skills will not be in demand in the labour market. 33 33 33
I will not like to get orders from a younger work supervisor 19 20 17
I will have difficulty finding a job that makes good use of my skills. 30 28 33
The jobs that I get will not pay enough to be worth my while. 29 28 32
I will not have enough information about job opportunities. 27 27 29
* Multiple response
2.2.2 Differences between Early Baby-boomers and Late Baby-boomers
27. The findings show that proportionately more late baby-boomers want to retire before
age 60 (11%) as compared to the early baby-boomers (5%). (Refer to Table 2-2-7). Also, fewer
of these late baby-boomers (9% versus 14% in early baby-boomers) feel the necessity to
continue employment for as long as possible. These differences could be due to differences in
educational attainment and thus prospects for retirement income security between the cohorts.
With regard to the ideal form of post-retirement employment, however, there are no significant
cohort differences.
50
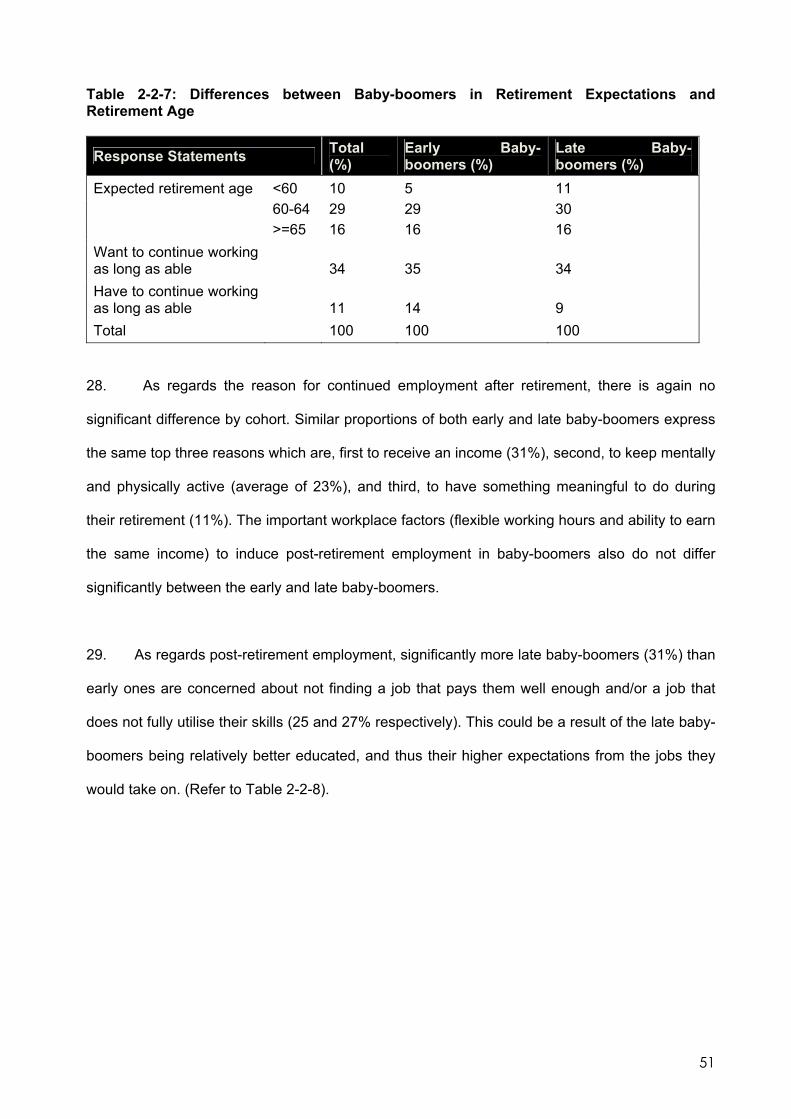
Table 2-2-7: Differences between Baby-boomers in Retirement Expectations and Retirement Age
Response Statements Total (%)
Early Baby-boomers (%)
Late Baby-boomers (%)
<60 10 5 11 60-64 29 29 30
Expected retirement age
>=65 16 16 16 Want to continue working as long as able
34
35
34
Have to continue working as long as able
11
14
9
Total 100 100 100
28. As regards the reason for continued employment after retirement, there is again no
significant difference by cohort. Similar proportions of both early and late baby-boomers express
the same top three reasons which are, first to receive an income (31%), second, to keep mentally
and physically active (average of 23%), and third, to have something meaningful to do during
their retirement (11%). The important workplace factors (flexible working hours and ability to earn
the same income) to induce post-retirement employment in baby-boomers also do not differ
significantly between the early and late baby-boomers.
29. As regards post-retirement employment, significantly more late baby-boomers (31%) than
early ones are concerned about not finding a job that pays them well enough and/or a job that
does not fully utilise their skills (25 and 27% respectively). This could be a result of the late baby-
boomers being relatively better educated, and thus their higher expectations from the jobs they
would take on. (Refer to Table 2-2-8).
51

Table 2-2-8: Differences between Early and Late Baby-boomers in Concerns about Post-retirement Employment*
Response Statements Total (%)
Early Baby-boomers (%)
Late Baby-boomers (%)
My skills will not be in demand in the labour market. 33 32 33
I will not like to get orders from a younger work supervisor. 19 19 19
I will have difficulty finding a job that makes good use of my skills. 30 27 31
The jobs that I get will not pay enough to be worth my while. 30 25 31
I will not have enough information about job opportunities. 27 26 28
* Multiple response.
2.2.3 Differences between Baby-boomers with Different Levels of Education
30. Baby-boomers with primary or no formal qualifications are the most likely to feel
compelled to forego retirement (20 and 15% respectively). The large proportion of baby-boomers
with no formal qualifications (50%) who indicate they want to continue working for as long as
possible could also be concealing a number of such baby-boomers that have to work for as long
as possible. On the other hand, a sizeable proportion of the university-educated expect to retire
before age 65 (47%) (Refer to Table 2-2-9). This is despite the fact that they are more likely to
possess the skills for continued employment. In view of the looming labour shortage as the
baby-boomers retire, more effort may be needed to persuade this group to prolong their
engagement in the work force.
31. There are significant differences between baby-boomers with various educational levels
and their ideal post-retirement employment. As shown in Table 2-2-10 (below), baby-boomers
with no formal qualifications are the most likely to prefer part-time work (51% versus 29 to 41% of
52
baby-boomers with other educational qualifications). Moreover, they are the least likely to want
no work at all in their retirement years (28% versus 37 to 54% of baby-boomers with other
educational qualifications). In comparison, university graduates are more likely to consider self-
employment as ideal in their retirement years or old age.
53

Table 2-2-9: Differences in Retirement Expectations and Retirement Age between Baby-boomers with Different Levels of Education
Response Statements Total (%)
No formal qualification (%)
Primary (%)
Lower secondary (%)
Secondary (%)
Upper secondary (%)
Polytechnic Diploma/Other professional qualifications (%)
University (%)
Expected <60 10 7 9 12 10 6 8 10retirement age 60-64 29 16 26 31 28 31 29 37 >=65 16 11 13 22 16 15 15 16Want to continue working as long as able
34 51 32 26 34 35 41 32
Have to continue working as long as able
11 15 20 8 11 12 8 4
Total 100 100 100 100 100 100 100 100
54

Table 2-2-10: Differences between Baby-boomers with Different Levels of Education in Ideal Post-retirement Employment
Response Statements Total (%)
No formal qualification (%)
Primary (%)
Lower Secondary (%)
Secondary (%)
Upper Secondary (%)
Polytechnic diploma/Other professional qualifications (%)
University (%)
Full-time work (30 hours or more a week) 13 14 16 10 12 15 13 9
Part-time work (less than 30 hours a week) 36 51 35 29 39 41 36 33
Self-employment 9 6 7 6 10 7 8 16
Others 0.6 1 0 0.3 1 0 0.8 1
Not work at all 42 28 42 54 38 37 42 41
Total 100 100 100 100 100 100 100 100
55
32. Baby-boomers with no formal qualifications are also significantly more likely to
emphasise income consideration (51%) as the most important reason for post-retirement
employment; this proportion declines with educational attainment to 14% among the university-
educated (Table 2-2-11). The latter, on the other hand, are more likely to emphasise keeping
active, doing something meaningful and having a sense of self-worth as motivations for working
even after retirement age.
33. Flexible work arrangement is a key work place factor for maintaining employment during
retirement, this being the top choice for baby-boomers of all educational levels. However, while
shorter working hours ranks higher for primary and lower educated baby-boomers, this is
replaced by income continuity for the other educational groups. For the university-educated,
having a stimulating work place and ability to guide/mentor younger workers are more important
than income continuity or work hours (Refer to Table 2-2-12).
56

Table 2-2-11: Differences between Baby-boomers of Different Levels of Education in the Most Important Reason for Post-retirement Employment
Response Statements Total (%)
No formal qualification (%)
Primary (%)
Lower secondary (%)
Secondary (%)
Upper secondary (%)
Polytechnic diploma/Other professional qualifications (%)
University (%)
To receive an income 32 51 42 34 33 31 26 14
To receive health benefits 7 8 8 8 7 8 5 3
To stay connected with others 10 4 10 10 9 9 14 11
To keep mentally/ physically active 22 23 19 24 20 22 24 28
To have something meaningful/valuable to do 12 5 9 10 12 11 11 20
To have a sense of self-worth 10 2 6 6 10 12 9 18
To escape from boredom 9 7 6 9 9 8 12 7
Total 100 100 100 100 100 100 100 100
57

Table 2-2-12: Differences between Baby-boomers with Different Levels of Education in the Most Important Workplace Factor for Post-retirement Employment
Response Statements Total (%)
No formal qualification (%)
Primary (%)
Lower Secondary (%)
Secondary (%)
Upper Secondary (%)
Polytechnic diploma/Other professional qualifications
University (%)
Work fewer hours 13 20 21 12 13 7 12 8
Flexible work arrangements 27 28 22 28 30 27 23 26
Ability to continue earning the same income 17 20 18 18 18 21 16 8
Ability to guide and teach younger workers 7 1 4 2 4 7 9 17
Able to learn new skills 6 3 6 4 7 7 7 5
Ability to undertake less physically-demanding work 10 14 14 9 10 7 10 4
Enjoyable and stimulating workplace 11 3 8 12 8 7 11 20
New kinds of work 4 4 3 8 3 7 5 2
Ability to continue in the same job/position 7 8 4 6 7 9 8 9
Total 100 100 100 100 100 100 100 100
58

34. The problems perceived by baby-boomers during post-retirement employment
also differ significantly by the level of education attained. Baby-boomers with no formal
qualifications are significantly more concerned about not receiving an income worth
working for (43% versus average of 29% for the other educational groups) as well as
lack of information on job opportunities as compared to the other groups (37% versus
average of 26% for the other educational groups). More of the relatively lower educated
baby-boomers (primary and lower secondary) worry about lacking the skills in demand/
(47%) whereas more upper secondary and university-educated baby-boomers (32%)
perceive difficulty in finding a job that would utilise their skills effectively.
59

2.3 Perceptions of Financial Security During Retirement/ Old Age 2.3.1 Gender Differences
35. Overall, the modal household income baby-boomers expect to have during old
age/retirement is in the category of $500-599 per month, with 32% expecting to have this amount
(see Chart 2-3-1). This is followed very closely by the $1000-1999 category (28 %). The
remaining 40% are almost equally divided among those who expect to have less than $500 (20%,
including 4% who expected to have no income) and those who expect to have $2,000 or more
monthly (19%). There is little gender difference, with females being slightly more modest in their
income expectations than males.
Chart 2-3-1: Gender Differences in Expected Monthly Household Income During Retirement/Old Age
5
4
4
13
19
16
31
33
32
30
26
28
11
9
10
9
8
9
0% 20% 40% 60% 80% 100%
Males
Females
Total
No income No f ixed income <500 500-999 1000-1999 2000-2999 3000+
60

36. Family members (children/siblings) are the most important expected source of
household income in retirement/ old age (32%). This is followed by own income from work (21%)
and pension/CPF/retirement fund (20%). Asset income follows in fourth place (15%). Men are
more likely to report their own earnings while women are more likely to report children/siblings as
sources of income. Not surprisingly, more women expect to rely on spouse’s earnings (see Chart
2-3-2).
Chart 2-3-2: Gender Differences in Major Source of Household Income During Retirement/Old Age
21
30
11
9
1
17
20
22
18
15
15
15
32
29
36
3
2
3
0% 20% 40% 60% 80% 100%
Total
Males
Females
Ow n earnings Spouse's earnings Pension/ CPF Asset income Children/ siblings Others
37. There is little gender difference as regards baby-boomers’ perception of financial
adequacy in old age/retirement. Overall, 38% expect to have more than enough money (with
some money left over) while 47% expect that their income would be just adequate. (Refer to
Chart 2-3-3). Only about 15% expect to have some or much difficulty.
61

Chart 2-3-3: Gender Differences in Perception of Income Adequacy During Retirement/ Old Age
38
39
37
47
45
49
13
13
13
3
4
2
0% 20% 40% 60% 80% 100%
Total
Males
Females
More than enough Just enough Some diff iculty Much diff iculty
2.3.2 Differences between Early and Late Baby-boomers
38. There are some generational differences in the level of household income expected. Late
baby-boomers generally expect to have more income in retirement/ old age than the early baby-
boomers. (Refer to Chart 2-3-4) This is regardless of gender.
62
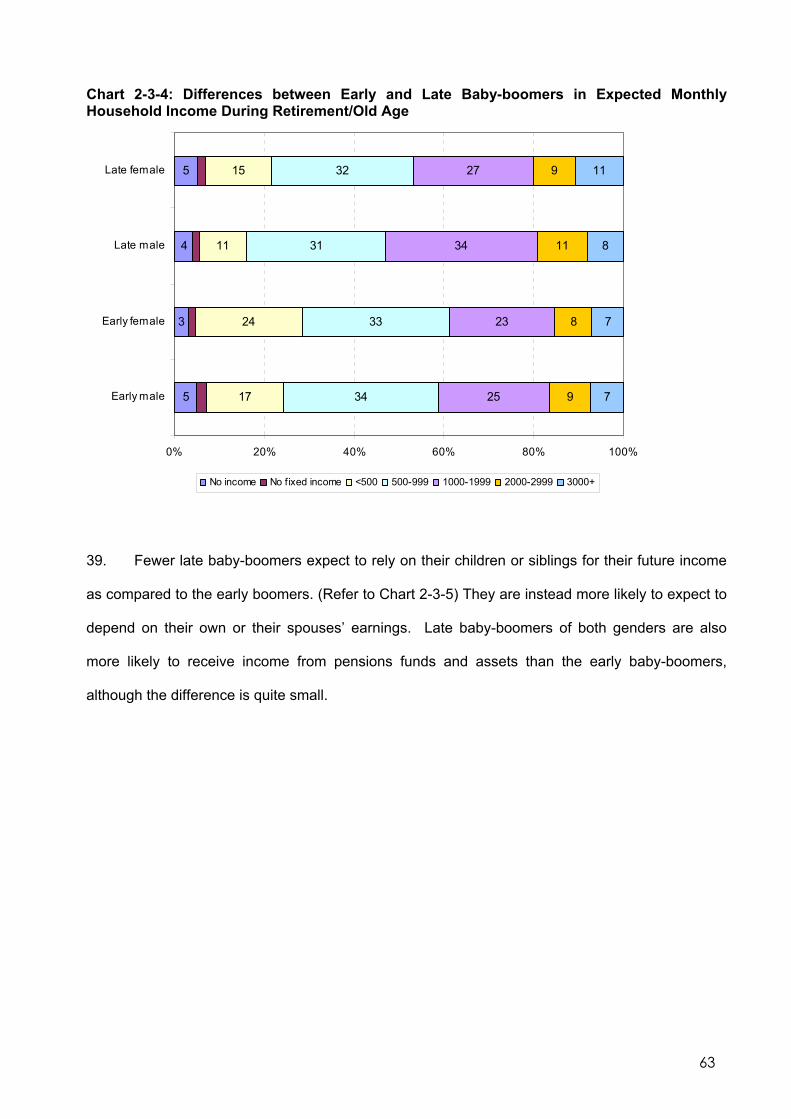
Chart 2-3-4: Differences between Early and Late Baby-boomers in Expected Monthly Household Income During Retirement/Old Age
5
3
4
5
17
24
11
15
34
33
31
32
25
23
34
27
9
8
11
9
7
7
8
11
0% 20% 40% 60% 80% 100%
Early male
Early female
Late male
Late female
No income No fixed income <500 500-999 1000-1999 2000-2999 3000+
39. Fewer late baby-boomers expect to rely on their children or siblings for their future income
as compared to the early boomers. (Refer to Chart 2-3-5) They are instead more likely to expect to
depend on their own or their spouses’ earnings. Late baby-boomers of both genders are also
more likely to receive income from pensions funds and assets than the early baby-boomers,
although the difference is quite small.
63

Chart 2-3-5: Differences between Early and Late Baby-boomers in Expected Source of Household Income During Retirement/Old Age
26
11
31
15
2
14
16
22
16
24
19
14
15
14
16
33
42
29
30
3
3
2
3
0% 20% 40% 60% 80% 100%
Early males
Early females
Late males
Late females
Ow n earnings Spouse's earnings Pension/ CPF Asset income Children/ siblings Others
2.3.3 Differences between Baby Boomers with Different Levels of Education
40. As to be expected, there is a strong correlation between educational attainment and
expected retirement income. The majority of baby-boomers with below secondary education
expect to receive less than $1000 monthly, while the majority of those with university degrees
expected to have $2000 or more in their retirement/old age. (Refer to Chart 2-3-6)
64

Chart 2-3-6: Educational differences in Expected Monthly Household Income During Retirement/Old Age
3
5
6
6
8
2
29
25
26
12
8
5
2
35
44
40
35
28
21
8
25
20
22
31
32
42
23
4
4
3
9
13
16
24
2
2
5
11
12
41
0% 20% 40% 60% 80% 100%
No Qual
Pri
Low Sec
Sec
Upp sec
Poly/diploma
University
No income No f ixed income <500 500-999 1000-1999 2000-2999 3000+
41. Reliance on children/siblings also declines with better educational attainment. While about
half of the baby-boomers with below secondary qualification cited their children and siblings as
their expected source of income, this proportion declines drastically to about half this proportion
among those with secondary and upper secondary qualification and to only 4% among the
university educated. The reverse is true with regard to CPF and pension funds. The proportions
of baby-boomers who expect to receive incomes from their CPF and pension funds decline sharply
from 46% among the university educated to about 10% or lower among those with less than
secondary qualifications. (Refer to Chart 2-3-7) There is also a sharp divide between the
secondary and better educated and those with below secondary qualification with regard to own
earnings as a source of income in old age/retirement.
65

Chart 2-3-7: Educational differences in Expected Source of Household Income During Retirement/Old Age
14
17
15
23
26
25
25
9
11
9
10
11
6
5
11
7
10
19
19
39
46
12
14
16
16
18
15
15
52
50
50
28
23
12
4
2
2
1
3
3
2
5
0% 20% 40% 60% 80% 100%
No Qual
Pri
Low sec
Sec
Upp Sec
Poly/diploma
University
Ow n earnings Spouse's earnings Pension/ CPF Asset income Children/ siblings Others
42. As shown in Chart 2-3-8 below, primary-educated baby-boomers are the least optimistic
about their income adequacy in old age/retirement while the university educated are the most
optimistic. Nevertheless, it should be noted that the overall mood among the baby-boomers
studied is one of optimism, with the majority expecting to have adequate financial means in old
age. However, the perception of adequacy must be related to the standard of living they expect
to have (which is not studied).
66
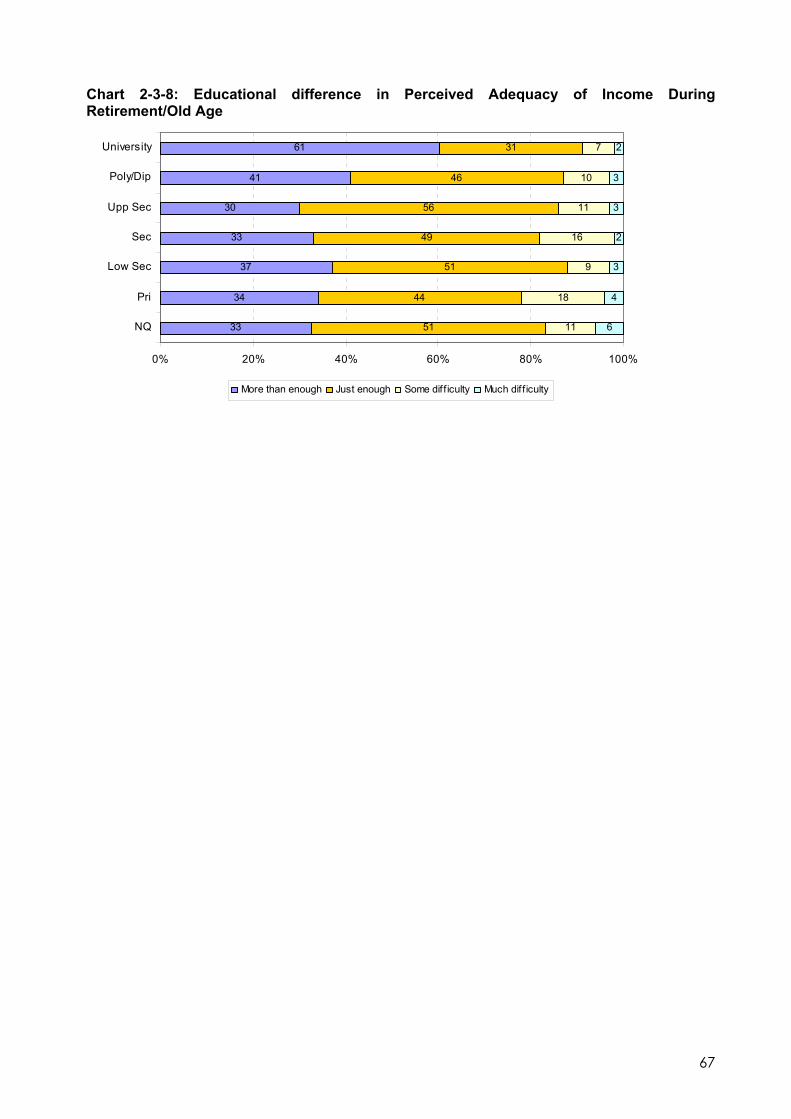
Chart 2-3-8: Educational difference in Perceived Adequacy of Income During Retirement/Old Age
33
34
37
33
30
41
61
51
44
51
49
56
46
31
11
18
9
16
11
10
7
6
4
3
2
3
3
2
0% 20% 40% 60% 80% 100%
NQ
Pri
Low Sec
Sec
Upp Sec
Poly/Dip
University
More than enough Just enough Some dif f iculty Much dif f iculty
67
2.4 Living Arrangements and Perceptions of Social Support in Retirement/ Old Age
43. In the Singapore context, intergenerational cohesion is deemed important for achieving
successful ageing. Intergenerational cohesion is believed to be promoted through interaction
between the old and young, and is thus best fostered in a family context. Application of this
concept is crucial to the baby-boomer generation as these individuals are entering old age or
retirement. In order to encourage intergenerational cohesion and to plan for retirement/ old age
support of these baby-boomers, it is first imperative to understand their perceptions of retirement
living arrangements and social support. In addition, any significant perceptual differences between
gender, cohort of baby-boomers and differences in relation to their educational level are identified.
These differences indicate differing needs which then shape policies and resource allocation to
adequately meet these needs.
2.4.1 Gender Differences
44. Findings from the survey demonstrate that majority of the baby-boomers (93%) expect to
continue living in Singapore. Most of them (75%) want to live in their own house independently or
with their spouse. About 37% expect to live near/ with at least one of their children with significantly
higher number of females expressing this sentiment than males. The finding suggests that elderly
women are potentially more dependent on others for support during old age. One-fourth would not
mind staying in a retirement village and 14% would not mind staying at a nursing home. (Table 2-4-
1)
45. One-third of the baby-boomers surveyed intend to move out of their current property. Of
these, 31% intend to do so to move in with their children and only 4% to move to a retirement
community. (Table 2-4-2) The most frequently selected reason, however, is to downgrade to a
smaller property which is easier to upkeep (35%). Whatever the reasons, these intentions to move,
if realised, will have important implications for future demand and supply of housing, particularly
public housing where the majority of Singaporeans live.
68

Table 2-4-1: Gender Differences in Perceptions of Living Arrangements in Retirement/ Old Age
Response Statements Total (%) Male (%) Female (%) I expect to continue living in Singapore. 93 92 94
*I expect to be living with my spouse for most of my retirement years/old age. 75 77 73
*I expect to live near at least one of my children. 37 35 40
*I expect to live with one of my children. 37 34 41
I would not mind staying in a nursing home. 14 15 13
I would not mind staying in a retirement village. 25 25 25
I want to maintain my own household independently/ with my spouse. 77 78 77
I intend to move out of my current property. 34 33 34 * indicates significance between genders in their response
Table 2-4-2: Gender Differences in Reasons for Moving Out of Current Property Response Statements Total (%) Male (%) Female (%) Downgrade to a smaller property which is easier to upkeep 35 37 33
To realize financial value of property, for spending in retirement/old age 18 17 18
To move in with children 31 30 33
To move to a community where there are retirees like me 4 4 4
To move overseas 7 8 6
46. Expectations of support from family members are shown in Table 2-4-3a. As expected, a
significantly larger proportion of females (71%) expect their spouse to support them in retirement
compared to males (62%). In addition, 77% of the women expect their children to support them
69
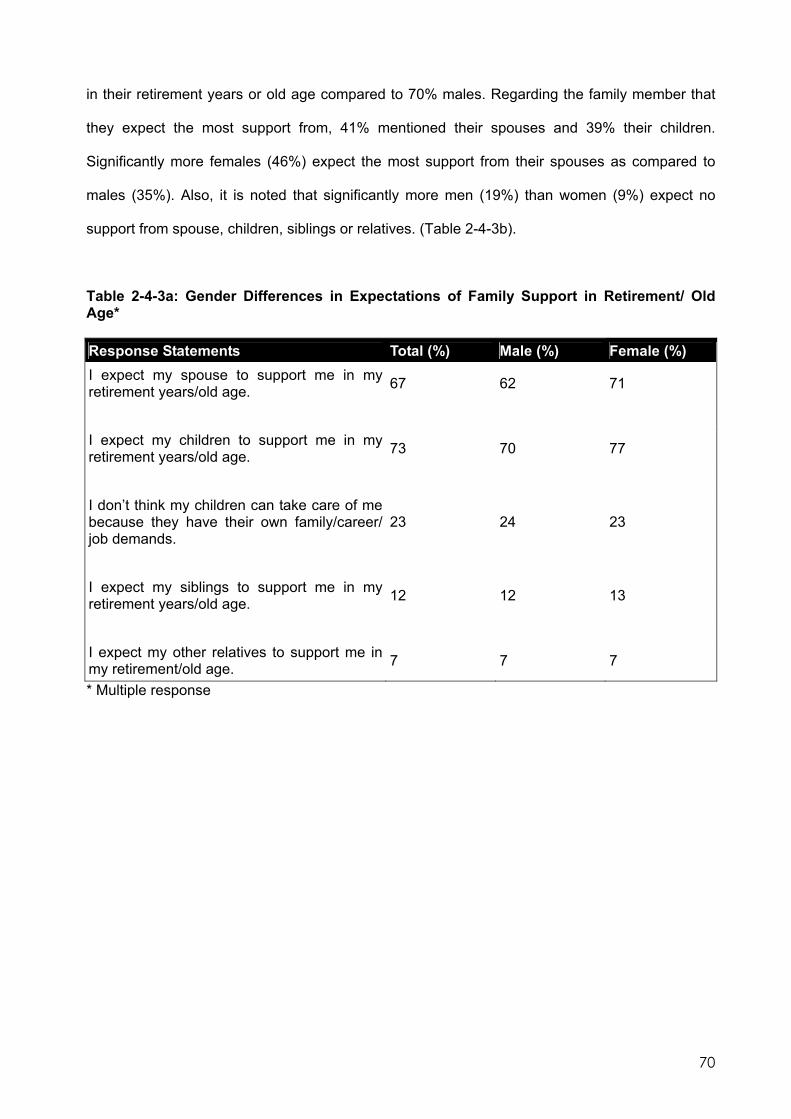
in their retirement years or old age compared to 70% males. Regarding the family member that
they expect the most support from, 41% mentioned their spouses and 39% their children.
Significantly more females (46%) expect the most support from their spouses as compared to
males (35%). Also, it is noted that significantly more men (19%) than women (9%) expect no
support from spouse, children, siblings or relatives. (Table 2-4-3b).
Table 2-4-3a: Gender Differences in Expectations of Family Support in Retirement/ Old Age* Response Statements Total (%) Male (%) Female (%) I expect my spouse to support me in my retirement years/old age. 67 62 71
I expect my children to support me in my retirement years/old age. 73 70 77
I don’t think my children can take care of me because they have their own family/career/ job demands.
23 24 23
I expect my siblings to support me in my retirement years/old age. 12 12 13
I expect my other relatives to support me in my retirement/old age. 7 7 7
* Multiple response
70

Table 2-4-1-3b: Gender Differences in Family Member from whom Most Support is Expected Response Statements Total (%) Male (%) Female (%) I expect the most support from: my spouse in my retirement years/old age. 41 35 46
I expect the most support from my children in my retirement years/old age. 39 40 39
I expect the most support from my siblings in my retirement years/old age. 5 4 5
I expect the most support from my other relatives in my retirement/old age. 0.8 1 0.7
None of the above 14 19 9 Total 100 100 100
47. As most baby-boomers expect their spouses and/or children to support them in their
retirement/ old age, the type of support these baby-boomers expect in their retirement years or
old age is important as well. Findings through this survey show that most baby-boomers expect
emotional support (34%), physical care (31%) and monetary support (26%) from their family
members (Refer to Table 2-4-4).
48. Nonetheless, there are gender differences in the type of support expected. As shown in
the same table, Table 2-4-4, a significantly larger proportion of males expect physical care
support (37%) as compared to their female counterparts (26%). On the other hand, more females
(31%) expect monetary support from their family members than the males (21%).
71

Table 2-4-4: Gender Differences in Type of Support Expected from Family Members in
Retirement/ Old Age
Type of Support Total (%) Male (%) Female (%) Monetary 26 21 31 Physical care 31 37 26 Material goods 7 7 7 Emotional support 34 34 33 Others 1 1 1 Don’t know/Refused to answer 0.7 0.5 1
72

2.4.2 Differences between Early Baby-boomers and Late Baby-boomers
49. As shown in Table 2-4-5 below, a significantly higher proportion of the early baby-boomers
(41%) expect to live with their children compared to the late baby-boomers (35%) and significantly
fewer of them want to maintain their own household independently (74% and 80% respectively).
Besides being more independent of their families, the late baby-boomers are also less averse to
living in nursing homes or retirement villages. The late baby-boomers are also more likely to move
out of their current property (36% as compared to 30% for the early baby-boomers).
Table 2-4-5: Differences between Early and Late Baby-boomers in Expectations of Living Arrangements in Retirement/ Old Age*
Response Statements Total (%)
Early Baby-boomers (%)
Late Baby-boomers (%)
I expect to continue living in Singapore. 93 94 92 I expect to be living with my spouse for most of my retirement years/old age. 75 73 76
I expect to live near at least one of my children. 37 38 37
*I expect to live with one of my children. 37 41 35 *I would not mind staying in a nursing home. 14 12 15
*I would not mind staying in a retirement village. 25 21 27
*I want to maintain my own household independently/with my spouse. 77 74 80
I intend to move out of my current property. 34 30 36
* Multiple response
50. Of the baby-boomers with intentions to move, significantly more early baby-boomers
(39%) than late ones (33%) would downgrade to a smaller property.
73

Table 2-4-6: Differences between Early and Late Baby-boomers in Reason(s) for Moving Out of Current Property
Response Statements Total (%)
Early Baby-boomers (%)
Late Baby-boomers (%)
Downgrade to a smaller property which is easier to upkeep 35 39 33
To realize financial value of property, for spending in retirement/old age 18 18 18
To move in with children 31 30 32 To move to a community where there are retirees like me 4 4 4
To move overseas 7 8 7 Others 5 1 6 Total 100 100 100
51. As regards family support, a significantly higher proportion of the early baby-boomers
(77%) expect their children to support them compared to the late baby-boomers (71%). (Table 2-
4-7a) Moreover, more early baby-boomers (44%) expect the most support to come from their
children compared to late baby-boomers (37%) (Table 2-4-7b). Emotional support is the most
common support expected by both early (31%) and late baby-boomers (35%). However, more
early baby-boomers (28%) expect monetary support compared to late baby-boomers (26%).
(Table 2-4-8)
74

Table 2-4-7a: Differences between Early and Late Baby-boomers in Expectations of Family Support in Retirement/ Old Age*
Response Statements Total (%) Early Baby-boomers (%)
Late Baby-boomers (%)
I expect my spouse to support me in my retirement years/old age. 67 65 67
I expect my children to support me in my retirement years/old age. 73 77 71
I don’t think my children can take care of me because they have their own family/career/job demands.
23 22 24
I expect my siblings to support me in my retirement years/old age. 12 11 13
I expect my other relatives to support me in my retirement/old age. 7 6 8
* Multiple response
Table 2-4-7b: Differences between Early and Late Baby-boomers in Family Member from whom Most Support is Expected
Response Statements Total (%) Early Baby-boomers (%)
Late Baby-boomers (%)
I expect the most support from my spouse in my retirement years/old age. 41 39 42
I expect the most support from my children in my retirement years/old age. 39 44 37
I expect the most support from my siblings in my retirement years/old age. 5 3 5
I expect the most support from my other relatives in my retirement/old age. 0.8 0.6 1
None of the above 14 13 15 Total 100 100 100
75

Table 2-4-8: Differences between Early and Late Baby-boomers in Type of Support Expected from Family Members in Retirement/Old Age
Type of Support Total (%) Early Baby-boomers (%)
Late Baby-boomers (%)
Monetary 26 28 26 Physical care 31 31 32 Material goods 7 9 6 Emotional support 34 31 35 Others 1 1 1 Don’t know/Refused to answer 0.7 0.8 0.5
2.4.3 Differences between Baby-boomers with Different Levels of Education
53. A significantly higher proportion of baby-boomers with secondary to diploma education
expect to live near their children (average of 40%) compared to those with higher educational
levels, i.e. university and higher education (32%). (Table 2-4-9).
52. Amongst the baby-boomers, half (50%) of those with no formal qualifications expect to
live with their children during retirement or old age, whereas only 18% of the baby-boomers with
university and higher education indicate the same expectation. (Refer to Table 2-4-9) This is
likely to be related to the level of dependence of these baby-boomers on their children during
their old age; more highly educated baby-boomers tend to be more financially and socially
independent and resourceful than those who are lowly educated.
76
54. At the same time however, relatively more baby-boomers with secondary to diploma
education (averaging 34%) also would not mind living in a retirement village, as compared to
their peers with lower and higher educational levels (averaging 18% and 29% respectively).
Hence, we note that there are mixed findings to the living arrangement expectations of baby-
boomers with middle-upper level of education (Refer to Table 2-4-9).
55. In terms of housing during retirement or old age, a significantly large proportion of baby-
boomers with lower secondary education (42%) intend to move out of their current property. This
contrasts with both ends of the spectrum, i.e. baby-boomers with no formal qualifications and
baby-boomers with university and higher education, with only 25% and 28% respectively who
intend to move out (Refer to Table 2-4-9).
77

Table 2-4-9: Differences between Baby-boomers with Different Levels of Education in Expectations of Living Arrangements in Retirement/Old Age
Response Statements Total (%) No formal qualification (%)
Primary (%)
Lower Secondary (%)
Secondary (%)
Upper Secondary (%)
Polytechnic diploma/Other professional qualification (%)
University (%)
I expect to continue living in Singapore. 93 94 95 97 93 94 87 90
I expect to be living with my spouse or partner for most of my retirement years/ old age.
75 73 76 75 74 68 74 84
I expect to live near at least one of my children. 37 37 36 33 41 38 40 32
I expect to live with one of my children. 37 50 44 39 39 37 32 18
I would not mind staying in a nursing home. 14 12 10 7 14 19 24 16
I would not mind staying in a retirement village. 25 17 19 18 26 33 35 29
I want to maintain my own household independently/with my spouse. 77 67 73 75 82 77 72 92
I intend to move out of my current property. 34 25 33 42 35 32 33 28
78
56. Some obvious differences between the baby-boomers of differing levels of education are
that more of the baby-boomers with lower education (no formal qualification to lower secondary)
intend to move out of their own property to move in with their children (averaging 39%) as
compared to those with upper secondary and above level of education (averaging 19%). (Refer to
Table 2-4-10). Also, a significantly larger proportion of baby-boomers with tertiary and higher
education, 15% against an average of 3% of those with no formal qualification to lower secondary
education, move out of their current property to spend their old age overseas during their old age.
57. As expected, the expectation of family support is significantly higher among those baby-
boomers with no formal education (86%) compared to those with any other level of education.
(Table 2-4-11a) Also, a significantly higher proportion of baby-boomers with no formal education,
expect most support from their children (58%). Notably, expectation of no support is higher
among those with upper secondary education or higher (19%) compared to other. (Table 2-4-
11b)
58. Table 2-4-12 shows that 44% of baby-boomers with no formal education expect financial
support from their children whereas 55% of those with university education expect emotional
support from their children.
79
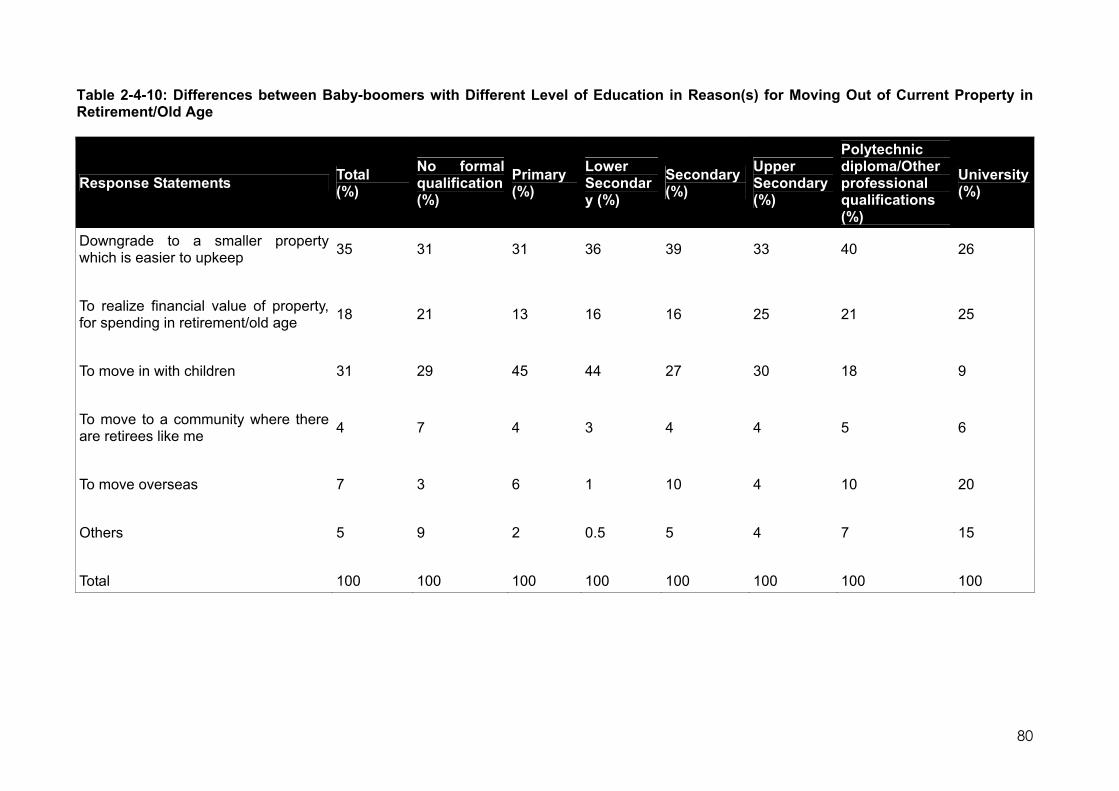
Table 2-4-10: Differences between Baby-boomers with Different Level of Education in Reason(s) for Moving Out of Current Property in Retirement/Old Age
Response Statements Total (%)
No formal qualification (%)
Primary (%)
Lower Secondary (%)
Secondary (%)
Upper Secondary (%)
Polytechnic diploma/Other professional qualifications (%)
University (%)
Downgrade to a smaller property which is easier to upkeep 35 31 31 36 39 33 40 26
To realize financial value of property, for spending in retirement/old age 18 21 13 16 16 25 21 25
To move in with children 31 29 45 44 27 30 18 9
To move to a community where there are retirees like me 4 7 4 3 4 4 5 6
To move overseas 7 3 6 1 10 4 10 20
Others 5 9 2 0.5 5 4 7 15
Total 100 100 100 100 100 100 100 100
80

Table 2-4-11a: Differences between Baby-boomers with Different Level of Education in Expectations of Family Support in Retirement/ Old Age*
Response Statements Total (%)
No formal qualification (%)
Primary (%)
Lower Secondary (%)
Secondary (%)
Upper Secondary (%)
Polytechnic diploma/Other professional qualifications (%)
University (%)
I expect my spouse to support me in my retirement years/old age. 67 65 73 72 64 52 62 71
I expect my children to support me in my retirement years/old age. 73 86 79 78 71 62 71 63
I don’t think my children can take care of me because they have their own family/career/job demands.
28 20 24 25 33 34 33 28
I expect my siblings to support me in my retirement years/old age. 12 12 10 13 15 12 11 9
I expect my other relatives to support me in my retirement/old age. 7 6 7 9 7 9 6 7
* Multiple response
81

Table 2-4-11b: Educational Differences between Baby-boomers in Family Member from Whom Most Support is Expected
Response Statements Total (%)
No formal qualification (%)
Primary (%)
Lower Secondary (%)
Secondary (%)
Upper Secondary (%)
Polytechnic diploma/Other professional qualifications (%)
University (%)
I expect the most support from my spouse in my retirement years/old age.
41 32 40 36 41 32 43 60
I expect the most support from my children in my retirement years/old age.
39 58 46 48 37 35 37 15
I expect the most support from my siblings in my retirement years/old age.
5 2 3 4 6 7 4 4
I expect the most support from my other relatives in my retirement/old age.
0.8 0 0.3 2 1 2 0.3 0.3
None of the above 14 8 11 9 15 23 16 20
Total 100 100 100 100 100 100 100 100
82

Table 2-4-12: Educational Differences in Type of Support Expected From Family Members in Retirement/ Old age
Response Statements Total (%)
No formal qualification (%)
Primary (%)
Lower Secondary (%)
Secondary (%)
Upper Secondary (%)
Polytechnic diploma/Other professional qualifications (%)
University (%)
Monetary 26 44 30 36 26 17 20 7
Physical care 31 19 32 31 32 37 34 32
Material goods 7 12 7 7 7 10 7 4
Emotional support 34 24 30 26 35 35 36 55
Others 1 0 1 0 1 2 3 2
Don’t know/ Refused 0.7 1 1 1 0.5 0 1 0
Total 100 100 100 100 100 100 100 100
83

CHAPTER 3: PRODUCTS & SERVICES FOR BABY-BOOMERS IN RETIREMENT/ OLD AGE
The Silver Market
1 The ageing of the baby-boomers is projected to fuel the rise of the silver market for
products and services for seniors. In his book, The Glittering Silver Market; The Rise of Elderly
Consumers in Asia (Singapore: John Wiley, 2007), Yuwa Hedrick-Wong, the economic advisor to
MasterCard Worldwide in Asia/Pacific, estimates the spending power of Singapore’s elderly to
rise from $3.6 billion in 2005 to $10.5 billion (in constant 2005 dollars) in 2015 (p 86). This is part
of a growing trend all over Asia and the Pacific, attributed to longer and healthier lives, greater
affluence and “an active and youthful outlook on life” (p 28). This chapter examines what
products and services are likely to be in demand by baby-boomers as they age and their
potential to effectively purchase them.
3.1 Baby-boomers’ Potential Demand for Products and Services in Retirement/Old Age
2. In this study, baby-boomers were asked if they would pay for a range of products and
services targeted at seniors if these were available. The responses to these questions may be
used as indicators of their potential demand. As Figure 3-1 shows, the most popular products and
services that the baby-boomers studied are ready to pay for are leisure activities for seniors (41%),
followed by seniors-only travel activities (34%), educational activities for seniors (23%) and
financial services targeted specifically at seniors (21%). On the other hand, only 5% would pay for
service robots, with the proportion increasing to 10% for telemedicine, and 12% for smart homes
and high tech assistive devices – in other words, the high technology products. Home help (16%)
and home nursing (7%) are also relatively low on this list.
84
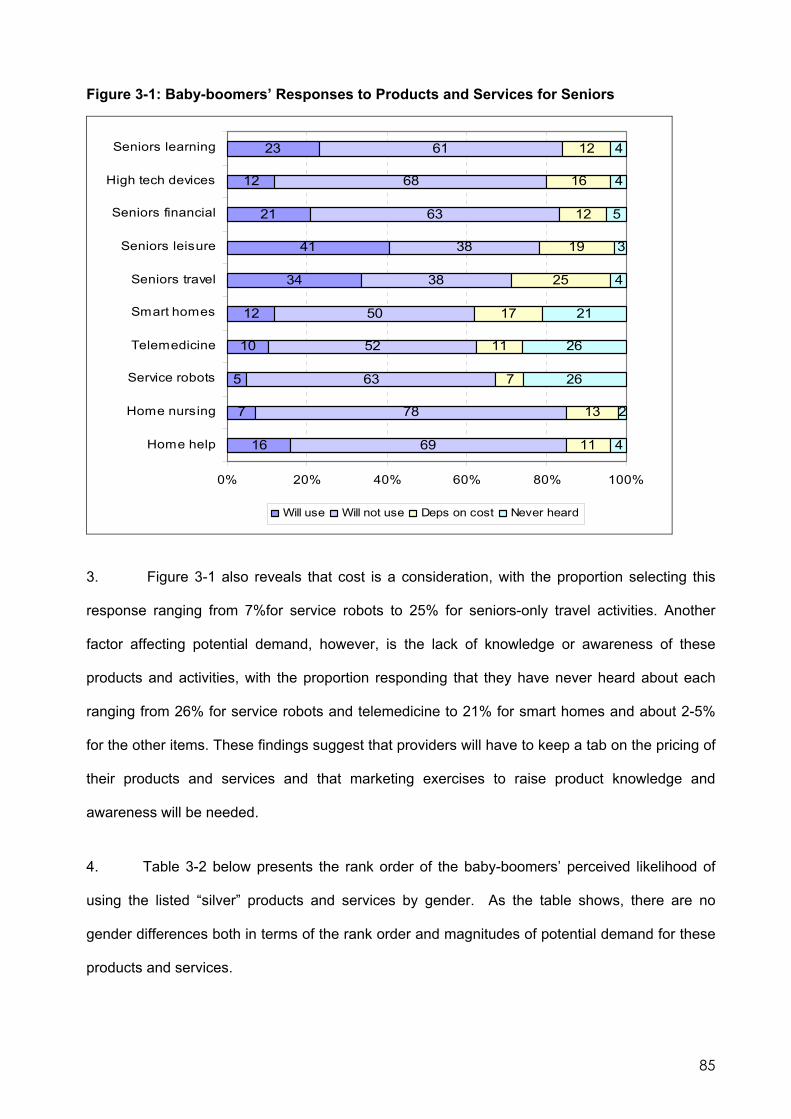
Figure 3-1: Baby-boomers’ Responses to Products and Services for Seniors
16
7
5
10
12
34
41
21
12
23
69
78
63
52
50
38
38
63
68
61
11
13
7
11
17
25
19
12
16
12
4
2
26
26
21
4
3
5
4
4
0% 20% 40% 60% 80% 100%
Home help
Home nursing
Service robots
Telemedicine
Smart homes
Seniors travel
Seniors leisure
Seniors financial
High tech devices
Seniors learning
Will use Will not use Deps on cost Never heard
3. Figure 3-1 also reveals that cost is a consideration, with the proportion selecting this
response ranging from 7%for service robots to 25% for seniors-only travel activities. Another
factor affecting potential demand, however, is the lack of knowledge or awareness of these
products and activities, with the proportion responding that they have never heard about each
ranging from 26% for service robots and telemedicine to 21% for smart homes and about 2-5%
for the other items. These findings suggest that providers will have to keep a tab on the pricing of
their products and services and that marketing exercises to raise product knowledge and
awareness will be needed.
4. Table 3-2 below presents the rank order of the baby-boomers’ perceived likelihood of
using the listed “silver” products and services by gender. As the table shows, there are no
gender differences both in terms of the rank order and magnitudes of potential demand for these
products and services.
85

Table 3-2: Rank Order of Baby-boomers’ Willingness to Use Product/Service in Retirement/Old Age
Rank Products/Services Total (%) Male (%) Female (%)
1 Seniors leisure 41 42 40
2 Seniors travel 34 36 32
3 Seniors learning 23 22 24
4 Seniors financial 21 21 20
5 Home help 16 15 17
6 Smart homes 12 12 12
7 High tech assistive devices 12 12 12
8 Telemedicine 10 11 10
9 Home nursing 7 7 7
10 Service robots 5 5 5
5. With regard to differences between the cohorts, the late baby-boomers are more open
to practically all the abovementioned products and services than the early baby-boomers, as
shown in Table 3-3 below.
Table 3-3: Differences between Early and Late Baby-boomers in Willingness to Use Product/Service in Retirement/Old Age
Products/Services Total (%) Early Baby-boomers (%)
Late Baby-boomers (%)
Seniors leisure 41 38 42
Seniors travel 34 31 36
Seniors learning 23 20 25
Seniors financial 21 20 21
Home help 16 15 17
Smart homes 12 10 14
High tech assistive devices 12 9 14
Telemedicine 10 9 11
Home nursing 7 6 8
Service robots 5 5 5
86

6. Another important finding is the increasing potential of use of these silver products
and services with rising education. (Refer to Figure 3-4) Even among the least educated group
(i.e. those with no formal qualifications), about 20-30% would pay for leisure and travel activities
in their retirement or old age years.
Figure 3-4: Differences between Baby-boomers with Different Levels of Education in Willingness to Use Product/Service in Retirement/Old Age
Perceived Use of Products and Services
0
10
20
30
40
50
60
No qual
Primary
Lower
sec
Second
ary
Upper s
ec
Poly/di
ploma
Universi
ty
Per
cen
t
Home helpHome nursingService robotsTele-medicineSmart homesSeniors travelSeniors leisureSeniors financialHigh tech deviceSeniors learning
3.2 Estimating Baby-boomers’ Effective Demand for Silver Products and Services
7. While the potential demand for products and services have been established above, the
ability of baby-boomers to effect this will depend on their future incomes. In this regard, it may
be noted that about half (52%) of baby-boomers studied expect to receive monthly household
incomes of less than $1000 per month. Another approximately 1% expect to receive no fixed
income. (Refer to Section 2.3) For the majority, retirement means a decline (even a drastic
87
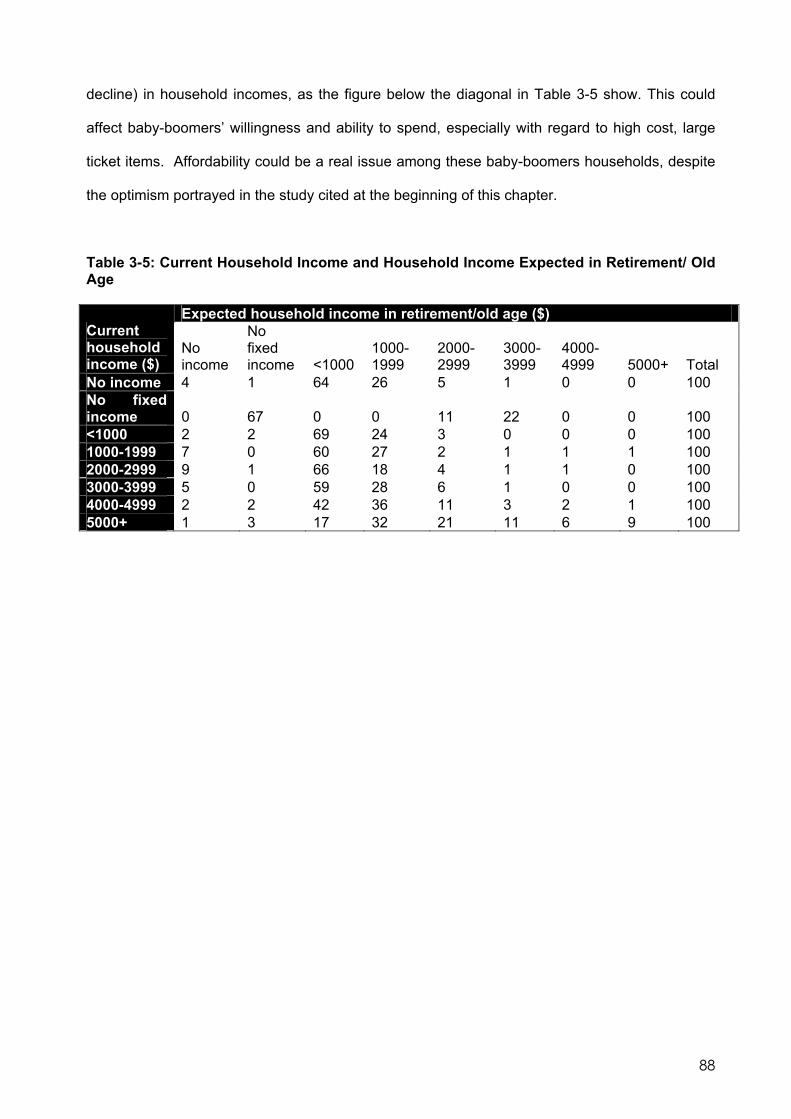
88
decline) in household incomes, as the figure below the diagonal in Table 3-5 show. This could
affect baby-boomers’ willingness and ability to spend, especially with regard to high cost, large
ticket items. Affordability could be a real issue among these baby-boomers households, despite
the optimism portrayed in the study cited at the beginning of this chapter.
Table 3-5: Current Household Income and Household Income Expected in Retirement/ Old Age
Expected household income in retirement/old age ($) Current household income ($)
No income
No fixed income <1000
1000-1999
2000-2999
3000-3999
4000-4999 5000+ Total
No income 4 1 64 26 5 1 0 0 100 No fixed income 0 67 0 0 11 22 0 0 100 <1000 2 2 69 24 3 0 0 0 100 1000-1999 7 0 60 27 2 1 1 1 100 2000-2999 9 1 66 18 4 1 1 0 100 3000-3999 5 0 59 28 6 1 0 0 100 4000-4999 2 2 42 36 11 3 2 1 100 5000+ 1 3 17 32 21 11 6 9 100