B. ENROLLMENT AND PERSISTENCE - UMass Lowell Revised 9-2011_tcm18-39309.pdf · System's Graduation...
27
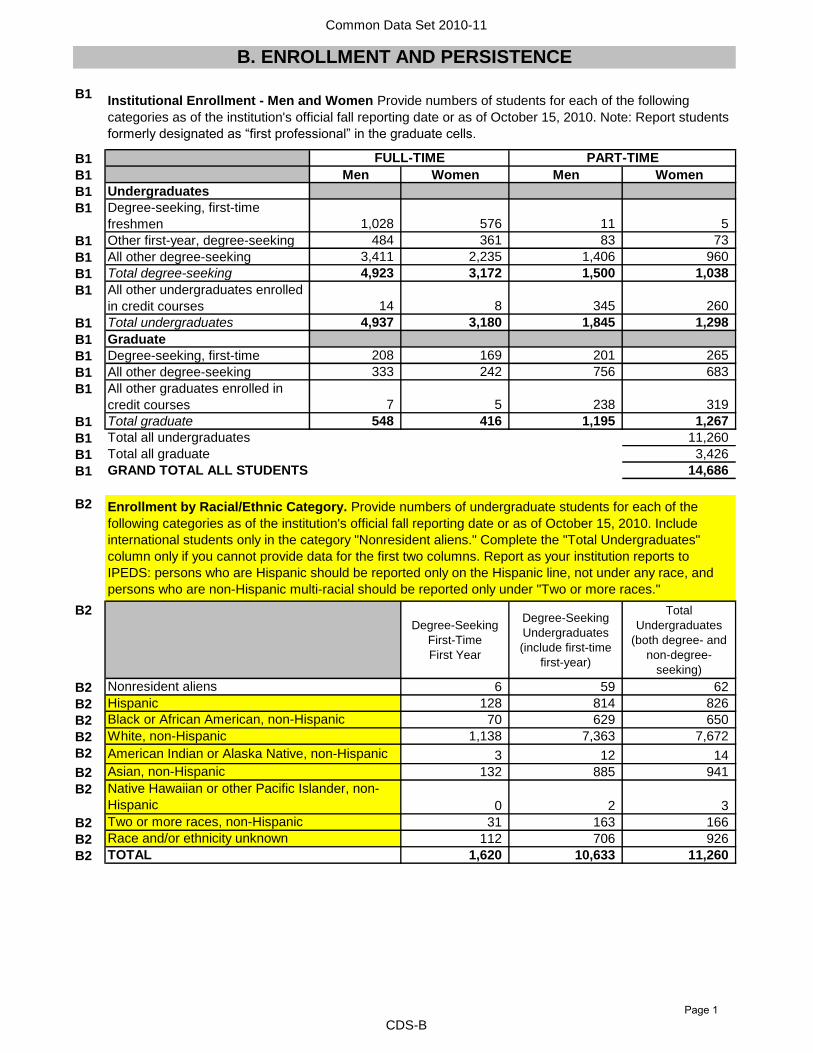
Common Data Set 2010-11 B1 B1 B1 Men Women Men Women B1 Undergraduates B1 Degree-seeking, first-time freshmen 1,028 576 11 5 B1 Other first-year, degree-seeking 484 361 83 73 B1 All other degree-seeking 3,411 2,235 1,406 960 B1 Total degree-seeking 4,923 3,172 1,500 1,038 B1 All other undergraduates enrolled in credit courses 14 8 345 260 B1 Total undergraduates 4,937 3,180 1,845 1,298 B1 Graduate B1 Degree-seeking, first-time 208 169 201 265 B1 All other degree-seeking 333 242 756 683 B1 All other graduates enrolled in credit courses 7 5 238 319 B1 Total graduate 548 416 1,195 1,267 B1 11,260 B1 3,426 B1 14,686 B2 B2 Degree-Seeking First-Time First Year Degree-Seeking Undergraduates (include first-time first-year) Total Undergraduates (both degree- and non-degree- seeking) B2 6 59 62 B2 128 814 826 B2 70 629 650 B2 1,138 7,363 7,672 B2 3 12 14 B2 132 885 941 B2 0 2 3 B2 31 163 166 B2 112 706 926 B2 1,620 10,633 11,260 Enrollment by Racial/Ethnic Category. Provide numbers of undergraduate students for each of the following categories as of the institution's official fall reporting date or as of October 15, 2010. Include international students only in the category "Nonresident aliens." Complete the "Total Undergraduates" column only if you cannot provide data for the first two columns. Report as your institution reports to IPEDS: persons who are Hispanic should be reported only on the Hispanic line, not under any race, and persons who are non-Hispanic multi-racial should be reported only under "Two or more races." TOTAL Nonresident aliens Black or African American, non-Hispanic American Indian or Alaska Native, non-Hispanic Hispanic White, non-Hispanic Asian, non-Hispanic Native Hawaiian or other Pacific Islander, non- Hispanic Two or more races, non-Hispanic Race and/or ethnicity unknown B. ENROLLMENT AND PERSISTENCE Institutional Enrollment - Men and Women Provide numbers of students for each of the following categories as of the institution's official fall reporting date or as of October 15, 2010. Note: Report students formerly designated as “first professional” in the graduate cells. FULL-TIME PART-TIME Total all undergraduates Total all graduate GRAND TOTAL ALL STUDENTS CDS-B Page 1
Transcript of B. ENROLLMENT AND PERSISTENCE - UMass Lowell Revised 9-2011_tcm18-39309.pdf · System's Graduation...
Common Data Set 2010-11
B1
B1
B1 Men Women Men Women
B1 Undergraduates
B1 Degree-seeking, first-time
freshmen 1,028 576 11 5
B1 Other first-year, degree-seeking 484 361 83 73
B1 All other degree-seeking 3,411 2,235 1,406 960
B1 Total degree-seeking 4,923 3,172 1,500 1,038
B1 All other undergraduates enrolled
in credit courses 14 8 345 260
B1 Total undergraduates 4,937 3,180 1,845 1,298
B1 Graduate
B1 Degree-seeking, first-time 208 169 201 265
B1 All other degree-seeking 333 242 756 683
B1 All other graduates enrolled in
credit courses 7 5 238 319
B1 Total graduate 548 416 1,195 1,267
B1 11,260
B1 3,426
B1 14,686
B2
B2Degree-Seeking
First-Time
First Year
Degree-Seeking
Undergraduates
(include first-time
first-year)
Total
Undergraduates
(both degree- and
non-degree-
seeking)
B2 6 59 62
B2 128 814 826
B2 70 629 650
B2 1,138 7,363 7,672
B2 3 12 14
B2 132 885 941
B2
0 2 3
B2 31 163 166
B2 112 706 926
B2 1,620 10,633 11,260
Enrollment by Racial/Ethnic Category. Provide numbers of undergraduate students for each of the
following categories as of the institution's official fall reporting date or as of October 15, 2010. Include
international students only in the category "Nonresident aliens." Complete the "Total Undergraduates"
column only if you cannot provide data for the first two columns. Report as your institution reports to
IPEDS: persons who are Hispanic should be reported only on the Hispanic line, not under any race, and
persons who are non-Hispanic multi-racial should be reported only under "Two or more races."
TOTAL
Nonresident aliens
Black or African American, non-Hispanic
American Indian or Alaska Native, non-Hispanic
Hispanic
White, non-Hispanic
Asian, non-Hispanic
Native Hawaiian or other Pacific Islander, non-
Hispanic
Two or more races, non-Hispanic
Race and/or ethnicity unknown
B. ENROLLMENT AND PERSISTENCE
Institutional Enrollment - Men and Women Provide numbers of students for each of the following
categories as of the institution's official fall reporting date or as of October 15, 2010. Note: Report students
formerly designated as “first professional” in the graduate cells.
FULL-TIME PART-TIME
Total all undergraduates
Total all graduate
GRAND TOTAL ALL STUDENTS
CDS-B
Page 1
Common Data Set 2010-11
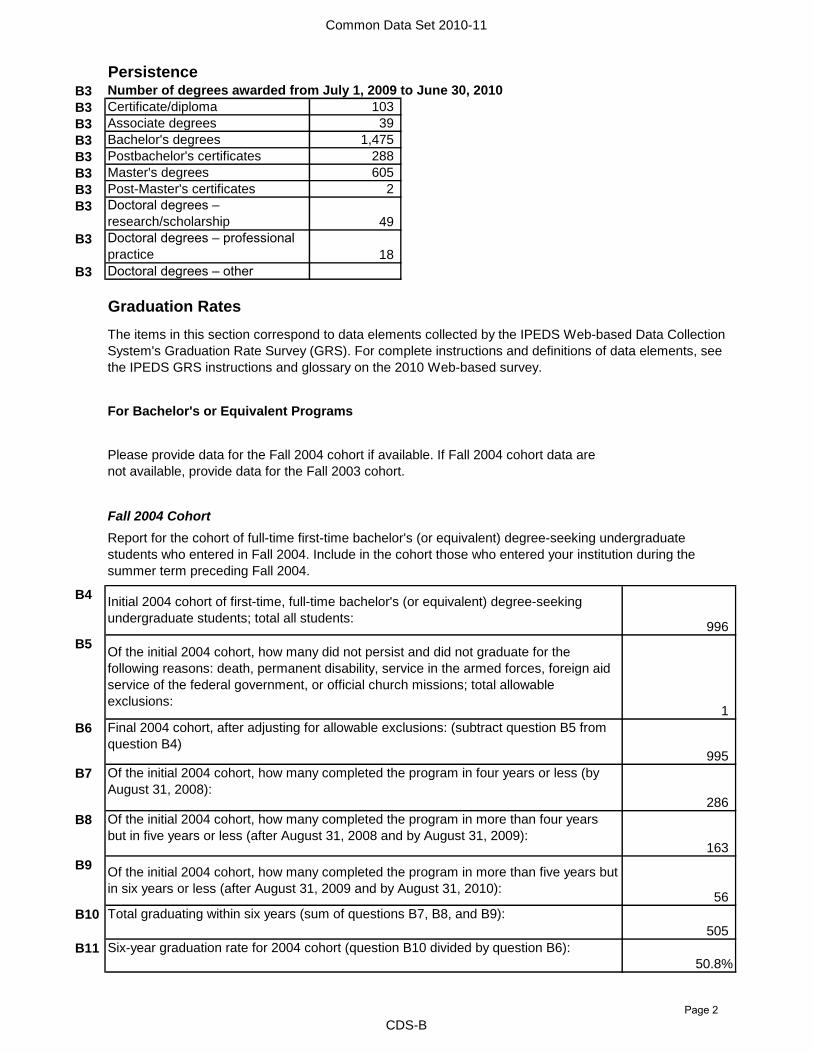
PersistenceB3 Number of degrees awarded from July 1, 2009 to June 30, 2010
B3 Certificate/diploma 103
B3 Associate degrees 39
B3 Bachelor's degrees 1,475
B3 Postbachelor's certificates 288
B3 Master's degrees 605
B3 Post-Master's certificates 2
B3 Doctoral degrees –
research/scholarship 49
B3 Doctoral degrees – professional
practice 18
B3 Doctoral degrees – other
Graduation Rates
Fall 2004 Cohort
B4
996
B5
1
B6
995
B7
286
B8
163
B9
56
B10
505
B11
50.8%
Of the initial 2004 cohort, how many completed the program in four years or less (by
August 31, 2008):
Of the initial 2004 cohort, how many completed the program in more than four years
but in five years or less (after August 31, 2008 and by August 31, 2009):
Please provide data for the Fall 2004 cohort if available. If Fall 2004 cohort data are
not available, provide data for the Fall 2003 cohort.
Report for the cohort of full-time first-time bachelor's (or equivalent) degree-seeking undergraduate
students who entered in Fall 2004. Include in the cohort those who entered your institution during the
summer term preceding Fall 2004.
Initial 2004 cohort of first-time, full-time bachelor's (or equivalent) degree-seeking
undergraduate students; total all students:
Of the initial 2004 cohort, how many did not persist and did not graduate for the
following reasons: death, permanent disability, service in the armed forces, foreign aid
service of the federal government, or official church missions; total allowable
exclusions:
Final 2004 cohort, after adjusting for allowable exclusions: (subtract question B5 from
question B4)
The items in this section correspond to data elements collected by the IPEDS Web-based Data Collection
System's Graduation Rate Survey (GRS). For complete instructions and definitions of data elements, see
the IPEDS GRS instructions and glossary on the 2010 Web-based survey.
For Bachelor's or Equivalent Programs
Six-year graduation rate for 2004 cohort (question B10 divided by question B6):
Of the initial 2004 cohort, how many completed the program in more than five years but
in six years or less (after August 31, 2009 and by August 31, 2010):
Total graduating within six years (sum of questions B7, B8, and B9):
CDS-B
Page 2
Common Data Set 2010-11
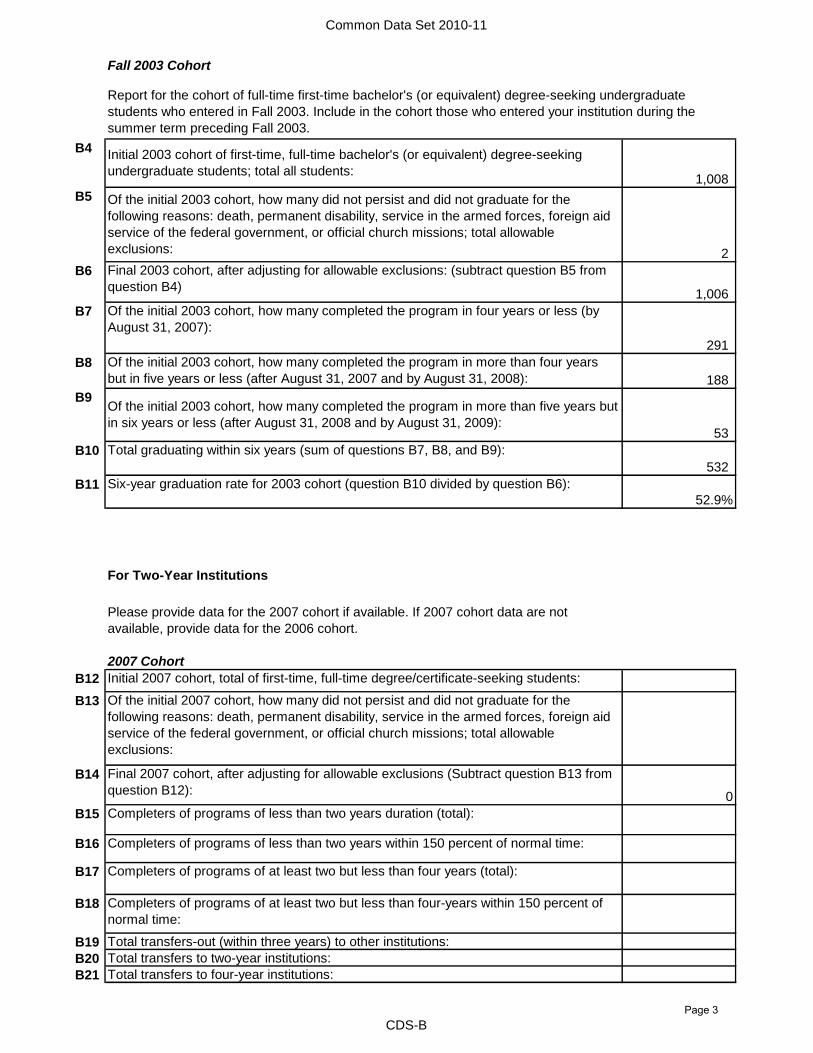
Fall 2003 Cohort
B4
1,008
B5
2
B6
1,006
B7
291
B8
188
B9
53
B10
532
B11
52.9%
For Two-Year Institutions
2007 Cohort
B12
B13
B14
0
B15
B16
B17
B18
B19
B20
B21
Of the initial 2007 cohort, how many did not persist and did not graduate for the
following reasons: death, permanent disability, service in the armed forces, foreign aid
service of the federal government, or official church missions; total allowable
exclusions:
Final 2007 cohort, after adjusting for allowable exclusions (Subtract question B13 from
question B12):
Completers of programs of less than two years duration (total):
Completers of programs of less than two years within 150 percent of normal time:
Total transfers to four-year institutions:
Final 2003 cohort, after adjusting for allowable exclusions: (subtract question B5 from
question B4)
Of the initial 2003 cohort, how many completed the program in more than four years
but in five years or less (after August 31, 2007 and by August 31, 2008):
Total transfers to two-year institutions:
Report for the cohort of full-time first-time bachelor's (or equivalent) degree-seeking undergraduate
students who entered in Fall 2003. Include in the cohort those who entered your institution during the
summer term preceding Fall 2003.
Completers of programs of at least two but less than four years (total):
Completers of programs of at least two but less than four-years within 150 percent of
normal time:
Total transfers-out (within three years) to other institutions:
Initial 2003 cohort of first-time, full-time bachelor's (or equivalent) degree-seeking
undergraduate students; total all students:
Of the initial 2003 cohort, how many did not persist and did not graduate for the
following reasons: death, permanent disability, service in the armed forces, foreign aid
service of the federal government, or official church missions; total allowable
exclusions:
Of the initial 2003 cohort, how many completed the program in four years or less (by
August 31, 2007):
Of the initial 2003 cohort, how many completed the program in more than five years but
in six years or less (after August 31, 2008 and by August 31, 2009):
Total graduating within six years (sum of questions B7, B8, and B9):
Six-year graduation rate for 2003 cohort (question B10 divided by question B6):
Please provide data for the 2007 cohort if available. If 2007 cohort data are not
available, provide data for the 2006 cohort.
Initial 2007 cohort, total of first-time, full-time degree/certificate-seeking students:
CDS-B
Page 3
Common Data Set 2010-11
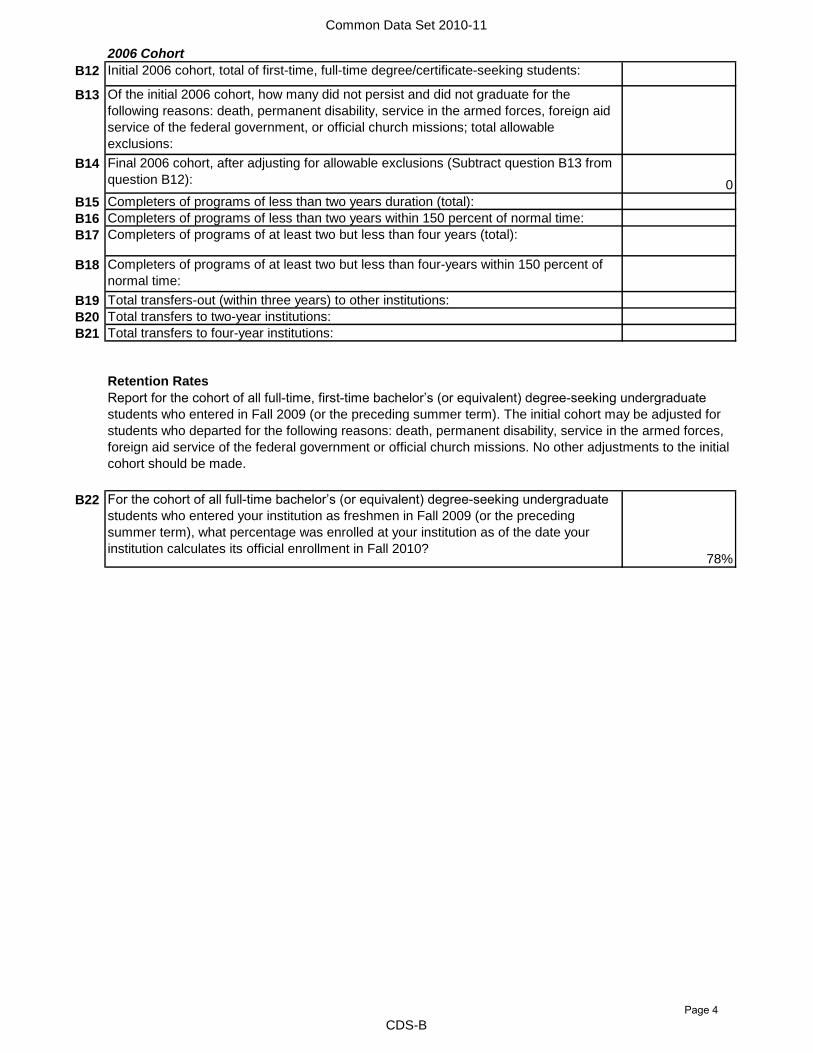
2006 Cohort
B12
B13
B14
0
B15
B16
B17
B18
B19
B20
B21
Retention Rates
B22
78%
Final 2006 cohort, after adjusting for allowable exclusions (Subtract question B13 from
question B12):
Completers of programs of less than two years duration (total):
For the cohort of all full-time bachelor’s (or equivalent) degree-seeking undergraduate
students who entered your institution as freshmen in Fall 2009 (or the preceding
summer term), what percentage was enrolled at your institution as of the date your
institution calculates its official enrollment in Fall 2010?
Completers of programs of at least two but less than four years (total):
Completers of programs of at least two but less than four-years within 150 percent of
normal time:
Total transfers-out (within three years) to other institutions:
Total transfers to two-year institutions:
Total transfers to four-year institutions:
Report for the cohort of all full-time, first-time bachelor’s (or equivalent) degree-seeking undergraduate
students who entered in Fall 2009 (or the preceding summer term). The initial cohort may be adjusted for
students who departed for the following reasons: death, permanent disability, service in the armed forces,
foreign aid service of the federal government or official church missions. No other adjustments to the initial
cohort should be made.
Of the initial 2006 cohort, how many did not persist and did not graduate for the
following reasons: death, permanent disability, service in the armed forces, foreign aid
service of the federal government, or official church missions; total allowable
exclusions:
Completers of programs of less than two years within 150 percent of normal time:
Initial 2006 cohort, total of first-time, full-time degree/certificate-seeking students:
CDS-B
Page 4
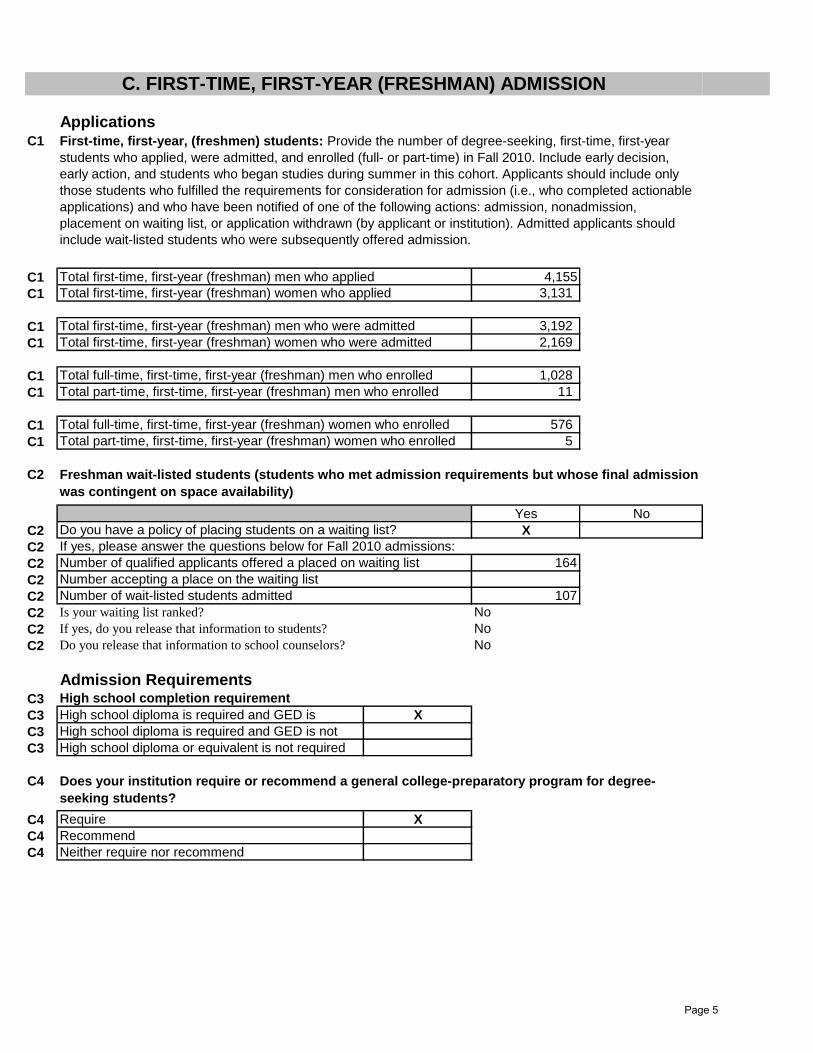
ApplicationsC1
C1 4,155
C1 3,131
C1 3,192
C1 2,169
C1 1,028
C1 11
C1 576
C1 5
C2
Yes No
C2 X
C2
C2 164
C2
C2 107
C2 Is your waiting list ranked? No
C2 No
C2 No
Admission RequirementsC3 High school completion requirement
C3 X
C3
C3
C4
C4 X
C4
C4
Recommend
Neither require nor recommend
Do you release that information to school counselors?
High school diploma is required and GED is
High school diploma is required and GED is not
High school diploma or equivalent is not required
Does your institution require or recommend a general college-preparatory program for degree-
seeking students?
Require
Do you have a policy of placing students on a waiting list?
If yes, please answer the questions below for Fall 2010 admissions:
Number of qualified applicants offered a placed on waiting list
Number accepting a place on the waiting list
Number of wait-listed students admitted
If yes, do you release that information to students?
Total full-time, first-time, first-year (freshman) men who enrolled
Total part-time, first-time, first-year (freshman) men who enrolled
Total full-time, first-time, first-year (freshman) women who enrolled
Total part-time, first-time, first-year (freshman) women who enrolled
Freshman wait-listed students (students who met admission requirements but whose final admission
was contingent on space availability)
C. FIRST-TIME, FIRST-YEAR (FRESHMAN) ADMISSION
First-time, first-year, (freshmen) students: Provide the number of degree-seeking, first-time, first-year
students who applied, were admitted, and enrolled (full- or part-time) in Fall 2010. Include early decision,
early action, and students who began studies during summer in this cohort. Applicants should include only
those students who fulfilled the requirements for consideration for admission (i.e., who completed actionable
applications) and who have been notified of one of the following actions: admission, nonadmission,
placement on waiting list, or application withdrawn (by applicant or institution). Admitted applicants should
include wait-listed students who were subsequently offered admission.
Total first-time, first-year (freshman) men who applied
Total first-time, first-year (freshman) women who applied
Total first-time, first-year (freshman) men who were admitted
Total first-time, first-year (freshman) women who were admitted
Page 5

C5
C5 Units
Required
Units
Recommended
C5 Total academic units 16
C5 English 4
C5 Mathematics 3 4
C5 Science 3 4
C5 Of these, units that must be
lab2
C5 Foreign language 2
C5 Social studies 2
C5 History
C5 Academic electives 2
C5 Computer Science
C5 Visual/Performing Arts
C5 Other (specify)
Basis for SelectionC6
C6
C6
C6
C6
C6
selective admission for out-of-state students
selective admission to some programs
other (explain)
Distribution of high school units required and/or recommended. Specify the distribution of academic
high school course units required and/or recommended of all or most degree-seeking students using
Carnegie units (one unit equals one year of study or its equivalent). If you use a different system for
calculating units, please convert.
Do you have an open admission policy, under which virtually all secondary school graduates or students with
GED equivalency diplomas are admitted without regard to academic record, test scores, or other
qualifications? If so, check which applies:
Open admission policy as described above for all students
Open admission policy as described above for most students, but--
Page 6
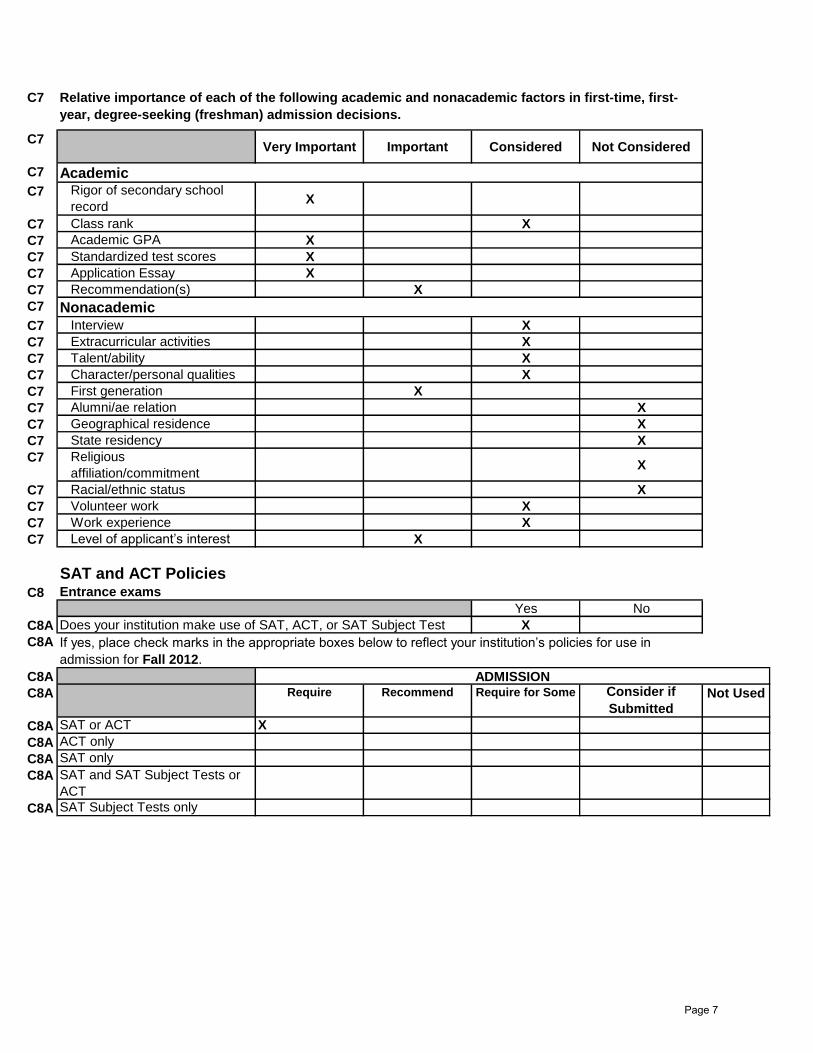
C7
C7Very Important Important Considered Not Considered
C7 Academic
C7 Rigor of secondary school
recordX
C7 Class rank X
C7 Academic GPA X
C7 Standardized test scores X
C7 Application Essay X
C7 Recommendation(s) X
C7 Nonacademic
C7 Interview X
C7 Extracurricular activities X
C7 Talent/ability X
C7 Character/personal qualities X
C7 First generation X
C7 Alumni/ae relation X
C7 Geographical residence X
C7 State residency X
C7 Religious
affiliation/commitmentX
C7 Racial/ethnic status X
C7 Volunteer work X
C7 Work experience X
C7 Level of applicant’s interest X
SAT and ACT PoliciesC8 Entrance exams
Yes No
C8A X
C8A
C8A
C8A Require Recommend Require for Some Consider if
SubmittedNot Used
C8A SAT or ACT X
C8A ACT only
C8A SAT only
C8A SAT and SAT Subject Tests or
ACT
C8A SAT Subject Tests only
Does your institution make use of SAT, ACT, or SAT Subject Test
If yes, place check marks in the appropriate boxes below to reflect your institution’s policies for use in
admission for Fall 2012.
ADMISSION
Relative importance of each of the following academic and nonacademic factors in first-time, first-
year, degree-seeking (freshman) admission decisions.
Page 7

C8B
C8B
C8B
C8B X
C8C
C8C
SAT essay ACT essay
C8C For admission
C8C For placement
C8C For advising
C8C
In place of an application essay
C8C As a validity check on the
application essay
C8C
No college policy as of now
C8CNot using essay component
X X
C8D
C8D Yes No
C8E June 1, 2011
C8E
C8F
C8F
C8G
C8G SAT X
C8G ACT X
C8G SAT Subject Tests
C8G AP X
C8G CLEP
C8G Institutional Exam X
C8G State Exam (specify):
Please indicate which tests your institution uses for placement (e.g., state tests):
ACT with or without Writing component accepted
Please indicate how your institution will use the SAT or ACT writing component; check all that apply:
In addition, does your institution use applicants' test scores for academic advising?
Latest date by which SAT or ACT scores must be received for fall-
Latest date by which SAT Subject Test scores must be received for
If necessary, use this space to clarify your test policies (e.g., if tests are recommended for some students, or
If your institution will make use of the ACT in admission decisions for first-time, first-year, degree-seeking applicants for
Fall 2012, please indicate which ONE of the following applies: (regardless of whether the writing score will be used in the
admissions process):
ACT with Writing Component required
ACT with Writing component recommended
Page 8
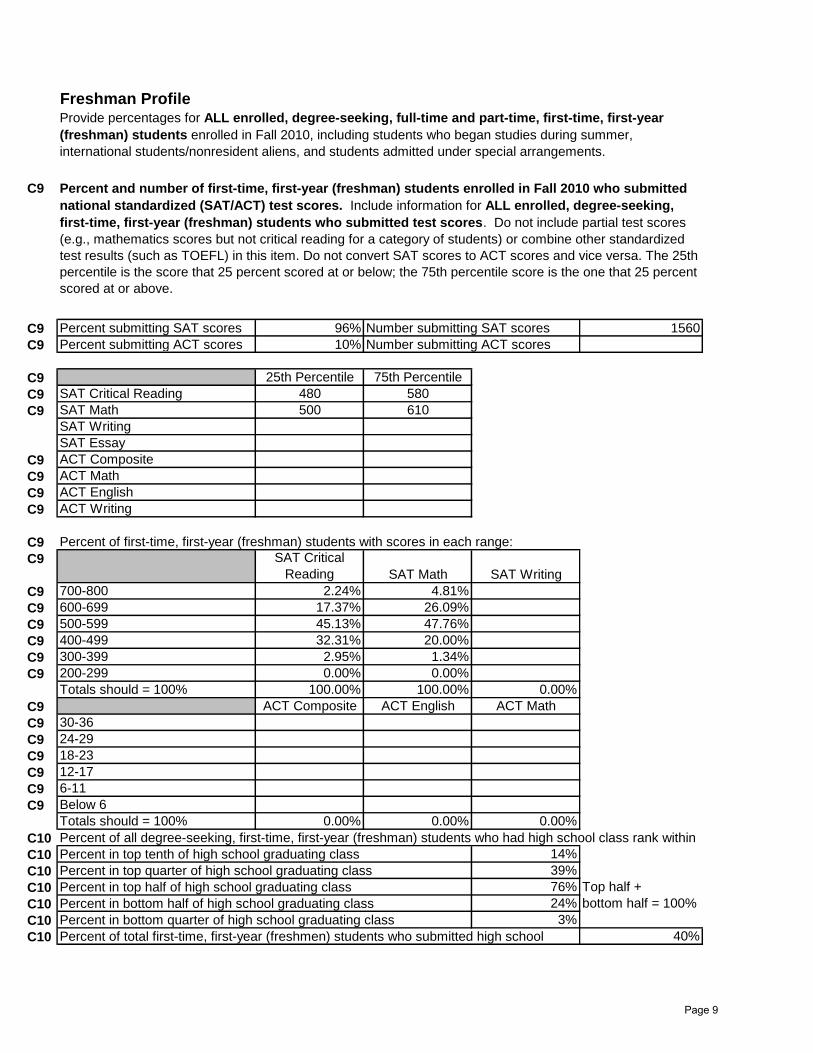
Freshman Profile
C9
C9 Percent submitting SAT scores 96% 1560
C9 Percent submitting ACT scores 10%
C9 25th Percentile 75th Percentile
C9 SAT Critical Reading 480 580
C9 SAT Math 500 610
SAT Writing
SAT Essay
C9 ACT Composite
C9 ACT Math
C9 ACT English
C9 ACT Writing
C9
C9 SAT Critical
Reading SAT Math SAT Writing
C9 700-800 2.24% 4.81%
C9 600-699 17.37% 26.09%
C9 500-599 45.13% 47.76%
C9 400-499 32.31% 20.00%
C9 300-399 2.95% 1.34%
C9 200-299 0.00% 0.00%
Totals should = 100% 100.00% 100.00% 0.00%
C9 ACT Composite ACT English ACT Math
C9 30-36
C9 24-29
C9 18-23
C9 12-17
C9 6-11
C9 Below 6
Totals should = 100% 0.00% 0.00% 0.00%
C10
C10 14%
C10 39%
C10 76% Top half +
C10 24% bottom half = 100%
C10 3%
C10 40%
Percent in bottom half of high school graduating class
Percent in bottom quarter of high school graduating class
Percent of total first-time, first-year (freshmen) students who submitted high school
Number submitting ACT scores
Percent of first-time, first-year (freshman) students with scores in each range:
Percent of all degree-seeking, first-time, first-year (freshman) students who had high school class rank within
Percent in top tenth of high school graduating class
Percent in top quarter of high school graduating class
Percent in top half of high school graduating class
Provide percentages for ALL enrolled, degree-seeking, full-time and part-time, first-time, first-year
(freshman) students enrolled in Fall 2010, including students who began studies during summer,
international students/nonresident aliens, and students admitted under special arrangements.
Percent and number of first-time, first-year (freshman) students enrolled in Fall 2010 who submitted
national standardized (SAT/ACT) test scores. Include information for ALL enrolled, degree-seeking,
first-time, first-year (freshman) students who submitted test scores. Do not include partial test scores
(e.g., mathematics scores but not critical reading for a category of students) or combine other standardized
test results (such as TOEFL) in this item. Do not convert SAT scores to ACT scores and vice versa. The 25th
percentile is the score that 25 percent scored at or below; the 75th percentile score is the one that 25 percent
scored at or above.
Number submitting SAT scores
Page 9
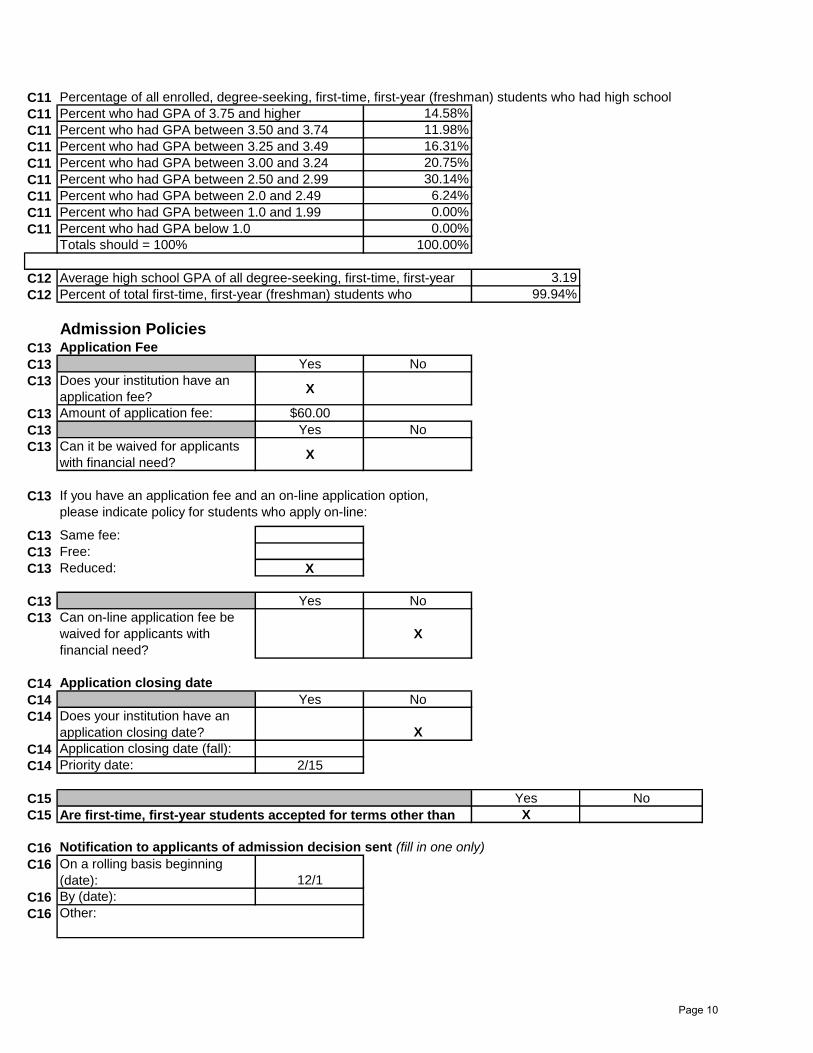
C11
C11 14.58%
C11 11.98%
C11 16.31%
C11 20.75%
C11 30.14%
C11 6.24%
C11 0.00%
C11 0.00%
100.00%
C12 3.19
C12 99.94%
Admission PoliciesC13 Application Fee
C13 Yes No
C13 Does your institution have an
application fee?X
C13 Amount of application fee: $60.00
C13 Yes No
C13 Can it be waived for applicants
with financial need?X
C13
C13 Same fee:
C13 Free:
C13 Reduced: X
C13 Yes No
C13 Can on-line application fee be
waived for applicants with
financial need?
X
C14 Application closing date
C14 Yes No
C14 Does your institution have an
application closing date? X
C14 Application closing date (fall):
C14 Priority date: 2/15
C15 Yes No
C15 X
C16 Notification to applicants of admission decision sent (fill in one only)
C16 On a rolling basis beginning
(date): 12/1
C16 By (date):
C16 Other:
Totals should = 100%
Average high school GPA of all degree-seeking, first-time, first-year
Percent of total first-time, first-year (freshman) students who
If you have an application fee and an on-line application option,
please indicate policy for students who apply on-line:
Are first-time, first-year students accepted for terms other than
Percent who had GPA between 3.25 and 3.49
Percent who had GPA between 3.00 and 3.24
Percent who had GPA between 2.50 and 2.99
Percent who had GPA between 2.0 and 2.49
Percent who had GPA between 1.0 and 1.99
Percent who had GPA below 1.0
Percentage of all enrolled, degree-seeking, first-time, first-year (freshman) students who had high school
Percent who had GPA of 3.75 and higher
Percent who had GPA between 3.50 and 3.74
Page 10
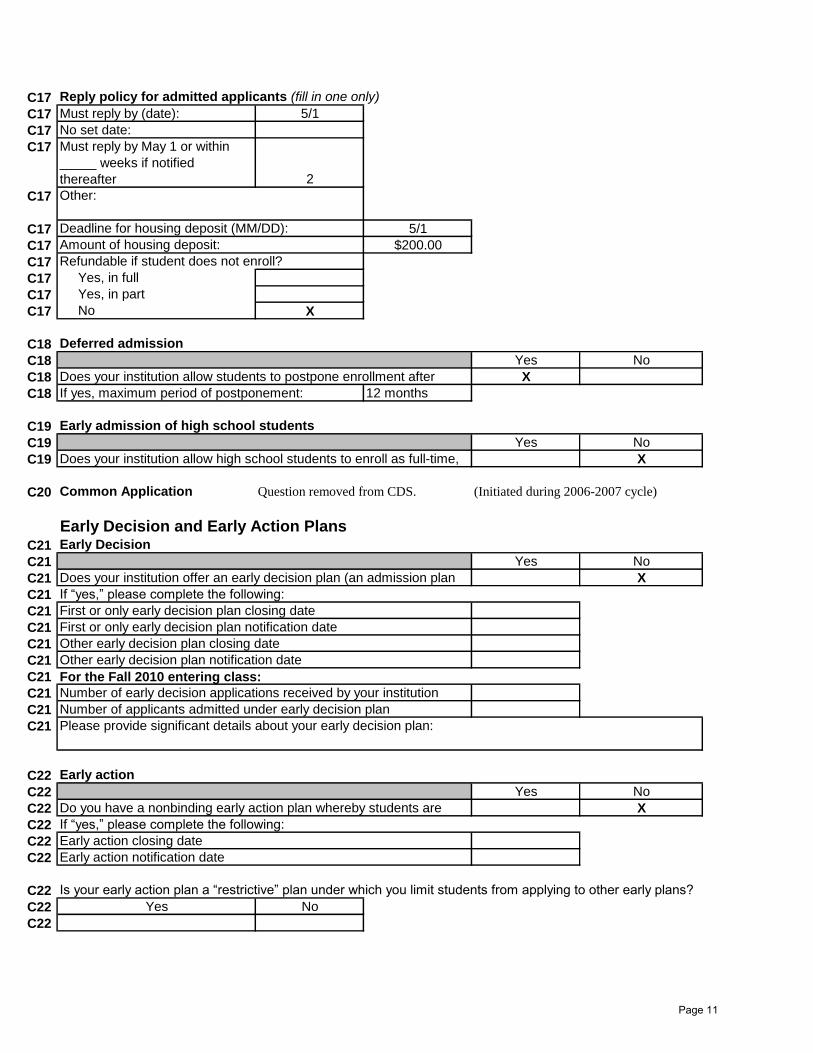
C17 Reply policy for admitted applicants (fill in one only)
C17 Must reply by (date): 5/1
C17 No set date:
C17 Must reply by May 1 or within
_____ weeks if notified
thereafter 2
C17 Other:
C17 5/1
C17 $200.00
C17
C17 Yes, in full
C17 Yes, in part
C17 No X
C18 Deferred admission
C18 Yes No
C18 X
C18 12 months
C19 Early admission of high school students
C19 Yes No
C19 X
C20 Common Application (Initiated during 2006-2007 cycle)
Early Decision and Early Action PlansC21 Early Decision
C21 Yes No
C21 X
C21
C21
C21
C21
C21
C21
C21
C21
C21
C22 Early action
C22 Yes No
C22 X
C22
C22
C22
C22
C22 Yes No
C22
Early action notification date
Is your early action plan a “restrictive” plan under which you limit students from applying to other early plans?
Number of applicants admitted under early decision plan
Please provide significant details about your early decision plan:
Do you have a nonbinding early action plan whereby students are
If “yes,” please complete the following:
Early action closing date
First or only early decision plan closing date
First or only early decision plan notification date
Other early decision plan closing date
Other early decision plan notification date
For the Fall 2010 entering class:
Number of early decision applications received by your institution
Does your institution allow high school students to enroll as full-time,
Question removed from CDS.
Does your institution offer an early decision plan (an admission plan
If “yes,” please complete the following:
Deadline for housing deposit (MM/DD):
Amount of housing deposit:
Refundable if student does not enroll?
Does your institution allow students to postpone enrollment after
If yes, maximum period of postponement:
Page 11
Common Data Set 2010-11
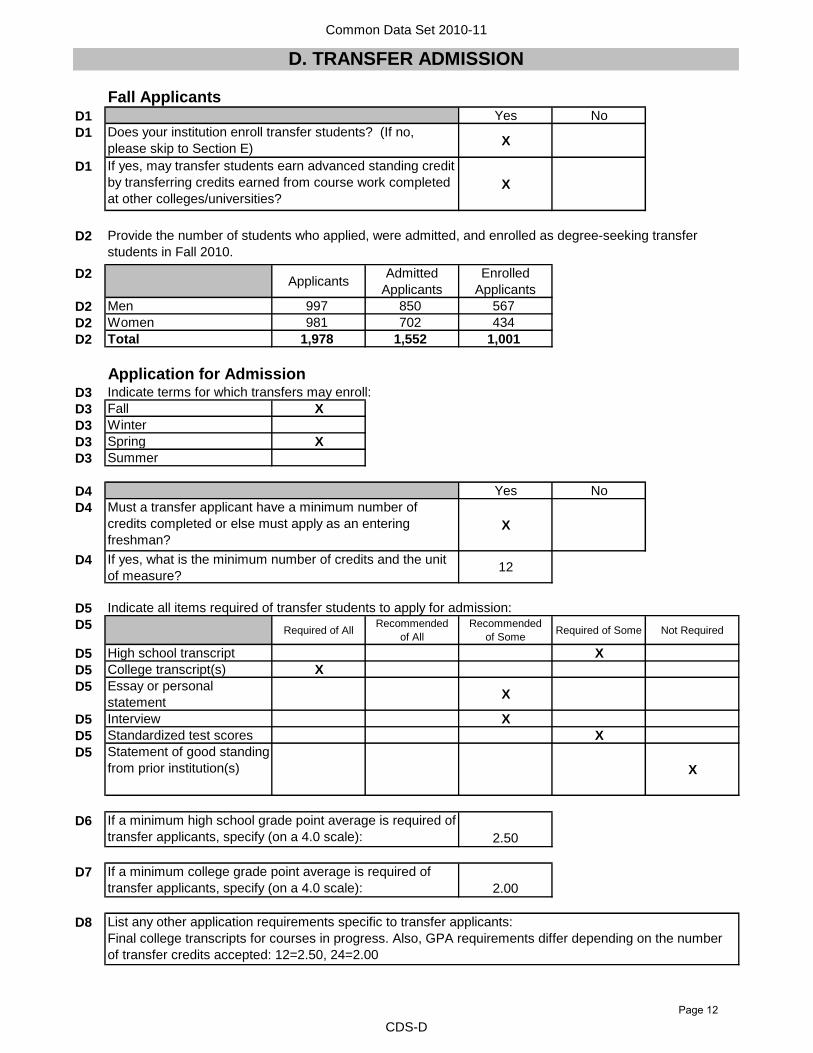
Fall ApplicantsD1 Yes No
D1X
D1
X
D2
D2Applicants
Admitted
Applicants
Enrolled
Applicants
D2 Men 997 850 567
D2 Women 981 702 434
D2 Total 1,978 1,552 1,001
D3
D3 Fall X
D3 Winter
D3 Spring X
D3 Summer
D4 Yes No
D4
X
D412
D5
D5 Required of AllRecommended
of All
Recommended
of SomeRequired of Some Not Required
D5 High school transcript X
D5 College transcript(s) X
D5 Essay or personal
statementX
D5 Interview X
D5 Standardized test scores X
D5 Statement of good standing
from prior institution(s) X
D6
2.50
D7
2.00
D8
Indicate terms for which transfers may enroll:
D. TRANSFER ADMISSION
Provide the number of students who applied, were admitted, and enrolled as degree-seeking transfer
students in Fall 2010.
Indicate all items required of transfer students to apply for admission:
If a minimum high school grade point average is required of
transfer applicants, specify (on a 4.0 scale):
Does your institution enroll transfer students? (If no,
please skip to Section E)
If yes, may transfer students earn advanced standing credit
by transferring credits earned from course work completed
at other colleges/universities?
If yes, what is the minimum number of credits and the unit
of measure?
Application for Admission
Must a transfer applicant have a minimum number of
credits completed or else must apply as an entering
freshman?
If a minimum college grade point average is required of
transfer applicants, specify (on a 4.0 scale):
List any other application requirements specific to transfer applicants:
Final college transcripts for courses in progress. Also, GPA requirements differ depending on the number
of transfer credits accepted: 12=2.50, 24=2.00
CDS-D
Page 12
Common Data Set 2010-11
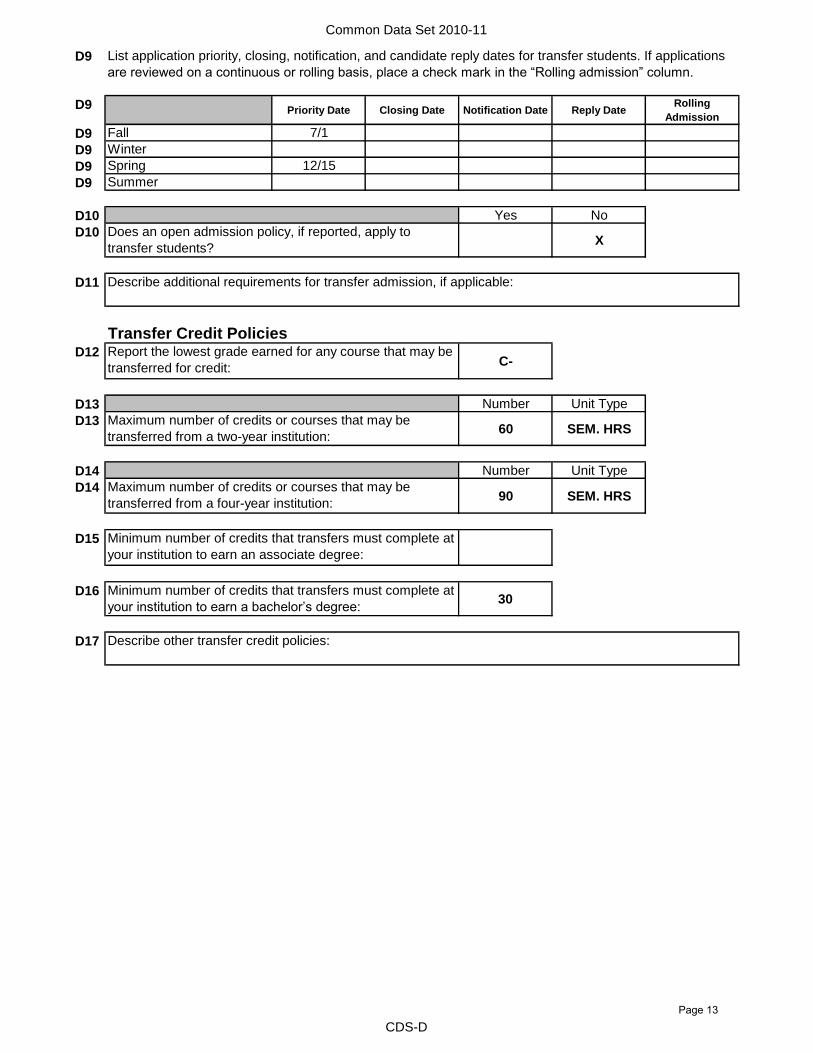
D9
D9 Priority Date Closing Date Notification Date Reply DateRolling
Admission
D9 Fall 7/1
D9 Winter
D9 Spring 12/15
D9 Summer
D10 Yes No
D10X
D11
D12C-
D13 Number Unit Type
D1360 SEM. HRS
D14 Number Unit Type
D1490 SEM. HRS
D15
D1630
D17
List application priority, closing, notification, and candidate reply dates for transfer students. If applications
are reviewed on a continuous or rolling basis, place a check mark in the “Rolling admission” column.
Describe other transfer credit policies:
Report the lowest grade earned for any course that may be
transferred for credit:
Maximum number of credits or courses that may be
transferred from a two-year institution:
Maximum number of credits or courses that may be
transferred from a four-year institution:
Minimum number of credits that transfers must complete at
your institution to earn an associate degree:
Does an open admission policy, if reported, apply to
transfer students?
Describe additional requirements for transfer admission, if applicable:
Transfer Credit Policies
Minimum number of credits that transfers must complete at
your institution to earn a bachelor’s degree:
CDS-D
Page 13

Common Data Set 2010-11
E1
E1 Accelerated program X
E1 Cooperative education program X
E1 Cross-registration X
E1 Distance learning X
E1 Double major X
E1 Dual enrollment X
E1 English as a Second Language (ESL)
E1 Exchange student program (domestic)
E1 External degree program
E1 Honors Program X
E1 Independent study X
E1 Internships X
E1 Liberal arts/career combination X
E1 Student-designed major
E1 Study abroad X
E1 Teacher certification program X
E1 Weekend college
E1 Other (specify):
E2 This question has been removed from the Common Data Set.
E3 Areas in which all or most students are required to complete some course
work prior to graduation:E3 Arts/fine arts X
E3 Computer literacy
E3 English (including composition) X
E3 Foreign languages X
E3 History X
E3 Humanities X
E3 Mathematics X
E3 Philosophy
E3 Sciences (biological or physical) X
E3 Social science X
E3 Other (describe):
Library Collections: The CDS Publishers will collect library data again
when a new Academic Libraries Survey is in place.
E. ACADEMIC OFFERINGS AND POLICIESSpecial study options: Identify those programs available at your institution. Refer to the glossary
for definitions.
CDS-E
Page 14
Common Data Set 2010-11
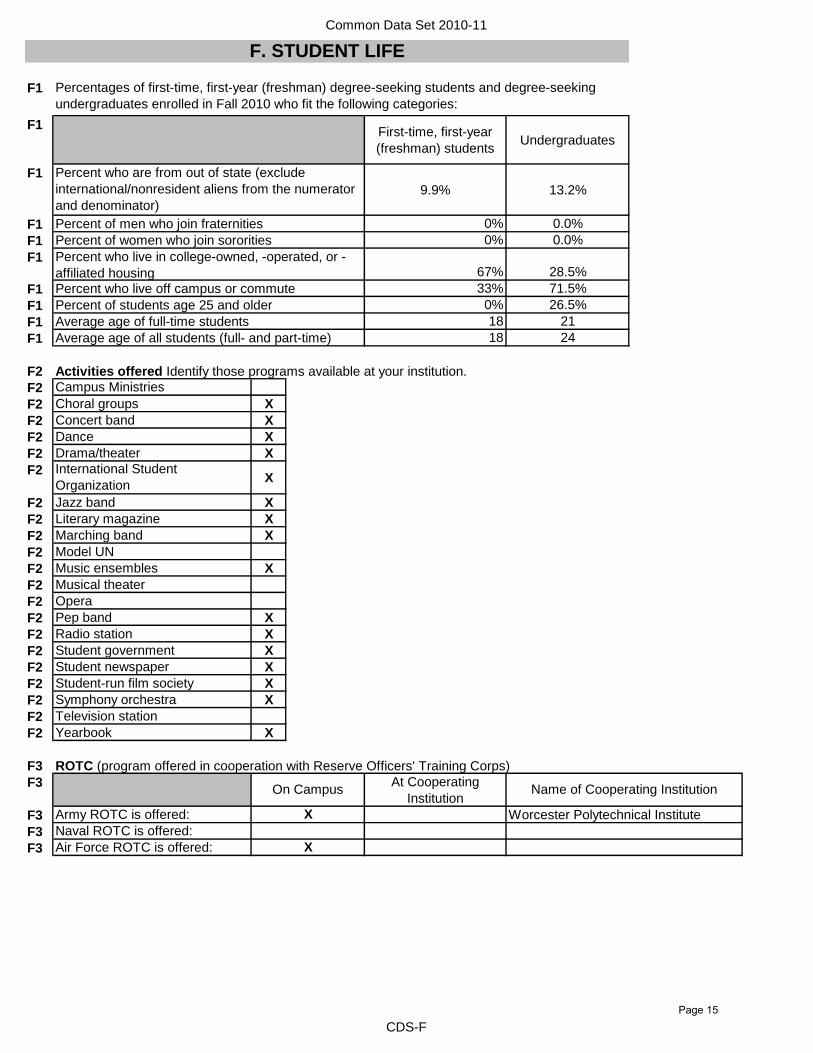
F1
F1First-time, first-year
(freshman) students Undergraduates
F1
9.9% 13.2%
F1 0% 0.0%
F1 0% 0.0%
F167% 28.5%
F1 33% 71.5%
F1 0% 26.5%
F1 18 21
F1 18 24
F2
F2 Campus Ministries
F2 Choral groups X
F2 Concert band X
F2 Dance X
F2 Drama/theater X
F2 International Student
OrganizationX
F2 Jazz band X
F2 Literary magazine X
F2 Marching band X
F2 Model UN
F2 Music ensembles X
F2 Musical theater
F2 Opera
F2 Pep band X
F2 Radio station X
F2 Student government X
F2 Student newspaper X
F2 Student-run film society X
F2 Symphony orchestra X
F2 Television station
F2 Yearbook X
F3
F3 At Cooperating
Institution
F3 Army ROTC is offered:
F3 Naval ROTC is offered:
F3 Air Force ROTC is offered:
Percent who live in college-owned, -operated, or -
affiliated housing
F. STUDENT LIFE
Percent who are from out of state (exclude
international/nonresident aliens from the numerator
and denominator)
Percent of women who join sororities
Percent of men who join fraternities
Percentages of first-time, first-year (freshman) degree-seeking students and degree-seeking
undergraduates enrolled in Fall 2010 who fit the following categories:
Activities offered Identify those programs available at your institution.
Percent who live off campus or commute
Percent of students age 25 and older
Average age of full-time students
Average age of all students (full- and part-time)
X
X
Worcester Polytechnical Institute
On Campus
ROTC (program offered in cooperation with Reserve Officers' Training Corps)
Name of Cooperating Institution
CDS-F
Page 15
Common Data Set 2010-11
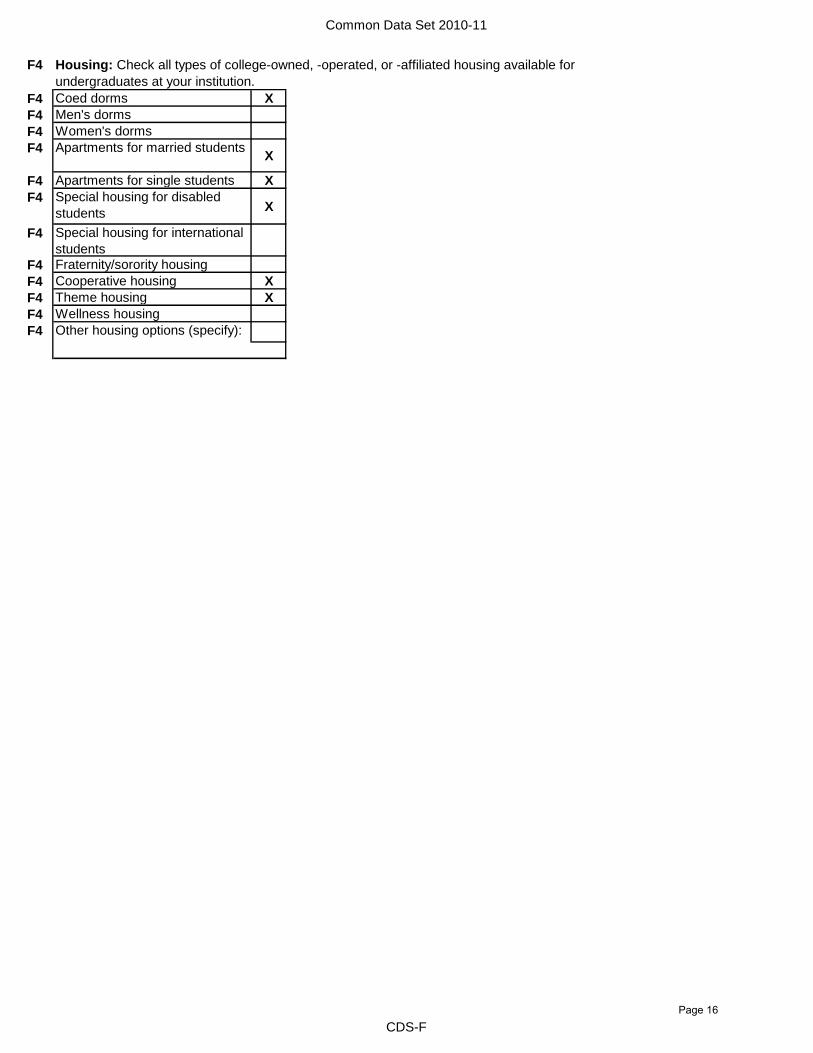
F4
F4 Coed dorms X
F4 Men's dorms
F4 Women's dorms
F4 Apartments for married studentsX
F4 Apartments for single students X
F4 Special housing for disabled
studentsX
F4 Special housing for international
students
F4 Fraternity/sorority housing
F4 Cooperative housing X
F4 Theme housing X
F4 Wellness housing
F4 Other housing options (specify):
Housing: Check all types of college-owned, -operated, or -affiliated housing available for
undergraduates at your institution.
CDS-F
Page 16
Common Data Set 2010-11
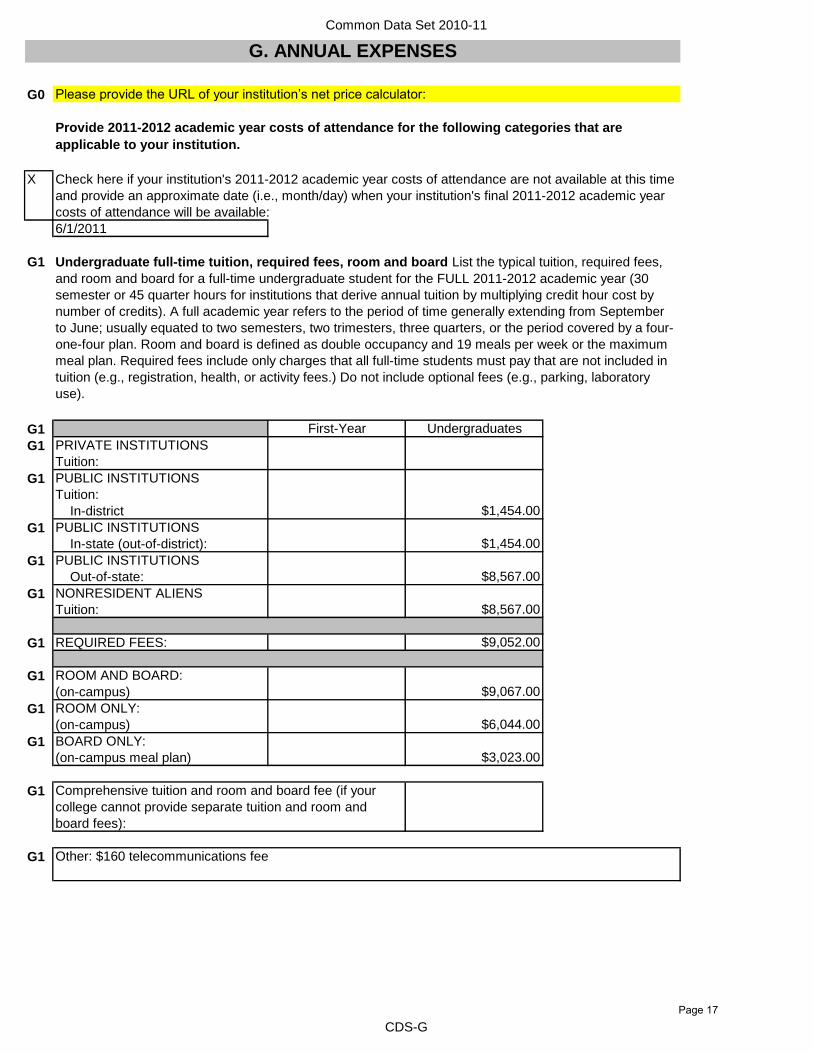
G0 Please provide the URL of your institution’s net price calculator:
X
6/1/2011
G1
G1 First-Year Undergraduates
G1 PRIVATE INSTITUTIONS
Tuition:
G1 PUBLIC INSTITUTIONS
Tuition:
In-district $1,454.00
G1 PUBLIC INSTITUTIONS
In-state (out-of-district): $1,454.00
G1 PUBLIC INSTITUTIONS
Out-of-state: $8,567.00
G1 NONRESIDENT ALIENS
Tuition: $8,567.00
G1 REQUIRED FEES: $9,052.00
G1 ROOM AND BOARD:
(on-campus) $9,067.00
G1 ROOM ONLY:
(on-campus) $6,044.00
G1 BOARD ONLY:
(on-campus meal plan) $3,023.00
G1
G1
G. ANNUAL EXPENSES
Provide 2011-2012 academic year costs of attendance for the following categories that are
applicable to your institution.
Undergraduate full-time tuition, required fees, room and board List the typical tuition, required fees,
and room and board for a full-time undergraduate student for the FULL 2011-2012 academic year (30
semester or 45 quarter hours for institutions that derive annual tuition by multiplying credit hour cost by
number of credits). A full academic year refers to the period of time generally extending from September
to June; usually equated to two semesters, two trimesters, three quarters, or the period covered by a four-
one-four plan. Room and board is defined as double occupancy and 19 meals per week or the maximum
meal plan. Required fees include only charges that all full-time students must pay that are not included in
tuition (e.g., registration, health, or activity fees.) Do not include optional fees (e.g., parking, laboratory
use).
Comprehensive tuition and room and board fee (if your
college cannot provide separate tuition and room and
board fees):
Other: $160 telecommunications fee
Check here if your institution's 2011-2012 academic year costs of attendance are not available at this time
and provide an approximate date (i.e., month/day) when your institution's final 2011-2012 academic year
costs of attendance will be available:
CDS-G
Page 17

Common Data Set 2010-11
G2 Minimum Maximum
G2
12 18
G3 Yes No
G3X
G4 Yes No
G4X
G4%
G4
G5
G5Residents
Commuters
(living at home)
Commuters
(not living at home)
G5 Books and supplies $1,200 $1,200 $1,200
G5 Room only
G5 Board only $1,500
G5 Room and board total (if your
college cannot provide separate
room and board figures for
commuters not living at home): $3,900
G5 Transportation $500 $1,000 $1,000
G5 Other expenses $808 $808 $808
G6
G6 PRIVATE INSTITUTIONS:
G6 PUBLIC INSTITUTIONS
In-district: $61.00
G6 PUBLIC INSTITUTIONS
In-state (out-of-district): $61.00
G6 PUBLIC INSTITUTIONS
Out-of-state: $357.00
G6 NONRESIDENT ALIENS:
$357.00
Provide the estimated expenses for a typical full-time undergraduate student:
Undergraduate per-credit-hour charges (tuition only)
Number of credits per term a student can take for the
stated full-time tuition
Do tuition and fees vary by year of study (e.g., sophomore,
junior, senior)?
Do tuition and fees vary by undergraduate instructional
program?
If yes, what percentage of full-time undergraduates pay
more than the tuition and fees reported in G1?
CDS-G
Page 18
Common Data Set 2010-11
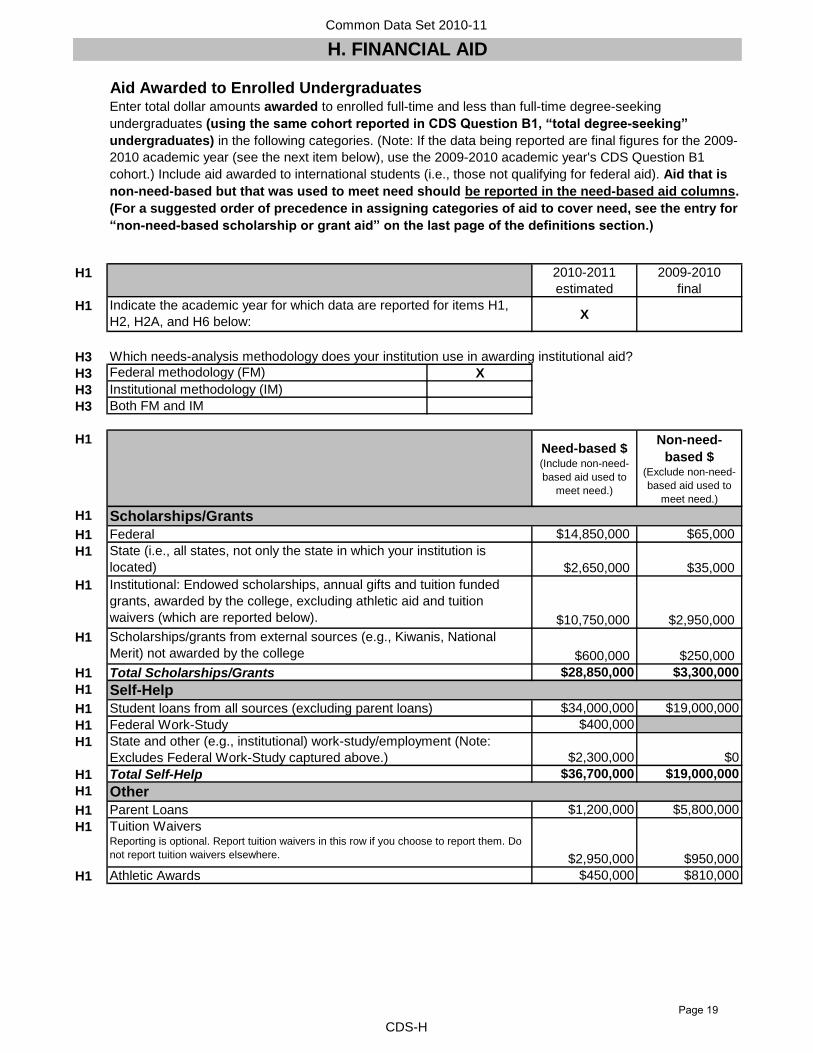
H1 2010-2011
estimated
2009-2010
final
H1X
H3
H3 X
H3
H3
H1Need-based $ (Include non-need-
based aid used to
meet need.)
Non-need-
based $ (Exclude non-need-
based aid used to
meet need.)
H1
H1 $14,850,000 $65,000
H1
$2,650,000 $35,000
H1
$10,750,000 $2,950,000
H1
$600,000 $250,000
H1 $28,850,000 $3,300,000
H1
H1 $34,000,000 $19,000,000
H1 $400,000
H1
$2,300,000 $0
H1 $36,700,000 $19,000,000
H1
H1 $1,200,000 $5,800,000
H1
$2,950,000 $950,000
H1 $450,000 $810,000Athletic Awards
Parent Loans
Tuition WaiversReporting is optional. Report tuition waivers in this row if you choose to report them. Do
not report tuition waivers elsewhere.
State (i.e., all states, not only the state in which your institution is
located)
Institutional: Endowed scholarships, annual gifts and tuition funded
grants, awarded by the college, excluding athletic aid and tuition
waivers (which are reported below).
Scholarships/grants from external sources (e.g., Kiwanis, National
Merit) not awarded by the college
Total Scholarships/Grants
Self-Help
Student loans from all sources (excluding parent loans)
H. FINANCIAL AID
Scholarships/Grants
Federal
Both FM and IM
Which needs-analysis methodology does your institution use in awarding institutional aid?
Federal methodology (FM)
Institutional methodology (IM)
Aid Awarded to Enrolled UndergraduatesEnter total dollar amounts awarded to enrolled full-time and less than full-time degree-seeking
undergraduates (using the same cohort reported in CDS Question B1, “total degree-seeking”
undergraduates) in the following categories. (Note: If the data being reported are final figures for the 2009-
2010 academic year (see the next item below), use the 2009-2010 academic year's CDS Question B1
cohort.) Include aid awarded to international students (i.e., those not qualifying for federal aid). Aid that is
non-need-based but that was used to meet need should be reported in the need-based aid columns.
(For a suggested order of precedence in assigning categories of aid to cover need, see the entry for
“non-need-based scholarship or grant aid” on the last page of the definitions section.)
Indicate the academic year for which data are reported for items H1,
H2, H2A, and H6 below:
Federal Work-Study
State and other (e.g., institutional) work-study/employment (Note:
Excludes Federal Work-Study captured above.)
Total Self-Help
Other
CDS-H
Page 19
Common Data Set 2010-11
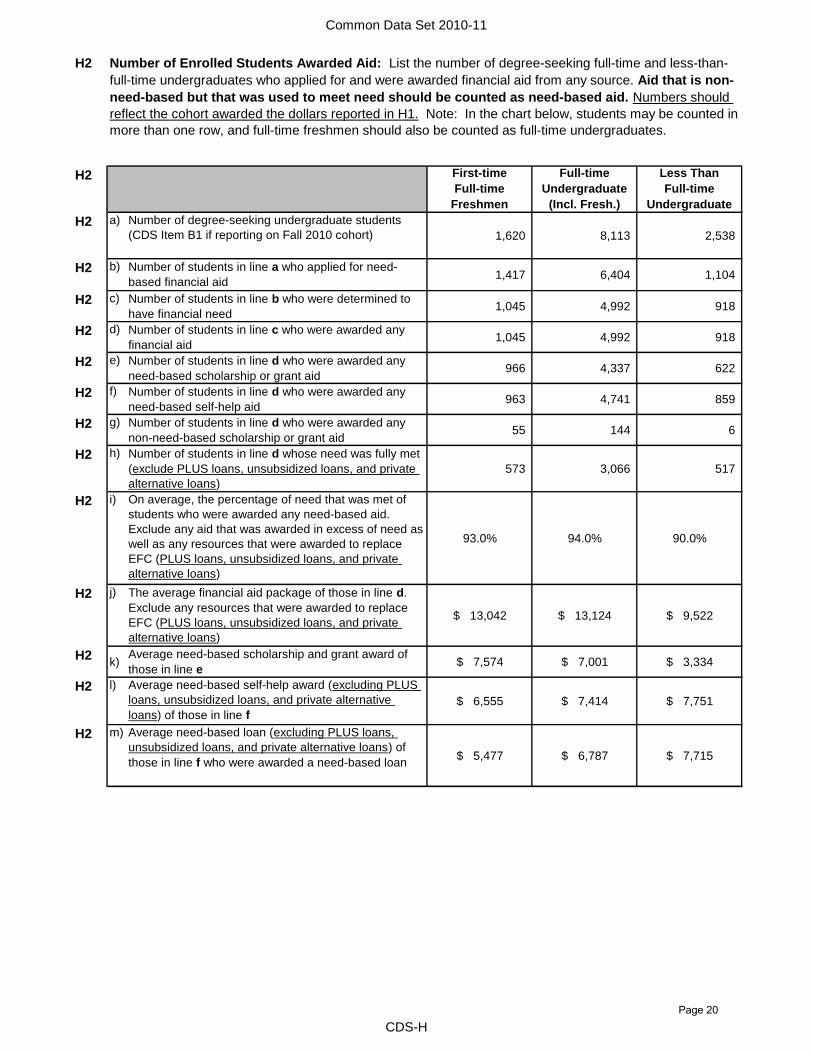
H2
H2 First-time
Full-time
Freshmen
Full-time
Undergraduate
(Incl. Fresh.)
Less Than
Full-time
Undergraduate
H2 a) Number of degree-seeking undergraduate students
(CDS Item B1 if reporting on Fall 2010 cohort) 1,620 8,113 2,538
H2 b) Number of students in line a who applied for need-
based financial aid1,417 6,404 1,104
H2 c) Number of students in line b who were determined to
have financial need1,045 4,992 918
H2 d) Number of students in line c who were awarded any
financial aid1,045 4,992 918
H2 e) Number of students in line d who were awarded any
need-based scholarship or grant aid966 4,337 622
H2 f) Number of students in line d who were awarded any
need-based self-help aid963 4,741 859
H2 g) Number of students in line d who were awarded any
non-need-based scholarship or grant aid55 144 6
H2 h) Number of students in line d whose need was fully met
(exclude PLUS loans, unsubsidized loans, and private
alternative loans)
573 3,066 517
H2 i) On average, the percentage of need that was met of
students who were awarded any need-based aid.
Exclude any aid that was awarded in excess of need as
well as any resources that were awarded to replace
EFC (PLUS loans, unsubsidized loans, and private
alternative loans)
93.0% 94.0% 90.0%
H2 j) The average financial aid package of those in line d.
Exclude any resources that were awarded to replace
EFC (PLUS loans, unsubsidized loans, and private
alternative loans)
$ 13,042 $ 13,124 $ 9,522
H2k)
Average need-based scholarship and grant award of
those in line e$ 7,574 $ 7,001 $ 3,334
H2 l) Average need-based self-help award (excluding PLUS
loans, unsubsidized loans, and private alternative
loans) of those in line f$ 6,555 $ 7,414 $ 7,751
H2 m) Average need-based loan (excluding PLUS loans,
unsubsidized loans, and private alternative loans) of
those in line f who were awarded a need-based loan$ 5,477 $ 6,787 $ 7,715
Number of Enrolled Students Awarded Aid: List the number of degree-seeking full-time and less-than-
full-time undergraduates who applied for and were awarded financial aid from any source. Aid that is non-
need-based but that was used to meet need should be counted as need-based aid. Numbers should
reflect the cohort awarded the dollars reported in H1. Note: In the chart below, students may be counted in
more than one row, and full-time freshmen should also be counted as full-time undergraduates.
CDS-H
Page 20
Common Data Set 2010-11
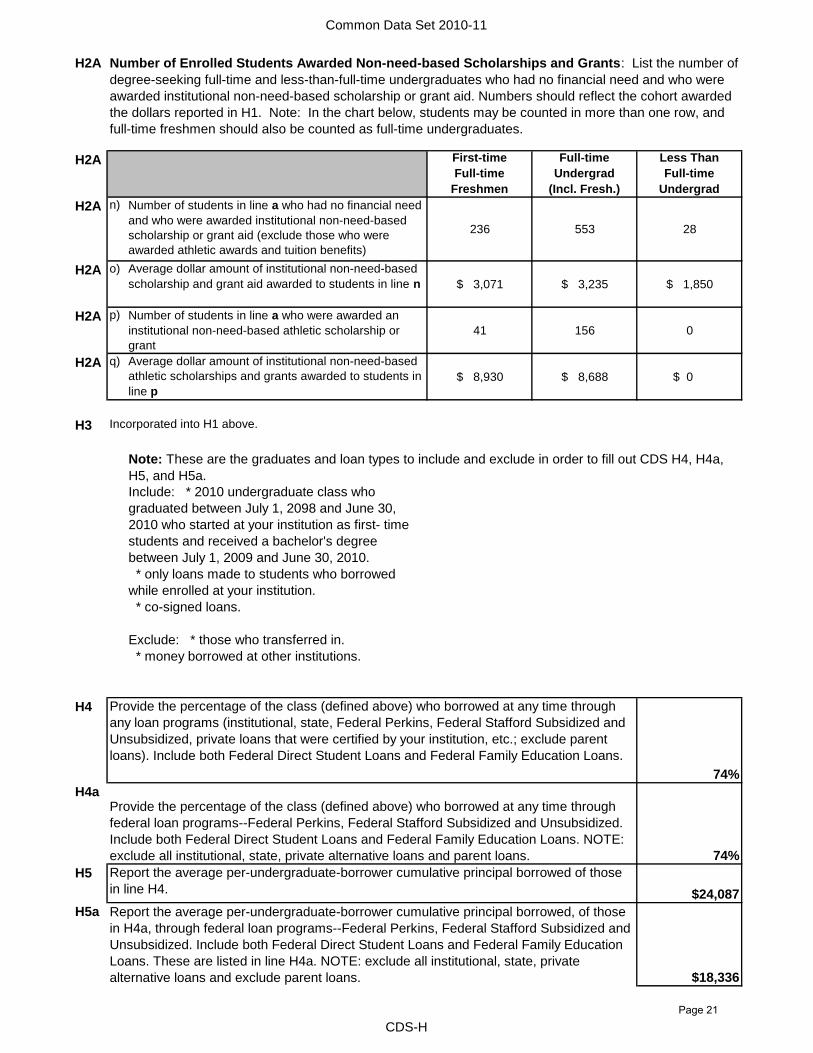
H2A
H2A First-time
Full-time
Freshmen
Full-time
Undergrad
(Incl. Fresh.)
Less Than
Full-time
Undergrad
H2A n) Number of students in line a who had no financial need
and who were awarded institutional non-need-based
scholarship or grant aid (exclude those who were
awarded athletic awards and tuition benefits)
236 553 28
H2A o) Average dollar amount of institutional non-need-based
scholarship and grant aid awarded to students in line n $ 3,071 $ 3,235 $ 1,850
H2A p) Number of students in line a who were awarded an
institutional non-need-based athletic scholarship or
grant
41 156 0
H2A q) Average dollar amount of institutional non-need-based
athletic scholarships and grants awarded to students in
line p
$ 8,930 $ 8,688 $ 0
H3 Incorporated into H1 above.
Include: * 2010 undergraduate class who
graduated between July 1, 2098 and June 30,
2010 who started at your institution as first- time
students and received a bachelor's degree
between July 1, 2009 and June 30, 2010.
* only loans made to students who borrowed
while enrolled at your institution.
* co-signed loans.
Exclude: * those who transferred in.
* money borrowed at other institutions.
H4
74%
H4a
74%
H5
$24,087
H5a
$18,336
Report the average per-undergraduate-borrower cumulative principal borrowed of those
in line H4.
Number of Enrolled Students Awarded Non-need-based Scholarships and Grants: List the number of
degree-seeking full-time and less-than-full-time undergraduates who had no financial need and who were
awarded institutional non-need-based scholarship or grant aid. Numbers should reflect the cohort awarded
the dollars reported in H1. Note: In the chart below, students may be counted in more than one row, and
full-time freshmen should also be counted as full-time undergraduates.
Provide the percentage of the class (defined above) who borrowed at any time through
any loan programs (institutional, state, Federal Perkins, Federal Stafford Subsidized and
Unsubsidized, private loans that were certified by your institution, etc.; exclude parent
loans). Include both Federal Direct Student Loans and Federal Family Education Loans.
Note: These are the graduates and loan types to include and exclude in order to fill out CDS H4, H4a,
H5, and H5a.
Provide the percentage of the class (defined above) who borrowed at any time through
federal loan programs--Federal Perkins, Federal Stafford Subsidized and Unsubsidized.
Include both Federal Direct Student Loans and Federal Family Education Loans. NOTE:
exclude all institutional, state, private alternative loans and parent loans.
Report the average per-undergraduate-borrower cumulative principal borrowed, of those
in H4a, through federal loan programs--Federal Perkins, Federal Stafford Subsidized and
Unsubsidized. Include both Federal Direct Student Loans and Federal Family Education
Loans. These are listed in line H4a. NOTE: exclude all institutional, state, private
alternative loans and exclude parent loans.
CDS-H
Page 21
Common Data Set 2010-11
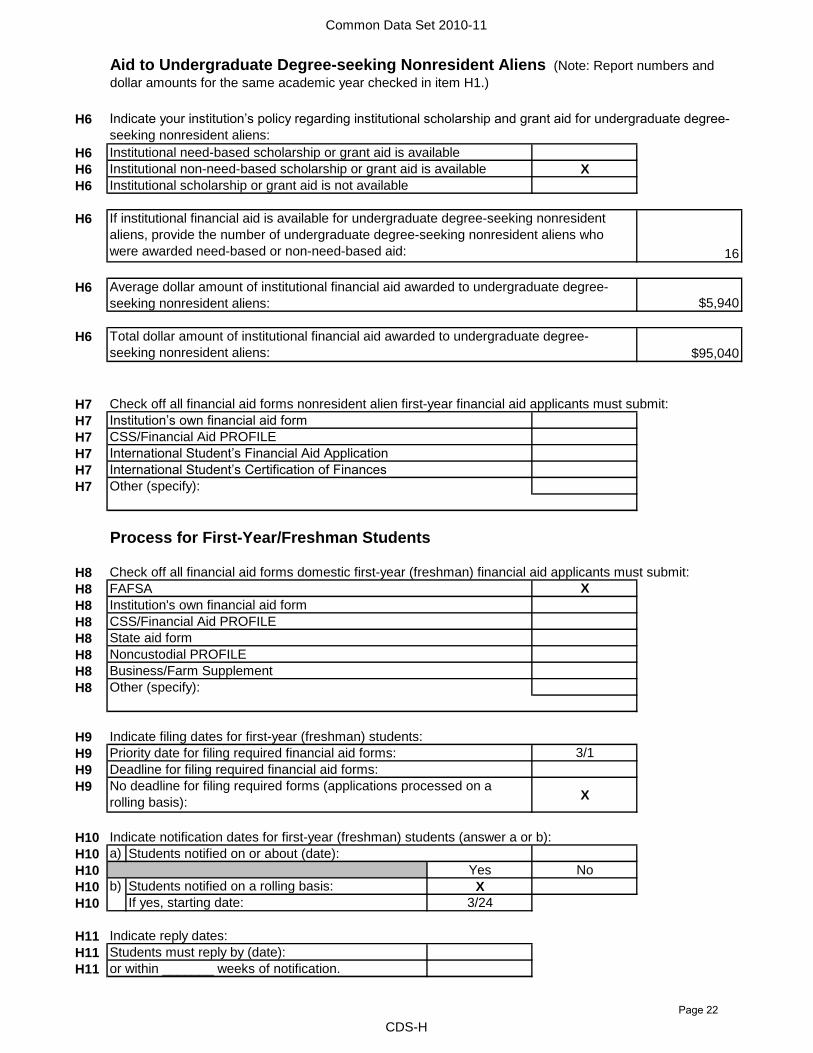
H6
H6
H6 X
H6
H6
16
H6
$5,940
H6
$95,040
H7
H7
H7
H7
H7
H7
Process for First-Year/Freshman Students
H8
H8 X
H8
H8
H8
H8
H8
H8
H9
H9 3/1
H9
H9X
H10
H10 a)
H10 Yes No
H10 b) Students notified on a rolling basis: X
H10 If yes, starting date: 3/24
H11
H11
H11
CSS/Financial Aid PROFILE
International Student’s Financial Aid Application
Institutional scholarship or grant aid is not available
Average dollar amount of institutional financial aid awarded to undergraduate degree-
seeking nonresident aliens:
Check off all financial aid forms nonresident alien first-year financial aid applicants must submit:
Institution’s own financial aid form
Indicate reply dates:
Students must reply by (date):
or within _______ weeks of notification.
No deadline for filing required forms (applications processed on a
rolling basis):
Indicate notification dates for first-year (freshman) students (answer a or b):
CSS/Financial Aid PROFILE
Check off all financial aid forms domestic first-year (freshman) financial aid applicants must submit:
International Student’s Certification of Finances
Other (specify):
Students notified on or about (date):
FAFSA
Institution's own financial aid form
Indicate your institution’s policy regarding institutional scholarship and grant aid for undergraduate degree-
seeking nonresident aliens:
Aid to Undergraduate Degree-seeking Nonresident Aliens (Note: Report numbers and
dollar amounts for the same academic year checked in item H1.)
If institutional financial aid is available for undergraduate degree-seeking nonresident
aliens, provide the number of undergraduate degree-seeking nonresident aliens who
were awarded need-based or non-need-based aid:
Total dollar amount of institutional financial aid awarded to undergraduate degree-
seeking nonresident aliens:
Institutional need-based scholarship or grant aid is available
Institutional non-need-based scholarship or grant aid is available
Business/Farm Supplement
Other (specify):
State aid form
Noncustodial PROFILE
Indicate filing dates for first-year (freshman) students:
Priority date for filing required financial aid forms:
Deadline for filing required financial aid forms:
CDS-H
Page 22

Common Data Set 2010-11
Types of Aid AvailablePlease check off all types of aid available to undergraduates at your institution:
H12
H12
H12 X
H12 X
H12 X
H12 X
H12
H12
H12
H12
H13
H13
H13 X
H13 X
H13 X
H13 X
H13 X
H13
H13
H13
H14
H14 Non-Need Based Need-Based
H14 X X
H14 X
H14 X
H14 X
H14 X
H14 X
H14 X
H14 X
H14 X
H14 X
H14 X
H15
Scholarships and Grants
FEDERAL DIRECT STUDENT LOAN PROGRAM (DIRECT LOAN)
NEED-BASED:
Direct Subsidized Stafford Loans
Direct Unsubsidized Stafford Loans
Direct PLUS Loans
Other (specify):
Federal Nursing Loans
State Loans
College/university loans from institutional funds
Federal Perkins Loans
Loans
Art
Federal Pell
SEOG
State scholarships/grants
Private scholarships
Federal Nursing Scholarship
Check off criteria used in awarding institutional aid. Check all that apply.
Other (specify):
College/university scholarship or grant aid from institutional funds
United Negro College Fund
If your institution has recently implemented any major financial aid policy, program, or initiative
to make your institution more affordable to incoming students such as replacing loans with grants,
or waiving costs for families below a certain income level please provide details below:
State/district residency
Job skills
ROTC
Leadership
Athletics
Music/drama
Religious affiliation
Minority status
Academics
Alumni affiliation
CDS-H
Page 23
Common Data Set 2010-11
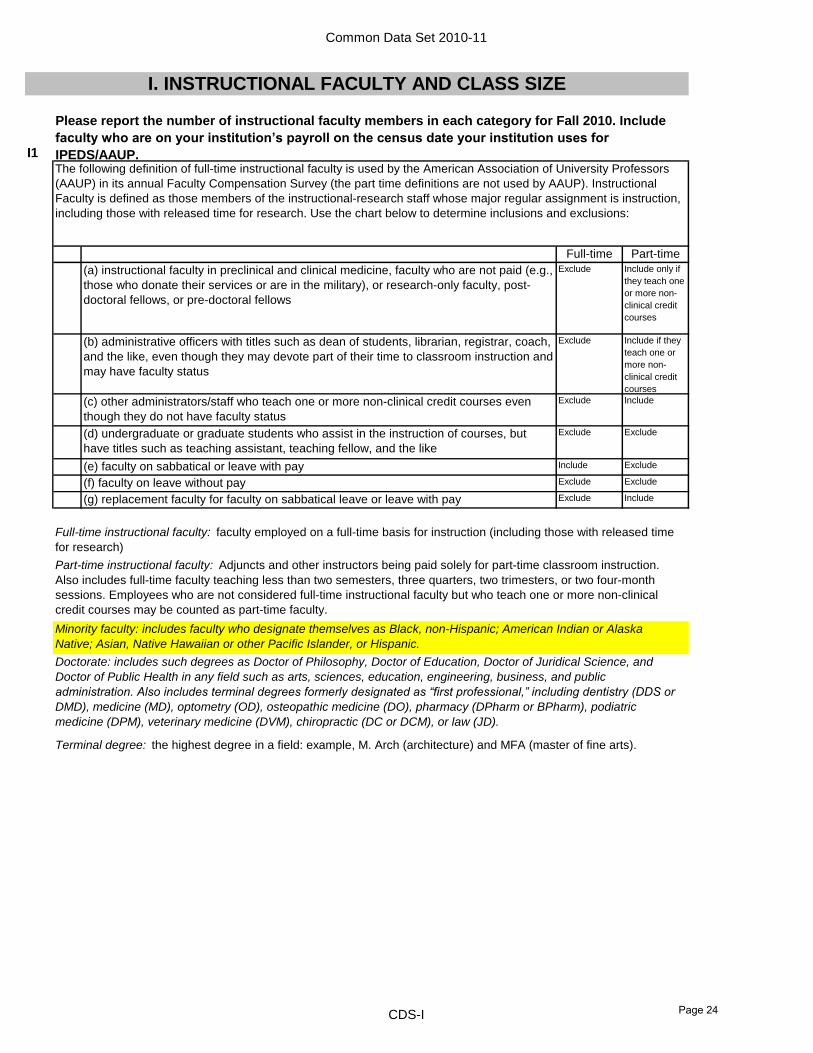
I1
Full-time Part-time
Exclude Include only if
they teach one
or more non-
clinical credit
courses
Exclude Include if they
teach one or
more non-
clinical credit
courses
Exclude Include
Exclude Exclude
Include Exclude
Exclude Exclude
Exclude Include
(e) faculty on sabbatical or leave with pay
(f) faculty on leave without pay
(g) replacement faculty for faculty on sabbatical leave or leave with pay
Please report the number of instructional faculty members in each category for Fall 2010. Include
faculty who are on your institution’s payroll on the census date your institution uses for
IPEDS/AAUP.
I. INSTRUCTIONAL FACULTY AND CLASS SIZE
The following definition of full-time instructional faculty is used by the American Association of University Professors
(AAUP) in its annual Faculty Compensation Survey (the part time definitions are not used by AAUP). Instructional
Faculty is defined as those members of the instructional-research staff whose major regular assignment is instruction,
including those with released time for research. Use the chart below to determine inclusions and exclusions:
Full-time instructional faculty: faculty employed on a full-time basis for instruction (including those with released time
for research)
Part-time instructional faculty: Adjuncts and other instructors being paid solely for part-time classroom instruction.
Also includes full-time faculty teaching less than two semesters, three quarters, two trimesters, or two four-month
sessions. Employees who are not considered full-time instructional faculty but who teach one or more non-clinical
credit courses may be counted as part-time faculty.
Minority faculty: includes faculty who designate themselves as Black, non-Hispanic; American Indian or Alaska
Native; Asian, Native Hawaiian or other Pacific Islander, or Hispanic.
Doctorate: includes such degrees as Doctor of Philosophy, Doctor of Education, Doctor of Juridical Science, and
Doctor of Public Health in any field such as arts, sciences, education, engineering, business, and public
administration. Also includes terminal degrees formerly designated as “first professional,” including dentistry (DDS or
DMD), medicine (MD), optometry (OD), osteopathic medicine (DO), pharmacy (DPharm or BPharm), podiatric
medicine (DPM), veterinary medicine (DVM), chiropractic (DC or DCM), or law (JD).
Terminal degree: the highest degree in a field: example, M. Arch (architecture) and MFA (master of fine arts).
(a) instructional faculty in preclinical and clinical medicine, faculty who are not paid (e.g.,
those who donate their services or are in the military), or research-only faculty, post-
doctoral fellows, or pre-doctoral fellows
(b) administrative officers with titles such as dean of students, librarian, registrar, coach,
and the like, even though they may devote part of their time to classroom instruction and
may have faculty status
(c) other administrators/staff who teach one or more non-clinical credit courses even
though they do not have faculty status
(d) undergraduate or graduate students who assist in the instruction of courses, but
have titles such as teaching assistant, teaching fellow, and the like
CDS-I Page 24
Common Data Set 2010-11
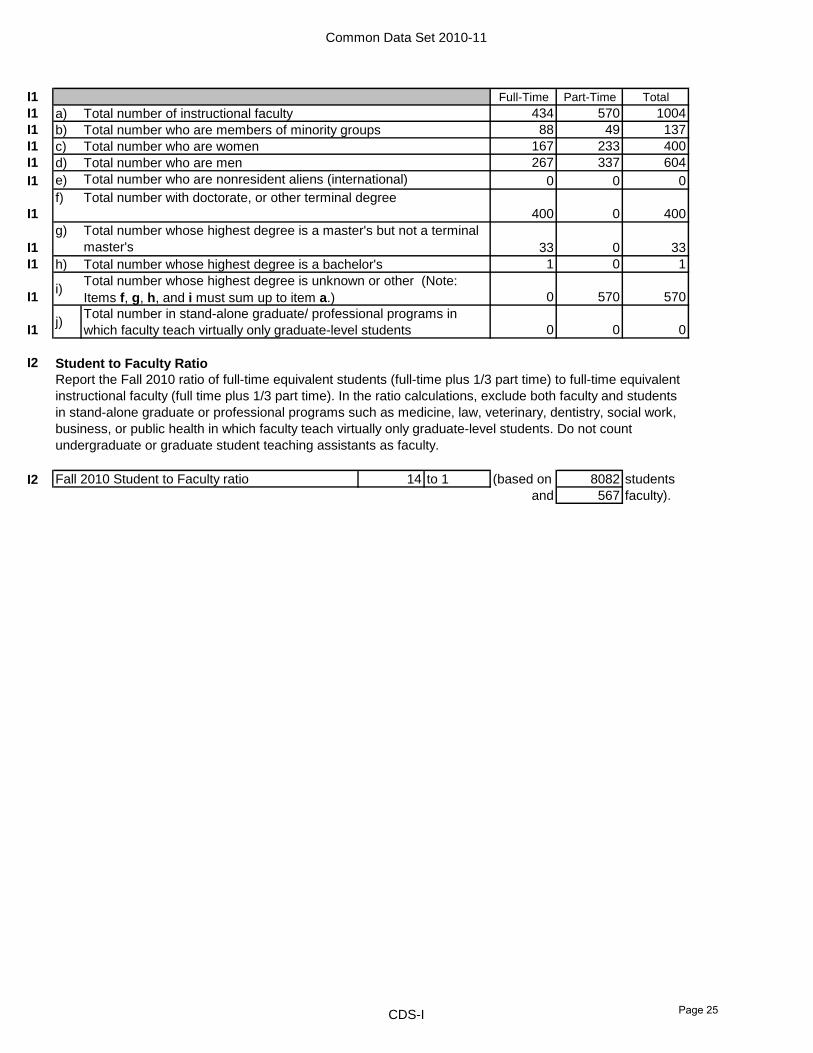
I1 Full-Time Part-Time Total
I1 a) 434 570 1004
I1 b) 88 49 137
I1 c) 167 233 400
I1 d) 267 337 604
I1 e) 0 0 0
I1
f)
400 0 400
I1
g)
33 0 33
I1 h) 1 0 1
I1i)
0 570 570
I1j)
0 0 0
I2
I2 14 to 1 (based on 8082 students
and 567 faculty).
Total number who are nonresident aliens (international)
Total number who are members of minority groups
Total number who are women
Total number who are men
Student to Faculty Ratio
Report the Fall 2010 ratio of full-time equivalent students (full-time plus 1/3 part time) to full-time equivalent
instructional faculty (full time plus 1/3 part time). In the ratio calculations, exclude both faculty and students
in stand-alone graduate or professional programs such as medicine, law, veterinary, dentistry, social work,
business, or public health in which faculty teach virtually only graduate-level students. Do not count
undergraduate or graduate student teaching assistants as faculty.
Fall 2010 Student to Faculty ratio
Total number with doctorate, or other terminal degree
Total number whose highest degree is a master's but not a terminal
master's
Total number whose highest degree is a bachelor's
Total number whose highest degree is unknown or other (Note:
Items f, g, h, and i must sum up to item a.)
Total number in stand-alone graduate/ professional programs in
which faculty teach virtually only graduate-level students
Total number of instructional faculty
CDS-I Page 25
Common Data Set 2010-11
I3
I3
I3
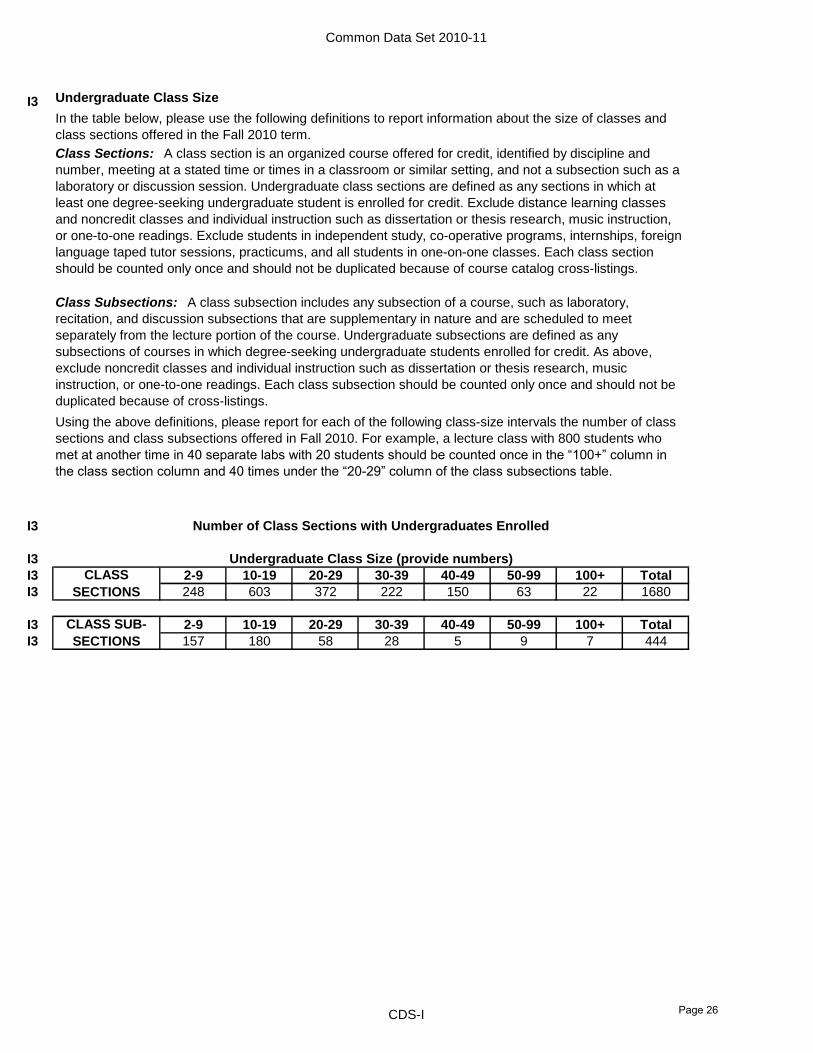
I3 2-9 10-19 20-29 30-39 40-49 50-99 100+ Total
I3 248 603 372 222 150 63 22 1680
I3 2-9 10-19 20-29 30-39 40-49 50-99 100+ Total
I3 157 180 58 28 5 9 7 444
CLASS SUB-
SECTIONS
Undergraduate Class Size
Number of Class Sections with Undergraduates Enrolled
Undergraduate Class Size (provide numbers)
Class Sections: A class section is an organized course offered for credit, identified by discipline and
number, meeting at a stated time or times in a classroom or similar setting, and not a subsection such as a
laboratory or discussion session. Undergraduate class sections are defined as any sections in which at
least one degree-seeking undergraduate student is enrolled for credit. Exclude distance learning classes
and noncredit classes and individual instruction such as dissertation or thesis research, music instruction,
or one-to-one readings. Exclude students in independent study, co-operative programs, internships, foreign
language taped tutor sessions, practicums, and all students in one-on-one classes. Each class section
should be counted only once and should not be duplicated because of course catalog cross-listings.
CLASS
SECTIONS
Using the above definitions, please report for each of the following class-size intervals the number of class
sections and class subsections offered in Fall 2010. For example, a lecture class with 800 students who
met at another time in 40 separate labs with 20 students should be counted once in the “100+” column in
the class section column and 40 times under the “20-29” column of the class subsections table.
Class Subsections: A class subsection includes any subsection of a course, such as laboratory,
recitation, and discussion subsections that are supplementary in nature and are scheduled to meet
separately from the lecture portion of the course. Undergraduate subsections are defined as any
subsections of courses in which degree-seeking undergraduate students enrolled for credit. As above,
exclude noncredit classes and individual instruction such as dissertation or thesis research, music
instruction, or one-to-one readings. Each class subsection should be counted only once and should not be
duplicated because of cross-listings.
In the table below, please use the following definitions to report information about the size of classes and
class sections offered in the Fall 2010 term.
CDS-I Page 26
Common Data Set 2010-11
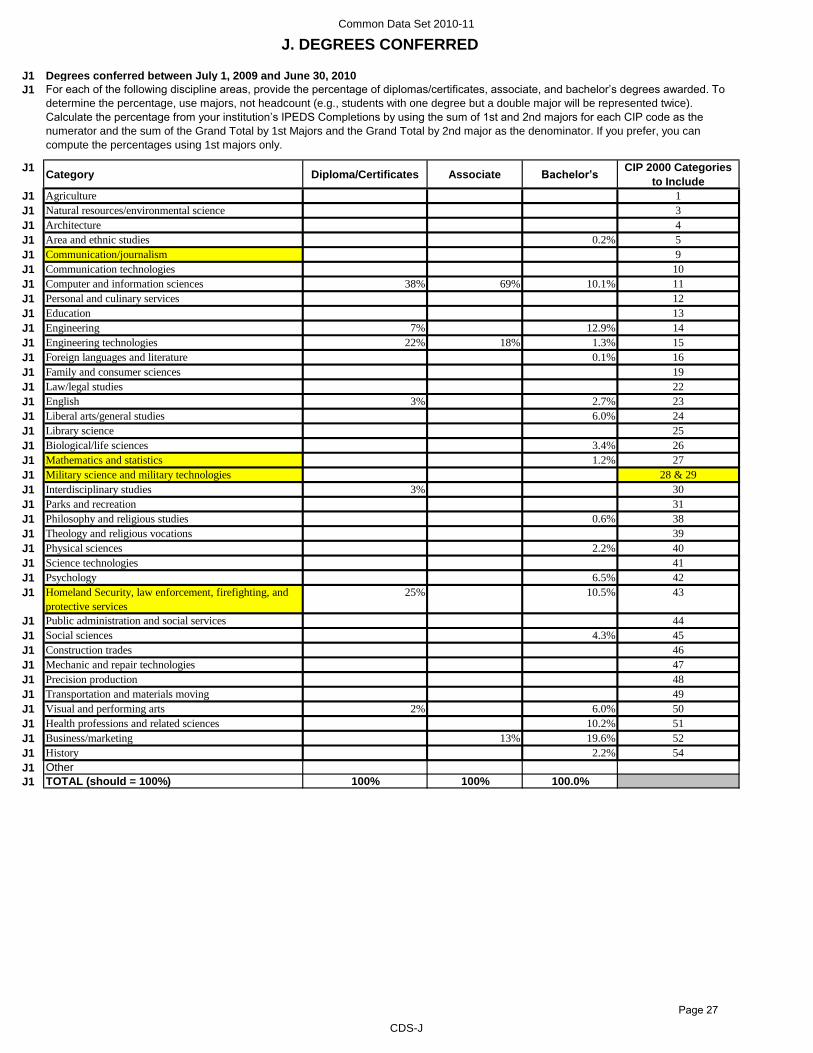
J1 Degrees conferred between July 1, 2009 and June 30, 2010
J1
J1Category Diploma/Certificates Associate Bachelor’s
CIP 2000 Categories
to Include
J1 Agriculture 1
J1 Natural resources/environmental science 3
J1 Architecture 4
J1 Area and ethnic studies 0.2% 5
J1 Communication/journalism 9
J1 Communication technologies 10
J1 Computer and information sciences 38% 69% 10.1% 11
J1 Personal and culinary services 12
J1 Education 13
J1 Engineering 7% 12.9% 14
J1 Engineering technologies 22% 18% 1.3% 15
J1 Foreign languages and literature 0.1% 16
J1 Family and consumer sciences 19
J1 Law/legal studies 22
J1 English 3% 2.7% 23
J1 Liberal arts/general studies 6.0% 24
J1 Library science 25
J1 Biological/life sciences 3.4% 26
J1 Mathematics and statistics 1.2% 27
J1 Military science and military technologies 28 & 29
J1 Interdisciplinary studies 3% 30
J1 Parks and recreation 31
J1 Philosophy and religious studies 0.6% 38
J1 Theology and religious vocations 39
J1 Physical sciences 2.2% 40
J1 Science technologies 41
J1 Psychology 6.5% 42
J1 Homeland Security, law enforcement, firefighting, and
protective services
25% 10.5% 43
J1 Public administration and social services 44
J1 Social sciences 4.3% 45
J1 Construction trades 46
J1 Mechanic and repair technologies 47
J1 Precision production 48
J1 Transportation and materials moving 49
J1 Visual and performing arts 2% 6.0% 50
J1 Health professions and related sciences 10.2% 51
J1 Business/marketing 13% 19.6% 52
J1 History 2.2% 54
J1 Other
J1 TOTAL (should = 100%) 100% 100% 100.0%
For each of the following discipline areas, provide the percentage of diplomas/certificates, associate, and bachelor’s degrees awarded. To
determine the percentage, use majors, not headcount (e.g., students with one degree but a double major will be represented twice).
Calculate the percentage from your institution’s IPEDS Completions by using the sum of 1st and 2nd majors for each CIP code as the
numerator and the sum of the Grand Total by 1st Majors and the Grand Total by 2nd major as the denominator. If you prefer, you can
compute the percentages using 1st majors only.
J. DEGREES CONFERRED
CDS-J
Page 27