AXA Mansard Insurance plc and Subsidiary Companies ... · PDF fileAXA Mansard Insurance plc...
48
AXA Mansard Insurance plc and Subsidiary Companies Consolidated Financial Statements for the period ended 31 March 2017 1
Transcript of AXA Mansard Insurance plc and Subsidiary Companies ... · PDF fileAXA Mansard Insurance plc...
AXA Mansard Insurance plc and Subsidiary Companies
Consolidated Financial Statements
for the period ended 31 March 2017
1
AXA Mansard Insurance plc and Subsidiary Companies
CERTIFICATION PURSUANT TO SECTION 60(2) OF INVESTMENT AND SECURITIES
We have reviewed the report;
(b) To the best of our knowledge, the report does not contain:
(i) Any untrue statement of a material fact, or
(ii)
(c )
(d) We:
(i) Are responsible for establishing and maintaining internal controls.
(ii)
(iii)
(iv)
We have disclosed to the auditors of the company and audit committee:
(i)
(ii)
(f)
Mrs. Rashidat Adebisi
FRC/2012/ICAN/00000000497
Chief Financial Officer Chief Executive Officer
Have present in the report our conclusions about the effectiveness of our internal controls based on our evaluation as of
that date;
All significant deficiency in the design or operation of internal controls which would adversely affect the company’s
ability to record, process, summarize and report financial data and have identified for the company’s auditors any
material weakness in internal controls, and
Any fraud, whether or not material, that involves management or other employees who have significant role in the
company’s internal controls;
We have identified in the report whether or not there were significant changes in internal controls or other factors that
could significantly affect internal controls subsequent to the date of our evaluation, including any corrective actions
with regard to significant deficiencies and material weaknesses.
Mrs. Yetunde Ilori
FRC/2012/CIIN/00000000344
Have evaluated the effectiveness of the company’s internal controls as of date within 90 days prior to the report;
ACT NO.29 OF 2007
Omit to state a material fact, which would make the statements, misleading in the light of circumstances under which
such statements were made;
To the best of our knowledge, the Financial Statements and other financial information included in the report fairly
present in all material respects the financial condition and results of operation of the company as of, and for the year
presented in the report.
Have designed such internal controls to ensure that material information relating to the company and its consolidated
subsidiaries is made known to such officers by others within those entries particularly during the year in which the
periodic reports are being prepared;
We the undersigned hereby certify the following with regards to our Management accounts for the period ended 31 March 2017
that:
2
AXA Mansard Insurance plc and Subsidiary Companies
1 General information
For the period ended 31 March 2017
Reporting entity
2 Summary of significant accounting policies
2.1 Basis of presentation and compliance with IFRS
(a) Basis of measurement
(b) Use of estimates and judgements
2.1.1
These consolidated and separate financial statements have been prepared on the historical cost basis except for the following:
- non-derivative financial instruments designated at fair value through profit or loss.
- available-for-sale financial assets are measured at fair value.
- investment property is measured at fair value.
- insurance liabilities measured at present value of future cashflows.
- share based payment at fair value or an approximation of fair value allowed by the relevant standards
AXA Mansard Insurance Plc. (‘the Company’) and its subsidiaries (together ‘the Group’) underwrite life and non-life insurance contracts. The Group
also issues a diversified portfolio of investment contracts to provide its customers with asset management solutions for their savings and retirement
needs as well as provide pension administration and management services to its customers. All these products are offered to both domestic and
foreign markets. The Group does business in Nigeria and employs over 200 people.
The Company is a public limited company incorporated and domiciled in Nigeria. The address of its registered office is:
Santa Clara Court, Plot 1412, Ahmadu Bello Way Victoria Island, Lagos, Nigeria.
These financial statements have been prepared in accordance with the International Financial Reporting Standards (IFRS) and IFRS
Interpretations Committee (IFRIC) Interpretations applicable to companies reporting under IFRS. Additional information required by national
regulations have been included where appropriate.
The consolidated financial statements comprises the consolidated statement of comprehensive income, the consolidated statement of financial
position, the consolidated statements of changes in equity, the consolidated statement of cash flows and the notes.
- investment contract liabilities at fair value.
The preparation of the consolidated financial statements in conformity with IFRSs requires management to make judgements, estimates and
assumptions that affect the application of policies and reported amounts of assets and liabilities, income and expenses. Actual results may
differ from these estimates.
Changes in accounting policy and disclosures
(a) New and amended standards and interpretations not yet adopted by the Group
A number of standards, interpretations and amendments are effective for annual period beginning after 1 January 2017 and earlier application
is permitted; however, the group has not early adopted the following new or amended standards in preparing these consolidated financial
statements:
New or amended
standardsSummary of the requirements
Possible impact on Consolidated financial
statements
IFRS 9 Financial
instruments
IFRS 9, released in July 2014, replaces the existing
guidance in IAS 39 Financial instruments: Recognition
and measurement. IFRS 9 includes revised guidance on
the reclassification and measurement of financial
instruments, a new expected credit loss model for
calculating impairment on financial assets and new
general hedge accounting requirments. It also carries
forward the guidance on recognition and derecognition
of financial instruments from IAS 39. IFRS 9 is
effective for annual reporting periods beginning on or
after 1 January 2018 with early adoption permitted.
Having assessed the impact of the new standard, the
adoption of the new standard will not have material
impact on the Group's consolidated financial statements.
3
AXA Mansard Insurance plc and Subsidiary Companies
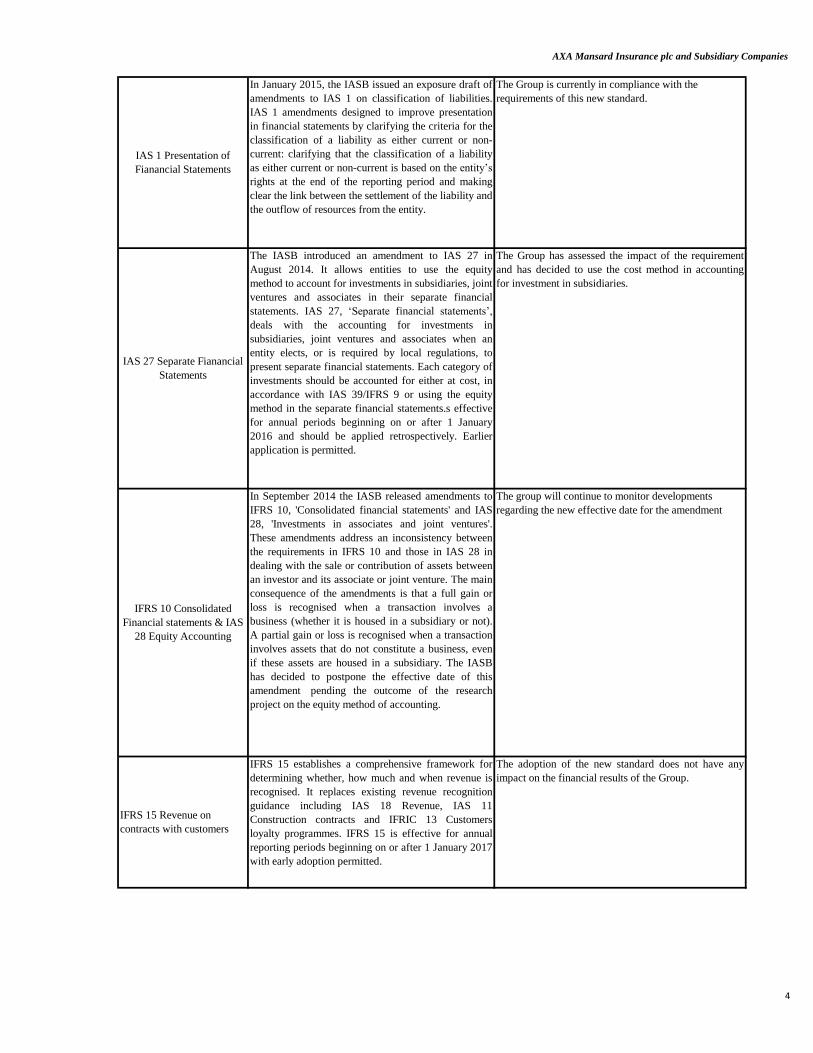
IAS 27 Separate Fianancial
Statements
The IASB introduced an amendment to IAS 27 in
August 2014. It allows entities to use the equity
method to account for investments in subsidiaries, joint
ventures and associates in their separate financial
statements. IAS 27, ‘Separate financial statements’,
deals with the accounting for investments in
subsidiaries, joint ventures and associates when an
entity elects, or is required by local regulations, to
present separate financial statements. Each category of
investments should be accounted for either at cost, in
accordance with IAS 39/IFRS 9 or using the equity
method in the separate financial statements.s effective
for annual periods beginning on or after 1 January
2016 and should be applied retrospectively. Earlier
application is permitted.
The Group has assessed the impact of the requirement
and has decided to use the cost method in accounting
for investment in subsidiaries.
IAS 1 Presentation of
Fianancial Statements
In January 2015, the IASB issued an exposure draft of
amendments to IAS 1 on classification of liabilities.
IAS 1 amendments designed to improve presentation
in financial statements by clarifying the criteria for the
classification of a liability as either current or non-
current: clarifying that the classification of a liability
as either current or non-current is based on the entity’s
rights at the end of the reporting period and making
clear the link between the settlement of the liability and
the outflow of resources from the entity.
The Group is currently in compliance with the
requirements of this new standard.
IFRS 10 Consolidated
Financial statements & IAS
28 Equity Accounting
In September 2014 the IASB released amendments to
IFRS 10, 'Consolidated financial statements' and IAS
28, 'Investments in associates and joint ventures'.
These amendments address an inconsistency between
the requirements in IFRS 10 and those in IAS 28 in
dealing with the sale or contribution of assets between
an investor and its associate or joint venture. The main
consequence of the amendments is that a full gain or
loss is recognised when a transaction involves a
business (whether it is housed in a subsidiary or not).
A partial gain or loss is recognised when a transaction
involves assets that do not constitute a business, even
if these assets are housed in a subsidiary. The IASB
has decided to postpone the effective date of this
amendment pending the outcome of the research
project on the equity method of accounting.
The group will continue to monitor developments
regarding the new effective date for the amendment
IFRS 15 Revenue on
contracts with customers
IFRS 15 establishes a comprehensive framework for
determining whether, how much and when revenue is
recognised. It replaces existing revenue recognition
guidance including IAS 18 Revenue, IAS 11
Construction contracts and IFRIC 13 Customers
loyalty programmes. IFRS 15 is effective for annual
reporting periods beginning on or after 1 January 2017
with early adoption permitted.
The adoption of the new standard does not have any
impact on the financial results of the Group.
4
AXA Mansard Insurance plc and Subsidiary Companies
2.2 Significant accounting policies
(a)
(a) power over the investee entity;
(b) exposure, or rights, to variable returns from involvement with the investee entity; and
(c) the ability to use power over the investee to affect the amount of the investor’s returns.
(b)
(i) Subsidiaries
Investment in subsidiaries in the separate financial statement of the parent entity is measured at cost less impairment.
(ii) Business combinations
(iii) Changes in ownership interests in subsidiaries without change in controls
(iv) Disposal of subsidiaries
(c) Segment reporting
The group has consistently applied the following accounting policies to all periods presented in these consolidated financial statements.
Consolidation
The Group defines the principle of control and establishes control as the basis for determining which entities are consolidated in the group
financial statements.
The Group controls an investee entity when it is exposed, or has rights, to variable returns from its involvement with the investee entity and
has the ability to affect those returns through its power over the investee entity. The Group applies the following three elements of control as
set out by the principle of control in assessing control of an investee:
Consolidated structured entities
Subsidiaries are all entities over which the group exercises control.
If the business combination is achieved in stages, fair value of the acquirer’s previously held equity interest in the acquiree is re-measured to
fair value at the acquisition date through profit or loss.
Any contingent consideration to be transferred by the Group is recognised at fair value at the acquisition date. Subsequent changes to the fair
value of the contingent consideration that is deemed to be an asset or liability is recognised in compliance with IAS 39 either in profit or loss
or as a change to other comprehensive income. Contingent consideration that is classified as equity is not re-measured, and its subsequent
settlement is accounted for within equity.
Goodwill is initially measured as the excess of the aggregate of the consideration transferred and the fair value of non- controlling interest
over the net identifiable assets acquired and liabilities assumed. If this consideration is lower than the fair value of the net assets of the
subsidiary acquired, the difference is recognised in profit or loss.
Transactions with non-controlling interests that do not result in loss of control are accounted for as equity transactions – that is, as
transactions with the owners in their capacity as owners. The difference between fair value of any consideration paid and the relevant share
acquired of the carrying value of net assets of the subsidiary is recorded in equity between retained earnings and Non controlling interests.
Gains or losses on disposals to non-controlling interests are also recorded in equity.
When the Group ceases to have control, any retained interest in the entity is re-measured to its fair value at the date when control is lost,
with the change in carrying amount recognised in profit or loss. The fair value is the initial carrying amount for the purposes of subsequently
accounting for the retained interest as an associate, joint venture or financial asset. In addition, any amounts previously recognised in other
comprehensive income in respect of that entity are accounted for as if the Group had directly disposed of the related assets or liabilities. This
may mean that amounts previously recognised in other comprehensive income are reclassified to profit or loss.
The financial statements of subsidiaries are consolidated from the date the Group acquires control, up to the date that such effective control
ceases. Subsidiaries are entities over which the Group, directly or indirectly, has the power to govern the financial and operating policies so as
to obtain benefits from their activities.
Inter-company transactions, balances and unrealised gains on transactions between companies within the Group are eliminated on
consolidation. Unrealised losses are also eliminated in the same manner as unrealised gains, but only to the extent that there is no evidence of
impairment. Accounting policies of subsidiaries have been changed where necessary to ensure consistency with the policies adopted by the
Group.
The Group applies the acquistion method to account for Business Combinations and acquisition-related costs are expensed as incurred.
Operating segments are reported in a manner consistent with the internal reporting provided to the chief operating decision-maker. The chief
operating decision-maker, which is responsible for allocating resources and assessing performance of the operating segments, has been
identified as the Management Underwriting and Investment Committee (MUIC) that makes strategic decisions.
5
AXA Mansard Insurance plc and Subsidiary Companies
(d) Foreign currency translation
(i) Functional and presentation currency
(ii) Transactions and balances
(iii) Group companies
-
-
-
(e) Financial assets
Classification of financial assets
(i) Financial assets at fair value through profit or loss
Held for trading
Financial assets designated at fair value through profit or loss upon initial recognition
Monetary items denominated in foreign currency are translated using the closing rate as at the reporting date. Non-monetary items measured at
historical cost denominated in a foreign currency are translated with the exchange rate as at the date of initial recognition; non monetary items
(investment property) in a foreign currency that are measured at fair value are translated using the closing rate as at the date when the fair
value was determined.
Foreign exchange gains and losses resulting from the settlement of foreign currency transactions and from the translation at year-end exchange
rates of monetary assets and liabilities denominated in foreign currencies are recognised in the Statement of Comprehensive income.
Foreign exchange gains and losses are presented in the income statement within ‘Net losses/gains on financial instruments'.
In the case of changes in the fair value of monetary assets denominated in foreign currency classified as available-for-sale, a distinction is
made between translation differences resulting from changes in amortised cost of the security and other changes in the carrying amount of the
security. Translation differences on non-monetary financial assets and liabilities such as equities held at fair value through profit and loss are
recognised in the income statement as part of net gain/loss on financial assets. Translation differences on non-monetary financial assets such
as equities classified as available for sale are included in other comprehensive income.
The results and financial position of all the group entities (none of which has the currency of a hyper-inflationary economy) that have a
functional currency different from the presentation currency are translated into the presentation currency as follows:
Items included in the financial statements of each of the Group’s entities are measured using the currency of the primary economic
environment in which the entity operates (the ‘functional currency’). The consolidated financial statements are presented in thousands of
Naira (NGN) which is the Group's presentation currency.
Foreign currency transactions are translated into the functional currency using the exchange rates prevailing at the dates of the transactions.
Foreign exchange gains and losses resulting from the settlement of such transactions and from the translation at year-end exchange rates of
monetary assets and liabilities denominated in foreign currencies are recognised in the profit or loss.
A financial asset is classified into the held for trading category if acquired principally for the purpose of selling in the short term, if it forms
part of a portfolio of financial assets in which there is evidence of short-term profit-taking.
Other financial assets designated as at fair value through profit or loss at initial recognition are those that are:
- Separate assets held to match insurance and investment contracts liabilities that are linked to the changes in fair value of these assets. The
designation of these assets to be at fair value through profit or loss eliminates or significantly reduces a measurement or recognition
inconsistency (sometimes referred to as ‘an accounting mismatch’) that would otherwise arise from measuring assets or liabilities or
recognising the gains and losses on them on different bases; and
- Managed and whose performance is evaluated on a fair value basis. Information about these financial assets is provided internally on a fair
value basis to the Group’s key management personnel. The Group’s investment strategy is to invest in equity and debt securities and to
evaluate them with reference to their fair values. Assets that are part of these portfolios are designated upon initial recognition at fair value
Assets and liabilities for each statement of financial position presented are translated at the closing rate on the reporting date;
income and expenses for each income statement are translated at average exchange rates (unless this average is not a reasonable
approximation of the cumulative effect of the rates prevailing on the transaction dates, in which case income and expenses are translated at the
rate on the dates of the transactions); and
all resulting exchange differences are recognised in other comprehensive income.
Financial assets are classified into the following categories: fair value through profit and loss, loans and receivables, held-to-maturity and
available-for-sale. The classification by the Group is determined by management at initial recognition and depends on the purpose for which
the investments were acquired.
6
AXA Mansard Insurance plc and Subsidiary Companies
(ii) Loans and receivables
Reinsurance assets
(iii) Held-to-maturity financial assets
(iv) Available-for-sale financial assets
Recognition and measurement of financial assets
These are non-derivative financial assets with fixed determinable payments that are not quoted in an active market. After initial recognition,
they are measured at amortised cost using the effective interest method less impairment. Discounting is omitted where the effect of
discounting is immaterial. Trade receivables are made up of premium receivables and coinsurance receivables.
- Premium receivables relate to receivables from agents, brokers and insurance companies in respect of premium income.
-Coinsurance recoverables relate to only claims recoverables from coinsurers for claims settled to policy holders on behalf of coinsurers
based on agreed terms.
The Company cedes businesses to reinsurers in the normal course of business for the purpose of limiting its net loss potential through the
transfer of risks. Reinsurance arrangements do not relieve the Company from its direct obligations to its policyholders. Reinsurance assets are
measured at amortised costs. Reinsurance assets relate to prepaid reinsurance, reinsurers' share of IBNR claims and claims recoverables.
Other receivables
Other receivables are made up of other amounts due from parties which are not directly linked to insurance or investment contracts. These are
measured at amortised costs. Discounting is omitted where the effect of discounting is immaterial.
Loans and receivables are non-derivative financial assets with fixed or determinable payments that are not quoted in an active market other
than:
- those that the Group intends to sell in the short term which are declassified as fair value through profit or loss and those that the group
upon initial recognition designates as fair value through profit or loss.
- those that the Group upon initial recognition designates as Available for Sale
- those for which the holder may not recover substantially all of its initial loans and receivables other than because of credit risk. Loans and
receivables include trade receivables, reinsurance assets and other receivables (financial assets).
Trade receivables
During the year, in order to align with the Parent company's investment classification policy, all held for trading and held to maturity financial
assets were reclassified to available for sale.
Regular-way purchases and sales of financial assets are recognised on trade-date which is the date on which the Group commits to purchase
or sell the asset.
Financial assets are initially recognised at fair value, plus transaction costs for all financial assets not initially recognised at fair value
through profit or loss. Financial assets carried at fair value through profit or loss are initially recognised at fair value, and transaction costs
are expensed in the income statement.
Available-for-sale financial assets and financial assets at fair value through profit or loss are subsequently carried at fair value. Loans and
receivables and held-to- maturity financial assets are carried at amortised cost using the effective interest method.
Held-to-maturity investments are non-derivative financial assets with fixed or determinable payments and fixed maturities that the Group’s
management has the positive intention and ability to hold to maturity, other than:
- those that the Group upon initial recognition designates as at fair value through profit or loss;
- those that the Group designates as available-for-sale; and
- those that meet the definition of loans and receivables.
Interests on held-to-maturity investments are included in the consolidated income statement and are reported as interest income. In the case
of an impairment, it is reported as a deduction from the carrying value of the investment and recognised in the consolidated income statement
as ‘Net gains/(losses) on financial assets'. Held-to-maturity investments are largely bonds.
Available-for-sale investments are financial assets that are intended to be held for an indefinite period of time, which may be sold in response
to needs for liquidity or changes in interest rates, exchange rates or equity prices or that are not classified as loans and receivables, held-to-
maturity investments or fair value through profit or loss.
Interest on available-for-sale securities calculated using the effective interest method is recognised in the income statement. Dividends on
available-for-sale equity instruments are recognised in the income statement when the Group’s right to receive payments is established. Both
are included in the investment income line.
Gains and losses arising from changes in the fair value of the ‘financial assets at fair value through profit or loss' category are included in
the income statement in the period in which they arise. Dividend income from financial assets at fair value through profit or loss is recognised
in the income statement as part of other income when the Group’s right to receive payments is established.
Changes in the fair value of monetary and non-monetary securities classified as available for sale are recognised in other comprehensive
income.
When securities classified as available-for-sale are sold or impaired, the accumulated fair value adjustments recognised in other
comprehensive income are included in the income statement as net realised gains on financial assets.
7
AXA Mansard Insurance plc and Subsidiary Companies
Determination of fair value of financial assets
Reclassification of financial assets
Impairment of financial assets
(a) Financial assets carried at amortised cost
For financial instruments traded in active markets, the determination of fair values of financial assets and financial liabilities is based on the
market approach (transaction price paid for an identical or a similar instrument). This includes listed equity securities and quoted debt
instruments on major exchanges.
A financial instrument is regarded as quoted in an active market if quoted prices are readily and regularly available from an exchange, dealer,
broker, industry group, pricing service or regulatory agency, and those prices represent actual and regularly occurring market transactions on
an arm’s length basis. If the above criteria are not met, the market is regarded as being inactive. For example, a market is inactive when there
is a wide bid-offer spread or significant increase in the bid-offer spread or there are few recent transactions.
For all other financial instruments, fair value is determined using valuation techniques . In these techniques, fair values are estimated from
observable data in respect of similar financial instruments, using models to estimate the present value of expected future cash flows or other
valuation techniques, using inputs (for example, NIBOR yield curve, foreign exchange rates, volatilities and counterparty spreads) existing
at the reporting date.
Reclassifications are made at fair value as of the reclassification date. Fair value becomes the new cost or amortised cost as applicable, and no
reversals of fair value gains or losses recorded before reclassification date are subsequently made. Effective interest rates for financial assets
reclassified to loans and receivables and held-to-maturity categories are determined at the reclassification date. Further increases in estimates
of cash flows adjust effective interest rates prospectively.
The Group assesses at each end of the reporting period whether there is objective evidence that a financial asset or group of financial assets is
impaired. A financial asset or group of financial assets is impaired and impairment losses are incurred only if there is objective evidence of
impairment as a result of one or more events that have occurred after the initial recognition of the asset (a ‘loss event’) and that loss event (or
events) has an impact on the estimated future cash flows of the financial asset or group of financial assets that can be reliably estimated.
Objective evidence that a financial asset or group of assets is impaired includes observable data that comes to the attention of the Group about
the following events:
- Trade receivables are outstanding for more than 30 days
- Reinsurance recoverable outstanding more than 90 days
- Significant financial difficulty of the issuer or debtor;
- A breach of contract, such as a default or delinquency in payments;
- It becoming probable that the issuer or debtor will enter bankruptcy or other financial re-organisation;
- The disappearance of an active market for that financial asset because of financial difficulties; or
For more complex instruments the company uses internally developed models which are usually based on valuation models and techniques
generally recognised as standard within the industry. Valuation models are used primarily to value unlisted debt securities for which markets
were or have become illiquid. Some of the inputs to these models may not be market observable and therefore estimated based on
assumptions. The impact of financial instruments valuation reflecting non-market observable inputs (Level 3 valuations) is disclosed in the
note to the financial statements.
Financial assets other than loans and receivables are permitted to be reclassified out of the held-for-trading category only in rare circumstances
arising from a single event that is unusual and highly unlikely to recur in the near-term. In addition, the Group may choose to reclassify
financial assets that would meet the definition of loans and receivables out of the held-for-trading or available-for-sale categories if the Group
has the intention and ability to hold these financial assets for the foreseeable future or until maturity at the date of reclassification.
Financial assets classified as held to maturity can be reclassfied as available for sale assets. In making this reclassification, the entire portfolio
becomes tainted and the group cannot designate any instrument as held to maturity for the next two years after a sale or reclassification. Fair
values changes upon tainting of the HTM portfolio are recognised in Other Comprehensive income prospectively.
- Observable data indicating that there is a measurable decrease in the estimated future cash flow from a group of financial assets since
the initial recognition of those assets, although the decrease cannot yet be identified with the individual financial assets in the Group.
8
AXA Mansard Insurance plc and Subsidiary Companies
(b) Assets classified as available for sale
If in a subsequent period, the amount of the impairment loss decreases and the decrease can be related objectively to an event occurring after
the impairment was recognised (such as improved credit rating), the previously recognised impairment loss is reversed by adjusting the
allowance account. The amount of the reversal is recognised in the income statement.
The discount rate is the yield at the reporting date on government bonds that have maturity dates approximating the terms of the Group’s
obligations and that are denominated in the same currency in which the benefits are expected to be paid.
When the financial asset at amortised cost is uncollectible, it is written off against the related allowance for impairment. Such loans are
written off after all the necessary procedures have been completed and the amount of the loss has been determined. Impairment charges
relating to Investment securities are classified as net gains/loss of financial assets while those on receivables are classified as operating
expenses.
The recoverable amount of an asset or cash-generating unit is the greater of its value in use and its fair value less costs to sell. In assessing
value in use, the estimated future cash flows are discounted to their present value using a pre-tax discount rate that reflects current market
assessments of the time value of money and the risks specific to the asset.
The Group first assesses whether objective evidence of impairment exists for financial assets that are individually significant. If the Group
determines that no objective evidence of impairment exists for an individually assessed financial asset, whether significant or not, it includes
the asset in a group of financial assets with similar credit risk characteristics and collectively assesses them for impairment. Assets that are
individually assessed for impairment and for which an impairment loss is or continues to be recognised are not included in a collective
assessment of impairment.
If there is objective evidence that an impairment loss has been incurred on loans and receivables or held-to-maturity investments carried at
amortised cost, the amount of the loss is measured as the difference between the asset’s carrying amount and the present value of estimated
future cash flows (excluding future credit losses that have been incurred) discounted at the financial asset’s original effective interest rate.
The carrying amount of the asset is reduced through the use of an allowance account, and the amount of the loss is recognised in the income
statement. If a held-to- maturity investment or a loan has a variable interest rate, the discount rate for measuring any impairment loss is the
current effective interest rate determined under contract. The Group may measure impairment on the basis of an instrument’s fair value using
an observable market price.
Derecognition of financial assets
A financial asset is derecognised if either the entity has transferred contractual rights to receive cash flows from the asset or if the entity has
retained the contractual rights to receive the cash flows from the asset but has assumed a contractual obligation to pass on the cash flows
under an arrangement that meets the conditions stated below:
- the entity has no obligation to pay amounts to the eventual recipient unless it collects equivalent amounts on the original asset
- the entity is prohibited from selling or pledging the original asset other than as security to the eventual recipient
- the entity has an obligation to remit those cash flows without material delay
A financial liability shall be derecognised when the obligation specified in the contract is either discharged, cancelled or expired.
Assets that have an indefinite useful life – for example, land are not subject to amortisation and are tested annually for impairment. Assets
that are subject to amortisation are reviewed for impairment whenever events or changes in circumstances indicate that the carrying
amount may not be recoverable. An impairment loss is recognised for the amount by which the asset’s carrying amount exceeds its
recoverable amount. The recoverable amount is the higher of an asset’s fair value less costs to sell and value in use. For the purposes of
assessing impairment, assets are grouped at the lowest levels for which there are separately identifiable cash flows (cash-generating units).
The Group assesses at each reporting date whether there is objective evidence that a financial asset or a group of financial assets is impaired.
In the case of equity investments classified as available-for-sale, a significant or prolonged decline in the fair value of the security below its
cost is an objective evidence of impairment resulting in the recognition of an impairment loss. In this respect, a period of 12 months or longer
is considered to be prolonged. If any such quantitative evidence exists for available-for-sale financial assets, the asset is considered for
impairment, taking qualitative evidence into account. The cumulative loss measured as: the difference between the acquisition cost and the
current fair value, less any impairment loss on that financial asset previously recognised in profit or loss is removed from equity and
recognised in the consolidated income statement. Impairment losses recognised in the consolidated income statement on equity instruments
are not reversed through the consolidated income statement.
If in a subsequent period the fair value of a debt instrument classified as available for sale increases and the increase can be objectively
related to an event occurring after the impairment loss was recognised in profit or loss, the impairment loss is reversed through the
consolidated income statement.
Initial recognition of pledged assets is at fair value, whilst subsequent measurement is based on the classification and measurement of the
financial asset in accordance with IAS 39.
9
AXA Mansard Insurance plc and Subsidiary Companies
Offsetting financial instruments
(f)
(g) Intangible assets
(i) Computer software
(ii) Goodwill
Financial assets and liabilities are offset and the net amount reported in the statement of financial position only when there is a legally
enforceable right to offset the recognised amounts and there is an intention to settle on a net basis, or to realise the asset and settle the liability
simultaneously.
If an investment property becomes owner-occupied, it is reclassified as property, plant and equipment, and its fair value at the date of
reclassification becomes its cost for subsequent accounting purposes.
If an item of property, plant and equipment becomes an investment property because its use has changed, any difference arising between the
carrying amount and the fair value of this item at the date of transfer is recognised in other comprehensive income as a revaluation of
property, plant and equipment. However, if a fair value gain reverses a previous impairment loss, the gain is recognised in the income
statement. Upon the disposal of such investment property any surplus previously recorded in equity is transferred to retained earnings net of
associated tax; the transfer is not made through profit or loss.
Properties could have dual purposes whereby part of the property is used for own use activities. The portion of a dual use property is
classified as an investment property only if it could be sold or leased out separately under a finance lease or if the portion occupied by the
owner is immaterial to the total lettable space. Currently, the group occupies less than 10% of the lettable space (264sqm out of 7,406sqm).
The portion of the investment property occupied by the owner is considered immaterial to the total lettable space and to the value of the
investment property.
Intangibles assets represents cost associated with the acquisition of software and inherent goodwill on business combination.
Investment property
Property held for long-term rental yields that is not occupied by the companies in the Group is classified as investment property.
Investment property comprises freehold land and buildings. It is carried at fair value, adjusted if necessary, for any difference in the nature,
location or condition of the specific asset. If this information is not available, the Group uses alternative valuation methods such as discounted
cash flow projections or recent prices in less active markets. These valuations are reviewed annually by an independent valuation expert.
Changes in fair values are recorded in the income statement. Property located on land that is held under an operating lease is classified as
investment property as long as it is held for long-term rental yields and is not occupied by the companies in the consolidated Group. The initial
cost of the property shall be the fair value (where available). When not available the initial cost shall be used. The property is carried at fair
value after initial recognition. Investment property denominated in foreign currencies are translated to the reporting currency using the closing
exchange rate at the reporting date.
Other development expenditures that do not meet these criteria are recognised as an expense when incurred. Development costs previously
recognised as an expense are not recognised as an asset in a subsequent period.
Computer software development costs recognised as assets are amortised over their useful lives, which does not exceed five years.
Goodwill arises on the acquistion of subsidiaries and represents the excess of the consideration transferred over the Group's interest in the fair
value of the net identifiable assets, liabilities and contigent liabilities of the acquiree and the fair value of the non-controlling interest in the
acquiree.
For the purpose of impairment testing, goodwill acquired in a business combination is allocated to each of the CGU's or groups of CGUs, that
is expected to benefit from the synergies of the combination. Goodwill is monitored at the operating segment level.
Costs associated with maintaining computer software programmes are recognised as an expense when incurred.
Development costs that are directly attributable to the design and testing of identifiable and unique software products controlled by the Group
are recognised as intangible assets when the following criteria are met:
- It is technically feasible to complete the software product so that it will be available for use;
- Management intends to complete the software product and use or sell it;
- There is an ability to use or sell the software product;
- It can be demonstrated how the software product will generate probable future economic benefits;
- Adequate technical, financial and other resources to complete the development and to use or sell the software product are available; and
- The expenditure attributable to the software product during its development can be reliably measured.
Directly attributable costs that are capitalised as part of the software product include the software development employee costs and an
appropriate portion of directly attributable overheads.
Goodwill impairment reviews are undertaken annually or more frequently if events or changes in circumstances indicate a potential
impairment. The carrying value of goodwill is compared to the recoverable amount, which is the higher of value in use and the fair value less
costs to sell. Any impairment is recognised immediately as an expense and is not subsequently reversed.
10
AXA Mansard Insurance plc and Subsidiary Companies
(iii) License fee
(h) Property and equipment
Land and buildings comprise mainly outlets and offices occupied by the Group.
50 years
-Vehicle 5 years
-Branding, furniture and fittings and equipment 2- 5 years
-Computer equipment 3 yearsLeasehold improvements are depreciated over the lower of the useful life of the asset and the lease term.
(i) Statutory deposit
(j) Insurance contracts
(1) Types of Insurance Contracts
(i) Non-life insurance contracts
-Building
The assets residual values and useful lives are reviewed at the end of each reporting period and adjusted if appropriate.
An asset’s carrying amount is written down immediately to its recoverable amount, if the asset’s carrying amount is greater than its estimated
recoverable amount.
Property and equipment are dercognised at the disposal date or at the date when it is permanently withdrawn from use without the ability to be
disposed of. Gains and losses on disposals are determined by comparing the proceeds with the carrying amount. These are included within
other income in the Statement of Comprehensive Income.
The Group applies the cost model in recognising intangible assets acquired in a business combination. Licenses acquired in a business
combination are recognised at fair value at the acquisition date. Subsequently, they are carried at cost less accumulated amortisation and
impairment losses. Licenses acquired in a business combination are amortised over a period of 25 years.
Land is shown at cost. All other property and equipment are stated at historical cost less depreciation and accumulated impairment charges.
Historical cost includes expenditure that is directly attributable to the acquisition of the items.
Subsequent costs are included in the asset’s carrying amount or recognised as a separate asset, as appropriate, only when it is probable that
future economic benefits associated with the item will flow to the Group and the cost of the item can be measured reliably. All other repairs
and maintenance are charged to the income statement during the financial period in which they are incurred.
Land is not depreciated. Depreciation on property and equipment is calculated using the straight-line method to allocate the cost to the
residual values over the estimated useful lives as follows.
Property insurance contracts mainly compensate the Group’s customers for damage suffered to their properties or for the value of property
lost. Customers who undertake commercial activities on their premises could also receive compensation for the loss of earnings caused by
the inability to use the insured properties in their business activities (business interruption cover).
Non- life insurance contracts protect the Group’s customers from the consequences of events (such as death or disability) that would affect
the ability of the customer or his/her dependents to maintain their current level of income. Guaranteed benefits paid on occurrence of the
specified insurance event are either fixed or linked to the extent of the economic loss suffered by the policyholder. There are no maturity
or surrender benefits.
The group leases some welcome centers and branches under the operating lease arrangement. The lease payments are recognised as an
expense in the income statement over the lease term.
Statutory deposit represents 10% of the paid up capital of the Company deposited with the Central Bank of Nigeria (CBN) in pursuant to
Section 10(3) of the Insurance Act, 2003. Statutory deposit is measured at cost.
The Group issues contracts that transfer insurance risk or financial risk or both. Insurance contracts are those contracts where a party (the
policy holder) transfers significant insurance risk to another party (insurer) and the latter agrees to compensate the policyholder or other
beneficiary if a specified uncertain future event (the insured event) adversely affects the policyholder, or other beneficiary. Such contracts
may also transfer financial risk when the insurer issues financial instruments with a discretionary participation feature.
The group classify insurance contract into life and non-life insurance contracts.
These contracts are accident and casualty and property insurance contracts.
Accident and casualty insurance contracts protect the Group’s customers against the risk of causing harm to third parties as a result of their
legitimate activities. Damages covered include both contractual and non-contractual events. The typical protection offered is designed for
employers who become legally liable to pay compensation to injured employees (employers’ liability) and for individual and business
customers who become liable to pay compensation to a third party for bodily harm or property damage (public liability).
11
AXA Mansard Insurance plc and Subsidiary Companies
(ii) Life insurance contracts
-Annuity contracts
(i) Non-life insurance contracts premium and claims
(iii) Annuity premium and claims
(iv) Salvages
(v) Subrogation
These contracts insure events associated with human life (for example, death). These are divided into the individual life, group life and
Annuity contracts.
-Individual life contracts are usually long term insurance contracts and span over one year while the group life insurance contracts usually
cover a period of 12 months. A liability for contractual benefits that are expected to be incurred in the future when the premiums are
recognised. The liability is determined as the sum of the expected discounted value of the benefit payments and the future administration
expenses that are directly related to the contract, less the expected discounted value of the theoretical premiums that would be required to meet
the benefits and administration expenses based on the valuation assumptions used. The liability is based on assumptions as to mortality,
persistency, maintenance expenses and investment income that are established at the time the contract is issued.
These contracts insure customers from consequences of events that would affect the ability of the customers to maintain their current level of
income. There are no maturity or surrender benefits. The annuity contracts are fixed annuity plans. Policy holders make a lump sum payment
recognised as part of premium in the period when the payment was made. Constant and regular payments are made to annuitants based on
terms and conditions agreed at the inception of the contract and throughout the life of the annuitants. The annuity funds are invested in long
tailed government bonds and reasonable money markets instruments to meet up with the payment of monthly/quarterly annuity payments. The
annuity funds liability is actuarially determined based on assumptions as to mortality, persistency, maintenance expenses and investment
income that are established at the time the contract is issued.
(2) Recognition and measurement
Some non-life insurance contracts permit the Group to sell (usually damaged) property acquired in the process of settling a claim. The Group
may also have the right to pursue third parties for payment of some or all costs of damages to its clients property (i.e. subrogation right).
Salvage recoveries are used to reduce the claim expense when the claim is settled.
Subrogation is the right for an insurer to pursue a third party that caused an insurance loss to the insured. This is done as a means of
recovering the amount of the claim paid to the insured for the loss. A receivable for subrogation is recognised in other assets when the liability
is settled and the Company has the right to receive future cash flow from the third party.
These contracts are accident, casualty and property insurance contracts. Accident and casualty insurance contracts protect the Group's
customers against the risk of causing harm to third parties as a result of their legitimate activities. Damages covered include both contractual
and non-contractual events. The typical protection offered is designed for employers who become legally liable to pay compensation to
injured employees (employers' liability) and for individual and business customers who become liable to pay compensation to a third party for
bodily harm or property damage (public liability). Property insurance contracts mainly compensate the Group's customers for damage
suffered to their properties or for the value of property lost. Customers who undertake commercial activities on their premises could also
receive compensation for the loss of earnings caused by the inability to use the insured properties in their business activities. Life insurance
contracts protects the Group's customers from the consequences of events (such as death or disability) that would affect the ability of the
customer or his/her dependents to maintain their current level of income. Guaranteed benefits paid on occurrence of the specified insurance
event are either fixed or linked to the extent of the economic loss suffered by the insured. There are no maturity or surrender benefits.
For all these contracts, premiums are recognised as revenue (earned premiums) proportionally over the period of coverage. The portion of
premium received on in-force contracts that relates to unexpired risks at the reporting date is reported as the unearned premium liability.
Premiums are shown before deduction of commission.Claims and loss adjustment expenses are charged to income as incurred based on the estimated liability for compensation owed to contract
holders or third parties damaged by the contract holders. They include direct and indirect claims settlement costs and arise from events that
have occurred up to the end of the reporting period even if they have not yet been reported to the Group. The Group does not discount its
liabilities for unpaid claims. Liabilities for unpaid claims are estimated using the input of assessments for individual cases reported to the
Group and statistical analyses for the claims incurred but not reported, and to estimate the expected ultimate cost of more complex claims
that may be affected by external factors (such as court decisions).
(ii) Life insurance contracts premium and claims
Premiums are recognised as revenue when they become payable by the contract holders. Premium are shown before deduction of commission.
Annuity premium are recognised as premium in the statement of comprehensive income
Claims and other benefits are recorded as an expense when they are incurred.
Annuity premiums relate to single premium payments and recognised as earned premium income in the period in which payments are
received. Claims are made to annuitants in the form of monthly/quarterly payments based on the terms of the annuity contract and charged to
income statement as incurred. Premiums are recognised as revenue when they become payable by the contract holders. Premium are shown
before deduction of commission.
12
AXA Mansard Insurance plc and Subsidiary Companies
(vi) Deferred policy acquisition costs (DAC)
(vii) Deferred income
(k) Investment contracts
(l) Technical reserves
(i) General insurance contracts
Reserves for unearned premium
Reserves for outstanding claims
Reserves for unexpired risk
Acquisition costs comprise all direct and indirect costs arising from the writing of both life and non-life insurance contracts. Deferred
acquisition costs represent a proportion of commission which are incurred during a financial period and are deferred to the extent that they are
recoverable out of future revenue margins. For the non life business, it is calculated by applying to the acquisition expenses the ratio of
unearned premium to written premium; while no assets are established in respect of deferred acquisition cost for the life business.
Deferred income represent a proportion of commission received on reinsurance contracts which are booked during a financial year and are
deferred to the extent that they are recoverable out of future revenue margins. It is calculated by applying to the reinsurance commission
income the ratio of prepaid reinsurance to reinsurance cost.
(viii) Receivables and payables related to insurance contracts
Reinsurance assets consist of short-term balances due from reinsurers, as well as longer term receivables that are dependent on the expected
claims and benefits arising under the related reinsured insurance contracts. Reinsurance liabilities are primarily premiums payable for
reinsurance contracts and are recognised as an expense when due. The Group has the right to set-off re-insurance payables against amount
due from re-insurance and brokers in line with the agreed arrangement between both parties.
The Group assesses its reinsurance assets for impairment on a quarterly basis. If there is objective evidence that the reinsurance asset is
impaired, the Group reduces the carrying amount of the reinsurance asset to its recoverable amount and recognises that impairment loss in
the income statement. The Group gathers the objective evidence that a reinsurance asset is impaired using the same process adopted for
financial assets held at amortised cost. The impairment loss is calculated using the number of days that the receivable has been outstanding.
Investment contracts are those contracts that transfer financial risk with no significant insurance risk. Investment contracts can be classified
into interest linked and unitised fund. Interest linked investment contracts are measured at amortised cost while unitised funds are measured at
fair value.
Investment contracts with guaranteed returns (interest linked) and other business of a savings nature are recognised as liabilities. Interest
accruing to the life assured from investment of the savings is recognised in the profit and loss account in the year it is earned while interest
paid and due to depositors is recognised as an expense. The net result of the deposit administration revenue account is transferred to the
income statement of the group. Unitised funds contracts sell units under seven portfolios with the value of each unit determined by the value
of the underlying assets for each portfolio.
These are computed in compliance with the provisions of Sections 20, 21, and 22 of the Insurance Act 2003 as follows:
In compliance with Section 20 (1) (a) of Insurance Act 2003, the reserve for unearned premium is calculated on a time apportionment basis in
respect of the risks accepted during the year.
Receivables and payables are recognised when due. These include amounts due to and from agents, brokers and insurance companies (as
coinsurers) and reinsurance companies.
-Receivables and payables to agents, brokers and insurance companies (as coinsurers)
The company's receivables and payables to agents, brokers and insurance companies (as coinsurers) relate to premium and commission.
If there is objective evidence that the insurance receivable is impaired, the Group reduces the carrying amount of the insurance receivable
accordingly and recognises that impairment loss in the income statement. The Group gathers the objective evidence that an insurance
receivable is impaired using the same methodology adopted for financial assets held at amortised cost. The impairment loss is calculated
under the same method used for these financial assets.- Reinsurance and coinsurance contracts held
Contracts entered into by the Group with reinsurers and that meet the classification requirements for insurance contracts are classified as
reinsurance contracts held. Contracts that do not meet these classification requirements are classified as financial assets.
The reserve for outstanding claims is maintained at the total amount of outstanding claims incurred and reported plus claims incurred but not
reported ("IBNR") as at the reporting date. The IBNR is based on the liability adequacy test.
A provision for additional unexpired risk reserve (AURR) is recognised for an underwriting year where it is envisaged that the estimated cost
of claims and expenses would exceed the unearned premium reserve (UPR).
13
AXA Mansard Insurance plc and Subsidiary Companies
(ii) Life business
Life fund
(m) Financial liabilities
(i) Borrowings
(ii)
(iii) Financial guarantee contracts
(n) Provisions
Borrowings are recognised initially at fair value, net of transaction costs incurred. Borrowings are subsequently stated at amortised cost; any
difference between the proceeds (net of transaction costs) and the redemption value is recognised in the income statement over the period of
the borrowings using the effective interest method.
Fees paid on the establishment of loan facilities are recognised as transaction cost of the loan to the extent that it is probable that some or all
of the facility will be drawn down. In this case, the fee is deferred until the drawdown occurs. To the extent there is no evidence that it is
probable that some or all of the facility will be drawn down, the fee is capitalised and amortised over the period of the facility to which it
relates.
Borrowings are classified as current liabilities unless the group has an unconditional right to defer settlement of the liabilities for at least 12
months after the date of the statement of financial position.
Borrowing costs are interest and other costs incurred by the Group directly attributable to the acquisition and construction of qualifying assets
which are assets that necessarily takes a substantial period of time to get ready for its intended use or sale.
Borrowing costs are capitalized as part of the cost of a qualifying asset only when it is probable that they will result in future economic
benefits to the Group and the costs can be measured reliably. Other borrowing costs are recognised as an expense in the period in which they
are incurred.
When the carrying amount or the expected ultimate cost of the qualifying asset exceeds its recoverable amount or net realizable value, the
carrying amount is written down or written off. Investment income earned on the temporary investment of specific borrowings pending their
expenditure on qualifying assets is deducted from the borrowing costs eligible for capitalisation.
This is made up of net liabilities on policies in force as computed by the actuaries at the time of the actuarial valuation or as at reporting
period end.
Liability adequacy test
At each end of the reporting period, liability adequacy tests are performed by an Actuary to ensure the adequacy of the contract liabilities net
of related DAC assets. In performing these tests, current best estimates of future contractual cash flows and claims handling and
administration expenses, as well as investment income from the assets backing such liabilities, are used. Any deficiency is immediately
charged to profit or loss initially by writing off DAC and by subsequently establishing a provision for losses arising from liability adequacy
tests "the unexpired risk provision".
Provisions are measured at the present value of the expenditures expected to be required to settle the obligation using a pre-tax rate that
reflects current market assessments of the time value of money and the risks specific to the obligation. The increase in the provision due to
passage of time is recognised as interest expense.
Trade and other payables
Trade and other payables are recognised initially at fair value and subsequently measured at amortised cost using the effective interest
method. The fair value of a non-interest bearing liability is its discounted repayment amount. If the due date of the liability is less than one
year discounting is omitted.
Financial guarantees are contracts that require the Group to make specified payments to reimburse the holder for a loss it incurs because a
specified debtor fails to make payment when due in compliance with the original or modified terms of a debt instrument.
Financial guarantee liabilities are initially recognised at their fair value, which is the premium received, and then amortised over the life of the
financial guarantee. Subsequent to initial recognition, the financial guarantee liability is measured at the higher of the present value of any
expected payment and the unamortised premium when a payment under the guarantee has become probable. Financial guarantees are included
within other liabilities.
Provisions are recognised when: the Group has a present legal or constructive obligation as a result of past events; it is more likely than not
that an outflow of resources will be required to settle the obligation; and the amount has been reliably estimated. Provisions are not
recognised for future operating losses.
Where there are a number of similar obligations, the likelihood that an outflow will be required in settlement is determined by considering
the class of obligations as a whole. A provision is recognised even if the likelihood of an outflow with respect to any one item included in
the same class of obligations may be small.
14
AXA Mansard Insurance plc and Subsidiary Companies
(o)
(p) Equity
(i) Share capital
(ii) Repurchase and re-issue of ordinary shares (treasury shares)
(iii) Equity-linked compensation plans
(iv) Contingency reserves
(v) Dividends
Current and deferred income tax
The tax expense for the period comprises current and deferred tax. Tax is recognised in the income statement, except to the extent that it
relates to items recognised in other comprehensive income or directly in equity. In this case, the tax is also recognised in other
comprehensive income or directly in equity, respectively.
The current income tax charge is calculated on the basis of the tax laws enacted or substantively enacted at the end of the reporting period.
Management periodically evaluates positions taken in tax returns with respect to situations in which applicable tax regulation is subject to
interpretation and establishes provisions where appropriate.
Deferred income tax is recognised, using the liability method, on temporary differences arising between the tax bases of assets and liabilities
and their carrying amounts in the consolidated financial statements. However, if the deferred income tax arises from initial recognition of an
asset or liability in a transaction other than a business combination that at the time of the transaction affects neither accounting nor taxable
profit or loss, it is not accounted for. Deferred income tax is determined using tax rates (and laws) that have been enacted or substantively
enacted by the end of the reporting period and are expected to apply when the related deferred income tax asset is realisable or the deferred
income tax liability is payable.
Deferred income tax assets are recognised to the extent that it is probable that future taxable profit will be available against which the
temporary differences can be utilised.
Where any member of the Group purchases the Company’s equity share capital (treasury shares), the consideration paid, including any
directly attributable incremental costs (net of income taxes), is reported as a separate component of equity attributable to the Company’s
equity holders. Where such shares are subsequently sold, reissued or otherwise disposed of, any consideration received is included in equity
attributable to the Company’s equity holders, net of any directly attributable incremental transaction costs and the related income tax effects.
When shares recognised as equity are repurchased, the amount of the consideration paid, which includes directly attributable costs, net of tax
effects, is recognised as a deduction from equity. Repurchased shares are classified as treasury shares and are presented in the treasury shares
reserve. When treasury shares are sold or reissued subsequently, the amount received is recognised as an increase in equity and the resulting
surplus or deficit on the transaction is presented within share premium.
The group operates an equity share-based compensation plans. The fair value of equity-settled share options is determined on the grant date
and accounted for as staff costs over the vesting period of the share options, with a corresponding increase in equity. At the end of each
reporting period, the group revisits its estimates of the number of options that are expected to vest based on the non market and service
conditions. It recognises the impact of the revision to initial estimates, if any, in the income statement with a corresponding adjustment to
equity. On vesting of share options, amounts previously credited to the share-based payment reserve are transferred to retained earnings
through an equity transfer. On exercise of equity- settled share options, proceeds received are credited to share capital and premium.
(a) Non-life business
Deferred income tax is provided on temporary differences arising on investments in subsidiaries and associates, except where the Group
controls the timing of the reversal of the temporary difference and it is probable that the temporary difference will not reverse in the
foreseeable future.
Deferred income tax assets and liabilities are offset when there is a legally enforceable right to offset current tax assets against current tax
liabilities and when the deferred income tax assets and liabilities relate to income taxes levied by the same taxation authority on either the
taxable entity or different taxable entities where there is an intention to settle the balances on a net basis.
The tax effects of carry-forwards of unused losses or unused tax credits are recognised as an asset when it is probable that future taxable
profits will be available against which these losses can be utilised.
Deferred tax related to fair value remeasurement of available-for-sale investments, which are charged or credited directly in other
comprehensive income, is also credited or charged directly to other comprehensive income and subsequently recognised in the consolidated
income statement together with the deferred gain or loss.
Shares are classified as equity when there is no obligation to transfer cash or other assets. Incremental costs directly attributable to the issue
of equity instruments are shown in equity as a deduction from the proceeds, net of tax.
In compliance with Section 21 (2) of Insurance Act 2003, the contingency reserve is credited with the greater of 3% of total premiums, or
20% of the net profits. This shall accumulate until it reaches the amount of greater of minimum paid-up capital or 50% of net premium.
(b) Life business
In compliance with Section 22 (1) (b) of Insurance Act 2003, the contingency reserve is credited with the higher of 1% of gross premiums or
10% of net profit.
Dividend on the Company’s ordinary shares are recognised in equity in the period in which they are approved by the Company’s shareholders.
Dividend distribution to the Company’s shareholders is recognised as equity in the financial statements in the period in which the dividend is
paid to the Company’s shareholders.
15
AXA Mansard Insurance plc and Subsidiary Companies
(q) Earnings per share
(r) Revenue recognition
(d ) Net gains/(losses) on financial assets
(e) Net fair value gain on non financial assets
(s) Changes in life fund estimates
(t) Investment income
(u) Operating expenditure
(i) Reinsurance expenses
Revenue comprises premium, value for services rendered, net of value-added tax, after eliminating revenue within the Group. Other revenue
classes are recognised as follows:
(a) Premium income: for short duration life insurance contracts, premiums are recognised as revenue (earned premiums) proportionally over
the period of coverage. The portion of premium received on in-force contracts that relates to unexpired risks at the reporting date is reported
as the unearned premium liability. Premiums are shown before deduction of commission and are gross of any taxes or duties levied on
premiums. Where insurance contracts have a single premium or a limited number of premium payments due over a significantly shorter period
than the period during which benefits are provided, the excess of the premiums payable over the valuation premiums is deferred and
recognised as income in line with the decrease of unexpired insurance risk of the contracts in force or, for annuities in force, in line with the
decrease of the amount of future benefits expected to be paid.
(b) Rendering of services: Revenue arising from asset management and other related services offered by the Group are recognised in the
accounting period in which the services are rendered. Fees consist primarily of investment management fees arising from services rendered
in conjunction with the issue and management of investment contracts where the Group actively manages the consideration received from its
customers to fund a return that is based on the investment profile that the customer selected on origination of the instrument.
These services comprise the activity of trading financial assets and derivatives in order to reproduce the contractual returns that the Group’s
customers expect to receive from their investments. Such activities generate revenue that is recognised by reference to the stage of completion
of the contractual services.
In all cases, these services comprise an indeterminate number of acts over the life of the individual contracts. For practical purposes, the
Group recognises these fees on a straight-line basis over the estimated life of the contract. Certain upfront payments received for asset
management services (‘front-end fees’) are deferred and amortised in proportion to the stage of completion of the service for which they
were paid.
The Group presents basic earnings per share (EPS) data for its ordinary shares. Basic EPS is calculated by dividing the profit or loss
attributable to ordinary shareholders of the Company by the weighted average number of ordinary shares outstanding during the period
excluding treasury shares held by the Company.
Diluted EPS is determined by adjusting the profit or loss attributable to ordinary shareholders and the weighted average number of ordinary
shares outstanding for the effects of all dilutive potential ordinary shares which comprise share options granted to staff.
Reinsurance cost represents outward premium paid to reinsurance companies less the unexpired portion as at the end of the accounting year.
The Group charges its customers for asset management and other related services using the following different approaches:- Front-end
fees are charged to the client on inception. This approach is used particularly for single premium contracts. The consideration received is
deferred as a liability and recognised over the life of the contract on a straight-line basis; and Regular fees are charged to the customer
periodically (monthly, quarterly or annually) either directly or by making a deduction from invested funds. Regular charges billed in advance
are recognised on a straight-line basis over the billing period; fees charged at the end of the period are accrued as a receivable that is
offset against the financial liability when charged to the customer.
(c) Dividend income: dividend income for available-for-sale equities is recognised when the right to receive payment is established, this is
the ex-dividend date for equity securities. They are reported within other income.
Net realised gains/(losses) on financial assets comprises gains less losses related to trading and available-for-sale investment, and includes all
realised and unrealised fair value changes and foreign exchange differences and realised gain or loss on available-for-sale investment.
Net fair value gain on non financial assets at fair value represents fair value gains on the Group's non financial instruments such as investment
property.
Actuarial valuation of the life fund is conducted annually to determine the net liabilities on the existing policies and the adequacy of the assets
representing the insurance fund as at the date of valuation. All deficits arising therefrom are charged to the income statement.
Interest income and expenses for all interest-bearing financial instruments including financial instruments measured at fair value through
profit or loss, are recognised within ‘investment income and finance cost respectively in the income statement using the effective interest rate
method. When a receivable is impaired, the Group reduces the carrying amount to its recoverable amount, being the estimated future cash flow
discounted at the original effective interest rate of the instrument, and continues unwinding the discount as interest income.
16
AXA Mansard Insurance plc and Subsidiary Companies
(ii) Underwriting expenses
(iii) Other operating expenses
(iv) Employee benefits
(a) Defined contribution plans
(b) Short-term benefits
(c ) Share based payment
(i) Equity-settled share based payment
(ii) Cash-settled share based payment
The fair value of the amount payable to employees in respect of share appreciation rights, which are settled in cash, is recognised as an
expense, with a corresponding increase in liabilities, over the period in which the employees become unconditionally entitled to payment. The
liability is remeasured at each reporting date and at settlement date. Any changes in the fair value of the liability are recognised in profit or
loss.
Underwriting expenses comprise acquisition costs and other underwriting expenses. Acquisition costs comprise all direct and indirect costs
arising from the writing of insurance contracts. Examples of these costs include, but are not limited to, commission expense, supervisory levy,
superintending fees and other technical expenses. Other underwriting expenses are those incurred in servicing existing policies/contract.
These expenses are charged in the accounting year in which they are incurred.
Other expenses are expenses other than claims expenses, employee benefit, expenses for marketing and administration and underwriting
expenses. They include wages for contract staff, professional fee, depreciation expenses and other non-operating expenses. Other operating
expenses are accounted for on accrual basis and recognised in the income statement upon utilization of the service.
The Group operates a defined contributory pension scheme for eligible employees. Employees and the Group contribute 7.5% and 10.5%
respectively each qualifying staff's salary in line with the provisions of the Pension Reform Act 2014. The Group pays contributions to
pension fund administrator on a mandatory basis. The Group has no further payment obligations once the contributions have been paid. The
contributions are recognised as employee benefits expense when they are due. Prepaid contributions are recognised as an asset to the extent
that a cash refund or a reduction in the future payments is available.
Wages, salaries, paid annual leave and sick leave, bonuses and non-monetary benefits are recognised as employee benefit expense and
accrued when the associated services are rendered by the employees of the Group.
The grant date fair value of equity -settled share-based payments awards granted to employees is generally recognised as an expense, with a
corresponding increase in equity, over the vesting period of the awards. The amount recognised as an expense is adjusted to reflect the
number of awards for which the related services and unobservable performance conditions are expected to be met, such that the amount
ultimately recognised is based on the number of awards that meet the related service and unobservable performance conditions at the vesting
date. For share- based payment awards with non vesting conditions, the grant date fair value of the share based payment is measured to reflect
such conditions.
17
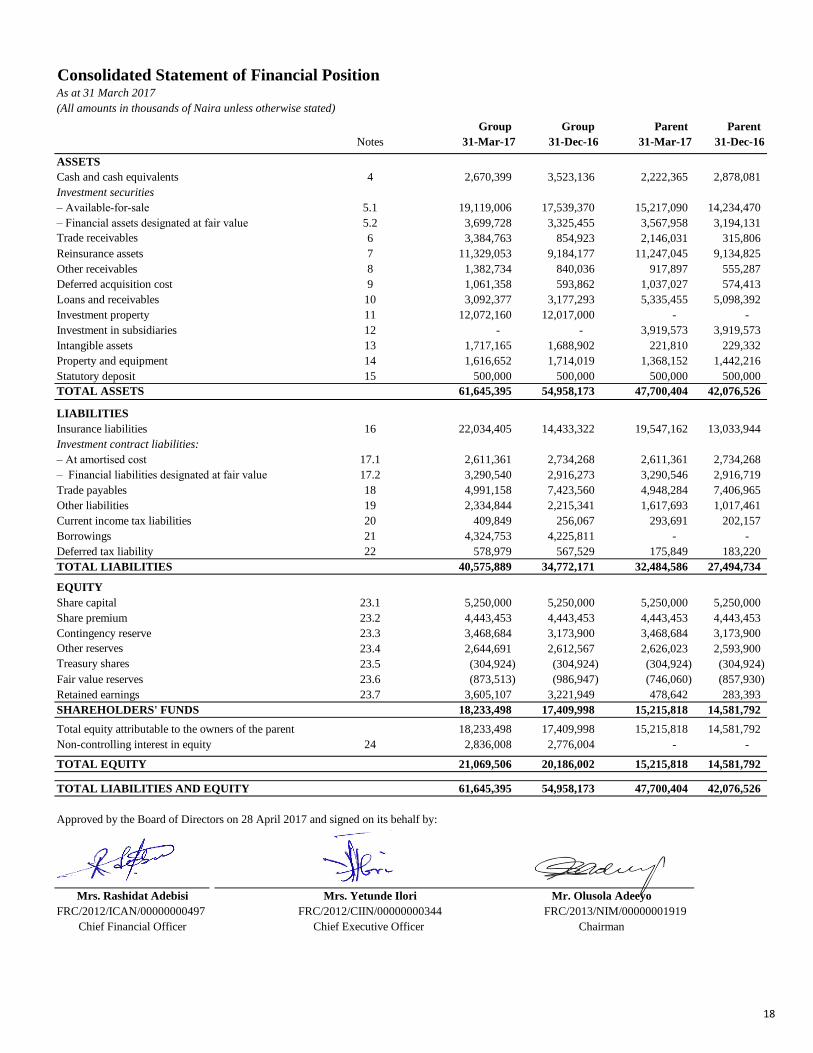
Consolidated Statement of Financial PositionAs at 31 March 2017
(All amounts in thousands of Naira unless otherwise stated)
Group Group Parent Parent
Notes 31-Mar-17 31-Dec-16 31-Mar-17 31-Dec-16
ASSETS
Cash and cash equivalents 4 2,670,399 3,523,136 2,222,365 2,878,081
Investment securities
– Available-for-sale 5.1 19,119,006 17,539,370 15,217,090 14,234,470
– Financial assets designated at fair value 5.2 3,699,728 3,325,455 3,567,958 3,194,131
Trade receivables 6 3,384,763 854,923 2,146,031 315,806
Reinsurance assets 7 11,329,053 9,184,177 11,247,045 9,134,825
Other receivables 8 1,382,734 840,036 917,897 555,287
Deferred acquisition cost 9 1,061,358 593,862 1,037,027 574,413
Loans and receivables 10 3,092,377 3,177,293 5,335,455 5,098,392
Investment property 11 12,072,160 12,017,000 - -
Investment in subsidiaries 12 - - 3,919,573 3,919,573
Intangible assets 13 1,717,165 1,688,902 221,810 229,332
Property and equipment 14 1,616,652 1,714,019 1,368,152 1,442,216
Statutory deposit 15 500,000 500,000 500,000 500,000
TOTAL ASSETS 61,645,395 54,958,173 47,700,404 42,076,526
LIABILITIES
Insurance liabilities 16 22,034,405 14,433,322 19,547,162 13,033,944
Investment contract liabilities:
– At amortised cost 17.1 2,611,361 2,734,268 2,611,361 2,734,268
– Financial liabilities designated at fair value 17.2 3,290,540 2,916,273 3,290,546 2,916,719
Trade payables 18 4,991,158 7,423,560 4,948,284 7,406,965
Other liabilities 19 2,334,844 2,215,341 1,617,693 1,017,461
Current income tax liabilities 20 409,849 256,067 293,691 202,157
Borrowings 21 4,324,753 4,225,811 - -
Deferred tax liability 22 578,979 567,529 175,849 183,220
TOTAL LIABILITIES 40,575,889 34,772,171 32,484,586 27,494,734
EQUITY
Share capital 23.1 5,250,000 5,250,000 5,250,000 5,250,000
Share premium 23.2 4,443,453 4,443,453 4,443,453 4,443,453
Contingency reserve 23.3 3,468,684 3,173,900 3,468,684 3,173,900
Other reserves 23.4 2,644,691 2,612,567 2,626,023 2,593,900
Treasury shares 23.5 (304,924) (304,924) (304,924) (304,924)
Fair value reserves 23.6 (873,513) (986,947) (746,060) (857,930)
Retained earnings 23.7 3,605,107 3,221,949 478,642 283,393
SHAREHOLDERS' FUNDS 18,233,498 17,409,998 15,215,818 14,581,792
Total equity attributable to the owners of the parent 18,233,498 17,409,998 15,215,818 14,581,792
Non-controlling interest in equity 24 2,836,008 2,776,004 - -
TOTAL EQUITY 21,069,506 20,186,002 15,215,818 14,581,792
TOTAL LIABILITIES AND EQUITY 61,645,395 54,958,173 47,700,404 42,076,526
Approved by the Board of Directors on 28 April 2017 and signed on its behalf by:
Mrs. Rashidat Adebisi Mrs. Yetunde Ilori Mr. Olusola Adeeyo
FRC/2012/ICAN/00000000497 FRC/2012/CIIN/00000000344 FRC/2013/NIM/00000001919
Chief Financial Officer Chief Executive Officer Chairman
18
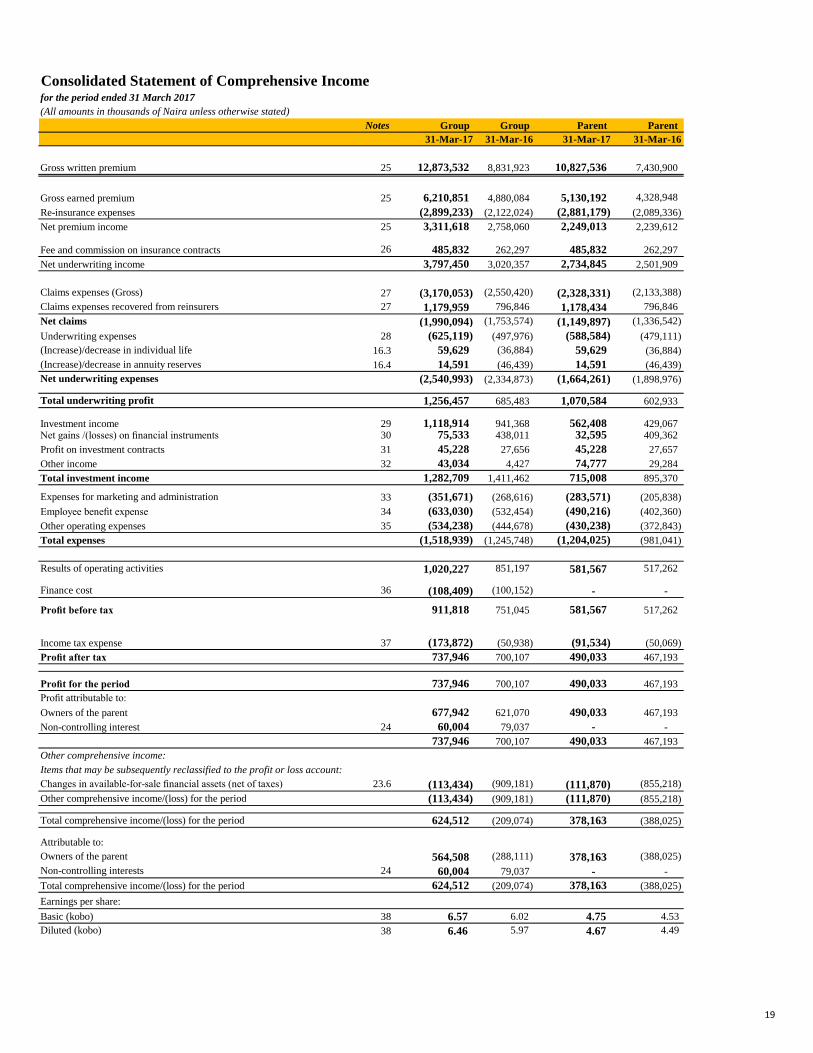
Consolidated Statement of Comprehensive Incomefor the period ended 31 March 2017
(All amounts in thousands of Naira unless otherwise stated)
Notes Group Group Parent Parent
31-Mar-17 31-Mar-16 31-Mar-17 31-Mar-16
Gross written premium 25 12,873,532 8,831,923 10,827,536 7,430,900
Gross earned premium 25 6,210,851 4,880,084 5,130,192 4,328,948
Re-insurance expenses (2,899,233) (2,122,024) (2,881,179) (2,089,336)
Net premium income 25 3,311,618 2,758,060 2,249,013 2,239,612
Fee and commission on insurance contracts 26 485,832 262,297 485,832 262,297
Net underwriting income 3,797,450 3,020,357 2,734,845 2,501,909
Claims expenses (Gross) 27 (3,170,053) (2,550,420) (2,328,331) (2,133,388)
Claims expenses recovered from reinsurers 27 1,179,959 796,846 1,178,434 796,846
Net claims (1,990,094) (1,753,574) (1,149,897) (1,336,542)
Underwriting expenses 28 (625,119) (497,976) (588,584) (479,111)
(Increase)/decrease in individual life 16.3 59,629 (36,884) 59,629 (36,884)
(Increase)/decrease in annuity reserves 16.4 14,591 (46,439) 14,591 (46,439)
Net underwriting expenses (2,540,993) (2,334,873) (1,664,261) (1,898,976)
Total underwriting profit 1,256,457 685,483 1,070,584 602,933
Investment income 29 1,118,914 941,368 562,408 429,067 Net gains /(losses) on financial instruments 30 75,533 438,011 32,595 409,362
Profit on investment contracts 31 45,228 27,656 45,228 27,657
Other income 32 43,034 4,427 74,777 29,284
Total investment income 1,282,709 1,411,462 715,008 895,370
Expenses for marketing and administration 33 (351,671) (268,616) (283,571) (205,838)
Employee benefit expense 34 (633,030) (532,454) (490,216) (402,360)
Other operating expenses 35 (534,238) (444,678) (430,238) (372,843)
Total expenses (1,518,939) (1,245,748) (1,204,025) (981,041)
Results of operating activities 1,020,227 851,197 581,567 517,262
Finance cost 36 (108,409) (100,152) - -
Profit before tax 911,818 751,045 581,567 517,262
Income tax expense 37 (173,872) (50,938) (91,534) (50,069)
Profit after tax 737,946 700,107 490,033 467,193
Profit for the period 737,946 700,107 490,033 467,193
Profit attributable to:
Owners of the parent 677,942 621,070 490,033 467,193
Non-controlling interest 24 60,004 79,037 - -
737,946 700,107 490,033 467,193
Other comprehensive income:
Items that may be subsequently reclassified to the profit or loss account:
Changes in available-for-sale financial assets (net of taxes) 23.6 (113,434) (909,181) (111,870) (855,218)
Other comprehensive income/(loss) for the period (113,434) (909,181) (111,870) (855,218)
Total comprehensive income/(loss) for the period 624,512 (209,074) 378,163 (388,025)
Attributable to:
Owners of the parent 564,508 (288,111) 378,163 (388,025)
Non-controlling interests 24 60,004 79,037 - -
Total comprehensive income/(loss) for the period 624,512 (209,074) 378,163 (388,025)
Earnings per share:
Basic (kobo) 38 6.57 6.02 4.75 4.53
Diluted (kobo) 38 6.46 5.97 4.67 4.49
19
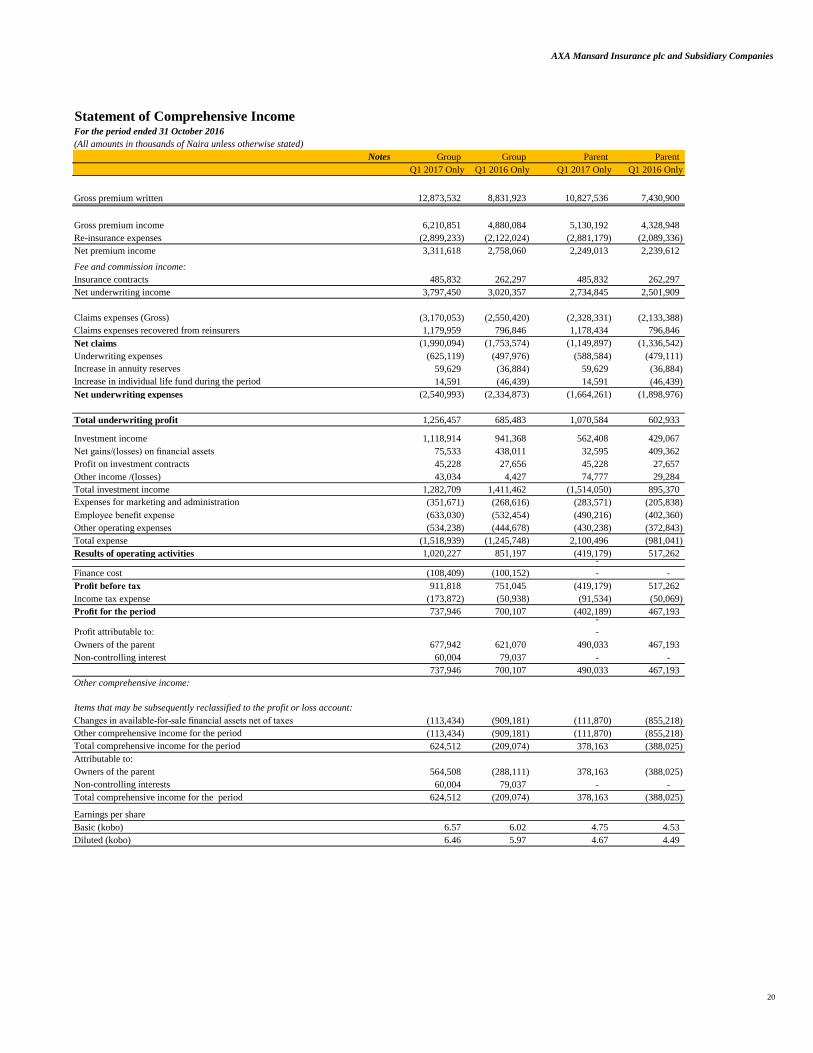
AXA Mansard Insurance plc and Subsidiary Companies
Statement of Comprehensive IncomeFor the period ended 31 October 2016
(All amounts in thousands of Naira unless otherwise stated)
Notes Group Group Parent Parent
Q1 2017 Only Q1 2016 Only Q1 2017 Only Q1 2016 Only
Gross premium written 12,873,532 8,831,923 10,827,536 7,430,900
Gross premium income 6,210,851 4,880,084 5,130,192 4,328,948
Re-insurance expenses (2,899,233) (2,122,024) (2,881,179) (2,089,336)
Net premium income 3,311,618 2,758,060 2,249,013 2,239,612
Fee and commission income:
Insurance contracts 485,832 262,297 485,832 262,297
Net underwriting income 3,797,450 3,020,357 2,734,845 2,501,909
Claims expenses (Gross) (3,170,053) (2,550,420) (2,328,331) (2,133,388)
Claims expenses recovered from reinsurers 1,179,959 796,846 1,178,434 796,846
Net claims (1,990,094) (1,753,574) (1,149,897) (1,336,542)
Underwriting expenses (625,119) (497,976) (588,584) (479,111)
Increase in annuity reserves 59,629 (36,884) 59,629 (36,884)
Increase in individual life fund during the period 14,591 (46,439) 14,591 (46,439)
Net underwriting expenses (2,540,993) (2,334,873) (1,664,261) (1,898,976)
Total underwriting profit 1,256,457 685,483 1,070,584 602,933
Investment income 1,118,914 941,368 562,408 429,067
Net gains/(losses) on financial assets 75,533 438,011 32,595 409,362
Profit on investment contracts 45,228 27,656 45,228 27,657
Other income /(losses) 43,034 4,427 74,777 29,284
Total investment income 1,282,709 1,411,462 (1,514,050) 895,370
Expenses for marketing and administration (351,671) (268,616) (283,571) (205,838)
Employee benefit expense (633,030) (532,454) (490,216) (402,360)
Other operating expenses (534,238) (444,678) (430,238) (372,843)
Total expense (1,518,939) (1,245,748) 2,100,496 (981,041)
Results of operating activities 1,020,227 851,197 (419,179) 517,262 -
Finance cost (108,409) (100,152) - -
Profit before tax 911,818 751,045 (419,179) 517,262
Income tax expense (173,872) (50,938) (91,534) (50,069)
Profit for the period 737,946 700,107 (402,189) 467,193 -
Profit attributable to: -
Owners of the parent 677,942 621,070 490,033 467,193
Non-controlling interest 60,004 79,037 - -
737,946 700,107 490,033 467,193
Other comprehensive income:
Items that may be subsequently reclassified to the profit or loss account:
Changes in available-for-sale financial assets net of taxes (113,434) (909,181) (111,870) (855,218)
Other comprehensive income for the period (113,434) (909,181) (111,870) (855,218)
Total comprehensive income for the period 624,512 (209,074) 378,163 (388,025)
Attributable to:
Owners of the parent 564,508 (288,111) 378,163 (388,025)
Non-controlling interests 60,004 79,037 - -
Total comprehensive income for the period 624,512 (209,074) 378,163 (388,025)
Earnings per share
Basic (kobo) 6.57 6.02 4.75 4.53
Diluted (kobo) 6.46 5.97 4.67 4.49
20
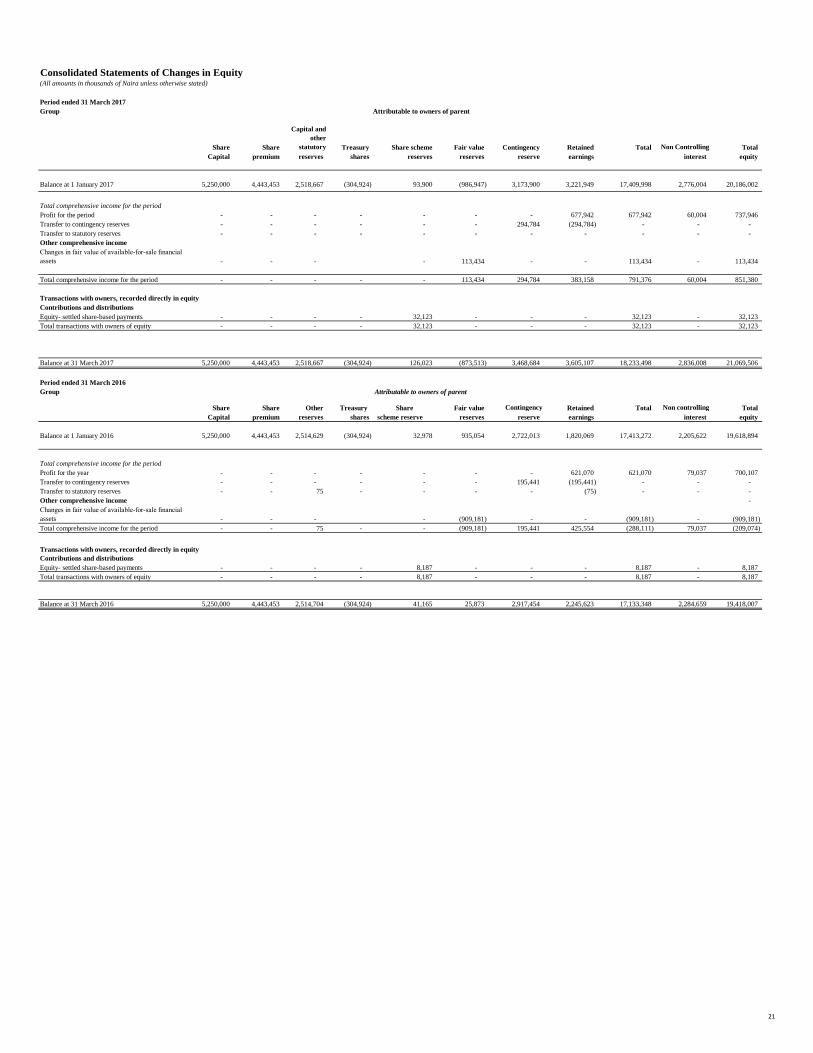
Consolidated Statements of Changes in Equity(All amounts in thousands of Naira unless otherwise stated)
Period ended 31 March 2017
Group
Share Share
Capital and
other
statutory Treasury Share scheme Fair value Contingency Retained Total Non Controlling Total
Capital premium reserves shares reserves reserves reserve earnings interest equity
Balance at 1 January 2017 5,250,000 4,443,453 2,518,667 (304,924) 93,900 (986,947) 3,173,900 3,221,949 17,409,998 2,776,004 20,186,002
Total comprehensive income for the period
Profit for the period - - - - - - - 677,942 677,942 60,004 737,946
Transfer to contingency reserves - - - - - - 294,784 (294,784) - - -
Transfer to statutory reserves - - - - - - - - - - -
Other comprehensive income
Changes in fair value of available-for-sale financial
assets - - - - 113,434 - - 113,434 - 113,434
Total comprehensive income for the period - - - - - 113,434 294,784 383,158 791,376 60,004 851,380
Transactions with owners, recorded directly in equity
Contributions and distributions
Equity- settled share-based payments - - - - 32,123 - - - 32,123 - 32,123
Total transactions with owners of equity - - - - 32,123 - - - 32,123 - 32,123
Balance at 31 March 2017 5,250,000 4,443,453 2,518,667 (304,924) 126,023 (873,513) 3,468,684 3,605,107 18,233,498 2,836,008 21,069,506
Period ended 31 March 2016
Group
Share Share Other Treasury Share Fair value Contingency Retained Total Non controlling Total
Capital premium reserves shares scheme reserve reserves reserve earnings interest equity
Balance at 1 January 2016 5,250,000 4,443,453 2,514,629 (304,924) 32,978 935,054 2,722,013 1,820,069 17,413,272 2,205,622 19,618,894
Total comprehensive income for the period
Profit for the year - - - - - - - 621,070 621,070 79,037 700,107
Transfer to contingency reserves - - - - - - 195,441 (195,441) - - -
Transfer to statutory reserves - - 75 - - - - (75) - - -
Other comprehensive income -
Changes in fair value of available-for-sale financial
assets - - - - (909,181) - - (909,181) - (909,181)
Total comprehensive income for the period - - 75 - - (909,181) 195,441 425,554 (288,111) 79,037 (209,074)
Transactions with owners, recorded directly in equity
Contributions and distributions
Equity- settled share-based payments - - - - 8,187 - - - 8,187 - 8,187
Total transactions with owners of equity - - - - 8,187 - - - 8,187 - 8,187
Balance at 31 March 2016 5,250,000 4,443,453 2,514,704 (304,924) 41,165 25,873 2,917,454 2,245,623 17,133,348 2,284,659 19,418,007
Attributable to owners of parent
Attributable to owners of parent
21

Statement of Changes in Equity(All amounts in thousands of Naira unless otherwise stated)
Period ended 31 March 2017
Parent
Share Share Treasury Capital Share Fair Contingency Retained Total
Capital premium shares reserves scheme value reserve earnings
reserve reserves
Balance at 1 January 2017 5,250,000 4,443,453 (304,924) 2,500,000 93,900 (857,930) 3,173,900 283,393 14,581,792
Total comprehensive income for the period
Profit for the period - - - - - - - 490,033 490,033
Transfer to contingency reserves - - - - - - 294,784 (294,784) -
Other comprehensive income
Changes in fair value of available-for-sale financial
assets - - - - - 111,870 - - 111,870
Total comprehensive income for the period - - - - - 111,870 294,784 195,249 601,903
Transactions with owners, recorded directly in equity
Contributions by and distributions to owners
Equity- settled share-based transactions - - - - 32,123 - - - 32,123
Total transactions with owners - - - - 32,123 - - - 32,123
Balance at 31 March 2017 5,250,000 4,443,453 (304,924) 2,500,000 126,024 (746,060) 3,468,684 478,642 15,215,819
Period ended 31 March 2016
Parent
Fair
Share Share Treasury Other Share value Contingency Retained Total
Capital premium shares reserves scheme reserves reserve earnings
reserve
Balance at 1 January 2016 5,250,000 4,443,453 (304,924) 2,500,000 32,978 851,929 2,722,013 (98,288) 15,397,162
Total comprehensive income for the period
Profit for the period - - - - - - - 467,193 467,193
Transfer to contingency reserves - - - - - - 195,441 (195,441) -
Other comprehensive income
Changes in fair value of available-for-sale financial
assets - - - - - (855,218) - - (855,218)
Total comprehensive income for the period - - - - - (855,218) 195,441 271,752 (388,025)
Transactions with owners, recorded directly in equity
Equity- settled share-based transactions - - - - 8,187 - - - 8,187
Total transactions with owners - - - - 8,187 - - - 8,187
Balance at 31 March 2016 5,250,000 4,443,453 (304,924) 2,500,000 41,165 (3,289) 2,917,455 173,465 15,017,324
22
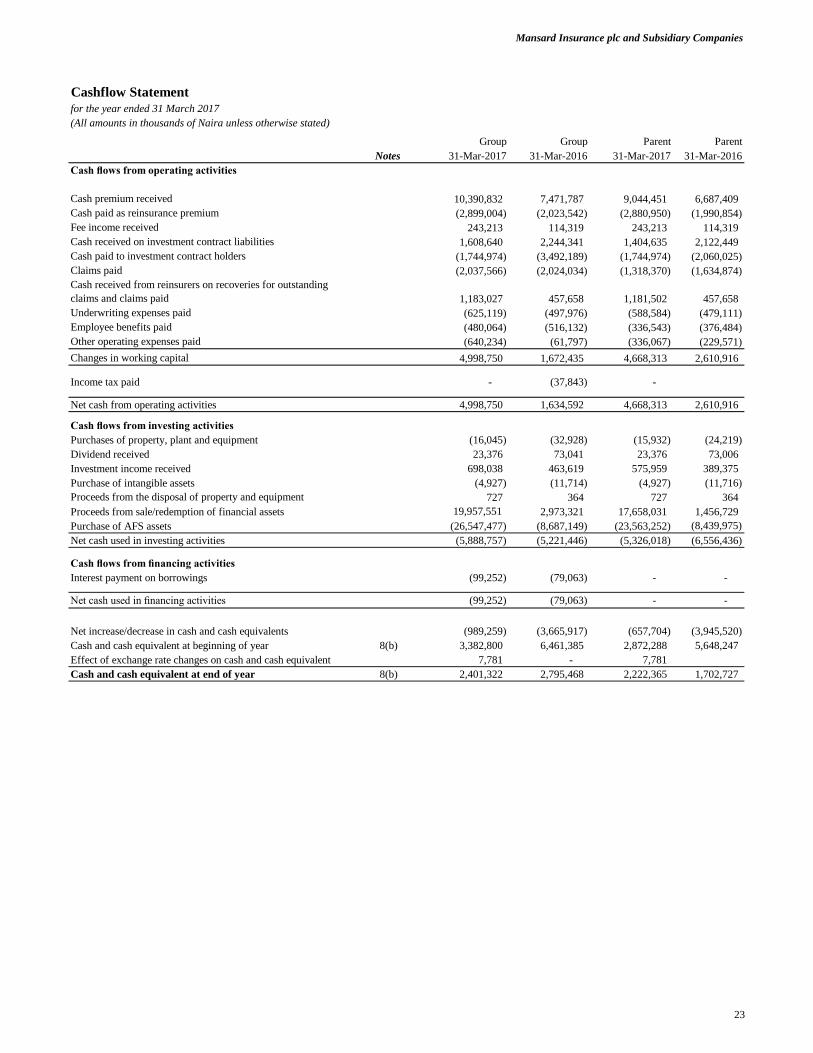
Mansard Insurance plc and Subsidiary Companies
Cashflow Statement
for the year ended 31 March 2017
(All amounts in thousands of Naira unless otherwise stated)
Group Group Parent Parent
Notes 31-Mar-2017 31-Mar-2016 31-Mar-2017 31-Mar-2016
Cash flows from operating activities
Cash premium received 10,390,832 7,471,787 9,044,451 6,687,409
Cash paid as reinsurance premium (2,899,004) (2,023,542) (2,880,950) (1,990,854)
Fee income received 243,213 114,319 243,213 114,319
Cash received on investment contract liabilities 1,608,640 2,244,341 1,404,635 2,122,449
Cash paid to investment contract holders (1,744,974) (3,492,189) (1,744,974) (2,060,025)
Claims paid (2,037,566) (2,024,034) (1,318,370) (1,634,874)
Cash received from reinsurers on recoveries for outstanding
claims and claims paid 1,183,027 457,658 1,181,502 457,658
Underwriting expenses paid (625,119) (497,976) (588,584) (479,111)
Employee benefits paid (480,064) (516,132) (336,543) (376,484)
Other operating expenses paid (640,234) (61,797) (336,067) (229,571)
Changes in working capital 4,998,750 1,672,435 4,668,313 2,610,916
Income tax paid - (37,843) -
Net cash from operating activities 4,998,750 1,634,592 4,668,313 2,610,916
Cash flows from investing activities
Purchases of property, plant and equipment (16,045) (32,928) (15,932) (24,219)
Dividend received 23,376 73,041 23,376 73,006
Investment income received 698,038 463,619 575,959 389,375
Purchase of intangible assets (4,927) (11,714) (4,927) (11,716)
Proceeds from the disposal of property and equipment 727 364 727 364
Proceeds from sale/redemption of financial assets 19,957,551 2,973,321 17,658,031 1,456,729
Purchase of AFS assets (26,547,477) (8,687,149) (23,563,252) (8,439,975)
Net cash used in investing activities (5,888,757) (5,221,446) (5,326,018) (6,556,436)
Cash flows from financing activities
Interest payment on borrowings (99,252) (79,063) - -
Net cash used in financing activities (99,252) (79,063) - -
Net increase/decrease in cash and cash equivalents (989,259) (3,665,917) (657,704) (3,945,520)
Cash and cash equivalent at beginning of year 8(b) 3,382,800 6,461,385 2,872,288 5,648,247
Effect of exchange rate changes on cash and cash equivalent 7,781 - 7,781
Cash and cash equivalent at end of year 8(b) 2,401,322 2,795,468 2,222,365 1,702,727
23
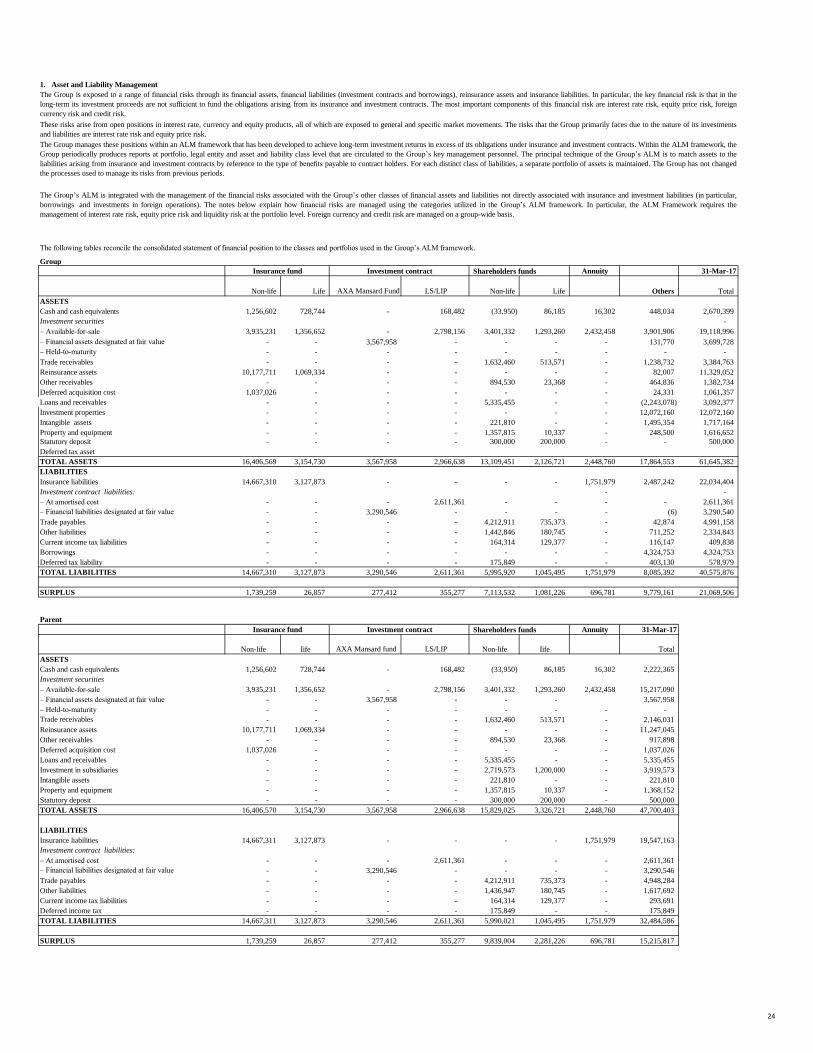
1. Asset and Liability Management
Group
Insurance fund Investment contract Shareholders funds Annuity 31-Mar-17
Non-life Life AXA Mansard Fund LS/LIP Non-life Life Others Total
ASSETS
Cash and cash equivalents 1,256,602 728,744 - 168,482 (33,950) 86,185 16,302 448,034 2,670,399
Investment securities -
– Available-for-sale 3,935,231 1,356,652 - 2,798,156 3,401,332 1,293,260 2,432,458 3,901,906 19,118,996
– Financial assets designated at fair value - - 3,567,958 - - - - 131,770 3,699,728
– Held-to-maturity - - - - - - - - -
Trade receivables - - - - 1,632,460 513,571 - 1,238,732 3,384,763
Reinsurance assets 10,177,711 1,069,334 - - - - - 82,007 11,329,052
Other receivables - - - - 894,530 23,368 - 464,836 1,382,734
Deferred acquisition cost 1,037,026 - - - - - - 24,331 1,061,357
Loans and receivables - - - - 5,335,455 - - (2,243,078) 3,092,377
Investment properties - - - - - - - 12,072,160 12,072,160
Intangible assets - - - - 221,810 - - 1,495,354 1,717,164
Property and equipment - - - - 1,357,815 10,337 - 248,500 1,616,652
Statutory deposit - - - - 300,000 200,000 - - 500,000
Deferred tax asset
TOTAL ASSETS 16,406,569 3,154,730 3,567,958 2,966,638 13,109,451 2,126,721 2,448,760 17,864,553 61,645,382
LIABILITIES
Insurance liabilities 14,667,310 3,127,873 - - - - 1,751,979 2,487,242 22,034,404
Investment contract liabilities: - -
– At amortised cost - - - 2,611,361 - - - - 2,611,361
– Financial liabilities designated at fair value - - 3,290,546 - - - - (6) 3,290,540
Trade payables - - - - 4,212,911 735,373 - 42,874 4,991,158
Other liabilities - - - - 1,442,846 180,745 - 711,252 2,334,843
Current income tax liabilities - - - - 164,314 129,377 - 116,147 409,838
Borrowings - - - - - - - 4,324,753 4,324,753
Deferred tax liability - - - - 175,849 - - 403,130 578,979
TOTAL LIABILITIES 14,667,310 3,127,873 3,290,546 2,611,361 5,995,920 1,045,495 1,751,979 8,085,392 40,575,876
SURPLUS 1,739,259 26,857 277,412 355,277 7,113,532 1,081,226 696,781 9,779,161 21,069,506
Parent
Insurance fund Investment contract Shareholders funds Annuity 31-Mar-17
Non-life Iife AXA Mansard fund LS/LIP Non-life Iife Total
ASSETS
Cash and cash equivalents 1,256,602 728,744 - 168,482 (33,950) 86,185 16,302 2,222,365
Investment securities
– Available-for-sale 3,935,231 1,356,652 - 2,798,156 3,401,332 1,293,260 2,432,458 15,217,090
– Financial assets designated at fair value - - 3,567,958 - - - 3,567,958
– Held-to-maturity - - - - - - - -
Trade receivables - - - - 1,632,460 513,571 - 2,146,031
Reinsurance assets 10,177,711 1,069,334 - - - - - 11,247,045
Other receivables - - - - 894,530 23,368 - 917,898
Deferred acquisition cost 1,037,026 - - - - - - 1,037,026
Loans and receivables - - - - 5,335,455 - - 5,335,455
Investment in subsidiaries - - - - 2,719,573 1,200,000 - 3,919,573
Intangible assets - - - - 221,810 - - 221,810
Property and equipment - - - - 1,357,815 10,337 - 1,368,152
Statutory deposit - - - - 300,000 200,000 - 500,000
TOTAL ASSETS 16,406,570 3,154,730 3,567,958 2,966,638 15,829,025 3,326,721 2,448,760 47,700,403
LIABILITIES
Insurance liabilities 14,667,311 3,127,873 - - - - 1,751,979 19,547,163
Investment contract liabilities:
– At amortised cost - - - 2,611,361 - - - 2,611,361
– Financial liabilities designated at fair value - - 3,290,546 - - - - 3,290,546
Trade payables - - - - 4,212,911 735,373 - 4,948,284
Other liabilities - - - - 1,436,947 180,745 - 1,617,692
Current income tax liabilities - - - - 164,314 129,377 - 293,691
Deferred income tax - - - - 175,849 - - 175,849
TOTAL LIABILITIES 14,667,311 3,127,873 3,290,546 2,611,361 5,990,021 1,045,495 1,751,979 32,484,586
SURPLUS 1,739,259 26,857 277,412 355,277 9,839,004 2,281,226 696,781 15,215,817
The following tables reconcile the consolidated statement of financial position to the classes and portfolios used in the Group’s ALM framework.
The Group is exposed to a range of financial risks through its financial assets, financial liabilities (investment contracts and borrowings), reinsurance assets and insurance liabilities. In particular, the key financial risk is that in the
long-term its investment proceeds are not sufficient to fund the obligations arising from its insurance and investment contracts. The most important components of this financial risk are interest rate risk, equity price risk, foreign
currency risk and credit risk.
These risks arise from open positions in interest rate, currency and equity products, all of which are exposed to general and specific market movements. The risks that the Group primarily faces due to the nature of its investments
and liabilities are interest rate risk and equity price risk.
The Group manages these positions within an ALM framework that has been developed to achieve long-term investment returns in excess of its obligations under insurance and investment contracts. Within the ALM framework, the
Group periodically produces reports at portfolio, legal entity and asset and liability class level that are circulated to the Group’s key management personnel. The principal technique of the Group’s ALM is to match assets to the
liabilities arising from insurance and investment contracts by reference to the type of benefits payable to contract holders. For each distinct class of liabilities, a separate portfolio of assets is maintained. The Group has not changed
the processes used to manage its risks from previous periods.
The Group’s ALM is integrated with the management of the financial risks associated with the Group’s other classes of financial assets and liabilities not directly associated with insurance and investment liabilities (in particular,
borrowings and investments in foreign operations). The notes below explain how financial risks are managed using the categories utilized in the Group’s ALM framework. In particular, the ALM Framework requires the
management of interest rate risk, equity price risk and liquidity risk at the portfolio level. Foreign currency and credit risk are managed on a group-wide basis.
24
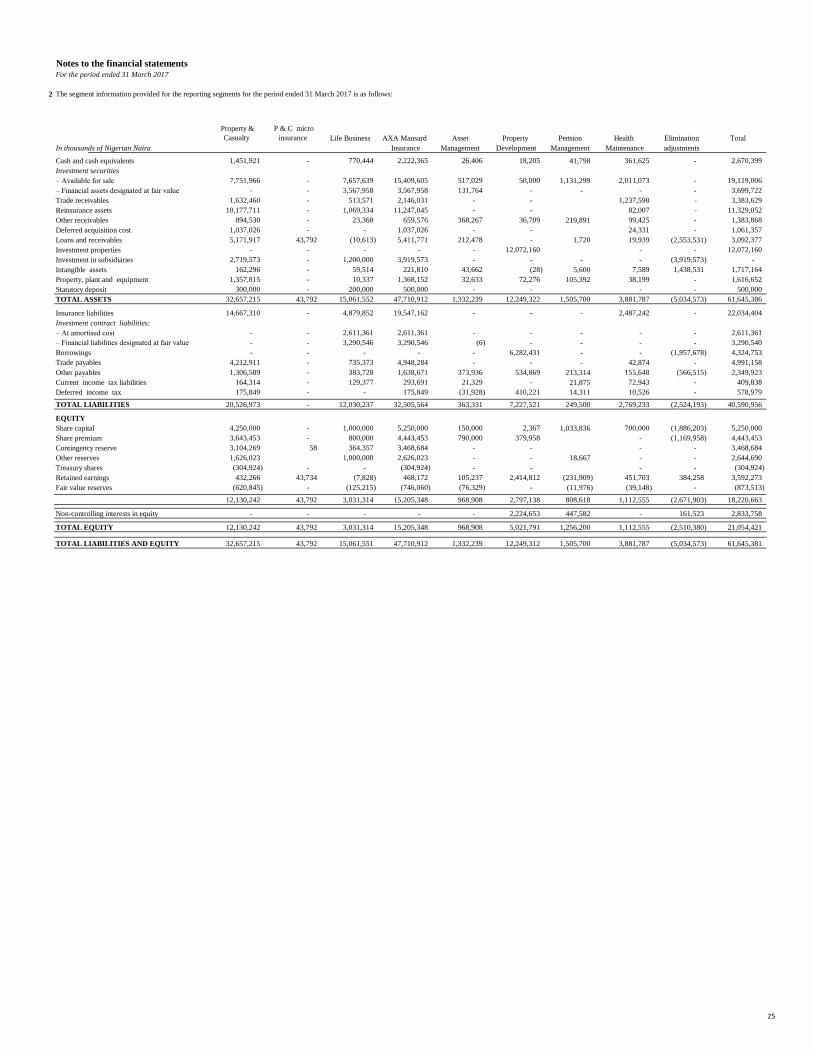
Notes to the financial statementsFor the period ended 31 March 2017
2 The segment information provided for the reporting segments for the period ended 31 March 2017 is as follows:
Property &
Casualty
P & C micro
insurance Life Business AXA Mansard Asset Property Pension Health Elimination Total
In thousands of Nigerian Naira Insurance Management Development Management Maintenance adjustments
Cash and cash equivalents 1,451,921 - 770,444 2,222,365 26,406 18,205 41,798 361,625 - 2,670,399
Investment securities
– Available for sale 7,751,966 - 7,657,639 15,409,605 517,029 50,000 1,131,299 2,011,073 - 19,119,006
– Financial assets designated at fair value - - 3,567,958 3,567,958 131,764 - - - - 3,699,722
Trade receivables 1,632,460 - 513,571 2,146,031 - - 1,237,598 - 3,383,629
Reinsurance assets 10,177,711 - 1,069,334 11,247,045 - - 82,007 - 11,329,052
Other receivables 894,530 - 23,368 659,576 368,267 36,709 219,891 99,425 - 1,383,868
Deferred acquisition cost 1,037,026 - - 1,037,026 - - 24,331 - 1,061,357
Loans and receivables 5,171,917 43,792 (10,613) 5,411,771 212,478 - 1,720 19,939 (2,553,531) 3,092,377
Investment properties - - - - - 12,072,160 - - 12,072,160
Investment in subsidiaries 2,719,573 - 1,200,000 3,919,573 - - - - (3,919,573) -
Intangible assets 162,296 - 59,514 221,810 43,662 (28) 5,600 7,589 1,438,531 1,717,164
Property, plant and equipment 1,357,815 - 10,337 1,368,152 32,633 72,276 105,392 38,199 - 1,616,652
Statutory deposit 300,000 - 200,000 500,000 - - - - 500,000
TOTAL ASSETS 32,657,215 43,792 15,061,552 47,710,912 1,332,239 12,249,322 1,505,700 3,881,787 (5,034,573) 61,645,386
Insurance liabilities 14,667,310 - 4,879,852 19,547,162 - - - 2,487,242 - 22,034,404
Investment contract liabilities:
– At amortised cost - - 2,611,361 2,611,361 - - - - - 2,611,361
– Financial liabilities designated at fair value - - 3,290,546 3,290,546 (6) - - - - 3,290,540
Borrowings - - - - - 6,282,431 - - (1,957,678) 4,324,753
Trade payables 4,212,911 - 735,373 4,948,284 - - - 42,874 - 4,991,158
Other payables 1,306,589 - 383,728 1,638,671 373,936 534,869 213,314 155,648 (566,515) 2,349,923
Current income tax liabilities 164,314 - 129,377 293,691 21,329 - 21,875 72,943 - 409,838
Deferred income tax 175,849 - - 175,849 (31,928) 410,221 14,311 10,526 - 578,979
TOTAL LIABILITIES 20,526,973 - 12,030,237 32,505,564 363,331 7,227,521 249,500 2,769,233 (2,524,193) 40,590,956
EQUITY
Share capital 4,250,000 - 1,000,000 5,250,000 150,000 2,367 1,033,836 700,000 (1,886,203) 5,250,000
Share premium 3,643,453 - 800,000 4,443,453 790,000 379,958 - (1,169,958) 4,443,453
Contingency reserve 3,104,269 58 364,357 3,468,684 - - - - 3,468,684
Other reserves 1,626,023 1,000,000 2,626,023 - - 18,667 - - 2,644,690
Treasury shares (304,924) - - (304,924) - - - - (304,924)
Retained earnings 432,266 43,734 (7,828) 468,172 105,237 2,414,812 (231,909) 451,703 384,258 3,592,273
Fair value reserves (620,845) - (125,215) (746,060) (76,329) - (11,976) (39,148) - (873,513)
12,130,242 43,792 3,031,314 15,205,348 968,908 2,797,138 808,618 1,112,555 (2,671,903) 18,220,663
Non-controlling interests in equity - - - - - 2,224,653 447,582 - 161,523 2,833,758
TOTAL EQUITY 12,130,242 43,792 3,031,314 15,205,348 968,908 5,021,791 1,256,200 1,112,555 (2,510,380) 21,054,421
TOTAL LIABILITIES AND EQUITY 32,657,215 43,792 15,061,551 47,710,912 1,332,239 12,249,312 1,505,700 3,881,787 (5,034,573) 61,645,381
25
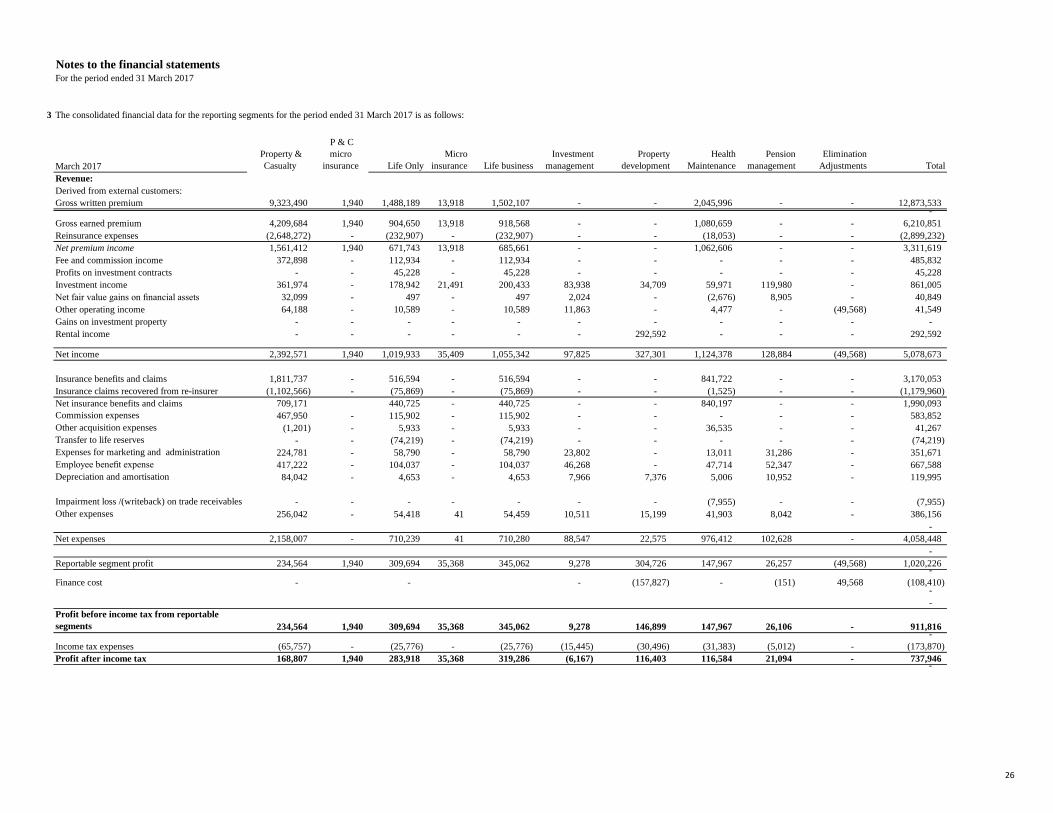
Notes to the financial statementsFor the period ended 31 March 2017
3 The consolidated financial data for the reporting segments for the period ended 31 March 2017 is as follows:
March 2017
Property &
Casualty
P & C
micro
insurance Life Only
Micro
insurance Life business
Investment
management
Property
development
Health
Maintenance
Pension
management
Elimination
Adjustments Total
Revenue:
Derived from external customers:
Gross written premium 9,323,490 1,940 1,488,189 13,918 1,502,107 - - 2,045,996 - - 12,873,533 -
Gross earned premium 4,209,684 1,940 904,650 13,918 918,568 - - 1,080,659 - - 6,210,851
Reinsurance expenses (2,648,272) - (232,907) - (232,907) - - (18,053) - - (2,899,232)
Net premium income 1,561,412 1,940 671,743 13,918 685,661 - - 1,062,606 - - 3,311,619
Fee and commission income 372,898 - 112,934 - 112,934 - - - - - 485,832
Profits on investment contracts - - 45,228 - 45,228 - - - - - 45,228
Investment income 361,974 - 178,942 21,491 200,433 83,938 34,709 59,971 119,980 - 861,005
Net fair value gains on financial assets 32,099 - 497 - 497 2,024 - (2,676) 8,905 - 40,849
Other operating income 64,188 - 10,589 - 10,589 11,863 - 4,477 - (49,568) 41,549
Gains on investment property - - - - - - - - - - -
Rental income - - - - - - 292,592 - - - 292,592
Net income 2,392,571 1,940 1,019,933 35,409 1,055,342 97,825 327,301 1,124,378 128,884 (49,568) 5,078,673
Insurance benefits and claims 1,811,737 - 516,594 - 516,594 - - 841,722 - - 3,170,053
Insurance claims recovered from re-insurer (1,102,566) - (75,869) - (75,869) - - (1,525) - - (1,179,960)
Net insurance benefits and claims 709,171 440,725 - 440,725 - - 840,197 - - 1,990,093
Commission expenses 467,950 - 115,902 - 115,902 - - - - - 583,852
Other acquisition expenses (1,201) - 5,933 - 5,933 - - 36,535 - - 41,267
Transfer to life reserves - - (74,219) - (74,219) - - - - - (74,219)
Expenses for marketing and administration 224,781 - 58,790 - 58,790 23,802 - 13,011 31,286 - 351,671
Employee benefit expense 417,222 - 104,037 - 104,037 46,268 - 47,714 52,347 - 667,588
Depreciation and amortisation 84,042 - 4,653 - 4,653 7,966 7,376 5,006 10,952 - 119,995
Impairment loss /(writeback) on trade receivables - - - - - - - (7,955) - - (7,955)
Other expenses 256,042 - 54,418 41 54,459 10,511 15,199 41,903 8,042 - 386,156
-
Net expenses 2,158,007 - 710,239 41 710,280 88,547 22,575 976,412 102,628 - 4,058,448
-
Reportable segment profit 234,564 1,940 309,694 35,368 345,062 9,278 304,726 147,967 26,257 (49,568) 1,020,226 -
Finance cost - - - (157,827) - (151) 49,568 (108,410) -
-
Profit before income tax from reportable
segments 234,564 1,940 309,694 35,368 345,062 9,278 146,899 147,967 26,106 - 911,816 -
Income tax expenses (65,757) - (25,776) - (25,776) (15,445) (30,496) (31,383) (5,012) - (173,870)
Profit after income tax 168,807 1,940 283,918 35,368 319,286 (6,167) 116,403 116,584 21,094 - 737,946 -
26
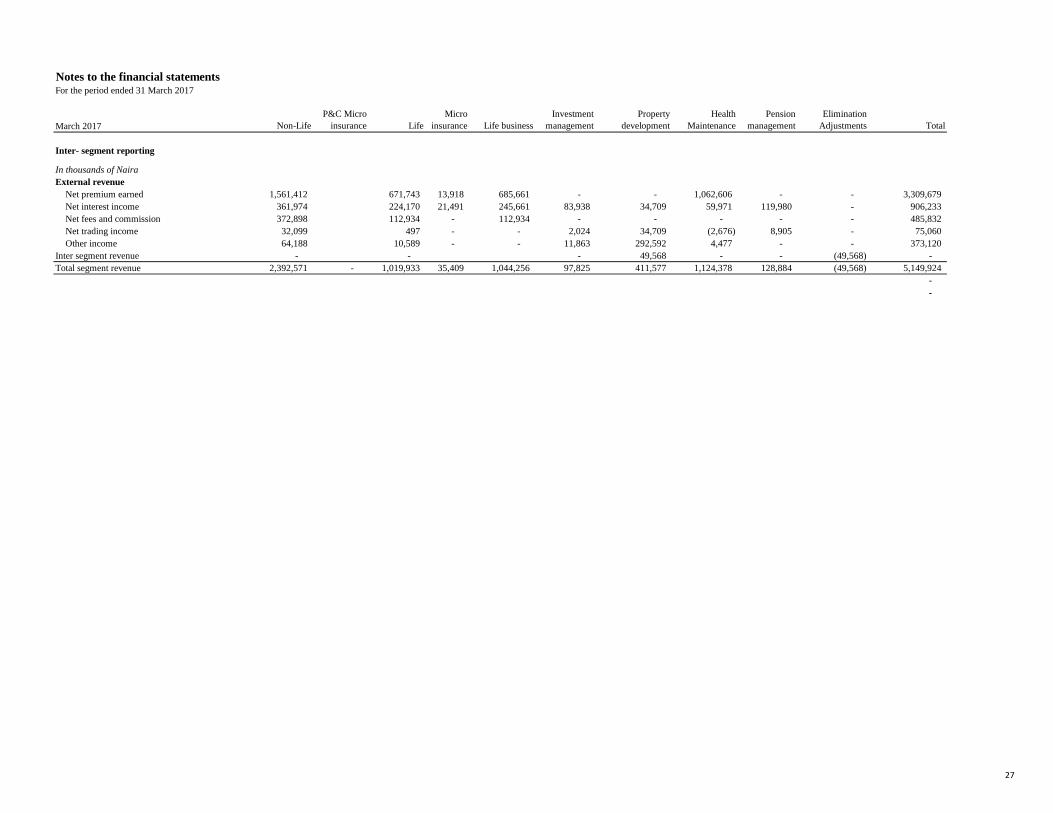
Notes to the financial statementsFor the period ended 31 March 2017
March 2017 Non-Life
P&C Micro
insurance Life
Micro
insurance Life business
Investment
management
Property
development
Health
Maintenance
Pension
management
Elimination
Adjustments Total
Inter- segment reporting
In thousands of Naira
External revenue
Net premium earned 1,561,412 671,743 13,918 685,661 - - 1,062,606 - - 3,309,679
Net interest income 361,974 224,170 21,491 245,661 83,938 34,709 59,971 119,980 - 906,233
Net fees and commission 372,898 112,934 - 112,934 - - - - - 485,832
Net trading income 32,099 497 - - 2,024 34,709 (2,676) 8,905 - 75,060
Other income 64,188 10,589 - - 11,863 292,592 4,477 - - 373,120
Inter segment revenue - - - 49,568 - - (49,568) -
Total segment revenue 2,392,571 - 1,019,933 35,409 1,044,256 97,825 411,577 1,124,378 128,884 (49,568) 5,149,924
-
-
27
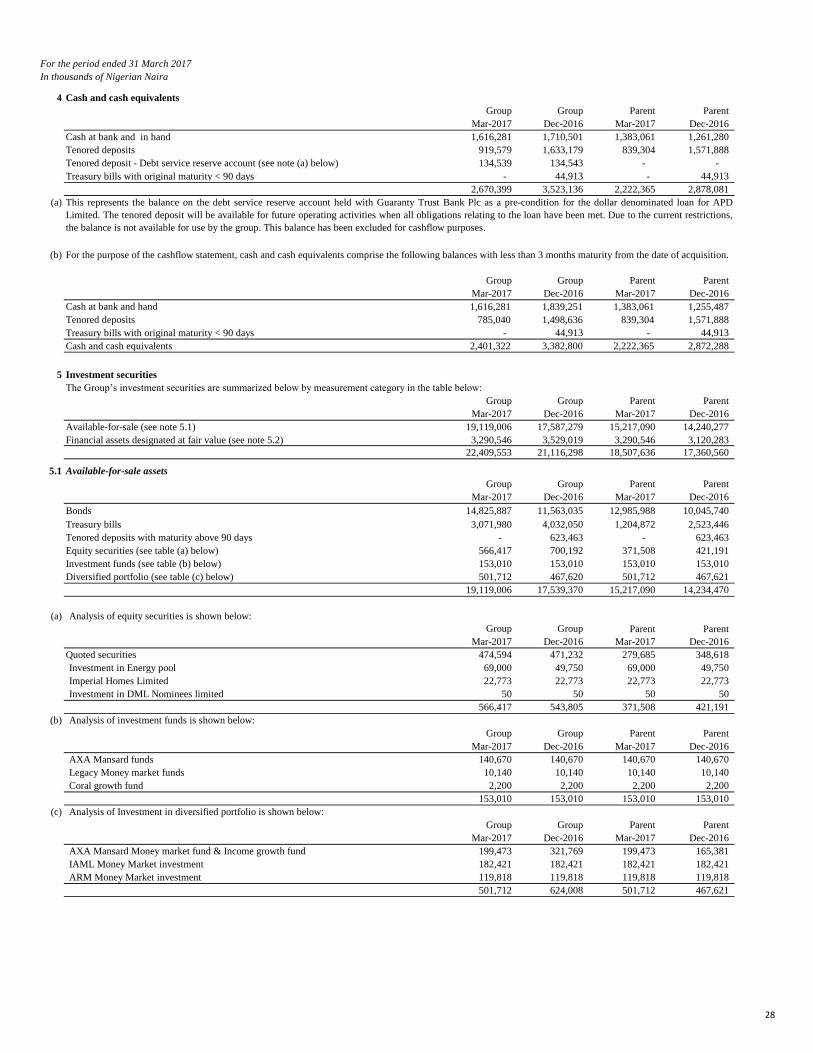
For the period ended 31 March 2017
In thousands of Nigerian Naira
4 Cash and cash equivalents
Group Group Parent Parent
Mar-2017 Dec-2016 Mar-2017 Dec-2016
Cash at bank and in hand 1,616,281 1,710,501 1,383,061 1,261,280
Tenored deposits 919,579 1,633,179 839,304 1,571,888
Tenored deposit - Debt service reserve account (see note (a) below) 134,539 134,543 - -
Treasury bills with original maturity < 90 days - 44,913 - 44,913
2,670,399 3,523,136 2,222,365 2,878,081
(a)
(b)
Group Group Parent Parent
Mar-2017 Dec-2016 Mar-2017 Dec-2016
Cash at bank and hand 1,616,281 1,839,251 1,383,061 1,255,487
Tenored deposits 785,040 1,498,636 839,304 1,571,888
Treasury bills with original maturity < 90 days - 44,913 - 44,913
Cash and cash equivalents 2,401,322 3,382,800 2,222,365 2,872,288
5 Investment securities
The Group’s investment securities are summarized below by measurement category in the table below:
Group Group Parent Parent
Mar-2017 Dec-2016 Mar-2017 Dec-2016
Available-for-sale (see note 5.1) 19,119,006 17,587,279 15,217,090 14,240,277
Financial assets designated at fair value (see note 5.2) 3,290,546 3,529,019 3,290,546 3,120,283
22,409,553 21,116,298 18,507,636 17,360,560
5.1 Available-for-sale assets
Group Group Parent Parent
Mar-2017 Dec-2016 Mar-2017 Dec-2016
Bonds 14,825,887 11,563,035 12,985,988 10,045,740
Treasury bills 3,071,980 4,032,050 1,204,872 2,523,446
Tenored deposits with maturity above 90 days - 623,463 - 623,463
Equity securities (see table (a) below) 566,417 700,192 371,508 421,191
Investment funds (see table (b) below) 153,010 153,010 153,010 153,010
Diversified portfolio (see table (c) below) 501,712 467,620 501,712 467,621
19,119,006 17,539,370 15,217,090 14,234,470
(a) Analysis of equity securities is shown below:
Group Group Parent Parent
Mar-2017 Dec-2016 Mar-2017 Dec-2016
Quoted securities 474,594 471,232 279,685 348,618
Investment in Energy pool 69,000 49,750 69,000 49,750
Imperial Homes Limited 22,773 22,773 22,773 22,773
Investment in DML Nominees limited 50 50 50 50
566,417 543,805 371,508 421,191
(b) Analysis of investment funds is shown below:
Group Group Parent Parent
Mar-2017 Dec-2016 Mar-2017 Dec-2016
AXA Mansard funds 140,670 140,670 140,670 140,670
Legacy Money market funds 10,140 10,140 10,140 10,140
Coral growth fund 2,200 2,200 2,200 2,200
153,010 153,010 153,010 153,010
(c) Analysis of Investment in diversified portfolio is shown below:
Group Group Parent Parent
Mar-2017 Dec-2016 Mar-2017 Dec-2016
AXA Mansard Money market fund & Income growth fund 199,473 321,769 199,473 165,381
IAML Money Market investment 182,421 182,421 182,421 182,421
ARM Money Market investment 119,818 119,818 119,818 119,818
501,712 624,008 501,712 467,621
This represents the balance on the debt service reserve account held with Guaranty Trust Bank Plc as a pre-condition for the dollar denominated loan for APD
Limited. The tenored deposit will be available for future operating activities when all obligations relating to the loan have been met. Due to the current restrictions,
the balance is not available for use by the group. This balance has been excluded for cashflow purposes.
For the purpose of the cashflow statement, cash and cash equivalents comprise the following balances with less than 3 months maturity from the date of acquisition.
28
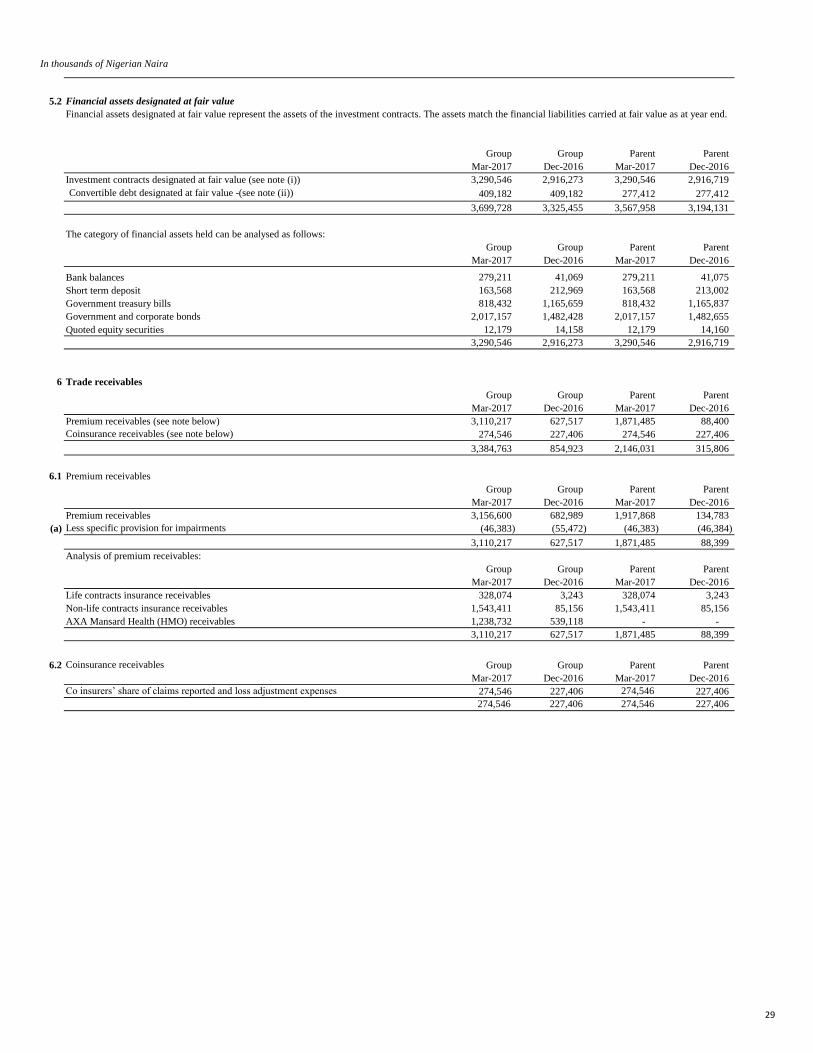
In thousands of Nigerian Naira
5.2 Financial assets designated at fair value
Group Group Parent Parent
Mar-2017 Dec-2016 Mar-2017 Dec-2016
Investment contracts designated at fair value (see note (i)) 3,290,546 2,916,273 3,290,546 2,916,719
Convertible debt designated at fair value -(see note (ii)) 409,182 409,182 277,412 277,412
3,699,728 3,325,455 3,567,958 3,194,131
Group Group Parent Parent
Mar-2017 Dec-2016 Mar-2017 Dec-2016
Bank balances 279,211 41,069 279,211 41,075
Short term deposit 163,568 212,969 163,568 213,002
Government treasury bills 818,432 1,165,659 818,432 1,165,837
Government and corporate bonds 2,017,157 1,482,428 2,017,157 1,482,655
Quoted equity securities 12,179 14,158 12,179 14,160
3,290,546 2,916,273 3,290,546 2,916,719
6 Trade receivables
Group Group Parent Parent
Mar-2017 Dec-2016 Mar-2017 Dec-2016
Premium receivables (see note below) 3,110,217 627,517 1,871,485 88,400
Coinsurance receivables (see note below) 274,546 227,406 274,546 227,406
3,384,763 854,923 2,146,031 315,806
6.1 Premium receivables
Group Group Parent Parent
Mar-2017 Dec-2016 Mar-2017 Dec-2016
Premium receivables 3,156,600 682,989 1,917,868 134,783
(a) Less specific provision for impairments (46,383) (55,472) (46,383) (46,384)
3,110,217 627,517 1,871,485 88,399
Analysis of premium receivables:
Group Group Parent Parent
Mar-2017 Dec-2016 Mar-2017 Dec-2016
Life contracts insurance receivables 328,074 3,243 328,074 3,243
Non-life contracts insurance receivables 1,543,411 85,156 1,543,411 85,156
AXA Mansard Health (HMO) receivables 1,238,732 539,118 - -
3,110,217 627,517 1,871,485 88,399
6.2 Coinsurance receivables Group Group Parent Parent
Mar-2017 Dec-2016 Mar-2017 Dec-2016
Co insurers’ share of claims reported and loss adjustment expenses 274,546 227,406 274,546 227,406
274,546 227,406 274,546 227,406
The category of financial assets held can be analysed as follows:
Financial assets designated at fair value represent the assets of the investment contracts. The assets match the financial liabilities carried at fair value as at year end.
29
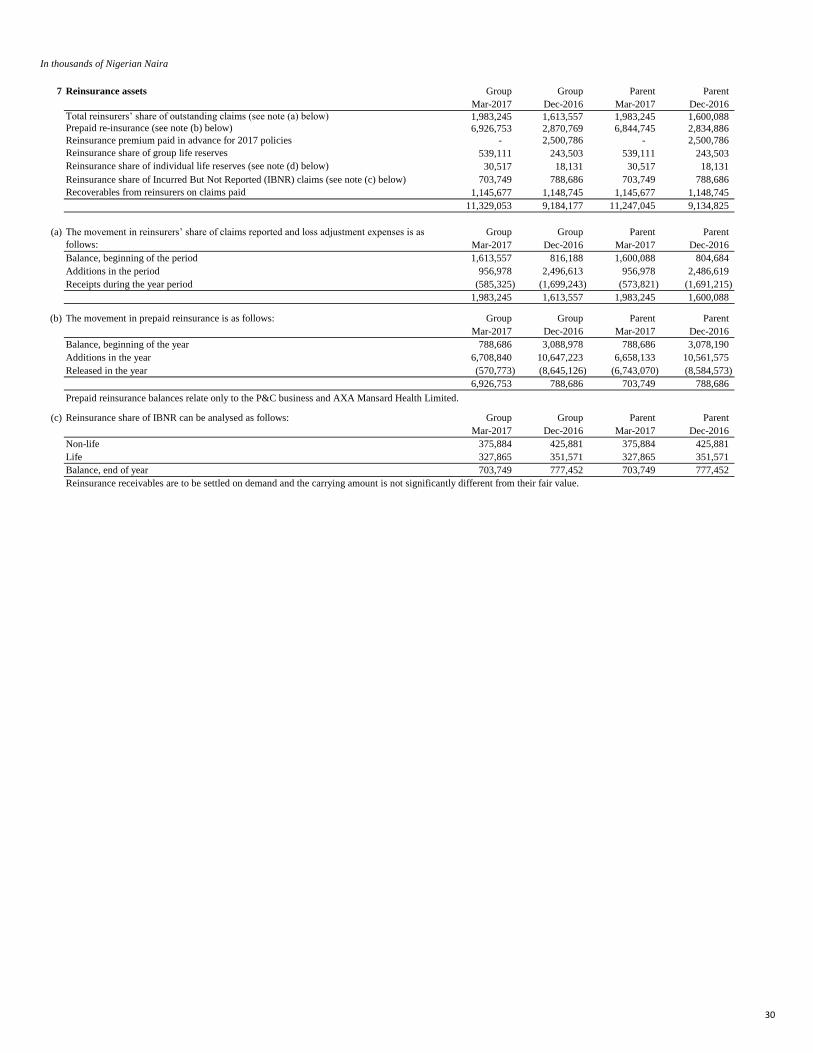
In thousands of Nigerian Naira
7 Reinsurance assets Group Group Parent Parent
Mar-2017 Dec-2016 Mar-2017 Dec-2016
Total reinsurers’ share of outstanding claims (see note (a) below) 1,983,245 1,613,557 1,983,245 1,600,088 Prepaid re-insurance (see note (b) below) 6,926,753 2,870,769 6,844,745 2,834,886
Reinsurance premium paid in advance for 2017 policies - 2,500,786 - 2,500,786
Reinsurance share of group life reserves 539,111 243,503 539,111 243,503
Reinsurance share of individual life reserves (see note (d) below) 30,517 18,131 30,517 18,131
Reinsurance share of Incurred But Not Reported (IBNR) claims (see note (c) below) 703,749 788,686 703,749 788,686
Recoverables from reinsurers on claims paid 1,145,677 1,148,745 1,145,677 1,148,745
11,329,053 9,184,177 11,247,045 9,134,825
(a) Group Group Parent Parent
Mar-2017 Dec-2016 Mar-2017 Dec-2016
Balance, beginning of the period 1,613,557 816,188 1,600,088 804,684
Additions in the period 956,978 2,496,613 956,978 2,486,619
Receipts during the year period (585,325) (1,699,243) (573,821) (1,691,215)
1,983,245 1,613,557 1,983,245 1,600,088
(b) The movement in prepaid reinsurance is as follows: Group Group Parent Parent
Mar-2017 Dec-2016 Mar-2017 Dec-2016
Balance, beginning of the year 788,686 3,088,978 788,686 3,078,190
Additions in the year 6,708,840 10,647,223 6,658,133 10,561,575
Released in the year (570,773) (8,645,126) (6,743,070) (8,584,573)
6,926,753 788,686 703,749 788,686
Prepaid reinsurance balances relate only to the P&C business and AXA Mansard Health Limited.
(c) Reinsurance share of IBNR can be analysed as follows: Group Group Parent Parent
Mar-2017 Dec-2016 Mar-2017 Dec-2016
Non-life 375,884 425,881 375,884 425,881
Life 327,865 351,571 327,865 351,571
Balance, end of year 703,749 777,452 703,749 777,452
Reinsurance receivables are to be settled on demand and the carrying amount is not significantly different from their fair value.
The movement in reinsurers’ share of claims reported and loss adjustment expenses is as
follows:
30
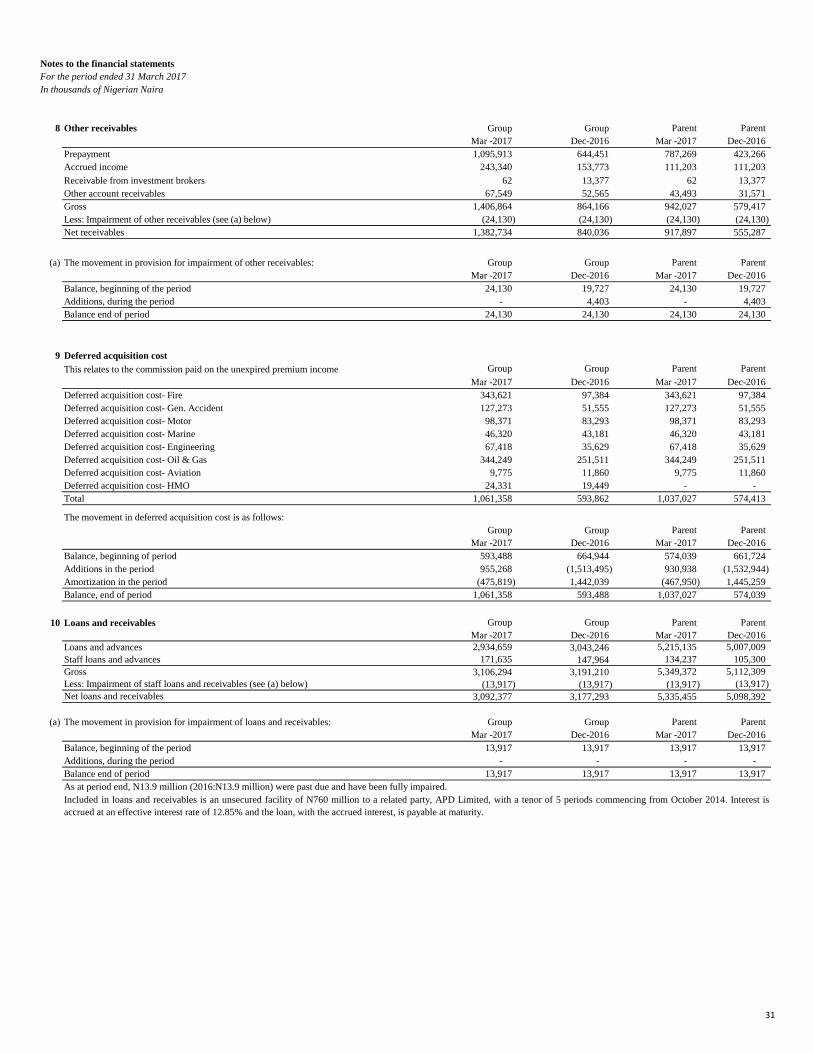
Notes to the financial statements
For the period ended 31 March 2017
In thousands of Nigerian Naira
8 Other receivables Group Group Parent Parent
Mar -2017 Dec-2016 Mar -2017 Dec-2016
Prepayment 1,095,913 644,451 787,269 423,266
Accrued income 243,340 153,773 111,203 111,203
Receivable from investment brokers 62 13,377 62 13,377
Other account receivables 67,549 52,565 43,493 31,571
Gross 1,406,864 864,166 942,027 579,417
Less: Impairment of other receivables (see (a) below) (24,130) (24,130) (24,130) (24,130)
Net receivables 1,382,734 840,036 917,897 555,287
(a) The movement in provision for impairment of other receivables: Group Group Parent Parent
Mar -2017 Dec-2016 Mar -2017 Dec-2016
Balance, beginning of the period 24,130 19,727 24,130 19,727
Additions, during the period - 4,403 - 4,403
Balance end of period 24,130 24,130 24,130 24,130
9 Deferred acquisition cost
This relates to the commission paid on the unexpired premium income Group Group Parent Parent
Mar -2017 Dec-2016 Mar -2017 Dec-2016
Deferred acquisition cost- Fire 343,621 97,384 343,621 97,384
Deferred acquisition cost- Gen. Accident 127,273 51,555 127,273 51,555
Deferred acquisition cost- Motor 98,371 83,293 98,371 83,293
Deferred acquisition cost- Marine 46,320 43,181 46,320 43,181
Deferred acquisition cost- Engineering 67,418 35,629 67,418 35,629
Deferred acquisition cost- Oil & Gas 344,249 251,511 344,249 251,511
Deferred acquisition cost- Aviation 9,775 11,860 9,775 11,860
Deferred acquisition cost- HMO 24,331 19,449 - -
Total 1,061,358 593,862 1,037,027 574,413
The movement in deferred acquisition cost is as follows:
Group Group Parent Parent
Mar -2017 Dec-2016 Mar -2017 Dec-2016
Balance, beginning of period 593,488 664,944 574,039 661,724
Additions in the period 955,268 (1,513,495) 930,938 (1,532,944)
Amortization in the period (475,819) 1,442,039 (467,950) 1,445,259
Balance, end of period 1,061,358 593,488 1,037,027 574,039
10 Loans and receivables Group Group Parent Parent
Mar -2017 Dec-2016 Mar -2017 Dec-2016
Loans and advances 2,934,659 3,043,246 5,215,135 5,007,009
Staff loans and advances 171,635 147,964 134,237 105,300
Gross 3,106,294 3,191,210 5,349,372 5,112,309
Less: Impairment of staff loans and receivables (see (a) below) (13,917) (13,917) (13,917) (13,917)
Net loans and receivables 3,092,377 3,177,293 5,335,455 5,098,392
(a) The movement in provision for impairment of loans and receivables: Group Group Parent Parent
Mar -2017 Dec-2016 Mar -2017 Dec-2016
Balance, beginning of the period 13,917 13,917 13,917 13,917
Additions, during the period - - - -
Balance end of period 13,917 13,917 13,917 13,917
Included in loans and receivables is an unsecured facility of N760 million to a related party, APD Limited, with a tenor of 5 periods commencing from October 2014. Interest is
accrued at an effective interest rate of 12.85% and the loan, with the accrued interest, is payable at maturity.
As at period end, N13.9 million (2016:N13.9 million) were past due and have been fully impaired.
31
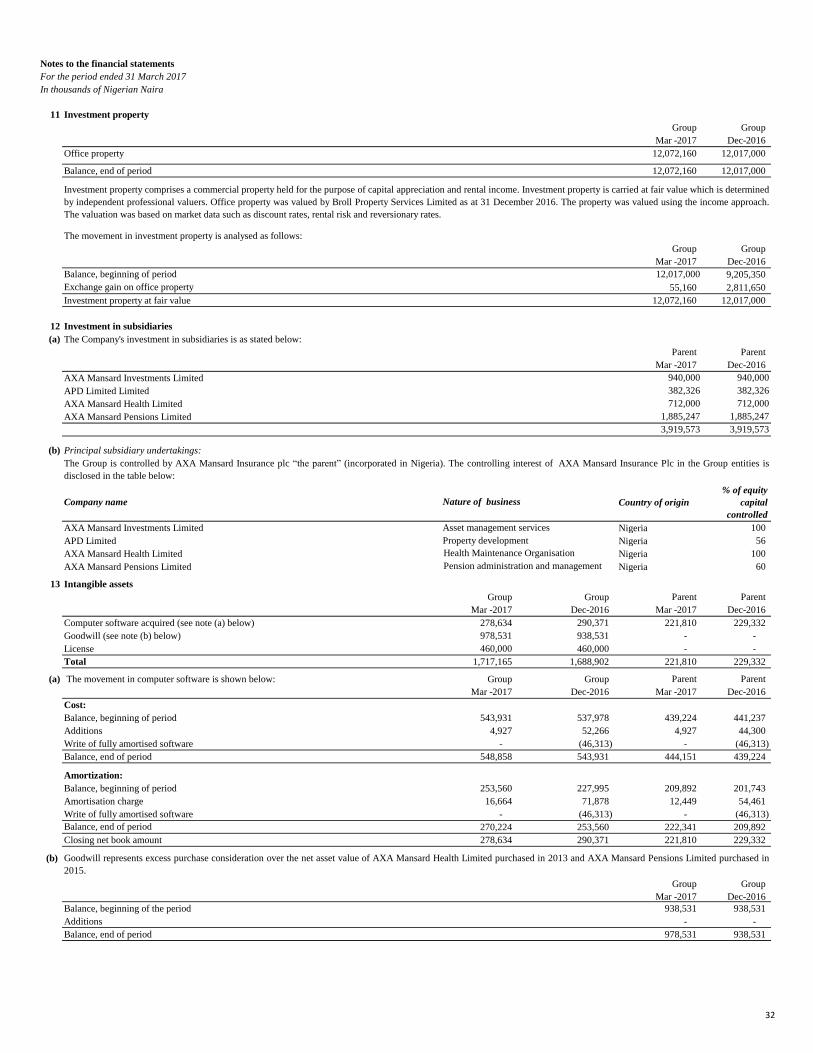
Notes to the financial statements
For the period ended 31 March 2017
In thousands of Nigerian Naira
11 Investment property
Group Group
Mar -2017 Dec-2016
Office property 12,072,160 12,017,000
Balance, end of period 12,072,160 12,017,000
The movement in investment property is analysed as follows:
Group Group
Mar -2017 Dec-2016
Balance, beginning of period 12,017,000 9,205,350
Exchange gain on office property 55,160 2,811,650
Investment property at fair value 12,072,160 12,017,000
12 Investment in subsidiaries
(a) The Company's investment in subsidiaries is as stated below:
Parent Parent
Mar -2017 Dec-2016
AXA Mansard Investments Limited 940,000 940,000
APD Limited Limited 382,326 382,326
AXA Mansard Health Limited 712,000 712,000
AXA Mansard Pensions Limited 1,885,247 1,885,247
3,919,573 3,919,573
(b) Principal subsidiary undertakings:
Company name Country of origin
% of equity
capital
controlled
AXA Mansard Investments Limited Nigeria 100
APD Limited Nigeria 56
AXA Mansard Health Limited Nigeria 100
AXA Mansard Pensions Limited Nigeria 60
13 Intangible assets
Group Group Parent Parent
Mar -2017 Dec-2016 Mar -2017 Dec-2016
Computer software acquired (see note (a) below) 278,634 290,371 221,810 229,332
Goodwill (see note (b) below) 978,531 938,531 - -
License 460,000 460,000 - -
Total 1,717,165 1,688,902 221,810 229,332
(a) The movement in computer software is shown below: Group Group Parent Parent
Mar -2017 Dec-2016 Mar -2017 Dec-2016
Cost:
Balance, beginning of period 543,931 537,978 439,224 441,237
Additions 4,927 52,266 4,927 44,300
Write of fully amortised software - (46,313) - (46,313)
Balance, end of period 548,858 543,931 444,151 439,224
Amortization:
Balance, beginning of period 253,560 227,995 209,892 201,743
Amortisation charge 16,664 71,878 12,449 54,461
Write of fully amortised software - (46,313) - (46,313)
Balance, end of period 270,224 253,560 222,341 209,892
Closing net book amount 278,634 290,371 221,810 229,332
(b)
Group Group
Mar -2017 Dec-2016
Balance, beginning of the period 938,531 938,531
Additions - -
Balance, end of period 978,531 938,531
Health Maintenance Organisation
Pension administration and management
Investment property comprises a commercial property held for the purpose of capital appreciation and rental income. Investment property is carried at fair value which is determined
by independent professional valuers. Office property was valued by Broll Property Services Limited as at 31 December 2016. The property was valued using the income approach.
The valuation was based on market data such as discount rates, rental risk and reversionary rates.
Property development
The Group is controlled by AXA Mansard Insurance plc “the parent” (incorporated in Nigeria). The controlling interest of AXA Mansard Insurance Plc in the Group entities is
disclosed in the table below:
Nature of business
Asset management services
Goodwill represents excess purchase consideration over the net asset value of AXA Mansard Health Limited purchased in 2013 and AXA Mansard Pensions Limited purchased in
2015.
32
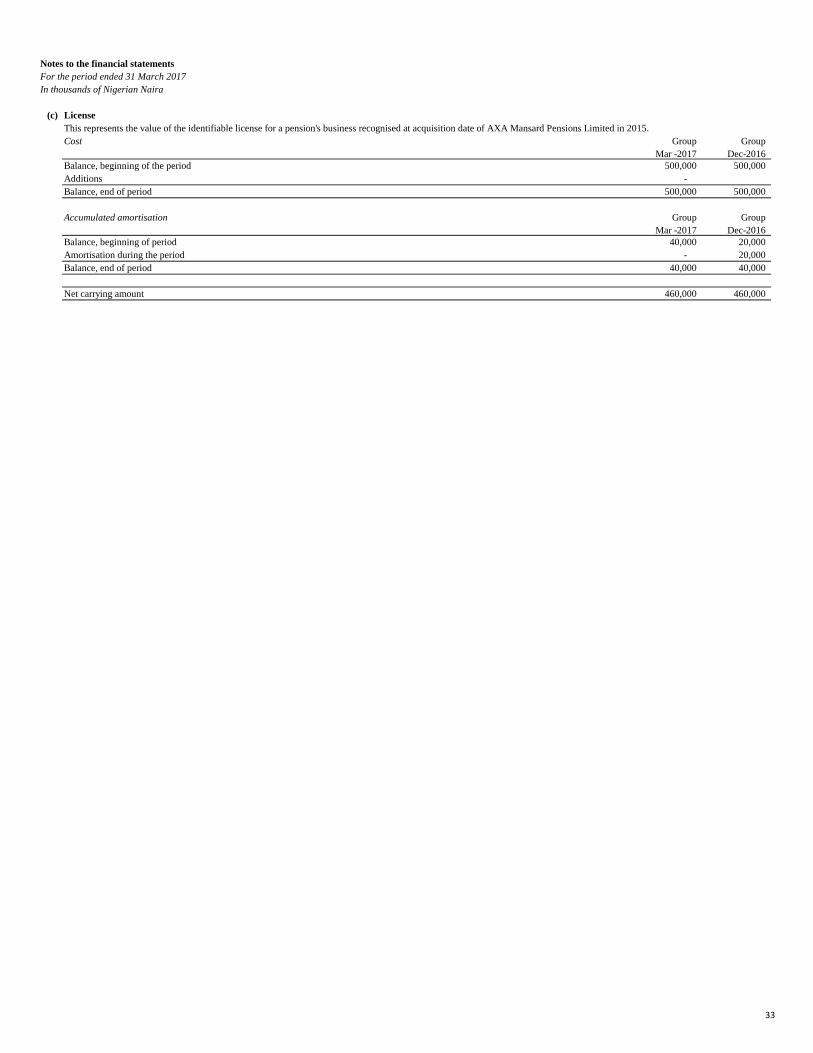
Notes to the financial statements
For the period ended 31 March 2017
In thousands of Nigerian Naira
(c) License
This represents the value of the identifiable license for a pension's business recognised at acquisition date of AXA Mansard Pensions Limited in 2015.
Cost Group Group
Mar -2017 Dec-2016
Balance, beginning of the period 500,000 500,000
Additions -
Balance, end of period 500,000 500,000
Accumulated amortisation Group Group
Mar -2017 Dec-2016
Balance, beginning of period 40,000 20,000
Amortisation during the period - 20,000
Balance, end of period 40,000 40,000
Net carrying amount 460,000 460,000
33
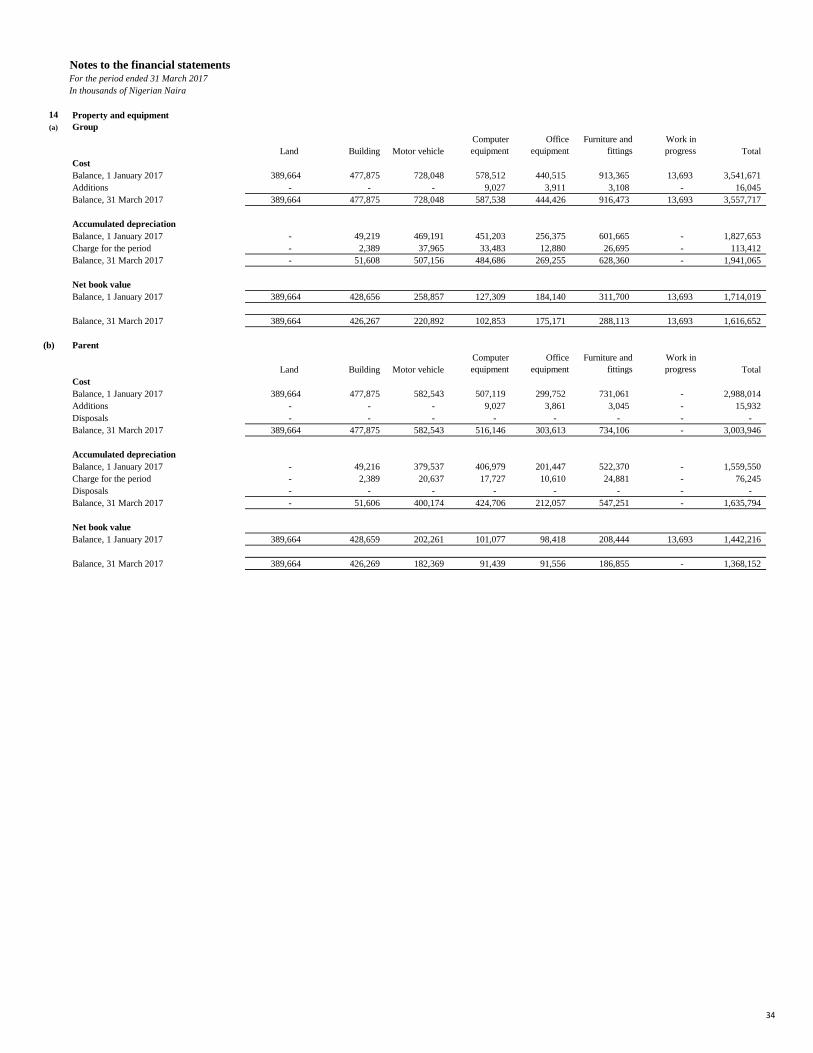
Notes to the financial statementsFor the period ended 31 March 2017
In thousands of Nigerian Naira
14 Property and equipment
(a) Group
Land Building Motor vehicle
Computer
equipment
Office
equipment
Furniture and
fittings
Work in
progress Total
Cost
Balance, 1 January 2017 389,664 477,875 728,048 578,512 440,515 913,365 13,693 3,541,671
Additions - - - 9,027 3,911 3,108 - 16,045
Balance, 31 March 2017 389,664 477,875 728,048 587,538 444,426 916,473 13,693 3,557,717
Accumulated depreciation
Balance, 1 January 2017 - 49,219 469,191 451,203 256,375 601,665 - 1,827,653
Charge for the period - 2,389 37,965 33,483 12,880 26,695 - 113,412
Balance, 31 March 2017 - 51,608 507,156 484,686 269,255 628,360 - 1,941,065
Net book value
Balance, 1 January 2017 389,664 428,656 258,857 127,309 184,140 311,700 13,693 1,714,019
Balance, 31 March 2017 389,664 426,267 220,892 102,853 175,171 288,113 13,693 1,616,652
(b) Parent
Land Building Motor vehicle
Computer
equipment
Office
equipment
Furniture and
fittings
Work in
progress Total
Cost
Balance, 1 January 2017 389,664 477,875 582,543 507,119 299,752 731,061 - 2,988,014
Additions - - - 9,027 3,861 3,045 - 15,932
Disposals - - - - - - - -
Balance, 31 March 2017 389,664 477,875 582,543 516,146 303,613 734,106 - 3,003,946
Accumulated depreciation
Balance, 1 January 2017 - 49,216 379,537 406,979 201,447 522,370 - 1,559,550
Charge for the period - 2,389 20,637 17,727 10,610 24,881 - 76,245
Disposals - - - - - - - -
Balance, 31 March 2017 - 51,606 400,174 424,706 212,057 547,251 - 1,635,794
Net book value
Balance, 1 January 2017 389,664 428,659 202,261 101,077 98,418 208,444 13,693 1,442,216
Balance, 31 March 2017 389,664 426,269 182,369 91,439 91,556 186,855 - 1,368,152
34
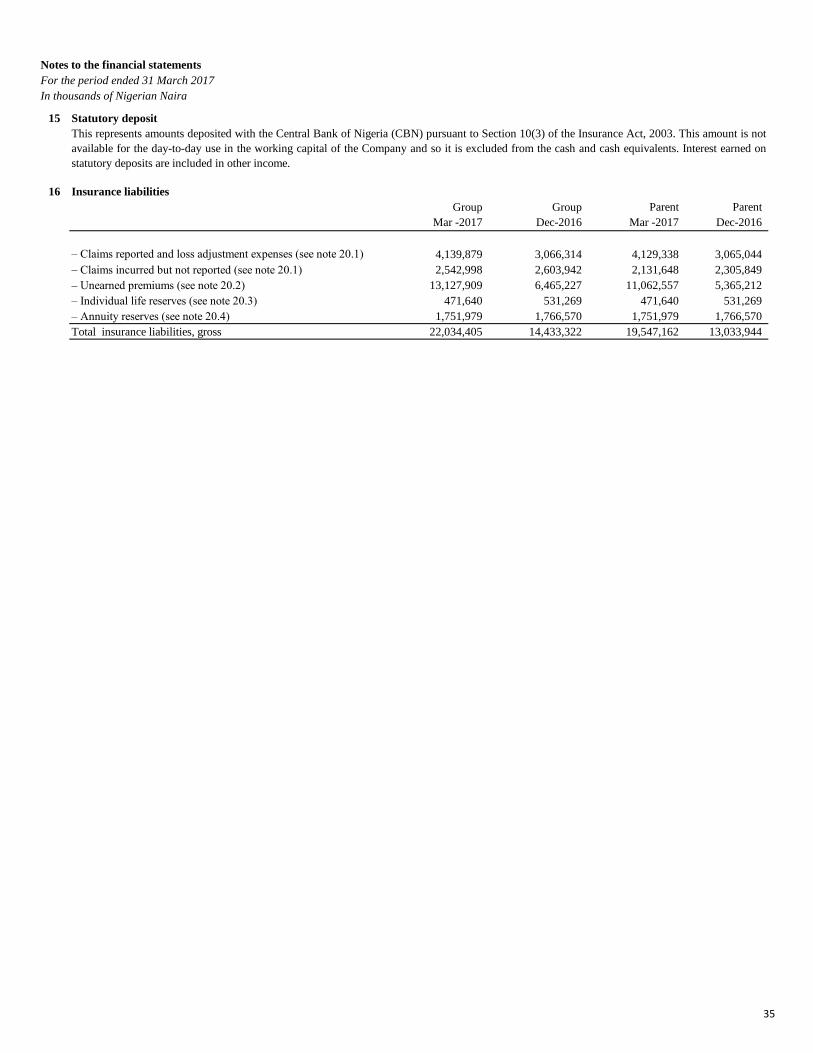
Notes to the financial statements
For the period ended 31 March 2017
In thousands of Nigerian Naira
15 Statutory deposit
16 Insurance liabilities
Group Group Parent Parent
Mar -2017 Dec-2016 Mar -2017 Dec-2016
– Claims reported and loss adjustment expenses (see note 20.1) 4,139,879 3,066,314 4,129,338 3,065,044
– Claims incurred but not reported (see note 20.1) 2,542,998 2,603,942 2,131,648 2,305,849
– Unearned premiums (see note 20.2) 13,127,909 6,465,227 11,062,557 5,365,212
– Individual life reserves (see note 20.3) 471,640 531,269 471,640 531,269
– Annuity reserves (see note 20.4) 1,751,979 1,766,570 1,751,979 1,766,570
Total insurance liabilities, gross 22,034,405 14,433,322 19,547,162 13,033,944
This represents amounts deposited with the Central Bank of Nigeria (CBN) pursuant to Section 10(3) of the Insurance Act, 2003. This amount is not
available for the day-to-day use in the working capital of the Company and so it is excluded from the cash and cash equivalents. Interest earned on
statutory deposits are included in other income.
35
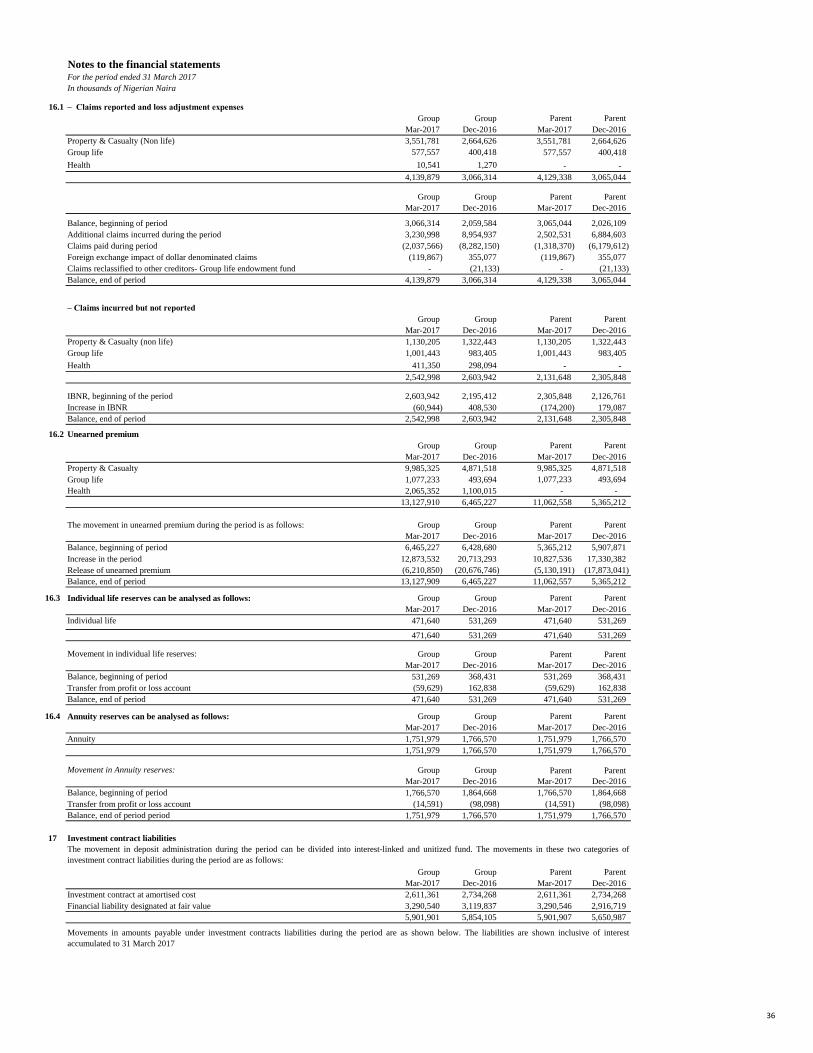
Notes to the financial statementsFor the period ended 31 March 2017
In thousands of Nigerian Naira
16.1 – Claims reported and loss adjustment expenses
Group Group Parent Parent
Mar-2017 Dec-2016 Mar-2017 Dec-2016
Property & Casualty (Non life) 3,551,781 2,664,626 3,551,781 2,664,626
Group life 577,557 400,418 577,557 400,418
Health 10,541 1,270 - -
4,139,879 3,066,314 4,129,338 3,065,044
Group Group Parent Parent
Mar-2017 Dec-2016 Mar-2017 Dec-2016
Balance, beginning of period 3,066,314 2,059,584 3,065,044 2,026,109
Additional claims incurred during the period 3,230,998 8,954,937 2,502,531 6,884,603
Claims paid during period (2,037,566) (8,282,150) (1,318,370) (6,179,612)
Foreign exchange impact of dollar denominated claims (119,867) 355,077 (119,867) 355,077
Claims reclassified to other creditors- Group life endowment fund - (21,133) - (21,133)
Balance, end of period 4,139,879 3,066,314 4,129,338 3,065,044
– Claims incurred but not reported
Group Group Parent Parent
Mar-2017 Dec-2016 Mar-2017 Dec-2016
Property & Casualty (non life) 1,130,205 1,322,443 1,130,205 1,322,443
Group life 1,001,443 983,405 1,001,443 983,405
Health 411,350 298,094 - -
2,542,998 2,603,942 2,131,648 2,305,848
IBNR, beginning of the period 2,603,942 2,195,412 2,305,848 2,126,761
Increase in IBNR (60,944) 408,530 (174,200) 179,087
Balance, end of period 2,542,998 2,603,942 2,131,648 2,305,848
16.2 Unearned premium
Group Group Parent Parent
Mar-2017 Dec-2016 Mar-2017 Dec-2016
Property & Casualty 9,985,325 4,871,518 9,985,325 4,871,518
Group life 1,077,233 493,694 1,077,233 493,694
Health 2,065,352 1,100,015 - -
13,127,910 6,465,227 11,062,558 5,365,212
The movement in unearned premium during the period is as follows: Group Group Parent Parent
Mar-2017 Dec-2016 Mar-2017 Dec-2016
Balance, beginning of period 6,465,227 6,428,680 5,365,212 5,907,871
Increase in the period 12,873,532 20,713,293 10,827,536 17,330,382
Release of unearned premium (6,210,850) (20,676,746) (5,130,191) (17,873,041)
Balance, end of period 13,127,909 6,465,227 11,062,557 5,365,212
16.3 Individual life reserves can be analysed as follows: Group Group Parent Parent
Mar-2017 Dec-2016 Mar-2017 Dec-2016
Individual life 471,640 531,269 471,640 531,269
471,640 531,269 471,640 531,269
Movement in individual life reserves: Group Group Parent Parent
Mar-2017 Dec-2016 Mar-2017 Dec-2016
Balance, beginning of period 531,269 368,431 531,269 368,431
Transfer from profit or loss account (59,629) 162,838 (59,629) 162,838
Balance, end of period 471,640 531,269 471,640 531,269
16.4 Annuity reserves can be analysed as follows: Group Group Parent Parent
Mar-2017 Dec-2016 Mar-2017 Dec-2016
Annuity 1,751,979 1,766,570 1,751,979 1,766,570
1,751,979 1,766,570 1,751,979 1,766,570
Movement in Annuity reserves: Group Group Parent Parent
Mar-2017 Dec-2016 Mar-2017 Dec-2016
Balance, beginning of period 1,766,570 1,864,668 1,766,570 1,864,668
Transfer from profit or loss account (14,591) (98,098) (14,591) (98,098)
Balance, end of period period 1,751,979 1,766,570 1,751,979 1,766,570
17 Investment contract liabilities
Group Group Parent Parent
Mar-2017 Dec-2016 Mar-2017 Dec-2016
Investment contract at amortised cost 2,611,361 2,734,268 2,611,361 2,734,268
Financial liability designated at fair value 3,290,540 3,119,837 3,290,546 2,916,719
5,901,901 5,854,105 5,901,907 5,650,987
The movement in deposit administration during the period can be divided into interest-linked and unitized fund. The movements in these two categories of
investment contract liabilities during the period are as follows:
Movements in amounts payable under investment contracts liabilities during the period are as shown below. The liabilities are shown inclusive of interest
accumulated to 31 March 2017
36
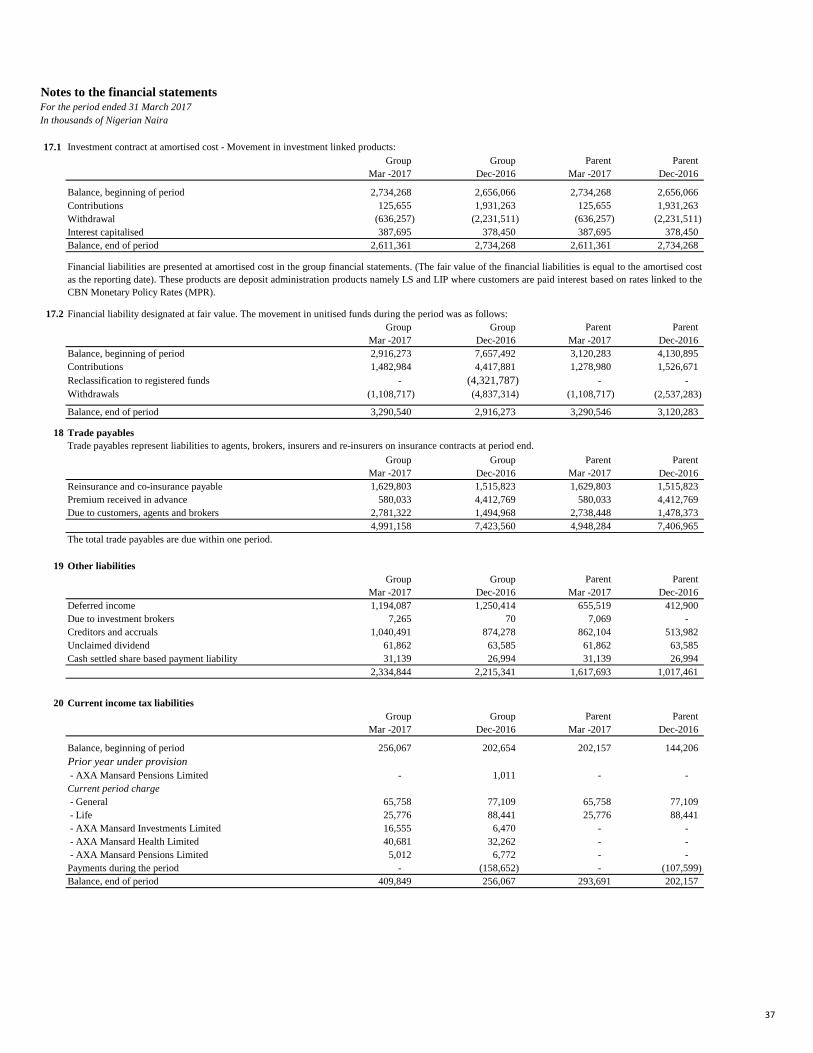
Notes to the financial statementsFor the period ended 31 March 2017
In thousands of Nigerian Naira
17.1 Investment contract at amortised cost - Movement in investment linked products:
Group Group Parent Parent
Mar -2017 Dec-2016 Mar -2017 Dec-2016
Balance, beginning of period 2,734,268 2,656,066 2,734,268 2,656,066
Contributions 125,655 1,931,263 125,655 1,931,263
Withdrawal (636,257) (2,231,511) (636,257) (2,231,511)
Interest capitalised 387,695 378,450 387,695 378,450
Balance, end of period 2,611,361 2,734,268 2,611,361 2,734,268
17.2 Financial liability designated at fair value. The movement in unitised funds during the period was as follows:
Group Group Parent Parent
Mar -2017 Dec-2016 Mar -2017 Dec-2016
Balance, beginning of period 2,916,273 7,657,492 3,120,283 4,130,895
Contributions 1,482,984 4,417,881 1,278,980 1,526,671
Reclassification to registered funds - (4,321,787) - -
Withdrawals (1,108,717) (4,837,314) (1,108,717) (2,537,283)
Balance, end of period 3,290,540 2,916,273 3,290,546 3,120,283
18 Trade payables
Group Group Parent Parent
Mar -2017 Dec-2016 Mar -2017 Dec-2016
Reinsurance and co-insurance payable 1,629,803 1,515,823 1,629,803 1,515,823
Premium received in advance 580,033 4,412,769 580,033 4,412,769
Due to customers, agents and brokers 2,781,322 1,494,968 2,738,448 1,478,373
4,991,158 7,423,560 4,948,284 7,406,965
The total trade payables are due within one period.
19 Other liabilities
Group Group Parent Parent
Mar -2017 Dec-2016 Mar -2017 Dec-2016
Deferred income 1,194,087 1,250,414 655,519 412,900
Due to investment brokers 7,265 70 7,069 -
Creditors and accruals 1,040,491 874,278 862,104 513,982
Unclaimed dividend 61,862 63,585 61,862 63,585
Cash settled share based payment liability 31,139 26,994 31,139 26,994
2,334,844 2,215,341 1,617,693 1,017,461
20 Current income tax liabilities
Group Group Parent Parent
Mar -2017 Dec-2016 Mar -2017 Dec-2016
Balance, beginning of period 256,067 202,654 202,157 144,206
Prior year under provision
- AXA Mansard Pensions Limited - 1,011 - -
Current period charge
- General 65,758 77,109 65,758 77,109
- Life 25,776 88,441 25,776 88,441
- AXA Mansard Investments Limited 16,555 6,470 - -
- AXA Mansard Health Limited 40,681 32,262 - -
- AXA Mansard Pensions Limited 5,012 6,772 - -
Payments during the period - (158,652) - (107,599)
Balance, end of period 409,849 256,067 293,691 202,157
Financial liabilities are presented at amortised cost in the group financial statements. (The fair value of the financial liabilities is equal to the amortised cost
as the reporting date). These products are deposit administration products namely LS and LIP where customers are paid interest based on rates linked to the
CBN Monetary Policy Rates (MPR).
Trade payables represent liabilities to agents, brokers, insurers and re-insurers on insurance contracts at period end.
37
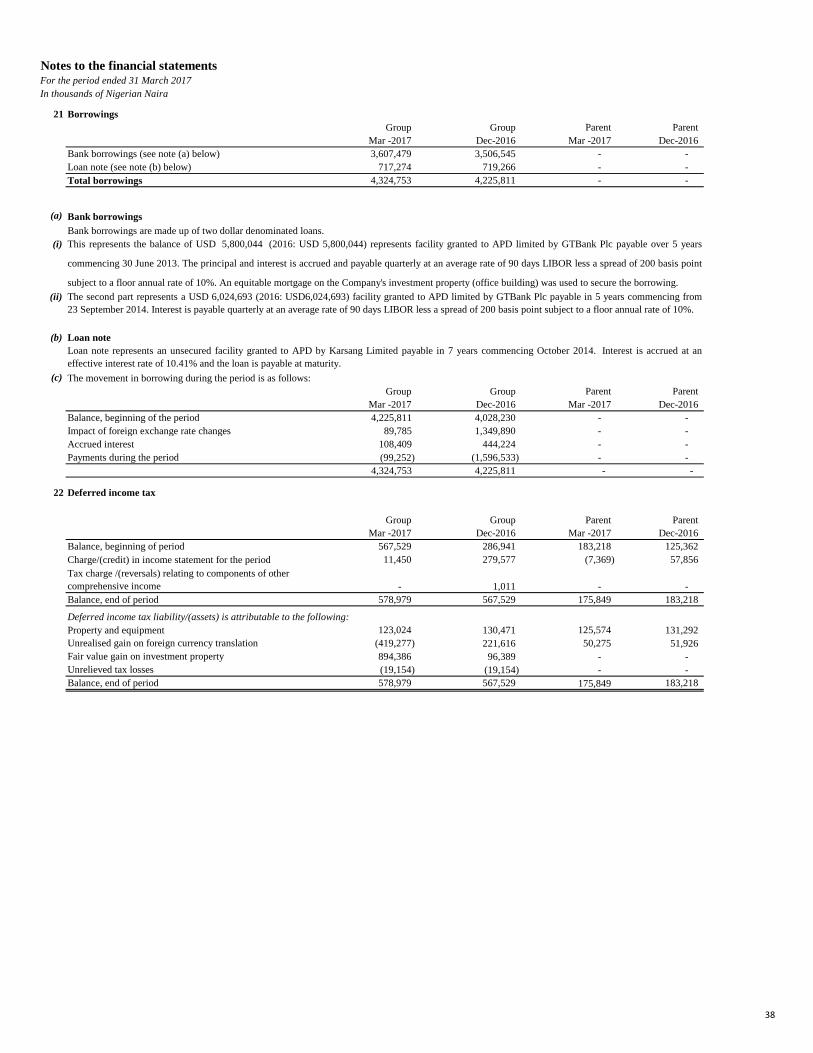
Notes to the financial statementsFor the period ended 31 March 2017
In thousands of Nigerian Naira
21 Borrowings
Group Group Parent Parent
Mar -2017 Dec-2016 Mar -2017 Dec-2016
Bank borrowings (see note (a) below) 3,607,479 3,506,545 - -
Loan note (see note (b) below) 717,274 719,266 - -
Total borrowings 4,324,753 4,225,811 - -
(a) Bank borrowings
(i)
(ii)
(b) Loan note
(c)
Group Group Parent Parent
Mar -2017 Dec-2016 Mar -2017 Dec-2016
Balance, beginning of the period 4,225,811 4,028,230 - -
Impact of foreign exchange rate changes 89,785 1,349,890 - -
Accrued interest 108,409 444,224 - -
Payments during the period (99,252) (1,596,533) - -
4,324,753 4,225,811 - -
22 Deferred income tax
Group Group Parent Parent
Mar -2017 Dec-2016 Mar -2017 Dec-2016
Balance, beginning of period 567,529 286,941 183,218 125,362
Charge/(credit) in income statement for the period 11,450 279,577 (7,369) 57,856
Tax charge /(reversals) relating to components of other
comprehensive income - 1,011 - -
Balance, end of period 578,979 567,529 175,849 183,218
Deferred income tax liability/(assets) is attributable to the following:
Property and equipment 123,024 130,471 125,574 131,292
Unrealised gain on foreign currency translation (419,277) 221,616 50,275 51,926
Fair value gain on investment property 894,386 96,389 - -
Unrelieved tax losses (19,154) (19,154) - -
Balance, end of period 578,979 567,529 175,849 183,218
Loan note represents an unsecured facility granted to APD by Karsang Limited payable in 7 years commencing October 2014. Interest is accrued at an
effective interest rate of 10.41% and the loan is payable at maturity.
Bank borrowings are made up of two dollar denominated loans.
The movement in borrowing during the period is as follows:
This represents the balance of USD 5,800,044 (2016: USD 5,800,044) represents facility granted to APD limited by GTBank Plc payable over 5 years
commencing 30 June 2013. The principal and interest is accrued and payable quarterly at an average rate of 90 days LIBOR less a spread of 200 basis point
subject to a floor annual rate of 10%. An equitable mortgage on the Company's investment property (office building) was used to secure the borrowing.
The second part represents a USD 6,024,693 (2016: USD6,024,693) facility granted to APD limited by GTBank Plc payable in 5 years commencing from
23 September 2014. Interest is payable quarterly at an average rate of 90 days LIBOR less a spread of 200 basis point subject to a floor annual rate of 10%.
38
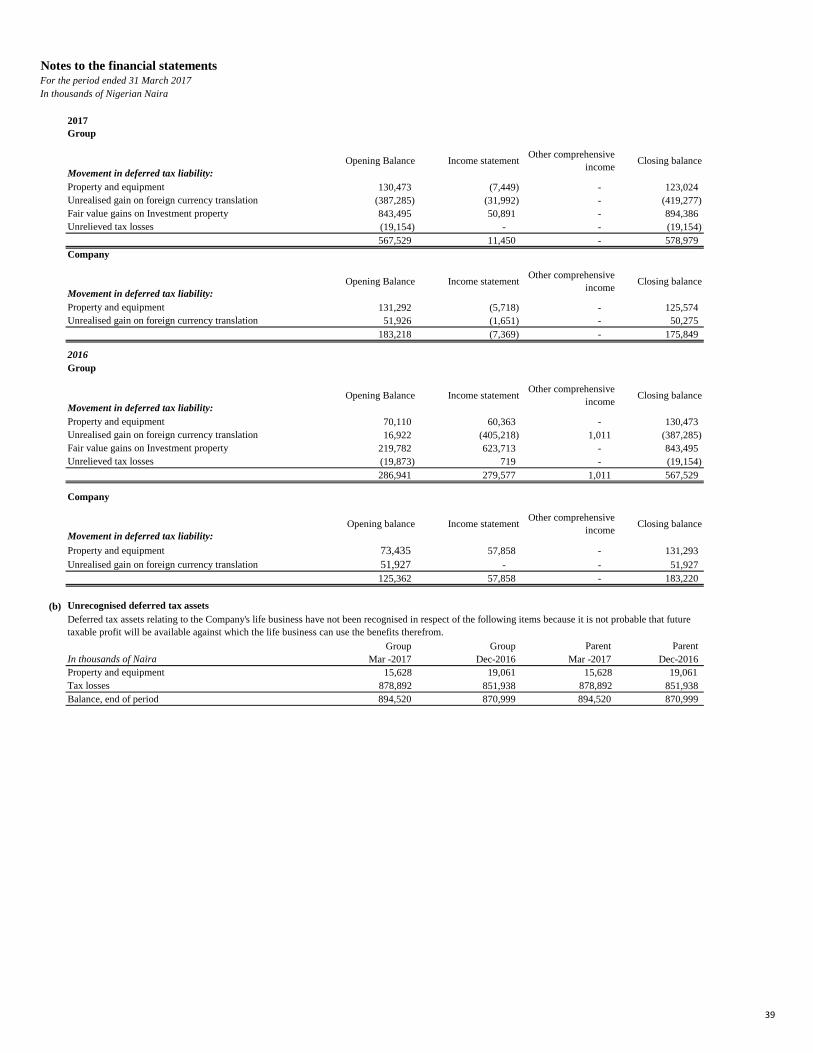
Notes to the financial statementsFor the period ended 31 March 2017
In thousands of Nigerian Naira
2017
Group
Movement in deferred tax liability:
Opening Balance Income statement Other comprehensive
income Closing balance
Property and equipment 130,473 (7,449) - 123,024
Unrealised gain on foreign currency translation (387,285) (31,992) - (419,277)
Fair value gains on Investment property 843,495 50,891 - 894,386
Unrelieved tax losses (19,154) - - (19,154)
567,529 11,450 - 578,979
Company
Movement in deferred tax liability:
Opening Balance Income statement Other comprehensive
income Closing balance
Property and equipment 131,292 (5,718) - 125,574
Unrealised gain on foreign currency translation 51,926 (1,651) - 50,275
183,218 (7,369) - 175,849
2016
Group
Movement in deferred tax liability:
Opening Balance Income statement Other comprehensive
income Closing balance
Property and equipment 70,110 60,363 - 130,473
Unrealised gain on foreign currency translation 16,922 (405,218) 1,011 (387,285)
Fair value gains on Investment property 219,782 623,713 - 843,495
Unrelieved tax losses (19,873) 719 - (19,154)
286,941 279,577 1,011 567,529
Company
Movement in deferred tax liability:
Opening balance Income statement Other comprehensive
income Closing balance
Property and equipment 73,435 57,858 - 131,293
Unrealised gain on foreign currency translation 51,927 - - 51,927
125,362 57,858 - 183,220
(b) Unrecognised deferred tax assets
Group Group Parent Parent
In thousands of Naira Mar -2017 Dec-2016 Mar -2017 Dec-2016
Property and equipment 15,628 19,061 15,628 19,061
Tax losses 878,892 851,938 878,892 851,938
Balance, end of period 894,520 870,999 894,520 870,999
Deferred tax assets relating to the Company's life business have not been recognised in respect of the following items because it is not probable that future
taxable profit will be available against which the life business can use the benefits therefrom.
39
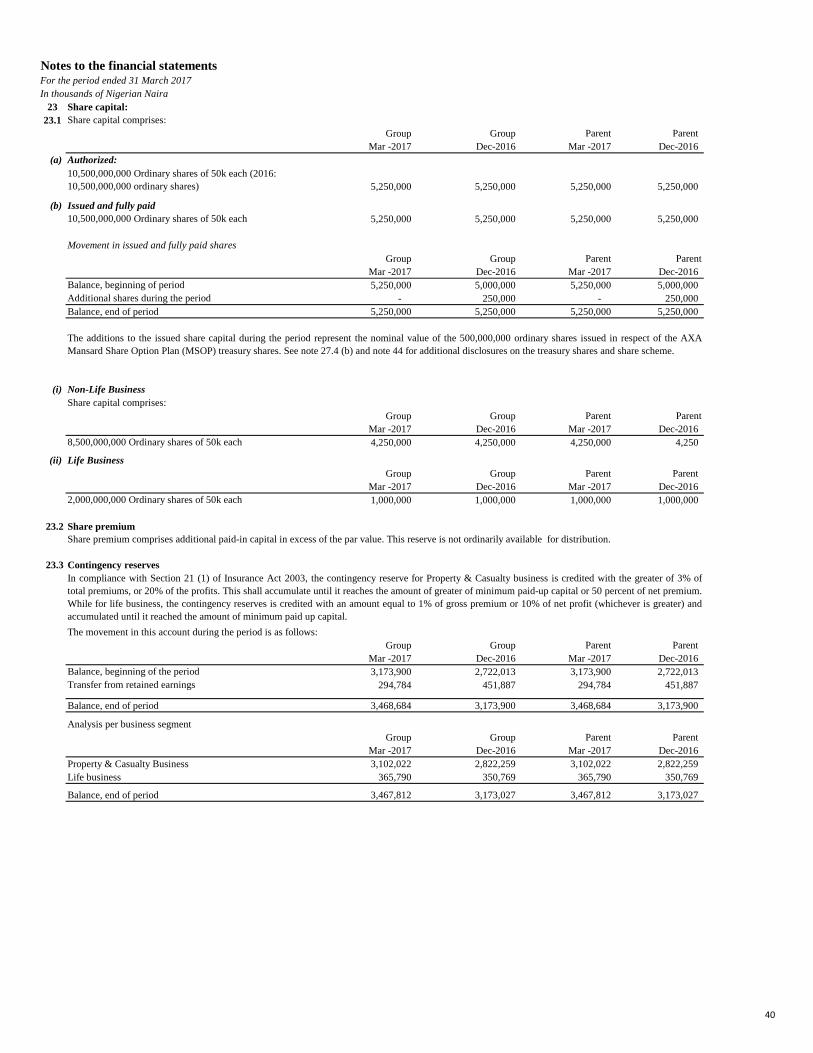
Notes to the financial statementsFor the period ended 31 March 2017
In thousands of Nigerian Naira
23 Share capital:
23.1 Share capital comprises:
Group Group Parent Parent
Mar -2017 Dec-2016 Mar -2017 Dec-2016
(a) Authorized:
10,500,000,000 Ordinary shares of 50k each (2016:
10,500,000,000 ordinary shares) 5,250,000 5,250,000 5,250,000 5,250,000
(b) Issued and fully paid
10,500,000,000 Ordinary shares of 50k each 5,250,000 5,250,000 5,250,000 5,250,000
Movement in issued and fully paid shares
Group Group Parent Parent
Mar -2017 Dec-2016 Mar -2017 Dec-2016
Balance, beginning of period 5,250,000 5,000,000 5,250,000 5,000,000
Additional shares during the period - 250,000 - 250,000
Balance, end of period 5,250,000 5,250,000 5,250,000 5,250,000
(i) Non-Life Business
Share capital comprises:
Group Group Parent Parent
Mar -2017 Dec-2016 Mar -2017 Dec-2016
8,500,000,000 Ordinary shares of 50k each 4,250,000 4,250,000 4,250,000 4,250
(ii) Life Business
Group Group Parent Parent
Mar -2017 Dec-2016 Mar -2017 Dec-2016
2,000,000,000 Ordinary shares of 50k each 1,000,000 1,000,000 1,000,000 1,000,000
23.2 Share premium
23.3 Contingency reserves
The movement in this account during the period is as follows:
Group Group Parent Parent
Mar -2017 Dec-2016 Mar -2017 Dec-2016
Balance, beginning of the period 3,173,900 2,722,013 3,173,900 2,722,013
Transfer from retained earnings 294,784 451,887 294,784 451,887
Balance, end of period 3,468,684 3,173,900 3,468,684 3,173,900
Analysis per business segment
Group Group Parent Parent
Mar -2017 Dec-2016 Mar -2017 Dec-2016
Property & Casualty Business 3,102,022 2,822,259 3,102,022 2,822,259
Life business 365,790 350,769 365,790 350,769
Balance, end of period 3,467,812 3,173,027 3,467,812 3,173,027
The additions to the issued share capital during the period represent the nominal value of the 500,000,000 ordinary shares issued in respect of the AXA
Mansard Share Option Plan (MSOP) treasury shares. See note 27.4 (b) and note 44 for additional disclosures on the treasury shares and share scheme.
Share premium comprises additional paid-in capital in excess of the par value. This reserve is not ordinarily available for distribution.
In compliance with Section 21 (1) of Insurance Act 2003, the contingency reserve for Property & Casualty business is credited with the greater of 3% of
total premiums, or 20% of the profits. This shall accumulate until it reaches the amount of greater of minimum paid-up capital or 50 percent of net premium.
While for life business, the contingency reserves is credited with an amount equal to 1% of gross premium or 10% of net profit (whichever is greater) and
accumulated until it reached the amount of minimum paid up capital.
40
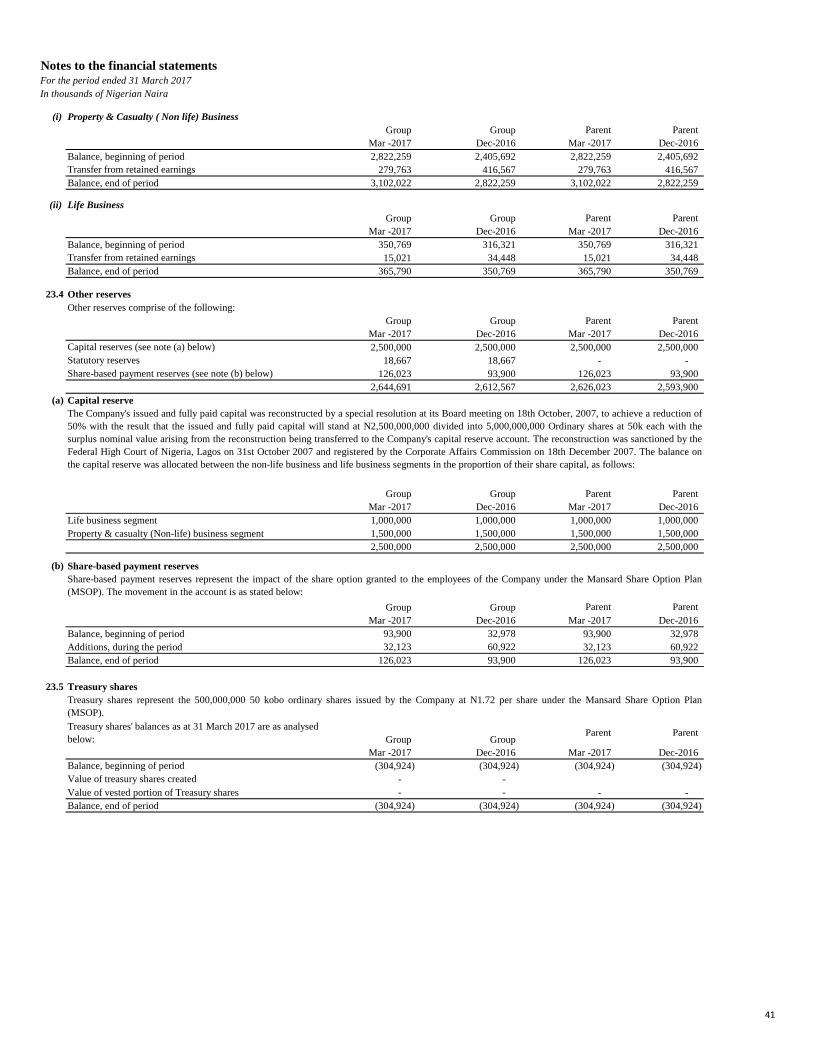
Notes to the financial statementsFor the period ended 31 March 2017
In thousands of Nigerian Naira
(i) Property & Casualty ( Non life) Business
Group Group Parent Parent
Mar -2017 Dec-2016 Mar -2017 Dec-2016
Balance, beginning of period 2,822,259 2,405,692 2,822,259 2,405,692
Transfer from retained earnings 279,763 416,567 279,763 416,567
Balance, end of period 3,102,022 2,822,259 3,102,022 2,822,259
(ii) Life Business
Group Group Parent Parent
Mar -2017 Dec-2016 Mar -2017 Dec-2016
Balance, beginning of period 350,769 316,321 350,769 316,321
Transfer from retained earnings 15,021 34,448 15,021 34,448
Balance, end of period 365,790 350,769 365,790 350,769
23.4 Other reserves
Other reserves comprise of the following:
Group Group Parent Parent
Mar -2017 Dec-2016 Mar -2017 Dec-2016
Capital reserves (see note (a) below) 2,500,000 2,500,000 2,500,000 2,500,000
Statutory reserves 18,667 18,667 - -
Share-based payment reserves (see note (b) below) 126,023 93,900 126,023 93,900
2,644,691 2,612,567 2,626,023 2,593,900
(a) Capital reserve
Group Group Parent Parent
Mar -2017 Dec-2016 Mar -2017 Dec-2016
Life business segment 1,000,000 1,000,000 1,000,000 1,000,000
Property & casualty (Non-life) business segment 1,500,000 1,500,000 1,500,000 1,500,000
2,500,000 2,500,000 2,500,000 2,500,000
(b) Share-based payment reserves
Group Group Parent Parent
Mar -2017 Dec-2016 Mar -2017 Dec-2016
Balance, beginning of period 93,900 32,978 93,900 32,978
Additions, during the period 32,123 60,922 32,123 60,922
Balance, end of period 126,023 93,900 126,023 93,900
23.5 Treasury shares
Treasury shares' balances as at 31 March 2017 are as analysed
below: Group GroupParent Parent
Mar -2017 Dec-2016 Mar -2017 Dec-2016
Balance, beginning of period (304,924) (304,924) (304,924) (304,924)
Value of treasury shares created - -
Value of vested portion of Treasury shares - - - -
Balance, end of period (304,924) (304,924) (304,924) (304,924)
Treasury shares represent the 500,000,000 50 kobo ordinary shares issued by the Company at N1.72 per share under the Mansard Share Option Plan
(MSOP).
Share-based payment reserves represent the impact of the share option granted to the employees of the Company under the Mansard Share Option Plan
(MSOP). The movement in the account is as stated below:
The Company's issued and fully paid capital was reconstructed by a special resolution at its Board meeting on 18th October, 2007, to achieve a reduction of
50% with the result that the issued and fully paid capital will stand at N2,500,000,000 divided into 5,000,000,000 Ordinary shares at 50k each with the
surplus nominal value arising from the reconstruction being transferred to the Company's capital reserve account. The reconstruction was sanctioned by the
Federal High Court of Nigeria, Lagos on 31st October 2007 and registered by the Corporate Affairs Commission on 18th December 2007. The balance on
the capital reserve was allocated between the non-life business and life business segments in the proportion of their share capital, as follows:
41
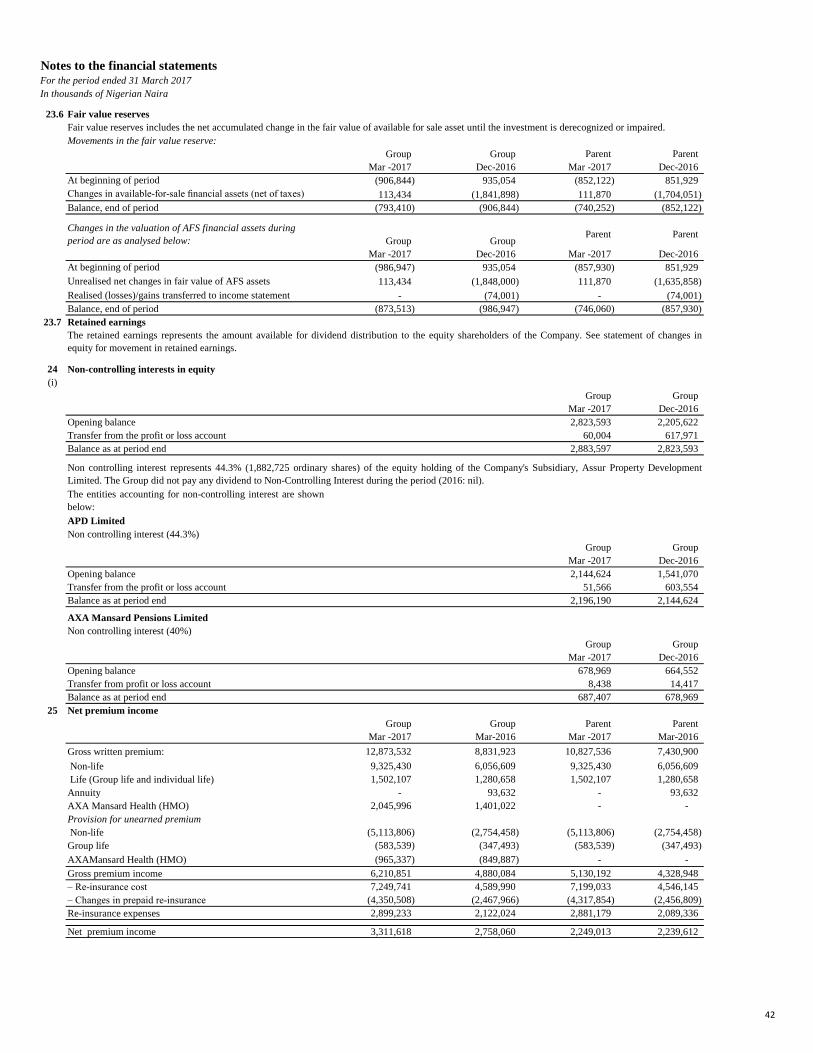
Notes to the financial statementsFor the period ended 31 March 2017
In thousands of Nigerian Naira
23.6 Fair value reserves
Movements in the fair value reserve:
Group Group Parent Parent
Mar -2017 Dec-2016 Mar -2017 Dec-2016
At beginning of period (906,844) 935,054 (852,122) 851,929
Changes in available-for-sale financial assets (net of taxes) 113,434 (1,841,898) 111,870 (1,704,051)
Balance, end of period (793,410) (906,844) (740,252) (852,122)
Changes in the valuation of AFS financial assets during
period are as analysed below: Group GroupParent Parent
Mar -2017 Dec-2016 Mar -2017 Dec-2016
At beginning of period (986,947) 935,054 (857,930) 851,929
Unrealised net changes in fair value of AFS assets 113,434 (1,848,000) 111,870 (1,635,858)
Realised (losses)/gains transferred to income statement - (74,001) - (74,001)
Balance, end of period (873,513) (986,947) (746,060) (857,930)
23.7 Retained earnings
24 Non-controlling interests in equity
(i)
Group Group
Mar -2017 Dec-2016
Opening balance 2,823,593 2,205,622
Transfer from the profit or loss account 60,004 617,971
Balance as at period end 2,883,597 2,823,593
The entities accounting for non-controlling interest are shown
below:
APD Limited
Non controlling interest (44.3%)
Group Group
Mar -2017 Dec-2016
Opening balance 2,144,624 1,541,070
Transfer from the profit or loss account 51,566 603,554
Balance as at period end 2,196,190 2,144,624
AXA Mansard Pensions Limited
Non controlling interest (40%)
Group Group
Mar -2017 Dec-2016
Opening balance 678,969 664,552
Transfer from profit or loss account 8,438 14,417
Balance as at period end 687,407 678,969
25 Net premium income
Group Group Parent Parent
Mar -2017 Mar-2016 Mar -2017 Mar-2016
Gross written premium: 12,873,532 8,831,923 10,827,536 7,430,900
Non-life 9,325,430 6,056,609 9,325,430 6,056,609
Life (Group life and individual life) 1,502,107 1,280,658 1,502,107 1,280,658
Annuity - 93,632 - 93,632
AXA Mansard Health (HMO) 2,045,996 1,401,022 - -
Provision for unearned premium
Non-life (5,113,806) (2,754,458) (5,113,806) (2,754,458)
Group life (583,539) (347,493) (583,539) (347,493)
AXAMansard Health (HMO) (965,337) (849,887) - -
Gross premium income 6,210,851 4,880,084 5,130,192 4,328,948
– Re-insurance cost 7,249,741 4,589,990 7,199,033 4,546,145
– Changes in prepaid re-insurance (4,350,508) (2,467,966) (4,317,854) (2,456,809)
Re-insurance expenses 2,899,233 2,122,024 2,881,179 2,089,336
Net premium income 3,311,618 2,758,060 2,249,013 2,239,612
The retained earnings represents the amount available for dividend distribution to the equity shareholders of the Company. See statement of changes in
equity for movement in retained earnings.
Fair value reserves includes the net accumulated change in the fair value of available for sale asset until the investment is derecognized or impaired.
Non controlling interest represents 44.3% (1,882,725 ordinary shares) of the equity holding of the Company's Subsidiary, Assur Property Development
Limited. The Group did not pay any dividend to Non-Controlling Interest during the period (2016: nil).
42
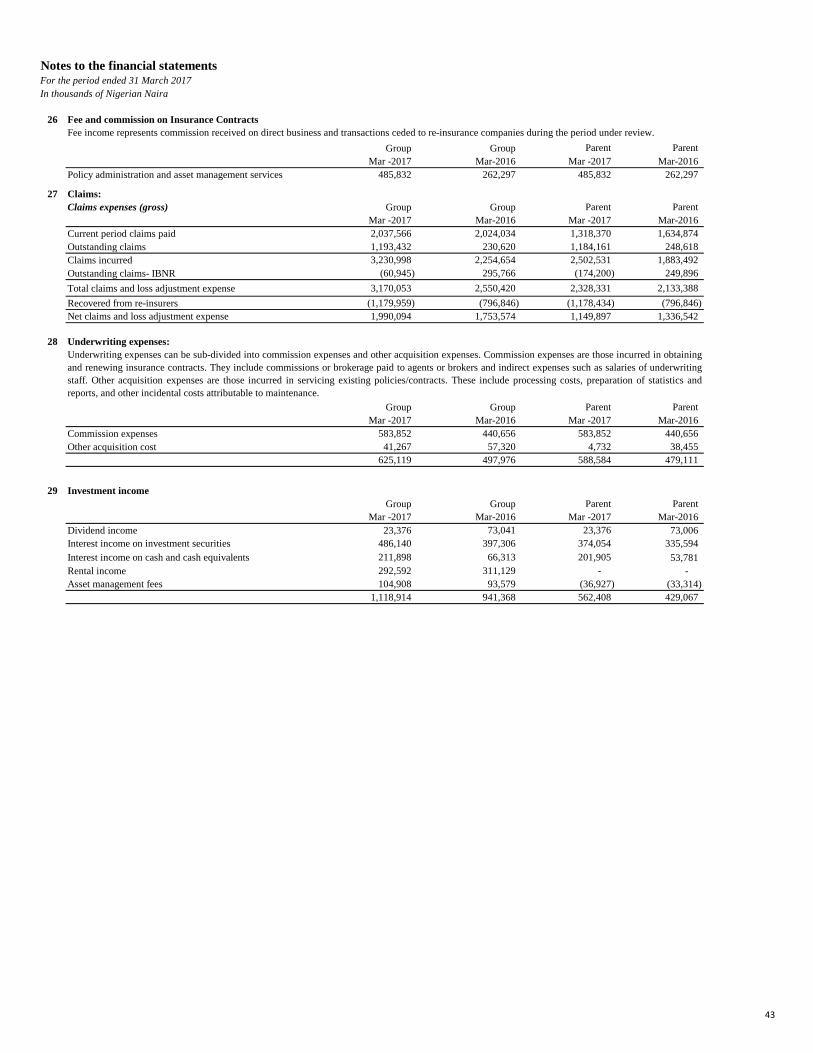
Notes to the financial statementsFor the period ended 31 March 2017
In thousands of Nigerian Naira
26 Fee and commission on Insurance Contracts
Group Group Parent Parent
Mar -2017 Mar-2016 Mar -2017 Mar-2016
Policy administration and asset management services 485,832 262,297 485,832 262,297
27 Claims:
Claims expenses (gross) Group Group Parent Parent
Mar -2017 Mar-2016 Mar -2017 Mar-2016
Current period claims paid 2,037,566 2,024,034 1,318,370 1,634,874
Outstanding claims 1,193,432 230,620 1,184,161 248,618
Claims incurred 3,230,998 2,254,654 2,502,531 1,883,492
Outstanding claims- IBNR (60,945) 295,766 (174,200) 249,896
Total claims and loss adjustment expense 3,170,053 2,550,420 2,328,331 2,133,388
Recovered from re-insurers (1,179,959) (796,846) (1,178,434) (796,846)
Net claims and loss adjustment expense 1,990,094 1,753,574 1,149,897 1,336,542
28 Underwriting expenses:
Group Group Parent Parent
Mar -2017 Mar-2016 Mar -2017 Mar-2016
Commission expenses 583,852 440,656 583,852 440,656
Other acquisition cost 41,267 57,320 4,732 38,455
625,119 497,976 588,584 479,111
29 Investment income
Group Group Parent Parent
Mar -2017 Mar-2016 Mar -2017 Mar-2016
Dividend income 23,376 73,041 23,376 73,006
Interest income on investment securities 486,140 397,306 374,054 335,594
Interest income on cash and cash equivalents 211,898 66,313 201,905 53,781
Rental income 292,592 311,129 - -
Asset management fees 104,908 93,579 (36,927) (33,314)
1,118,914 941,368 562,408 429,067
Underwriting expenses can be sub-divided into commission expenses and other acquisition expenses. Commission expenses are those incurred in obtaining
and renewing insurance contracts. They include commissions or brokerage paid to agents or brokers and indirect expenses such as salaries of underwriting
staff. Other acquisition expenses are those incurred in servicing existing policies/contracts. These include processing costs, preparation of statistics and
reports, and other incidental costs attributable to maintenance.
Fee income represents commission received on direct business and transactions ceded to re-insurance companies during the period under review.
43
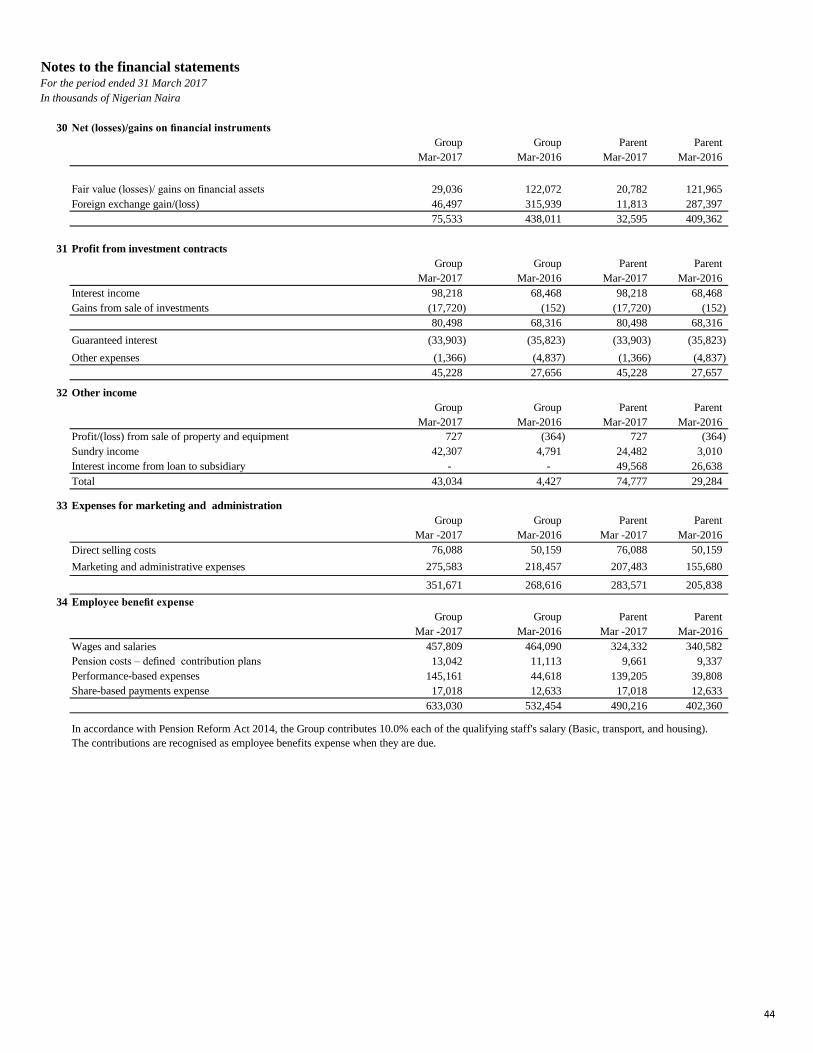
Notes to the financial statementsFor the period ended 31 March 2017
In thousands of Nigerian Naira
30 Net (losses)/gains on financial instruments
Group Group Parent Parent
Mar-2017 Mar-2016 Mar-2017 Mar-2016
Fair value (losses)/ gains on financial assets 29,036 122,072 20,782 121,965
Foreign exchange gain/(loss) 46,497 315,939 11,813 287,397
75,533 438,011 32,595 409,362
31 Profit from investment contracts
Group Group Parent Parent
Mar-2017 Mar-2016 Mar-2017 Mar-2016
Interest income 98,218 68,468 98,218 68,468
Gains from sale of investments (17,720) (152) (17,720) (152)
80,498 68,316 80,498 68,316
Guaranteed interest (33,903) (35,823) (33,903) (35,823)
Other expenses (1,366) (4,837) (1,366) (4,837)
45,228 27,656 45,228 27,657
32 Other income
Group Group Parent Parent
Mar-2017 Mar-2016 Mar-2017 Mar-2016
Profit/(loss) from sale of property and equipment 727 (364) 727 (364)
Sundry income 42,307 4,791 24,482 3,010
Interest income from loan to subsidiary - - 49,568 26,638
Total 43,034 4,427 74,777 29,284
33 Expenses for marketing and administration
Group Group Parent Parent
Mar -2017 Mar-2016 Mar -2017 Mar-2016
Direct selling costs 76,088 50,159 76,088 50,159
Marketing and administrative expenses 275,583 218,457 207,483 155,680
351,671 268,616 283,571 205,838
34 Employee benefit expense
Group Group Parent Parent
Mar -2017 Mar-2016 Mar -2017 Mar-2016
Wages and salaries 457,809 464,090 324,332 340,582
13,042 11,113 9,661 9,337
Performance-based expenses 145,161 44,618 139,205 39,808
Share-based payments expense 17,018 12,633 17,018 12,633
633,030 532,454 490,216 402,360
In accordance with Pension Reform Act 2014, the Group contributes 10.0% each of the qualifying staff's salary (Basic, transport, and housing).
The contributions are recognised as employee benefits expense when they are due.
Pension costs – defined contribution plans
44
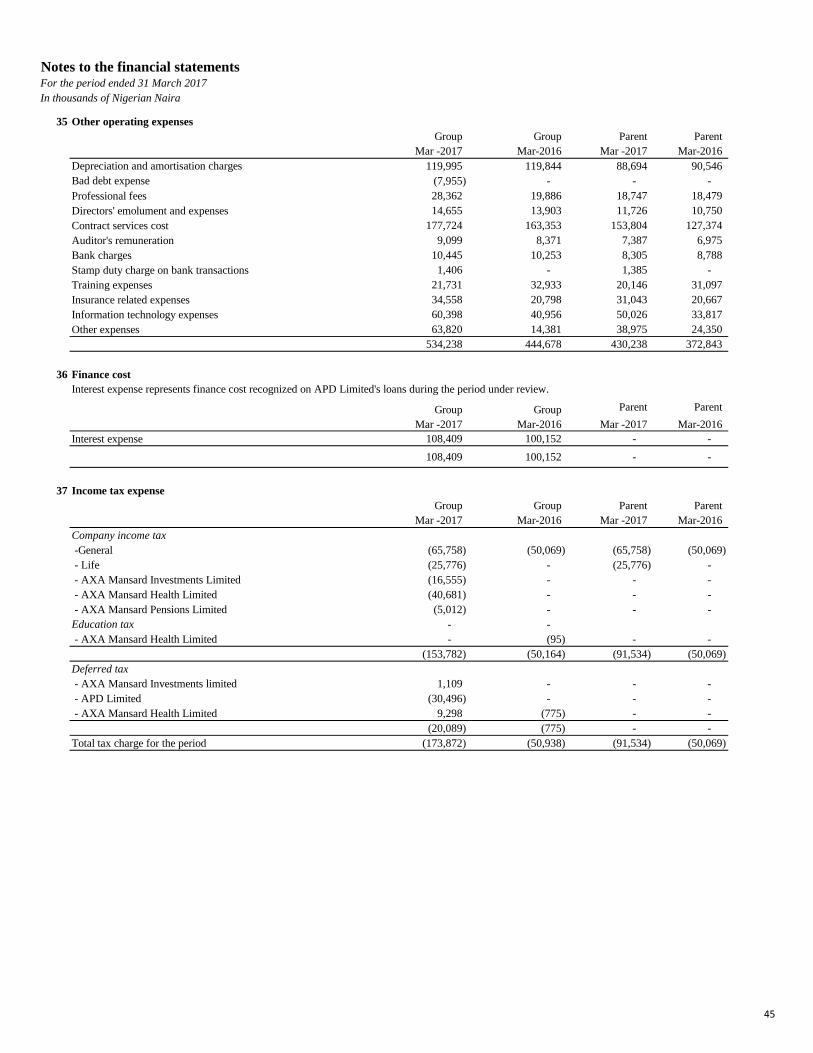
Notes to the financial statementsFor the period ended 31 March 2017
In thousands of Nigerian Naira
35 Other operating expenses
Group Group Parent Parent
Mar -2017 Mar-2016 Mar -2017 Mar-2016
Depreciation and amortisation charges 119,995 119,844 88,694 90,546
Bad debt expense (7,955) - - -
Professional fees 28,362 19,886 18,747 18,479
Directors' emolument and expenses 14,655 13,903 11,726 10,750
Contract services cost 177,724 163,353 153,804 127,374
Auditor's remuneration 9,099 8,371 7,387 6,975
Bank charges 10,445 10,253 8,305 8,788
Stamp duty charge on bank transactions 1,406 - 1,385 -
Training expenses 21,731 32,933 20,146 31,097
Insurance related expenses 34,558 20,798 31,043 20,667
Information technology expenses 60,398 40,956 50,026 33,817
Other expenses 63,820 14,381 38,975 24,350
534,238 444,678 430,238 372,843
36 Finance cost
Group Group Parent Parent
Mar -2017 Mar-2016 Mar -2017 Mar-2016
Interest expense 108,409 100,152 - -
108,409 100,152 - -
37 Income tax expense
Group Group Parent Parent
Mar -2017 Mar-2016 Mar -2017 Mar-2016
Company income tax
-General (65,758) (50,069) (65,758) (50,069)
- Life (25,776) - (25,776) -
- AXA Mansard Investments Limited (16,555) - - -
- AXA Mansard Health Limited (40,681) - - -
- AXA Mansard Pensions Limited (5,012) - - -
Education tax - -
- AXA Mansard Health Limited - (95) - -
(153,782) (50,164) (91,534) (50,069)
Deferred tax
- AXA Mansard Investments limited 1,109 - - -
- APD Limited (30,496) - - -
- AXA Mansard Health Limited 9,298 (775) - -
(20,089) (775) - -
Total tax charge for the period (173,872) (50,938) (91,534) (50,069)
Interest expense represents finance cost recognized on APD Limited's loans during the period under review.
45
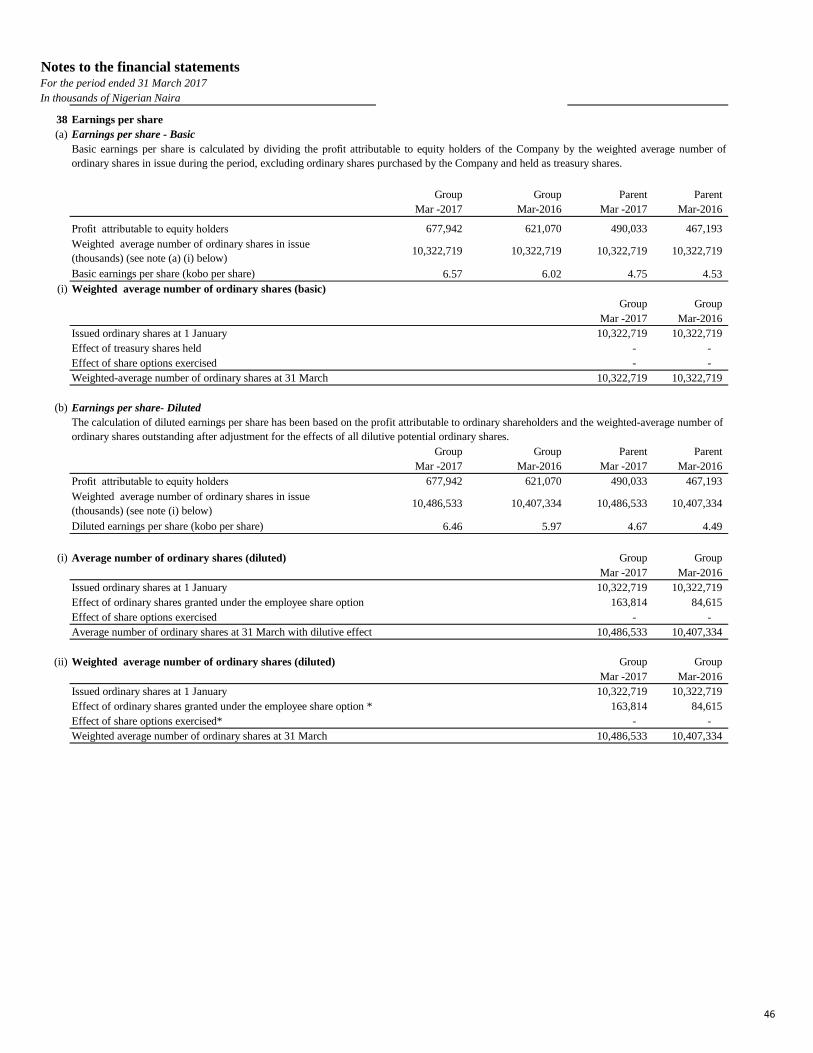
Notes to the financial statementsFor the period ended 31 March 2017
In thousands of Nigerian Naira
38 Earnings per share
(a) Earnings per share - Basic
Group Group Parent Parent
Mar -2017 Mar-2016 Mar -2017 Mar-2016
Profit attributable to equity holders 677,942 621,070 490,033 467,193
Weighted average number of ordinary shares in issue
(thousands) (see note (a) (i) below)10,322,719 10,322,719 10,322,719 10,322,719
Basic earnings per share (kobo per share) 6.57 6.02 4.75 4.53
(i) Weighted average number of ordinary shares (basic)
Group Group
Mar -2017 Mar-2016
Issued ordinary shares at 1 January 10,322,719 10,322,719
Effect of treasury shares held - -
Effect of share options exercised - -
Weighted-average number of ordinary shares at 31 March 10,322,719 10,322,719
(b) Earnings per share- Diluted
Group Group Parent Parent
Mar -2017 Mar-2016 Mar -2017 Mar-2016
Profit attributable to equity holders 677,942 621,070 490,033 467,193
Weighted average number of ordinary shares in issue
(thousands) (see note (i) below)10,486,533 10,407,334 10,486,533 10,407,334
Diluted earnings per share (kobo per share) 6.46 5.97 4.67 4.49
(i) Average number of ordinary shares (diluted) Group Group
Mar -2017 Mar-2016
Issued ordinary shares at 1 January 10,322,719 10,322,719
Effect of ordinary shares granted under the employee share option 163,814 84,615
Effect of share options exercised - -
Average number of ordinary shares at 31 March with dilutive effect 10,486,533 10,407,334
(ii) Weighted average number of ordinary shares (diluted) Group Group
Mar -2017 Mar-2016
Issued ordinary shares at 1 January 10,322,719 10,322,719
Effect of ordinary shares granted under the employee share option * 163,814 84,615
Effect of share options exercised* - -
Weighted average number of ordinary shares at 31 March 10,486,533 10,407,334
Basic earnings per share is calculated by dividing the profit attributable to equity holders of the Company by the weighted average number of
ordinary shares in issue during the period, excluding ordinary shares purchased by the Company and held as treasury shares.
The calculation of diluted earnings per share has been based on the profit attributable to ordinary shareholders and the weighted-average number of
ordinary shares outstanding after adjustment for the effects of all dilutive potential ordinary shares.
46
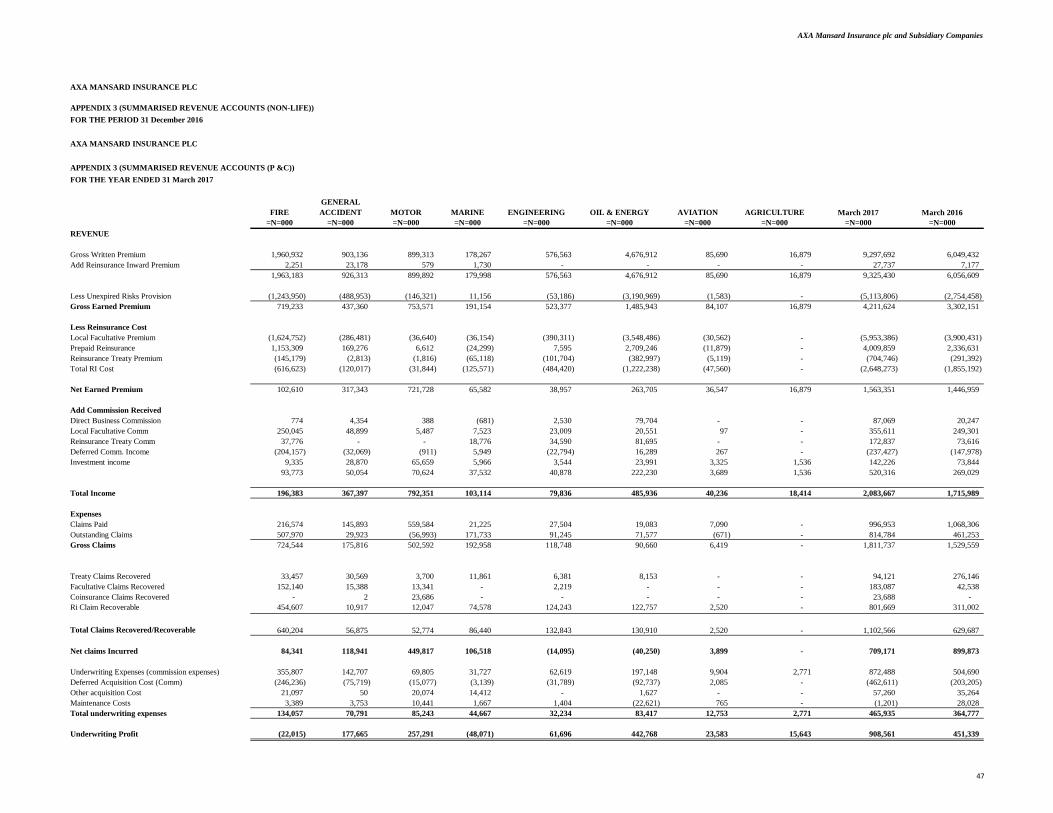
AXA Mansard Insurance plc and Subsidiary Companies
AXA MANSARD INSURANCE PLC
APPENDIX 3 (SUMMARISED REVENUE ACCOUNTS (NON-LIFE))
FOR THE PERIOD 31 December 2016
AXA MANSARD INSURANCE PLC
APPENDIX 3 (SUMMARISED REVENUE ACCOUNTS (P &C))
FOR THE YEAR ENDED 31 March 2017
GENERAL
FIRE ACCIDENT MOTOR MARINE ENGINEERING OIL & ENERGY AVIATION AGRICULTURE March 2017 March 2016
=N=000 =N=000 =N=000 =N=000 =N=000 =N=000 =N=000 =N=000 =N=000 =N=000
REVENUE
Gross Written Premium 1,960,932 903,136 899,313 178,267 576,563 4,676,912 85,690 16,879 9,297,692 6,049,432
Add Reinsurance Inward Premium 2,251 23,178 579 1,730 - - - - 27,737 7,177
1,963,183 926,313 899,892 179,998 576,563 4,676,912 85,690 16,879 9,325,430 6,056,609
Less Unexpired Risks Provision (1,243,950) (488,953) (146,321) 11,156 (53,186) (3,190,969) (1,583) - (5,113,806) (2,754,458)
Gross Earned Premium 719,233 437,360 753,571 191,154 523,377 1,485,943 84,107 16,879 4,211,624 3,302,151
Less Reinsurance Cost
Local Facultative Premium (1,624,752) (286,481) (36,640) (36,154) (390,311) (3,548,486) (30,562) - (5,953,386) (3,900,431)
Prepaid Reinsurance 1,153,309 169,276 6,612 (24,299) 7,595 2,709,246 (11,879) - 4,009,859 2,336,631
Reinsurance Treaty Premium (145,179) (2,813) (1,816) (65,118) (101,704) (382,997) (5,119) - (704,746) (291,392)
Total RI Cost (616,623) (120,017) (31,844) (125,571) (484,420) (1,222,238) (47,560) - (2,648,273) (1,855,192)
Net Earned Premium 102,610 317,343 721,728 65,582 38,957 263,705 36,547 16,879 1,563,351 1,446,959
Add Commission Received
Direct Business Commission 774 4,354 388 (681) 2,530 79,704 - - 87,069 20,247
Local Facultative Comm 250,045 48,899 5,487 7,523 23,009 20,551 97 - 355,611 249,301
Reinsurance Treaty Comm 37,776 - - 18,776 34,590 81,695 - - 172,837 73,616
Deferred Comm. Income (204,157) (32,069) (911) 5,949 (22,794) 16,289 267 - (237,427) (147,978)
Investment income 9,335 28,870 65,659 5,966 3,544 23,991 3,325 1,536 142,226 73,844
93,773 50,054 70,624 37,532 40,878 222,230 3,689 1,536 520,316 269,029
Total Income 196,383 367,397 792,351 103,114 79,836 485,936 40,236 18,414 2,083,667 1,715,989
Expenses
Claims Paid 216,574 145,893 559,584 21,225 27,504 19,083 7,090 - 996,953 1,068,306
Outstanding Claims 507,970 29,923 (56,993) 171,733 91,245 71,577 (671) - 814,784 461,253
Gross Claims 724,544 175,816 502,592 192,958 118,748 90,660 6,419 - 1,811,737 1,529,559
Treaty Claims Recovered 33,457 30,569 3,700 11,861 6,381 8,153 - - 94,121 276,146
Facultative Claims Recovered 152,140 15,388 13,341 - 2,219 - - - 183,087 42,538
Coinsurance Claims Recovered - 2 23,686 - - - - - 23,688 -
Ri Claim Recoverable 454,607 10,917 12,047 74,578 124,243 122,757 2,520 - 801,669 311,002
Total Claims Recovered/Recoverable 640,204 56,875 52,774 86,440 132,843 130,910 2,520 - 1,102,566 629,687
Net claims Incurred 84,341 118,941 449,817 106,518 (14,095) (40,250) 3,899 - 709,171 899,873
Underwriting Expenses (commission expenses) 355,807 142,707 69,805 31,727 62,619 197,148 9,904 2,771 872,488 504,690
Deferred Acquisition Cost (Comm) (246,236) (75,719) (15,077) (3,139) (31,789) (92,737) 2,085 - (462,611) (203,205)
Other acquisition Cost 21,097 50 20,074 14,412 - 1,627 - - 57,260 35,264
Maintenance Costs 3,389 3,753 10,441 1,667 1,404 (22,621) 765 - (1,201) 28,028
Total underwriting expenses 134,057 70,791 85,243 44,667 32,234 83,417 12,753 2,771 465,935 364,777
Underwriting Profit (22,015) 177,665 257,291 (48,071) 61,696 442,768 23,583 15,643 908,561 451,339
47
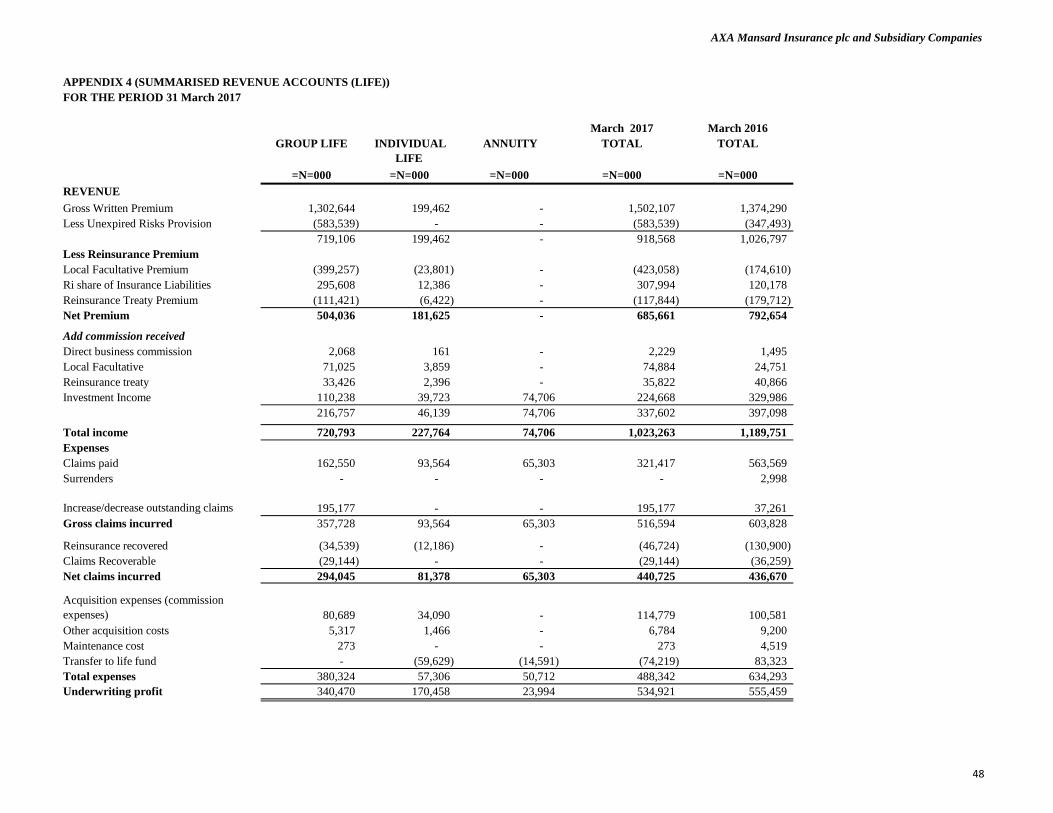
AXA Mansard Insurance plc and Subsidiary Companies
APPENDIX 4 (SUMMARISED REVENUE ACCOUNTS (LIFE))
FOR THE PERIOD 31 March 2017
March 2017 March 2016
GROUP LIFE INDIVIDUAL
LIFE
ANNUITY TOTAL TOTAL
=N=000 =N=000 =N=000 =N=000 =N=000
REVENUE
Gross Written Premium 1,302,644 199,462 - 1,502,107 1,374,290
Less Unexpired Risks Provision (583,539) - - (583,539) (347,493)
719,106 199,462 - 918,568 1,026,797
Less Reinsurance Premium
Local Facultative Premium (399,257) (23,801) - (423,058) (174,610)
Ri share of Insurance Liabilities 295,608 12,386 - 307,994 120,178
Reinsurance Treaty Premium (111,421) (6,422) - (117,844) (179,712)
Net Premium 504,036 181,625 - 685,661 792,654
Add commission received
Direct business commission 2,068 161 - 2,229 1,495
Local Facultative 71,025 3,859 - 74,884 24,751
Reinsurance treaty 33,426 2,396 - 35,822 40,866
Investment Income 110,238 39,723 74,706 224,668 329,986
216,757 46,139 74,706 337,602 397,098
Total income 720,793 227,764 74,706 1,023,263 1,189,751
Expenses
Claims paid 162,550 93,564 65,303 321,417 563,569
Surrenders - - - - 2,998
Increase/decrease outstanding claims 195,177 - - 195,177 37,261
Gross claims incurred 357,728 93,564 65,303 516,594 603,828
Reinsurance recovered (34,539) (12,186) - (46,724) (130,900)
Claims Recoverable (29,144) - - (29,144) (36,259)
Net claims incurred 294,045 81,378 65,303 440,725 436,670
Acquisition expenses (commission
expenses) 80,689 34,090 - 114,779 100,581
Other acquisition costs 5,317 1,466 - 6,784 9,200
Maintenance cost 273 - - 273 4,519
Transfer to life fund - (59,629) (14,591) (74,219) 83,323
Total expenses 380,324 57,306 50,712 488,342 634,293
Underwriting profit 340,470 170,458 23,994 534,921 555,459
48