AXA Mansard Insurance annual report 2016
138
AXA Mansard Insurance plc and Subsidiary Companies Consolidated Financial Statements Together with Directors' and Auditor's Report for the year ended 31 December 2016
-
Upload
michael-olafusi -
Category
Investor Relations
-
view
323 -
download
7
Transcript of AXA Mansard Insurance annual report 2016

AXA Mansard Insurance plc and Subsidiary Companies
Consolidated Financial Statements
Together with Directors' and Auditor's Report
for the year ended 31 December 2016

Introduction
AXA Mansard Insurance is a Nigerian financial service group with interest in insurance, asset and investment
management, health insurance, property development and pension fund administration and management. AXA
Mansard Group comprises AXA Mansard Insurance Plc. and four subsidiaries all operating in Nigeria.
AXA Mansard Insurance Plc's Financial Statements comply with the applicable legal requirements of the
Companies and Allied Matters Act (CAMA) regarding financial statements and comprises Consolidated and
Separate Financial Statements of the group for the year ended 31 December 2016. The consolidated financial
statements have been prepared in accordance with the International Financial Reporting Standards issued by the
International Accounting Standards Board.

Contents
PageBusiness Review:
Corporate information 5
Corporate addresses 6
Vision, Mission and Values 7
2016 Corporate social responsibility initiatives 8
Complaints and feedback 9
Sustainability report 11
Corporate Governance:
Corporate governance report 12
Internal Control and Risk Management Systems 21
Enterprise Risk Management 21
Management discussion and analysis 27
Director's Report 28
Statement of Directors' Responsibilities 33
Report of the Audit and Compliance Committee 34
Independent Auditor's Report 35
Financial Statements:
General Information 41
Summary of significant accounting policies 41
Consolidated Statement of Financial Position 57
Consolidated Statement of Comprehensive Income 58
Consolidated Statements of Changes in Equity 59
Consolidated Statement of Cash Flows 61
Notes to the financial statements 62
Other supplementary information:
Claims Triangulation tables 129
Five Year Financial Highlights 132
Value Added Statement 134
General Business Revenue Account 135
Life Business Revenue Account 136
Annuity disclosures 137
Hypothecation 138
AXA Mansard Insurance plc and Subsidiary Companies
Business Review
AXA Mansard Insurance plc and Subsidiary Companies
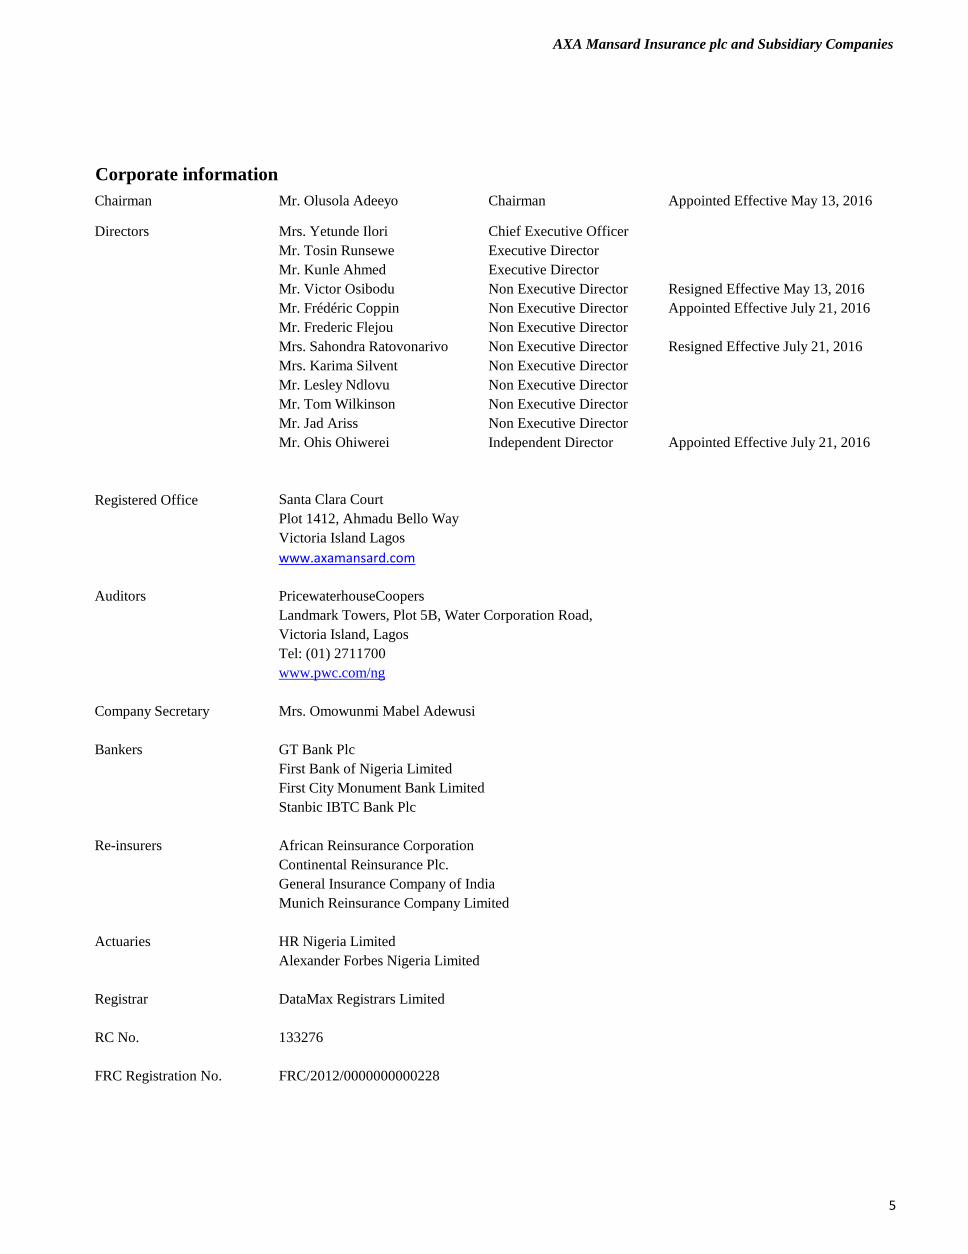
Corporate information
Chairman Mr. Olusola Adeeyo Chairman Appointed Effective May 13, 2016
Directors Mrs. Yetunde Ilori Chief Executive Officer
Mr. Tosin Runsewe Executive Director
Mr. Kunle Ahmed Executive Director
Mr. Victor Osibodu Non Executive Director Resigned Effective May 13, 2016
Mr. Frédéric Coppin Non Executive Director Appointed Effective July 21, 2016
Mr. Frederic Flejou Non Executive Director
Mrs. Sahondra Ratovonarivo Non Executive Director Resigned Effective July 21, 2016
Mrs. Karima Silvent Non Executive Director
Mr. Lesley Ndlovu Non Executive Director
Mr. Tom Wilkinson Non Executive Director
Mr. Jad Ariss Non Executive Director
Mr. Ohis Ohiwerei Independent Director Appointed Effective July 21, 2016
Registered Office Santa Clara Court
Plot 1412, Ahmadu Bello Way
Victoria Island Lagos
www.axamansard.com
Auditors PricewaterhouseCoopers
Landmark Towers, Plot 5B, Water Corporation Road,
Victoria Island, Lagos
Tel: (01) 2711700
www.pwc.com/ng
Company Secretary Mrs. Omowunmi Mabel Adewusi
Bankers GT Bank Plc
First Bank of Nigeria Limited
First City Monument Bank Limited
Stanbic IBTC Bank Plc
Re-insurers African Reinsurance Corporation
Continental Reinsurance Plc.
General Insurance Company of India
Munich Reinsurance Company Limited
Actuaries HR Nigeria Limited
Alexander Forbes Nigeria Limited
Registrar DataMax Registrars Limited
RC No. 133276
FRC Registration No. FRC/2012/0000000000228
5

AXA Mansard Insurance plc and Subsidiary Companies
Corporate Addresses
HEAD OFFICE
AXA Mansard Insurance Plc. AXA MANSARD WELCOME CENTERSMINNA
Santa Clara Court, ABUJA Shamras Plaza, Along Bosso Road
Plot 1412, Ahmadu Bello Way, Plot 1568 Muhammadu Buhari way Opposite Murtala Park,
Victoria Island, Lagos. Area 11,Garki, Minna Central Business District,
Abuja Niger State
REGIONAL OFFICES
ABUJA ALAUSA ALABA
Plot 1568 Muhammadu Buhari way DN Meyer Building H40/51 Igbede Road,
Area 11,Garki Plot 34, Mobolaji Johnson Avenue Alaba International Market,
Abuja. Behind 7Up Bottling Company Ojo, Alaba.
Alausa-Ikeja, Lagos.
IBADAN AHMADU BELLO WAY-V/I
11B, Jimoh Odutola Road, YABA Plot 1412, Ahmadu Bello Way,
Ibadan, Oyo State. 176, Herbert Macaulay, Victoria Island, Lagos.
Adekunle, Yaba, Lagos.
PORT HARCOURT OPEBI
Plot 12 Ezimgbu Link Road, FESTAC 15/17 Opebi Road
Off Stadium Road, GRA Phase IV Plot 248, Block B Opebi, Ikeja, Lagos.
Port Harcourt, Rivers State Amuwo-Odofin, Festac Link Road,
Amuwo-Odofin, Lagos. ONIKAN
ENUGU 3/5, Boyle Street,
Suite A5, Bethel Plaza, IKOTA – LEKKI Onikan, Lagos.
Garden Avenue, Enugu, Enugu State Suite K4-6 & K15-17
Road 5, Ikota Shopping Complex PORT HARCOURT
MINNA Ikota, Ajah, Lagos. Plot 12 Ezimgbu Link Road,
Shamras Plaza, Along Bosso Road Tel: 08150490173 Off Stadium Road, GRA Phase IV
Opposite Murtala Park, Port Harcourt, Rivers State.
Minna Central Business District, IKORODU ROAD
Niger State 177 Ikorodu Road Onipanu, Lagos. IBADAN
Broking House, 1 Alhaji Jimoh Odutola Rd,
KADUNA APAPADugbe, Ibadan, Oyo State.
3B, Bungalow Close, No. 12/14 Wharf Road, Apapa, Lagos.
Along Ribadu Road, Doctors Quarters, SURULERE
Angwar Rimi GRA, Kaduna North, OGBA 82 Adeniran Ogunsanya Street, Surulere
Kaduna State 18 Ijaiye Road Ogba, Ikeja, Lagos. Lagos
ENUGU KADUNA
Suite A5, Bethel Plaza, 3B, Bungalow Close,
Garden Avenue, Enugu, Enugu State Along Ribadu Road, Doctors Quarters,
Angwar Rimi GRA, Kaduna North,
BENIN Kaduna State
No 15 Sapele Road
Opposite High Court, Benin City, Edo State EGBEDA
Yemosa Plaza
UYO 26-28 Akowonjo Road
110,Abak Road,Uyo,Akwa Ibom State Egbeda, Lagos
ILORIN MARYLAND MALL
30 Taiwo Ibrahim Road, Ilorin Kiosk 2, Ground Floor, Maryland Mall
Maryland, Lagos
6
AXA Mansard Insurance plc and Subsidiary Companies
Vision, Mission and Values
Our Vision
Our Mission
We are driven to innovate and excel consistently creating exceptional value for our stakeholders.
Our corporate values
Integrity : To do the right thing at the right time, every time.
Responsibility : To our customers, to our society, and to ourselves.
Innovation : Constantly re-defining ourselves to create the best service.
Customer Focus : Always providing the best value for our customers by understanding their world, their needs
and their wants.
Excellence : Superior performance, aiming for the highest quality.
Our mission, vision and values outline who we are, what we want to achieve and how we want to achieve it. They
provide direction for our Company and help ensure that we are all working toward the same goal.
To be the leading African Financial Services provider, delivering superior solutions to our customers while
exceeding stakeholders’ expectations.
Our values are the foundation of our organization. They serve as our guide, inspiring our actions and our
decisions. These values reflect our way of doing and thinking, for the benefit of our customers, shareholders,
employees, business partners and in any community we operate in. The following core values drive everything we
do at AXA Mansard Insurance Plc.
7
AXA Mansard Insurance plc and Subsidiary Companies
2016 Corporate social responsibility report
Background
Support for Non-Governmental Organizations
Health
Pan-African Urological Surgeons Association's Initiative for Urological Training in Africa (PIUTA)
Eye Foundation Centre
ENACTUS
ENACTUS (FORMERLY KNOWN AS SIFE FOUNDATION GTE) is an international non-profit organization dedicated to inspiring
students to improve the world through entrepreneurial action. It provides a platform for teams of outstanding university students and create
community development projects that put people’s own ingenuity and talents at the center of improving their livelihoods. Guided by
educators and supported by business leaders.
AXA Mansard’s overall aim is to achieve positive impact on the society as a whole while maximizing the creation of shared value for
members of staff, shareholders and stakeholders.
To achieve this objective, our attention is driven towards community projects, such as healthcare access, education and support to non-
governmental organizations.
AXA Mansard in April 2016 donated the sum of Two Million Naira (N2,000,000) to the Postgraduate Training Fellowships in general
urology at the Pan-African Urological Surgeons Association's Initiative for Urological Training in Africa (PIUTA), Ibadan Centre,
University of Ibadan and University College Hospital, Ibadan. AXA Mansard incepted funding of training fellowships in Urology in 2013.
The sponsorship comes as a yearly medical outreach programme which is aimed at providing health education talks, screening for medical
and surgical diseases and undertaking intermediate procedures in all surgical specialties. Over 1,740 medical cases will be attended to for
free. These cases include screening for general medical and surgical diseases, urological diseases, obstetrics and gynecology diseases,
primary dental and ophthalmological care and provision of eye glasses amongst others.
The Eye foundation centre was established in 1993 by Dr Kunle Hassan, an international acclaimed, Opthalmic Surgeon with wide
experience in Vitreo-Retina, Surgery, Glaucoma, Anterior Segment, Cataract and Ocular Plastic Surgery. The hospital was established
with state-of-the-art technology,which is of comparable standard to that available in developed countries.
AXA Mansard sponsored the Eye Foundation for the surgical procedure and medical expense of indigent persons with eye problems such
as cataract for 20- 30 persons. We are also involved in the sponsorship of sports programmes for special needs children and in various
primary, secondary and tertiary institutions.
In August 2016, AXA Mansard supported the foundation with a sum of N500,000 (Five Hundred Thousand Naira Only) in order to drive
creativity and reward results of outstanding students who participated in the competition.
DANGOTE WOMEN NETWORK IDP INITIATIVE
In view of this, the 2016 event which held December 3rd was aimed at educating women on relevant health information which will help
improve their health lifestyle and the session feature key interesting topics relating to nutrition, fertility & cancer awareness which will be
opened by a 2-hour charity walk. AXA Mansard contributed the sum of N1,000,000 for this course.
EDUCATION
AXA Mansard supported various schools activities, ranging from sports events, family fun days, academic events and some tactical
projects. The schools below were beneficiaries of AXA Mansard’s support in 2016.
CORONA SCHOOLS provide top of the range education akin to the type offered anywhere in the world with excellent modern facilities.
A total sum of N260,000 (Two Hundred and Sixty Thousand Naira) was donated to the school in October and December to support their
Inter-house sports and family fun day event.
DAY WATERMAN COLLEGE (DWC) is a modern co - educational boarding school in Asu, Ogun State, designed to provide an
exciting learning environment for children between the ages of 11 – 16. The school also provides a broad-based education of international
standard to meet global needs with facilities and equipment of outstanding quality to support the learning environment.
As part of our efforts to include access to safe recreational areas in schools, AXA Mansard sponsored DWC with the sum of N200,000 in
its 6th annual Inter - House Sports festival for sporting excellence among its students and the event was held on Saturday, 12th March 2016
at the school sports ground.
EMERALD HIGH SCHOOL was established in 2005 as a progression from the highly academically successful Emerald Nursery and
Primary School in Lagos, which was established in 1995. The establishment of Emerald High School was in response to the yearnings of
parents of the primary school pupils and the need to bridge the gap in providing high quality Secondary School Education in the country.
A sum of N75,000 (Seventy Five Thousand Naira Only) was donated towards the School’s 9th annual Inter-house sport in January 2016.
The Dangote Women’s Network provides the platform through which women can act as catalysts for change, especially towards nation
building. Also, the network encourages women to aspire for top managerial positions so as to contribute to the economic growth of the
nation.
8

AXA Mansard Insurance plc and Subsidiary Companies
Complaints and feedback
Introduction
3. Our website platform,
4. Correspondence from customers,
5. Our Twitter handle, Google+, Facebook channel and Live Chat Platform on the website.
Resolution structure
The process flow for customer complaints and resolution is as follows:
- The receiving point of a customer's complaint acknowledges the received complaint.
- The complaint is reviewed and it is determined if the complaint could be resolved at first-level.
- Where the complaint can be resolved at the first level, a resolution is immediately provided to the customer.
- Upon resolution, the customer is contacted and the resolution is explained to the customer.
The evaluation is conducted in various ways including:
- One-on-one focus meetings with key customers
- Interviews with selected customers
- Opinions received via our AXA Mansard CCare mailbox ([email protected])
- Surveys / Questionnaires administered to customers.
Complaints channels
AXA Mansard Insurance plc considers customers as critical stakeholders in its business. One of our main selling points at AXA Mansard
over the years has been our excellent customer service. We therefore consider customers’ feedback as a necessary and important factor in
our drive to always treat customers fairly.
To enrich our customers experience we also periodically evaluate public/customer opinion about our services, products and policies.
In recognition of this, we at AXA Mansard have provided various channels for its customers to provide feedback on our products and
services. These platforms include:
1. Our AXA Mansard CCare and Complaint email channels,
2. Our AXA Mansard hotline
Customers can also pay a visit to any of our AXA Mansard Welcome Centers located across the country to provide the feedback. For
locations of these addresses, they can be found on our website – http://AXA Mansardinsurance.com/index.php/contact-us/corporate-
addresses.
At AXA Mansard, we have put in place a structure to ensure that customers’ feedback are received and promptly resolved. For this purpose
we have a dedicated Customer Interface team which comprises of the Contact Centre and Branch Operations teams, of which the Contact
Centre is responsible for the prompt investigation and resolution of customers’ complaints within the approved period. The Contact Centre
liaises with other units within the organization and ensures that customers’ complaints are satisfactorily resolved.
Customers' complaints are stream-lined based on the type of complaints to provide an enabling environment for proper monitoring, proper
documentation and effective feedback process of received complaints.
- If such complaint cannot be resolved at the first level, the receiving point forwards the complaint to the appropriate unit in the
organization to handle.
- The complaint is closed and marked as resolved.
In addition to our current process and our Customer Relationship Management application currently being used, we have gone a step
further to deploy a Contact Centre Solution that will help in enhancing customer engagement and experience. The combination of all these
processes and applications will help in adequately managing all complaints and in also giving the best response time in this area of our
services.
Customers’ opinion on products
These various evaluations are carried out to afford our organization the opportunity of receiving customers’ perception about the company,
in order to ensure that efforts can be put in place to close such gap(s) in our services delivery or improve upon the process, service or
product.
9

AXA Mansard Insurance plc and Subsidiary Companies
Feedback on customers’ complaints to AXA Mansard Insurance Plc
- AXA Mansard retains her customers as they feel appreciated and respected,
- The quality service delivery at AXA Mansard is maintained and made uniform across board,
- A reliable source of identifying improvement opportunities is presented to management
- A reliable source of data on customers’ complaints and expectations is collated.
Report of Complaints received and resolved by the organization between January - December 2016
January 22 22 Nil 1
February 27 27 Nil 1
March 11 11 Nil Nil
April 30 30 Nil 2
May 30 30 Nil 3
June 13 13 Nil Nil
July 27 27 Nil 1
August 16 16 Nil Nil
September 11 11 Nil Nil
October 2 2 Nil Nil
November 2 2 Nil Nil
December 11 11 Nil Nil
Total 202 202 Nil 8
Going into 2017, we will be commencing our 24hr services within our Contact Centre, this is to help increase our availability to customers
and also drive service excellence. Being a global brand, it is now becoming more important that we are open to customers and prospective
customers 24/7, as it is possible that we may receive communication from anywhere across the world from our customers and prospective
customers to either make enquiries or have an issue resolved.
The complaints received for this year (2016) have all been treated appropriately as customer satisfaction is paramount to our organization.
Feedback on customers’ complaints is provided to Management, the relevant Units and Groups in the organization to ensure that
complaints and issues raised by customers do not re-occur.
The feedback gathered ensures that:
The feedbacks are circulated to management staff through the company’s internal information channel for the general information of all
staff.
Month
Number of
Complaints
received during the
period
Number of complaints
resolved
Number of complaints
unresolved
Number of complaints
unresolved with SLA
Incidences of complaints not resolved within stipulated turnaround times, were largely due to the unavailability of these customers either
via e-mail or telephone and also due to dependencies on third party assistance in resolving the issue, however all complaints are usually
resolved within 24hrs. It is mandatory that all complaints are closed with each customers consent at an agreed upon time (if the issue
exceeds our stated turnaround time).
We continually strive to ensure improvements in our service delivery with a view to reducing customer complaints. Major tools for
achieving this are: (i) our Keep in Touch (KIT) Process, which helps us continuously engage and interact with our customers. This has in
turn helped the organization address customer concerns before they became complaints. (ii) An increase in number of our customer touch
points (Welcome Centers, Contact Center, live chat, etc.) has made it easy for customers to walk in or engage us and have a delightful
experience while their concerns are being treated.
From the data above, we can identify four major spikes, in the months of February, April, May, and July 2016. The spikes in the number of
complaints noticed in April and May 2016 were due to an upgrade in the application / system used in processing liquidation claims. This
initially led to an increase in our standard turnaround time for processing customer liquidation requests to which customers were
accustomed to, but this situation has since normalized, as can be seen in the month of June 2016.
For the months of February and July 2016, these months were peculiar as the major reason for these spikes was due to delayed updates on
customer statement (for contributory savings policies) and this occurred because of certain adjustments made from our vendor banks. This
is now being closely monitored to avoid a repeat of the incident.
10

AXA Mansard Insurance plc and Subsidiary Companies
SUSTAINABILITY REPORT
Continuous awareness
Our commitment
Our Environmental and Social risk management framework constitutes an integral part of our robust corporate governance, social
responsibility and enterprise risk management strategies. Our obligation to uphold environmental and social sustainability considers the
occupational and community health, safety and security concerns of the businesses we underwrite and advocates social responsiveness
amongst our clients in relation to these risks.
The Environmental and Social Management System- Our approach
As the foremost insurance company in Nigeria to pioneer and incorporate the environment and social facets of risk management, as an
ancillary function to mainstream insurance risk underwriting, AXA Mansard remains passionate and dedicated to managing the potential
Environmental & Social risks of our business and applying the appropriate standards in the review of our business operations and those of
our clients, as well as in our relationship with the communities in which we operate.
We are taking a more serious look at the environmental and social impacts and risks potentially associated with our business activities as
we strive to retain our standards and the delicate balance between ensuring viable competitiveness and delivering on our corporate social
responsibilities. This is evident in our constant improvement of the ESMS tools and processes we use to ensure that it continues to function
efficiently and effectively, we put other identified E&S risk that emerge in the course of the year into consideration as well as ensure that
changes in relevant environmental standards are reflected.
The management of E&S risks is governed by its Environmental & Social Management System (ESMS) framework- which consists of a
policy, a set of procedures to identify, assess and manage environmental and social risks in our clients’ operations and the assignment of
administering such responsibility by the Enterprise Risk Management (ERM) unit.
In addition, through our Environmental & Social Management System processes, we evaluate our clients’ current capabilities in managing
identified environmental & social risks that could arise in the cause of their business operations and we offer advisory services and also
assist in developing E&S framework as value- added service.
It is our belief that for sustainability initiative to thrive within the Nigerian Insurance industry, a firm commitment by and robust
collaboration with all industry stakeholders is necssary and we are committed to this.
The management of E&S risks is governed by its Environmental & Social Management System (ESMS) framework-this is a policy, set of
procedures to identify, assess and manage environmental and social risks in our clients’ operations and the assignment of administering
such responsibility by the Enterprise Risk Management (ERM) unit.
A significant contribution we are making to socioeconomic development is in creating awareness by training and buildig the capacity of
our employees in the subject of sustainability and enlightening our customers, clients and all other stakeholders.
We seek to increase our clients’ understanding of how E&S issues can impact their business, thereby reducing resistance to environmental
and social risk managment requirements and developing strong partnership for sustainability.
We will remain focused and committed on Sustainable performance. This translates into taking measures to minimize harm in the
communities we operate in, we would continually communicate our progress and create more awareness and promote such drives from
other players in the industry.
We are committed to assisting our clients develop environmental and social risk management frameworks as value-added service as this we
believe is mutually beneficial to our clients and ourselves in relation to managing E&S risks as the success of our customers, clients and
stakeholders guarantees future business, which strengthens our commercial sustainability.
11

AXA Mansard Insurance plc and Subsidiary Companies
Corporate Governance

AXA Mansard Insurance plc. and Subsidiary Companies
Corporate governance report
Governance structure
The Board
Responsibilities of the Board
The powers reserved for the Board include the following;
of the Board members;
h) recommendation to shareholders of the appointment or removal of auditors and the remuneration of Auditors;
b) approval of mergers and acquisitions, branch expansion and establishment of subsidiaries; approval of remuneration policy and packages
c) approval of policy documents on significant issues including Enterprise-wide Risk Management, Human Resources, Corporate governance
d) approval of resolutions and corresponding documentation for shareholders in general meeting(s), shareholders circulars, prospectus and
e) approval of major change to the Company’s corporate structure (excluding internal reorganizations) and changes relating to the Company
f) approval of quarterly, half-yearly and full year financial statements (whether audited or unaudited) and any significant change in
Board and senior management and Board Committee membership;
and Anti – money laundering;
principal regulatory filings with the regulators;
capital structure or its status as a public limited company;
accounting policies and/or practices;
g) approval of the Company’s strategy, medium and short term plan and its annual operating and capital expenditure budget;
AXA Mansard Insurance Plc (“the Group”) has consistently developed corporate policies and standards to encourage good and transparent corporate
governance framework to avoid potential conflicts of interest between all stakeholders whilst promoting ethical business practices. This is the
foundation of our history, values and culture as a Company for building and sustaining an endurable institution that guarantees profitability and
professionalism whilst enhancing shareholders’ value.
As a publicly quoted company, the Company strives to carry out its business operations on the principles of integrity and professionalism whilst
enhancing shareholders value through transparent conduct at all times with the adoption and application of local regulatory standards as well as
international best practices in corporate governance, service delivery and value creation for all. For the Company, good corporate governance goes
beyond just adhering to rules and policies of the regulators; it is about consistently creating value through going the extra within a sustainable and
enduring system.
In order to ensure consistency in its practice of good corporate governance, the Company continuously reviews its practice to align with the various
applicable Codes of Corporate Governance such as the Securities and Exchange Commission (SEC) Code and the National Insurance Commission
(NAICOM) Code with particular reference to compliance, disclosures and structure. Furthermore, an annual board appraisal is also conducted by an
Independent Consultant appointed by the Company whose report is submitted to NAICOM and presented to shareholders at the Annual General
Meeting of the Company in compliance with the recommendation of the NAICOM Code of Corporate Governance.
The governance of the Company resides with the Board of Directors which is accountable to shareholders for creating and delivering sustainable value
through the management of the Company’s business. The Board of Directors is responsible for the efficient operation of the Company and to ensure the
Company fully discharges its legal, financial and regulatory responsibilities.
The Board also reviews corporate performance, monitors the implementation of corporate strategy and sets the Company’s performance objectives. The
Board monitors the effectiveness of its governance practices, manages potential conflict and provides general direction to management. These oversight
functions of the Board of Directors are exercised through its various Committees. In the course of the year under review, the Board has four (4)
Committees to ensure the proper management and direction of the Company via interactive dialogue on a regular basis.
The Board membership comprises eleven (11) members, including the Chairman, six (6) Non-Executive Directors, three (3) Executive Directors and
one (1) Independent Director appointed based on the criteria laid down by NAICOM for the appointment of Independent Director(s).The Independent
Director does not have any significant shareholding interest or any special business relationship with the Company. The effectiveness of the Board
derives from the appropriate balance and mix of skills and experience of Directors, both Executive and Non-Executive. The Company’s Board is made
up of seasoned professionals, who have excelled in their various professions and possess the requisite integrity, skills and experience to bring to bear
independent judgment on the deliberations of the Board.
The Board meets quarterly and additional meetings are convened as at when required. Material decisions may be taken between meetings by way of
written resolutions, as provided for in the Articles of Association of the Company. The Directors are provided with comprehensive group information at
each of the quarterly Board meetings and are also briefed on business developments between Board meetings. The Board met four (4) times during the
period ended December 31, 2016.
The Board determines the strategic objectives of the Company in delivering long-term growth and short-term goals. In fulfilling its primary
responsibility, the Board is aware of the importance of achieving a balance between conformance to governance principles and economic performance.
a) determination of Board structure, size and composition, including appointment and removal of Directors, succession planning for the
13
AXA Mansard Insurance plc. and Subsidiary Companies
Roles of key members of the Board
The Chairman
The Chief Executive Officer
The Chief Client Officer
The Independent Director
Company Secretary
Director nomination process
The following core values are considered critical in nominating a new director;
(i) Integrity
(ii) Professionalism
(iii) Career success
(iv) Recognition
Induction and continuous training of Board members
The balance and mix of appropriate skills and experience of Non-executive Directors is taken into account when considering a proposed appointment. In
reviewing the Board composition, the Board ensures a mix with representatives from different industry sectors.
The Shareholding of an individual in the Company is not considered a criterion for the nomination or appointment of a Director. The appointment of
Directors is subject to the approval of NAICOM.
In line with the NAICOM code of corporate governance practices, the Board has an independent Director who does not represent any significant
shareholding interest nor holds any business interest in the Company.
The Company Secretary is a point of reference and support for all Directors. It is her responsibility to update the Directors with all requisite information
promptly and regularly. The Board may obtain information from external sources, such as consultants and other advisers, if there is a need for outside
expertise, via the Company Secretary or directly.
The Company Secretary has a further responsibility to assist the Chairman and Chief Executive Officer to formulate an annual Board Plan and with the
administration of other strategic issues at the Board level; organize Board meetings and ensure that the minutes of Board meetings clearly and properly
capture Board’s discussions and decisions.
The Chief Client Officer (CCO) is an Executive on the Board who is responsible for strategic business decisions, research and business development of
the Company. The CCO has the oversight on monitoring investment policies and strategic plans of the Company to the Board for approval. He is
responsible for the review of policies that will ensure that the Company’s assets, objectives and resources are channeled in investments that will yield
utmost returns and goals of the Company.
On appointment to the Board and to Board Committees, all Directors receive a formal induction tailored to meet their individual requirements. The new
Directors are oriented about the Company and its operations through the Company Secretary via the provision of the Company’s Articles of Association,
relevant statutory books and regulations and adequate information on the operations.
The Directors are also given a mandate and terms of reference to aid in performance of their functions the Management further strives to acquaint the
new Directors with the operations of the Company via trainings and seminars to the extent desired by new Directors to enable them function in their
position.
The training and education of Directors on issues pertaining to their oversight functions is a continuous process, in order to update their knowledge and
skills and keep them informed of new developments in the insurance industry and operating environment.
The positions of the Chairman of the Board and the Chief Executive Officer are separate and held by different persons. The Chairman and the Chief
Executive Officer are not members of the same extended family.
The Board has delegated the responsibility for the day-to-day management of the Company to the Chief Executive Officer (CEO), who is responsible for
leading management and for making and implementing operational decisions. The CEO is responsible to the Board of Directors and ensures that the
Company complies strictly with regulations and policies of both the Board and Regulatory Authorities. The CEO ensures that optimization of the
Company’s resources is achieved at all times and has the overall responsibility for the Company’s financial performance.
The Chairman’s main responsibility is to lead and manage the Board to ensure that it operates effectively and fully discharges its legal and regulatory
responsibilities. The Chairman is responsible for ensuring that Directors receive accurate, timely and clear information to enable the Board take
informed decisions: monitor effectively and provide advice to promote the success of the Company. The Chairman also facilitates the contribution of
Non-executive Directors to promote effective relationships and open communications, both inside and outside the Boardroom, between Executive and
Non-executive Directors. The Chairman strives to ensure that any disagreements on the Board are resolved amicably.
The Board agrees upon the criteria for the desired experience and competencies of new Directors. The Board has power under the Articles of
Association to appoint a Director to fill a casual vacancy or as an additional Director. The criteria for the desired experience and competencies of new
Non-executive Directors are agreed upon by the Board.
14

AXA Mansard Insurance plc. and Subsidiary Companies
Changes on the Board
Non-Executive Directors (NEDs) Remuneration
Committees
(i) Statutory Audit Committee
The Statutory Audit Committee comprised the following members during the year under review;
1. Mr. Olusola Adeeyo Independent Director – Chairman (resigned effective July 21, 2016)
2. Mr. Ohis Ohiwerei Independent Director – Chairman (appointed effective July 21, 2016)3. Mr. Lesley Ndlovu Non-Executive Director – Member
4. Mr. Laoye Jaiyeola Shareholder’s Representative – Member
5. Mr. Akingbola Akinola Shareholder’s Representative – Member
The Committee met four (4) times during the year under review:
Mr. Olusola Adeeyo
Chairman (resigned
effective July 21, 2016) 2 X X - -
Mr. Ohis Ohiwerei
Chairman (appointed
effective July 21, 2016) 1 N/A N/A N/A X
Mr. Lesley Ndlovu Member 4 X X X X
Mr. Laoye Jaiyeola Member 4 X X X X
Mr. Akingbola Akinola Member 4 X X X X
27-Oct-16
The Company’s policy on remuneration of Non-Executive Directors is guided by the provisions of the NAICOM and SEC Codes which stipulate that
Executive Directors’ remuneration should be limited to Directors’ fees and reimbursable travel and hotel expenses. Director’s fees and sitting allowance
was paid to only Non-executive directors as recommended by the Board Governance, Remuneration, and Establishment & General Purpose Committee.
Auditing is vital to ensuring that accounting norms for insurance businesses are effectively applied and maintained and to monitor the quality of internal
control procedures; ensure compliance with all regulatory directives. The Committee shall be responsible for the review of the integrity of the data and
information provided in the audit and/or financial reports.
A summary of the roles, responsibilities, composition and frequency of meetings of each of the Committees are as stated hereunder:
All Committees in the exercise of their powers as delegated conform to the regulations laid down by the Board, with well-defined terms of reference
contained in the charter of each Committee. The Committees render reports to the Board at the Board’s quarterly meetings.
Through these committees, the Board is able to more effectively deal with complex and specialized issues and to fully utilize its expertise to formulate
strategies for the Company. The committees make recommendations to the Board, which retains responsibility for final decision making.
The Board carries out its responsibilities through its Committees, which have clearly defined terms of reference, setting out their roles, responsibilities,
functions and scope of authority. The Board has four (4) Committees, namely: Audit Committee, Board Investment & Finance Committee, Board Risk
Management and Technical Committee and the Board Governance, Remuneration, Establishment & General Purpose Committee
There were changes in the composition of the Board during the 24th Annual General Meeting following the resignation of Mr. Gbolade Osibodu as the
Chairman of the Board of Directors and Mr. Olusola Adeeyo an independent Director was nominated to replace Mr. Gbolade Osibodu as the Chairman
of the Board. The nomination of Mr. Olusola Adeeyo as the Chairman of the Board created a vacancy in the position of an Independent Director. The
Board at its 67th Board meeting held in July, 2016 appointed Mr. Ohis Ohiwerei as a Non-Executive (Independent) Director and Mr. Frédéric Coppin
(Representative of AAH) as a Non-Executive subject to regulatory approvals to replace Mr. Olusola Adeeyo and Mrs. Sahondra Ratovonarivo
(Representative of AAH) who resigned at the meeting.
The Committee Chairman shall report formally to the Board on its proceedings after each meeting on all matters within its functions and responsibilities.
The Committee shall make whatever recommendations to the Board it deems appropriate on any area within its remit where action or improvement is
needed.
The Committee shall provide oversight functions with regard to both the company’s financial statements and its internal control and risk management
functions. The Committee shall ensure compliance with legal and other regulatory requirements, assessment of qualifications and independence of
external auditor; and performance of the company’s internal audit function as well as that of external auditors.
Name Composition
Meetings
attended 4-Feb-16 26-Apr-16 14-Jul-16
15

AXA Mansard Insurance plc. and Subsidiary Companies
(ii) Board Investment and Finance Committee
The Board Investment and Finance Committee comprised the following members during the year under review;
1. Mr. Frédéric Fléjou Non Executive Director Chairman
2. Mr. Lesley Ndlovu Non Executive Director Member
3. Mr. Tosin Runsewe Executive Director Member
Mr. Frédéric Fléjou Chairman 4 X X X X
Mr. Lesley Ndlovu Member 4 X X X X
Mr. Tosin Runsewe Member 4 X X X X
(iii) Board Risk Management and Technical Committee
1. Mrs. Sahondra Ratovonarivo Non Executive Director Chairman (resigned effective July 21, 2016)
2. Mr. Frédéric Coppin Non Executive Director Chairman (appointed effective July 21, 2016)
3. Mrs. Yetunde Ilori Executive Director Member
4. Mr. Tosin Runsewe Executive Director Member
5. Mr. Kunle Ahmed Executive Director Member
Mrs. Sahondra Ratovonarivo
Chairman (resigned
effective July 21, 2016) 2 X X - -
Mr. Frédéric Coppin
Chairman (appointed
effective July 21, 2016) 2 - - X X
Mrs. Yetunde Ilori Member 4 X X - -
Mr. Kunle Ahmed Member 4 X X X XMr. Tosin Runsewe Member 3 - X X X
The Board Investment and Finance Committee is responsible for the approval of investment decisions and portfolio limits by Management of the
Company. This Committee shall have supervisory functions over investment and other finance-related issues such as capital & funding requirements.
The Committee met four (4) times during the year under review:
Name
11-May-16
The main functions of the Committee shall be to approve all investment above the limit of the management. Where it is not expedient for the members
of the committee to meet, an investment approval can be obtained through circularization of the approval. The Committee is also responsible for the
review and approval of the investment manual on a periodic basis and to further identify specific areas for review as approved by the Board, in particular
the financial implications of new and major investment strategies/initiatives.
The Committee shall make recommendations of investment policies for consideration and adoption by the Board, including proposed ethical positions
with respect to appropriate investments and shall conduct a review of the performance of the major assets in the company’s investment portfolios on a
quarterly basis.
Composition
Meetings
attended 10-Feb-16 20-Jul-16
Meetings
attended 11-Feb-16
This Committee will have supervisory functions over risk management, the risk profile, the enterprise-wide risk management framework, underwriting
functions of the Company and the risk-reward strategy determined by the Board
The Committee is also charged with the review of large underwritten risks for adequacy of reinsurance and other risk management techniques including
environmental & social management system
The main functions of the Committee shall be to assist in the oversight of the review and approval of the Company’s risk management policy including
risk appetite and risk strategy; to oversee management’s process for the identification of significant risks across the company and the adequacy of
prevention, detection and reporting mechanisms
6-Dec-16
7-Dec-16
The Board Risk Management and Technical Committee comprised the following members during the year under review;
21-Jul-16Composition 11-May-16
The Committee met four (4) times during the year under review:
Name
16

AXA Mansard Insurance plc. and Subsidiary Companies
(iv) Board Governance, Remuneration, Establishment and General Purpose Committee
1. Mrs. Karima Silvent Non Executive Director Chairman (became member effective July 21,2016)2. Mr. Sola Adeeyo Non Executive (Independent) Director Member (resigned effective July 21,2016)3. Mr. Ohis Ohiwerei Non Executive (Independent) Director Chairman (appointed effective July 21,2016)
3. Mr. Frédéric Fléjou Non Executive Director Member
4. Mr. Tom Wilkinson Non Executive Director Member
Mrs. Karima Silvent Chairman 4 X X X X
Mr. Frédéric Fléjou Member 4 X X X X
Mr. Ohis Ohiwerei
Chairman (appointed
effective July 21, 2016) 1 N/A N/A N/A X
Mr. Tom Wilkinson Member 4 X X X X
Mr. Olusola Adeeyo Member 2 X X - -
Attendance at Board meetings
Mr. Victor Osibodu
(resigned as Non-Executive
Director on May 13, 2016) Chairman 2 X X - -
Mr. Olusola Adeeyo
(Nominated as Chairman on
May 13, 2016) Director 4 X X X X
Mrs. Yetunde Ilori Director 4 X X X X
Mr. Tosin Runsewe Director 4 X X X X
Mr. Jad Ariss Director 4 X X X X
Mrs. Karima Silvent Director 3 X - X X
Mrs. Sahondra Ratovonarivo
(resigned effective July 21,
2016) Director 2 X X - -
Mr. Kunle Ahmed Director 4 X X X X
Mr. Frédéric Fléjou Director 4 X X X X
Mr. Frédéric Coppin
(appointed effective July 21,
2016) Director 2 X X - -
Mr. Lesley Ndlovu Director 4 X X X X
Mr. Tom Wilkinson Director 4 X X X X
Mr. Ohis Ohiwerei
(appointed effective July 21,
2016) Director 1 N/A N/A N/A X
Annual Board Appraisal
The Committee met four (4) times during the year under review:
Name Composition
Meetings
attended 12-Feb-16 12-May-16 6-Dec-16
The table below shows the frequency of meetings of the Board of Directors for the year ended December 31, 2016. The Board met four (4) times during
the year under review:
Name of Director Composition
Meetings
attended 11-Feb-16 13-May-16 21-Jul-16 8-Dec-16
The Code of Corporate Governance for the Insurance Industry recognizes the fact that the good corporate governance framework must be anchored on
an effective and accountable Board of Directors whose performance is assessed periodically. The annual appraisal would be conducted at the end of the
financial year, as well as the Company’s compliance status with the provisions of NAICOM.
21-Jul-16
The Committee shall have supervisory functions over the whole company, recruitment and ensuring corporate governance compliance. The main
functions of the Committee shall be to establish the criteria for board and board committee memberships, review candidates qualifications and any
potential conflict of interest, assess the contribution of current directors in connection with their re-nomination and make recommendations to the
Board.
The Committee shall further ensure that a succession policy and plan exist for the positions of Chairman, CEO/MD, the executive directors and the
subsidiary managing directors for Group companies. The Board Governance, Remuneration, Establishment & General Purpose Committee comprised
the following members during the period under review;
17
AXA Mansard Insurance plc. and Subsidiary Companies
Shareholders
Protection of Shareholders' Rights
Communication policy
The principles that guide the Company’s information dissemination include the following;
Independent advice
Insider trading and price sensitive information
Securities Trading Policy
· Feedback: The Company actively and regularly seeks feedback on its image and communication activities both from the media as well as from its key
target groups. This feedback is used in future activities.
The Company is clear in its prohibition of insider trading by its Board, Management, Officers and related persons who are privy to confidential price
sensitive information. Such persons are further prohibited from trading in the Company’s securities where such transactions would amount to insider
trading.
The Board of Directors are at their own discretion and at the Company’s expense required to seek Independent professional advice when required to
enable a Member of the Board effectively perform certain responsibilities.
In order to reach its overall goal on information dissemination, the Company is guided by the following principles, legislation and codes of corporate
governance of the jurisdictions within which it operates. These include the Insurance Act, the NAICOM Operational Guidelines, the Companies and
Allied Matters Act (CAMA) and the codes of Corporate Governance issued by NAICOM and SEC.
The website also has an Investors' Relations portal where the company’s annual reports and other relevant information about the company is published
and made accessible to its shareholders, stakeholders and the general public.
· Clarity: The Company aims at clarity, i.e. to send uniform and clear messages on key issues.
The General Meeting of the Company is the highest decision making body of the Company. The Company is driven by its desire to deliver significant
returns on its shareholders investment. The shareholders have an opportunity to express their concerns (if any) and opinions on the Company’s financial
results and all other issues at the Annual General Meeting of the Company. The Meetings are conducted in a fair and transparent manner where the
regulators are invited such as The National Insurance Commission, the Securities and Exchange Commission, Corporate Affairs Commission, the
Auditors as well as other Shareholder’s Association. To ensure timely and effective communication with shareholders on all matters of the Company,
the Investor Relations Unit deals directly with all enquiries from shareholders and it is communicated to Management and the Board. The Company also
dispatches its annual reports, providing highlights of all the Company’s activities to its shareholders.
The Board ensures the protection of the statutory and general rights of shareholders at all times, particularly their right to attend and vote at general
meetings. All shareholders are treated equally, regardless of volume of shareholding or social status.
· Transparency: The Company strives in its communication to be as transparent and open as possible while taking into account the concept of
confidentiality between the Company, its customers and company secretary. This contributes to maintaining a high level of accountability.
· Cultural awareness: The Company operates in a multicultural environment and accordingly recognizes the need to be sensitive to the cultural
peculiarities of its operating environment.
It is the responsibility of Executive Management under the direction of the Board, to ensure that the Board receives adequate information on a timely
basis, about the Company’s businesses and operations at appropriate intervals and in an appropriate manner, to enable the Board to carry out its
responsibilities. Furthermore, the Board and Management of the Company ensures that communication and dissemination of information regarding the
operations and management of the Company to shareholders, stakeholders and the general public is timely, accurate and continuous, to give a balanced
and fair view of the Company’s financial and non-financial matters. Such information, which is in plain language, readable and understandable, is
available on the Company’s website, www.axamansard.com.
Directors, insiders and related parties are prohibited from disposing, selling, buying or transferring their shares in the Company for a period
commencing from the date of receipt of such insider information until such a period when the information is released to the public or any other period as
defined by the Company from time to time.
The Company adopted and implemented a Securities Trading Policy which is applicable to all Directors and Employees. The policy has been circulated
to all Directors and employees and can found on the Company’s Website, www.axamansard.com
· Efficiency: The Company uses modern communication technologies in a timely manner to convey its messages to its target groups. The Company
responds without unnecessary delay to information requests by the media and the public.
18
AXA Mansard Insurance plc. and Subsidiary Companies
Management committees
The Company has 2 Committees which comprises of management staff.
The Secretary to the Committees is the Company Secretary.
Monitoring compliance with corporate governance
i) Chief Compliance Officer
ii) Whistle blowing procedures
Code of professional conduct for employees
Complaints Management Policy
Internal management structure
The MUIC also ensures that risk investment limits as contained in the Board Investment and Finance manual are complied with at all times. They
provide inputs from the Board Committee and also ensure that recommendations of the Board Committees are effectively and efficiently implemented.
The Management Committee (MC) is the Committee set up to identify and make recommendations on strategies that will aid the long term objectives of
the Company. Whilst the Management Underwriting and Investment Committee (MUIC) was initiated to analyze the risks the Company is underwriting
at any given period.
The Group operates an internal management structure where all officers are accountable for duties and responsibilities attached to their respective
offices and there are clearly defined and acceptable lines of authority and responsibility.
The Group had an internal Code of Professional Conduct, which all members of staff are expected to subscribe to upon assumption of duties. Staff is
also required to reaffirm their commitment to the Code annually. All members of staff are expected to strive to maintain the highest standards of ethical
conduct and integrity in all aspects of their professional life as contained in the Code of Professional Conduct which prescribes the common ethical
standards, culture and policies of the Group relating to employee values.
In line with the Group’s commitment to instill the best corporate governance practices, a whistle blowing procedure was established that ensures
anonymity on any reported incidence(s). The Group has a dedicated e-mail address for whistle-blowing procedures.
The Chief Compliance Officer monitors compliance with money laundering requirements and the implementation of the Corporate Governance Code of
the Company. The Chief Compliance Officer together with the Chief Executive Officer certifies each year to NAICOM and SEC that they are not aware
of any other violation of the Corporate Governance Code, other than as disclosed during the year.
In accordance with the rules and regulations of The Securities & Exchange Commission, the Company adopted and implemented a Complaints
Management Policy which is a platform that addresses complaints arising out of issues that are covered under the Investments and Securities Act, 2007
(ISA) by the Company’s shareholders
The Complaints Management policy was designed to handle and resolve complaints from all shareholders of the Company. The policy was endorsed by
the Company’s senior management, who would also be responsible for its implementation and monitoring of compliance.
A copy of the Complaints Management Policy shall be made available for inspection to shareholders of the Company at the Annual General Meeting of
the Company. The policy can found on the Company’s Website, www.axamansard.com
An annual appraisal of the duties assigned and dedicated to each person is done by the first quarter of the preceding year.
Both Committees meet frequently as necessary to immediately take action and decisions within the confines of their powers.
19

AXA Mansard Insurance plc. and Subsidiary Companies
Share capital history
Date Authorized increase CumulativeIssued (N)
Increase
Cumulative
(N)
1989 - 34,300,000 - 17,150,000
1998 6,346,000 40,646,000 3,173,000 20,323,000
1999 5,978,000 46,624,000 2,989,000 23,312,000
2000 706,000 47,330,000 353,000 23,665,000
2002 152,798,000 200,128,000 76,399,000 100,064,000
2004 799,872,000 1,000,000,000 399,936,000 500,000,000
2006 4,746,440,954 5,746,440,954 2,373,220,477 2,873,220,477
2006 3,938,744,509 9,685,185,463 1,969,372,254 4,842,592,731
2007 314,814,537 10,000,000,000 157,407,269 5,000,000,000
*2007 (5,000,000,000) 5,000,000,000 (2,500,000,000) 2,500,000,000
2008 3,750,000,000 8,750,000,000 1,875,000,000 4,375,000,000
2009 1,250,000,000 10,000,000,000 625,000,000 5,000,000,000
2010 - 10,000,000,000 - 5,000,000,000
2011 - 10,000,000,000 - 5,000,000,000
2012 - 10,000,000,000 - 5,000,000,000
2013 500,000,000 10,500,000,000 - 5,000,000,000
2014 - 10,500,000,000 250,000,000 5,250,000,000
2015 - 10,500,000,000 - 5,250,000,000
2016 - 10,500,000,000 - 5,250,000,000
The Company’s issued and fully paid share capital was reconstructed by a special resolution of the Board at its meeting on the 18th of October, 2007, to
achieve a reduction of 50% with the result that the issued and fully paid share capital will stand at N2,500,000,000 divided into 5,000,000,000 Ordinary
shares at 50k each with the surplus nominal value arising from the reconstruction being transferred to the Company’s capital reserve account. The
reconstruction was sanctioned by the Federal High Court of Nigeria, Lagos on 31st October 2007 and registered by the Corporate Affairs Commission
on the 18th of December 2007.
As at 31 December 2016, the Company’s Authorized capital was N5, 250,000,000 divided into 10,500,000,000 Ordinary shares of 50k each, While the
issued capital was N5,250,000,000 divided into 10,500,000,000 ordinary shares of 50 kobo each. The initial share capital upon incorporation and
subsequent changes therein are as follows:
An annual appraisal of the duties assigned and dedicated to each person is done by the first quarter of the preceding year.
20
AXA Mansard Insurance plc. and Subsidiary Companies
Risk Management
Our Guiding Principles
- The Company will institute a sustainable risk culture enterprise-wide.
Risk Management Framework
1st line – Risk Owners
2nd line – Risk Control
3rd line – Risk assurance
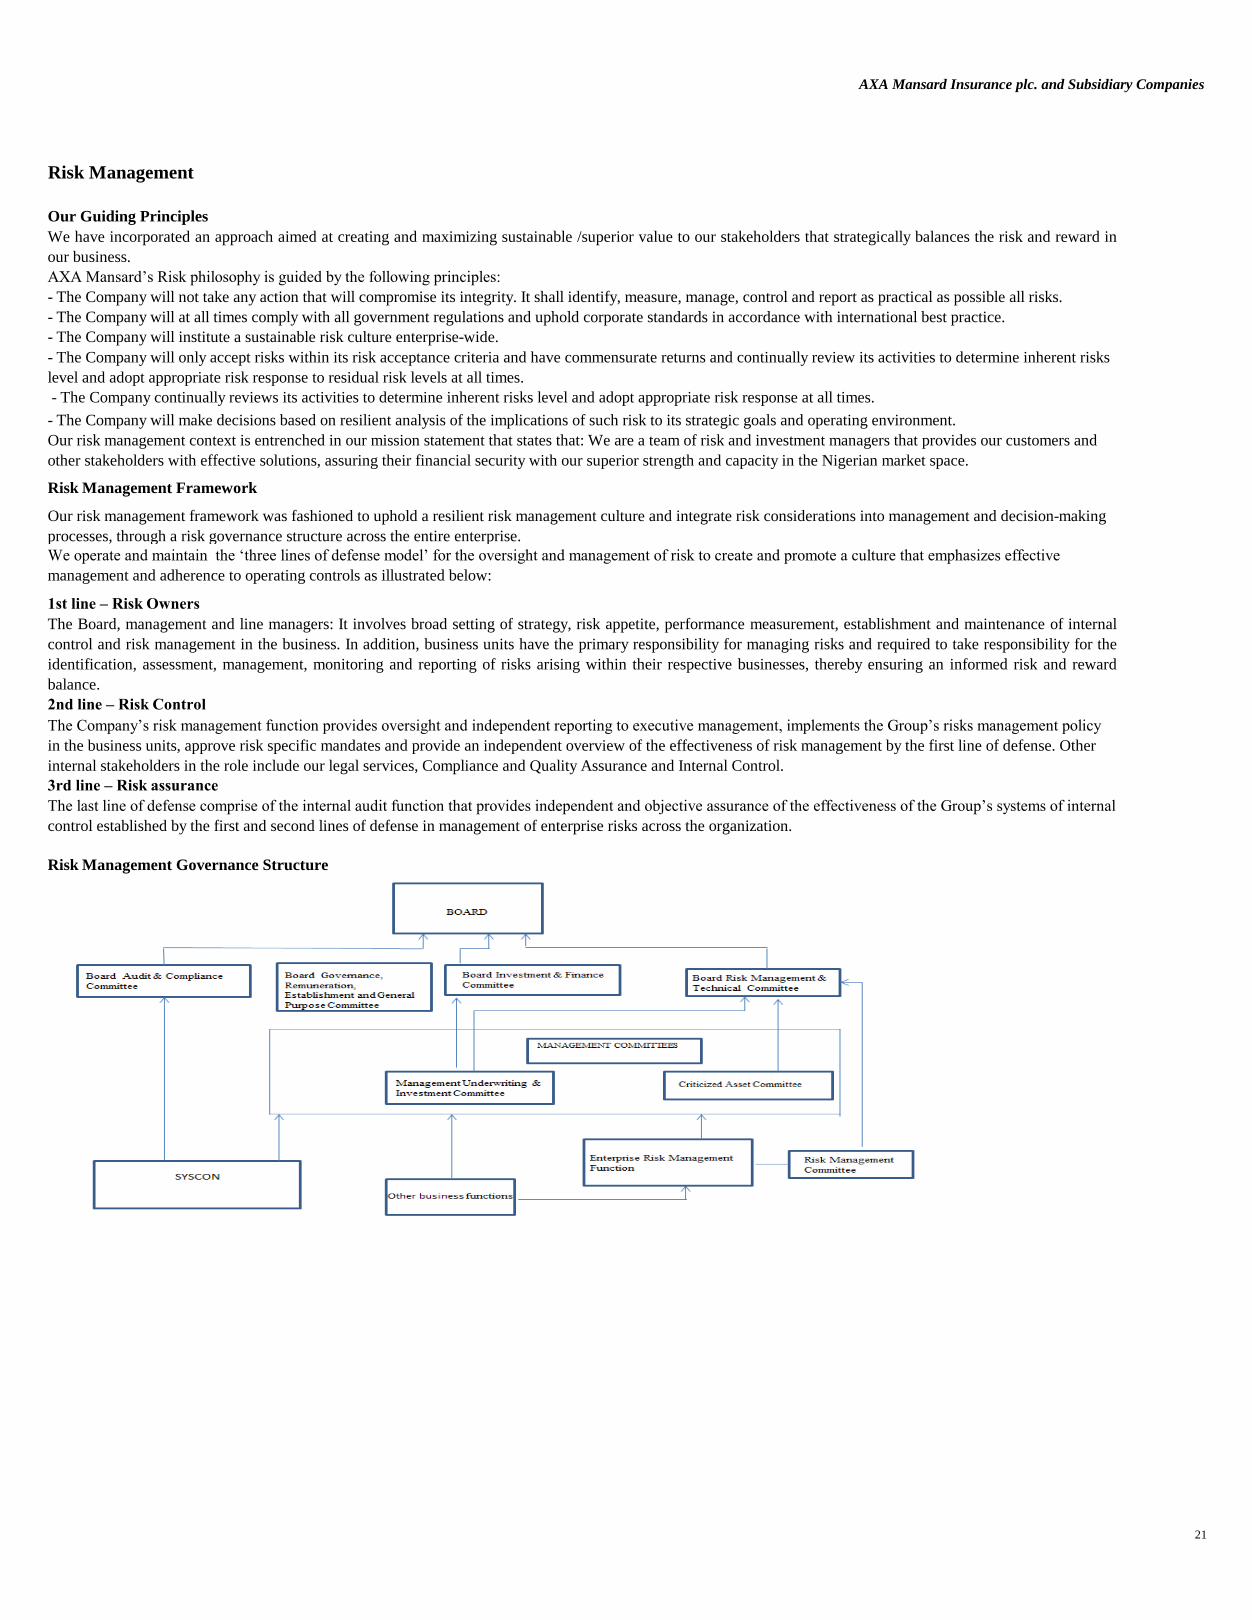
Risk Management Governance Structure
We have incorporated an approach aimed at creating and maximizing sustainable /superior value to our stakeholders that strategically balances the risk and reward in
our business.
The last line of defense comprise of the internal audit function that provides independent and objective assurance of the effectiveness of the Group’s systems of internal
control established by the first and second lines of defense in management of enterprise risks across the organization.
AXA Mansard’s Risk philosophy is guided by the following principles:
- The Company will not take any action that will compromise its integrity. It shall identify, measure, manage, control and report as practical as possible all risks.
- The Company will at all times comply with all government regulations and uphold corporate standards in accordance with international best practice.
- The Company will only accept risks within its risk acceptance criteria and have commensurate returns and continually review its activities to determine inherent risks
level and adopt appropriate risk response to residual risk levels at all times.
- The Company will make decisions based on resilient analysis of the implications of such risk to its strategic goals and operating environment.
Our risk management context is entrenched in our mission statement that states that: We are a team of risk and investment managers that provides our customers and
other stakeholders with effective solutions, assuring their financial security with our superior strength and capacity in the Nigerian market space.
We operate and maintain the ‘three lines of defense model’ for the oversight and management of risk to create and promote a culture that emphasizes effective
management and adherence to operating controls as illustrated below:
The Board, management and line managers: It involves broad setting of strategy, risk appetite, performance measurement, establishment and maintenance of internal
control and risk management in the business. In addition, business units have the primary responsibility for managing risks and required to take responsibility for the
identification, assessment, management, monitoring and reporting of risks arising within their respective businesses, thereby ensuring an informed risk and reward
balance.
The Company’s risk management function provides oversight and independent reporting to executive management, implements the Group’s risks management policy
in the business units, approve risk specific mandates and provide an independent overview of the effectiveness of risk management by the first line of defense. Other
internal stakeholders in the role include our legal services, Compliance and Quality Assurance and Internal Control.
Our risk management framework was fashioned to uphold a resilient risk management culture and integrate risk considerations into management and decision-making
processes, through a risk governance structure across the entire enterprise.
- The Company continually reviews its activities to determine inherent risks level and adopt appropriate risk response at all times.
21

AXA Mansard Insurance plc. and Subsidiary Companies
COMMITTEES FUNCTIONS
- Oversight of financial reporting and accounting
- Oversight of the external auditor
- Oversight of regulatory compliance
- Monitoring the internal control process
- Oversight of risk management
Board Risk Management & Technical
Committee
- Review the adequacy and effectiveness of risk management and controls
- Reviews and approves the company’s investment policy
- Approves investments over and above managements’ approval limit
- Ensures that optimum asset allocation is achieved
Integration of Risk Management Functions: Our Approach
Risk appetite
Risk categorization
- Review of the company’s compliance level with applicable laws and regulatory requirements that may
impact the company’s risk profile
b) Utilize risk control to ensure risk guidelines and policies approved by the board are adhered to;
c) Champion the growth of Risk culture and awareness ; and
Lack of risk diversification, for instance, in terms of type and amount of risk, geographical location and type of industry covered increases the probability of insurance
risks.
The risk in any insurance contract is the possibility that the event insured against occurs, resulting in a claim. This risk is very random and unforeseeable.
- Review changes in the economic and business environment, including emerging trends and other factors relevant to
the company’s risk profile- Review large underwritten risks for adequacy of reinsurance and other risk management techniques including
environmental & social management system
- Review and recommend for approval of the Board risk management
Board Finance and Investment Committee
The fundamental risk the Group faces under its insurance contracts is that the actual claims and benefit payments exceed the provision (reserves) for insurance
liabilities. This could occur if the frequency or severity of claims and benefits are greater than estimated. Insurance events are random hence; the actual number and
amount of claims and benefits will vary from year to year from the level established using statistical techniques.
The remit of the setting the organization’s risk appetite and approving the strategy for managing risk and organization’s system of internal control in the overall directly
lies with the Board of Directors. The implementation of this principal function is carried out via its Board Committees as enumerated below:
Insurance Risk
The Group recognizes that its continual sustainability initiative is largely contingent upon brand protection and enhancement of stakeholder value. Our ethos therefore
mandates that the Group is averse to risks that essentially erode corporate value.
The Group’s risk appetite is primarily characterized by a clear risk strategy, monitoring and reporting procedure that provides the foundation to identify potential
deviations from our risk tolerances in a timely manner across the enterprise, which is underpinned by our top-down risk management approach.
The Board recognizes that the practice of risk management is critical to the achievement of corporate objectives and has actively encouraged a risk culture that
embraces innovation and opportunity, primed risk-taking and acceptance of risk as inherent in all our activities, whilst reducing barriers to successful implementation.
We constantly bear in mind that the nature of risk is dynamic and pervasive in our business and the responsibility is that of all, hence we have created a structured
Insurance Risk
d) Lead an enterprise-wide risk dialogue by instigating risk discussions in a variety of fora.
The Risk Managment Commiittee (RMC) of the Company provides recommendation to the Board Risk Management and Technical Committee on risk issues for the
latter to assess and possibly approve in accordance with the company’s objectives of aligning risk appetite and strategy.The Board Risk Management and Technical Committee approves the Company’s risk appetite annually on the basis of robust assessment of risks that incorporates the
prudent decision making of risk and reward trade-offs. The Board is also responsible for evaluating strategic alternatives, setting related objectives, and developing
mechanisms to manage related risks establishing, documenting, and enforcing all policies that involve risk. The Chief Risk Officer (a member of this Committee) is
responsible for implementing these strategies.
The role of the Chief Risk Officer (CRO) includes informing the Board as well as the Management Committee about the risk profile of the Company and also
communicates the views of the Board and Senior Management to the entire Company.
The Risk Management policies and procedures instituted are strategically aimed at managing potential, inherent and residual risk categories inherent in our operations.
The Group is exposed to a myriad of risks in the conduct of its business some of which are Insurance Risk, Financial (Market, Credit, Liquidity) Risk, Operational
Risk, Reputational Risk, Emerging Risk, Environmental & Social Risk amongst others including Business continuity and Crisis management.
Our structured approach to managing risks is evident in the integration of the risk management function; which is charged with the responsibility of undertaking risk-
based audit on all business units using outputs of the annual company-wide risk assessment to guide its annual audit program. A quarterly assessment exercise is
conducted by this unit and a rated score expressed in percentage is applied to measure the level of compliance.
Audit Committee
- Assist in the oversight of the review and approval of the companies risk management policy including risk appetite
and risk strategy.
- Oversee management’s process for the identification of significant risks across the company and the adequacy of
Our insurance underwriting strategy has been improved in such a way that it diversifies the various types of insurance risks that might affect a sufficiently large
population of risks to reduce the chances of having inconsistent expected outcome significantly.
The Risk Management function of the company is primarily responsible for coordinating the company’s cross functional response to risks. Other functions include:
a) Drive an enterprise–wide process to aggregate risk exposures, produce risk reports and institute mitigation strategies;
22
AXA Mansard Insurance plc. and Subsidiary Companies
· Non life business
· Life business
Non life business
a) Frequency and severity of claims
Basic Chain Ladder method (BCL)
I.e. IBNR = Ultimate claim amount (excl. extreme large losses)
minus paid claims to date
minus claims outstanding (excl. extreme large losses)
Loss Ratio method
The IBNR is then calculated as:
Expected average ultimate annual loss ratio
Multiplied by earned premium for the past 12 months
Minus experience to date over the past 12 accident months
d) Sensitivity Analysis
Life & Savings
(a) Frequency and severity of claims
(b) Sources of uncertainty in the estimation of future benefits payments and premium receipts
(c) Valuation methods
Insurance risk can be classified into two main businesses namely:
These include the non-life contracts namely; Aviation, Oil & Gas (Energy), Engineering, Fire, General Accident, Motor, Marine Cargo & Hull
The frequency and severity of claims can be affected by several factors. The most significant are the increasing level of reimbursment for the damages suffered as a
result of road accidents. The Group manages these risks through its underwriting strategy, adequate reinsurance arrangements and proactive claims handling and
investigations. Underwriting limits are in place to enforce appropriate risk selection criteria.The reinsurance arrangements include treaty and excess of loss coverage, it
helps to mitigate the Group's risk of total net insurance losses, increases our underwriting capacity,reduces our exposures to catastrophic risk and gives us an
opportunity of benefit from the reinsurers' expertise.
b) Sources of uncertainty in the estimation of future claim payments
Claims on non-life insurance contracts are payable on a claims-occurrence basis. The Group is liable for all insured events that occurred during the term of the contract.
There are several variables that affect the amount and timing of cash flows from these contracts. These mainly relate to the inherent risks of the business activities
carried out by individual contract holders and the risk management procedures adopted. The reserves held for these contracts comprises a provision for IBNR, a
provision for reported claims not yet paid and a provision for unearned premiums at the end of the reporting period.
c) Process used to decide on assumptions
Depending on the volume of data in the reserving classes, the appropriate methodologies were used. Two methods were used for the projection of claims. The Basic
Chain Ladder Method (BCL) and a Loss ratio method, adjusted for assumed experience to date. In more recent years and where the claim development seems slower
than in the past, the Bornheutter – Ferguson Method was used based on expected loss ratios.Claims data was grouped into triangles by accident year, half-year or
quarter and payment year, half-year or quarter. The choice between quarters, half-years or years was based on the volume of data in each segment. Payment
development patterns were used instead of the reporting year patterns to allow for the longer tail development that would be seen in payment/settlement delays as well
as to allow for the movement of partial payments in the data.
Development factors were calculated using the last 3 to 9 years’ of data by accident period. Ultimate development factors are calculated for each of the permutations
and judgment is applied in the selection of these factors. Ultimate development factors are applied to the paid data per accident half-year (or quarter) and an ultimate
claim amount is calculated. The future claims (the ultimate claim amount less paid claims to date) are allocated to future payment periods in line with the development
patterns calculated above. The outstanding claims reported to date are then subtracted from the total future claims to give the resulting IBNR figure per accident half-
year (or quarter).
For two of the classes, namely, Aviation and Oil & Energy, there was limited data. A BCL method was therefore inappropriate. We allowed for expected experience to
Sensitivity analyses are performed to test the variability around the reserves that are calculated at a best estimate level. The estimated claim amounts can never be an
exact forecast of future claim amounts and therefore looking at how these claim amounts can vary can provide valuable information for business planning and risk
appetite considerations. A sensitivity analysis was done to determine how the IBNR reserve amount would change if we were to consider the 75th-90th percentile as
opposed to the best estimate figures included in reserve reviews as at 31 December 2016.
This includes the Group Life, Annuities ,Credit Life
For contracts where death is the insured risk, the most significant factors that could increase the overall frequency of claims are terminal diseases or widespread
changes in lifestyle, such as eating, smoking and exercise habits as well as adverse changes in the socio-political climate resulting in earlier or more claims than ideally
expected. For contracts where survival is the insured risk, the most significant factor is continued improvement in medical science, human behaviour and social
conditions that would increase longevity.
Uncertainty in the estimation of future benefit payments and premium receipts for life insurance contracts arises from the unpredictability of long-term changes in
overall levels of mortality and the variability in contract-holder behavior.The Group uses appropriate and acceptable base tables of standard mortality according to the
type of contract being written. There is also a plan to develop a Nigerian mortality table in the 2017.
Our management team establishes structures, reporting lines and appropriate authorities and responsibilities in the pursuit of the company’s strategic objectives. The
internal audit function reports on development and performance of internal control to the Board Audit Committee on a quarterly basis which demonstrates Board
oversight and independence of management.
Annuities will be reserved for using a discounted cash flow approach. Here reserves are set equal to the present value of future annuity payments plus expenses, with
allowance being made for any guaranteed periods as required.
23

AXA Mansard Insurance plc. and Subsidiary Companies
Reinsurance Agreements
BROAD RISK CATEGORY RISK CONTROLS MEASURES
Insurance risk
Mortality/Longevity risks Improvement factors on mortality table consistent with portfolio experience
Pricing risk Segmented tariff
Underwriting risk Policy and underwriting governance and guidelines/underwriting limits
Under reserving risk Follow up on Boni/Mali
Catastrophe risk Follow up on catastrophe events
Reinsurers treaty agreement Regular review of reinsurance treaty agreement
Market risk Investment approval limits
Policy on volume and quality of investment assets
Counter party placement limits. Asset allocation limits etc.
Operational risk Clear policy on recruitment
Tolerance limits for errors and breaches and operational threats Business Continuity Policy
Service level consultations Loss event reporting
Information security policy etc.Credit risk Counter party financial analysis - Credit rating
Liquidity risk Policy on quality of liquid assets.
Minimum operating liquid level etc.
INTERNAL REPORTS
Quarterly Board Investment/Insurance Report
Quartely Gap Analysis Report
Key Risk Indicator Report
Loss Data Report
Market Risk
2) Downgrade Risk: risk that changes in the possibility of a future default by an obligor will adversely affect the present value of the contract with the obligor today.
3) Settlement Risk: risk arising from the lag between the value and settlement dates of securities' transactions.
In a bid to ensure that the company is not negatively impacted by inherent risks in its business activity, we continually identify, monitor and review our portfolios
/business operations on a regular basis. Some of the internal reports of the Risk Mangament team are listed below:
• Property price risk: The Company’s portfolio is subject to property price risk arising from changes in the valuation of properties.
Credit risk
Three (3) notable areas of exposure to credit risks include:
The four (4) risk exposures to Market risks arise through the following:
• Equity price risk: represents the potential risk of loss in our investment in stocks, occasioned by volatility in the stock market
This risk arises from the default of a counterparty to fulfill its contractual obligation. Being an Insurance company; non-remittance of premium after the required thirty
(30) days period available to Insurance Brokers as stipulated by NAICOM’s premium collection and remittance guidelines . The possibility of default by counterparties
on investments placed with corporate and government entities, could result in cash flow shortages.
1) Direct Default Risk: is the risk of exposure a company may experience due to non-payment of investment receipts or cash flow on assets at an agreed time by an
obligor following a contractual agreement to do so. This type of risk could also arise from failure of registered Insurance Broker’s to remit premiums to the company to
the company after the permissible thirty days (30) grace period, as mandated by NAICOM.
• Foreign exchange risk: potential risk of loss of an asset value held in foreign currency due to changes in currency exchange rates.
Reinsurance is allowed for in the valuation by having gross and reinsurance ceded records in the policy files. For IFRS compliance purposes all reserves were reported
gross of reinsurance, with the value of the reinsurance asset calculated and reported separately.
At AXA Mansard Insurance Plc, Risk Management is performed at all levels and at various stages within business processes, and over the technology environment. It
forms an integral part of the Company’s daily operations through established policies and procedures to help ensure that management’s directives to mitigate risks to
the achievement of strategic objectives are carried out. Our risk activities are structured to mitigate risk exposures from identified broad risk categories as illustrated
below:
OBJECTIVES
Shows the performance of the company and reviews the profitability of all aspects of the
company's operation.
Monthly Investment Risk Report Informs management on Company’s exposure to market, credit and liquidity risks.
Weekly Investment Risk Report Monitors and informs management on Company’s asset allocation, exposure to sectors of
the economy, market/investment, credit and liquidity risks, breaches in regulatory limits
Analyse the gap duration and sensitivity testing for our assets & liabilities
Monitors the effectiveness of existing operational controls and the Company’s operational
risk profile. To quantify operational risk and to identify sensitive areas of activity in order to put in
place appropriate controls
This is the risk that the value of financial instrument in general will change due to moves in the market factors. Such movements may be occasioned market factors
(volatilities) that directly related to an individual investment and/or systemic risks.
• Interest rate risk: the potential risk that the value of fixed income assets will plummet owing to movements in market interest rates.
24
AXA Mansard Insurance plc. and Subsidiary Companies
Liquidity risk
Operational risk
Operational Risk Management
Health and Safety Management
Reputational risk
Underwriting risk
The characteristic nature of our business requires adequate cash flow to meet our contractual obligations in the event of claim settlement. This is the risk of loss arising
due to insufficient liquid assets to meet cash flow requirements or to fulfill its financial obligation once claims crystallize. Our exposure to liquidity risk comprises of:
A Health and Safety Management system has been institutionalized to provide and maintain safe and healthy working environment and conditions for all staff. This
responsibility also extends to visitors, contractors and others who may potentially be affected by our activities or present within our business premises .The Health and
Safety Policy framework underpins the policy statements, roles and responsibilities of HSE officer, First Aid services, Safety Marshalls/Deputies and emergency
procedures, etc.
Underwriting risks relates to risks that premiums charged are inadequate to cover the claims the company is legally obliged to pay. Furthermore, it is essential that those
premiums match to the return on the company’s capital. Underwriting risk may either arise from an inaccurate assessment of the risks entailed in writing an insurance
policy, or from factors wholly out of the underwriter's control.
Underwriting risks may arise through the following ways:
• Inadequate premium pricing vis a vis the risk insured against;
• Inappropriate reinsurance arrangements;
• Inadequate claims reserves- the number of claims that occur may be higher than expected claims.
• Moral hazard of policyholders which may result in adverse claims experience.
Underwriting risks form an integral part of our business. While we recognize that it is not practicable to eliminate all risks underwritten completely, we continually
strive to leverage on managing this type of risks as a mitigation strategy because we believe that the continual profitability of our underwriting competencies, is a
reflection of strategies employed in risk decision making which is in conformity with our risk appetite.
Risk Maps: Risk maps typically are graphs on which impact of each risk is plotted against probability of occurrence. Risk maps are designed either to show inherent or
residual risk categories by line of business. High-frequency/high-severity risks need to be monitored closely to reduce the Group’s exposure to losses.
Key Risk Indicators: Key Risk Indicators are defined to provide early warnings indicators, data is collected in an easy and meaningful way that allows preventine
actions to be taken. It may also measure the accumulation of conditions that may favor emergence of potential risks thus the Key Risk Indicator (KRI) provides a
veritable tool for early identification of increasing risk exposure and /or deviations concerning inherent risk of business units. The KRI dashboard represents a snap-
shot of risk events essential for effective monitoring and control of risks, in conformity with the Enterprise’s risk appetite.
Loss Data Collection: This tool represents a primary resource for risk reporting and data collection. We have leveraged on our technological infrastructure to develop
an application for the collection of potential/actual risk events. Events (inclusive of near-misses) upto a predeternimned threshold are analysied for cause, category,
impact and correlation effect across the business.
2) Market (Asset) Liquidity Risk: risk of loss which is occasioned by the incapacity to sell assets at or near their carrying value at the time needed.
This is risk of loss resulting from inadequate or failed processes, people (human factors) and systems or from external events.
Operational risks represents risks loss arising from inadequate or failed internal processes, or from personnel and systems, or from external events. In line with best
practices, a number of tools employed in managing these risks are enumerated as follows:Risk Identification: The Risk Identifiation is a critical tool applied to identify, assess, quantify and mitigate operational risks across the enterprise. The exercise
constitutes a fundamental element of the overall operational risk framework, to assess risks using a pre-defined measurement grid for the ferquency assessment and
severity assessment of each risk identified. The profile of risks across the organization is an integral input for the Group’s internal audit whilst preparing for audit
plans.
The risk that an event will negatively influence stakeholders’ perception or threaten to violate public trust in our brand. We firmly appreciate that Stakeholders are
crucial to the success of our business and we are committed to continually conduct our business in an affirmative manner that facilitates building sustainable
relationships with our stakeholders.
1) Funding (Cash-flow) Liquidity Risk: These risks arise from investment-linked products especially in circumstances where there are liquidity constraints to meet
financial obligations to customers.
25
AXA Mansard Insurance plc. and Subsidiary Companies
Reputational Risk Management
The Group recognizes that in extreme cases, black swan events could result in significant reputational damage. It is to this end, that the Group maintains a top-down
approach to managing its potential and actual corporate culture and values against untoward events that may erode its brand value. Our reputation management
objectives are two-fold; to proactively manage and reactively protect and leverages on a strong internal stakeholders collaboration between Legal, Compliance and
Quality Assurance, Risk Management and Brand Management & Corporate Communications.
Legal risks include but not limited to exposure to fines, penalties or punitive damages resulting from supervisory actions, as well as private settlements.
Business Continuity & Crisis Management (CMBC):
The Business Continuity Framework has been designed to ensure continous availability of processess and delivery of products and services at acceptable predefined
levels in the event of a disaster or disruption to critical operations.
The Crisis Management Plan (CMP) ensures that AXA Mansard has the capacity to prepare for, anticipate, respond to and recover from crisis as a result of a serious
incident that immediately prevents, or threatens the continuity of business operations and the delivery of our key products and services.
The CMBC policy reinforces the unequivocal commitment of all internal stakeholders of AXA Mansard towards CM & BC processes.
26

AXA Mansard Insurance plc and Subsidiary Companies
Management’s Discussion and Analysisfor the year ended 31 December 2016
Forward looking statements
Business strategy of the Company and overall performance
Operating results
(in thousands of Nigerian Naira)
Dec-16 Dec-15 %Chg Dec-16 Dec-15 %Chg
Gross premium written 20,713,129 16,574,614 25% 17,330,219 15,009,324 15%
Net premium income 10,949,138 9,904,934 11% 8,205,987 8,664,101 -5%
Underwriting profit 2,946,122 2,985,703 -1% 2,591,643 2,672,028 -3%
Investment income 6,391,238 4,597,916 39% 3,424,501 2,332,815 47%
Profit before tax 3,125,627 2,023,653 54% 1,263,787 689,232 83%
Profit after tax 2,634,996 1,662,181 59% 1,040,379 466,098 123%
Earnings per share (kobo) 20.00 11.81 69% 10.08 4.52 123%
This "Management discussion and analysis" (MD&A) has been prepared as at 31 December 2016 and should be read in
conjunction with the consolidated financial statements of AXA Mansard Insurance Plc and subsidiary companies.
The MD&A contains forward looking statements related to AXA Mansard Insurance Plc financial and other projections,
expected future plans, event, financial and operating results, objectives and performance as well as underlying assumptions all of
which involve risk and uncertainties. When used in this MD&A the words "believe", "anticipate", "intended" "estimate" and
similar expression are used to identify forward looking statements, although not all forward-looking statements contain such
words. These statements reflect management's current belief and are based on information available to AXA Mansard Insurance
Plc. and are subject to certain risk, uncertainties and assumptions. As a member of the AXA Group, consequent upon the
acquisition of 100% stake in Assur Africa Holdings Limited during the last financial year, AXA Mansard Insurance Plc is poised
to extending its corporate and retail coverage within the Nigerian insurance space and the wider Africa region.
The Company is registered and incorporated in Nigeria and is engaged in providing insurance and investment solutions to both
the corporate and retail sectors of Nigeria. It also aims to establish itself as the apex insurance company in Nigeria and the west
african region.
The Company's strategy is to use technology and international best practice to provide its customers with tailor made solutions,
superior services and specially designed programs to assist its patrons through a network of regional and agency offices spread
over Nigeria.
Group Parent
27

AXA Mansard Insurance plc. and Subsidiary Companies
(in thousands of Nigerian Naira)
Group Group Parent Parent
31-Dec-2016 31-Dec-2015 31-Dec-2016 31-Dec-2015
Profit before tax 3,125,627 2,023,653 1,263,787 689,232
(490,631) (361,472) (223,408) (223,134)
Profit after tax 2,634,996 1,662,181 1,040,379 466,098
Non Controlling Interest (570,382) (442,932) - -
Transfer to contingency reserve (451,887) (377,508) (451,887) (377,508)
Dividend paid 206,809 310,212 206,809 310,212
Earnings per share – Basic (in kobo) 20.00 11.81 10.08 4.52
Dividend per share - (in kobo) 2k 3k 2k 3k
Operating results
The following is a summary of the Group and Company’s operating results:
Taxation
Directors’ Report
for the year ended 31 December 2016
The Directors have pleasure in presenting their report on the affairs of AXA Mansard Insurance Plc (“the Company”) and its subsidiaries (“the
Group”), together with the consolidated and separate audited financial statements and the auditor’s report for the year ended December 31,
2016.
Legal form and principal activity
The Company was incorporated on 23 June 1989 as a private limited liability company called “Heritage Assurance Limited” and issued with a
composite insurance license by the National Insurance Commission in March 2004. The Company’s name was changed to Guaranty Trust
Assurance Limited in September 2004 following the acquisition of a majority share holding by Guaranty Trust Bank plc, and changed again to
Guaranty Trust Assurance Plc in March 2006 following the increase in number of members beyond the maximum required for a private
company. In November 2009, the Company became listed on the Nigerian Stock Exchange.
The beneficial ownership of the Company changed to Societe Beaujon S.A.S (AXA S.A) in December 2014 by the acquisition of 100% of
Assure Africa Holding (AAH). The Company modified its name and corporate identity to AXA Mansard Insurance plc in July 2015.
The principal activity of AXA Mansard Insurance Plc is the provision of life and general business risk management solutions and financial
services to corporate and retail customers in Nigeria.
AXA Mansard Investments Limited was incorporated as a private limited liability company on 9 January 2008 and its principal activity
involves provision of portfolio management services to both individual and corporate clients. AXA Mansard Health Limited was incorporated
as a private limited liability company on the 7th of August 2003 and its principal activities is to manage the provision of health care services
through health care providers and for that purpose accredited with the National Health Insurance Scheme. APD Limited was incorporated on 2
September 2010 for the purpose of leasing, holding and developing the Company's commercial property located at Plot 928A/B, Bishop
Aboyade Cole Street, Victoria Island, Lagos to an ultra modern office structure. AXA Mansard Pensions Limited was incorporated on 1
February 2005 as a private limited liability company. The Company’s name was changed to AXA Mansard Pensions Limited in June 2015
following the acquisition of the majority share holding of the Company by AXA Mansard Insurance plc. in January 2015. The Company’s
principal activity continues to be the administration and management of Pension Fund Assets in line with the provisions of the Pension Reform
Act and the relevant National Pension Commission circulars.
Dividends
During the year under review, the Directors declared and paid dividend in the sum of 2 Kobo (2015:3 kobo) per ordinary share on the issued
capital of 10,500,000,000 Ordinary Share of 50 kobo each (net of dividend on treasury shares) subject to the appropriate withholding tax
deduction.
The Company has two wholly owned and two partly owned subsidiaries: AXA Mansard Investments Limited, AXA Mansard Health Limited,
AXA Mansard Pensions Limited and APD Limited is a special purpose company.
28

AXA Mansard Insurance plc. and Subsidiary Companies
Directors’ Report
for the year ended 31 December 2016
Directors and their interests
31-Dec-2016 31-Dec-2015
Mr. Victor Gbolade Osibodu Chairman Resigned effective 18/5/2016 Nil Nil
Mr. Olusola Adeeyo Chairman Appointed effective 18/5/2016 Nil Nil
Mrs. Yetunde Ilori Chief Executive Officer 14,343,122 14,343,122
Mr. Tosin Runsewe Executive Director 127,035,800 121,035,800
Mr. Kunle Ahmed Executive Director 20,080,371 20,080,371
Mr. Frederic Flejou Non Executive Director Nil Nil
Mrs. Sahondra Ratovonarivo Non Executive Director Resigned effective 21/7/2016 Nil Nil
Mrs. Karima Silvent Non Executive Director Nil Nil
Mr. Frédéric Coppin Non Executive Director Appointed effective 21/7/2016 Nil Nil
Mr. Lesley Ndlovu Non Executive Director Nil Nil
Mr. Jad Ariss Non Executive Director Appointed effective 3/12/2015 Nil Nil
Mr. Tom Wilkinson Non Executive Director Nil Nil
Mr Ohis Ohiwerei Independent Director Appointed effective 21/7/2016 Nil Nil
Remuneration
13th month salary
Director fees
Travelling allowances
Sitting allowances
Directors’ interests in contracts
The Directors who held office during the year, together with their direct and indirect interests in the issued share capital of the Company as
recorded in the register of Directors shareholding and/or as notified by the Directors for the purposes of sections 275 and 276 of the
Companies and Allied Matters Act and the listing requirements of the Nigerian Stock Exchange are as follows:
Mr Victor Gbolade Osibodu and Mrs Sahondra Ratovonarivo resigned from the Board of the Company during the year.
Directors’ remuneration
Resignation of directors
Appointment of directors
Mr Frédéric Coppin and Mr Ohis Ohiwerei were appointed on the Company's Board of Directors during the year under review and their
appointment is subject to regulatory approvals.
Timing
Paid monthly
during the financial
year
Paid last month of
the financial year
Paid during the year
The remuneration of the Company’s Directors is disclosed pursuant to section 34(5) of the code of corporate governance for public companies
as issued by Securities and Exchange Commission (SEC) as follows:
Description
Basic salary Part of gross salary package for Executive Directors only.
Reflects the insurance industry competitive salary package and
the extent to which the Company’s objectives have been met for
the financial year
Part of gross salary package for Executive Directors only
Allowances paid to Non-Executive Directors
Allowances paid to Non-Executive Directors that reside outside
NigeriaAllowances paid to Non-Executive Directors only for sitting at
board meetings and other business meetings
In compliance with Section 277 of the Companies and Allied Matters Act of Nigeria, none of the directors has notified the Company of any
declarable interest in contracts deliberated by the Company during the year under review.
Paid during the year
Paid during the year
29
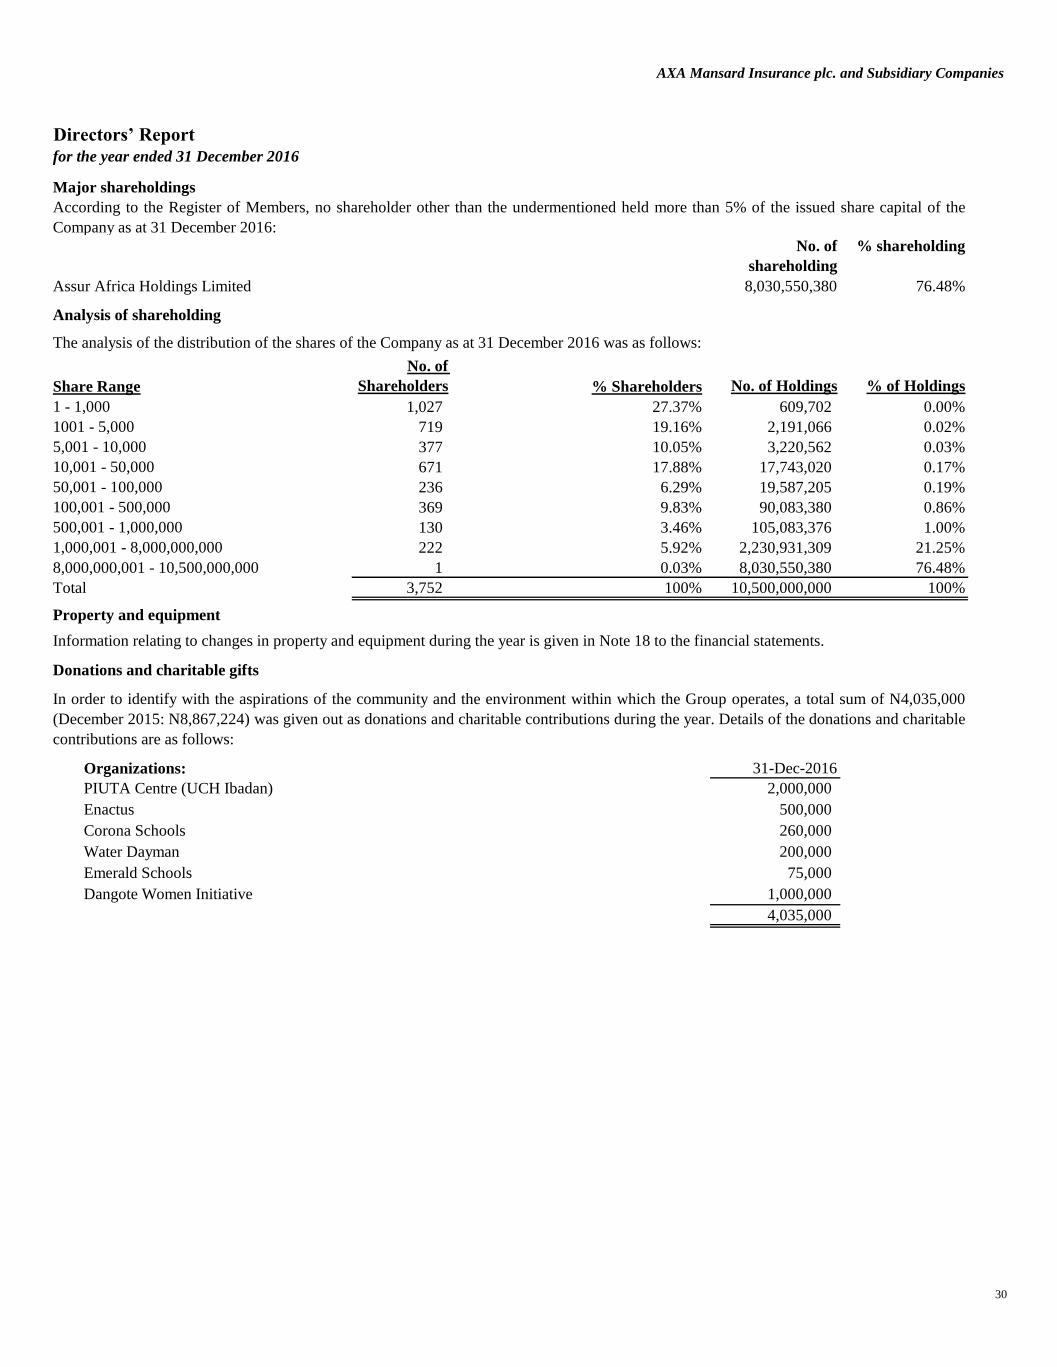
AXA Mansard Insurance plc. and Subsidiary Companies
Directors’ Report
for the year ended 31 December 2016
No. of
shareholding
% shareholding
8,030,550,380 76.48%
No. of
Shareholders No. of Holdings % of Holdings
1 - 1,000 1,027 27.37% 609,702 0.00%
1001 - 5,000 719 19.16% 2,191,066 0.02%
5,001 - 10,000 377 10.05% 3,220,562 0.03%
10,001 - 50,000 671 17.88% 17,743,020 0.17%
50,001 - 100,000 236 6.29% 19,587,205 0.19%
100,001 - 500,000 369 9.83% 90,083,380 0.86%
500,001 - 1,000,000 130 3.46% 105,083,376 1.00%
1,000,001 - 8,000,000,000 222 5.92% 2,230,931,309 21.25%
8,000,000,001 - 10,500,000,000 1 0.03% 8,030,550,380 76.48%
3,752 100% 10,500,000,000 100%
Organizations: 31-Dec-2016
PIUTA Centre (UCH Ibadan) 2,000,000
Enactus 500,000
Corona Schools 260,000
Water Dayman 200,000
Emerald Schools 75,000
Dangote Women Initiative 1,000,000
4,035,000
In compliance with Section 277 of the Companies and Allied Matters Act of Nigeria, none of the directors has notified the Company of any
declarable interest in contracts deliberated by the Company during the year under review.
Major shareholdings
Analysis of shareholding
The analysis of the distribution of the shares of the Company as at 31 December 2016 was as follows:
% ShareholdersShare Range
Total
Property and equipment
Information relating to changes in property and equipment during the year is given in Note 18 to the financial statements.
Donations and charitable gifts
In order to identify with the aspirations of the community and the environment within which the Group operates, a total sum of N4,035,000
(December 2015: N8,867,224) was given out as donations and charitable contributions during the year. Details of the donations and charitable
contributions are as follows:
According to the Register of Members, no shareholder other than the undermentioned held more than 5% of the issued share capital of the
Company as at 31 December 2016:
Assur Africa Holdings Limited
30
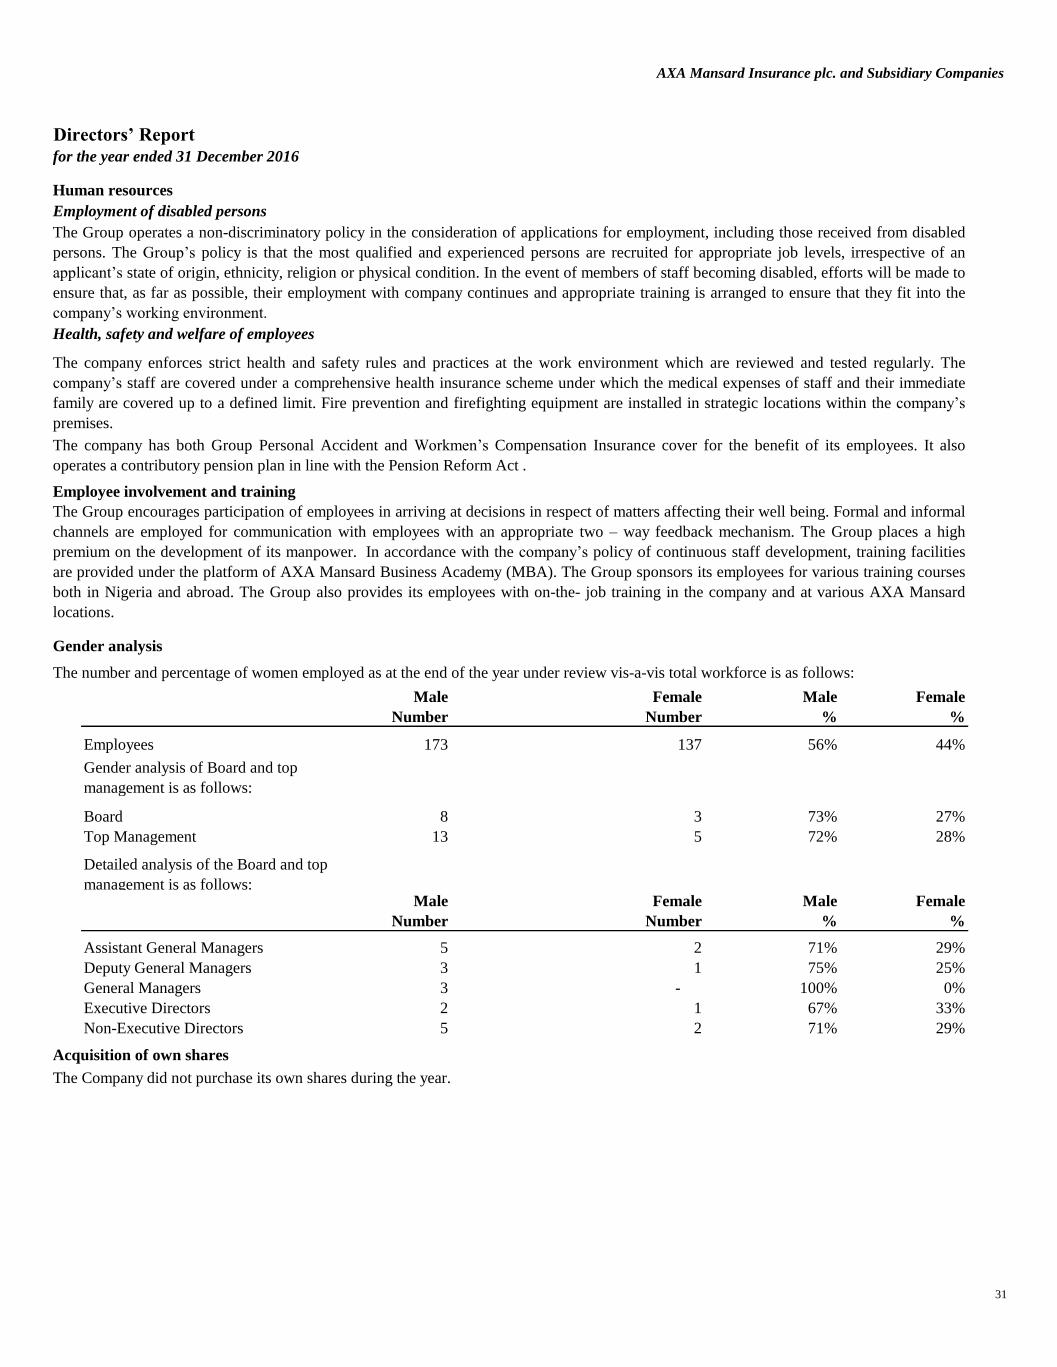
AXA Mansard Insurance plc. and Subsidiary Companies
Directors’ Report
for the year ended 31 December 2016
Health, safety and welfare of employees
Employee involvement and training
Gender analysis
Male Female Male Female
Number Number % %
Employees 173 137 56% 44%
Board 8 3 73% 27%
Top Management 13 5 72% 28%
Male Female Male Female
Number Number % %
Assistant General Managers 5 2 71% 29%
Deputy General Managers 3 1 75% 25%
General Managers 3 - 100% 0%
Executive Directors 2 1 67% 33%
Non-Executive Directors 5 2 71% 29%
Acquisition of own shares
Human resources
Employment of disabled persons
The Group operates a non-discriminatory policy in the consideration of applications for employment, including those received from disabled
persons. The Group’s policy is that the most qualified and experienced persons are recruited for appropriate job levels, irrespective of an
applicant’s state of origin, ethnicity, religion or physical condition. In the event of members of staff becoming disabled, efforts will be made to
ensure that, as far as possible, their employment with company continues and appropriate training is arranged to ensure that they fit into the
company’s working environment.
The company enforces strict health and safety rules and practices at the work environment which are reviewed and tested regularly. The
company’s staff are covered under a comprehensive health insurance scheme under which the medical expenses of staff and their immediate
family are covered up to a defined limit. Fire prevention and firefighting equipment are installed in strategic locations within the company’s
premises.
The Group encourages participation of employees in arriving at decisions in respect of matters affecting their well being. Formal and informal
channels are employed for communication with employees with an appropriate two – way feedback mechanism. The Group places a high
premium on the development of its manpower. In accordance with the company’s policy of continuous staff development, training facilities
are provided under the platform of AXA Mansard Business Academy (MBA). The Group sponsors its employees for various training courses
both in Nigeria and abroad. The Group also provides its employees with on-the- job training in the company and at various AXA Mansard
locations.
The number and percentage of women employed as at the end of the year under review vis-a-vis total workforce is as follows:
The Company did not purchase its own shares during the year.
Detailed analysis of the Board and top
management is as follows:
Gender analysis of Board and top
management is as follows:
The company has both Group Personal Accident and Workmen’s Compensation Insurance cover for the benefit of its employees. It also
operates a contributory pension plan in line with the Pension Reform Act .
31
AXA Mansard Insurance plc. and Subsidiary Companies
Directors’ Report
for the year ended 31 December 2016
Auditors
BY ORDER OF THE BOARD
Mrs. Omowunmi Mabel Adewusi
Company Secretary
FRC/2013/NBA/00000000967
Plot 1412, Ahmadu Bello Way,
Victoria Island, Lagos.
Messrs. PricewaterhouseCoopers have indicated their willingness to continue in office as auditors in compliance with section 357(2) of the
Companies and Allied Matters Act of Nigeria.
25 March 2017
32
AXA Mansard Insurance plc. and Subsidiary Companies
i.
ii.
iii.
SIGNED ON BEHALF OF THE BOARD OF DIRECTORS BY:
Mrs. Yetunde Ilori Mr. Olusola Adeeyo
FRC/2012/CIIN/00000000344 FRC/2013/NIM/00000001919
25 March 2017 25 March 2017
- International Financial Reporting Standards (IFRS) as issued by the International Accounting Standards
Board (IASB);
- the requirements of the Nigerian Insurance Act;
- relevant guidelines and circulars issued by the National Insurance Commission (NAICOM); and
- the requirements of the Companies and Allied Matters Act.
The directors further accept responsibility for the maintenance of accounting records that may be relied upon in the
preparation of financial statements, as well as adequate systems of internal financial control.
The directors have made assessment of the Group’s ability to continue as a going concern and have no reason to
believe that the Group will not remain a going concern in the year ahead.
Statement of Directors’ Responsibilities in relation to the consolidated and
separate financial statements for the year ended 31 December 2016
The directors accept responsibility for the preparation of the consolidated financial statements that give a true and
fair view of the statement of financial position of the Group and Company at the reporting date and of its
comprehensive income in the manner required by the Companies and Allied Matters Act of Nigeria and the
Nigerian Insurance Act. The responsibilities include ensuring that the Group:
keeps proper accounting records that disclose, with reasonable accuracy, the financial position of the Group
and comply with the requirements of the Companies and Allied Matters Act and the Insurance Act;
establishes adequate internal controls to safeguard its assets and to prevent and detect fraud and other
irregularities; and
prepares its financial statements using suitable accounting policies supported by reasonable and prudent
judgments and estimates, that are consistently applied.
The directors accept responsibility for the financial statements, which have been prepared using appropriate
accounting policies supported by reasonable and prudent judgments and estimates, in compliance with
- Financial Reporting Council of Nigeria Act
33

AXA Mansard Insurance plc and Subsidiary Companies
Report of the Statutory Audit Committee
for the year ended 31 December 2016
Mr. Ohis Ohiwerei
FRC/2017/CIBN/00000016412
Chairman, Statutory Audit Committee
1 Mr. Olusola Adeeyo Independent Director Resigned effective July 21, 2016
2 Mr. Lesley Ndlovu Non Executive Director Member
3 Mr. Akingbola Akinola Shareholders' representative Member
4 Mr. Ohis Ohiwerei Independent Director Appointed effective July 21, 2016
5 Mr. Laoye Jaiyeola Shareholders' representative Member
In attendance:
Mr. Olusola Odumuyiwa Secretary
Members of the Statutory Audit Committee are:
To the members of AXA Mansard Insurance Plc:
In compliance with the provisions of Section 359(6) of the Companies and Allied Matters Act of
Nigeria, the members of the Audit Committee of AXA Mansard Insurance Plc hereby report as follows:
We have exercised our statutory functions under Section 359(6) of the Companies and Allied Matters
Act of Nigeria and acknowledge the co-operation of management and staff in the conduct of these
responsibilities.
We are of the opinion that the accounting and reporting policies of the Group are in compliance with
legal requirements and agreed ethical practices and that the scope and planning of both the external and
internal audits for the year ended 31 December 2016 were satisfactory and reinforce the Group's internal
control systems.
We have deliberated with the external auditors, who have confirmed that necessary cooperation was
received from Management in the course of their statutory audit and we are satisfied with Management’s
responses to their recommendations for improvement and with the effectiveness of the Group's system of
accounting and internal control.
16 February 2017
1


AXA Mansard Insurance plc and Subsidiary Companies
Consolidated and Separate Financial Statements
AXA Mansard Insurance plc and Subsidiary Companies
1 General information
For the year ended 31 December 2016
Reporting entity
2 Summary of significant accounting policies
2.1 Basis of presentation and compliance with IFRS
(a) Basis of measurement
(b) Use of estimates and judgements
2.1.1
A number of standards, interpretations and amendments are effective for annual period beginning after 1 January 2016 and earlier
application is permitted; however, the group has not early adopted the following new or amended standards in preparing these consolidated
financial statements:
New or amended
standardsSummary of the requirements
Possible impact on Consolidated financial
statements
IFRS 9 Financial
instruments
IFRS 9, released in July 2014, replaces the existing
guidance in IAS 39 Financial instruments:
Recognition and measurement. IFRS 9 includes
revised guidance on the reclassification and
measurement of financial instruments, a new expected
credit loss model for calculating impairment on
financial assets and new general hedge accounting
requirments. It also carries forward the guidance on
recognition and derecognition of financial instruments
from IAS 39. IFRS 9 is effective for annual reporting
periods beginning on or after 1 January 2018 with
early adoption permitted.
Having assessed the impact of the new standard, the
adoption of the new standard will not have material
impact on the Group's consolidated financial
statements.
(a) New and amended standards and interpretations not yet adopted by the Group
Changes in accounting policy and disclosures
The consolidated financial statements comprises the consolidated statement of comprehensive income, the consolidated statement of
financial position, the consolidated statements of changes in equity, the consolidated statement of cash flows and the notes.
These consolidated and separate financial statements have been prepared on the historical cost basis except for the following:
- non-derivative financial instruments designated at fair value through profit or loss.
- available-for-sale financial assets are measured at fair value.
- investment property is measured at fair value.
- insurance liabilities measured at present value of future cashflows.
AXA Mansard Insurance Plc. (‘the Company’) and its subsidiaries (together ‘the Group’) underwrite life and non-life insurance contracts. The
Group also issues a diversified portfolio of investment contracts to provide its customers with asset management solutions for their savings and
retirement needs as well as provide pension administration and management services to its customers. All these products are offered to both
domestic and foreign markets. The Group does business in Nigeria and employs over 200 people.
The Company is a public limited company incorporated and domiciled in Nigeria. The address of its registered office is:
Santa Clara Court, Plot 1412, Ahmadu Bello Way Victoria Island, Lagos, Nigeria.
The Company is listed on the Nigerian Stock Exchange. The consolidated financial statements were authorised for issue by the board of directors on
25 March 2017.
These financial statements have been prepared in accordance with the International Financial Reporting Standards (IFRS) and IFRS
Interpretations Committee (IFRIC) Interpretations applicable to companies reporting under IFRS. Additional information required by
national regulations have been included where appropriate.
- share based payment at fair value or an approximation of fair value allowed by the relevant standards
The preparation of the consolidated financial statements in conformity with IFRSs requires management to make judgements, estimates and
assumptions that affect the application of policies and reported amounts of assets and liabilities, income and expenses. Actual results may
differ from these estimates.
Information about significant areas of estimation uncertainties and critical judgements in applying accounting policies that have the most
significant effect on the amounts recognised in the consolidated and separate financial statements are described in note 2.3.
- investment contract liabilities at fair value.
41
AXA Mansard Insurance plc and Subsidiary Companies
IAS 19 Employee Benefits
In September 2014, the IASB issued an ammendment
to IAS 19.The amendment requires the assessment of
whether a deep market in high-quality corporate bonds
exists to be based on corporate bonds in the currency
in which the liabilities are denominated rather than
corporate bonds of a particular country. Where there
is no deep market in high-quality corporate bonds in
that currency, government bonds denominated in that
currency should instead be used. This amendment is
effective for periods beginning on after 1 January
2016
The amendment has no impact on the Group financial
statements as at 31 December 2016.
IAS 27 Separate Fianancial
Statements
The IASB introduced an amendment to IAS 27 in
August 2014. It allows entities to use the equity
method to account for investments in subsidiaries,
joint ventures and associates in their separate financial
statements. IAS 27, ‘Separate financial statements’,
deals with the accounting for investments in
subsidiaries, joint ventures and associates when an
entity elects, or is required by local regulations, to
present separate financial statements. Each category
of investments should be accounted for either at cost,
in accordance with IAS 39/IFRS 9 or using the equity
method in the separate financial statements.s effective
for annual periods beginning on or after 1 January
2016 and should be applied retrospectively. Earlier
application is permitted.
The Group has assessed the impact of the requirement
and has decided to use the cost method in accounting
for investment in subsidiaries.
IAS 16 Property,Plant and
Equipment
In March 2016, the IFRS interpretation committee
(IC) had tentatively decided to propose narrow scope
amendments to IAS 16, ‘Property, plant and
equipment’ requiring to recognise in profit or loss the
net proceeds from selling items produced while testing
and related costs of producing these items. This
amendment is effective for periods beginning on after
1 January 2016
The amendment has no impact on the Group financial
statements as at 31 December 2016
IFRS 11 Accounting for
Acquisition of interest in
Joint operations
In May 2014, the IASB published amendments to
IFRS 11, 'Joint arrangements', on accounting for
acquisitions. This amendment adds new guidance on
how to account for the acquisition of an interest in a
joint operation that constitutes a business. The
amendments specify the appropriate accounting
treatment for such acquisitions. The amendments are
effective annual periods beginning on or after 1
January 2016.
The Group does not have any interest in a joint venture
as at 31 December 2016.
IAS 1 Presentation of
Fianancial Statements
In January 2015, the IASB issued an exposure draft of
amendments to IAS 1 on classification of liabilities.
IAS 1 amendments designed to improve presentation
in financial statements by clarifying the criteria for the
classification of a liability as either current or non-
current: clarifying that the classification of a liability
as either current or non-current is based on the entity’s
rights at the end of the reporting period and making
clear the link between the settlement of the liability
and the outflow of resources from the entity.
The Group is currently in compliance with the
requirements of this new standard.
42

AXA Mansard Insurance plc and Subsidiary Companies
IFRS 15 Revenue on
contracts with customers
IFRS 15 establishes a comprehensive framework for
determining whether, how much and when revenue is
recognised. It replaces existing revenue recognition
guidance including IAS 18 Revenue, IAS 11
Construction contracts and IFRIC 13 Customers
loyalty programmes. IFRS 15 is effective for annual
reporting periods beginning on or after 1 January
2017 with early adoption permitted.
The Group is assessing the potential impact on its
consolidated financial statements resulting from the
application of IFRS 15.
IAS 38 Intangible Assets
In May 2014, IASB amended IAS 38, Intangible
assets to clarify when a method of depreciation or
amortisation based on revenue may be
appropriate.The amendment to IAS 38 establishes a
rebuttable presumption that amortisation of an
intangible asset based on revenue generated by using
the asset is inappropriate. The presumption may only
be rebutted in certain limited circumstances. These
are, where the intangible asset is expressed as a
measure of revenue or where it can be demonstrated
that revenue and the consumption of the economic
benefits of the intangible asset are highly
correlated.The amendments are effective annual
periods beginning on or after 1 January 2016.
Having assessed the impact of the new standard, the
adoption of the new standard will not have material
impact on the Group's consolidated financial
statements.
IFRS 10 Consolidated
Financial statements & IAS
28 Equity Accounting
In September 2014 the IASB released amendments to
IFRS 10, 'Consolidated financial statements' and IAS
28, 'Investments in associates and joint ventures'.
These amendments address an inconsistency between
the requirements in IFRS 10 and those in IAS 28 in
dealing with the sale or contribution of assets between
an investor and its associate or joint venture. The main
consequence of the amendments is that a full gain or
loss is recognised when a transaction involves a
business (whether it is housed in a subsidiary or not).
A partial gain or loss is recognised when a transaction
involves assets that do not constitute a business, even
if these assets are housed in a subsidiary. The IASB
has decided to postpone the effective date of this
amendment pending the outcome of the research
project on the equity method of accounting.
The group will continue to monitor developments
regarding the new effective date for the amendment
43

AXA Mansard Insurance plc and Subsidiary Companies
2.2 Significant accounting policies
(a)
(a) power over the investee entity;
(b) exposure, or rights, to variable returns from involvement with the investee entity; and
(c) the ability to use power over the investee to affect the amount of the investor’s returns.(b)
(i) Subsidiaries
Investment in subsidiaries in the separate financial statement of the parent entity is measured at cost less impairment.
(ii) Business combinations
(iii) Changes in ownership interests in subsidiaries without change in controls
(iv) Disposal of subsidiaries
(c) Segment reporting
When the Group ceases to have control, any retained interest in the entity is re-measured to its fair value at the date when control is lost,
with the change in carrying amount recognised in profit or loss. The fair value is the initial carrying amount for the purposes of
subsequently accounting for the retained interest as an associate, joint venture or financial asset. In addition, any amounts previously
recognised in other comprehensive income in respect of that entity are accounted for as if the Group had directly disposed of the related
assets or liabilities. This may mean that amounts previously recognised in other comprehensive income are reclassified to profit or loss.
Operating segments are reported in a manner consistent with the internal reporting provided to the chief operating decision-maker. The
chief operating decision-maker, which is responsible for allocating resources and assessing performance of the operating segments, has
been identified as the Management Underwriting and Investment Committee (MUIC) that makes strategic decisions.
Transactions with non-controlling interests that do not result in loss of control are accounted for as equity transactions – that is, as
transactions with the owners in their capacity as owners. The difference between fair value of any consideration paid and the relevant
share acquired of the carrying value of net assets of the subsidiary is recorded in equity between retained earnings and Non controlling
interests. Gains or losses on disposals to non-controlling interests are also recorded in equity.
Consolidated structured entities
Subsidiaries are all entities over which the group exercises control.
The financial statements of subsidiaries are consolidated from the date the Group acquires control, up to the date that such effective control
ceases. Subsidiaries are entities over which the Group, directly or indirectly, has the power to govern the financial and operating policies so
as to obtain benefits from their activities.
Inter-company transactions, balances and unrealised gains on transactions between companies within the Group are eliminated on
consolidation. Unrealised losses are also eliminated in the same manner as unrealised gains, but only to the extent that there is no evidence
of impairment. Accounting policies of subsidiaries have been changed where necessary to ensure consistency with the policies adopted by
the Group.
The group has consistently applied the following accounting policies to all periods presented in these consolidated financial statements.
Consolidation
The Group defines the principle of control and establishes control as the basis for determining which entities are consolidated in the group
financial statements.The Group controls an investee entity when it is exposed, or has rights, to variable returns from its involvement with the investee entity and
has the ability to affect those returns through its power over the investee entity. The Group applies the following three elements of control as
set out by the principle of control in assessing control of an investee:
The Group applies the acquistion method to account for Business Combinations and acquisition-related costs are expensed as incurred.
If the business combination is achieved in stages, fair value of the acquirer’s previously held equity interest in the acquiree is re-measured to
fair value at the acquisition date through profit or loss.
Any contingent consideration to be transferred by the Group is recognised at fair value at the acquisition date. Subsequent changes to the
fair value of the contingent consideration that is deemed to be an asset or liability is recognised in compliance with IAS 39 either in profit or
loss or as a change to other comprehensive income. Contingent consideration that is classified as equity is not re-measured, and its
subsequent settlement is accounted for within equity.
Goodwill is initially measured as the excess of the aggregate of the consideration transferred and the fair value of non- controlling interest
over the net identifiable assets acquired and liabilities assumed. If this consideration is lower than the fair value of the net assets of the
subsidiary acquired, the difference is recognised in profit or loss.
44
AXA Mansard Insurance plc and Subsidiary Companies
(d) Foreign currency translation
(i) Functional and presentation currency
(ii) Transactions and balances
(iii) Group companies
-
-
-
(e) Financial assets
Classification of financial assets
(i) Financial assets at fair value through profit or loss
Held for trading
Financial assets designated at fair value through profit or loss upon initial recognition
A financial asset is classified into the held for trading category if acquired principally for the purpose of selling in the short term, if it forms
part of a portfolio of financial assets in which there is evidence of short-term profit-taking.
Other financial assets designated as at fair value through profit or loss at initial recognition are those that are:
- Separate assets held to match insurance and investment contracts liabilities that are linked to the changes in fair value of these assets.
The designation of these assets to be at fair value through profit or loss eliminates or significantly reduces a measurement or recognition
inconsistency (sometimes referred to as ‘an accounting mismatch’) that would otherwise arise from measuring assets or liabilities or
recognising the gains and losses on them on different bases; and
- Managed and whose performance is evaluated on a fair value basis. Information about these financial assets is provided internally on a
fair value basis to the Group’s key management personnel. The Group’s investment strategy is to invest in equity and debt securities and to
evaluate them with reference to their fair values. Assets that are part of these portfolios are designated upon initial recognition at fair value
Assets and liabilities for each statement of financial position presented are translated at the closing rate on the reporting date;
income and expenses for each income statement are translated at average exchange rates (unless this average is not a reasonable
approximation of the cumulative effect of the rates prevailing on the transaction dates, in which case income and expenses are translated at
the rate on the dates of the transactions); and
all resulting exchange differences are recognised in other comprehensive income.
Financial assets are classified into the following categories: fair value through profit and loss, loans and receivables, held-to-maturity and
available-for-sale. The classification by the Group is determined by management at initial recognition and depends on the purpose for which
the investments were acquired.
Foreign exchange gains and losses resulting from the settlement of foreign currency transactions and from the translation at year-end
exchange rates of monetary assets and liabilities denominated in foreign currencies are recognised in the Statement of Comprehensive
income.
Foreign exchange gains and losses are presented in the income statement within ‘Net losses/gains on financial instruments'.
In the case of changes in the fair value of monetary assets denominated in foreign currency classified as available-for-sale, a distinction is
made between translation differences resulting from changes in amortised cost of the security and other changes in the carrying amount of
the security. Translation differences on non-monetary financial assets and liabilities such as equities held at fair value through profit and loss
are recognised in the income statement as part of net gain/loss on financial assets. Translation differences on non-monetary financial assets
such as equities classified as available for sale are included in other comprehensive income.
The results and financial position of all the group entities (none of which has the currency of a hyper-inflationary economy) that have a
functional currency different from the presentation currency are translated into the presentation currency as follows:
Items included in the financial statements of each of the Group’s entities are measured using the currency of the primary economic
environment in which the entity operates (the ‘functional currency’). The consolidated financial statements are presented in thousands of
Naira (NGN) which is the Group's presentation currency.
Foreign currency transactions are translated into the functional currency using the exchange rates prevailing at the dates of the transactions.
Foreign exchange gains and losses resulting from the settlement of such transactions and from the translation at year-end exchange rates of
monetary assets and liabilities denominated in foreign currencies are recognised in the profit or loss.
Monetary items denominated in foreign currency are translated using the closing rate as at the reporting date. Non-monetary items measured
at historical cost denominated in a foreign currency are translated with the exchange rate as at the date of initial recognition; non monetary
items (investment property) in a foreign currency that are measured at fair value are translated using the closing rate as at the date when the
fair value was determined.
45
AXA Mansard Insurance plc and Subsidiary Companies
(ii) Loans and receivables
Reinsurance assets
(iii) Held-to-maturity financial assets
(iv) Available-for-sale financial assets
Recognition and measurement of financial assets
Interest on available-for-sale securities calculated using the effective interest method is recognised in the income statement. Dividends on
available-for-sale equity instruments are recognised in the income statement when the Group’s right to receive payments is established. Both
are included in the investment income line.
Gains and losses arising from changes in the fair value of the ‘financial assets at fair value through profit or loss' category are included in
the income statement in the period in which they arise. Dividend income from financial assets at fair value through profit or loss is
recognised in the income statement as part of other income when the Group’s right to receive payments is established.
Changes in the fair value of monetary and non-monetary securities classified as available for sale are recognised in other comprehensive
income.When securities classified as available-for-sale are sold or impaired, the accumulated fair value adjustments recognised in other
comprehensive income are included in the income statement as net realised gains on financial assets.
During the year, in order to align with the Parent company's investment classification policy, all held for trading and held to maturity
financial assets were reclassified to available for sale.
Regular-way purchases and sales of financial assets are recognised on trade-date which is the date on which the Group commits to
purchase or sell the asset.
Financial assets are initially recognised at fair value, plus transaction costs for all financial assets not initially recognised at fair value
through profit or loss. Financial assets carried at fair value through profit or loss are initially recognised at fair value, and transaction
costs are expensed in the income statement.
Available-for-sale financial assets and financial assets at fair value through profit or loss are subsequently carried at fair value. Loans and
receivables and held-to- maturity financial assets are carried at amortised cost using the effective interest method.
Held-to-maturity investments are non-derivative financial assets with fixed or determinable payments and fixed maturities that the Group’s
management has the positive intention and ability to hold to maturity, other than:
- those that the Group upon initial recognition designates as at fair value through profit or loss;
- those that the Group designates as available-for-sale; and
- those that meet the definition of loans and receivables.
Interests on held-to-maturity investments are included in the consolidated income statement and are reported as interest income. In the case
of an impairment, it is reported as a deduction from the carrying value of the investment and recognised in the consolidated income
statement as ‘Net gains/(losses) on financial assets'. Held-to-maturity investments are largely bonds.
Available-for-sale investments are financial assets that are intended to be held for an indefinite period of time, which may be sold in
response to needs for liquidity or changes in interest rates, exchange rates or equity prices or that are not classified as loans and receivables,
held-to-maturity investments or fair value through profit or loss.
These are non-derivative financial assets with fixed determinable payments that are not quoted in an active market. After initial recognition,
they are measured at amortised cost using the effective interest method less impairment. Discounting is omitted where the effect of
discounting is immaterial. Trade receivables are made up of premium receivables and coinsurance receivables.
- Premium receivables relate to receivables from agents, brokers and insurance companies in respect of premium income.
-Coinsurance recoverables relate to only claims recoverables from coinsurers for claims settled to policy holders on behalf of coinsurers
based on agreed terms.
The Company cedes businesses to reinsurers in the normal course of business for the purpose of limiting its net loss potential through the
transfer of risks. Reinsurance arrangements do not relieve the Company from its direct obligations to its policyholders. Reinsurance assets
are measured at amortised costs. Reinsurance assets relate to prepaid reinsurance, reinsurers' share of IBNR claims and claims recoverables.
Other receivables
Other receivables are made up of other amounts due from parties which are not directly linked to insurance or investment contracts. These
are measured at amortised costs. Discounting is omitted where the effect of discounting is immaterial.
Loans and receivables are non-derivative financial assets with fixed or determinable payments that are not quoted in an active market other
than:
- those that the Group intends to sell in the short term which are declassified as fair value through profit or loss and those that the group
upon initial recognition designates as fair value through profit or loss.
- those that the Group upon initial recognition designates as Available for Sale
- those for which the holder may not recover substantially all of its initial loans and receivables other than because of credit risk. Loans and
receivables include trade receivables, reinsurance assets and other receivables (financial assets).Trade receivables
46
AXA Mansard Insurance plc and Subsidiary Companies
Determination of fair value of financial assets
Reclassification of financial assets
Impairment of financial assets
(a) Financial assets carried at amortised cost
- Trade receivables are outstanding for more than 30 days
- Reinsurance recoverable outstanding more than 90 days
- Significant financial difficulty of the issuer or debtor;
- A breach of contract, such as a default or delinquency in payments;
- It becoming probable that the issuer or debtor will enter bankruptcy or other financial re-organisation;
- The disappearance of an active market for that financial asset because of financial difficulties; or
- Observable data indicating that there is a measurable decrease in the estimated future cash flow from a group of financial assets since
the initial recognition of those assets, although the decrease cannot yet be identified with the individual financial assets in the Group.
Financial assets classified as held to maturity can be reclassfied as available for sale assets. In making this reclassification, the entire
portfolio becomes tainted and the group cannot designate any instrument as held to maturity for the next two years after a sale or
reclassification. Fair values changes upon tainting of the HTM portfolio are recognised in Other Comprehensive income prospectively.
Reclassifications are made at fair value as of the reclassification date. Fair value becomes the new cost or amortised cost as applicable, and
no reversals of fair value gains or losses recorded before reclassification date are subsequently made. Effective interest rates for financial
assets reclassified to loans and receivables and held-to-maturity categories are determined at the reclassification date. Further increases in
estimates of cash flows adjust effective interest rates prospectively.
The Group assesses at each end of the reporting period whether there is objective evidence that a financial asset or group of financial assets
is impaired. A financial asset or group of financial assets is impaired and impairment losses are incurred only if there is objective evidence
of impairment as a result of one or more events that have occurred after the initial recognition of the asset (a ‘loss event’) and that loss event
(or events) has an impact on the estimated future cash flows of the financial asset or group of financial assets that can be reliably estimated.
Objective evidence that a financial asset or group of assets is impaired includes observable data that comes to the attention of the Group
about the following events:
For more complex instruments the company uses internally developed models which are usually based on valuation models and techniques
generally recognised as standard within the industry. Valuation models are used primarily to value unlisted debt securities for which markets
were or have become illiquid. Some of the inputs to these models may not be market observable and therefore estimated based on
assumptions. The impact of financial instruments valuation reflecting non-market observable inputs (Level 3 valuations) is disclosed in the
note to the financial statements.
Financial assets other than loans and receivables are permitted to be reclassified out of the held-for-trading category only in rare
circumstances arising from a single event that is unusual and highly unlikely to recur in the near-term. In addition, the Group may choose to
reclassify financial assets that would meet the definition of loans and receivables out of the held-for-trading or available-for-sale categories
if the Group has the intention and ability to hold these financial assets for the foreseeable future or until maturity at the date of
reclassification.
For financial instruments traded in active markets, the determination of fair values of financial assets and financial liabilities is based on the
market approach (transaction price paid for an identical or a similar instrument). This includes listed equity securities and quoted debt
instruments on major exchanges.
A financial instrument is regarded as quoted in an active market if quoted prices are readily and regularly available from an exchange,
dealer, broker, industry group, pricing service or regulatory agency, and those prices represent actual and regularly occurring market
transactions on an arm’s length basis. If the above criteria are not met, the market is regarded as being inactive. For example, a market is
inactive when there is a wide bid-offer spread or significant increase in the bid-offer spread or there are few recent transactions.
For all other financial instruments, fair value is determined using valuation techniques . In these techniques, fair values are estimated from
observable data in respect of similar financial instruments, using models to estimate the present value of expected future cash flows or
other valuation techniques, using inputs (for example, NIBOR yield curve, foreign exchange rates, volatilities and counterparty spreads)
existing at the reporting date.
47

AXA Mansard Insurance plc and Subsidiary Companies
(b) Assets classified as available for sale
Derecognition of financial assets
A financial asset is derecognised if either the entity has transferred contractual rights to receive cash flows from the asset or if the entity has
retained the contractual rights to receive the cash flows from the asset but has assumed a contractual obligation to pass on the cash flows
under an arrangement that meets the conditions stated below:
- the entity has no obligation to pay amounts to the eventual recipient unless it collects equivalent amounts on the original asset
- the entity is prohibited from selling or pledging the original asset other than as security to the eventual recipient
- the entity has an obligation to remit those cash flows without material delay
A financial liability shall be derecognised when the obligation specified in the contract is either discharged, cancelled or expired.
Assets that have an indefinite useful life – for example, land are not subject to amortisation and are tested annually for impairment. Assets
that are subject to amortisation are reviewed for impairment whenever events or changes in circumstances indicate that the carrying
amount may not be recoverable. An impairment loss is recognised for the amount by which the asset’s carrying amount exceeds its
recoverable amount. The recoverable amount is the higher of an asset’s fair value less costs to sell and value in use. For the purposes of
assessing impairment, assets are grouped at the lowest levels for which there are separately identifiable cash flows (cash-generating units).
When the financial asset at amortised cost is uncollectible, it is written off against the related allowance for impairment. Such loans are
written off after all the necessary procedures have been completed and the amount of the loss has been determined. Impairment charges
relating to Investment securities are classified as net gains/loss of financial assets while those on receivables are classified as operating
expenses.
The Group assesses at each reporting date whether there is objective evidence that a financial asset or a group of financial assets is impaired.
In the case of equity investments classified as available-for-sale, a significant or prolonged decline in the fair value of the security below its
cost is an objective evidence of impairment resulting in the recognition of an impairment loss. In this respect, a period of 12 months or
longer is considered to be prolonged. If any such quantitative evidence exists for available-for-sale financial assets, the asset is considered
for impairment, taking qualitative evidence into account. The cumulative loss measured as: the difference between the acquisition cost and
the current fair value, less any impairment loss on that financial asset previously recognised in profit or loss is removed from equity and
recognised in the consolidated income statement. Impairment losses recognised in the consolidated income statement on equity instruments
are not reversed through the consolidated income statement.
If in a subsequent period the fair value of a debt instrument classified as available for sale increases and the increase can be objectively
related to an event occurring after the impairment loss was recognised in profit or loss, the impairment loss is reversed through the
consolidated income statement.
Initial recognition of pledged assets is at fair value, whilst subsequent measurement is based on the classification and measurement of the
financial asset in accordance with IAS 39.
If there is objective evidence that an impairment loss has been incurred on loans and receivables or held-to-maturity investments carried at
amortised cost, the amount of the loss is measured as the difference between the asset’s carrying amount and the present value of
estimated future cash flows (excluding future credit losses that have been incurred) discounted at the financial asset’s original effective
interest rate. The carrying amount of the asset is reduced through the use of an allowance account, and the amount of the loss is recognised
in the income statement. If a held-to- maturity investment or a loan has a variable interest rate, the discount rate for measuring any
impairment loss is the current effective interest rate determined under contract. The Group may measure impairment on the basis of an
instrument’s fair value using an observable market price.
If in a subsequent period, the amount of the impairment loss decreases and the decrease can be related objectively to an event occurring
after the impairment was recognised (such as improved credit rating), the previously recognised impairment loss is reversed by adjusting
the allowance account. The amount of the reversal is recognised in the income statement.
The discount rate is the yield at the reporting date on government bonds that have maturity dates approximating the terms of the Group’s
obligations and that are denominated in the same currency in which the benefits are expected to be paid.
The recoverable amount of an asset or cash-generating unit is the greater of its value in use and its fair value less costs to sell. In assessing
value in use, the estimated future cash flows are discounted to their present value using a pre-tax discount rate that reflects current market
assessments of the time value of money and the risks specific to the asset.
The Group first assesses whether objective evidence of impairment exists for financial assets that are individually significant. If the Group
determines that no objective evidence of impairment exists for an individually assessed financial asset, whether significant or not, it
includes the asset in a group of financial assets with similar credit risk characteristics and collectively assesses them for impairment. Assets
that are individually assessed for impairment and for which an impairment loss is or continues to be recognised are not included in a
collective assessment of impairment.
48
AXA Mansard Insurance plc and Subsidiary Companies
Offsetting financial instruments
(f)
(g) Intangible assets
(i) Computer software
(ii) Goodwill
Goodwill arises on the acquistion of subsidiaries and represents the excess of the consideration transferred over the Group's interest in the
fair value of the net identifiable assets, liabilities and contigent liabilities of the acquiree and the fair value of the non-controlling interest in
the acquiree.
For the purpose of impairment testing, goodwill acquired in a business combination is allocated to each of the CGU's or groups of CGUs,
that is expected to benefit from the synergies of the combination. Goodwill is monitored at the operating segment level.
Goodwill impairment reviews are undertaken annually or more frequently if events or changes in circumstances indicate a potential
impairment. The carrying value of goodwill is compared to the recoverable amount, which is the higher of value in use and the fair value
less costs to sell. Any impairment is recognised immediately as an expense and is not subsequently reversed.
- The expenditure attributable to the software product during its development can be reliably measured.
Directly attributable costs that are capitalised as part of the software product include the software development employee costs and an
appropriate portion of directly attributable overheads.
Other development expenditures that do not meet these criteria are recognised as an expense when incurred. Development costs previously
recognised as an expense are not recognised as an asset in a subsequent period.
Computer software development costs recognised as assets are amortised over their useful lives, which does not exceed five years.
Properties could have dual purposes whereby part of the property is used for own use activities. The portion of a dual use property is
classified as an investment property only if it could be sold or leased out separately under a finance lease or if the portion occupied by the
owner is immaterial to the total lettable space. Currently, the group occupies less than 10% of the lettable space (264sqm out of 7,406sqm).
The portion of the investment property occupied by the owner is considered immaterial to the total lettable space and to the value of the
investment property.
Intangibles assets represents cost associated with the acquisition of software and inherent goodwill on business combination.
Costs associated with maintaining computer software programmes are recognised as an expense when incurred.
Development costs that are directly attributable to the design and testing of identifiable and unique software products controlled by the
Group are recognised as intangible assets when the following criteria are met:
- It is technically feasible to complete the software product so that it will be available for use;
- Management intends to complete the software product and use or sell it;
- There is an ability to use or sell the software product;
- It can be demonstrated how the software product will generate probable future economic benefits;
- Adequate technical, financial and other resources to complete the development and to use or sell the software product are available; and
Changes in fair values are recorded in the income statement. Property located on land that is held under an operating lease is classified as
investment property as long as it is held for long-term rental yields and is not occupied by the companies in the consolidated Group. The
initial cost of the property shall be the fair value (where available). When not available the initial cost shall be used. The property is carried
at fair value after initial recognition. Investment property denominated in foreign currencies are translated to the reporting currency using the
closing exchange rate at the reporting date.
If an investment property becomes owner-occupied, it is reclassified as property, plant and equipment, and its fair value at the date of
reclassification becomes its cost for subsequent accounting purposes.
If an item of property, plant and equipment becomes an investment property because its use has changed, any difference arising between the
carrying amount and the fair value of this item at the date of transfer is recognised in other comprehensive income as a revaluation of
property, plant and equipment. However, if a fair value gain reverses a previous impairment loss, the gain is recognised in the income
statement. Upon the disposal of such investment property any surplus previously recorded in equity is transferred to retained earnings net of
associated tax; the transfer is not made through profit or loss.
Financial assets and liabilities are offset and the net amount reported in the statement of financial position only when there is a legally
enforceable right to offset the recognised amounts and there is an intention to settle on a net basis, or to realise the asset and settle the
liability simultaneously.
Investment property
Property held for long-term rental yields that is not occupied by the companies in the Group is classified as investment property.
Investment property comprises freehold land and buildings. It is carried at fair value, adjusted if necessary, for any difference in the nature,
location or condition of the specific asset. If this information is not available, the Group uses alternative valuation methods such as
discounted cash flow projections or recent prices in less active markets. These valuations are reviewed annually by an independent valuation
expert.
49

AXA Mansard Insurance plc and Subsidiary Companies
(iii) License fee
(h) Property and equipment
Land and buildings comprise mainly outlets and offices occupied by the Group.
50 years
-Vehicles 5 years
-Branding, furniture and fittings and equipment 2- 5 years-Computer equipment 3 yearsLeasehold improvements are depreciated over the lower of the useful life of the asset and the lease term.
(i) Statutory deposit
(j) Insurance contracts
(1) Types of Insurance Contracts
(i) Non-life insurance contracts
The group classify insurance contract into life and non-life insurance contracts.
These contracts are accident and casualty and property insurance contracts.
Accident and casualty insurance contracts protect the Group’s customers against the risk of causing harm to third parties as a result of their
legitimate activities. Damages covered include both contractual and non-contractual events. The typical protection offered is designed for
employers who become legally liable to pay compensation to injured employees (employers’ liability) and for individual and business
customers who become liable to pay compensation to a third party for bodily harm or property damage (public liability).
Property insurance contracts mainly compensate the Group’s customers for damage suffered to their properties or for the value of property
lost. Customers who undertake commercial activities on their premises could also receive compensation for the loss of earnings caused by
the inability to use the insured properties in their business activities (business interruption cover).
Non- life insurance contracts protect the Group’s customers from the consequences of events (such as death or disability) that would affect
the ability of the customer or his/her dependents to maintain their current level of income. Guaranteed benefits paid on occurrence of the
specified insurance event are either fixed or linked to the extent of the economic loss suffered by the policyholder. There are no maturity
or surrender benefits.
Property and equipment are dercognised at the disposal date or at the date when it is permanently withdrawn from use without the ability to
be disposed of. Gains and losses on disposals are determined by comparing the proceeds with the carrying amount. These are included
within other income in the Statement of Comprehensive Income.
Statutory deposit represents 10% of the paid up capital of the Company deposited with the Central Bank of Nigeria (CBN) in pursuant to
Section 10(3) of the Insurance Act, 2003. Statutory deposit is measured at cost.
The Group issues contracts that transfer insurance risk or financial risk or both. Insurance contracts are those contracts where a party (the
policy holder) transfers significant insurance risk to another party (insurer) and the latter agrees to compensate the policyholder or other
beneficiary if a specified uncertain future event (the insured event) adversely affects the policyholder, or other beneficiary. Such contracts
may also transfer financial risk when the insurer issues financial instruments with a discretionary participation feature.
The group leases some welcome centers and branches under the operating lease arrangement. The lease payments are recognised as an
expense in the income statement over the lease term.
Land is not depreciated. Depreciation on property and equipment is calculated using the straight-line method to allocate the cost to the
residual values over the estimated useful lives as follows.
-Building
The assets residual values and useful lives are reviewed at the end of each reporting period and adjusted if appropriate.
An asset’s carrying amount is written down immediately to its recoverable amount, if the asset’s carrying amount is greater than its
estimated recoverable amount.
The Group applies the cost model in recognising intangible assets acquired in a business combination. Licenses acquired in a business
combination are recognised at fair value at the acquisition date. Subsequently, they are carried at cost less accumulated amortisation and
impairment losses. Licenses acquired in a business combination are amortised over a period of 25 years.
Land is shown at cost. All other property and equipment are stated at historical cost less depreciation and accumulated impairment charges.
Historical cost includes expenditure that is directly attributable to the acquisition of the items.
Subsequent costs are included in the asset’s carrying amount or recognised as a separate asset, as appropriate, only when it is probable that
future economic benefits associated with the item will flow to the Group and the cost of the item can be measured reliably. All other repairs
and maintenance are charged to the income statement during the financial period in which they are incurred.
50
AXA Mansard Insurance plc and Subsidiary Companies
(ii) Life insurance contracts
-Annuity contracts
(i) Non-life insurance contracts premium and claims
(iii) Annuity premium and claims
(iv) Salvages
(v) Subrogation
Premiums are recognised as revenue when they become payable by the contract holders. Premium are shown before deduction of
commission. Annuity premium are recognised as premium in the statement of comprehensive income
Claims and other benefits are recorded as an expense when they are incurred.
Annuity premiums relate to single premium payments and recognised as earned premium income in the period in which payments are
received. Claims are made to annuitants in the form of monthly/quarterly payments based on the terms of the annuity contract and charged to
income statement as incurred. Premiums are recognised as revenue when they become payable by the contract holders. Premium are shown
before deduction of commission.
Some non-life insurance contracts permit the Group to sell (usually damaged) property acquired in the process of settling a claim. The
Group may also have the right to pursue third parties for payment of some or all costs of damages to its clients property (i.e. subrogation
right).
Salvage recoveries are used to reduce the claim expense when the claim is settled.
Subrogation is the right for an insurer to pursue a third party that caused an insurance loss to the insured. This is done as a means of
recovering the amount of the claim paid to the insured for the loss. A receivable for subrogation is recognised in other assets when the
liability is settled and the Company has the right to receive future cash flow from the third party.
-Individual life contracts are usually long term insurance contracts and span over one year while the group life insurance contracts usually
cover a period of 12 months. A liability for contractual benefits that are expected to be incurred in the future when the premiums are
recognised. The liability is determined as the sum of the expected discounted value of the benefit payments and the future administration
expenses that are directly related to the contract, less the expected discounted value of the theoretical premiums that would be required to
meet the benefits and administration expenses based on the valuation assumptions used. The liability is based on assumptions as to
mortality, persistency, maintenance expenses and investment income that are established at the time the contract is issued.
These contracts insure customers from consequences of events that would affect the ability of the customers to maintain their current level
of income. There are no maturity or surrender benefits. The annuity contracts are fixed annuity plans. Policy holders make a lump sum
payment recognised as part of premium in the period when the payment was made. Constant and regular payments are made to annuitants
based on terms and conditions agreed at the inception of the contract and throughout the life of the annuitants. The annuity funds are
invested in long tailed government bonds and reasonable money markets instruments to meet up with the payment of monthly/quarterly
annuity payments. The annuity funds liability is actuarially determined based on assumptions as to mortality, persistency, maintenance
expenses and investment income that are established at the time the contract is issued.
(2) Recognition and measurement
These contracts are accident, casualty and property insurance contracts. Accident and casualty insurance contracts protect the Group's
customers against the risk of causing harm to third parties as a result of their legitimate activities. Damages covered include both contractual
and non-contractual events. The typical protection offered is designed for employers who become legally liable to pay compensation to
injured employees (employers' liability) and for individual and business customers who become liable to pay compensation to a third party
for bodily harm or property damage (public liability). Property insurance contracts mainly compensate the Group's customers for damage
suffered to their properties or for the value of property lost. Customers who undertake commercial activities on their premises could also
receive compensation for the loss of earnings caused by the inability to use the insured properties in their business activities. Life insurance
contracts protects the Group's customers from the consequences of events (such as death or disability) that would affect the ability of the
customer or his/her dependents to maintain their current level of income. Guaranteed benefits paid on occurrence of the specified insurance
event are either fixed or linked to the extent of the economic loss suffered by the insured. There are no maturity or surrender benefits.
For all these contracts, premiums are recognised as revenue (earned premiums) proportionally over the period of coverage. The portion of
premium received on in-force contracts that relates to unexpired risks at the reporting date is reported as the unearned premium liability.
Claims and loss adjustment expenses are charged to income as incurred based on the estimated liability for compensation owed to contract
holders or third parties damaged by the contract holders. They include direct and indirect claims settlement costs and arise from events that
have occurred up to the end of the reporting period even if they have not yet been reported to the Group. The Group does not discount its
liabilities for unpaid claims. Liabilities for unpaid claims are estimated using the input of assessments for individual cases reported to the
Group and statistical analyses for the claims incurred but not reported, and to estimate the expected ultimate cost of more complex claims
that may be affected by external factors (such as court decisions).
(ii) Life insurance contracts premium and claims
These contracts insure events associated with human life (for example, death). These are divided into the individual life, group life and
Annuity contracts.
51
AXA Mansard Insurance plc and Subsidiary Companies
(vi) Deferred policy acquisition costs (DAC)
(vii) Deferred income
(k) Investment contracts
(l) Technical reserves
(i) General insurance contracts
Reserves for unearned premium
Reserves for outstanding claims
Reserves for unexpired risk
Investment contracts are those contracts that transfer financial risk with no significant insurance risk. Investment contracts can be classified
into interest linked and unitised fund. Interest linked investment contracts are measured at amortised cost while unitised funds are measured
at fair value.
Investment contracts with guaranteed returns (interest linked) and other business of a savings nature are recognised as liabilities. Interest
accruing to the life assured from investment of the savings is recognised in the profit and loss account in the year it is earned while interest
paid and due to depositors is recognised as an expense. The net result of the deposit administration revenue account is transferred to the
income statement of the group. Unitised funds contracts sell units under seven portfolios with the value of each unit determined by the value
of the underlying assets for each portfolio.
These are computed in compliance with the provisions of Sections 20, 21, and 22 of the Insurance Act 2003 as follows:
In compliance with Section 20 (1) (a) of Insurance Act 2003, the reserve for unearned premium is calculated on a time apportionment basis
in respect of the risks accepted during the year.
The reserve for outstanding claims is maintained at the total amount of outstanding claims incurred and reported plus claims incurred but not
reported ("IBNR") as at the reporting date. The IBNR is based on the liability adequacy test.
A provision for additional unexpired risk reserve (AURR) is recognised for an underwriting year where it is envisaged that the estimated
cost of claims and expenses would exceed the unearned premium reserve (UPR).
If there is objective evidence that the insurance receivable is impaired, the Group reduces the carrying amount of the insurance receivable
accordingly and recognises that impairment loss in the income statement. The Group gathers the objective evidence that an insurance
receivable is impaired using the same methodology adopted for financial assets held at amortised cost. The impairment loss is calculated
under the same method used for these financial assets.- Reinsurance and coinsurance contracts held
Contracts entered into by the Group with reinsurers and that meet the classification requirements for insurance contracts are classified as
reinsurance contracts held. Contracts that do not meet these classification requirements are classified as financial assets.
Reinsurance assets consist of short-term balances due from reinsurers, as well as longer term receivables that are dependent on the expected
claims and benefits arising under the related reinsured insurance contracts. Reinsurance liabilities are primarily premiums payable for
reinsurance contracts and are recognised as an expense when due. The Group has the right to set-off re-insurance payables against amount
due from re-insurance and brokers in line with the agreed arrangement between both parties.
The Group assesses its reinsurance assets for impairment on a quarterly basis. If there is objective evidence that the reinsurance asset is
impaired, the Group reduces the carrying amount of the reinsurance asset to its recoverable amount and recognises that impairment loss
in the income statement. The Group gathers the objective evidence that a reinsurance asset is impaired using the same process adopted for
financial assets held at amortised cost. The impairment loss is calculated using the number of days that the receivable has been
outstanding.
Acquisition costs comprise all direct and indirect costs arising from the writing of both life and non-life insurance contracts. Deferred
acquisition costs represent a proportion of commission which are incurred during a financial period and are deferred to the extent that they
are recoverable out of future revenue margins. For the non life business, it is calculated by applying to the acquisition expenses the ratio of
unearned premium to written premium; while no assets are established in respect of deferred acquisition cost for the life business.
Deferred income represent a proportion of commission received on reinsurance contracts which are booked during a financial year and are
deferred to the extent that they are recoverable out of future revenue margins. It is calculated by applying to the reinsurance commission
income the ratio of prepaid reinsurance to reinsurance cost.
(viii) Receivables and payables related to insurance contracts
Receivables and payables are recognised when due. These include amounts due to and from agents, brokers and insurance companies (as
coinsurers) and reinsurance companies.
-Receivables and payables to agents, brokers and insurance companies (as coinsurers)
The company's receivables and payables to agents, brokers and insurance companies (as coinsurers) relate to premium and commission.
52
AXA Mansard Insurance plc and Subsidiary Companies
(ii) Life business
Life fund
(m) Financial liabilities
(i) Borrowings
(ii)
(iii) Financial guarantee contracts
(n) Provisions
Financial guarantees are contracts that require the Group to make specified payments to reimburse the holder for a loss it incurs because a
specified debtor fails to make payment when due in compliance with the original or modified terms of a debt instrument.
Financial guarantee liabilities are initially recognised at their fair value, which is the premium received, and then amortised over the life of
the financial guarantee. Subsequent to initial recognition, the financial guarantee liability is measured at the higher of the present value of
any expected payment and the unamortised premium when a payment under the guarantee has become probable. Financial guarantees are
included within other liabilities.
Provisions are recognised when: the Group has a present legal or constructive obligation as a result of past events; it is more likely than
not that an outflow of resources will be required to settle the obligation; and the amount has been reliably estimated. Provisions are not
recognised for future operating losses.
Where there are a number of similar obligations, the likelihood that an outflow will be required in settlement is determined by considering
the class of obligations as a whole. A provision is recognised even if the likelihood of an outflow with respect to any one item included in
the same class of obligations may be small.
Provisions are measured at the present value of the expenditures expected to be required to settle the obligation using a pre-tax rate that
reflects current market assessments of the time value of money and the risks specific to the obligation. The increase in the provision due
to passage of time is recognised as interest expense.
Borrowings are classified as current liabilities unless the group has an unconditional right to defer settlement of the liabilities for at least 12
months after the date of the statement of financial position.
Borrowing costs are interest and other costs incurred by the Group directly attributable to the acquisition and construction of qualifying
assets which are assets that necessarily takes a substantial period of time to get ready for its intended use or sale.
Borrowing costs are capitalized as part of the cost of a qualifying asset only when it is probable that they will result in future economic
benefits to the Group and the costs can be measured reliably. Other borrowing costs are recognised as an expense in the period in which they
are incurred.
When the carrying amount or the expected ultimate cost of the qualifying asset exceeds its recoverable amount or net realizable value, the
carrying amount is written down or written off. Investment income earned on the temporary investment of specific borrowings pending their
expenditure on qualifying assets is deducted from the borrowing costs eligible for capitalisation.
Trade and other payables
Trade and other payables are recognised initially at fair value and subsequently measured at amortised cost using the effective interest
method. The fair value of a non-interest bearing liability is its discounted repayment amount. If the due date of the liability is less than one
year discounting is omitted.
This is made up of net liabilities on policies in force as computed by the actuaries at the time of the actuarial valuation or as at reporting
period end.
Liability adequacy test
At each end of the reporting period, liability adequacy tests are performed by an Actuary to ensure the adequacy of the contract liabilities
net of related DAC assets. In performing these tests, current best estimates of future contractual cash flows and claims handling and
administration expenses, as well as investment income from the assets backing such liabilities, are used. Any deficiency is immediately
charged to profit or loss initially by writing off DAC and by subsequently establishing a provision for losses arising from liability adequacy
tests "the unexpired risk provision".
Borrowings are recognised initially at fair value, net of transaction costs incurred. Borrowings are subsequently stated at amortised cost; any
difference between the proceeds (net of transaction costs) and the redemption value is recognised in the income statement over the period
of the borrowings using the effective interest method.
Fees paid on the establishment of loan facilities are recognised as transaction cost of the loan to the extent that it is probable that some or
all of the facility will be drawn down. In this case, the fee is deferred until the drawdown occurs. To the extent there is no evidence that it
is probable that some or all of the facility will be drawn down, the fee is capitalised and amortised over the period of the facility to which it
relates.
53
AXA Mansard Insurance plc and Subsidiary Companies
(o)
(p) Equity
(i) Share capital
(ii) Repurchase and re-issue of ordinary shares (treasury shares)
(iii) Equity-linked compensation plans
(iv) Contingency reserves
(v) Dividends
(b) Life business
In compliance with Section 22 (1) (b) of Insurance Act 2003, the contingency reserve is credited with the higher of 1% of gross premiums
or 10% of net profit.
Dividend on the Company’s ordinary shares are recognised in equity in the period in which they are approved by the Company’s
shareholders. Dividend distribution to the Company’s shareholders is recognised as equity in the financial statements in the period in which
the dividend is paid to the Company’s shareholders.
When shares recognised as equity are repurchased, the amount of the consideration paid, which includes directly attributable costs, net of
tax effects, is recognised as a deduction from equity. Repurchased shares are classified as treasury shares and are presented in the treasury
shares reserve. When treasury shares are sold or reissued subsequently, the amount received is recognised as an increase in equity and the
resulting surplus or deficit on the transaction is presented within share premium.
The group operates an equity share-based compensation plans. The fair value of equity-settled share options is determined on the grant date
and accounted for as staff costs over the vesting period of the share options, with a corresponding increase in equity. At the end of each
reporting period, the group revisits its estimates of the number of options that are expected to vest based on the non market and service
conditions. It recognises the impact of the revision to initial estimates, if any, in the income statement with a corresponding adjustment to
equity. On vesting of share options, amounts previously credited to the share-based payment reserve are transferred to retained earnings
through an equity transfer. On exercise of equity- settled share options, proceeds received are credited to share capital and premium.
(a) Non-life business
In compliance with Section 21 (2) of Insurance Act 2003, the contingency reserve is credited with the greater of 3% of total premiums, or
20% of the net profits. This shall accumulate until it reaches the amount of greater of minimum paid-up capital or 50% of net premium.
The tax effects of carry-forwards of unused losses or unused tax credits are recognised as an asset when it is probable that future taxable
profits will be available against which these losses can be utilised.
Deferred tax related to fair value remeasurement of available-for-sale investments, which are charged or credited directly in other
comprehensive income, is also credited or charged directly to other comprehensive income and subsequently recognised in the
consolidated income statement together with the deferred gain or loss.
Shares are classified as equity when there is no obligation to transfer cash or other assets. Incremental costs directly attributable to the
issue of equity instruments are shown in equity as a deduction from the proceeds, net of tax.
Where any member of the Group purchases the Company’s equity share capital (treasury shares), the consideration paid, including any
directly attributable incremental costs (net of income taxes), is reported as a separate component of equity attributable to the Company’s
equity holders. Where such shares are subsequently sold, reissued or otherwise disposed of, any consideration received is included in
equity attributable to the Company’s equity holders, net of any directly attributable incremental transaction costs and the related income tax
effects.
The tax expense for the period comprises current and deferred tax. Tax is recognised in the income statement, except to the extent that it
relates to items recognised in other comprehensive income or directly in equity. In this case, the tax is also recognised in other
comprehensive income or directly in equity, respectively.
The current income tax charge is calculated on the basis of the tax laws enacted or substantively enacted at the end of the reporting
period. Management periodically evaluates positions taken in tax returns with respect to situations in which applicable tax regulation is
subject to interpretation and establishes provisions where appropriate.
Deferred income tax is recognised, using the liability method, on temporary differences arising between the tax bases of assets and
liabilities and their carrying amounts in the consolidated financial statements. However, if the deferred income tax arises from initial
recognition of an asset or liability in a transaction other than a business combination that at the time of the transaction affects neither
accounting nor taxable profit or loss, it is not accounted for. Deferred income tax is determined using tax rates (and laws) that have been
enacted or substantively enacted by the end of the reporting period and are expected to apply when the related deferred income tax asset
is realisable or the deferred income tax liability is payable.
Deferred income tax assets are recognised to the extent that it is probable that future taxable profit will be available against which the
temporary differences can be utilised.
Deferred income tax is provided on temporary differences arising on investments in subsidiaries and associates, except where the Group
controls the timing of the reversal of the temporary difference and it is probable that the temporary difference will not reverse in the
foreseeable future.
Deferred income tax assets and liabilities are offset when there is a legally enforceable right to offset current tax assets against current tax
liabilities and when the deferred income tax assets and liabilities relate to income taxes levied by the same taxation authority on either the
taxable entity or different taxable entities where there is an intention to settle the balances on a net basis.
Current and deferred income tax
54

AXA Mansard Insurance plc and Subsidiary Companies
(q) Earnings per share
(r) Revenue recognition
(d ) Net gains/(losses) on financial assets
(e) Net fair value gain on non financial assets
(s) Changes in life fund estimates
(t) Investment income
(u) Operating expenditure
(i) Reinsurance expenses
(c) Dividend income: dividend income for available-for-sale equities is recognised when the right to receive payment is established, this is
the ex-dividend date for equity securities. They are reported within other income.
Net realised gains/(losses) on financial assets comprises gains less losses related to trading and available-for-sale investment, and includes
all realised and unrealised fair value changes and foreign exchange differences and realised gain or loss on available-for-sale investment.
Net fair value gain on non financial assets at fair value represents fair value gains on the Group's non financial instruments such as
investment property.
Actuarial valuation of the life fund is conducted annually to determine the net liabilities on the existing policies and the adequacy of the
assets representing the insurance fund as at the date of valuation. All deficits arising therefrom are charged to the income statement.
Interest income and expenses for all interest-bearing financial instruments including financial instruments measured at fair value through
profit or loss, are recognised within ‘investment income and finance cost respectively in the income statement using the effective interest
rate method. When a receivable is impaired, the Group reduces the carrying amount to its recoverable amount, being the estimated future
cash flow discounted at the original effective interest rate of the instrument, and continues unwinding the discount as interest income.
Reinsurance cost represents outward premium paid to reinsurance companies less the unexpired portion as at the end of the accounting year.
Revenue comprises premium, value for services rendered, net of value-added tax, after eliminating revenue within the Group. Other revenue
classes are recognised as follows:
(a) Premium income: for short duration life insurance contracts, premiums are recognised as revenue (earned premiums) proportionally over
the period of coverage. The portion of premium received on in-force contracts that relates to unexpired risks at the reporting date is reported
as the unearned premium liability. Premiums are shown before deduction of commission and are gross of any taxes or duties levied on
premiums. Where insurance contracts have a single premium or a limited number of premium payments due over a significantly shorter
period than the period during which benefits are provided, the excess of the premiums payable over the valuation premiums is deferred and
recognised as income in line with the decrease of unexpired insurance risk of the contracts in force or, for annuities in force, in line with the
decrease of the amount of future benefits expected to be paid.
(b) Rendering of services: Revenue arising from asset management and other related services offered by the Group are recognised in the
accounting period in which the services are rendered. Fees consist primarily of investment management fees arising from services rendered
in conjunction with the issue and management of investment contracts where the Group actively manages the consideration received from
its customers to fund a return that is based on the investment profile that the customer selected on origination of the instrument.
These services comprise the activity of trading financial assets and derivatives in order to reproduce the contractual returns that the
Group’s customers expect to receive from their investments. Such activities generate revenue that is recognised by reference to the stage of
completion of the contractual services.
In all cases, these services comprise an indeterminate number of acts over the life of the individual contracts. For practical purposes, the
Group recognises these fees on a straight-line basis over the estimated life of the contract. Certain upfront payments received for asset
management services (‘front-end fees’) are deferred and amortised in proportion to the stage of completion of the service for which they
were paid.
The Group charges its customers for asset management and other related services using the following different approaches:- Front-end
fees are charged to the client on inception. This approach is used particularly for single premium contracts. The consideration received is
deferred as a liability and recognised over the life of the contract on a straight-line basis; and Regular fees are charged to the customer
periodically (monthly, quarterly or annually) either directly or by making a deduction from invested funds. Regular charges billed in
advance are recognised on a straight-line basis over the billing period; fees charged at the end of the period are accrued as a receivable
that is offset against the financial liability when charged to the customer.
The Group presents basic earnings per share (EPS) data for its ordinary shares. Basic EPS is calculated by dividing the profit or loss
attributable to ordinary shareholders of the Company by the weighted average number of ordinary shares outstanding during the period
excluding treasury shares held by the Company.
Diluted EPS is determined by adjusting the profit or loss attributable to ordinary shareholders and the weighted average number of ordinary
shares outstanding for the effects of all dilutive potential ordinary shares which comprise share options granted to staff.
55
AXA Mansard Insurance plc and Subsidiary Companies
(ii) Underwriting expenses
(iii) Other operating expenses
(iv) Employee benefits
(a) Defined contribution plans
(b) Short-term benefits
(c ) Share based payment
(i) Equity-settled share based payment
(ii) Cash-settled share based payment
Underwriting expenses comprise acquisition costs and other underwriting expenses. Acquisition costs comprise all direct and indirect costs
arising from the writing of insurance contracts. Examples of these costs include, but are not limited to, commission expense, supervisory
levy, superintending fees and other technical expenses. Other underwriting expenses are those incurred in servicing existing
policies/contract. These expenses are charged in the accounting year in which they are incurred.
Other expenses are expenses other than claims expenses, employee benefit, expenses for marketing and administration and underwriting
expenses. They include wages for contract staff, professional fee, depreciation expenses and other non-operating expenses. Other operating
expenses are accounted for on accrual basis and recognised in the income statement upon utilization of the service.
The Group operates a defined contributory pension scheme for eligible employees. Employees and the Group contribute 7.5% and 10.5%
respectively each qualifying staff's salary in line with the provisions of the Pension Reform Act 2014. The Group pays contributions to
pension fund administrator on a mandatory basis. The Group has no further payment obligations once the contributions have been paid. The
contributions are recognised as employee benefits expense when they are due. Prepaid contributions are recognised as an asset to the extent
that a cash refund or a reduction in the future payments is available.
Wages, salaries, paid annual leave and sick leave, bonuses and non-monetary benefits are recognised as employee benefit expense and
accrued when the associated services are rendered by the employees of the Group.
The grant date fair value of equity -settled share-based payments awards granted to employees is generally recognised as an expense, with a
corresponding increase in equity, over the vesting period of the awards. The amount recognised as an expense is adjusted to reflect the
number of awards for which the related services and unobservable performance conditions are expected to be met, such that the amount
ultimately recognised is based on the number of awards that meet the related service and unobservable performance conditions at the vesting
date. For share- based payment awards with non vesting conditions, the grant date fair value of the share based payment is measured to
reflect such conditions.
The fair value of the amount payable to employees in respect of share appreciation rights, which are settled in cash, is recognised as an
expense, with a corresponding increase in liabilities, over the period in which the employees become unconditionally entitled to payment.
The liability is remeasured at each reporting date and at settlement date. Any changes in the fair value of the liability are recognised in profit
or loss.
56
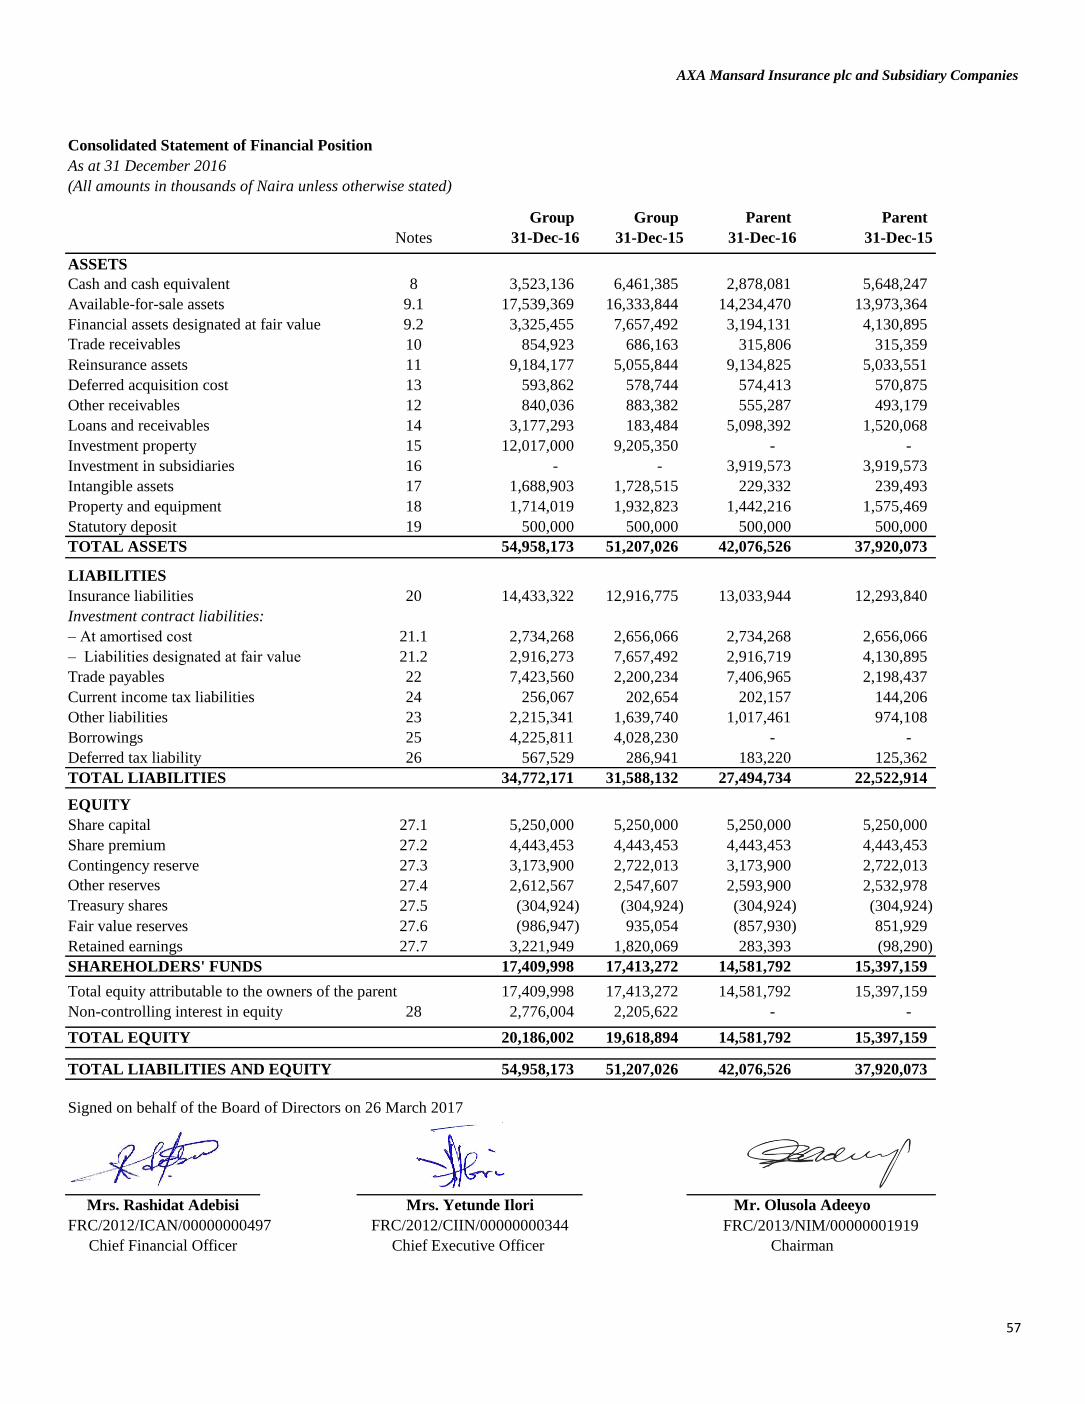
AXA Mansard Insurance plc and Subsidiary Companies
Consolidated Statement of Financial Position
As at 31 December 2016
(All amounts in thousands of Naira unless otherwise stated)
Group Group Parent Parent
Notes 31-Dec-16 31-Dec-15 31-Dec-16 31-Dec-15
ASSETS
Cash and cash equivalent 8 3,523,136 6,461,385 2,878,081 5,648,247
Available-for-sale assets 9.1 17,539,369 16,333,844 14,234,470 13,973,364
Financial assets designated at fair value 9.2 3,325,455 7,657,492 3,194,131 4,130,895
Trade receivables 10 854,923 686,163 315,806 315,359
Reinsurance assets 11 9,184,177 5,055,844 9,134,825 5,033,551
Deferred acquisition cost 13 593,862 578,744 574,413 570,875
Other receivables 12 840,036 883,382 555,287 493,179
Loans and receivables 14 3,177,293 183,484 5,098,392 1,520,068
Investment property 15 12,017,000 9,205,350 - -
Investment in subsidiaries 16 - - 3,919,573 3,919,573
Intangible assets 17 1,688,903 1,728,515 229,332 239,493
Property and equipment 18 1,714,019 1,932,823 1,442,216 1,575,469
Statutory deposit 19 500,000 500,000 500,000 500,000
TOTAL ASSETS 54,958,173 51,207,026 42,076,526 37,920,073
LIABILITIES
Insurance liabilities 20 14,433,322 12,916,775 13,033,944 12,293,840
Investment contract liabilities:
– At amortised cost 21.1 2,734,268 2,656,066 2,734,268 2,656,066
– Liabilities designated at fair value 21.2 2,916,273 7,657,492 2,916,719 4,130,895
Trade payables 22 7,423,560 2,200,234 7,406,965 2,198,437
Current income tax liabilities 24 256,067 202,654 202,157 144,206
Other liabilities 23 2,215,341 1,639,740 1,017,461 974,108
Borrowings 25 4,225,811 4,028,230 - -
Deferred tax liability 26 567,529 286,941 183,220 125,362
TOTAL LIABILITIES 34,772,171 31,588,132 27,494,734 22,522,914
EQUITY
Share capital 27.1 5,250,000 5,250,000 5,250,000 5,250,000
Share premium 27.2 4,443,453 4,443,453 4,443,453 4,443,453
Contingency reserve 27.3 3,173,900 2,722,013 3,173,900 2,722,013
Other reserves 27.4 2,612,567 2,547,607 2,593,900 2,532,978
Treasury shares 27.5 (304,924) (304,924) (304,924) (304,924)
Fair value reserves 27.6 (986,947) 935,054 (857,930) 851,929
Retained earnings 27.7 3,221,949 1,820,069 283,393 (98,290)
SHAREHOLDERS' FUNDS 17,409,998 17,413,272 14,581,792 15,397,159
Total equity attributable to the owners of the parent 17,409,998 17,413,272 14,581,792 15,397,159
Non-controlling interest in equity 28 2,776,004 2,205,622 - -
TOTAL EQUITY 20,186,002 19,618,894 14,581,792 15,397,159
TOTAL LIABILITIES AND EQUITY 54,958,173 51,207,026 42,076,526 37,920,073
Signed on behalf of the Board of Directors on 26 March 2017
Mrs. Rashidat Adebisi Mr. Olusola Adeeyo
FRC/2012/ICAN/00000000497 FRC/2013/NIM/00000001919
Chief Financial Officer ChairmanChief Executive Officer
Mrs. Yetunde Ilori
FRC/2012/CIIN/00000000344
57

AXA Mansard Insurance plc and Subsidiary Companies
Consolidated Statement of Comprehensive Incomefor the year ended 31 December 2016
(All amounts in thousands of Naira unless otherwise stated)
Notes Group Group Parent Parent
31-Dec-16 31-Dec-15 31-Dec-16 31-Dec-15
Continuing operations
Gross premium written 30 20,713,129 16,574,614 17,330,219 15,009,324
Gross premium income 30 20,676,584 16,891,241 17,872,878 15,616,615
Re-insurance expenses 30 (9,727,446) (6,986,307) (9,666,891) (6,952,514)
Net premium income 30 10,949,138 9,904,934 8,205,987 8,664,101
Fee and commission on insurance contracts 31 995,557 984,844 995,557 984,844
Net underwriting income 11,944,695 10,889,778 9,201,544 9,648,945
Claims expenses (gross) 32 (9,363,466) (7,251,411) (7,063,689) (6,353,116)
Claims expenses recovered from reinsurers 32 2,547,565 1,829,172 2,539,536 1,817,668
Underwriting expenses 33 (2,071,647) (1,844,444) (1,983,814) (1,804,077)
20.3 (162,838) 97,492 (162,838) 97,492
20.4 98,098 (737,375) 98,098 (737,375)
10.1 (46,285) 2,491 (37,194) 2,491
Net underwriting expenses (8,998,573) (7,904,075) (6,609,901) (6,976,917)
Total underwriting profit 2,946,122 2,985,703 2,591,643 2,672,028
Investment income 34 3,836,131 3,545,713 2,011,016 1,840,572 Net (losses)/gains on financial instruments 35 (576,170) (98,759) 997,992 165,633
Fair value gains on investment property 15 2,811,650 892,050 - -
Profit on investment contracts 36 198,950 183,519 198,950 183,519
Other income 37 120,677 75,393 216,543 143,091
Total investment income 6,391,238 4,597,916 3,424,501 2,332,815 Expenses for marketing and administration 38 (1,425,438) (1,433,243) (1,176,389) (1,208,890)
Employee benefit expense 39 (2,054,675) (1,630,127) (1,617,904) (1,224,712)
Other operating expenses 40 (2,287,396) (2,080,600) (1,958,064) (1,882,009)
Results of operating activities 3,569,851 2,439,649 1,263,787 689,232
Finance cost 41 (444,224) (415,996) - -
Profit before tax 3,125,627 2,023,653 1,263,787 689,232
Income tax expense 42 (490,631) (361,472) (223,408) (223,134)
Profit for the year 2,634,996 1,662,181 1,040,379 466,098
Profit attributable to:
Owners of the parent 2,064,614 1,219,249 1,040,379 466,098
Non-controlling interest 28 570,382 442,932 - -
2,634,996 1,662,181 1,040,379 466,098
Other comprehensive income:
Items that may be subsequently reclassified to the profit or loss account:
Changes in available-for-sale financial assets (net of taxes) 27.6 (1,922,001) 569,321 (1,709,859) 462,362
Other comprehensive income for the year (1,922,001) 569,321 (1,709,859) 462,362
Total comprehensive income for the year 712,995 2,231,502 (669,480) 928,460
Attributable to:
Owners of the parent 142,613 1,788,570 (669,480) 928,460
Non-controlling interests 28 570,382 442,932 - -
Total comprehensive income for the year 712,995 2,231,502 (669,480) 928,460
Earnings per share:
Basic (kobo) 43 20.00 11.81 10.08 4.52
Diluted (kobo) 43 19.69 11.72 9.92 4.48
Changes in individual life reserves
(Impairment)/writeback of premium receivables
Changes in annuity reserves
58

AXA Mansard Insurance plc and Subsidiary Companies
Consolidated Statements of Changes in Equity(All amounts in thousands of Naira unless otherwise stated)
Year ended 31 December 2016
Group
Share Share
Capital and
other
statutory Treasury Share scheme Fair value Contingency Retained Total
Non
Controlling Total
Capital premium reserves shares reserves reserves reserve earnings interest equity
Balance at 1 January 2016 5,250,000 4,443,453 2,514,629 (304,924) 32,978 935,054 2,722,013 1,820,069 17,413,272 2,205,622 19,618,894
Total comprehensive income for the year
Profit for the year - - - - - - - 2,064,614 2,064,614 570,382 2,634,996
Transfer to contingency reserves - - - - - - 451,887 (451,887) - - -
Transfer to statutory reserves - - 4,038 - - - - (4,038) - - -
Other comprehensive income
Changes in fair value of available-for-sale
financial assets - - - - (1,922,001) - - (1,922,001) - (1,922,001)
Total comprehensive income for the year - - 4,038 - - (1,922,001) 451,887 1,608,689 142,613 570,382 712,995
Transactions with owners, recorded directly in equity
Dividends to equity holders - - - - - - - (206,809) (206,809) - (206,809)
Equity- settled share-based payments expense - - - - 60,922 - - - 60,922 - 60,922
Total transactions with owners of equity - - - - 60,922 - - (206,809) (145,887) - (145,887)
Balance at 31 December 2016 5,250,000 4,443,453 2,518,667 (304,924) 93,900 (986,947) 3,173,900 3,221,949 17,409,998 2,776,004 20,186,002
Year ended 31 December 2015
Group
Share Share
Capital and
other
statutory Treasury Share scheme Fair value Contingency Retained Total
Non
Controlling Total
Capital premium reserves shares reserves reserves reserve earnings interest equity
Balance at 1 January 2015 5,250,000 4,443,453 2,500,000 (840,220) 157,907 365,733 2,344,505 982,218 15,203,596 1,123,546 16,327,142
Total comprehensive income for the year -
Profit for the year - - - - - - - 1,219,250 1,219,250 442,932 1,662,182
Transfer to contingency reserves - - - - - - 377,508 (377,508) - - -
Transfer to statutory reserves - - 14,629 - - - - (14,629) - - -
Other comprehensive income
Changes in fair value of available-for-sale
financial assets - - - - 569,321 - - 569,321 - 569,321
Total comprehensive income for the year - - 14,629 - - 569,321 377,508 827,113 1,788,571 442,932 2,231,503
Transactions with owners, recorded directly in equity
Dividends to equity holders - - - - - - - (310,212) (310,212) - (310,212)
Equity- settled share-based payments expense - - - - 158,675 - - - 158,675 - 158,675
Vested portion of equity settled share based
payment - - - 535,296 (283,604) - - 320,950 572,642 - 572,642
Total transactions with owners of equity - - - 535,296 (124,929) - - 10,738 421,105 - 421,105
Changes in ownership interest
Acquisition of subsidiary with NCI - - - - - - - - - 639,144 639,144
Total changes in ownership interests - - - - - - - - - 639,144 639,144
Balance at 31 December 2015 5,250,000 4,443,453 2,514,629 (304,924) 32,978 935,054 2,722,013 1,820,069 17,413,272 2,205,622 19,618,894
59

AXA Mansard Insurance plc and Subsidiary Companies
Statement of Changes in Equity(All amounts in thousands of Naira unless otherwise stated)
Year ended 31 December 2016
Parent
Share Share Treasury Capital Share Fair Contingency Retained Total
Capital premium shares reserves scheme value reserve earnings
reserve reserves
Balance at 1 January 2016 5,250,000 4,443,453 (304,924) 2,500,000 32,978 851,929 2,722,013 (98,290) 15,397,159
Total comprehensive income for the year
Profit for the year - - - - - - - 1,040,379 1,040,379
Transfer to contingency reserves - - - - - - 451,887 (451,887) -
Other comprehensive income
Changes in fair value of available-for-sale financial
assets - - - - - (1,709,859) - - (1,709,859)
Total comprehensive income for the year - - - - - (1,709,859) 451,887 588,492 (669,480)
Transactions with owners, recorded directly in equity
Contributions by and distributions to owners
Dividends to equity holders - - - - - - - (206,809) (206,809)
Equity- settled share-based expense for the year - - - - 60,922 - - - 60,922
Total transactions with owners - - - - 60,922 - - (206,809) (145,887)
Balance at 31 December 2016 5,250,000 4,443,453 (304,924) 2,500,000 93,900 (857,930) 3,173,900 283,393 14,581,792
Year ended 31 December 2015
Parent
Fair
Share Share Treasury Other Share value Contingency Retained Total
Capital premium shares reserves scheme reserves reserve earnings
reserve
Balance at 1 January 2015 5,250,000 4,443,453 (840,220) 2,500,000 157,907 389,567 2,344,505 (197,617) 14,047,595
Total comprehensive income for the year
Profit for the year - - - - - - - 466,097 466,097
Other comprehensive income - - - - - - 466,097 466,097
Change in fair value of available-for-sale financial
assets - - - - - 462,362 - - 462,362
Total comprehensive income for the year - - - - - 462,362 - 466,097 928,459
Transactions with owners, recorded directly in equity
Transfer to contingency reserves - - - - - - 377,508 (377,508) - Issue of new shares - - - - - - - - Equity- settled share-based transactions - - - - 158,675 - - - 158,675
Dividends to equity holders - - - - - - - (310,212) (310,212)
Transfer of vested portion of equity settled share
based payment to retained earnings - - 535,296 - (283,604) - - 320,950 572,642
Total transactions with owners - - 535,296 - (124,929) - 377,508 (366,770) 421,105
Balance at 31 December 2015 5,250,000 4,443,453 (304,924) 2,500,000 32,978 851,929 2,722,013 (98,290) 15,397,159
60
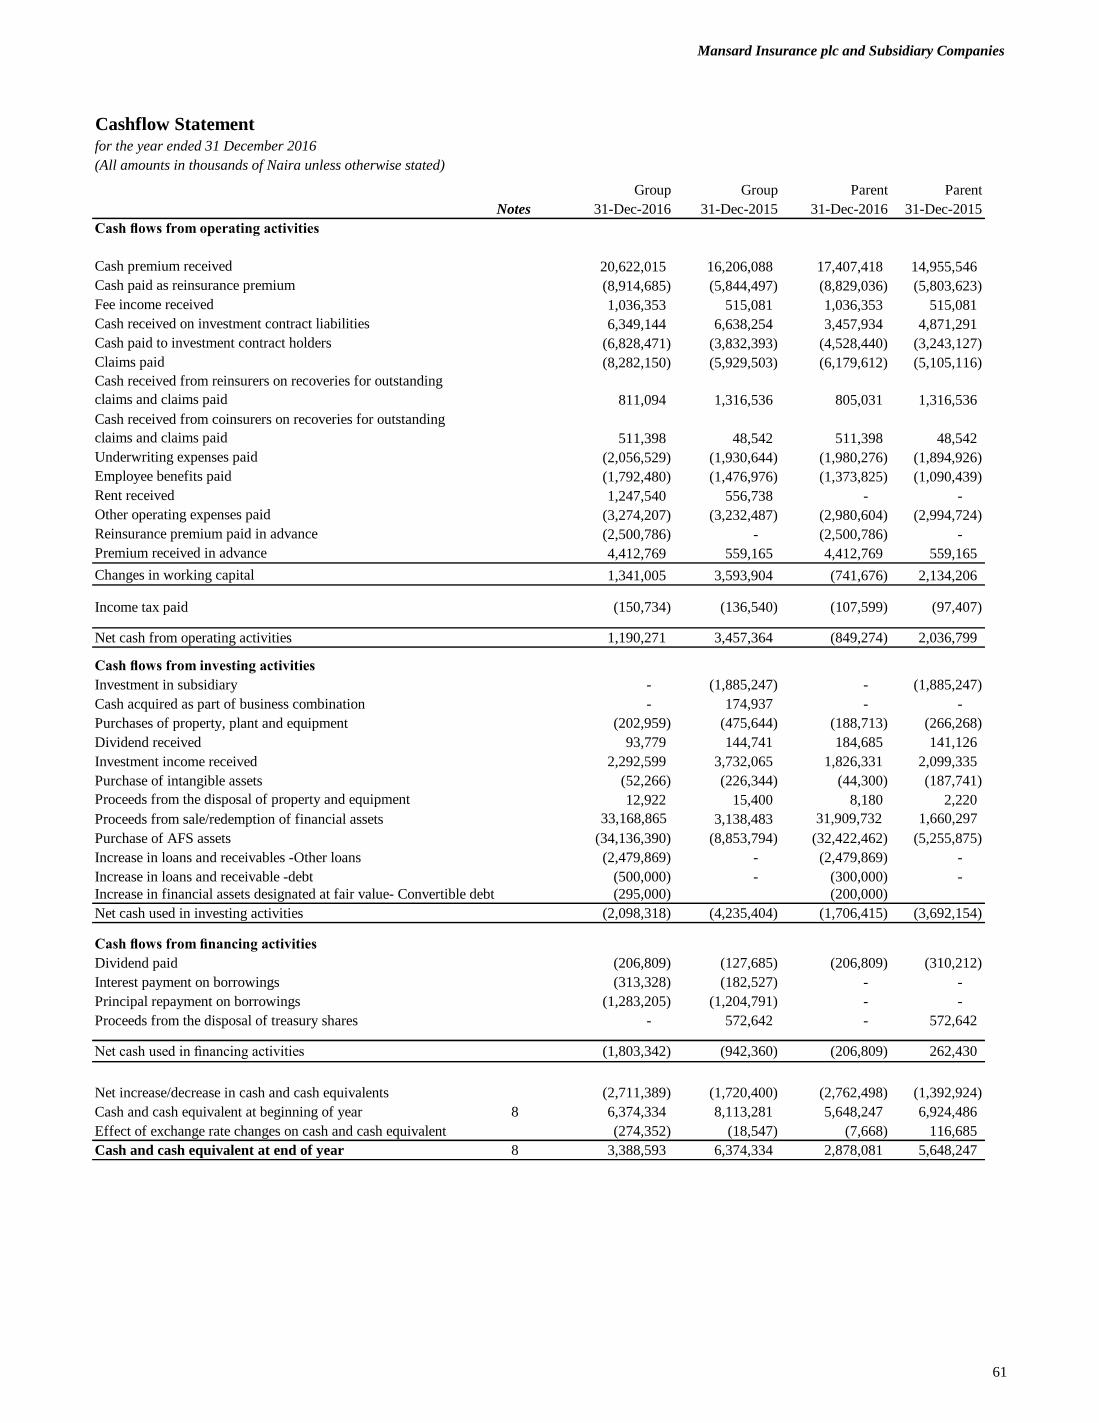
Mansard Insurance plc and Subsidiary Companies
Cashflow Statementfor the year ended 31 December 2016
(All amounts in thousands of Naira unless otherwise stated)
Group Group Parent Parent
Notes 31-Dec-2016 31-Dec-2015 31-Dec-2016 31-Dec-2015
Cash flows from operating activities
Cash premium received 20,622,015 16,206,088 17,407,418 14,955,546
Cash paid as reinsurance premium (8,914,685) (5,844,497) (8,829,036) (5,803,623)
Fee income received 1,036,353 515,081 1,036,353 515,081
Cash received on investment contract liabilities 6,349,144 6,638,254 3,457,934 4,871,291
Cash paid to investment contract holders (6,828,471) (3,832,393) (4,528,440) (3,243,127)
Claims paid (8,282,150) (5,929,503) (6,179,612) (5,105,116)
Cash received from reinsurers on recoveries for outstanding
claims and claims paid 811,094 1,316,536 805,031 1,316,536
Cash received from coinsurers on recoveries for outstanding
claims and claims paid 511,398 48,542 511,398 48,542
Underwriting expenses paid (2,056,529) (1,930,644) (1,980,276) (1,894,926)
Employee benefits paid (1,792,480) (1,476,976) (1,373,825) (1,090,439)
Rent received 1,247,540 556,738 - -
Other operating expenses paid (3,274,207) (3,232,487) (2,980,604) (2,994,724)
Reinsurance premium paid in advance (2,500,786) - (2,500,786) -
Premium received in advance 4,412,769 559,165 4,412,769 559,165
Changes in working capital 1,341,005 3,593,904 (741,676) 2,134,206
Income tax paid (150,734) (136,540) (107,599) (97,407)
Net cash from operating activities 1,190,271 3,457,364 (849,274) 2,036,799
Cash flows from investing activities
Investment in subsidiary - (1,885,247) - (1,885,247)
Cash acquired as part of business combination - 174,937 - -
Purchases of property, plant and equipment (202,959) (475,644) (188,713) (266,268)
Dividend received 93,779 144,741 184,685 141,126
Investment income received 2,292,599 3,732,065 1,826,331 2,099,335
Purchase of intangible assets (52,266) (226,344) (44,300) (187,741)
Proceeds from the disposal of property and equipment 12,922 15,400 8,180 2,220
Proceeds from sale/redemption of financial assets 33,168,865 3,138,483 31,909,732 1,660,297
Purchase of AFS assets (34,136,390) (8,853,794) (32,422,462) (5,255,875)
Increase in loans and receivables -Other loans (2,479,869) - (2,479,869) -
Increase in loans and receivable -debt (500,000) - (300,000) -
Increase in financial assets designated at fair value- Convertible debt (295,000) (200,000)
Net cash used in investing activities (2,098,318) (4,235,404) (1,706,415) (3,692,154)
Cash flows from financing activities
Dividend paid (206,809) (127,685) (206,809) (310,212)
Interest payment on borrowings (313,328) (182,527) - -
Principal repayment on borrowings (1,283,205) (1,204,791) - -
Proceeds from the disposal of treasury shares - 572,642 - 572,642
Net cash used in financing activities (1,803,342) (942,360) (206,809) 262,430
Net increase/decrease in cash and cash equivalents (2,711,389) (1,720,400) (2,762,498) (1,392,924)
Cash and cash equivalent at beginning of year 8 6,374,334 8,113,281 5,648,247 6,924,486
Effect of exchange rate changes on cash and cash equivalent (274,352) (18,547) (7,668) 116,685
Cash and cash equivalent at end of year 8 3,388,593 6,374,334 2,878,081 5,648,247
61

AXA Mansard Insurance plc and Subsidiary Companies
Notes to the financial statementsFor the year ended 31 December 2016
2.3
(a) Fair value of financial assets
(i) Impairment of available-for-sale equity financial assets
(ii) Fair value of unquoted equity financial instruments
(b ) Liabilities arising from insurance contracts
(i) Claims arising from non-life insurance contracts
(c ) Impairment for receivables
(d) Intangibles (goodwill)
Goodwill represents the cost of acquisition less the aggregate of the fair value of the purchased entity’s identifiable net assets and liabilities.
Goodwill has been recognised by the group at the acquisition of AXA Mansard Pensions Limited (formerly Penman Pensions Limited) in 2015
and AXA Mansard Health Limited in 2013. Additional judgments and assumptions are as disclosed in note 17(b)ii. Based on the impairment
assessment carried out as at 31 December 2016, no charge has been recognised. See note 17 for details of the sensitivity performed for goodwill.
Critical accounting estimates and judgments
The Group determines that available-for-sale equity financial assets are impaired when there has been a significant or prolonged decline in the
fair value below its cost. This determination of what is significant or prolonged requires judgment. In making this judgment, the Group evaluates
among other factors, the normal volatility in share price, the financial health of the investee, industry and sector performance, changes in
technology, and operational and financing cash flow. In this respect, a decline of 20% or more is regarded as significant, and a period longer than
12 months is considered to be prolonged. If any such quantitative evidence exists for available-for-sale financial assets, the asset is considered for
impairment, taking qualitative evidence into account. For the year ended 31 December 2016, if the decline in the value of the AFS equity
instruments were considered prolonged, an impairment of N60 million (2015: N149 million) would have been adjusted for in the Statement of
Comprehensive Income.
The Group makes estimates and assumptions that affect the reported amounts of assets and liabilities within the financial year. Estimates and
judgments are continually evaluated and based on historical experience and other factors, including expectations of future events that are
believed to be reasonable under the circumstances.
The Group tests periodically whether premium receivables have suffered any impairment. With this policy, all premium transactions are paid for
immediately except in the case of brokered transactions. For brokered transactions, the period is extended for 30 days if credit notes have been
received from the broker. If all insurance receivables within 30 days and reinsurance receivables within 90 days were deemed as impaired, a total
impairment of N8 million (2015: N178 million) would have been recognised in the income statement See note 10.1 (a) for details.
The liabilities for life insurance contracts are estimated using appropriate and acceptable base tables of standard mortality according to the type
of contract being written. Management make various assumptions such as expenses inflation, valuation interest rate, mortality and further
mortality improved in estimating the required reserves for life contracts. However if the group should change its basis for mortality by -5%, the
group would have recognised an actuarial valuation deficit of N622,000 (2015: N8.9 million) in the Statement of Comprehensive Income.
The fair value of financial instruments where no active market exists or where quoted prices are not otherwise available are determined by
using the income approach. In these cases the fair values are estimated from observable data using valuation models. The models used to
determine fair values are validated and periodically reviewed by qualified personnel independent of those that sourced them. All models are
certified before they are used, and models are calibrated to ensure that outputs reflect actual data and comparative market prices. Changes in
assumptions about these factors could affect the reported fair value of financial instruments.
Claims on non-life insurance contracts are payable on a claims-occurrence basis. The Group is liable for all insured events that occur during the
term of the contract. There are several variables that affect the amount and timing of cash flows from these contracts. These mainly relate to the
inherent risks of the business activities carried out by individual contract holders and the risk management procedures adopted. The estimated
cost of claims includes direct expenses to be incurred in settling claims, net of the expected subrogation value and other recoveries. The Group
takes all reasonable steps to ensure that it has appropriate information regarding its claims exposures. However, given the uncertainty in
establishing claims provisions, it is likely that the final outcome will prove to be different from the original liability established. A sensitivity
analysis was done to determine how the IBNR reserve amount would change if we were to consider the 75th percentile as opposed to the best
estimate figures included in the reserve reviews as at 31 December 2016 and an additional gross provision of N229 million (2015: N326 million)
would have been reported.
(ii) Liabilities arising from life insurance contracts
62

AXA Mansard Insurance plc and Subsidiary Companies
Notes to the financial statementsFor the year ended 31 December 2016
(e) Investment property
(f) Derivative instruments
(g) Share based payments
The Group measures the cost of equity settled transactions using fair value of the equity instrument at the grant date. The estimation of the fair
value requires the determination of the most appropriate model which is dependent on the terms of the grant. The estimate also requires making
assumption on the most appropriate inputs for the valuation model on items such as expected life of the share option, volatility and dividend
yield. The assumptions used in estimating the fair value of the share based payments have been disclosed in Note 46.
The Group's Investment property -Mansard Place- is accounted for in the books of APD Limited. The property was valued using the income
approach. The valuation was based on market data such as discount rates, rental risk and reversionary rates. Management estimated the market
value of the leasehold interest based on the highest and best use of the property.
The Group invested in the convertible debt of Maryland Mall Limited. The convertible debt which is a 5- year instrument has been separated into
a debt portion and an option to convert to equity anytime before the expiration of the debt. In determining the value of the embedded value of
the option, the group used the Black Scholes Methodology of investment valuation. Major variables used in the valuation include risk free rate
on a 5- year FGN bond (15.85%), current price of the share as stated in the contract agreement (N615.41 per share) as well as the conversion
price per share (N650 per share). The assumptions used in estimating the fair value of derivatives have been disclosed in note 5.2
63

Notes to the financial statements
For the year ended 31 December 2016
AXA Mansard Insurance plc and Subsidiary Companies
Non life business Reserving
Reserving methodology
ClassLarge Claim Definition
(N'000)
Engineering 20,000
Oil and Energy 25,000
Fire 50,000
Marine Hull 25,000
The methodologies governing the attritional claim reserve calculations are described below:
Basic Chain Ladder Method (BCL)
IBNR = ultimate claim amount (excl. extreme large losses)
minus paid claims to date
minus claims outstanding (excl. extreme large losses)
Assumptions underlying the BCL
An implicit assumption is that, for an immature accident year, the claims observed thus far tell something about the claims yet to be observed.
A further assumption is that it assumes consistent claim processing, a stable mix of types of claims, stable inflation and stable policy limits.
Non life Business and Life Actuarial Valuation
AXA Mansard Insurance Plc (“AXA Mansard”) commissioned Alexander Forbes Consulting Actuaries Nigeria (“AFCAN”) to calculate non life
business reserves as at 31 December 2016.
The eight (8) classes of business that were reviewed are Aviation, Oil and Energy, Engineering, Fire, General Accident, Marine Cargo, Marine Hull
and Motor.
The reserves have been analysed gross of reinsurance. However, reserves net of reinsurance have been estimated based on historical risk retention.
Depending on the volume of data in the class of business, either the Basic Chain Ladder or Loss Ratio method was used in estimating the reserves. In
more recent years, and where the claim development seemed slower than in the past, a Bornhuetter – Ferguson (“BF”) method was used based on
expected loss ratios.
Claims of such a large nature are expected to have a very short reporting delay, and as such, no new large claims are expected to be reported. For this
reason, it was assumed that a pure Incurred But Not Reported (IBNR) reserve would not be necessary for these large claims. However, Incurred But
Not Enough Reported (IBNER) would be an important consideration for these claims. The methodology for reserving for the large losses is therefore
solely based on estimating the IBNER.
Development factors were calculated using the last 3 to 9 years’ of data by accident period. Ultimate development factors were calculated for each of
the permutations and judgment was applied in the selection of these factors.
Ultimate development factors were then applied to the paid data per accident half-year and an ultimate claim amount is calculated. The future claims
(the ultimate claim amount less paid claims to date) were allocated to future payment periods in line with the development patterns calculated above.
The outstanding claims reported to date are then subtracted from the total future claims to give the resulting IBNR figure per accident half-year.
For the Engineering, Oil and Energy, Fire and Marine Hull classes of business, claims paid data was sub-divided into large and attritional claims to
allow for the appropriate calculation of the reserves. Large claims are expected to behave differently from the attritional claims in terms of reporting
delays and development. The limits used for the classifications are given below:
The Basic Chain Ladder Method assumes that past experience is indicative of future experience i.e. that claims recorded to date will continue to
develop in a similar manner in the future.
64

Notes to the financial statements
For the year ended 31 December 2016
AXA Mansard Insurance plc and Subsidiary Companies
Loss Ratio method
IBNR= expected average ultimate annual loss ratio
multiplied by earned premium
minus experience to date
Assumptions underlying the Loss Ratio Method
AURR
AURR=
Sensitivity Analysis
Best Estimate 75th Percentile 90th Percentile
Aviation 26,941,533 36,654,683 42,482,574
Energy 220,641,245 280,140,685 315,840,349
Engineering 238,904,316 284,138,104 340,801,337
Fire 268,849,024 310,353,924 377,480,269
General Accident 58,873,804 66,390,985 76,342,463
Marine Cargo 27,308,954 40,751,374 61,909,579
Marine Hull 11,275,923 15,324,655 27,194,151
Motor 290,030,275 316,242,993 345,053,044
1,142,825,074 1,349,997,403 1,587,103,766
Unearned Premium Reserve (UPR) and Deferred Acquisition Cost (DAC)
maximum{0, [(combined ratio x UPR) - UPR)]}
The results of the P&C IBNR reserves as at 31 December 2016 at a 75th percentile indicated an increase of 18.25% from an actual reserve figure of
₦1,103,372,475 to ₦1,333,234,971. At the 90th percentile, the reserves are expected to increase by 39.15%.
In conclusion, there is only an 18% and 39% chance that the IBNR reserves required by AXA Mansard Insurance plc. will exceed ₦1,333,234,971
and ₦1,568,814,258 respectively as at 31 December 2016 on a gross basis.
Gross IBNR - Attritional Reserves
There was limited data for some of the classes. A BCL method was therefore inappropriate. We allowed for expected experience to date and the
average assumed ultimate loss ratio in carrying out the calculation.
An estimate of the average ultimate loss ratio needed to be assumed. We based the loss ratios off of experience that has been seen to date in previous
accident years.
A combined ratio for the 2016 financial year was calculated per class of business, taking into account the additional movement in claims reserves as
A sensitivity analysis was done to determine how the IBNR reserve amount would change if we were to consider the 75th percentile and 90th
percentile as opposed to our best estimate figures (which would represent the 50th percentile). This analysis was only done on the attritional IBNR as
there was not enough data to determine the percentiles for the large claims. For the classes that were modelled using triangulations, bootstrapping
was applied to determine the 75th and 90th percentile reserves. For the other classes, namely Aviation and Energy, a more simplistic Loss Ratio
approach was applied.
The unearned premium reserve and deferred acquisition cost were calculated using a time-apportionment basis, in particular, the 365ths method. In
the calculations, it was assumed that both the start and end date were included in the coverage period.
65
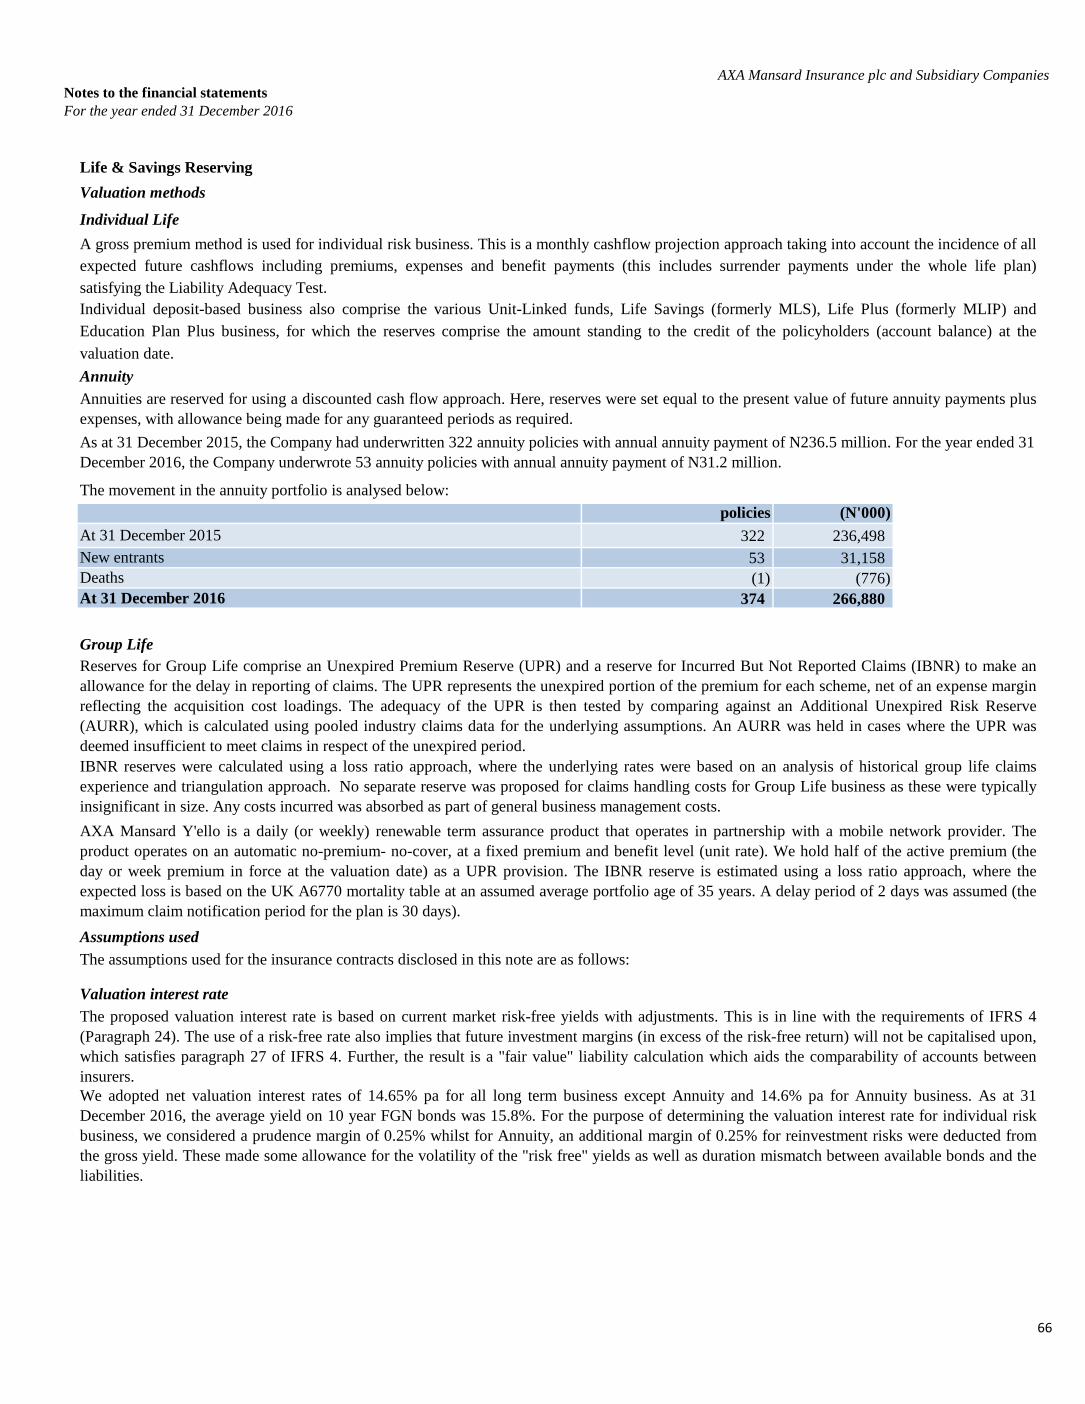
Notes to the financial statements
For the year ended 31 December 2016
AXA Mansard Insurance plc and Subsidiary Companies
Life & Savings Reserving
The movement in the annuity portfolio is analysed below: Number of annuity
policies
Annual Annuity
(N'000)
322 236,498
53 31,158
(1) (776)
374 266,880
The assumptions used for the insurance contracts disclosed in this note are as follows:
Assumptions used
Valuation interest rate
The proposed valuation interest rate is based on current market risk-free yields with adjustments. This is in line with the requirements of IFRS 4
(Paragraph 24). The use of a risk-free rate also implies that future investment margins (in excess of the risk-free return) will not be capitalised upon,
which satisfies paragraph 27 of IFRS 4. Further, the result is a "fair value" liability calculation which aids the comparability of accounts between
insurers.
We adopted net valuation interest rates of 14.65% pa for all long term business except Annuity and 14.6% pa for Annuity business. As at 31
December 2016, the average yield on 10 year FGN bonds was 15.8%. For the purpose of determining the valuation interest rate for individual risk
business, we considered a prudence margin of 0.25% whilst for Annuity, an additional margin of 0.25% for reinvestment risks were deducted from
the gross yield. These made some allowance for the volatility of the "risk free" yields as well as duration mismatch between available bonds and the
liabilities.
At 31 December 2015
New entrants
Deaths
At 31 December 2016
Reserves for Group Life comprise an Unexpired Premium Reserve (UPR) and a reserve for Incurred But Not Reported Claims (IBNR) to make an
allowance for the delay in reporting of claims. The UPR represents the unexpired portion of the premium for each scheme, net of an expense margin
reflecting the acquisition cost loadings. The adequacy of the UPR is then tested by comparing against an Additional Unexpired Risk Reserve
(AURR), which is calculated using pooled industry claims data for the underlying assumptions. An AURR was held in cases where the UPR was
deemed insufficient to meet claims in respect of the unexpired period.
AXA Mansard Y'ello is a daily (or weekly) renewable term assurance product that operates in partnership with a mobile network provider. The
product operates on an automatic no-premium- no-cover, at a fixed premium and benefit level (unit rate). We hold half of the active premium (the
day or week premium in force at the valuation date) as a UPR provision. The IBNR reserve is estimated using a loss ratio approach, where the
expected loss is based on the UK A6770 mortality table at an assumed average portfolio age of 35 years. A delay period of 2 days was assumed (the
maximum claim notification period for the plan is 30 days).
Group Life
IBNR reserves were calculated using a loss ratio approach, where the underlying rates were based on an analysis of historical group life claims
experience and triangulation approach. No separate reserve was proposed for claims handling costs for Group Life business as these were typically
insignificant in size. Any costs incurred was absorbed as part of general business management costs.
A gross premium method is used for individual risk business. This is a monthly cashflow projection approach taking into account the incidence of all
expected future cashflows including premiums, expenses and benefit payments (this includes surrender payments under the whole life plan)
satisfying the Liability Adequacy Test.
Individual deposit-based business also comprise the various Unit-Linked funds, Life Savings (formerly MLS), Life Plus (formerly MLIP) and
Education Plan Plus business, for which the reserves comprise the amount standing to the credit of the policyholders (account balance) at the
valuation date.
Annuities are reserved for using a discounted cash flow approach. Here, reserves were set equal to the present value of future annuity payments plus
expenses, with allowance being made for any guaranteed periods as required.
As at 31 December 2015, the Company had underwritten 322 annuity policies with annual annuity payment of N236.5 million. For the year ended 31
December 2016, the Company underwrote 53 annuity policies with annual annuity payment of N31.2 million.
Annuity
Valuation methods
Individual Life
66
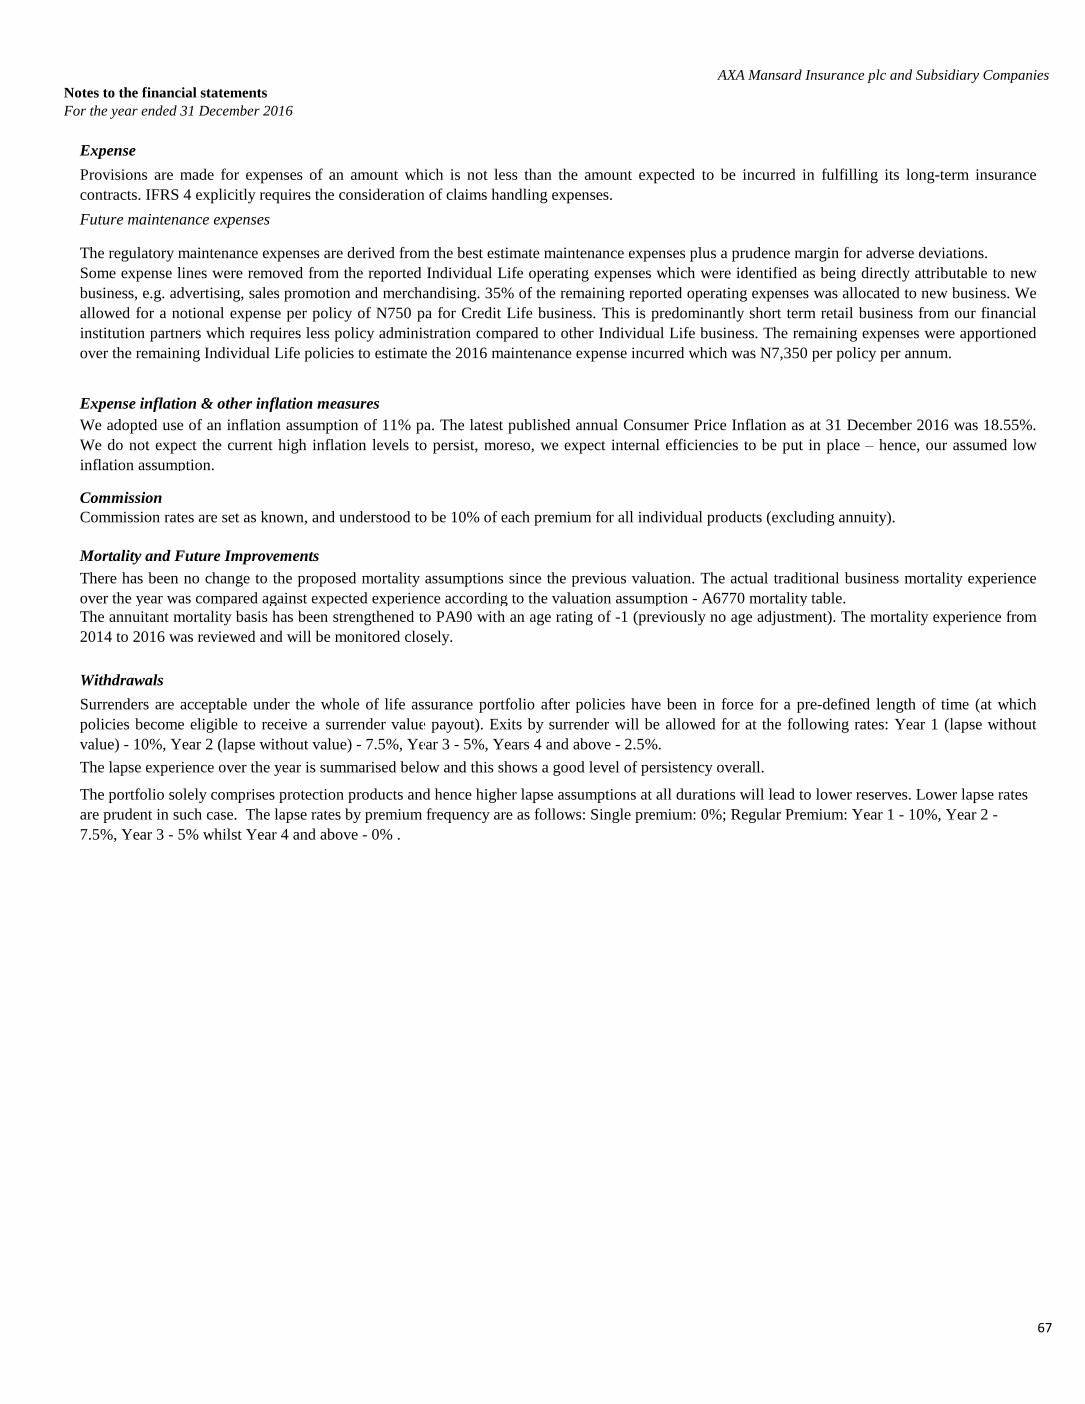
Notes to the financial statements
For the year ended 31 December 2016
AXA Mansard Insurance plc and Subsidiary Companies
Provisions are made for expenses of an amount which is not less than the amount expected to be incurred in fulfilling its long-term insurance
contracts. IFRS 4 explicitly requires the consideration of claims handling expenses.
The regulatory maintenance expenses are derived from the best estimate maintenance expenses plus a prudence margin for adverse deviations.
Some expense lines were removed from the reported Individual Life operating expenses which were identified as being directly attributable to new
business, e.g. advertising, sales promotion and merchandising. 35% of the remaining reported operating expenses was allocated to new business. We
allowed for a notional expense per policy of N750 pa for Credit Life business. This is predominantly short term retail business from our financial
institution partners which requires less policy administration compared to other Individual Life business. The remaining expenses were apportioned
over the remaining Individual Life policies to estimate the 2016 maintenance expense incurred which was N7,350 per policy per annum.
Expense inflation & other inflation measures
We adopted use of an inflation assumption of 11% pa. The latest published annual Consumer Price Inflation as at 31 December 2016 was 18.55%.
We do not expect the current high inflation levels to persist, moreso, we expect internal efficiencies to be put in place – hence, our assumed low
inflation assumption.
Commission
Expense
The annuitant mortality basis has been strengthened to PA90 with an age rating of -1 (previously no age adjustment). The mortality experience from
2014 to 2016 was reviewed and will be monitored closely.
Withdrawals
Surrenders are acceptable under the whole of life assurance portfolio after policies have been in force for a pre-defined length of time (at which
policies become eligible to receive a surrender value payout). Exits by surrender will be allowed for at the following rates: Year 1 (lapse without
value) - 10%, Year 2 (lapse without value) - 7.5%, Year 3 - 5%, Years 4 and above - 2.5%.
Future maintenance expenses
Commission rates are set as known, and understood to be 10% of each premium for all individual products (excluding annuity).
Mortality and Future Improvements
There has been no change to the proposed mortality assumptions since the previous valuation. The actual traditional business mortality experience
over the year was compared against expected experience according to the valuation assumption - A6770 mortality table.
The lapse experience over the year is summarised below and this shows a good level of persistency overall.
The portfolio solely comprises protection products and hence higher lapse assumptions at all durations will lead to lower reserves. Lower lapse rates
are prudent in such case. The lapse rates by premium frequency are as follows: Single premium: 0%; Regular Premium: Year 1 - 10%, Year 2 -
7.5%, Year 3 - 5% whilst Year 4 and above - 0% .
67
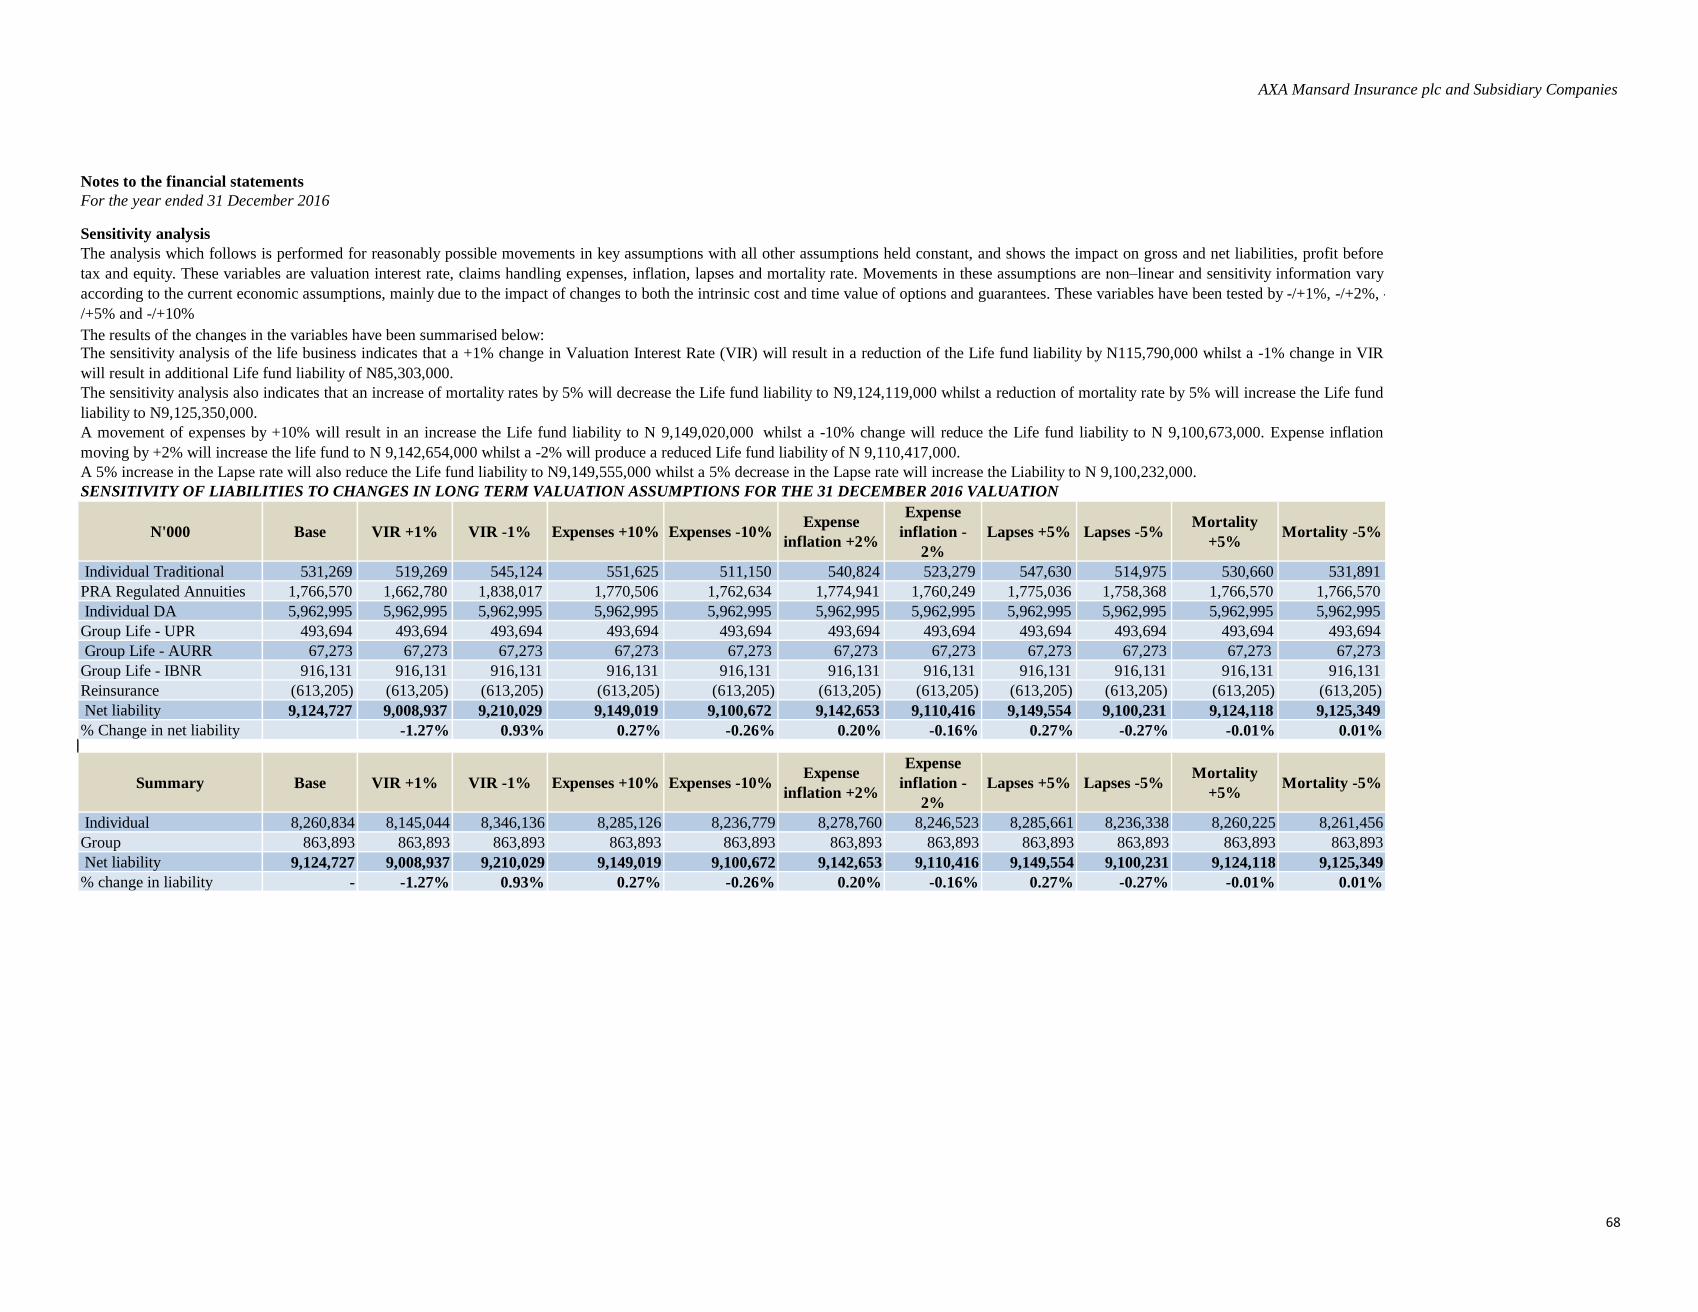
AXA Mansard Insurance plc and Subsidiary Companies
Notes to the financial statements
For the year ended 31 December 2016
Sensitivity analysis
SENSITIVITY OF LIABILITIES TO CHANGES IN LONG TERM VALUATION ASSUMPTIONS FOR THE 31 DECEMBER 2016 VALUATION
N'000 Base VIR +1% VIR -1% Expenses +10% Expenses -10%Expense
inflation +2%
Expense
inflation -
2%
Lapses +5% Lapses -5%Mortality
+5%Mortality -5%
Individual Traditional 531,269 519,269 545,124 551,625 511,150 540,824 523,279 547,630 514,975 530,660 531,891
PRA Regulated Annuities 1,766,570 1,662,780 1,838,017 1,770,506 1,762,634 1,774,941 1,760,249 1,775,036 1,758,368 1,766,570 1,766,570
Individual DA 5,962,995 5,962,995 5,962,995 5,962,995 5,962,995 5,962,995 5,962,995 5,962,995 5,962,995 5,962,995 5,962,995
Group Life - UPR 493,694 493,694 493,694 493,694 493,694 493,694 493,694 493,694 493,694 493,694 493,694
Group Life - AURR 67,273 67,273 67,273 67,273 67,273 67,273 67,273 67,273 67,273 67,273 67,273
Group Life - IBNR 916,131 916,131 916,131 916,131 916,131 916,131 916,131 916,131 916,131 916,131 916,131
Reinsurance (613,205) (613,205) (613,205) (613,205) (613,205) (613,205) (613,205) (613,205) (613,205) (613,205) (613,205)
Net liability 9,124,727 9,008,937 9,210,029 9,149,019 9,100,672 9,142,653 9,110,416 9,149,554 9,100,231 9,124,118 9,125,349
% Change in net liability -1.27% 0.93% 0.27% -0.26% 0.20% -0.16% 0.27% -0.27% -0.01% 0.01%
Summary Base VIR +1% VIR -1% Expenses +10% Expenses -10%Expense
inflation +2%
Expense
inflation -
2%
Lapses +5% Lapses -5%Mortality
+5%Mortality -5%
Individual 8,260,834 8,145,044 8,346,136 8,285,126 8,236,779 8,278,760 8,246,523 8,285,661 8,236,338 8,260,225 8,261,456
Group 863,893 863,893 863,893 863,893 863,893 863,893 863,893 863,893 863,893 863,893 863,893
Net liability 9,124,727 9,008,937 9,210,029 9,149,019 9,100,672 9,142,653 9,110,416 9,149,554 9,100,231 9,124,118 9,125,349
% change in liability - -1.27% 0.93% 0.27% -0.26% 0.20% -0.16% 0.27% -0.27% -0.01% 0.01%
A 5% increase in the Lapse rate will also reduce the Life fund liability to N9,149,555,000 whilst a 5% decrease in the Lapse rate will increase the Liability to N 9,100,232,000.
The analysis which follows is performed for reasonably possible movements in key assumptions with all other assumptions held constant, and shows the impact on gross and net liabilities, profit before
tax and equity. These variables are valuation interest rate, claims handling expenses, inflation, lapses and mortality rate. Movements in these assumptions are non–linear and sensitivity information vary
according to the current economic assumptions, mainly due to the impact of changes to both the intrinsic cost and time value of options and guarantees. These variables have been tested by -/+1%, -/+2%, -
/+5% and -/+10%
The results of the changes in the variables have been summarised below:The sensitivity analysis of the life business indicates that a +1% change in Valuation Interest Rate (VIR) will result in a reduction of the Life fund liability by N115,790,000 whilst a -1% change in VIR
will result in additional Life fund liability of N85,303,000.
The sensitivity analysis also indicates that an increase of mortality rates by 5% will decrease the Life fund liability to N9,124,119,000 whilst a reduction of mortality rate by 5% will increase the Life fund
liability to N9,125,350,000.
A movement of expenses by +10% will result in an increase the Life fund liability to N 9,149,020,000 whilst a -10% change will reduce the Life fund liability to N 9,100,673,000. Expense inflation
moving by +2% will increase the life fund to N 9,142,654,000 whilst a -2% will produce a reduced Life fund liability of N 9,110,417,000.
68
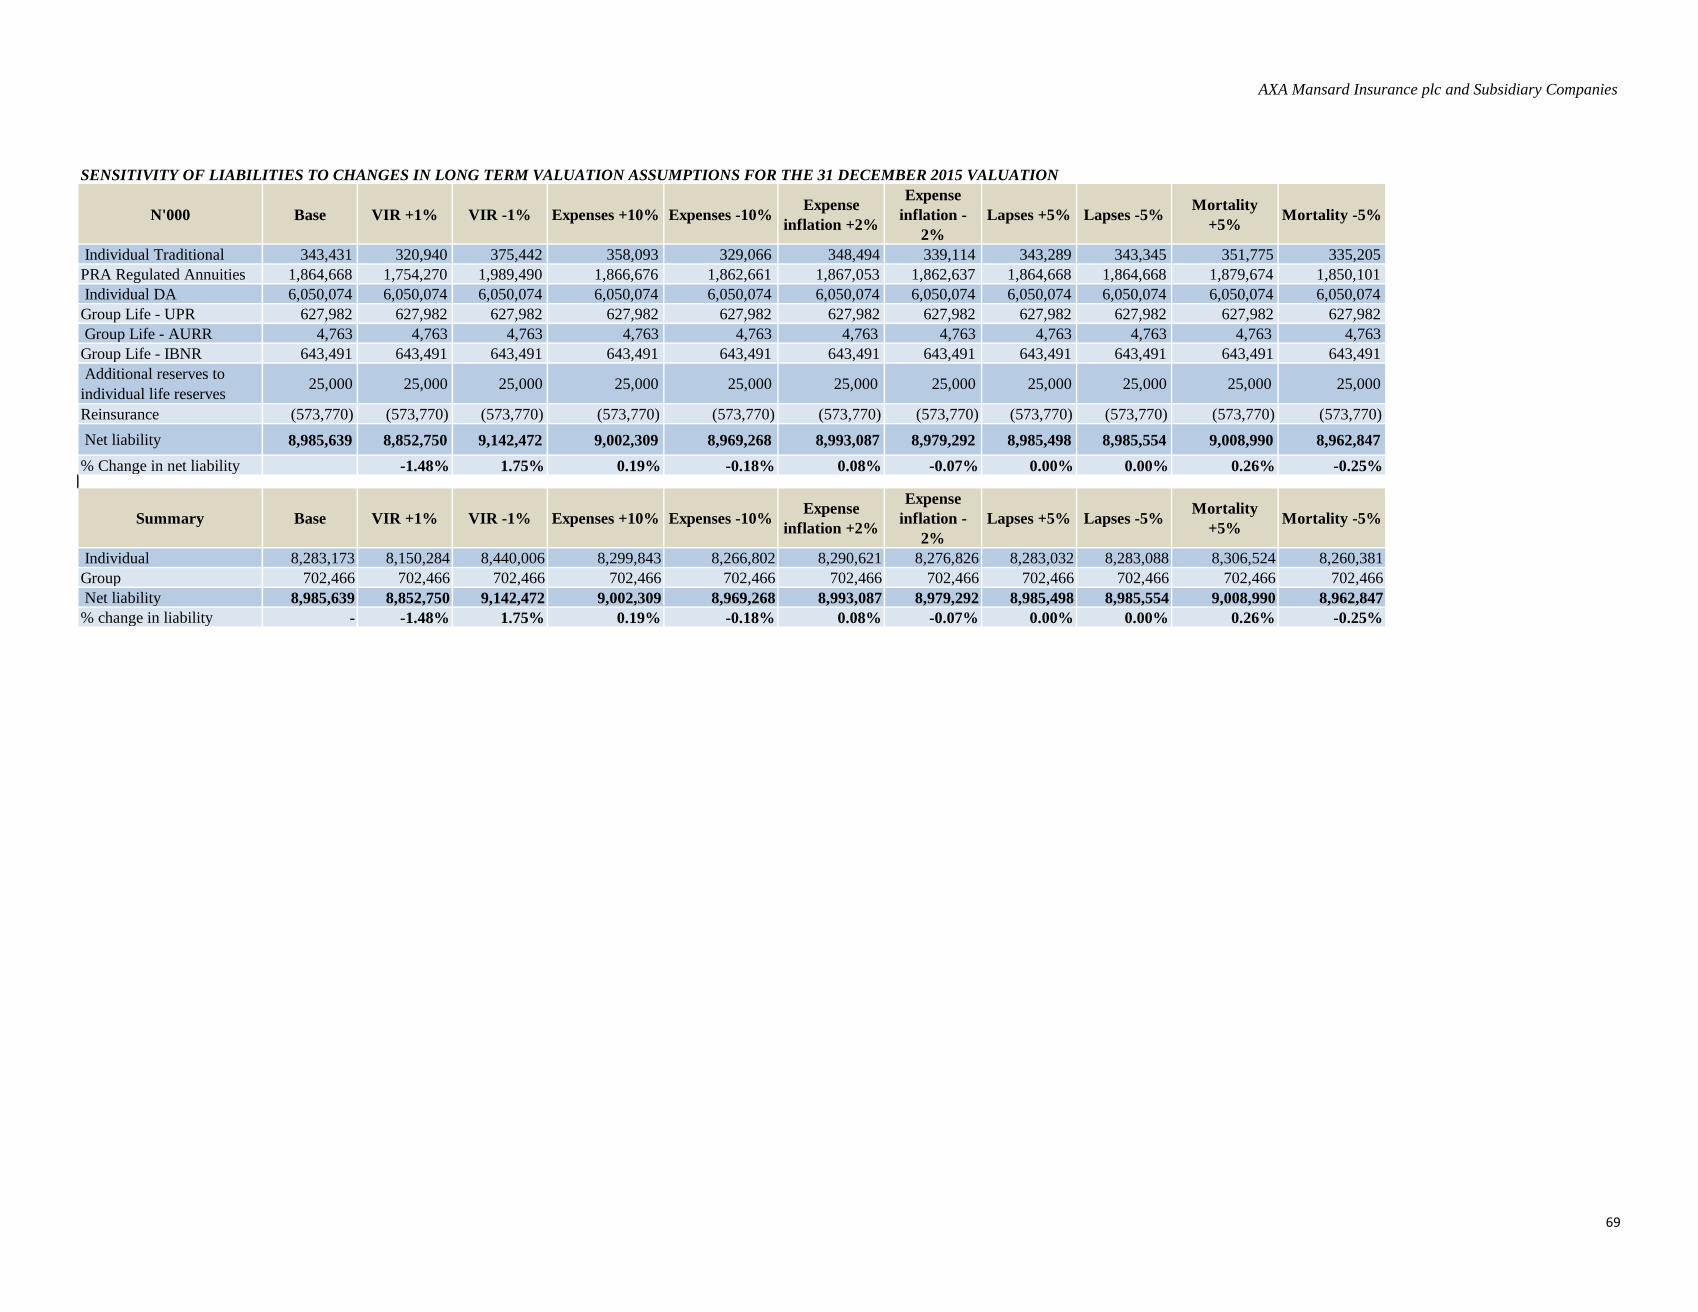
AXA Mansard Insurance plc and Subsidiary Companies
SENSITIVITY OF LIABILITIES TO CHANGES IN LONG TERM VALUATION ASSUMPTIONS FOR THE 31 DECEMBER 2015 VALUATION
N'000 Base VIR +1% VIR -1% Expenses +10% Expenses -10%Expense
inflation +2%
Expense
inflation -
2%
Lapses +5% Lapses -5%Mortality
+5%Mortality -5%
Individual Traditional 343,431 320,940 375,442 358,093 329,066 348,494 339,114 343,289 343,345 351,775 335,205
PRA Regulated Annuities 1,864,668 1,754,270 1,989,490 1,866,676 1,862,661 1,867,053 1,862,637 1,864,668 1,864,668 1,879,674 1,850,101
Individual DA 6,050,074 6,050,074 6,050,074 6,050,074 6,050,074 6,050,074 6,050,074 6,050,074 6,050,074 6,050,074 6,050,074
Group Life - UPR 627,982 627,982 627,982 627,982 627,982 627,982 627,982 627,982 627,982 627,982 627,982
Group Life - AURR 4,763 4,763 4,763 4,763 4,763 4,763 4,763 4,763 4,763 4,763 4,763
Group Life - IBNR 643,491 643,491 643,491 643,491 643,491 643,491 643,491 643,491 643,491 643,491 643,491
Additional reserves to
individual life reserves 25,000 25,000 25,000 25,000 25,000 25,000 25,000 25,000 25,000 25,000 25,000
Reinsurance (573,770) (573,770) (573,770) (573,770) (573,770) (573,770) (573,770) (573,770) (573,770) (573,770) (573,770)
Net liability 8,985,639 8,852,750 9,142,472 9,002,309 8,969,268 8,993,087 8,979,292 8,985,498 8,985,554 9,008,990 8,962,847
% Change in net liability -1.48% 1.75% 0.19% -0.18% 0.08% -0.07% 0.00% 0.00% 0.26% -0.25%
Summary Base VIR +1% VIR -1% Expenses +10% Expenses -10%Expense
inflation +2%
Expense
inflation -
2%
Lapses +5% Lapses -5%Mortality
+5%Mortality -5%
Individual 8,283,173 8,150,284 8,440,006 8,299,843 8,266,802 8,290,621 8,276,826 8,283,032 8,283,088 8,306,524 8,260,381
Group 702,466 702,466 702,466 702,466 702,466 702,466 702,466 702,466 702,466 702,466 702,466
Net liability 8,985,639 8,852,750 9,142,472 9,002,309 8,969,268 8,993,087 8,979,292 8,985,498 8,985,554 9,008,990 8,962,847
% change in liability - -1.48% 1.75% 0.19% -0.18% 0.08% -0.07% 0.00% 0.00% 0.26% -0.25%
69

Notes to the financial statements
For the year ended 31 December 2016
AXA Mansard Insurance plc. and Subsidiary Companies
4 Financial Risk Management
(a) Introduction and overview
• Market risk
• Credit risk
• Liquidity risk
4.1 Market risk
The identification, management, control, measurement and reporting of market risk are aligned towards the sub-risk categories namely:
• Price risk
• Foreign exchange risk
• Interest-rate risk
4.1.1 Price risk
The Group’s management of price risk is guided by the following limits:
• Investment quality and limit analysis
• Stop loss limit analysis
• Stock to total loss limit analysis
Investment quality and limit analysis
Stop loss limit analysis
STOP LOSS
LIMIT 25% Very liquid, high market capitalisation, low market volatility
23% Very liquid, moderate market capitalisation, low market volatility
20% Liquid, moderate market capitalisation, low market volatility
15% 20% 25%
N15,000,000 0.0% 25% 50%
N30,000,000 25% 50% 75%
N45,000,000 50% 75% 100%
>N45,000,000 100% 100% 100%
A summary of the Group’s Stop Loss Limit position on trading equities is as follows:
December 2016
Amounts in thousands of Naira
STOP LOSS LIMIT ANALYSIS ON GROUP'S QUOTED SECURITY PORTFOLIO
COST PRICE MARKET
PRICE
STOCK
CLASS
%
GAIN/LOSS
BENCHMARK EXCEPTION
213,041 253,053 A 19% 25% NO
99,800 113,724 A 14% 25% NO
21,267 20,527 C -3% 20% NO
20,345 18,325 A -10% 25% NO39,501 65,603 C 66% 20% NO
471,232
STOP LOSS LIMIT ANALYSIS ON COMPANY'S QUOTED SECURITY
COST PRICE MARKET
PRICE
STOCK
CLASS
%
GAIN/LOSS
BENCHMARK EXCEPTION
152,169 184,976 A 22% 25% NO54,538 62,827 A 15% 25% NO
21,267 20,527 C -3% 20% NO
16,705 14,685 A -12% 25% NO39,501 65,603 C 66% 20% NO
348,618
The Group is exposed to a range of financial risks through its financial instruments, insurance assets and insurance liabilities. The key financial risk is that in
the long term its investments proceeds are not sufficient to fund the obligations arising from its insurance and investment contracts. The most important
components of the financial risks are:
Management Underwriting & Investment Committee establishes and approves a list of eligible listed and unlisted stocks aligned with investment
approval/dealer limits as approved by the Board through its Board Finance and Investment Committee.
Market capitalizations, liquidity and market volatiles are criteria used to classify certain eligible stocks. These are in categories A, B and C. Stop loss limits
(which depict the volume of loss the Group is willing to accept) are ascribed to each stock category. Periodic reviews and reassessments are undertaken on the
performance of the stocks. The stop loss limits on categories of stocks as approved by Management Underwriting & Investment Committee are depicted below:
CHARATERISTICS
Total
Total
SECTOR OF STOCK
CLASS
A
B
C
SECTOR OF STOCK
Building materials
Consumer goods
Consumer goods
Oil and gas
Insurance
Building materials
The approved stop loss limit below shows the percentage of stock positions that can be sold given a position of events: a given percentage loss and absolute
loss amounts. For example, a combination of 20% loss and N15 million loss would require the Company to sell down 25% of the position.
Maximum losses permissible
in Naira
Percentage losses
The Group’s Enterprise Risk Management (ERM) function monitors compliance of the Investment arm to these limits and reports to Management on a weekly
basis.
InsuranceOil and gas
Banking
Banking
70

Notes to the financial statements
For the year ended 31 December 2016
AXA Mansard Insurance plc. and Subsidiary Companies
December 2015
Amounts in thousands of Naira
STOP LOSS LIMIT ANALYSIS ON COMPANY'S QUOTED SECURITY
COST PRICE MARKET
PRICE
STOCK
CLASS
%
GAIN/LOSS
BENCHMARK EXCEPTION
27,517 24,127 A -12% 25% NO
16,281 13,271 A -18% 25% NO
48,412 39,368 C -19% 20% NO61,772 51,241 A -17% 25% NO
13,258 11,281 C -15% 20% NO
139,288
STOP LOSS LIMIT ANALYSIS ON COMPANY'S QUOTED SECURITY
COST PRICE MARKET
PRICE
STOCK
CLASS
%
GAIN/LOSS
BENCHMARK EXCEPTION
36,217 30,478 A -16% 25% NO
16,281 13,271 A -18% 25% NO
48,412 39,368 C -19% 20% NO41,272 38,277 A -7% 25% NO13,258 11,281 C -15% 20% NO
132,675
Stock to Total Limit Analysis
A summary of the Group’s stock to total limit position on equities is as follows:
DEC 2016 DEC 2016 DEC 2015 DEC 2015
GROUP GROUP GROUP GROUP
MARKET
PRICE % of Total
MARKET
PRICE % of Total
253,053 54% 39,345 5%
104,924 22% 25,983 3%
20,527 4% 4,495 1%
18,325 4% 19,903 3%
Oil and Gas 65,603 14% 83,728 11%
8,800 2% 8,800 1%
- 0% 600,562 77%
471,232 782,816
DEC 2016 DEC 2016 DEC 2015 DEC 2015
PARENT PARENT PARENT PARENT MARKET
PRICE %
MARKET
PRICE %
- 0% 600,562 78%
184,976 53% 29,902 4%
54,027 15% 25,983 3%
20,527 6% 4,125 1%
14,685 4% 19,903 3%
Oil and Gas 65,603 19% 83,728 11%
8,800 3% 8,800 1%
348,618 773,003
STOCK TO TOTAL LIMIT ON GROUP'S INVESTMENT EQUITY SECURITY
The Group manages its exposure to price risk through adherence to stop loss limits and investment in eligible stocks as approved by the Board. Potential losses
and exception as seen in the schedule above were within the Group’s stated risk appetite.
The Group further reduces its exposure to price risk with relatively low investment in quoted equities. The position held on quoted equities by the Company
and Group is less than 6% of its investment portfolio mitigating the effect of price volatilities.
Considering the volatility of stocks (typically quoted stocks), the Group monitors the contribution of stocks within each sector to the total stocks holding in a
portfolio. The objective of the analysis is to evaluate the Company’s concentration on stocks within each sector and ultimately exposure to market volatility if
the price of any of the stocks should drastically plummet.
Oil and gas
Total
Banking
Building materials
Insurance
Consumer goods
Insurance
Real estate
Banking and other financial institutions
Building materials
Telecoms
Total
SECTOR OF STOCK
SECTOR OF STOCK
Total
Consumer goodsInsurance
Building materials
Banking
Real estate
Telecommunication
SECTOR OF STOCK
Banking and other financial institutions
Building materials
Oil and gas
Total
Consumer goods
Consumer goods
Insurance
SECTOR OF STOCK
STOCK TO TOTAL LIMIT ON COMPANY'S INVESTMENT EQUITY SECURITY
71

Notes to the financial statements
For the year ended 31 December 2016
AXA Mansard Insurance plc. and Subsidiary Companies
Increase by
13.5%
Increase by
20%
Decrease by
13.5%
Decrease by
20%
Gross amount
Government & corporate bonds 11,563,035 1,561,010 2,312,607 (1,561,010) (2,312,607)
Tenored deposits with maturity above 90 days 623,463 84,168 124,693 (84,168) (124,693)
Treasury bills 4,032,049 544,327 806,410 (544,327) (806,410)
Equity securities 543,805 73,414 108,761 (73,414) (108,761)
Investment funds 777,017 104,897 155,403 (104,897) (155,403)
3,325,455 448,936 665,091 (448,936) (665,091)
2,816,751 4,172,965 (2,816,751) (4,172,965)
Increase by
13.5%
Increase by
20%
Decrease by
13.5%
Decrease by
20%
Gross amount
Government & corporate bonds 10,045,740 1,356,175 2,009,148 (1,356,175) (2,009,148)
Tenored deposits with maturity above 90 days 623,463 84,168 124,693 (84,168) (124,693)
Treasury bills 2,523,446 340,665 504,689 (340,665) (504,689)
Equity securities 421,191 56,861 84,238 (56,861) (84,238)
Investment funds 620,630 83,785 124,126 (83,785) (124,126)
2,916,719 393,757 583,344 (393,757) (583,344)
2,315,410 3,430,238 (2,315,410) (3,430,238)
31-Dec-15
Group
Increase by
13.5%
Increase by
20%
Decrease by
13.5%
Decrease by
20%
Investment securities
Gross amount
(2) Available for sale assets 16,333,844 2,205,069 3,266,769 (2,205,069) (3,266,769)
7,657,492 1,033,761 1,531,498 (1,033,761) (1,531,498)
Impact on profit before tax 3,238,830 4,798,267 (3,238,830) (4,798,267)
Parent
Increase by
13.5%
Increase by
20%
Decrease by
13.5%
Decrease by
20%
Investment securities
Gross amount
(2) Available for sale assets 13,973,364 1,886,404 2,794,673 (1,886,404) (2,794,673)
4,130,895 557,671 826,179 (557,671) (826,179)
Impact on profit before tax 2,444,075 3,620,852 (2,444,075) (3,620,852)
4.1.2 Foreign Exchange Risk
The carrying amounts of the Group’s foreign currency denominated assets and liabilities at end of the year are as follows:
GroupUSD EUR GBP USD EUR GBP
1,989,244 46,820 (1,292) 135,569 (529) (540)
Investment securities -Available-for-sale 473,396 - - 600,562 - 31,229
Borrowings 3,506,545 - - 3,351,463 - -
Parent
USD EUR GBP USD EUR GBP
1,854,148 46,820 - 14,197 (529) (540)
Investment securities -Available-for-sale 473,396 - - 600,562 - 31,229
(3) Financial assets designated at fair value
31 December 2016
PRICE RISK SENSITIVITY
Impact on profit before tax
Investment securities
Parent
Group
Impact on profit before tax
Investment securities
(3) Financial assets designated at fair value
Financial assets designated at fair value
Cash and cash equivalents
Cash and cash equivalents
Financial assets designated at fair value
31 December 2015
AXA Mansard Insurance Group is exposed to foreign exchange currency risk primarily through undertaking certain transactions denominated in foreign
currency. The Group is exposed to foreign currency risk through its investment in bank balances, fixed deposits and bonds denominated in foreign currencies.
31 December 2016
PRICE RISK SENSITIVITY
72
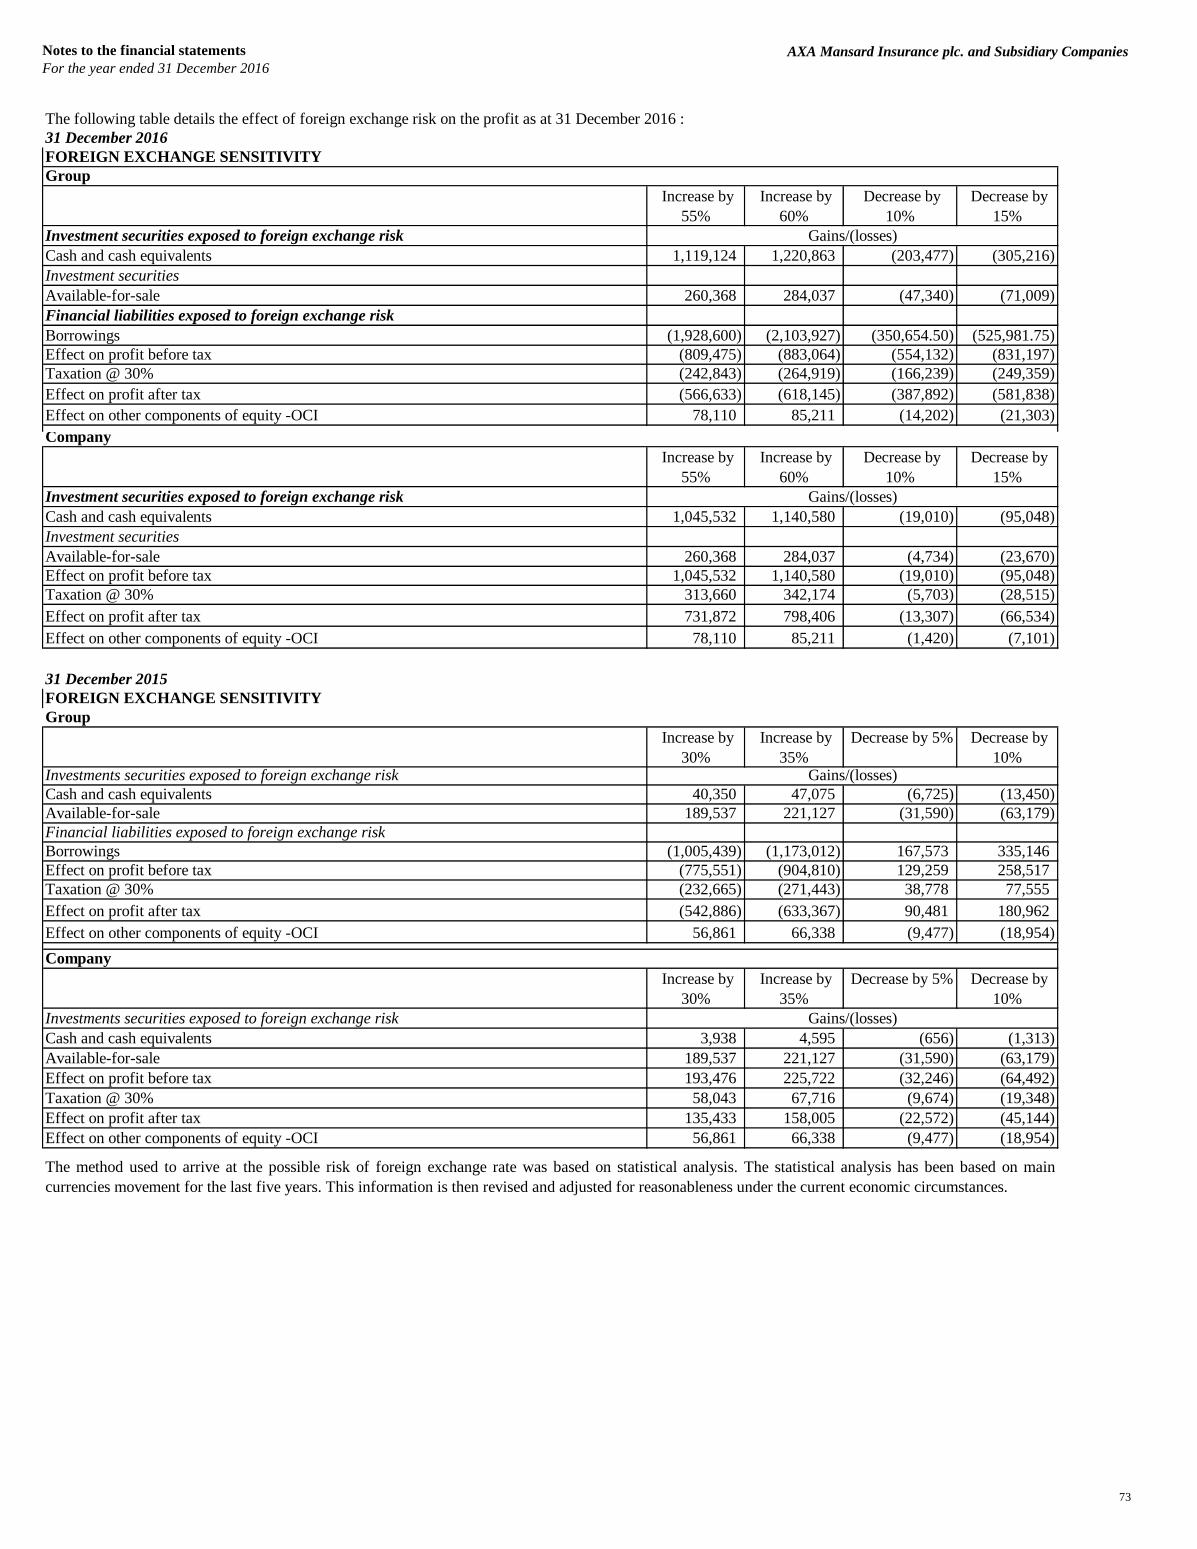
Notes to the financial statements
For the year ended 31 December 2016
AXA Mansard Insurance plc. and Subsidiary Companies
The following table details the effect of foreign exchange risk on the profit as at 31 December 2016 :
31 December 2016
Increase by
55%
Increase by
60%
Decrease by
10%
Decrease by
15%
1,119,124 1,220,863 (203,477) (305,216)
260,368 284,037 (47,340) (71,009)
(1,928,600) (2,103,927) (350,654.50) (525,981.75)
(809,475) (883,064) (554,132) (831,197)
(242,843) (264,919) (166,239) (249,359)
(566,633) (618,145) (387,892) (581,838)
78,110 85,211 (14,202) (21,303)
Increase by
55%
Increase by
60%
Decrease by
10%
Decrease by
15%
1,045,532 1,140,580 (19,010) (95,048)
260,368 284,037 (4,734) (23,670)
1,045,532 1,140,580 (19,010) (95,048)
313,660 342,174 (5,703) (28,515)
731,872 798,406 (13,307) (66,534)
78,110 85,211 (1,420) (7,101)
31 December 2015
Group
Increase by
30%
Increase by
35%
Decrease by 5% Decrease by
10%
40,350 47,075 (6,725) (13,450)
189,537 221,127 (31,590) (63,179)
(1,005,439) (1,173,012) 167,573 335,146
(775,551) (904,810) 129,259 258,517
(232,665) (271,443) 38,778 77,555
(542,886) (633,367) 90,481 180,962
56,861 66,338 (9,477) (18,954)
Increase by
30%
Increase by
35%
Decrease by 5% Decrease by
10%
3,938 4,595 (656) (1,313)
189,537 221,127 (31,590) (63,179)
193,476 225,722 (32,246) (64,492)
58,043 67,716 (9,674) (19,348)
135,433 158,005 (22,572) (45,144)
56,861 66,338 (9,477) (18,954)
Available-for-sale
Group
Effect on other components of equity -OCI
Cash and cash equivalents
Financial liabilities exposed to foreign exchange risk
Effect on profit after tax
FOREIGN EXCHANGE SENSITIVITY
Cash and cash equivalents
Investments securities exposed to foreign exchange risk
Financial liabilities exposed to foreign exchange risk
Borrowings
Company
Investment securities
Investment securities
Company
Effect on profit before tax
Investment securities exposed to foreign exchange risk
Available-for-sale
Cash and cash equivalents
Available-for-sale
Effect on profit before tax
The method used to arrive at the possible risk of foreign exchange rate was based on statistical analysis. The statistical analysis has been based on main
currencies movement for the last five years. This information is then revised and adjusted for reasonableness under the current economic circumstances.
Effect on profit after tax
Taxation @ 30%
Effect on other components of equity -OCI
Available-for-sale
Investments securities exposed to foreign exchange risk
Effect on profit after tax
Taxation @ 30%
Effect on other components of equity -OCI
Cash and cash equivalents
Effect on profit before tax
Gains/(losses)
Gains/(losses)
Taxation @ 30%
Effect on profit before tax
Effect on other components of equity -OCI
FOREIGN EXCHANGE SENSITIVITY
Gains/(losses)
Gains/(losses)
Investment securities exposed to foreign exchange risk
Borrowings
Taxation @ 30%
Effect on profit after tax
73
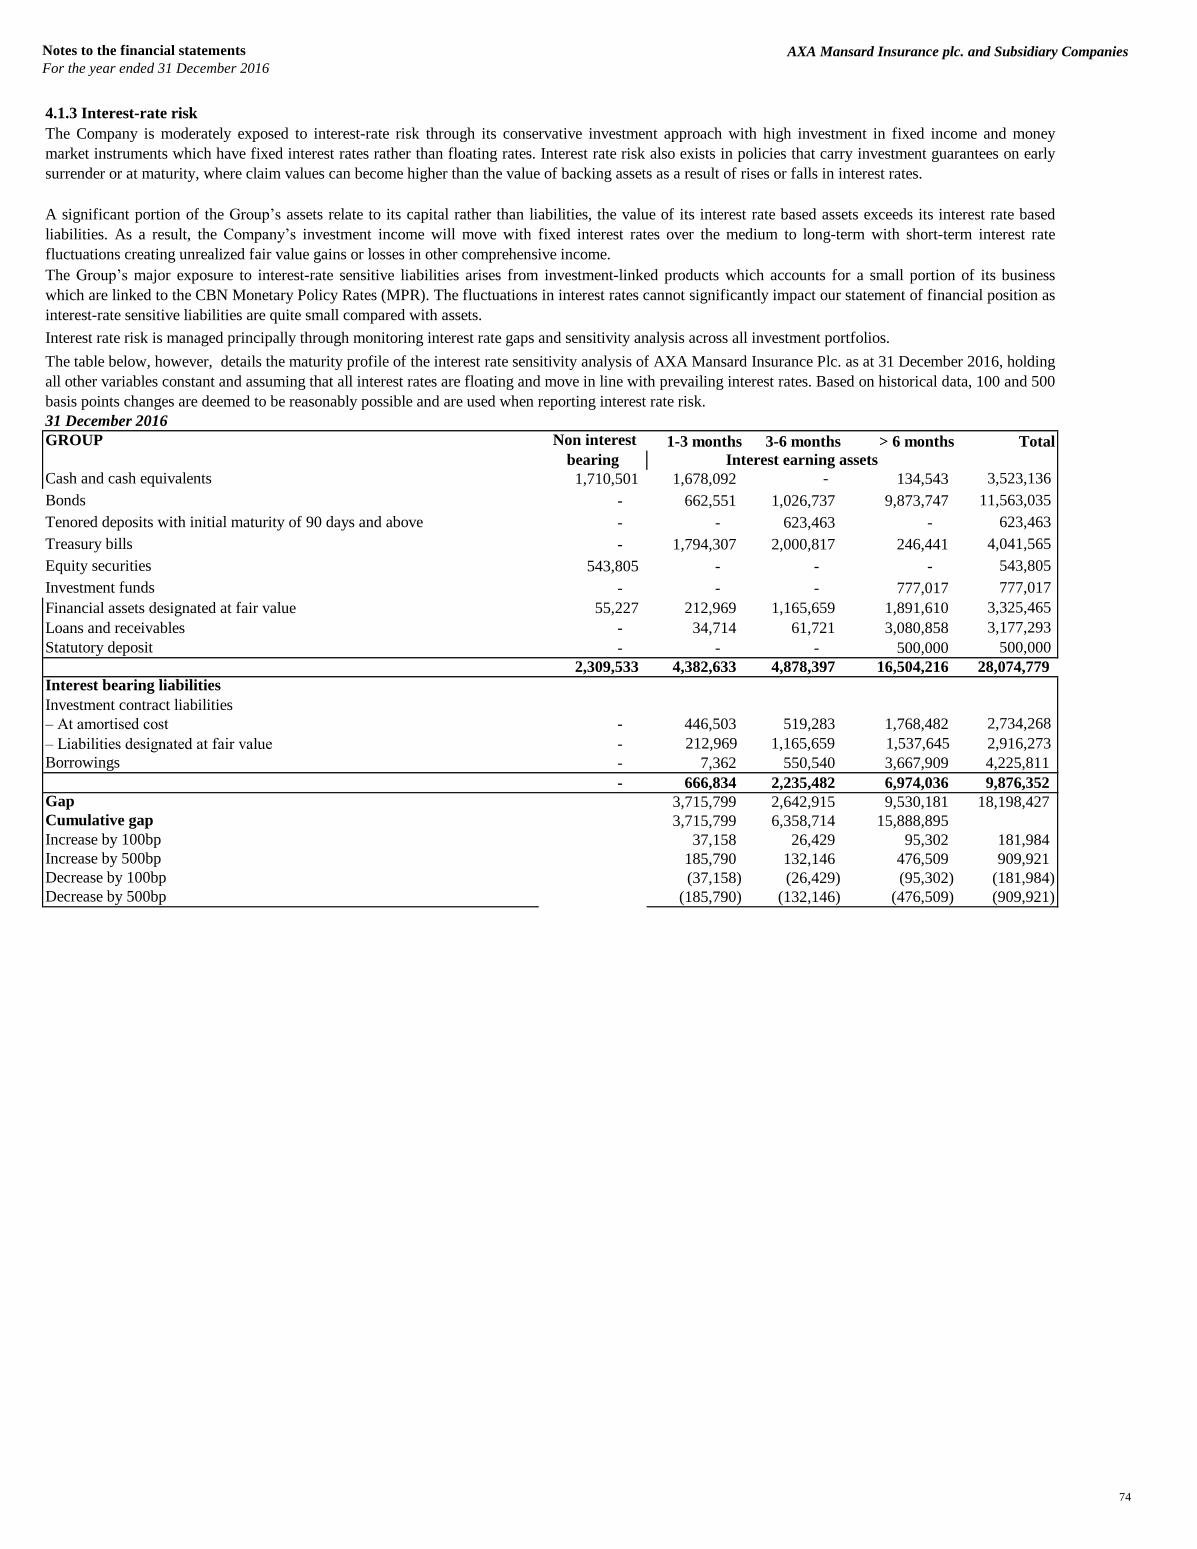
Notes to the financial statements
For the year ended 31 December 2016
AXA Mansard Insurance plc. and Subsidiary Companies
4.1.3 Interest-rate risk
31 December 2016
GROUP 1-3 months 3-6 months > 6 months Total
Cash and cash equivalents 1,710,501 1,678,092 - 134,543 3,523,136
Bonds - 662,551 1,026,737 9,873,747 11,563,035
Tenored deposits with initial maturity of 90 days and above - - 623,463 - 623,463
Treasury bills - 1,794,307 2,000,817 246,441 4,041,565
Equity securities 543,805 - - - 543,805
Investment funds - - - 777,017 777,017
Financial assets designated at fair value 55,227 212,969 1,165,659 1,891,610 3,325,465
Loans and receivables - 34,714 61,721 3,080,858 3,177,293
Statutory deposit - - - 500,000 500,000
2,309,533 4,382,633 4,878,397 16,504,216 28,074,779
Interest bearing liabilities
Investment contract liabilities
– At amortised cost - 446,503 519,283 1,768,482 2,734,268
– Liabilities designated at fair value - 212,969 1,165,659 1,537,645 2,916,273
Borrowings - 7,362 550,540 3,667,909 4,225,811
- 666,834 2,235,482 6,974,036 9,876,352
Gap 3,715,799 2,642,915 9,530,181 18,198,427
Cumulative gap 3,715,799 6,358,714 15,888,895
Increase by 100bp 37,158 26,429 95,302 181,984
Increase by 500bp 185,790 132,146 476,509 909,921
Decrease by 100bp (37,158) (26,429) (95,302) (181,984)
Decrease by 500bp (185,790) (132,146) (476,509) (909,921)
The Company is moderately exposed to interest-rate risk through its conservative investment approach with high investment in fixed income and money
market instruments which have fixed interest rates rather than floating rates. Interest rate risk also exists in policies that carry investment guarantees on early
surrender or at maturity, where claim values can become higher than the value of backing assets as a result of rises or falls in interest rates.
A significant portion of the Group’s assets relate to its capital rather than liabilities, the value of its interest rate based assets exceeds its interest rate based
liabilities. As a result, the Company’s investment income will move with fixed interest rates over the medium to long-term with short-term interest rate
fluctuations creating unrealized fair value gains or losses in other comprehensive income.
The Group’s major exposure to interest-rate sensitive liabilities arises from investment-linked products which accounts for a small portion of its business
which are linked to the CBN Monetary Policy Rates (MPR). The fluctuations in interest rates cannot significantly impact our statement of financial position as
interest-rate sensitive liabilities are quite small compared with assets.
Non interest
bearing
Interest rate risk is managed principally through monitoring interest rate gaps and sensitivity analysis across all investment portfolios.
The table below, however, details the maturity profile of the interest rate sensitivity analysis of AXA Mansard Insurance Plc. as at 31 December 2016, holding
all other variables constant and assuming that all interest rates are floating and move in line with prevailing interest rates. Based on historical data, 100 and 500
basis points changes are deemed to be reasonably possible and are used when reporting interest rate risk.
Interest earning assets
74
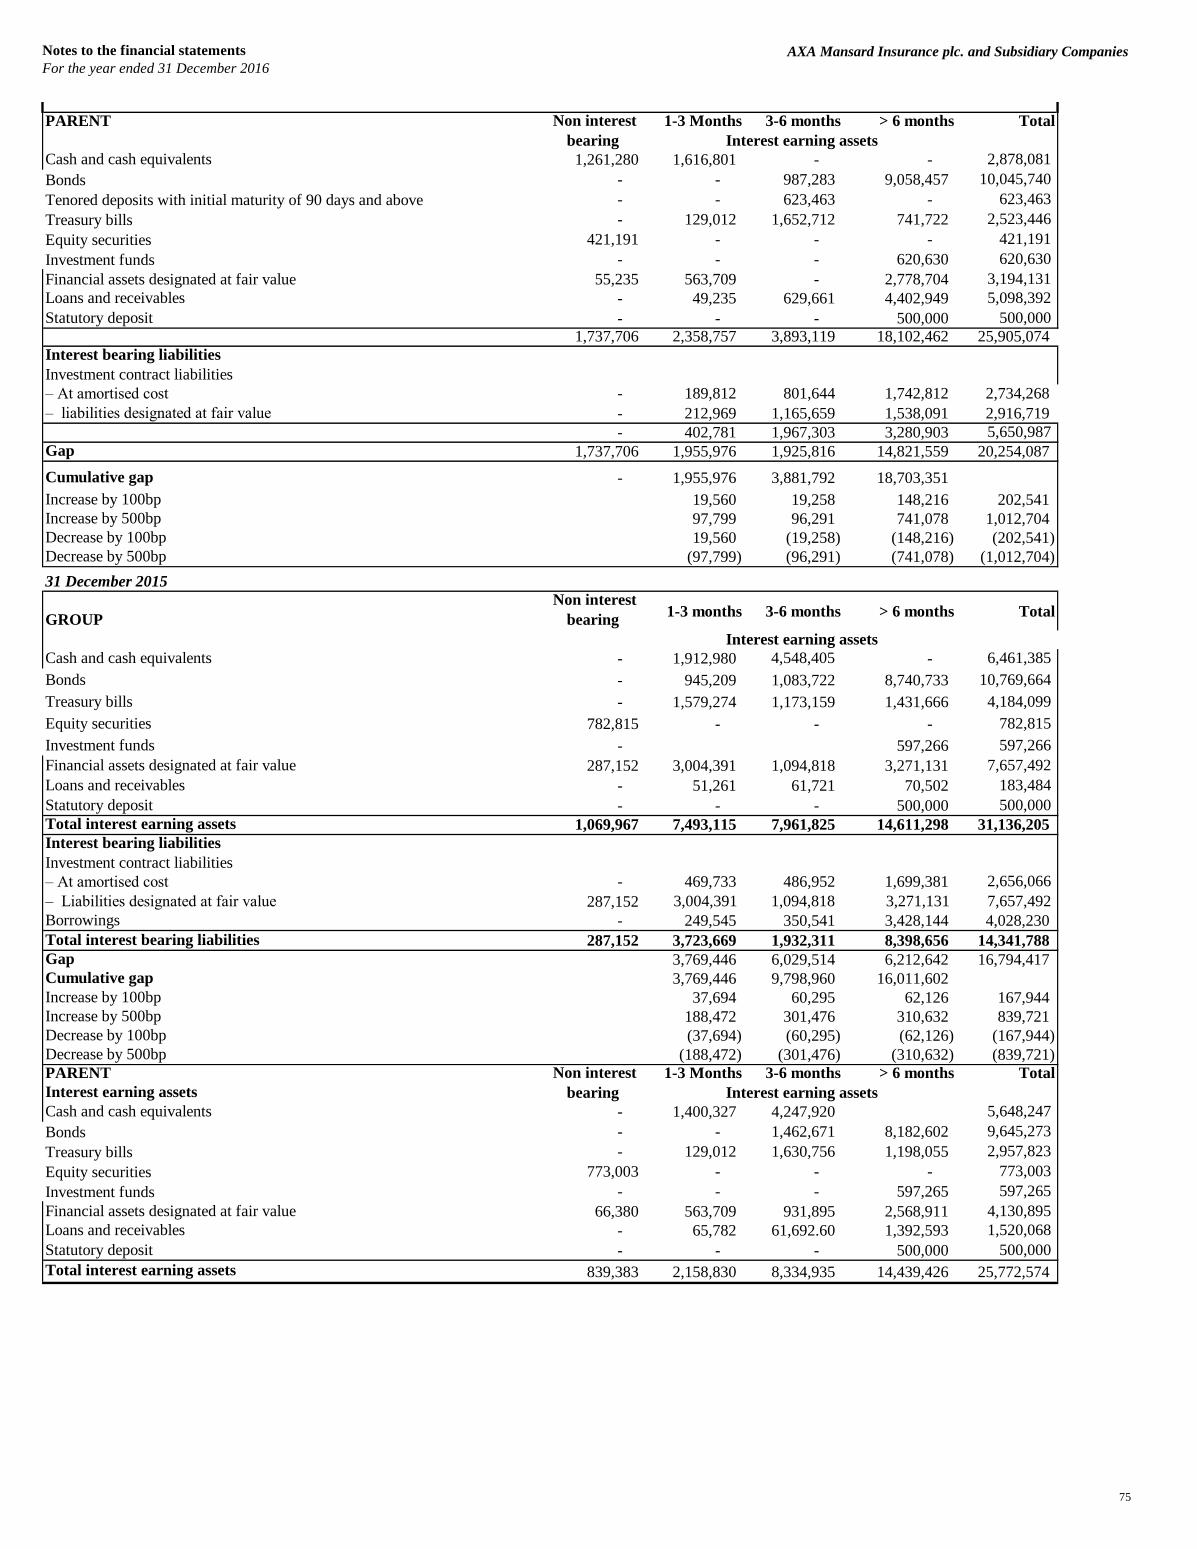
Notes to the financial statements
For the year ended 31 December 2016
AXA Mansard Insurance plc. and Subsidiary Companies
PARENT 1-3 Months 3-6 months > 6 months Total
Cash and cash equivalents 1,261,280 1,616,801 - - 2,878,081
Bonds - - 987,283 9,058,457 10,045,740
Tenored deposits with initial maturity of 90 days and above - - 623,463 - 623,463
Treasury bills - 129,012 1,652,712 741,722 2,523,446
Equity securities 421,191 - - - 421,191
Investment funds - - - 620,630 620,630
Financial assets designated at fair value 55,235 563,709 - 2,778,704 3,194,131
Loans and receivables - 49,235 629,661 4,402,949 5,098,392
Statutory deposit - - - 500,000 500,000
1,737,706 2,358,757 3,893,119 18,102,462 25,905,074
Interest bearing liabilities
Investment contract liabilities
– At amortised cost - 189,812 801,644 1,742,812 2,734,268
– liabilities designated at fair value - 212,969 1,165,659 1,538,091 2,916,719
- 402,781 1,967,303 3,280,903 5,650,987
Gap 1,737,706 1,955,976 1,925,816 14,821,559 20,254,087
Cumulative gap - 1,955,976 3,881,792 18,703,351
Increase by 100bp 19,560 19,258 148,216 202,541
Increase by 500bp 97,799 96,291 741,078 1,012,704
Decrease by 100bp 19,560 (19,258) (148,216) (202,541)
Decrease by 500bp (97,799) (96,291) (741,078) (1,012,704)
31 December 2015
GROUP
Non interest
bearing 1-3 months 3-6 months > 6 months Total
Cash and cash equivalents - 1,912,980 4,548,405 - 6,461,385
Bonds - 945,209 1,083,722 8,740,733 10,769,664
Treasury bills - 1,579,274 1,173,159 1,431,666 4,184,099
Equity securities 782,815 - - - 782,815
Investment funds - 597,266 597,266
Financial assets designated at fair value 287,152 3,004,391 1,094,818 3,271,131 7,657,492
Loans and receivables - 51,261 61,721 70,502 183,484
Statutory deposit - - - 500,000 500,000
Total interest earning assets 1,069,967 7,493,115 7,961,825 14,611,298 31,136,205
Interest bearing liabilities
Investment contract liabilities
– At amortised cost - 469,733 486,952 1,699,381 2,656,066
– Liabilities designated at fair value 287,152 3,004,391 1,094,818 3,271,131 7,657,492
Borrowings - 249,545 350,541 3,428,144 4,028,230
Total interest bearing liabilities 287,152 3,723,669 1,932,311 8,398,656 14,341,788
Gap 3,769,446 6,029,514 6,212,642 16,794,417
Cumulative gap 3,769,446 9,798,960 16,011,602
Increase by 100bp 37,694 60,295 62,126 167,944
Increase by 500bp 188,472 301,476 310,632 839,721
Decrease by 100bp (37,694) (60,295) (62,126) (167,944)
Decrease by 500bp (188,472) (301,476) (310,632) (839,721)
PARENT 1-3 Months 3-6 months > 6 months Total
Interest earning assets
Cash and cash equivalents - 1,400,327 4,247,920 5,648,247
Bonds - - 1,462,671 8,182,602 9,645,273
Treasury bills - 129,012 1,630,756 1,198,055 2,957,823
Equity securities 773,003 - - - 773,003
Investment funds - - - 597,265 597,265
Financial assets designated at fair value 66,380 563,709 931,895 2,568,911 4,130,895
Loans and receivables - 65,782 61,692.60 1,392,593 1,520,068
Statutory deposit - - - 500,000 500,000
Total interest earning assets 839,383 2,158,830 8,334,935 14,439,426 25,772,574
Non interest
bearing
Non interest
bearing
Interest earning assets
Interest earning assets
Interest earning assets
75
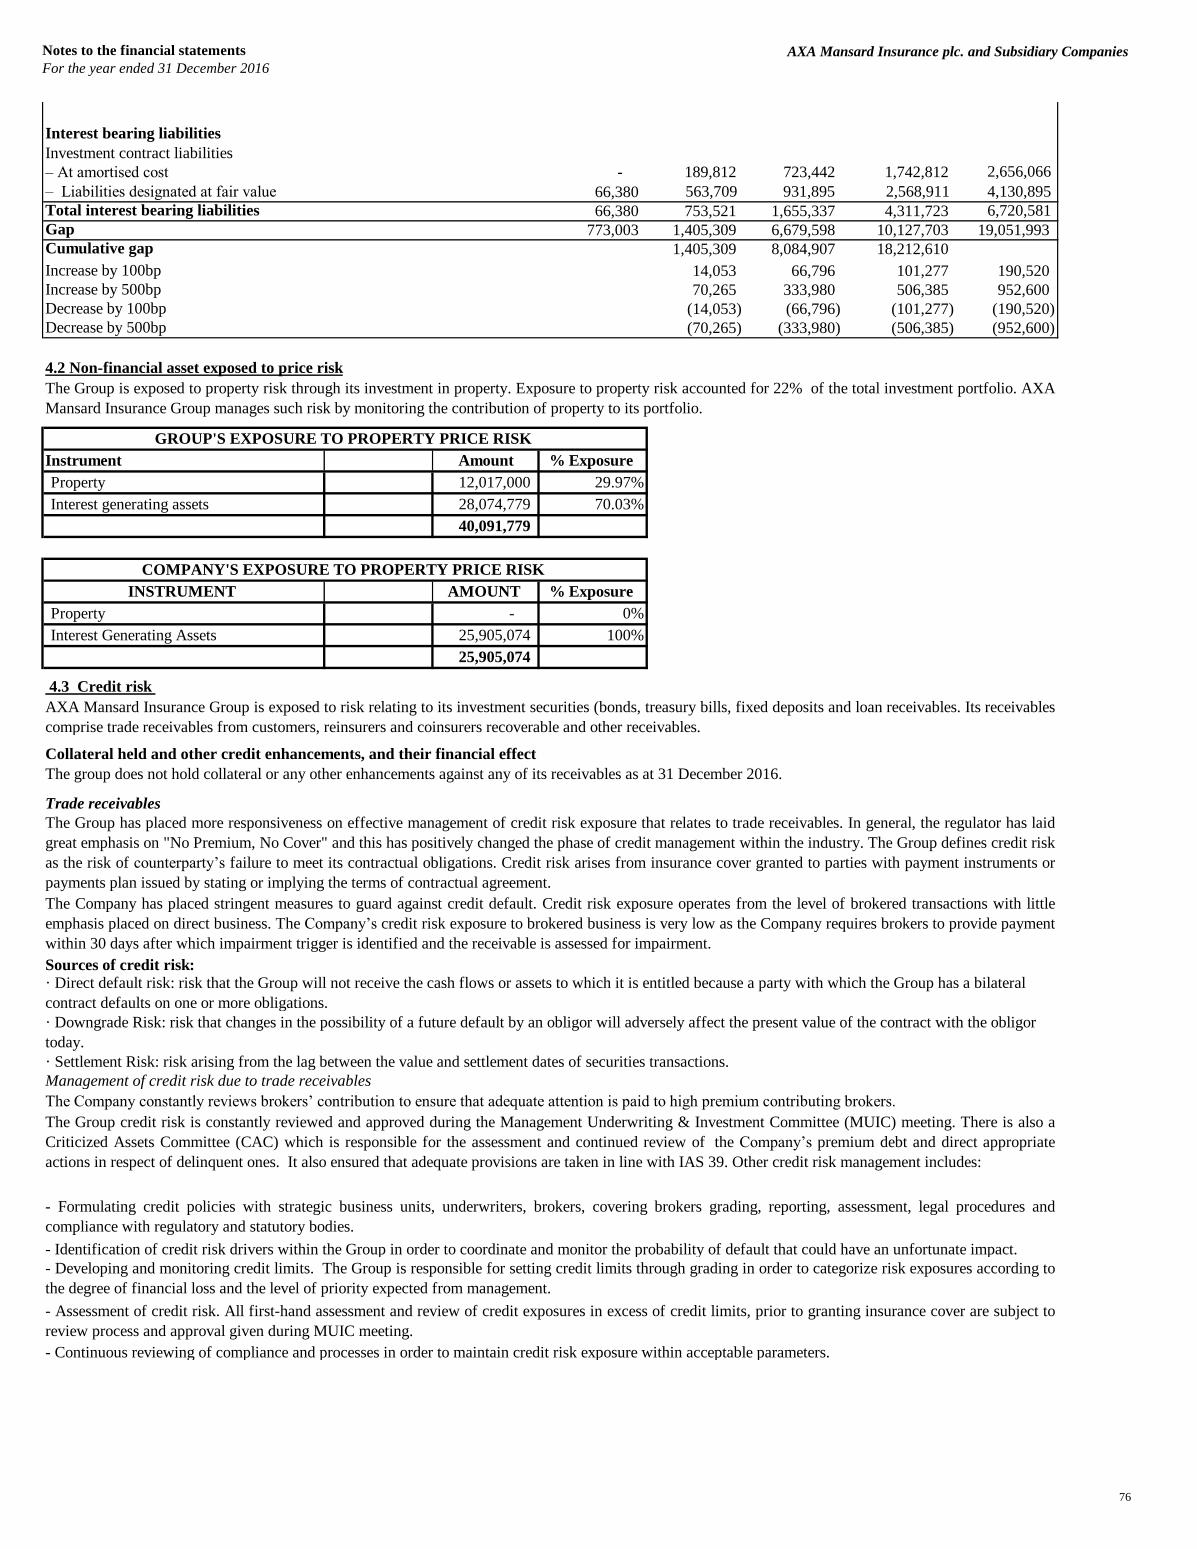
Notes to the financial statements
For the year ended 31 December 2016
AXA Mansard Insurance plc. and Subsidiary Companies
Interest bearing liabilities
Investment contract liabilities
– At amortised cost - 189,812 723,442 1,742,812 2,656,066
– Liabilities designated at fair value 66,380 563,709 931,895 2,568,911 4,130,895
Total interest bearing liabilities 66,380 753,521 1,655,337 4,311,723 6,720,581
Gap 773,003 1,405,309 6,679,598 10,127,703 19,051,993
Cumulative gap 1,405,309 8,084,907 18,212,610
Increase by 100bp 14,053 66,796 101,277 190,520
Increase by 500bp 70,265 333,980 506,385 952,600
Decrease by 100bp (14,053) (66,796) (101,277) (190,520)
Decrease by 500bp (70,265) (333,980) (506,385) (952,600)
4.2 Non-financial asset exposed to price risk
Instrument Amount % Exposure
Property 12,017,000 29.97%
Interest generating assets 28,074,779 70.03%
40,091,779
INSTRUMENT AMOUNT % Exposure
Property - 0%
Interest Generating Assets 25,905,074 100%
25,905,074
4.3 Credit risk
Collateral held and other credit enhancements, and their financial effect
Trade receivables
Sources of credit risk:
· Settlement Risk: risk arising from the lag between the value and settlement dates of securities transactions.
Management of credit risk due to trade receivables
The Company constantly reviews brokers’ contribution to ensure that adequate attention is paid to high premium contributing brokers.
- Continuous reviewing of compliance and processes in order to maintain credit risk exposure within acceptable parameters.
The Company has placed stringent measures to guard against credit default. Credit risk exposure operates from the level of brokered transactions with little
emphasis placed on direct business. The Company’s credit risk exposure to brokered business is very low as the Company requires brokers to provide payment
within 30 days after which impairment trigger is identified and the receivable is assessed for impairment.
· Direct default risk: risk that the Group will not receive the cash flows or assets to which it is entitled because a party with which the Group has a bilateral
contract defaults on one or more obligations.
The group does not hold collateral or any other enhancements against any of its receivables as at 31 December 2016.
COMPANY'S EXPOSURE TO PROPERTY PRICE RISK
The Group credit risk is constantly reviewed and approved during the Management Underwriting & Investment Committee (MUIC) meeting. There is also a
Criticized Assets Committee (CAC) which is responsible for the assessment and continued review of the Company’s premium debt and direct appropriate
actions in respect of delinquent ones. It also ensured that adequate provisions are taken in line with IAS 39. Other credit risk management includes:
The Group is exposed to property risk through its investment in property. Exposure to property risk accounted for 22% of the total investment portfolio. AXA
Mansard Insurance Group manages such risk by monitoring the contribution of property to its portfolio.
AXA Mansard Insurance Group is exposed to risk relating to its investment securities (bonds, treasury bills, fixed deposits and loan receivables. Its receivables
comprise trade receivables from customers, reinsurers and coinsurers recoverable and other receivables.
GROUP'S EXPOSURE TO PROPERTY PRICE RISK
- Assessment of credit risk. All first-hand assessment and review of credit exposures in excess of credit limits, prior to granting insurance cover are subject to
review process and approval given during MUIC meeting.
· Downgrade Risk: risk that changes in the possibility of a future default by an obligor will adversely affect the present value of the contract with the obligor
today.
- Developing and monitoring credit limits. The Group is responsible for setting credit limits through grading in order to categorize risk exposures according to
the degree of financial loss and the level of priority expected from management.
- Formulating credit policies with strategic business units, underwriters, brokers, covering brokers grading, reporting, assessment, legal procedures and
compliance with regulatory and statutory bodies.
The Group has placed more responsiveness on effective management of credit risk exposure that relates to trade receivables. In general, the regulator has laid
great emphasis on "No Premium, No Cover" and this has positively changed the phase of credit management within the industry. The Group defines credit risk
as the risk of counterparty’s failure to meet its contractual obligations. Credit risk arises from insurance cover granted to parties with payment instruments or
payments plan issued by stating or implying the terms of contractual agreement.
- Identification of credit risk drivers within the Group in order to coordinate and monitor the probability of default that could have an unfortunate impact.
76

Notes to the financial statements
For the year ended 31 December 2016
AXA Mansard Insurance plc. and Subsidiary Companies
Impairment model
Maximum exposure to credit risk
Carrying
amount
Carrying
amount
Carrying
amount
Carrying
amount
In thousands of Naira Dec 2016 Dec 2015 Dec 2016 Dec 2015
Cash and cash equivalents 3,388,593 6,374,307 2,878,081 5,648,247
16,995,564 15,551,029 13,813,279 13,200,361
Financial assets designated at fair value (less equity security) 3,311,297 7,586,714 3,179,971 4,119,045
Loans and receivable 3,177,293 183,484 5,098,392 1,520,068
Trade receivable 854,923 686,163 315,806 315,359
Reinsurance assets (less prepaid reinsurance, reserves and IBNR) 2,762,302 955,945 2,748,833 944,441
Other receivable (less prepayment) 195,585 371,397 132,021 131,011
Statutory deposit 500,000 500,000 500,000 500,000
31,185,557 32,209,038 28,666,383 26,378,532
4.3.1 Credit quality
Group
31 December 2016
In thousands of Nigerian Naira Unrated A/A- AA B+ BB- BBB TOTAL
Cash and cash equivalents - 277,684 - 58,532 1,946,103 1,100,481 3,382,800
Available-for-sale assets - - - 12,340,052 623,463 4,032,049 16,995,564
Financial assets designated at fair value 409,182 888,931 29,772 - 118,568 1,870,449 3,316,902
Loans and receivables 3,177,293 - - - - - 3,177,293
Trade receivable 854,923 - - - - - 854,923
Reinsurance assets (less prepaid
reinsurance, reserves and IBNR) 2,762,302 - - - - - 2,762,302
Other receivable (less prepayment) 195,585 - - - - - 195,585
Statutory deposit - - - - - 500,000 500,000
7,399,285 1,166,615 29,772 12,398,584 2,688,134 7,502,979 31,185,369
31 December 2015
In thousands of Nigerian Naira Unrated A/A- AA B+ BB- BBB TOTAL
Cash and cash equivalents - 396,343 - 172,001 1,761,032 4,044,931 6,374,307
Available-for-sale - - - 11,231,325 - 4,319,703 15,551,028
Financial assets designated at fair value - 1,077,691 267,173 - 118,568 6,123,281 7,586,714
Trade receivables 686,163 - - - - - 686,163 Reinsurance assets (less prepaid
reinsurance, reserves and IBNR) - - 955,945 - - 955,945
Loans and receivables 183,484 - - - - - 183,484
Other receivables (less prepayment) 371,398 - - - - - 371,398
Statutory deposit - - - - - 500,000 500,000
1,241,045 1,474,034 267,173 12,359,271 1,879,600 14,987,915 32,209,038
Parent Group
The Group’s investment portfolio is exposed to credit risk through its fixed income and money market instruments.
The Group’s exposure to credit risk is low as Government sector (government bonds and treasury bills) accounted for largest part 52% (2015: 57%) of the
investment as at 31 December 2016.
Except for staff loans included in loans and receivables, other receivables and trade receivables, all financial assets are neither past due nor impaired. The
credit quality of the assets are as analysed below:
Disclosure of treasury bills of less than 90 days maturity
For the purpose of IFRS 7 disclosures, treasury bills classified as cash and cash equivalents in the statement of financial position has been disclosed as part of
available for sale assets.
Below is the analysis of the group's maximum exposure to credit risk at the year end.
By the provisions of IAS 39, the impairment of the premium debtors is to be assessed at two different levels, individually or collectively. However, based on
NAICOM’s “No Premium No Cover” guidelines which state that “all insurance covers shall be provided on a strict ‘no premium no cover’ basis”, only cover
for which payment has been received shall be booked. However, brokers have a 30 day period to make payments from the date of the credit notes. The
Company uses the aging of receivables as the major parameter in calculating impairment.
Premium debtors are measured at amortized cost, less provision for impaired receivables. Under IFRS, an asset is impaired if the carrying amount is greater
than the recoverable amount. The standard favours the use of the incurred loss model in estimating the impairment of its receivables.
Exposures to credit risks is managed through counterparty risks using instituted limits as approved the MUIC. These limits are based on counter party credit
ratings amongst other factors.
Available-for-sale (less equity security)
77

Notes to the financial statements
For the year ended 31 December 2016
AXA Mansard Insurance plc. and Subsidiary Companies
Parent
31 December 2016
In thousands of Nigeria Naira Unrated A/A- AA B+ BB- BBB TOTAL
Cash and cash equivalents - 253,957 - 58,532 992,858 1,566,941 2,872,288
Available-for-sale - - - 10,045,740 623,463 3,144,076 13,813,279
Financial assets designated at fair value 277,412 847,862 29,772 - 56,187 1,974,342 3,185,576
Loans and receivables 5,098,392 - - - - - 5,098,392
Trade receivables 315,806 - - - - - 315,806
Reinsurance assets (less prepaid
reinsurance and IBNR) - - - 2,748,833 - - 2,748,833
Other receivables (less prepayment) 132,021 - - - - - 132,021
Statutory deposit - - - - - 500,000 500,000
5,823,631 1,101,819 29,772 12,853,104 1,672,508 7,185,359 28,666,194
Parent
31 December 2015
In thousands of Nigeria Naira Unrated A/A- Aa B+ BB- BBB TOTAL
Cash and cash equivalents - 473,968 - 172,001 996,597 4,005,681 5,648,247
Available-for-sale - - - 9,780,877 - 3,419,484 13,200,361
Financial assets designated at fair value - 861,317 29,772 - 56,187 3,171,768 4,119,045
Trade receivables 315,359 - - - - - 315,359
Reinsurance and co-insurance recoverable - - - 944,441 944,441
Loans and receivables 1,520,068 - - - - - 1,520,068
Other receivables (less prepayment) 131,011 - - - - - 131,011
Statutory deposit - - - - - 500,000 500,000
1,966,438 1,335,285 29,772 10,897,319 1,052,784 11,096,933 26,378,531
AAA
Amounts in thousands of Naira Dec 2016 Dec 2015 Dec 2016 Dec 2015
Gross premium receivable 682,989 545,592 134,783 174,788
Co-insurance receivable 227,406 149,760 227,406 149,760
Reinsurers’ share of outstanding claims 1,613,557 778,901 1,600,088 767,397
Recoverables from reinsurers on claims
paid
1,148,745 177,044 1,148,745 177,044
Total 3,672,697 1,651,297 3,111,022 1,268,989
Neither due nor impaired 3,617,225 1,642,108 3,064,639 1,259,800
Individually impaired 55,472 9,189 46,383 9,189
Gross total 3,672,697 1,651,297 3,111,022 1,268,989
Impairment allowance (55,472) (9,189) (46,383) (9,189)
Carrying amount 3,617,225 1,642,108 3,064,639 1,259,800
Group Company
Extremely strong financial security characteristics and is the highest FSR assigned by GCR.
Has good financial security characteristics, but is much more likely to be affected by adverse
business conditions than assurers with higher ratings.
Has vulnerable financial security characteristics, which might outweigh its strengths. The ability
of these companies to discharge obligations is not well safeguarded in the future.
Possessing substantial risk that obligations will not be paid when due. Judged to be speculative
to a high degree.
Has strong financial security characteristics, but is somewhat more likely to be affected by
adverse business conditions than assurers with higher ratings.
Has very strong financial security characteristics, differing only slightly from those rated higher. AA
A
Global Corporate Rating (GCR)'s Rating Symbols and Definitions Summary
Trade receivable and reinsurance assets (claims receivable) subject to credit risk are further assessed below:
BBB
BB
B
78
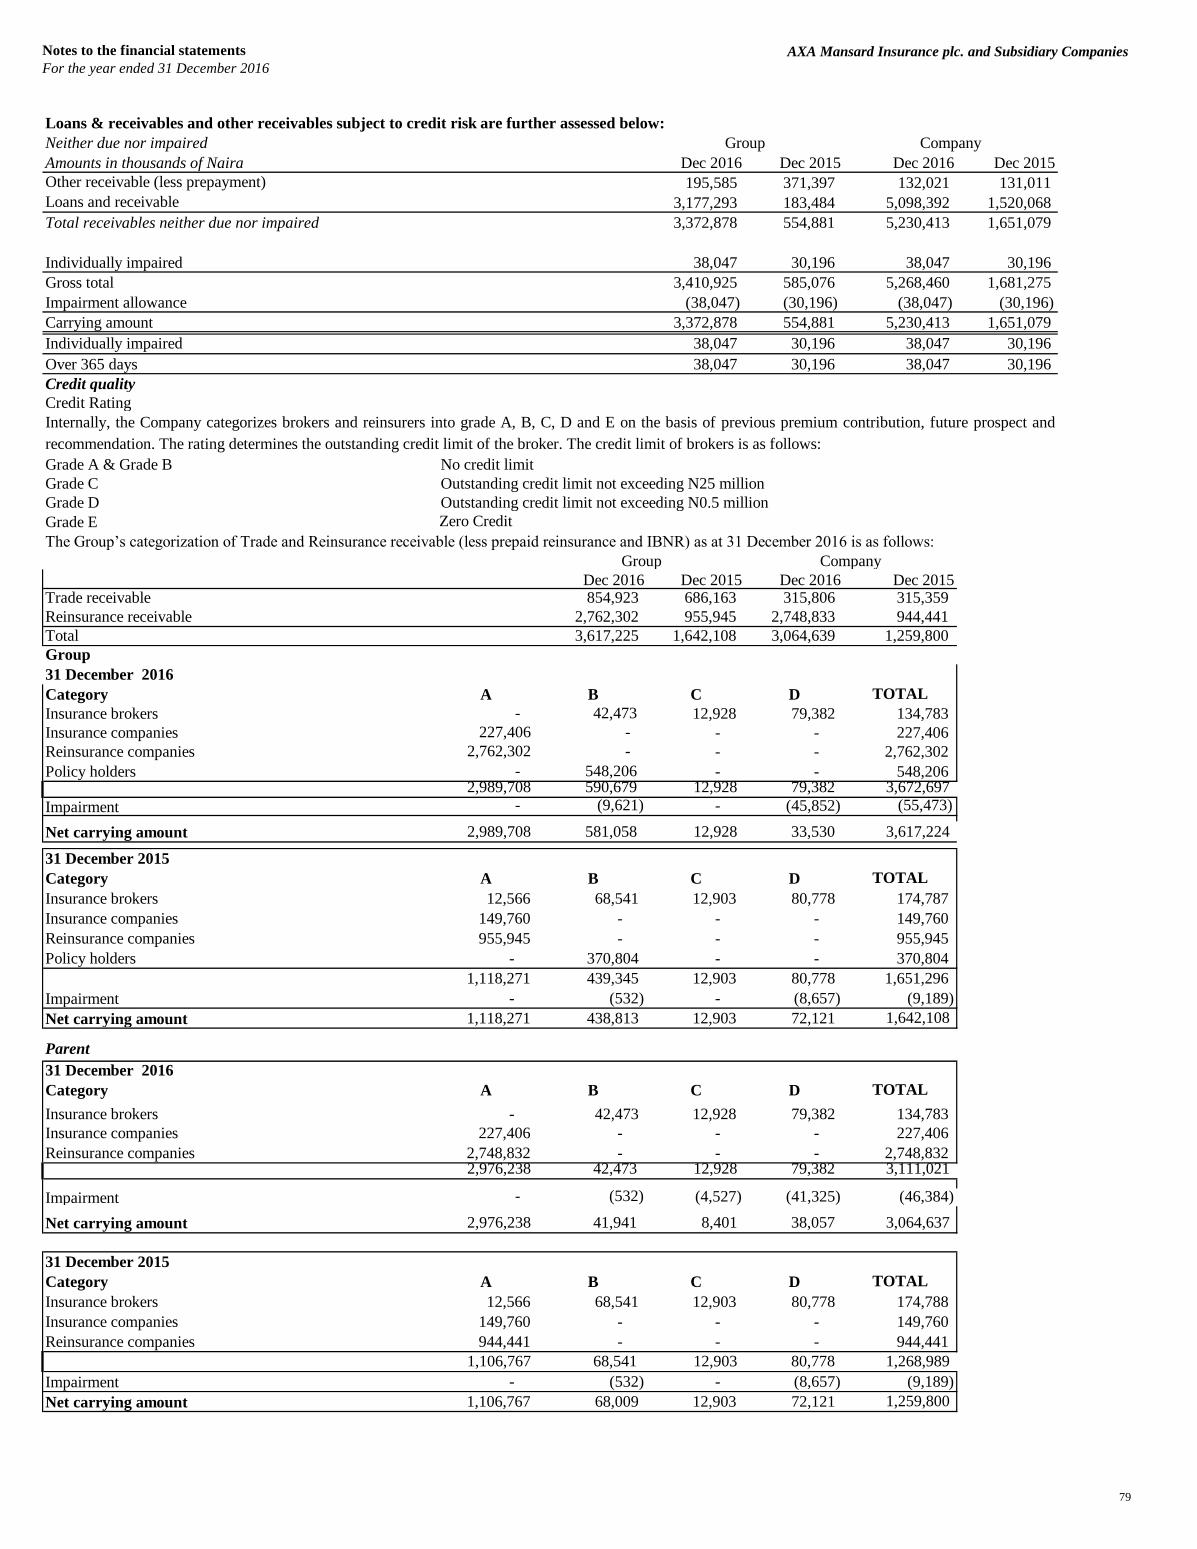
Notes to the financial statements
For the year ended 31 December 2016
AXA Mansard Insurance plc. and Subsidiary Companies
Neither due nor impaired
Amounts in thousands of Naira Dec 2016 Dec 2015 Dec 2016 Dec 2015
Other receivable (less prepayment) 195,585 371,397 132,021 131,011
Loans and receivable 3,177,293 183,484 5,098,392 1,520,068
Total receivables neither due nor impaired 3,372,878 554,881 5,230,413 1,651,079
Individually impaired 38,047 30,196 38,047 30,196
Gross total 3,410,925 585,076 5,268,460 1,681,275
Impairment allowance (38,047) (30,196) (38,047) (30,196)
Carrying amount 3,372,878 554,881 5,230,413 1,651,079
Individually impaired 38,047 30,196 38,047 30,196
Over 365 days 38,047 30,196 38,047 30,196
Credit quality
Credit Rating
Grade A & Grade B No credit limit
Grade C Outstanding credit limit not exceeding N25 million
Grade D Outstanding credit limit not exceeding N0.5 million
Grade E Zero Credit
The Group’s categorization of Trade and Reinsurance receivable (less prepaid reinsurance and IBNR) as at 31 December 2016 is as follows:
Dec 2016 Dec 2015 Dec 2016 Dec 2015Trade receivable 854,923 686,163 315,806 315,359
Reinsurance receivable 2,762,302 955,945 2,748,833 944,441
Total 3,617,225 1,642,108 3,064,639 1,259,800
Group
31 December 2016
Category A B C D TOTAL
Insurance brokers - 42,473 12,928 79,382 134,783
Insurance companies 227,406 - - - 227,406
Reinsurance companies 2,762,302 - - - 2,762,302
Policy holders - 548,206 - - 548,206 2,989,708 590,679 12,928 79,382 3,672,697
Impairment - (9,621) - (45,852) (55,473)
Net carrying amount 2,989,708 581,058 12,928 33,530 3,617,224
31 December 2015
Category A B C D TOTAL
Insurance brokers 12,566 68,541 12,903 80,778 174,787
Insurance companies 149,760 - - - 149,760
Reinsurance companies 955,945 - - - 955,945
Policy holders - 370,804 - - 370,804
1,118,271 439,345 12,903 80,778 1,651,296
Impairment - (532) - (8,657) (9,189)
Net carrying amount 1,118,271 438,813 12,903 72,121 1,642,108
Parent
31 December 2016
Category A B C D TOTAL
Insurance brokers - 42,473 12,928 79,382 134,783
Insurance companies 227,406 - - - 227,406
Reinsurance companies 2,748,832 - - - 2,748,832 2,976,238 42,473 12,928 79,382 3,111,021
Impairment - (532) (4,527) (41,325) (46,384)
Net carrying amount 2,976,238 41,941 8,401 38,057 3,064,637
31 December 2015
Category A B C D TOTAL
Insurance brokers 12,566 68,541 12,903 80,778 174,788
Insurance companies 149,760 - - - 149,760
Reinsurance companies 944,441 - - - 944,441
1,106,767 68,541 12,903 80,778 1,268,989
Impairment - (532) - (8,657) (9,189)
Net carrying amount 1,106,767 68,009 12,903 72,121 1,259,800
Internally, the Company categorizes brokers and reinsurers into grade A, B, C, D and E on the basis of previous premium contribution, future prospect and
recommendation. The rating determines the outstanding credit limit of the broker. The credit limit of brokers is as follows:
Group Company
Loans & receivables and other receivables subject to credit risk are further assessed below:
Group Company
79

Notes to the financial statements
For the year ended 31 December 2016
AXA Mansard Insurance plc. and Subsidiary Companies
4.3.2 Concentration of credit risk
31 December 2016
GROUP
Concentration of credit risk
Financial
institutions
Manu-
facturing/
telecom Real estate Public sector
Whole-sale
and retail
trade Individuals Total
Cash and cash equivalents 3,343,680 - - 44,913 - - 3,388,593
Available-for-sale 1,400,480 - 15,595,084 - - 16,995,564
Financial assets designated at fair value 268,196 - 409,182 2,648,087 - - 3,325,465 Loans and receivables - - 441,739 - 2,601,507 134,047 3,177,293 Trade receivables 686,163 - - - 168,760 - 854,923
Reinsurance assets 2,214,096 - - - 548,206 - 2,762,302
Other receivables - - - 153,773 41,812 - 195,585
Statutory deposit - - - 500,000 - - 500,000
Total 7,912,615 - 850,921 18,941,858 3,360,285 134,047 31,199,726
PARENT
Concentration of credit risk
Financial
institutions
Manu-
facturing/
telecom Real estate Public sector
Whole-sale
and retail
trade Individual Total
Cash and cash equivalents 2,878,081 - - - - - 2,878,081
Available-for-sale 1,244,093 - - 12,569,186 - - 13,813,279
Financial assets designated at fair value 268,237 - 277,412 2,648,492 - - 3,194,141
Loans and receivables 2,601,507 - 2,405,502 - - 91,383 5,098,392
Trade receivables 315,806 - - - - - 315,806
Reinsurance assets 2,200,627 - - - 548,206 - 2,748,833
Other receivables 76,319 - - - 55,701 - 132,020
Statutory deposit - - - 500,000 - - 500,000
Total 9,584,670 - 2,682,914 15,717,678 603,907 91,383 28,680,552
GROUP
31 December 2015
Concentration of credit risk
Financial
institutions
Manu-
facturing/
telecom Real estate Public sector
Whole-sale
and retail
trade Individuals Total
Cash and cash equivalents 6,038,318 - - - - - 6,038,318
Available-for-sale 597,265 - 14,953,763 - - 15,551,028
Financial assets designated at fair value 3,220,765 - - 4,365,949 - - 7,586,714
Loans and receivables - - - - - 183,484 183,484
Trade receivables 686,163 - - - - - 686,163
Reinsurance assets 622,428 - - - 370,804 - 993,232
Other receivables 36,009 - - 139,535 195,854 - 371,398
Statutory deposit - - - 500,000 - - 500,000
Total 11,200,948 - - 19,959,247 566,658 183,484 31,910,337
PARENT
Concentration of credit risk
Financial
institutions
Manu-
facturing/
telecom Real estate Public sector
Whole-sale
and retail
trade Individuals Total
Cash and cash equivalents 5,225,180 - - - - - 5,225,180
Available-for-sale 597,265 - - 12,603,096 - - 13,200,361
Financial assets designated at fair value 1,420,642 - - 2,698,403 - - 4,119,045
Loans and receivables 1,390,844 - - - - 129,224 1,520,068
Trade receivables 315,359 - - - - 315,359
Reinsurance assets 610,924 - - - 370,804 - 981,728
Other receivables 63,758 - 13,258 67,253 - 144,269
Statutory deposit - - - 500,000 - - 500,000
Total 9,623,972 - - 15,814,757 438,057 129,224 26,006,009
The Group monitors concentration of credit risk by sector.
80
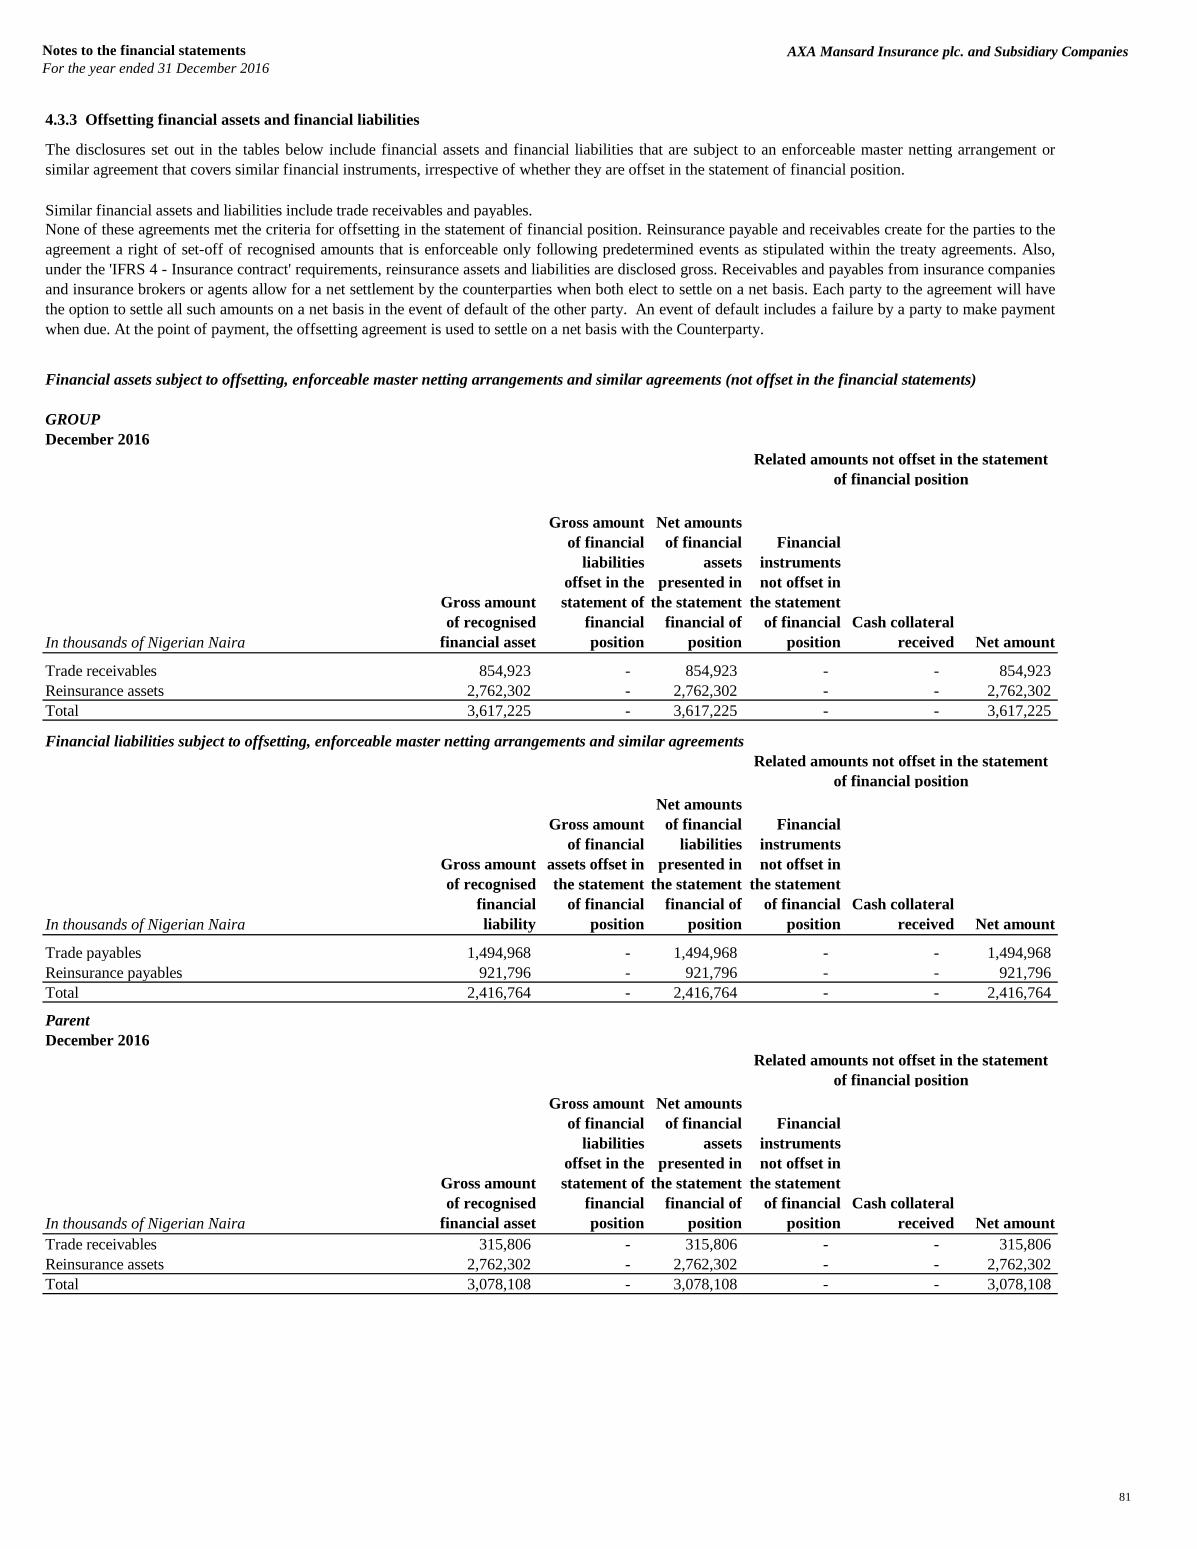
Notes to the financial statements
For the year ended 31 December 2016
AXA Mansard Insurance plc. and Subsidiary Companies
4.3.3 Offsetting financial assets and financial liabilities
GROUP
December 2016
In thousands of Nigerian Naira
Gross amount
of recognised
financial asset
Gross amount
of financial
liabilities
offset in the
statement of
financial
position
Net amounts
of financial
assets
presented in
the statement
financial of
position
Financial
instruments
not offset in
the statement
of financial
position
Cash collateral
received Net amount
Trade receivables 854,923 - 854,923 - - 854,923
Reinsurance assets 2,762,302 - 2,762,302 - - 2,762,302
Total 3,617,225 - 3,617,225 - - 3,617,225
In thousands of Nigerian Naira
Gross amount
of recognised
financial
liability
Gross amount
of financial
assets offset in
the statement
of financial
position
Net amounts
of financial
liabilities
presented in
the statement
financial of
position
Financial
instruments
not offset in
the statement
of financial
position
Cash collateral
received Net amount
Trade payables 1,494,968 - 1,494,968 - - 1,494,968
Reinsurance payables 921,796 - 921,796 - - 921,796
Total 2,416,764 - 2,416,764 - - 2,416,764
Parent
December 2016
In thousands of Nigerian Naira
Gross amount
of recognised
financial asset
Gross amount
of financial
liabilities
offset in the
statement of
financial
position
Net amounts
of financial
assets
presented in
the statement
financial of
position
Financial
instruments
not offset in
the statement
of financial
position
Cash collateral
received Net amount
Trade receivables 315,806 - 315,806 - - 315,806
Reinsurance assets 2,762,302 - 2,762,302 - - 2,762,302
Total 3,078,108 - 3,078,108 - - 3,078,108
The disclosures set out in the tables below include financial assets and financial liabilities that are subject to an enforceable master netting arrangement or
similar agreement that covers similar financial instruments, irrespective of whether they are offset in the statement of financial position.
Similar financial assets and liabilities include trade receivables and payables.
None of these agreements met the criteria for offsetting in the statement of financial position. Reinsurance payable and receivables create for the parties to the
agreement a right of set-off of recognised amounts that is enforceable only following predetermined events as stipulated within the treaty agreements. Also,
under the 'IFRS 4 - Insurance contract' requirements, reinsurance assets and liabilities are disclosed gross. Receivables and payables from insurance companies
and insurance brokers or agents allow for a net settlement by the counterparties when both elect to settle on a net basis. Each party to the agreement will have
the option to settle all such amounts on a net basis in the event of default of the other party. An event of default includes a failure by a party to make payment
when due. At the point of payment, the offsetting agreement is used to settle on a net basis with the Counterparty.
Related amounts not offset in the statement
of financial position
Related amounts not offset in the statement
of financial position
Financial liabilities subject to offsetting, enforceable master netting arrangements and similar agreements
Financial assets subject to offsetting, enforceable master netting arrangements and similar agreements (not offset in the financial statements)
Related amounts not offset in the statement
of financial position
81

Notes to the financial statements
For the year ended 31 December 2016
AXA Mansard Insurance plc. and Subsidiary Companies
In thousands of Nigerian Naira
Gross amount
of recognised
financial
liability
Gross amount
of financial
assets offset in
the statement
of financial
position
Net amounts
of financial
liabilities
presented in
the statement
financial of
position
Financial
instruments
not offset in
the statement
of financial
position
Cash collateral
received Net amount
Trade payables 1,478,373 - 1,478,373 - - 1,478,373
Reinsurance and coinsurance payables 921,796 - 921,796 - - 921,796
Total 2,400,169 - 2,400,169 - - 2,400,169
Group
30 December 2015
In thousands of Nigerian Naira
Gross amount
of recognised
financial asset
Gross amount
of financial
liabilities
offset in the
statement of
financial
position
Net amounts
of financial
assets
presented in
the statement
financial of
position
Financial
instruments
not offset in
the statement
of financial
position
Cash collateral
received Net amount
Trade receivables 686,163 - 686,163 - - 686,163
Reinsurance assets 955,945 - 955,945 (59,409) - 896,536
Total 1,642,108 - 1,642,108 (59,409) - 1,582,699
In thousands of Nigerian Naira
Gross amount
of recognised
financial
liability
Gross amount
of financial
assets offset in
the statement
of financial
position
Net amounts
of financial
liabilities
presented in
the statement
financial of
position
Financial
instruments
not offset in
the statement
of financial
position
Cash collateral
received Net amount
Trade payables 990,418 - 990,418 - - 990,418
Reinsurance payables 650,651 - 650,651 - - 650,651
Total 1,641,069 - 1,641,069 - - 1,641,069
Parent
30 December 2015
In thousands of Nigerian Naira
Gross amount
of recognised
financial asset
Gross amount
of financial
liabilities
offset in the
statement of
financial
position
Net amounts
of financial
assets
presented in
the statement
financial of
position
Financial
instruments
not offset in
the statement
of financial
position
Cash collateral
received Net amount
Trade receivables 315,359 - 315,359 - - 315,359
Reinsurance assets 944,441 - 944,441 (59,409) - 885,032
Total 1,259,800 - 1,259,800 (59,409) - 1,200,391
In thousands of Nigerian Naira
Gross amount
of recognised
financial
liability
Gross amount
of financial
assets offset in
the statement
of financial
position
Net amounts
of financial
liabilities
presented in
the statement
financial of
position
Financial
instruments
(including
non cash
collateral
Cash collateral
received Net amount
Trade payables 650,651 - 650,651 - - 650,651
Reinsurance payables 988,621 - 988,621 (59,409) - 929,212
Total 1,639,272 - 1,639,272 (59,409) - 1,579,863
Related amounts not offset in the statement
of financial position
Related amounts not offset in the statement
of financial position
Financial liabilities subject to offsetting, enforceable master netting arrangements and similar agreements
Related amounts not offset in the statement
of financial position
Related amounts not offset in the statement
of financial position
Financial liabilities subject to offsetting, enforceable master netting arrangements and similar agreements
Related amounts not offset in the statement
of financial position
Financial liabilities subject to offsetting, enforceable master netting arrangements and similar agreements
82

Notes to the financial statements
For the year ended 31 December 2016
AXA Mansard Insurance plc. and Subsidiary Companies
Trade receivables and payables Amortised cost
Reinsurance receivables and payables Amortised cost
4.4 Liquidity risk
31 December 2016
GROUP Carrying
amount Gross total 1-3 months 3-6 months 6-12 months 1-5 years > 5years
Cash and cash equivalents 3,523,136 3,523,136 3,388,593 - - 134,543 -
Available-for-sale (less equity investments) 16,995,564 17,080,434 454,657 3,057,885 652,892 6,118,712 6,796,288
Financial assets designated at fair value 3,311,297 3,325,455 2,916,273 - - 409,182 -
Loans and receivables 3,177,293 3,209,813 65,271 80,510 2,371,765 692,267 -
Trade receivables 854,923 854,923 854,923 - - - -
Reinsurance assets (less prepaid
reinsurance, IBNR & Reserves) 2,762,302 2,762,302 2,762,302 - - - -
Other receivables (less prepayment) 195,585 219,715 219,715 - - - -
Total financial assets 30,820,100 30,975,778 10,661,734 3,138,395 3,024,657 7,354,704 6,796,288
Carrying
amount Gross total 1-3 months 3-6 months 6-12 months 1-5 years > 5years
Investment contract liabilities:
– At amortised cost 2,734,268 2,734,268 971,657 - 1,762,611 - -
– Liabilities designated at fair value 2,916,273 2,916,273 2,916,273 - - - -
Borrowings 4,225,811 4,225,811 84,333 2,011,452 170,719 1,959,307 -
Trade payables 7,423,560 7,423,560 7,423,560 - - - -
Other liabilities (less deferred income and
premium received in advance) 964,927 964,927 964,927 - - - -
Total financial liabilities 18,264,839 18,264,839 12,360,750 2,011,452 1,933,330 1,959,307 -
Net financial assets/ liabilities 12,555,261 12,710,939 (1,699,016) 1,126,943 1,091,327 5,395,397 6,796,288
Insurance contract liabilities 7,968,095 7,968,095 2,453,305 613,009 531,269 2,603,942 1,766,570
Net policyholders' assets/(liabilities) 4,587,166 4,742,844 (4,152,321) 513,934 560,058 2,791,455 5,029,718
31 December 2016
PARENT Carrying
amount Gross total 1-3 months 3-6 months 6-12 months 1-5 years > 5years
Cash and cash equivalents 2,878,081 2,878,081 2,878,081 - - - -
Available-for-sale (less equity investments) 13,813,279 13,899,580 3,678,877 1,154,174 1,557,711 1,893,297 5,615,521
Financial assets designated at fair value 3,179,971 3,194,131 2,916,719 - - 277,412 -
Loans and receivables 5,098,392 5,134,320 296,191 80,510 3,587,050 1,170,569 -
Trade receivables 315,806 315,806 315,806 - - - -
Reinsurance assets (less prepaid
reinsurance, IBNR and reserves) 2,748,833 2,748,833 2,748,833 - - - -
Other receivables (less prepayment) 132,021 156,151 156,151 - - - -
Total financial assets 28,166,383 28,326,902 12,990,658 1,234,684 5,144,761 3,341,278 5,615,521
Investment contract liabilities:
– At amortised cost 2,734,268 2,734,268 2,734,268 - - - -
– Liabilities designated at fair value 2,916,719 3,179,971 3,179,971 - - - - Trade payables 7,406,965 7,406,965 7,406,965 - - - - Other liabilities (less deferred income and
premium received in advance) 604,561 604,561 604,561 - - - -
Total financial liabilities 13,662,513 13,925,765 13,925,765 - - - -
Net financial assets/ liabilities 14,503,870 14,401,137 (935,107) 1,234,684 5,144,761 3,341,278 5,615,521
Insurance contract liabilities 6,385,969 6,385,969 1,169,272 613,009 531,269 2,305,849 1,766,570
Net policyholders' assets/(liabilities) 8,117,901 8,015,168 (2,104,380) 621,676 4,613,492 1,035,429 3,848,951
The Group manages its cashflows in a way to ensure that net cash outflow positions through rental inflows and advance payments on service charge
Below is a summary of undiscounted contractual cashflows of financial assets matched with financial liabilities.
Liquidity risk is the risk that financial resources may not be available to meet maturing obligations at a reasonable cost. The Group mitigates this risk by
monitoring liquidity and expected outflows. The Group’s current liabilities arise as claims are made and/or clients request for termination of their investment-
linked products. It also arises from other normal business activities across the subsidiaries within the group. The Group has no material commitments for
capital expenditures and there is no need for such expenditures in the normal course of business. Claims payments are funded by current operating cash flow
including investment income.
The gross amount of financial assets and financial liabilities and their net amounts disclosed in the above tables have been measured in the statement of
financial position on the following bases:
The Company’s investment policy requires that a minimum of 35% of the Company’s life and non-life portfolio be held in cash and cash equivalent; this
highlights availability of liquid marketable securities sufficient to meet its liabilities as at when due. Cash and cash equivalents include treasury bills and term
deposits with an original maturity of less than 90 days.
The limits are monitored and reported on a weekly and monthly basis to ensure that exposure of the Group’s investment portfolio to this risk is properly
managed.
83

Notes to the financial statements
For the year ended 31 December 2016
AXA Mansard Insurance plc. and Subsidiary Companies
31 December 2015
GROUP
Carrying
amount Gross total
1-3 months 3-6 months 6-12 months 1-5 years above 5yrs
Cash and cash equivalents 6,038,318 6,038,318 6,038,318 - - - -
Investment securities
– Available-for-sale (less equity
investments)15,551,028 15,551,025 3,678,877 529,603 1,557,711 4,518,712 5,266,122
– Financial assets designated at fair value 7,586,714 7,586,714 7,586,714 - - - -
Loans and receivables 183,484 183,484 20,391 26,552 3,029 79,222 54,290
Trade receivables 686,163 686,163 686,163 - - - -
Reinsurance assets (less prepaid
reinsurance, IBNR & reserves)993,232
993,232 993,232 - - - -
Other receivables (less prepayment) 371,398 371,398 371,398 - - - -
Total financial assets 31,410,337 31,410,334 19,375,093 556,155 1,560,740 4,597,934 5,320,412
Investment contract liabilities: - - - -
– At amortised cost 2,656,066 2,656,066 2,656,066 - - - - – Financial liabilities designated at fair
value 7,657,492 7,657,492 7,657,492 - - - -
Borrowings 4,028,230 4,028,230 84,333 101,555 170,719 522,343 3,149,280
Trade payables 1,641,069 1,641,069 1,641,069 - - - -
Other liabilities 669,391 669,391 669,391 - - - -
Total financial liabilities 16,652,248 16,652,248 12,708,351 101,555 170,719 522,343 3,149,280
Net financial assets/ liabilities 14,758,089 14,758,087 6,666,743 454,600 1,390,021 4,075,591 2,171,132
Insurance contract liabilities 6,488,095 6,488,095 1,654,362 405,222 368,431 2,195,412 1,864,668
Net policyholders' assets/(liabilities) 8,269,994 8,269,992 5,012,380 49,378 1,021,590 1,880,179 306,464
31 December 2015
PARENT
Carrying
amount Total 1-3 months 3-6 months 6-12 months 1-5 years above 5yrs
Cash and cash equivalents 5,648,247 5,648,247 5,648,247 - - - -
Available-for-sale (less equity investments)13,200,361 13,200,362 3,678,877 530,711 1,557,711 3,266,941 4,166,122
Financial assets designated at fair value 4,119,045 4,119,045 4,119,045 - - - -
Loans and receivables 1,520,068 1,530,683 251,311 26,552 3,029 79,222 1,170,569
Trade receivables 315,359 315,359 315,359 - - - -
Reinsurance assets (less prepaid
reinsurance)981,728 981,728 981,728 - - - -
Other receivables (less prepayment) 131,011 131,011 131,011 - - - -
Total financial assets 25,915,819 25,926,436 15,125,578 557,263 1,560,740 3,346,164 5,336,691
Investment contract liabilities:
– At amortised cost 2,656,066 2,656,066 2,656,066 - - - -
– Financial liabilities designated at fair
value4,130,895 4,119,045 4,119,045 - - - -
Trade payables 1,639,272 1,639,272 1,639,272 - - - -
Other liabilities 520,412 520,412 520,412 - - - -
Total financial liabilities 8,946,644 8,934,795 8,934,795 - - - -
Net financial assets and liabilities 16,969,175 16,991,642 6,190,783 557,263 1,560,740 3,346,164 5,336,691
Insurance contract liabilities 6,385,969 6,385,969 1,620,887 405,222 368,431 2,126,761 1,864,668
Net policyholders' assets/(liabilities) 10,583,206 10,605,673 4,569,896 152,042 1,192,309 1,219,403 3,472,023
84
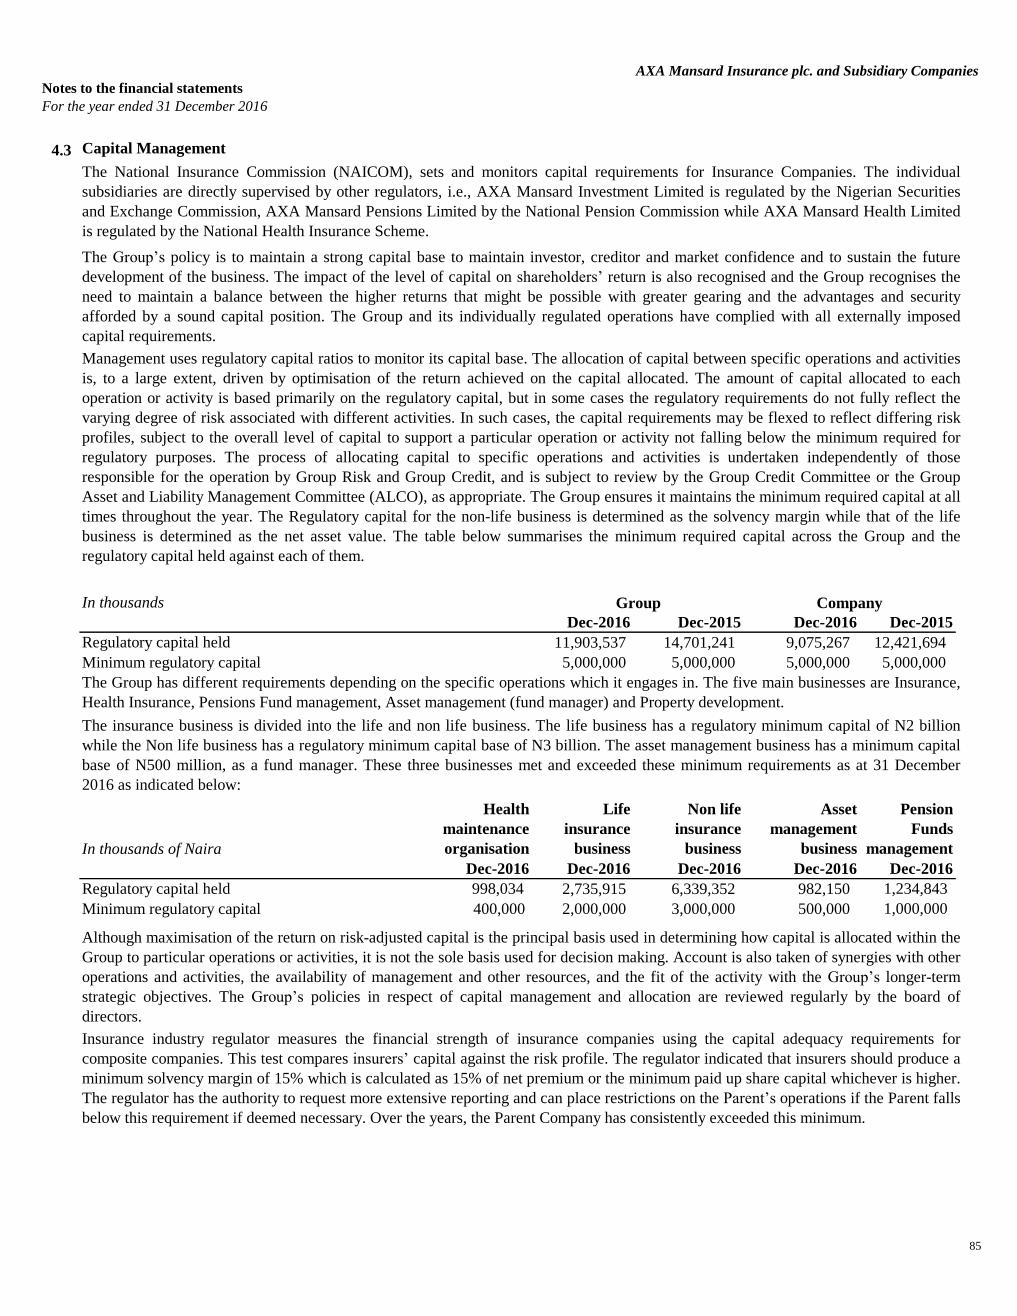
Notes to the financial statements
For the year ended 31 December 2016
AXA Mansard Insurance plc. and Subsidiary Companies
4.3 Capital Management
In thousands
Dec-2016 Dec-2015 Dec-2016 Dec-2015
Regulatory capital held 11,903,537 14,701,241 9,075,267 12,421,694
Minimum regulatory capital 5,000,000 5,000,000 5,000,000 5,000,000
In thousands of Naira
Health
maintenance
organisation
Life
insurance
business
Non life
insurance
business
Asset
management
business
Pension
Funds
management
Dec-2016 Dec-2016 Dec-2016 Dec-2016 Dec-2016
Regulatory capital held 998,034 2,735,915 6,339,352 982,150 1,234,843
Minimum regulatory capital 400,000 2,000,000 3,000,000 500,000 1,000,000
The National Insurance Commission (NAICOM), sets and monitors capital requirements for Insurance Companies. The individual
subsidiaries are directly supervised by other regulators, i.e., AXA Mansard Investment Limited is regulated by the Nigerian Securities
and Exchange Commission, AXA Mansard Pensions Limited by the National Pension Commission while AXA Mansard Health Limited
is regulated by the National Health Insurance Scheme.
The Group’s policy is to maintain a strong capital base to maintain investor, creditor and market confidence and to sustain the future
development of the business. The impact of the level of capital on shareholders’ return is also recognised and the Group recognises the
need to maintain a balance between the higher returns that might be possible with greater gearing and the advantages and security
afforded by a sound capital position. The Group and its individually regulated operations have complied with all externally imposed
capital requirements.
Management uses regulatory capital ratios to monitor its capital base. The allocation of capital between specific operations and activities
is, to a large extent, driven by optimisation of the return achieved on the capital allocated. The amount of capital allocated to each
operation or activity is based primarily on the regulatory capital, but in some cases the regulatory requirements do not fully reflect the
varying degree of risk associated with different activities. In such cases, the capital requirements may be flexed to reflect differing risk
profiles, subject to the overall level of capital to support a particular operation or activity not falling below the minimum required for
regulatory purposes. The process of allocating capital to specific operations and activities is undertaken independently of those
responsible for the operation by Group Risk and Group Credit, and is subject to review by the Group Credit Committee or the Group
Asset and Liability Management Committee (ALCO), as appropriate. The Group ensures it maintains the minimum required capital at all
times throughout the year. The Regulatory capital for the non-life business is determined as the solvency margin while that of the life
business is determined as the net asset value. The table below summarises the minimum required capital across the Group and the
regulatory capital held against each of them.
Although maximisation of the return on risk-adjusted capital is the principal basis used in determining how capital is allocated within the
Group to particular operations or activities, it is not the sole basis used for decision making. Account is also taken of synergies with other
operations and activities, the availability of management and other resources, and the fit of the activity with the Group’s longer-term
strategic objectives. The Group’s policies in respect of capital management and allocation are reviewed regularly by the board of
directors.
Insurance industry regulator measures the financial strength of insurance companies using the capital adequacy requirements for
composite companies. This test compares insurers’ capital against the risk profile. The regulator indicated that insurers should produce a
minimum solvency margin of 15% which is calculated as 15% of net premium or the minimum paid up share capital whichever is higher.
The regulator has the authority to request more extensive reporting and can place restrictions on the Parent’s operations if the Parent falls
below this requirement if deemed necessary. Over the years, the Parent Company has consistently exceeded this minimum.
Group Company
The Group has different requirements depending on the specific operations which it engages in. The five main businesses are Insurance,
Health Insurance, Pensions Fund management, Asset management (fund manager) and Property development.
The insurance business is divided into the life and non life business. The life business has a regulatory minimum capital of N2 billion
while the Non life business has a regulatory minimum capital base of N3 billion. The asset management business has a minimum capital
base of N500 million, as a fund manager. These three businesses met and exceeded these minimum requirements as at 31 December
2016 as indicated below:
85

Notes to the financial statements
For the year ended 31 December 2016
AXA Mansard Insurance plc. and Subsidiary Companies
The Solvency Margin for the parent as at 31 December 2016 is as follows:
Parent Non life Parent Non life
Admissible assets Dec-2016 Dec-2016 Dec-2015 Dec-2015
Cash and cash equivalents 1,922,864 1,704,354 5,643,696 3,795,716
Investment securities - Available for sale 14,234,420 7,018,431 13,967,707 6,728,295
3,194,131 - 4,130,895 -
Investment in subsidiaries 3,919,573 3,519,573 3,919,573 3,519,573
Statutory deposit 500,000 300,000 500,000 300,000
Land and building 818,323 818,323 827,881 827,881
Furniture and fittings 221,282 221,282 258,832 258,832
Office equipment 98,305 98,305 93,911 93,911
Computer equipment 100,774 100,774 126,625 126,625
Motor vehicles 203,532 192,262 268,221 251,997
Intangible assets 229,332 239,493
Prepaid reinsurance asset 3,096,520 2,834,886 3,426,099 3,078,189
Reinsurance premium paid in advance 2,500,786 2,500,786 - -
Deferred acquisition cost 574,415 574,415 570,876 570,876
Trade receivables 88,399 85,156 165,599 162,859
Staff loans and advances 91,383 73,851 129,224 101,952
Reinsurance claims recoverable 3,537,519 3,066,957 1,570,165 813,286
Admissible assets 35,331,558 23,109,356 35,838,795 20,629,990
Unearned premium 5,365,212 4,871,518 5,907,871 5,279,889
Provision for outstanding claims 3,065,044 2,664,626 2,026,109 1,438,873
Provision for claims incurred but not reported (IBNR) 2,305,849 1,322,443 2,126,761 1,478,507
Individual life and annuity reserves 2,297,839 - 2,233,099 -
Funds to meet other liabilities 14,277,568 7,911,416 10,047,973 2,741,484
Admissible liabilities 27,311,512 16,770,004 22,341,813 10,938,753
Solvency Margin 8,020,046 6,339,352 13,496,982 9,691,237
The higher of 15% of Net premium income and
Shareholders funds5,000,000 3,000,000 5,000,000 3,000,000
Solvency ratio 160% 211% 270% 323%
Financial assets designated at fair value
86

AXA Mansard Insurance plc and Subsidiary Companies
Notes to the financial statementsfor the year 31 December 2016
5 Measurement of financial assets and liabilities
5.1.Accounting classification measurement basis and fair value
The table below set out the group's classification of each class of financial instruments and liabilities and their fair value
In thousands of Nigerian Naira
Group Designated at fair
value
Loan and
receivables
Available for sale Other financial
instruments at
amortised cost
Carrying amount Fair value
Dec 2016 Notes
Cash and cash equivalents 8 - 3,523,136 - - 3,523,136 3,523,136
Available for sale 9.1 - - 17,539,369 - 17,539,369 17,539,369
Financial assets designated at fair value 9.2 3,325,455 - - - 3,325,455 3,325,455
Trade receivables 10 - 854,923 - - 854,923 854,923
Loans and receivables 14 3,177,293 3,177,293 3,177,293
Reinsurance receivables (excluding prepaid re-
insurance, IBNR & Reserves) 11 - 2,762,302 - - 2,762,302 2,762,302
Other receivables (excl. prepayment) 12 - 195,585 - - 195,585 195,585
Statutory deposit 19 - - - 500,000 500,000 500,000
3,325,455 10,513,239 17,539,369 500,000 31,878,063 31,878,063
Investment contracts:
– Designated at fair value 21.2 2,916,273 - - - 2,916,273 2,916,273
– At amortised cost 21.1 - - 2,734,268 2,734,268 2,734,268
Borrowing 25 - - - 4,225,811 4,225,811 4,225,811
Trade payables 22 - - - 7,423,560 7,423,560 7,423,560
Other liabilities (excluding deferred income) 23 - - - 964,927 964,927 964,927
2,916,273 - - 15,348,566 18,264,839 18,264,839
Parent Designated at fair
value
Loan and
receivables
Available for sale Other financial
instruments at
amortised cost
Carrying amount Fair value
Dec 2016 Notes
Cash and cash equivalents 8 - 2,878,081 - - 2,878,081 2,878,081
Available for sale 9.1 - - 14,234,470 - 14,234,470 14,234,470
Financial assets designated at fair value 9.2 3,194,131 - - - 3,194,131 3,194,131
Trade receivables 10 - 315,806 - - 315,806 315,806
Loans and receivables 14 - 5,098,392 - - 5,098,392 5,098,392
Reinsurance receivables (excluding prepaid re-
insurance) 11 - 2,748,833 - - 2,748,833 2,748,833
Other receivables (excl. prepayment) 12 - 132,021 - - 132,021 132,021
Statutory deposit 19 - - - 500,000 500,000 500,000
3,194,131 11,173,133 14,234,470 500,000 29,101,734 29,101,734
Investment contracts:
– Designated at fair value 21.2 2,916,719 - - - 2,916,719 2,916,719
– At amortised cost 21.1 - - - 2,734,268 2,734,268 2,734,268
Trade payables 22 - - - 7,406,965 7,406,965 7,406,965
Other liabilities (excluding deferred income and
advance premium) 23 - - - 604,561 604,561 604,561
2,916,719 - - 10,745,794 13,662,513 13,662,513
87
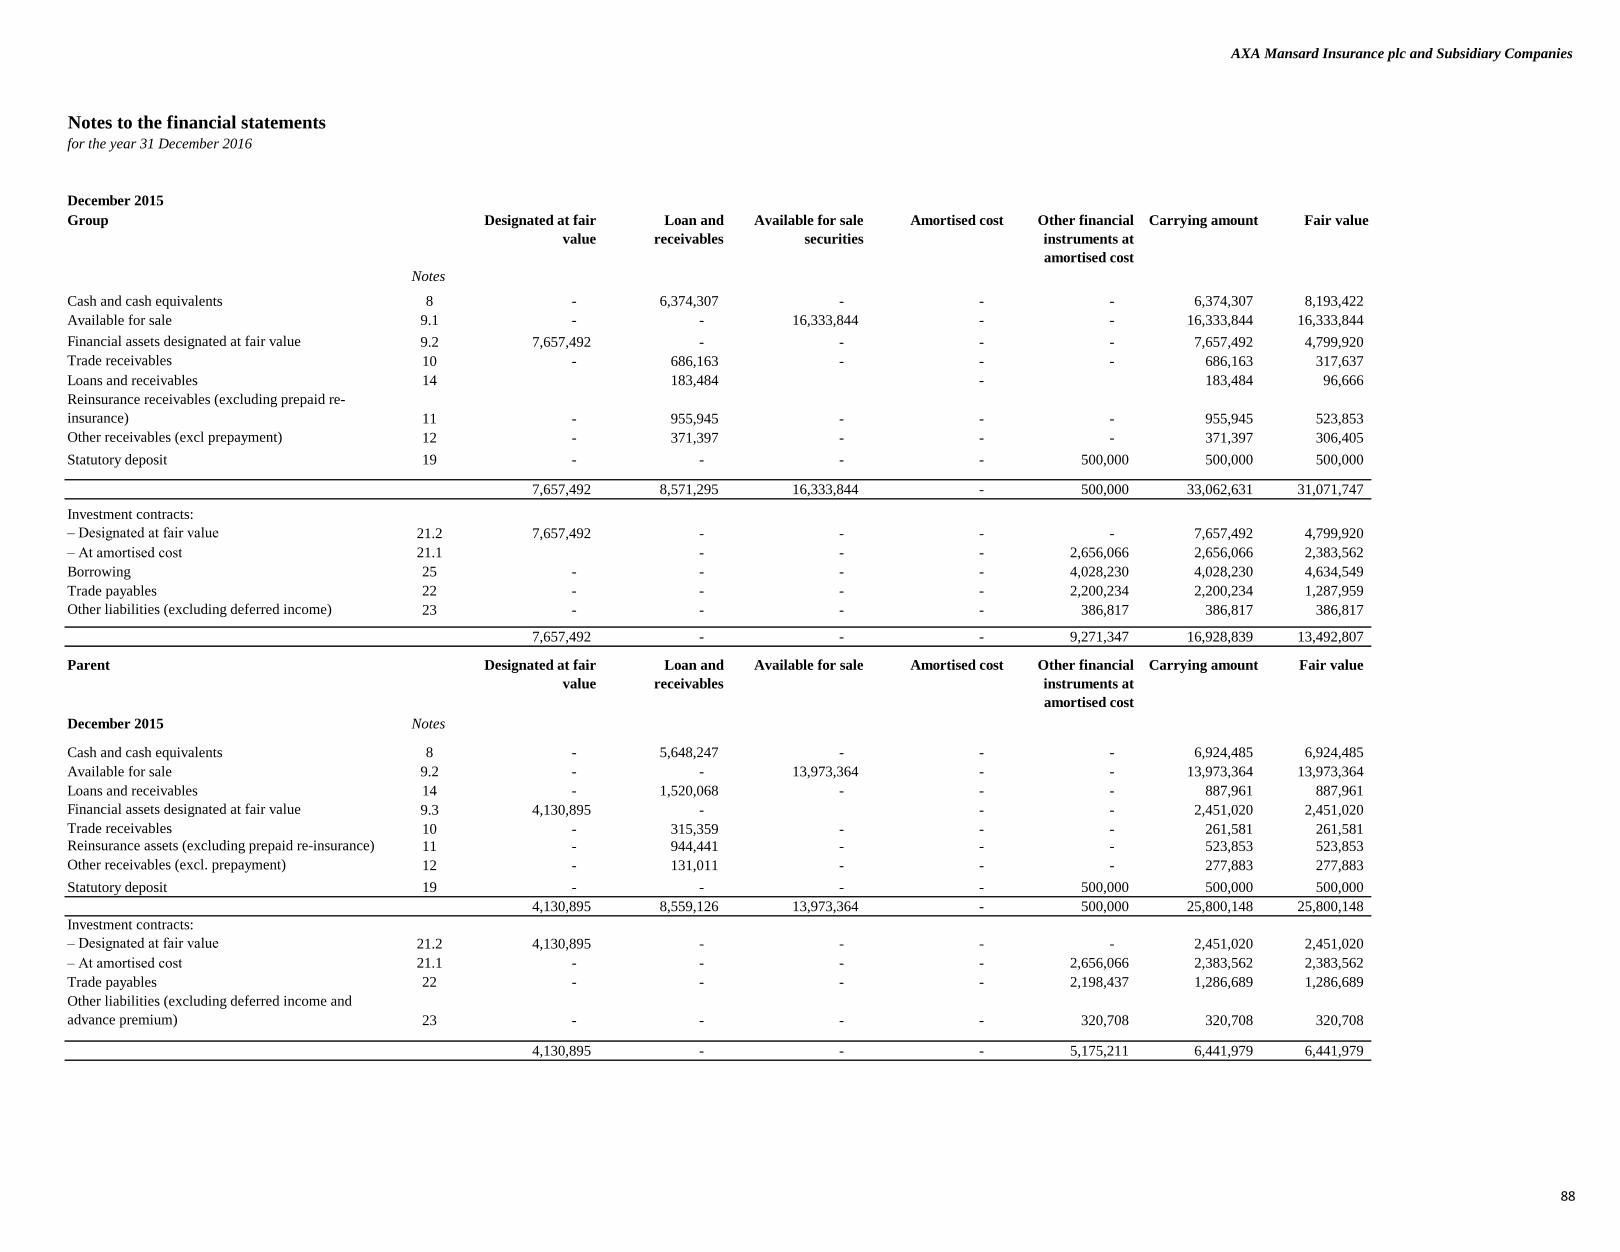
AXA Mansard Insurance plc and Subsidiary Companies
Notes to the financial statementsfor the year 31 December 2016
December 2015
Group Designated at fair
value
Loan and
receivables
Available for sale
securities
Amortised cost Other financial
instruments at
amortised cost
Carrying amount Fair value
Notes
Cash and cash equivalents 8 - 6,374,307 - - - 6,374,307 8,193,422
Available for sale 9.1 - - 16,333,844 - - 16,333,844 16,333,844
Financial assets designated at fair value 9.2 7,657,492 - - - - 7,657,492 4,799,920
Trade receivables 10 - 686,163 - - - 686,163 317,637
Loans and receivables 14 183,484 - 183,484 96,666
Reinsurance receivables (excluding prepaid re-
insurance) 11 - 955,945 - - - 955,945 523,853
Other receivables (excl prepayment) 12 - 371,397 - - - 371,397 306,405
Statutory deposit 19 - - - - 500,000 500,000 500,000
7,657,492 8,571,295 16,333,844 - 500,000 33,062,631 31,071,747
Investment contracts:
– Designated at fair value 21.2 7,657,492 - - - - 7,657,492 4,799,920
– At amortised cost 21.1 - - - 2,656,066 2,656,066 2,383,562
Borrowing 25 - - - - 4,028,230 4,028,230 4,634,549
Trade payables 22 - - - - 2,200,234 2,200,234 1,287,959
Other liabilities (excluding deferred income) 23 - - - - 386,817 386,817 386,817 -
7,657,492 - - - 9,271,347 16,928,839 13,492,807
Parent Designated at fair
value
Loan and
receivables
Available for sale Amortised cost Other financial
instruments at
amortised cost
Carrying amount Fair value
December 2015 Notes
Cash and cash equivalents 8 - 5,648,247 - - - 6,924,485 6,924,485
Available for sale 9.2 - - 13,973,364 - - 13,973,364 13,973,364
Loans and receivables 14 - 1,520,068 - - - 887,961 887,961
Financial assets designated at fair value 9.3 4,130,895 - - - 2,451,020 2,451,020
Trade receivables 10 - 315,359 - - - 261,581 261,581 Reinsurance assets (excluding prepaid re-insurance) 11 - 944,441 - - - 523,853 523,853
Other receivables (excl. prepayment) 12 - 131,011 - - - 277,883 277,883
Statutory deposit 19 - - - - 500,000 500,000 500,000
4,130,895 8,559,126 13,973,364 - 500,000 25,800,148 25,800,148
Investment contracts:
– Designated at fair value 21.2 4,130,895 - - - - 2,451,020 2,451,020
– At amortised cost 21.1 - - - - 2,656,066 2,383,562 2,383,562
Trade payables 22 - - - - 2,198,437 1,286,689 1,286,689
Other liabilities (excluding deferred income and
advance premium) 23 - - - - 320,708 320,708 320,708
4,130,895 - - - 5,175,211 6,441,979 6,441,979
88

Notes to the financial statements
For the year ended 31 December 2016
AXA Mansard Insurance plc and Subsidiary Companies
5.2 Fair value hierarchy
The Group’s accounting policy on fair value measurements is discussed under note 2.3.
Valuation models
(a) Financial instruments in level 1
Financial instruments in level 2
Financial instruments in level 3
(All figures are in thousands of naira)
Group
31-Dec-16
Level 1 Level 2 Level 3 Total
Available for sale 16,218,547 1,298,049 22,773 17,539,369
Other financial assets designated at fair value 2,703,314 212,969 409,182 3,325,455
Total 18,921,861 1,511,018 431,955 20,864,824
Liability type -
Other financial liabilities designated at fair value 2,703,314 212,969 - 2,916,283
Group
31-Dec-15
Level 1 Level 2 Level 3 Total
Available for sale 14,953,763 1,360,264 19,816 16,333,843
Other financial assets designated at fair value 4,653,101 3,004 - 7,657,492
Total 19,606,864 4,364,655 19,816 23,991,335
Liability type
Other financial liabilities designated at fair value 4,653,101 3,004,391 - 7,657,492
Parent
31-Dec-16
Level 1 Level 2 Level 3 Total
Available for sale 13,591,017 627,061 22,823 14,240,901
Other financial assets designated at fair value 2,865,953 254,331 277,412 3,397,696
Total 16,456,970 881,392 300,235 17,638,597
Other financial liabilities designated at fair value 2,865,953 254,331 - 3,120,284
Parent
31-Dec-15
Level 1 Level 2 Level 3 Total
Available for sale 13,376,099 577,449 19,816 13,973,364
Other financial assets designated at fair value 2,764,783 1,366,112 - 4,130,895
- Total 16,140,882 1,943,561 19,816 18,104,259
Other financial liabilities designated at fair value 2,764,783 1,366,112 - 4,130,895
-
The fair values of financial assets and liabilities that are traded inactive markets are based on quoted market prices or dealer price quotations. For all other financial instruments, the
group determines fair values using other valuation techniques.
For financial instruments that trade infrequently, and had little price transparency, fair value is less objective, and requires varying degrees of judgement depending on liquidity,
concentration, uncertainty of market factors, pricing assumptions and other risk affecting the specific instrument.
The group measures fair values using the following fair value hierarchy, which reflects the significance of the inputs used in making the measurements.
The table below analyses financial instruments measured at fair value at the end of the reporting period, by the level in the fair value hierarchy into which the fair value
measurement is categorized. The amounts are based on the values recognised in the statement of financial position.
Level 3: inputs that are unobservable. This category includes all instruments for which the valuation technique includes inputs not based on observable data and the unobservable
inputs have a significant effect on the instrument’s valuation. This category includes instruments that are valued based on quoted prices for similar instruments for which
significant unobservable adjustments or assumptions are required to reflect differences between the instruments.
The fair value of financial instruments traded in active markets is based on quoted market prices at the reporting date date. A market is regarded as active if quoted prices are
readily and regularly available from an exchange, dealer, broker, industry group, pricing service, or regulatory agency, and those prices represent actual and regularly occurring
market transactions on an arm’s length basis. The quoted market price used for financial assets held by the group is the current bid price. These instruments are included in Level 1.
Instruments included in Level 1 comprise primarily Nigerian Stock Exchange equity investments classified as trading securities or available for sale.
Inputs other than quoted prices included within Level 1 that are observable either directly (i.e. as prices) or indirectly (i.e. derived from prices). This category includes instruments
valued using: quoted market prices in active markets for similar instruments; quoted prices for identical or similar instruments in markets that are considered less than active; or
other valuation techniques in which all significant inputs are directly or indirectly observable from market data.
Financial assets and liabilities measured at fair value
89

Notes to the financial statements
For the year ended 31 December 2016
AXA Mansard Insurance plc and Subsidiary Companies
Unquoted equity
Debt security
In thousands of Nigerian Naira
Group Dec-16 Dec-15
Balance at 1 January 19,816 140,305
Acquisitions 409,182 -
Gain/loss for the year
Changes in fair value-realised - -
Changes in fair value recognised in other comprehensive income 2,957 (120,489)
Balance end of year 431,955 19,816
Impact of changes in fair value of available for sale assets
OCI 2,957 (120,489)
Parent Dec-16 Dec-15
Balance at 1 January 19,816 140,305
Acquisitions 277,412 -
Disposals - -
Gain/loss for the year - -
Changes in fair value recognised in other comprehensive income 2,957 (120,489)
Balance end of year 300,185 19,816
Dec-16 Dec-15
OCI 2,957 (120,489)
Information about fair value measurement using significant unobservable inputs (Level 3)
Risk-Free rate
There was no transfer between levels during the year under review.
Similar securities with close maturity dates
Financial instruments in level 3
The following table shows a reconciliation from the beginning balances to the ending balances for fair value measurements in level 3 of the fair value hierarchy.
Impact of changes in fair value of available for sale assets
For the unquoted financial instrument measured at fair value, the group used a valuation model. Some of the significant inputs may not be observable in the market and are derived
from market prices or rates or are estimated based on assumptions. Management judgement and estimation are usually required for selection of the appropriate valuation model to
be used, determination of expected cashflows on the financial instruments being valued, determination of the probability of counterparty default and prepayments and selection of
appropriate appropriate discount rates.
Fair value estimates obtained from models are adjusted for any other factors such as liquidity risk or model uncertainties, to the extent that the group believes that a third party
market participant would take them into account in pricing a transaction. Model inputs and values are calibrated against historical data and published forecasts. This calibration
process is inherently subjective and it yields ranges of possible inputs and estimates of fair value, and management judgement is required to select the most appropriate point in the
range.
Recent transaction price
Financial instruments in level 2
The fair values of financial instruments measured in level 2 are observable either directly (i.e. as prices) or indirectly (i.e. derived from prices). These are as shown in the table
below:
The group's valuation methodology for valuing certain unquoted financial instruments uses a free discounted cash flow methodology. It takes into account growth in net earnings or
cash flow, fixed capital investments, working capital investments and net borrowings, beta, risk free rate, market risk premium and assumed annual growth rate. These features are
used to estimate expected future cashflows and discounted at a risk-adjusted rate. However, this technique is subject to inherent limitations such as estimation of the appropriate
risk -adjusted discount rate, and different assumptions and inputs would yield different results.
Unobservable market inputs used in measuring the fair value.
Significant unobservable inputs are developed as follows:
The risk-free rate used in the valuation models is the yield of the most actively traded 10-yr FGN bond, as we believe this is the best reference for a risk-free instrument with a
similar duration to the investment horizon of equities.
The risk-free rate used in the unquoted financial instruments valuation reports was the current yield, 16% on the most actively traded 10-yr FGN bond in the Nigerian bond market
at the time.
The group's holds convertible debt as embedded derivatives. The derivatives are initially measured at fair value and any directly attributable transaction costs are recognised in
profit or loss as incurred. Subsequent to initial recognition, derivatives are measured at fair value and changes therein are recognised in profit or loss.
90

Notes to the financial statements
For the year ended 31 December 2016
AXA Mansard Insurance plc and Subsidiary Companies
Beta
Market risk premium
Assumed terminal growth rate
The effect of unobservable inputs in fair value measurement
Market Inputs used in valuing derivatives
Although the group believes that the estimates of its fair values are appropriate, the use of different methodologies or assumptions could lead to different measurement of fair
value. The following table shows the sensitivity of level 3 measurements to reasonably possible favorable or unfavorable changes in the assumptions used to determine the fair
value of the financial asset or liability. If discount rates were to change +/- 1% and terminal growth rate were to change by +/-0.5%, which management considers a reasonably
possible change in assumptions for the fair value of available -for-sale financial assets.
The beta of a stock measures the sensitivity of the excess expected return on an individual share relative to that of a benchmark equities market or index. It is best derived by the
regression analysis of a company’s stock price returns to that of the benchmark market index. However, in cases where a company is not publicly listed, it can be derived by using a
proxy from a similar company which is publicly listed, or by using the industry average. There are however cases where there are no comparable companies that are publicly listed
to use as proxies. In such cases, betas are estimated or assumed based on the sensitivity of the industry to the stock market and/or the overall economy as a guide. The unquoted
financial instruments valuation is peculiar in the sense that it is privately held and does not have ready and direct comparables publicly listed on the Nigerian Stock Exchange. We
assumed a beta of 0.68 for the unquoted financial instrument based on our perceived sensitivity of its industry to the Nigerian economy.
This is the premium estimated as required over the long term risk-free rate. In most cases, the unsystematic risk pertaining to countrywide factors such as socio-political risk, a
country’s sovereign rating etc. is usually priced into risk-free instruments such as government bonds. The unsystematic risk pertaining to the stock market or particular industry is
addressed by the market risk premium, while the beta is responsible for company-specific risks. We have used a market risk premium of 6% for the valuation, as we believe most of
the inherent risks in the Nigerian capital market have been largely priced in the bond yields.
This is the rate that the company is assumed to continue to grow after the forecasted years in the valuation. It is usually close to the GDP rate of the country where the company is
situated. In certain cases, the assumed growth rate may exceed the current GDP as the industry may be in its growth phase.
We have reduced the terminal growth rate for the unquoted financial instruments from 8.5% to 5.0% in line with growth projections for the country. It is important to note that
huge potentials remain largely untapped in the Nigerian housing industry, predicated on a large and growing population with unmet housing needs.
The Company adopted black scholes model in valuing the embedded derivatives in the convertible option of a debt to equity.The inputs applied in the model include a risk free
interest rate(5 year bond yield) of 15.85%, daily stock volatility of 6.18%, variance , stock price at N615.41 and strike price at N650. The grant date was April 1, 2016 and the
maturity date is April 1, 2021.
91
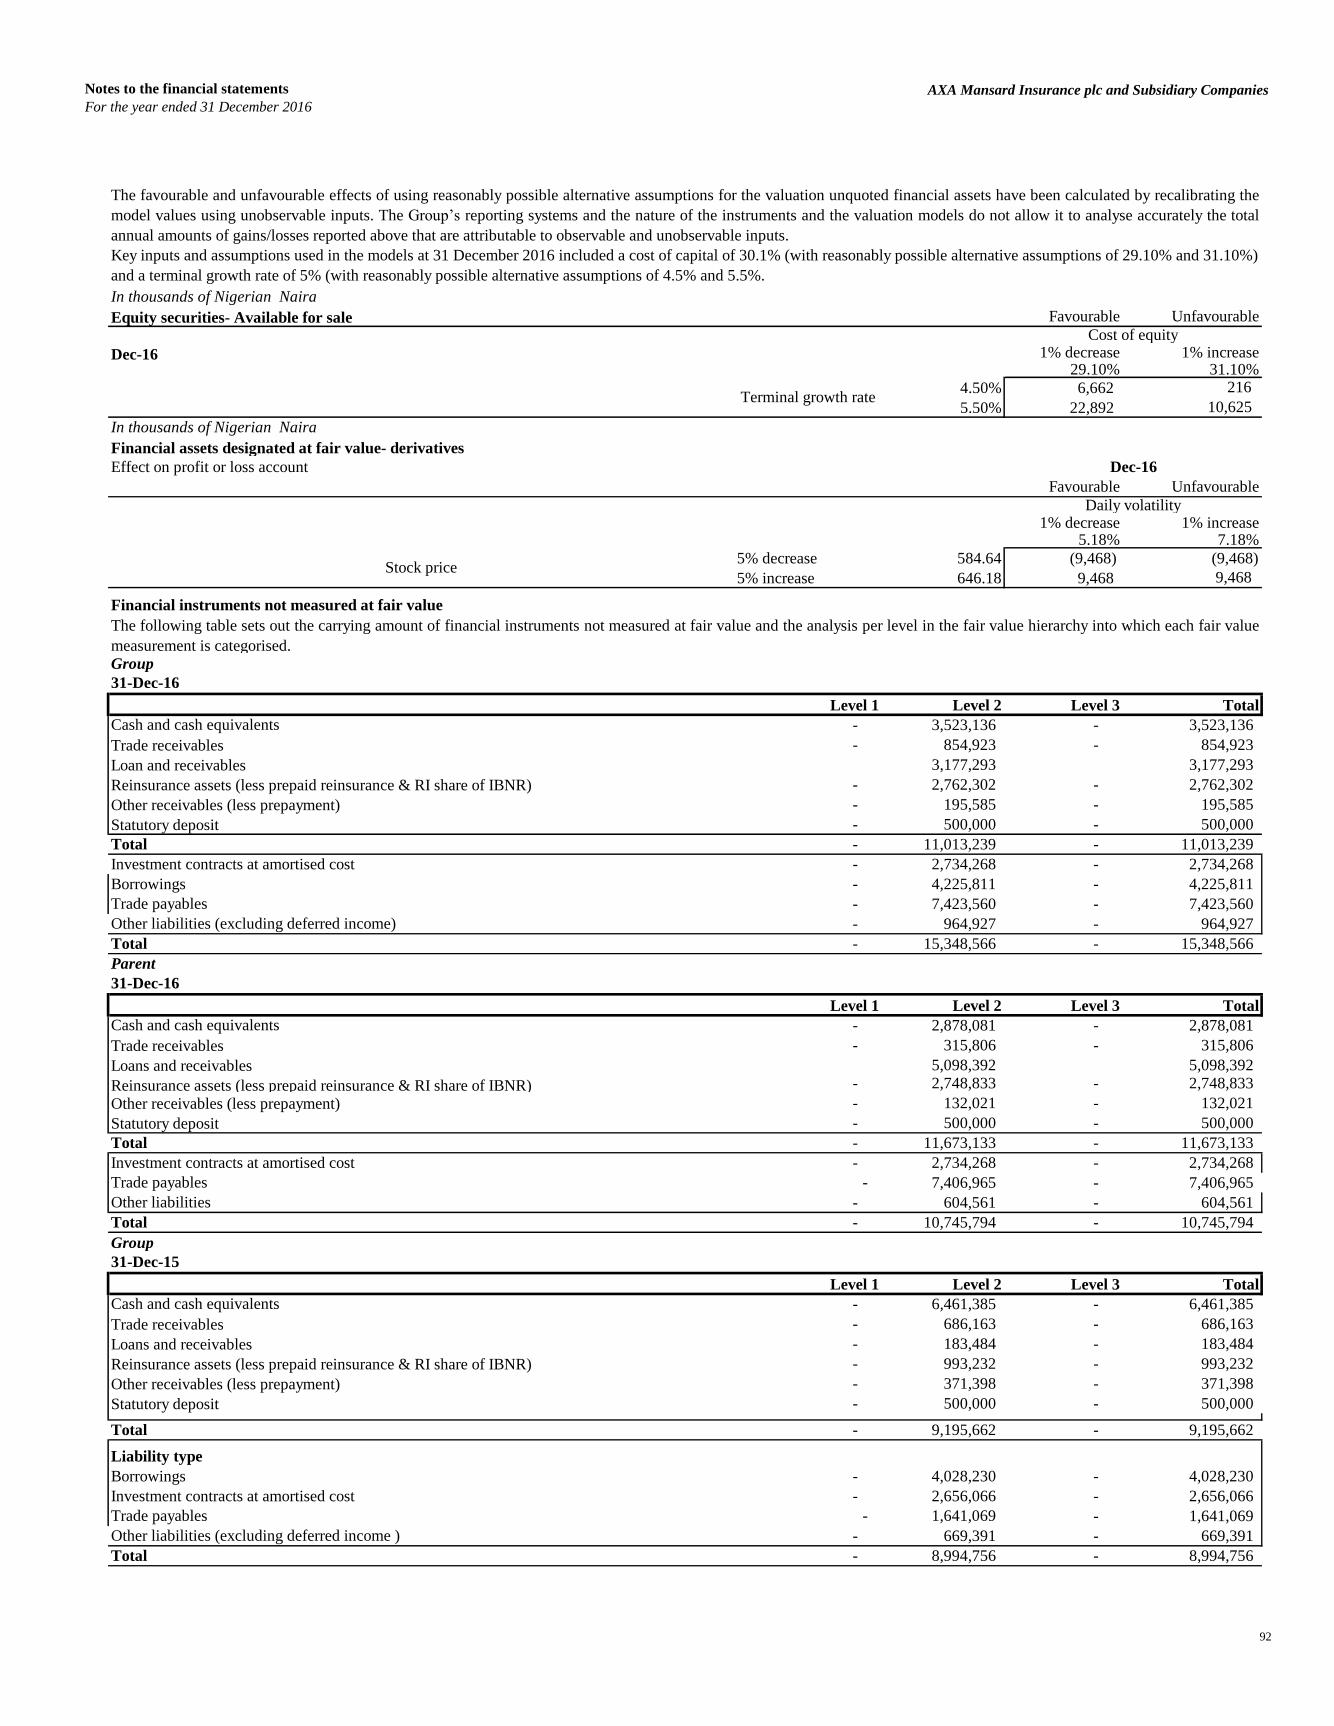
Notes to the financial statements
For the year ended 31 December 2016
AXA Mansard Insurance plc and Subsidiary Companies
In thousands of Nigerian Naira
Equity securities- Available for sale Favourable Unfavourable
1% decrease 1% increase29.10% 31.10%
4.50% 6,662 216
5.50% 22,892 10,625
In thousands of Nigerian Naira
Financial assets designated at fair value- derivatives
Effect on profit or loss account
Favourable Unfavourable
1% decrease 1% increase5.18% 7.18%
5% decrease 584.64 (9,468) (9,468)
5% increase 646.18 9,468 9,468
Financial instruments not measured at fair value
Group
31-Dec-16
Level 1 Level 2 Level 3 Total
Cash and cash equivalents - 3,523,136 - 3,523,136
Trade receivables - 854,923 - 854,923
Loan and receivables 3,177,293 3,177,293
Reinsurance assets (less prepaid reinsurance & RI share of IBNR) - 2,762,302 - 2,762,302
Other receivables (less prepayment) - 195,585 - 195,585
Statutory deposit - 500,000 - 500,000
Total - 11,013,239 - 11,013,239
Investment contracts at amortised cost - 2,734,268 - 2,734,268
Borrowings - 4,225,811 - 4,225,811
Trade payables - 7,423,560 - 7,423,560
Other liabilities (excluding deferred income) - 964,927 - 964,927
Total - 15,348,566 - 15,348,566
Parent
31-Dec-16
Level 1 Level 2 Level 3 Total
Cash and cash equivalents - 2,878,081 - 2,878,081
Trade receivables - 315,806 - 315,806
Loans and receivables 5,098,392 5,098,392
Reinsurance assets (less prepaid reinsurance & RI share of IBNR) - 2,748,833 - 2,748,833
Other receivables (less prepayment) - 132,021 - 132,021
Statutory deposit - 500,000 - 500,000
Total - 11,673,133 - 11,673,133
Investment contracts at amortised cost - 2,734,268 - 2,734,268
Trade payables - 7,406,965 - 7,406,965
Other liabilities - 604,561 - 604,561
Total - 10,745,794 - 10,745,794
Group
31-Dec-15
Level 1 Level 2 Level 3 Total
Cash and cash equivalents - 6,461,385 - 6,461,385
Trade receivables - 686,163 - 686,163
Loans and receivables - 183,484 - 183,484
Reinsurance assets (less prepaid reinsurance & RI share of IBNR) - 993,232 - 993,232
Other receivables (less prepayment) - 371,398 - 371,398
Statutory deposit - 500,000 - 500,000
Total - 9,195,662 - 9,195,662
Liability type
Borrowings - 4,028,230 - 4,028,230
Investment contracts at amortised cost - 2,656,066 - 2,656,066
Trade payables - 1,641,069 - 1,641,069
Other liabilities (excluding deferred income ) - 669,391 - 669,391
Total - 8,994,756 - 8,994,756
Cost of equity
Key inputs and assumptions used in the models at 31 December 2016 included a cost of capital of 30.1% (with reasonably possible alternative assumptions of 29.10% and 31.10%)
and a terminal growth rate of 5% (with reasonably possible alternative assumptions of 4.5% and 5.5%.
Dec-16
The favourable and unfavourable effects of using reasonably possible alternative assumptions for the valuation unquoted financial assets have been calculated by recalibrating the
model values using unobservable inputs. The Group’s reporting systems and the nature of the instruments and the valuation models do not allow it to analyse accurately the total
annual amounts of gains/losses reported above that are attributable to observable and unobservable inputs.
Dec-16
Terminal growth rate
The following table sets out the carrying amount of financial instruments not measured at fair value and the analysis per level in the fair value hierarchy into which each fair value
measurement is categorised.
Daily volatility
Stock price
92

Notes to the financial statements
For the year ended 31 December 2016
AXA Mansard Insurance plc and Subsidiary Companies
Parent
31-Dec-15
Level 1 Level 2 Level 3 Total
Cash and cash equivalents - 5,648,247 - 5,648,247
Trade receivables - 315,359 315,359
Loans and receivables - 1,520,068 - 1,520,068
Reinsurance assets (less prepaid reinsurance & RI share of IBNR) 944,441 944,441
Other receivables (less prepayment) - 131,011 - 131,011
Statutory deposit - 500,000 - 500,000 - -
Total - 9,059,126 - 9,059,126
Liability type
Investment contracts at amortised cost - 2,656,066 - 2,656,066
Trade payables - 1,639,272 - 1,639,272
Other liabilities - 520,412 - 520,412
Total - 4,815,750 - 4,815,750
Non financial asset measured at fair value
Valuation technique Fair value at 31
December 2016 (in
thousands)
Unobservable
inputs
Price per square
metre
Growth rate
Discount rate
Determination of fair value
Cash and cash equivalent and borrowings
Quoted securities
Unquoted equity securities available for sale
Trade receivables and payables, reinsurance receivables and other liabilities
The carrying amounts of other liabilities are reasonable approximation of their fair values which are payable on demand.
The estimated fair value of receivables and payables with no stated maturity which includes no interest payables and receivables is the amount repayable or to be received on
demand.
The estimated fair value of fixed interest placement with banks, bonds and borrowings is based on the discounted cash flow techniques using prevailing money market interest
rates for debts and similar credit risk and remaining maturity.
The fair value for treasury bills and bonds assets is based on market prices or brokers/dealers price quotations. Where this information is not available, fair valuation is estimated
using quoted market prices for securities with similar credit, maturity and yield characteristics.
The fair value of available-for-sale securities is based on on the market approach which consider similar/ identical transactions.
The determination of fair value for each class of financial instruments was based on the particular characteristic of the instruments. The method and assumptions applied are
enumerated below:
Range of unobservable
inputs (probability
weighted average)
$600-$700
($650)Discounted Income Capitalisation Cashflow approach
12,017,000
2%
14.15%
Investment property is a recurring fair value measurement valued using the income approach. The rental income/prices of comparable buildings in close proximity are adjusted for
differences in key attributes such as property size, beta, growth rates, discount rate, inflation rate, holding period and capitalisation rate. The valuation of the investment property
has been determined within level 3 of the fair value hierarchy. A variation of -/+5% will result in N415.7 million fair value losses/gain respectively.
93

Notes to the financial statements
For the year ended 31 December 2016
AXA Mansard Insurance plc and Subsidiary Companies
6. Asset and Liability Management (ALM)
Share-
holders'
Fund
Policy-
holders' Fund
Share-
holders'
Fund
Policy-
holders'
Fund
Annuity funds Total
LS/LIP AXA
Mansard
FundINVESTMENTS
FIXED ASSETS:
Real estate 818,323 - - - - - - 818,323
Equipment 199,022 - 484 - - - - 199,506
Motor vehicles 192,262 - 10,744 - - - - 203,006
Furniture 221,340 - 42 - - - - 221,382
Intangible assets 229,332 - - - - - - 229,332
OTHER INVESTMENTS -
Statutory deposit 300,000 - 200,000 - - - - 500,000
Government and corporate bonds 2,398,024 2,213,714 1,040,391 257,892 2,243,109 1,482,655 1,892,610 11,528,395
Quoted securities 231,283 - - 117,335 - 14,160 - 362,778
Unquoted securities (AFS) - 49,750 633,313 - 10,140 - - 693,203
Bank placements 7 1,915,854 52,343 16,187 154,728 213,002 56,233 2,408,354
Bank and cash balances 63,113 1,259,114 2,244 112,685 (182,125) 41,075 6,299 1,302,405
Mortgage loan 63,431 - 23,598 - - - - 87,029
Related companies' securities 3,519,573 - 400,000 - - - - 3,919,573
Related companies' loans 1,985,422 - 126,977 - - - - 2,112,399
Other investments 1,318,318 - 1,736,827 - - 1,165,837 - 4,220,982
Other assets 6,343,321 5,336,322 1,590,218 - - - - 13,269,860
Total assets 17,882,770 10,774,754 5,817,180 504,099 2,225,852 2,916,729 1,955,142 42,076,526
Financal assets per class Related appendix
(1) Cash and cash equivalents 6 (a)
(2) Available for sale assets 6 (b)
(3) Investment income 6 (c)
GroupInsurance fund Investment contract Shareholders funds Annuity 31-Dec-16
Non-life Life
AXA
Mansard Fund LS/LIP Non-life Life Others Total
ASSETS
Cash and cash equivalents 2,549,486 107,509 - 25,904 65,791 66,859 62,532 645,055 3,523,136
Available-for-sale 2,796,331 1,621,145 - 2,742,528 3,743,471 1,439,191 1,891,805 3,304,899 17,539,369
Financial assets designated at fair value - - 2,916,719 - - 138,706 138,706 131,324 3,325,455
Trade receivables - - - - 137,482 178,323 - 539,118 854,923
Reinsurance assets 8,402,629 732,196 - - - - - 49,352 9,184,177
Other receivables - - - - 535,438 19,849 - 63,918 619,205
Deferred acquisition cost 574,415 - - - - - - 19,447 593,862
Loans and receivables - - - - 2,040,078 988,639 - 148,576 3,177,293
Investment properties - - - - - - - 12,017,000 12,017,000
Intangible assets - - - - 229,332 - - 1,459,570 1,688,902
Property and equipment - - - - 1,430,946 11,270 - 271,804 1,714,020
Statutory deposit - - - - 300,000 200,000 - - 500,000
TOTAL ASSETS 14,322,860 2,460,850 2,916,719 2,768,432 8,482,537 3,042,837 2,093,043 18,650,063 54,737,342
LIABILITIES
Insurance liabilities 8,858,588 2,408,786 - - - - 1,766,570 1,399,379 14,433,323
Investment contract liabilities: - -
– At amortised cost - - - 2,734,268 - - - - 2,734,268
– Financial liabilities designated at fair value - - 2,916,718 - - - - (446) 2,916,272
Trade payables - - - - 7,029,810 377,156 - 16,594 7,423,560
Other liabilities - - - - 782,461 375,940 - 1,056,940 2,215,341
Current income tax liabilities - - - - 98,556 103,601 - 53,910 256,067
Borrowings - - - - - - - 4,225,811 4,225,811
Deferred tax liability - - - - 183,220 - - 384,308 567,528
TOTAL LIABILITIES 8,858,588 2,408,786 2,916,718 2,734,268 8,094,047 856,697 1,766,570 7,136,496 34,772,170
SURPLUS 5,464,272 52,064 1 34,164 388,491 2,186,140 326,473 11,513,567 19,965,172
Life
The following tables reconcile the consolidated statement of financial position to the classes and portfolios used in the Group’s ALM framework.
The Group is exposed to a range of financial risks through its financial assets, financial liabilities (investment contracts and borrowings), reinsurance assets and insurance liabilities. In particular,
the key financial risk is that in the long-term its investment proceeds are not sufficient to fund the obligations arising from its insurance and investment contracts. The most important
components of this financial risk are interest rate risk, equity price risk, foreign currency risk and credit risk.
These risks arise from open positions in interest rate, currency and equity products, all of which are exposed to general and specific market movements. The risks that the Group primarily faces
due to the nature of its investments and liabilities are interest rate risk and equity price risk.The Group manages these positions within an ALM framework that has been developed to achieve long-term investment returns in excess of its obligations under insurance and investment
contracts. Within the ALM framework, the Group periodically produces reports at portfolio, legal entity and asset and liability class level that are circulated to the Group’s key management
personnel. The principal technique of the Group’s ALM is to match assets to the liabilities arising from insurance and investment contracts by reference to the type of benefits payable to contract
holders. For each distinct class of liabilities, a separate portfolio of assets is maintained. The Group has not changed the processes used to manage its risks from previous periods.
The Group’s ALM is integrated with the management of the financial risks associated with the Group’s other classes of financial assets and liabilities not directly associated with insurance and
investment liabilities (in particular, borrowings and investments in foreign operations). The notes below explain how financial risks are managed using the categories utilized in the Group’s
ALM framework. In particular, the ALM Framework requires the management of interest rate risk, equity price risk and liquidity risk at the portfolio level. Foreign currency and credit risk are
managed on a group-wide basis.
Non Life
Investment Contract
The table below hypothecates the total assets of the parent into assets that represents insurance funds, shareholders' funds and other funds such as investment contracts:
The analysis of the hypothecation of financial assets per class and the analysis of investment income generated on these assets are contained in appendix 6
94

Notes to the financial statements
For the year ended 31 December 2016
AXA Mansard Insurance plc and Subsidiary Companies
Parent
Insurance fund Investment contract Shareholders funds Annuity 31-Dec-16
Non-life Iife
AXA
Mansard fund LS/LIP Non-life Iife Total
ASSETS
Cash and cash equivalents 2,549,486 107,509 - 25,904 65,791 66,859 62,532 2,878,081
Available-for-sale 2,796,331 1,621,145 - 2,742,528 3,743,471 1,439,191 1,891,805 14,234,470
Financial assets designated at fair value - - 2,916,719 - - 138,706 138,706 3,194,131
Trade receivables - - - - 137,482 178,323 - 315,805
Reinsurance assets 8,402,629 732,196 - - - - - 9,134,825
Other receivables - - - - 535,438 19,849 - 555,287
Deferred acquisition cost 574,415 - - - - - - 574,415
Loans and receivables - - - - 5,098,392 - - 5,098,392
Investment in subsidiaries - - - - 3,519,573 400,000 - 3,919,573
Intangible assets - - - - 229,332 - - 229,332
Property and equipment - - - - 1,430,946 11,270 - 1,442,216
Statutory deposit - - - - 300,000 200,000 - 500,000
TOTAL ASSETS 14,322,861 2,460,850 2,916,719 2,768,432 15,060,425 2,454,198 2,093,043 42,076,527
LIABILITIES
Insurance liabilities 8,858,588 2,408,786 - - - - 1,766,570 13,033,944
Investment contract liabilities:
– At amortised cost - - - 2,734,268 - - - 2,734,268
– Financial liabilities designated at fair value - - 2,916,718 - - - - 2,916,718
Trade payables - - - - 7,029,809 377,156 - 7,406,965
Other liabilities - - - - 641,521 375,940 - 1,017,461
Current income tax liabilities - - - - 98,556 103,601 - 202,157
Deferred income tax - - - - 183,220 - - 183,220
TOTAL LIABILITIES 8,858,588 2,408,786 2,916,718 2,734,268 7,953,106 856,697 1,766,570 27,494,733
SURPLUS 5,464,273 52,064 1 34,164 7,107,319 1,597,501 326,472 14,581,794
95
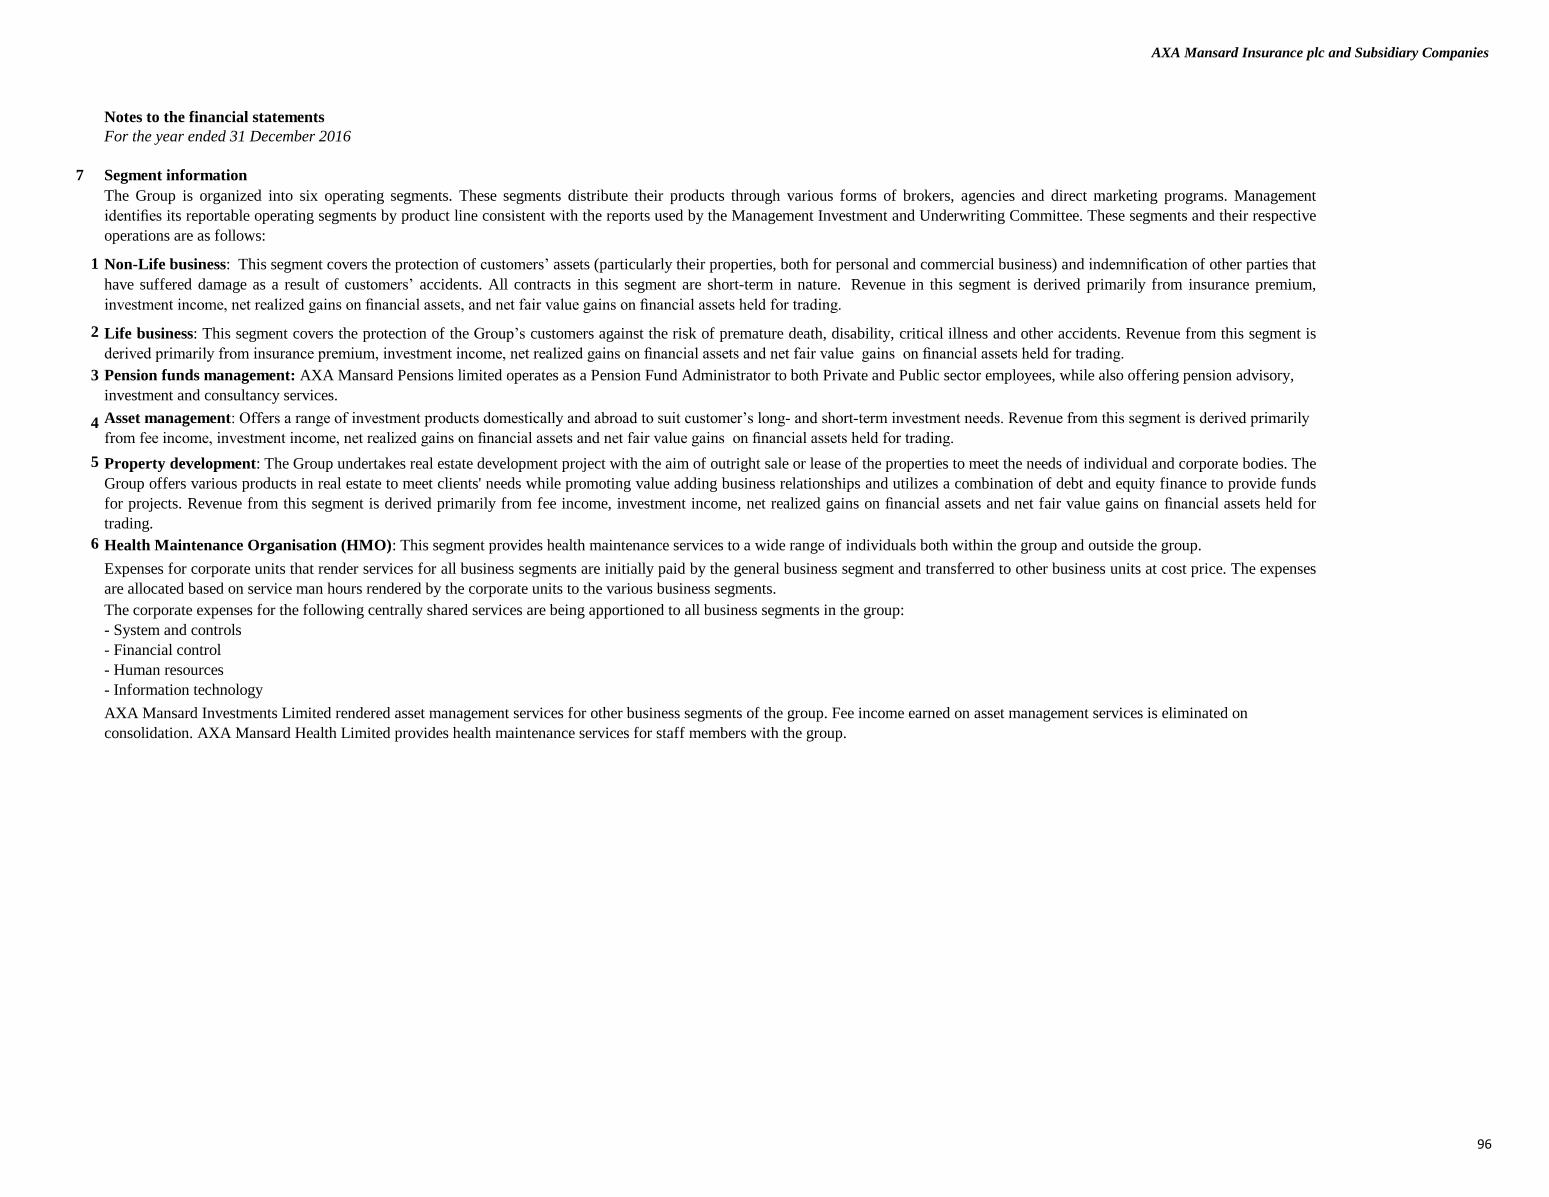
AXA Mansard Insurance plc and Subsidiary Companies
Notes to the financial statements
For the year ended 31 December 2016
7 Segment information
1
2
3
4
5
6
- System and controls
- Financial control
- Human resources
- Information technology
The Group is organized into six operating segments. These segments distribute their products through various forms of brokers, agencies and direct marketing programs. Management
identifies its reportable operating segments by product line consistent with the reports used by the Management Investment and Underwriting Committee. These segments and their respective
operations are as follows:
Non-Life business: This segment covers the protection of customers’ assets (particularly their properties, both for personal and commercial business) and indemnification of other parties that
have suffered damage as a result of customers’ accidents. All contracts in this segment are short-term in nature. Revenue in this segment is derived primarily from insurance premium,
investment income, net realized gains on financial assets, and net fair value gains on financial assets held for trading.
Life business: This segment covers the protection of the Group’s customers against the risk of premature death, disability, critical illness and other accidents. Revenue from this segment is
derived primarily from insurance premium, investment income, net realized gains on financial assets and net fair value gains on financial assets held for trading.
Pension funds management: AXA Mansard Pensions limited operates as a Pension Fund Administrator to both Private and Public sector employees, while also offering pension advisory,
investment and consultancy services.
Asset management: Offers a range of investment products domestically and abroad to suit customer’s long- and short-term investment needs. Revenue from this segment is derived primarily
from fee income, investment income, net realized gains on financial assets and net fair value gains on financial assets held for trading.
Property development: The Group undertakes real estate development project with the aim of outright sale or lease of the properties to meet the needs of individual and corporate bodies. The
Group offers various products in real estate to meet clients' needs while promoting value adding business relationships and utilizes a combination of debt and equity finance to provide funds
for projects. Revenue from this segment is derived primarily from fee income, investment income, net realized gains on financial assets and net fair value gains on financial assets held for
trading.
Health Maintenance Organisation (HMO): This segment provides health maintenance services to a wide range of individuals both within the group and outside the group.
Expenses for corporate units that render services for all business segments are initially paid by the general business segment and transferred to other business units at cost price. The expenses
are allocated based on service man hours rendered by the corporate units to the various business segments.
The corporate expenses for the following centrally shared services are being apportioned to all business segments in the group:
AXA Mansard Investments Limited rendered asset management services for other business segments of the group. Fee income earned on asset management services is eliminated on
consolidation. AXA Mansard Health Limited provides health maintenance services for staff members with the group.
96
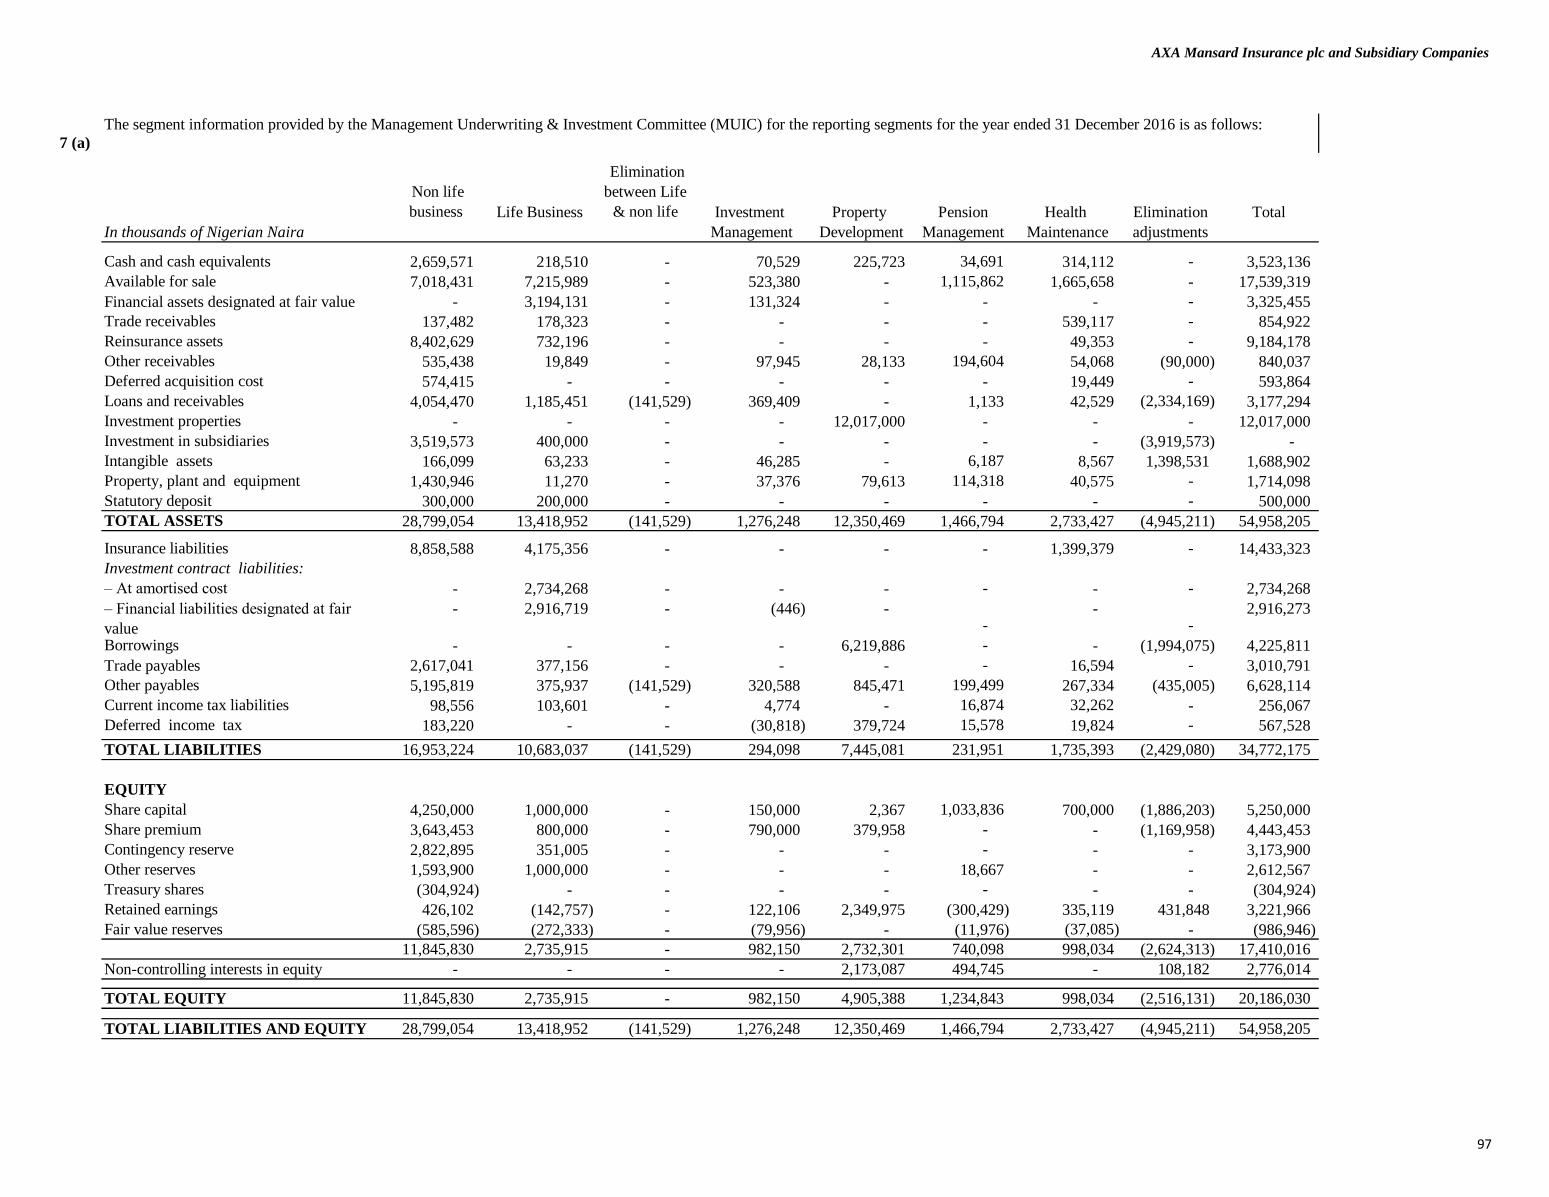
AXA Mansard Insurance plc and Subsidiary Companies
7 (a)
Non life
business Life Business
Elimination
between Life
& non life Investment Property Pension Health Elimination Total
In thousands of Nigerian Naira Management Development Management Maintenance adjustments
Cash and cash equivalents 2,659,571 218,510 - 70,529 225,723 34,691 314,112 - 3,523,136
Available for sale 7,018,431 7,215,989 - 523,380 - 1,115,862 1,665,658 - 17,539,319
- 3,194,131 - 131,324 - - - - 3,325,455
Trade receivables 137,482 178,323 - - - - 539,117 - 854,922
Reinsurance assets 8,402,629 732,196 - - - - 49,353 - 9,184,178
Other receivables 535,438 19,849 - 97,945 28,133 194,604 54,068 (90,000) 840,037
Deferred acquisition cost 574,415 - - - - - 19,449 - 593,864
Loans and receivables 4,054,470 1,185,451 (141,529) 369,409 - 1,133 42,529 (2,334,169) 3,177,294
Investment properties - - - - 12,017,000 - - - 12,017,000
Investment in subsidiaries 3,519,573 400,000 - - - - - (3,919,573) -
Intangible assets 166,099 63,233 - 46,285 - 6,187 8,567 1,398,531 1,688,902
Property, plant and equipment 1,430,946 11,270 - 37,376 79,613 114,318 40,575 - 1,714,098
Statutory deposit 300,000 200,000 - - - - - - 500,000
TOTAL ASSETS 28,799,054 13,418,952 (141,529) 1,276,248 12,350,469 1,466,794 2,733,427 (4,945,211) 54,958,205
Insurance liabilities 8,858,588 4,175,356 - - - - 1,399,379 - 14,433,323
Investment contract liabilities:
– At amortised cost - 2,734,268 - - - - - - 2,734,268
- 2,916,719 - (446) - -
- -
2,916,273
Borrowings - - - - 6,219,886 - - (1,994,075) 4,225,811
Trade payables 2,617,041 377,156 - - - - 16,594 - 3,010,791
Other payables 5,195,819 375,937 (141,529) 320,588 845,471 199,499 267,334 (435,005) 6,628,114
Current income tax liabilities 98,556 103,601 - 4,774 - 16,874 32,262 - 256,067
Deferred income tax 183,220 - - (30,818) 379,724 15,578 19,824 - 567,528
TOTAL LIABILITIES 16,953,224 10,683,037 (141,529) 294,098 7,445,081 231,951 1,735,393 (2,429,080) 34,772,175
EQUITY
Share capital 4,250,000 1,000,000 - 150,000 2,367 1,033,836 700,000 (1,886,203) 5,250,000
Share premium 3,643,453 800,000 - 790,000 379,958 - - (1,169,958) 4,443,453
Contingency reserve 2,822,895 351,005 - - - - - - 3,173,900
Other reserves 1,593,900 1,000,000 - - - 18,667 - - 2,612,567
Treasury shares (304,924) - - - - - - - (304,924)
Retained earnings 426,102 (142,757) - 122,106 2,349,975 (300,429) 335,119 431,848 3,221,966
Fair value reserves (585,596) (272,333) - (79,956) - (11,976) (37,085) - (986,946)
11,845,830 2,735,915 - 982,150 2,732,301 740,098 998,034 (2,624,313) 17,410,016
Non-controlling interests in equity - - - - 2,173,087 494,745 - 108,182 2,776,014
TOTAL EQUITY 11,845,830 2,735,915 - 982,150 4,905,388 1,234,843 998,034 (2,516,131) 20,186,030
28,799,054 13,418,952 (141,529) 1,276,248 12,350,469 1,466,794 2,733,427 (4,945,211) 54,958,205
The segment information provided by the Management Underwriting & Investment Committee (MUIC) for the reporting segments for the year ended 31 December 2016 is as follows:
– Financial liabilities designated at fair
value
Financial assets designated at fair value
TOTAL LIABILITIES AND EQUITY
97

AXA Mansard Insurance plc and Subsidiary Companies
Non life
business Life Business
Elimination
between Life
& non life Investment Property Pension Health Elimination Total
In thousands of Nigerian Naira Management Development Management Maintenance adjustments
Cash and cash equivalents 3,800,267 1,847,980 - 178,763 128,178 210,318 295,879 - 6,461,385
Available for sale assets 6,730,876 7,239,412 - 602,875 - 1,003,088 755,011 - 16,333,843
- 4,130,895 - 3,526,596 - - - - 7,657,491
Trade receivables 185,006 130,329 - - - - 370,828 - 686,163
Reinsurance assets 4,328,625 704,925 - - - - 22,294 - 5,055,844
Other receivables 459,201 33,978 - 73,889 129,568 177,049 41,197 (31,500) 883,383
Deferred acquisition cost 570,875 - - - - - 7,869 - 578,744
Loans and receivables 1,323,153 141,176 55,739 30,801 - 6,294 - (1,373,678) 183,484
Investment properties - - - - 9,205,350 - - - 9,205,350
Investment in subsidiaries 3,519,573 400,000 - - - - - (3,919,573) -
Intangible assets 239,493 - - 52,086 110 8,520 9,775 1,418,531 1,728,515
Property, plant and equipment 1,559,245 16,224 - 58,924 108,754 146,059 43,617 - 1,932,823
Statutory deposit 300,000 200,000 - - - - - - 500,000
TOTAL ASSETS 23,016,314 14,844,919 55,739 4,523,934 9,571,960 1,551,328 1,546,470 (3,906,220) 51,207,025
Insurance liabilities 8,197,269 4,096,571 - - - - 622,935 - 12,916,775
Investment contract liabilities:
– At amortised cost - 2,656,066 - - - - - - 2,656,066
– Financial liabilities designated at fair value - 4,130,895 - 3,526,596 - - - - 7,657,491
Borrowings - - - - 5,048,601 - - (1,020,372) 4,028,229
Trade payables 1,349,073 290,199 - - - - 1,797 - 1,641,069
Other payables 1,315,911 161,623 55,739 51,259 694,885 237,175 67,120 (384,807) 2,198,905
Current income tax liabilities 76,500 67,706 - 10,500 - 25,255 22,693 - 202,655
Deferred income tax 125,361 - - (31,827) 181,463 20,430 (8,486) - 286,941
TOTAL LIABILITIES 11,064,114 11,403,060 55,739 3,556,528 5,924,949 282,861 706,059 (1,405,179) 31,588,131
EQUITY
Share capital 4,250,000 1,000,000 - 150,000 2,367 1,033,836 700,000 (1,886,203) 5,250,000
Share premium 3,643,453 800,000 - 790,000 379,958 - (1,169,958) 4,443,453
Contingency reserve 2,405,879 316,133 - - - - - 2,722,012
Other reserves 1,532,979 1,000,000 - - - 14,629 - - 2,547,608
Treasury shares (304,924) - - - - - - - (304,924)
Retained earnings 316,943 (418,332) - 30,837 1,649,060 (298,451) 107,736 429,676 1,820,069
Fair value reserves 107,870 744,058 - (3,427) - 53,901 32,652 - 935,054
11,952,200 3,441,859 - 967,410 2,031,386 803,915 840,388 (2,626,485) 17,413,272
Non-controlling interests in equity - - 1,615,626 464,552 - 125,444 2,205,622
TOTAL EQUITY 11,952,200 3,441,859 - 967,410 3,647,012 1,268,467 840,388 (2,501,041) 19,618,894
23,016,314 14,844,919 55,739 4,523,938 9,571,961 1,551,328 1,546,447 (3,906,220) 51,207,025
Financial assets designated at fair value
TOTAL LIABILITIES AND EQUITY
98

AXA Mansard Insurance plc and Subsidiary Companies
Notes to the financial statementsFor the year ended 31 December 2016
(b) The consolidated financial data for the reporting segments for the year ended 31 December 2016 is as follows:
December 2016 Non life Life business
Investment
management
Property
development
Health
Maintenance
Pension
management
Elimination
Adjustments Total
Revenue:
Derived from external customers:
Gross premium 13,885,348 3,444,871 - - 3,503,493 - (120,582) 20,713,130 -
Gross premium income 14,293,718 3,579,158 - - 2,924,287 - (120,582) 20,676,581
Reinsurance expenses (8,584,572) (1,082,319) - - (60,554) - - (9,727,445)
Net premium income 5,709,146 2,496,839 - - 2,863,733 - (120,582) 10,949,136
Fees and commission income 816,887 178,669 - - - - - 995,556
Profits on investment contracts - 198,950 - - - - - 198,950
Investment income 1,133,058 737,711 301,072 1,072,282 254,200 427,719 (94,000) 3,832,042
Net fair value gains on financial assets 686,683 311,309 92,245 - 39,325 33,636 - 1,163,198
Other operating income 191,695 24,851 25,571 4,950 9,127 16 (135,533) 120,677
Gains on investment property - - - - - - - -
Rental income - - - 1,076,371 - - - 1,076,371
Net income 8,537,469 3,948,329 418,888 2,153,603 3,166,385 461,371 (350,115) 18,335,930
Insurance benefits and claims 4,917,926 2,145,763 - - 2,299,777 - - 9,363,466
Insurance claims recovered from re-insurer (1,991,922) (547,614) - - (8,028) - - (2,547,564)
Net insurance benefits and claims 2,926,004 1,598,149 - - 2,291,749 - - 6,815,902
Commission expenses 1,498,835 256,449 - - - - - 1,755,284
Other acquisition expenses 154,396 74,135 - - 87,833 - 316,364
Changes in individual life reserves - 162,837 - - - - - 162,837
Increase/(decrease) in annuity reserves - (98,098) - - - - - (98,098)
Expenses for marketing and administration 790,109 386,279 71,072 - 61,720 116,258 - 1,425,438
Employee benefit expense 1,287,397 577,497 162,625 9,521 174,045 211,161 (120,584) 2,301,662
Depreciation and amortisation 354,894 16,113 33,107 29,430 19,158 46,190 20,000 518,892
Impairment loss /(writeback) on trade receivables 34,239 2,956 - - 9,089 - - 46,284
Other expenses 669,522 530,301 54,550 78,257 135,347 53,540 - 1,521,517
Net expenses 7,715,396 3,506,618 321,354 117,208 2,778,941 427,149 (100,584) 14,766,082 -
Reportable segment profit 822,073 441,711 97,534 2,036,395 387,444 34,222 (249,531) 3,569,848
Finance cost - - (579,757) - - 135,533 (444,224)
Profit before income tax from reportable
segments 822,073 441,711 97,534 1,456,638 387,444 34,222 (113,998) 3,125,624
Income tax expenses (134,966) (88,441) (6,470) (198,261) (60,572) (1,920) - (490,630)
Profit after income tax 687,107 353,270 91,064 1,258,377 326,872 32,302 (113,998) 2,634,994
Assets and liabilities -
Total assets 28,799,054 13,418,952 1,276,248 12,350,469 2,733,427 1,466,794 (5,086,740) 54,958,204
Total liabilities 16,953,224 10,683,037 294,098 7,445,081 1,735,393 231,951 (2,570,609) 34,772,175
Net assets/(liabilities) 11,845,830 2,735,915 982,150 4,905,388 998,034 1,234,843 (2,516,131) 20,186,029
99

AXA Mansard Insurance plc and Subsidiary Companies
Notes to the financial statementsFor the year ended 31 December 2016
31 December 2016 Non life Life business
Investment
management
Property
development
Health
Maintenance
Pension
management
Elimination
Adjustments Total
-
Segment reporting - -
In thousands of Naira -
External revenue -
Net premium earned 5,709,146 2,496,839 - - 2,863,733 - - 11,069,718
Net interest income 1,133,058 936,661 301,072 1,072,282 254,200 427,719 - 4,124,992
Net fees and commission 816,887 178,669 - - - - - 995,556
Net trading income 686,683 311,309 92,245 1,072,282 39,325 33,636 - 2,235,480
Other income 191,695 24,851 25,571 1,081,321 9,127 16 - 1,332,581
Inter segment revenue 120,584 - 135,533 - - (350,115) (93,998)
Total segment revenue 8,658,053 3,948,329 418,888 3,361,418 3,166,385 461,371 (350,115) 19,664,329
-
Reportable segment profit before tax 822,073 441,711 97,534 1,456,638 387,444 34,222 (113,998) 3,125,624
-
Reportable segment assets 28,799,054 13,418,952 1,276,248 12,350,469 2,733,427 1,466,794 (5,086,740) 54,958,204
Reportable segment liabilities 16,953,224 10,683,037 294,098 7,445,081 1,735,393 231,951 (2,570,609) 34,772,175
-
100
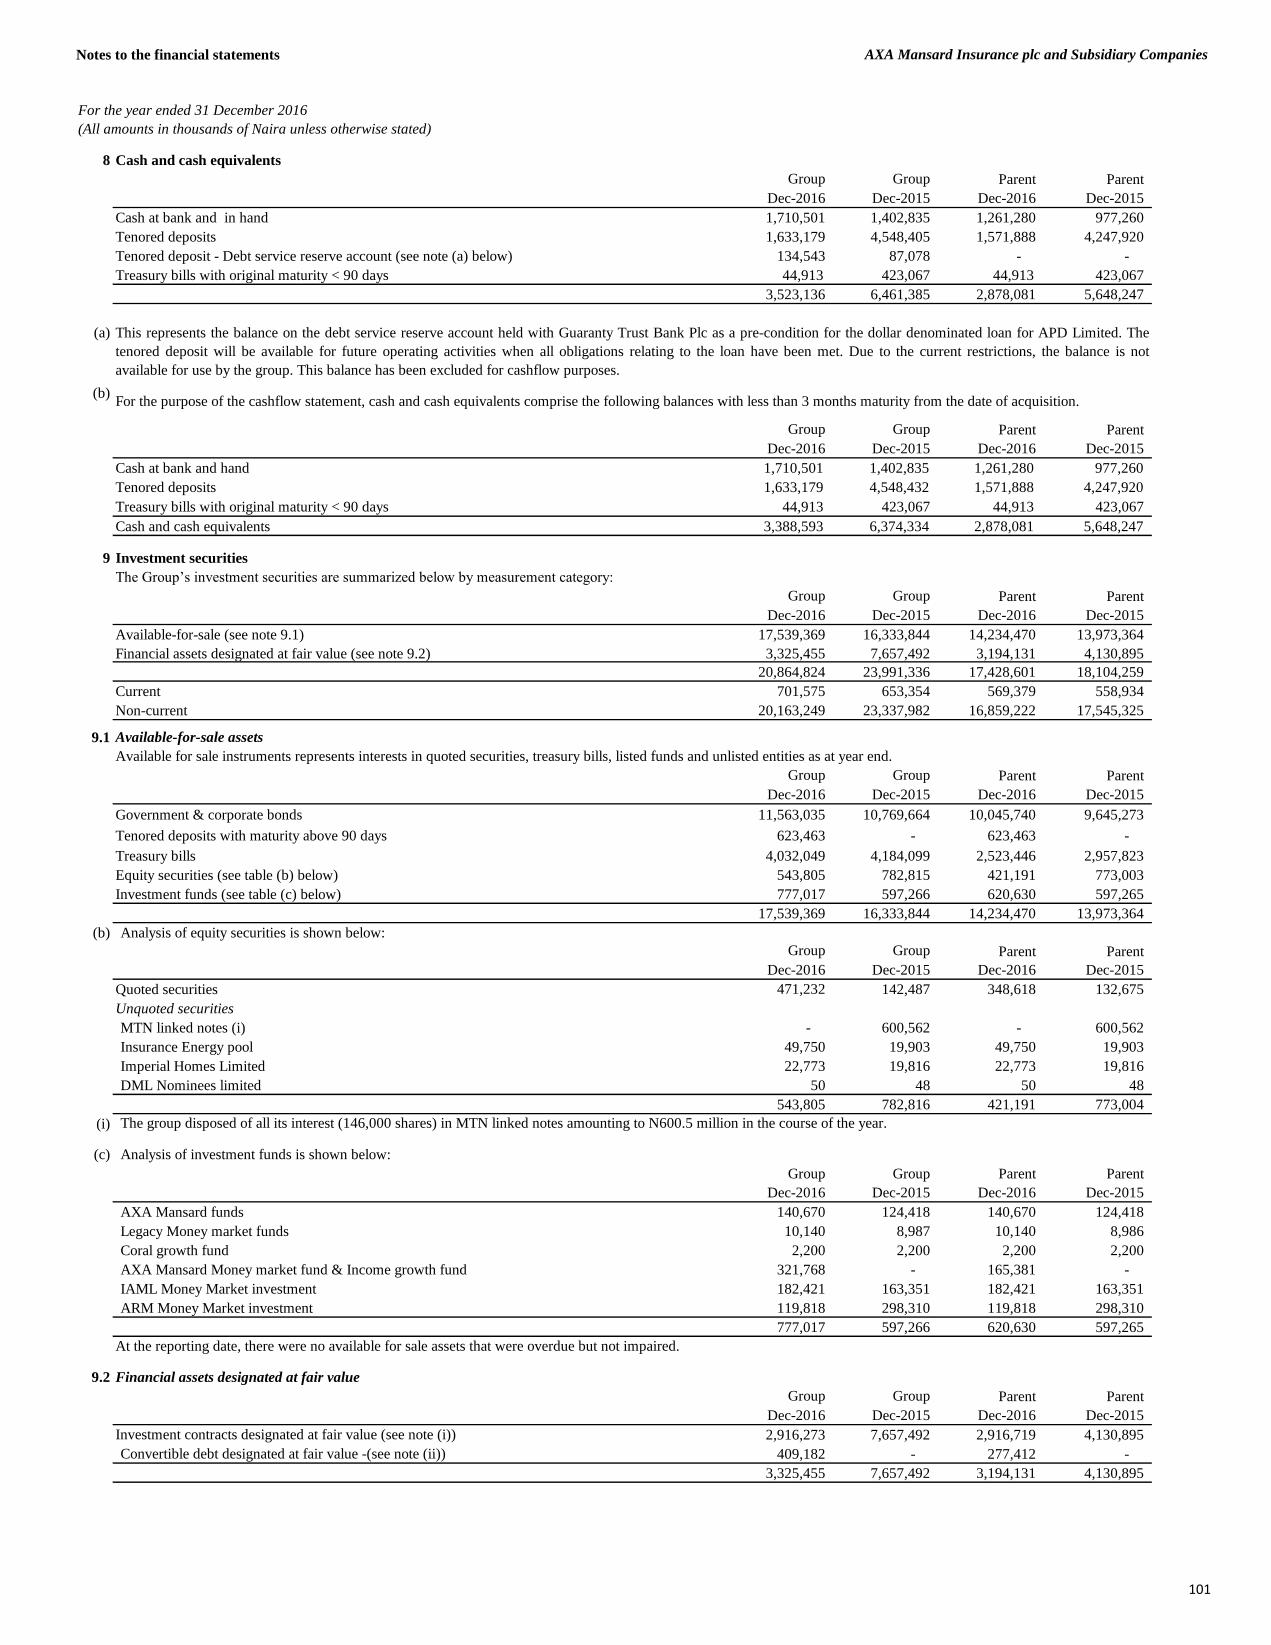
Notes to the financial statements AXA Mansard Insurance plc and Subsidiary Companies
For the year ended 31 December 2016
(All amounts in thousands of Naira unless otherwise stated)
8 Cash and cash equivalents
Group Group Parent Parent
Dec-2016 Dec-2015 Dec-2016 Dec-2015
Cash at bank and in hand 1,710,501 1,402,835 1,261,280 977,260
Tenored deposits 1,633,179 4,548,405 1,571,888 4,247,920
Tenored deposit - Debt service reserve account (see note (a) below) 134,543 87,078 - -
Treasury bills with original maturity < 90 days 44,913 423,067 44,913 423,067
3,523,136 6,461,385 2,878,081 5,648,247
(a)
(b)
Group Group Parent Parent
Dec-2016 Dec-2015 Dec-2016 Dec-2015
Cash at bank and hand 1,710,501 1,402,835 1,261,280 977,260
Tenored deposits 1,633,179 4,548,432 1,571,888 4,247,920
Treasury bills with original maturity < 90 days 44,913 423,067 44,913 423,067
Cash and cash equivalents 3,388,593 6,374,334 2,878,081 5,648,247
9 Investment securities
The Group’s investment securities are summarized below by measurement category:
Group Group Parent Parent
Dec-2016 Dec-2015 Dec-2016 Dec-2015
Available-for-sale (see note 9.1) 17,539,369 16,333,844 14,234,470 13,973,364
Financial assets designated at fair value (see note 9.2) 3,325,455 7,657,492 3,194,131 4,130,895
20,864,824 23,991,336 17,428,601 18,104,259
Current 701,575 653,354 569,379 558,934
Non-current 20,163,249 23,337,982 16,859,222 17,545,325
9.1 Available-for-sale assets
Group Group Parent Parent
Dec-2016 Dec-2015 Dec-2016 Dec-2015
Government & corporate bonds 11,563,035 10,769,664 10,045,740 9,645,273
Tenored deposits with maturity above 90 days 623,463 - 623,463 -
Treasury bills 4,032,049 4,184,099 2,523,446 2,957,823
Equity securities (see table (b) below) 543,805 782,815 421,191 773,003
Investment funds (see table (c) below) 777,017 597,266 620,630 597,265
17,539,369 16,333,844 14,234,470 13,973,364
(b) Analysis of equity securities is shown below:
Group Group Parent Parent
Dec-2016 Dec-2015 Dec-2016 Dec-2015
Quoted securities 471,232 142,487 348,618 132,675
Unquoted securities
MTN linked notes (i) - 600,562 - 600,562
Insurance Energy pool 49,750 19,903 49,750 19,903
Imperial Homes Limited 22,773 19,816 22,773 19,816
DML Nominees limited 50 48 50 48
543,805 782,816 421,191 773,004
(i)
(c) Analysis of investment funds is shown below:
Group Group Parent Parent
Dec-2016 Dec-2015 Dec-2016 Dec-2015
AXA Mansard funds 140,670 124,418 140,670 124,418
Legacy Money market funds 10,140 8,987 10,140 8,986
Coral growth fund 2,200 2,200 2,200 2,200
AXA Mansard Money market fund & Income growth fund 321,768 - 165,381 -
IAML Money Market investment 182,421 163,351 182,421 163,351
ARM Money Market investment 119,818 298,310 119,818 298,310
777,017 597,266 620,630 597,265
At the reporting date, there were no available for sale assets that were overdue but not impaired.
9.2 Financial assets designated at fair value
Group Group Parent Parent
Dec-2016 Dec-2015 Dec-2016 Dec-2015
Investment contracts designated at fair value (see note (i)) 2,916,273 7,657,492 2,916,719 4,130,895
Convertible debt designated at fair value -(see note (ii)) 409,182 - 277,412 -
3,325,455 7,657,492 3,194,131 4,130,895
This represents the balance on the debt service reserve account held with Guaranty Trust Bank Plc as a pre-condition for the dollar denominated loan for APD Limited. The
tenored deposit will be available for future operating activities when all obligations relating to the loan have been met. Due to the current restrictions, the balance is not
available for use by the group. This balance has been excluded for cashflow purposes.
For the purpose of the cashflow statement, cash and cash equivalents comprise the following balances with less than 3 months maturity from the date of acquisition.
Available for sale instruments represents interests in quoted securities, treasury bills, listed funds and unlisted entities as at year end.
The group disposed of all its interest (146,000 shares) in MTN linked notes amounting to N600.5 million in the course of the year.
101
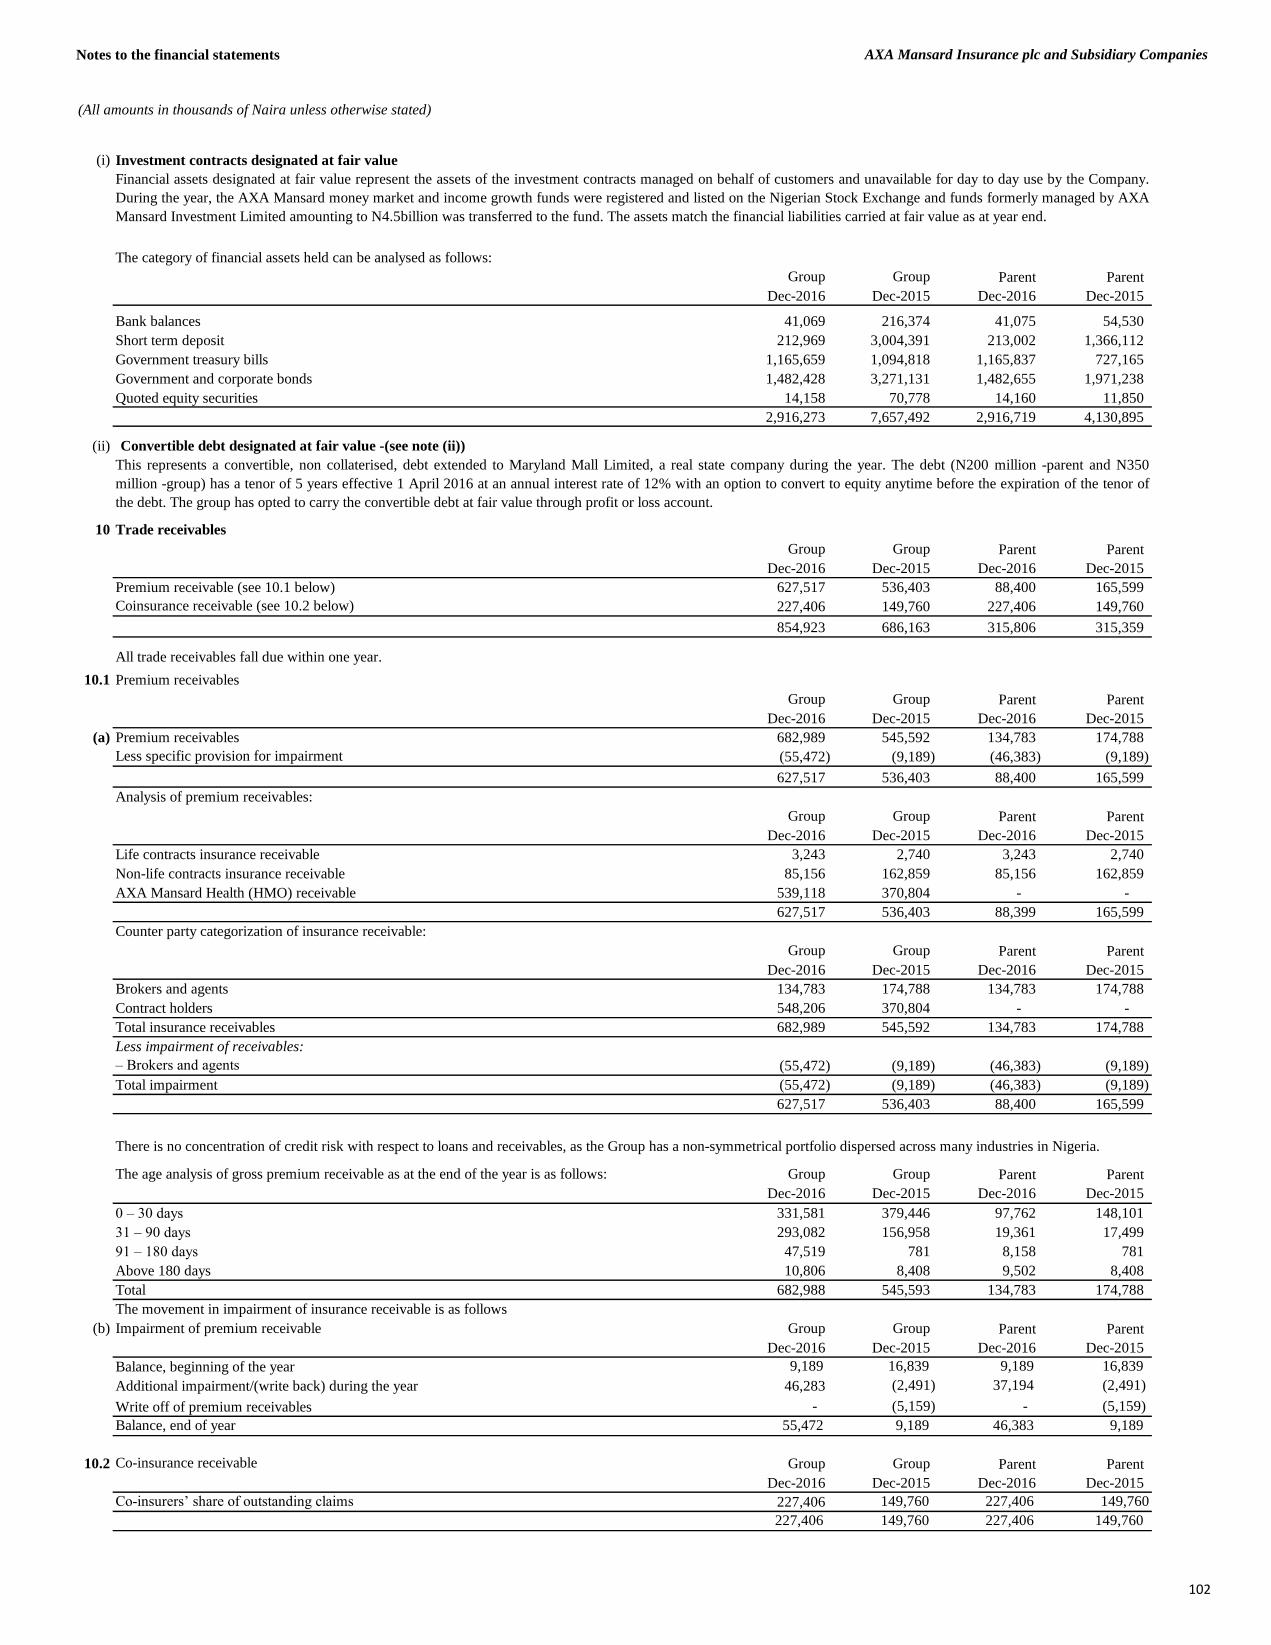
Notes to the financial statements AXA Mansard Insurance plc and Subsidiary Companies
(All amounts in thousands of Naira unless otherwise stated)
(i) Investment contracts designated at fair value
Group Group Parent Parent
Dec-2016 Dec-2015 Dec-2016 Dec-2015
Bank balances 41,069 216,374 41,075 54,530
Short term deposit 212,969 3,004,391 213,002 1,366,112
Government treasury bills 1,165,659 1,094,818 1,165,837 727,165
Government and corporate bonds 1,482,428 3,271,131 1,482,655 1,971,238
Quoted equity securities 14,158 70,778 14,160 11,850
2,916,273 7,657,492 2,916,719 4,130,895
(ii) Convertible debt designated at fair value -(see note (ii))
10 Trade receivables
Group Group Parent Parent
Dec-2016 Dec-2015 Dec-2016 Dec-2015
Premium receivable (see 10.1 below) 627,517 536,403 88,400 165,599
Coinsurance receivable (see 10.2 below) 227,406 149,760 227,406 149,760
854,923 686,163 315,806 315,359
All trade receivables fall due within one year.
10.1 Premium receivables
Group Group Parent Parent
Dec-2016 Dec-2015 Dec-2016 Dec-2015
(a) Premium receivables 682,989 545,592 134,783 174,788
Less specific provision for impairment (55,472) (9,189) (46,383) (9,189)
627,517 536,403 88,400 165,599
Analysis of premium receivables:
Group Group Parent Parent
Dec-2016 Dec-2015 Dec-2016 Dec-2015
Life contracts insurance receivable 3,243 2,740 3,243 2,740
Non-life contracts insurance receivable 85,156 162,859 85,156 162,859
AXA Mansard Health (HMO) receivable 539,118 370,804 - -
627,517 536,403 88,399 165,599
Counter party categorization of insurance receivable:
Group Group Parent Parent
Dec-2016 Dec-2015 Dec-2016 Dec-2015
Brokers and agents 134,783 174,788 134,783 174,788
Contract holders 548,206 370,804 - -
Total insurance receivables 682,989 545,592 134,783 174,788
Less impairment of receivables:
– Brokers and agents (55,472) (9,189) (46,383) (9,189)
Total impairment (55,472) (9,189) (46,383) (9,189)
627,517 536,403 88,400 165,599
The age analysis of gross premium receivable as at the end of the year is as follows: Group Group Parent Parent
Dec-2016 Dec-2015 Dec-2016 Dec-2015
0 – 30 days 331,581 379,446 97,762 148,101
31 – 90 days 293,082 156,958 19,361 17,499
91 – 180 days 47,519 781 8,158 781
Above 180 days 10,806 8,408 9,502 8,408
Total 682,988 545,593 134,783 174,788
The movement in impairment of insurance receivable is as follows
(b) Impairment of premium receivable Group Group Parent Parent
Dec-2016 Dec-2015 Dec-2016 Dec-2015
Balance, beginning of the year 9,189 16,839 9,189 16,839
Additional impairment/(write back) during the year 46,283 (2,491) 37,194 (2,491)
Write off of premium receivables - (5,159) - (5,159)
Balance, end of year 55,472 9,189 46,383 9,189
10.2 Co-insurance receivable Group Group Parent Parent
Dec-2016 Dec-2015 Dec-2016 Dec-2015
Co-insurers’ share of outstanding claims 227,406 149,760 227,406 149,760
227,406 149,760 227,406 149,760
The category of financial assets held can be analysed as follows:
There is no concentration of credit risk with respect to loans and receivables, as the Group has a non-symmetrical portfolio dispersed across many industries in Nigeria.
Financial assets designated at fair value represent the assets of the investment contracts managed on behalf of customers and unavailable for day to day use by the Company.
During the year, the AXA Mansard money market and income growth funds were registered and listed on the Nigerian Stock Exchange and funds formerly managed by AXA
Mansard Investment Limited amounting to N4.5billion was transferred to the fund. The assets match the financial liabilities carried at fair value as at year end.
This represents a convertible, non collaterised, debt extended to Maryland Mall Limited, a real state company during the year. The debt (N200 million -parent and N350
million -group) has a tenor of 5 years effective 1 April 2016 at an annual interest rate of 12% with an option to convert to equity anytime before the expiration of the tenor of
the debt. The group has opted to carry the convertible debt at fair value through profit or loss account.
102

Notes to the financial statements AXA Mansard Insurance plc and Subsidiary Companies
(All amounts in thousands of Naira unless otherwise stated)
11 Reinsurance assets Group Group Parent Parent
Dec-2016 Dec-2015 Dec-2016 Dec-2015
Total reinsurers’ share of outstanding claims (see note (a) below) 1,613,557 778,901 1,600,088 767,397
Prepaid re-insurance- Non life (see note (b) below) 2,870,769 3,088,979 2,834,886 3,078,190
Reinsurance premium paid in advance for 2017 policies 2,500,786 - 2,500,786 -
Reinsurance share of group life reserves (see note (c) below) 243,503 347,909 243,503 347,909
Reinsurance share of individual life reserves (see note (d) below) 18,131 37,287 18,131 37,287
Reinsurance share of Incurred But Not Reported (IBNR) claims (see note (e) below) 788,686 625,724 788,686 625,724
Recoverables from reinsurers on claims paid (see note (f) below) 1,148,745 177,044 1,148,745 177,044
9,184,177 5,055,844 9,134,825 5,033,551
(a) The movement in reinsurers’ share of outstanding claims is as follows: Group Group Parent Parent
Dec-2016 Dec-2015 Dec-2016 Dec-2015
Balance, beginning of the year 778,901 530,941 767,397 530,941
Movement during the year 834,656 247,960 832,691 236,456
1,613,557 778,901 1,600,088 767,397
Reinsurance share of outstanding claims can be analysed as follows: Group Group Parent Parent
Dec-2016 Dec-2015 Dec-2016 Dec-2015
Non-life 1,481,097 636,243 1,481,097 636,243
Life 118,991 131,155 118,991 131,155
AXA Mansard Health (HMO) 13,469 11,503 - -
Balance, end of year 1,613,557 778,901 1,600,088 767,398
(b) The movement in prepaid reinsurance -Non life & health is as follows: Group Group Parent Parent
Dec-2016 Dec-2015 Dec-2016 Dec-2015
Balance, beginning of the year 3,088,979 3,845,886 3,078,190 3,840,907
Additions in the year 8,426,917 5,466,316 8,341,269 5,426,713
Released in the year (8,645,127) (6,223,223) (8,584,573) (6,189,430)
2,870,769 3,088,979 2,834,886 3,078,190
(c) The movement in prepaid reinsurance for group life: Group Group Parent Parent
Dec-2016 Dec-2015 Dec-2016 Dec-2015
Balance, beginning of the year 347,909 141,086 347,909 141,086
Movement during the year (104,406) 206,823 (104,406) 206,823
243,503 347,909 243,503 347,909
The total reinsurance cost for the life business is N958,757,000 (2015: N973,723,000) as dislosed in note 30
(d) The movement in reinsurance share of individual life reserves: Group Group Parent Parent
Dec-2016 Dec-2015 Dec-2016 Dec-2015
Balance, beginning of the year 37,287 33,470 37,287 33,470
Movement during the year (19,156) 3,817 (19,156) 3,817
18,131 37,287 18,131 37,287
(e) Reinsurance share of IBNR can be analysed as follows: Group Group Parent Parent
Dec-2016 Dec-2015 Dec-2016 Dec-2015
Non-life 437,115 437,151 437,115 437,151
Life 351,571 188,573 351,571 188,573
Balance, end of year 788,686 625,724 788,686 625,724
The movement in reinsurance IBNR: Group Group Parent Parent
Dec-2016 Dec-2015 Dec-2016 Dec-2015
Balance, beginning of the year 625,724 473,893 625,724 473,893
Movement during the year 162,962 151,831 162,962 151,831
788,686 625,724 788,686 625,724
(f) The movement in recoverables from reinsurers on claims paid Group Group Parent Parent
Dec-2016 Dec-2015 Dec-2016 Dec-2015
Balance, beginning of the year 177,044 64,199 177,044 64,199
Additions in the year 1,782,796 509,084 1,776,733 497,580
Receipts during the year (811,095) (396,239) (805,032) (384,735)
1,148,745 177,044 1,148,745 177,044
(g) The movement in provision for impairment of reinsurance assets: Group Group Parent Parent
Dec-2016 Dec-2015 Dec-2016 Dec-2015
Balance, beginning of the year - 7,088 - 7,088
Additions in the year - - - -
Write-off during the year - (7,088) - (7,088)
- - - -
Current 8,397,205 1,866,563 8,347,853 1,844,270
Non current 786,972 3,189,281 786,972 3,189,281
Total 9,184,177 5,055,844 9,134,825 5,033,551
103

AXA Mansard Insurance plc and Subsidiary Companies
Notes to the financial statements
For the year ended 31 December 2016
(All amounts in thousands of Naira unless otherwise stated)
12 Other receivables Group Group Parent Parent
Dec-2016 Dec-2015 Dec-2016 Dec-2015
Prepayment 644,451 511,985 423,266 362,168
Accrued income 153,773 139,535 21,203 35,703
Accrued dividend - - 90,000 31,500
Receivable from investment brokers 13,377 36,009 13,377 36,009
Other account receivables 52,565 215,580 31,571 47,526
Gross 864,166 903,109 579,417 512,906
Less: Specific impairment of other receivables (see (a) below) (24,130) (19,727) (24,130) (19,727)
Net receivables 840,036 883,382 555,287 493,179
(a) The movement in provision for impairment of other receivables: Group Group Parent Parent
Dec-2016 Dec-2015 Dec-2016 Dec-2015
Balance, beginning of the year 19,727 19,727 19,727 19,727
Charge for the year 4,403 - 4,403 -
Balance end of year 24,130 19,727 24,130 19,727
Current 434,532 561,786 207,240 239,961
Non-current 429,634 341,323 372,177 272,945
864,166 903,109 579,417 512,906
13 Deferred acquisition cost
This relates to the commission paid on the unexpired premium reserve Group Group Parent Parent
Dec-2016 Dec-2015 Dec-2016 Dec-2015
Deferred acquisition cost- Fire 97,384 77,376 97,384 77,376
Deferred acquisition cost- Gen. Accident 51,555 36,068 51,555 36,068
Deferred acquisition cost- Motor 83,293 78,834 83,293 78,834
Deferred acquisition cost- Marine 43,181 39,595 43,181 39,595
Deferred acquisition cost- Engineering 35,629 36,182 35,629 36,182
Deferred acquisition cost- Oil & Gas 251,511 290,283 251,511 290,283
Deferred acquisition cost- Aviation 11,860 12,537 11,860 12,537
Deferred acquisition cost- HMO 19,449 7,869 - -
Total 593,862 578,744 574,413 570,875
The movement in deferred acquisition cost is as follows:
Group Group Parent Parent
Dec-2016 Dec-2015 Dec-2016 Dec-2015
Balance, beginning of year 578,744 664,944 570,875 661,724
Movement in deferred acquisition cost 15,118 (86,200) 3,538 (90,849)
Balance, end of year 593,862 578,744 574,413 570,875
Current 311,295 311,295 311,295 311,295
Non-current 282,567 267,449 263,118 259,580
593,862 578,744 574,413 570,875
14 Loans and receivables Group Group Parent Parent
Dec-2016 Dec-2015 Dec-2016 Dec-2015
Loans and advances to related party (see note (a) below) - - 2,112,339 1,390,844
Investment in debt instrument (see note (b) below) 441,739 - 293,163 -
Other loans (see (c) below) 2,601,507 - 2,601,507 -
Staff loans and advances 147,964 193,953 105,300 139,693
Gross 3,191,210 193,953 5,112,309 1,530,537
Less: Specific impairment of staff loans and advances (13,917) (10,469) (13,917) (10,469)
Net loans and receivables 3,177,293 183,484 5,098,392 1,520,068
(a)
(b)
(c)
(d) The movement in provision for impairment of loans and receivables: Group Group Parent Parent
Dec-2016 Dec-2015 Dec-2016 Dec-2015
Balance, beginning of the year 10,469 10,469 10,469 10,469
Additions, during the year 3,448 - 3,448 -
Balance end of year 13,917 10,469 13,917 10,469
Current 2,675,489 71,518 3,977,157 69,846
Non-current 515,721 122,435 1,135,152 1,460,691
Included in loans and advances to related parties is an unsecured facility of N760 million to a related party, APD Limited, with a tenor of 5 years commencing from October 2014.
Interest is accrued at an effective interest rate of 12.85% and the loan, with the accrued interest, is payable at maturity. Also included are non collaterised short term loans granted
to APD Limited with an average tenure of three (3) months. The make up of loans and advances to related parties both contractual loan (as indicated above) and intercompany
balances based on day-to-day intercompany transactions in the normal course of business are as follows (i) AXA Mansard Health Limited- N21 million, (ii) AXA Mansard
Pensions Limited - N168 million and (iii) APD Limited- N1.924 billion
This represents a loan with a tenor of 1 year at an interest rate of 22.5% per annum granted towards a hospital project. The Company is partnering with the International Finance
Corporation, Africa Capital Alliance, Synergy Capital and Healthshare Health Solutions of South Africa to develop a world class 150-bed acute care hospital in Lagos, Nigeria to
further support the development of its health insurance business. The loan relates to the funding made available to the consortium for the purchase of the hospital land and other
pre-approval processes. The construction of the hospital is expected to commence in July 2017. The plan is to convert the loan into an investment (equity) before the end of 2017.
This represents a non collaterised debt instrument to Maryland Mall Limited, a real estate company, during the year. The debt has a tenor of 5 years effective 1 April 2016 with an
annual interest rate of 18%.
104

AXA Mansard Insurance plc and Subsidiary Companies
Notes to the financial statements
For the year ended 31 December 2016
(All amounts in thousands of Naira unless otherwise stated)
15 Investment property
Group Group
Dec-2016 Dec-2015
Office property 12,017,000 9,205,350
Balance, end of year 12,017,000 9,205,350
The movement in investment property is analysed as follows:
Group Group
Dec-2016 Dec-2015
Balance, beginning of year 9,205,350 8,313,300
Fair value gain 2,811,650 892,050
Investment property at fair value 12,017,000 9,205,350
16 Investment in subsidiaries
(a) The Company's investment in subsidiaries is as stated below:
Parent Parent
Dec-2016 Dec-2015
AXA Mansard Investments Limited 940,000 940,000
APD Limited 382,326 382,326
AXA Mansard Health Limited 712,000 712,000
AXA Mansard Pensions Limited 1,885,247 1,885,247
3,919,573 3,919,573
(b) Principal subsidiary undertakings:
Company name Country of
origin
% of equity
capital
controlled
AXA Mansard Investments Limited Nigeria 100
APD Limited Nigeria 55.7
AXA Mansard Health Limited Nigeria 100
AXA Mansard Pensions Limited Nigeria 60
1
2
3
4
Investment property comprises a commercial property held for the purpose of capital appreciation and rental income. Investment property is carried at fair value which is
determined by independent professional valuers. Office property was valued by Broll Property Services Limited as at 31 December 2016. The property was valued using the
income approach. The valuation was based on market data such as discount rates, rental risk and reversionary rates. Rental income on investment property included in the
statement of comprehensive income for the year was N1.07billion (2015: N912million). Also, repairs and maintenance were carried out on the building amounting to
N51.8million.
The Group is controlled by AXA Mansard Insurance plc “the parent” (incorporated in Nigeria). The controlling interest of AXA Mansard Insurance Plc in the Group entities is
disclosed in the table below:
Nature of business
Asset management services
Health Maintenance Organisation
Pension Funds Administration
Property development
AXA Mansard Investments Limited was incorporated in January 2008 and its principal activity involves provision of portfolio management services to both individual and
corporate clients.
AXA Mansard Pensions Limited was incorporated on 1 February 2005 as a private limited liability company. The principal activity of the Company is administration and
management of pension fund assets in line with the provisions of the Pension Reform Act 2004. AXA Mansard Insurance Plc acquired 60% equity stake in AXA Mansard
Pensions Limited in January 2015. As at date of acquisition, the fair value of the total consideration transferred was N1.885 billion.
APD Limited was incorporated on 2 September 2010 for the purpose of holding and developing a commercial office property located at Plot 928A/B, Bishop Aboyade Cole Street,
Victoria Island, Lagos to an ultra modern office structure.
AXA Mansard Health Limited was incorporated as a private limited liability company on the 7th of August 2003 and its principal activities is to manage the provision of health
care services through health care providers and for that purpose was accredited with the National Health Insurance Scheme.
105

AXA Mansard Insurance plc and Subsidiary Companies
Notes to the financial statements
For the year ended 31 December 2016
(All amounts in thousands of Naira unless otherwise stated)
(c )
(i) APD Limited Group Group
Dec-2016 Dec-2015
NCI percentage 44.3% 44.3%
Cash and cash equivalents 225,723 128,179
Other receivables 28,133 129,568
Investment properties 12,017,000 9,205,350
Property and equipment 79,614 108,755
Intangible assets - 110
Borrowings (6,219,886) (5,048,601)
Other liabilities (1,225,195) (876,348)
Net assets 4,905,389 3,647,013
Carrying amount of NCI 2,173,087 1,615,627
Dec-2016 Dec-2015
Income 2,153,603 1,529,106
Expenses 696,965 701,944
Profit before tax 1,456,638 827,162
Profit after tax 1,258,377 885,136
Profit allocated to NCI (44.3%) 557,461 417,524
Cash flows from operating activities 1,207,040 578,399
Cash flows from investing activities (180) (76,122)
Cash flows from financing activities (936,082) (892,757)
Net increase/(decrease) in cash and cash equivalents 270,778 (390,480)
(ii) AXA Mansard Pensions Limited Group Group
Dec-2016 Dec-2015
NCI percentage 40% 40%
Cash and cash equivalents 34,691 210,318
Other receivables 195,737 183,343
Investment securities 1,115,862 1,003,088
Property and equipment 114,318 146,059
Intangible assets 6,187 8,520
Other liabilities (231,951) (282,861)
Net asset 1,234,844 1,268,467
Fair value adjustments - 206,522
Adjusted net assets 1,234,844 1,474,989
Carrying amount of NCI 493,938 589,996 Dec-2016 Dec-2015
Income 461,371 451,997
Expenses 427,149 359,620
Profit before tax 34,222 92,377
Profit after tax 32,302 63,521
Profit allocated to NCI (40%) 12,921 25,408
Cash flows from operating activities (148,652) (48,760)
Cash flows from investing activities (60,631) 84,077
Cash flows from financing activities - -
Net (decrease)/increase in cash and cash equivalents (209,283) 35,317
(d) Significant restrictions and impairment
The regulatory frameworks require all insurance companies to maintain certain levels of regulatory capital and liquid assets and comply with other ratios such as the solvency
margin.
The group does not have significant restrictions on its ability to access or use its assets and settle its liabilities other than those resulting from the regulatory frameworks within
which the insurance business operates.
The table below summarises the information relating to the Group's subsidiaries that have material Non-Controlling Interest (NCI) before any intra-group eliminations.
The Company's investment in subsidiaries was tested for impairment as at 31 December 2016 with no element of impairment identified. Based on the result of this test, no
impairment charge was recognised.
106
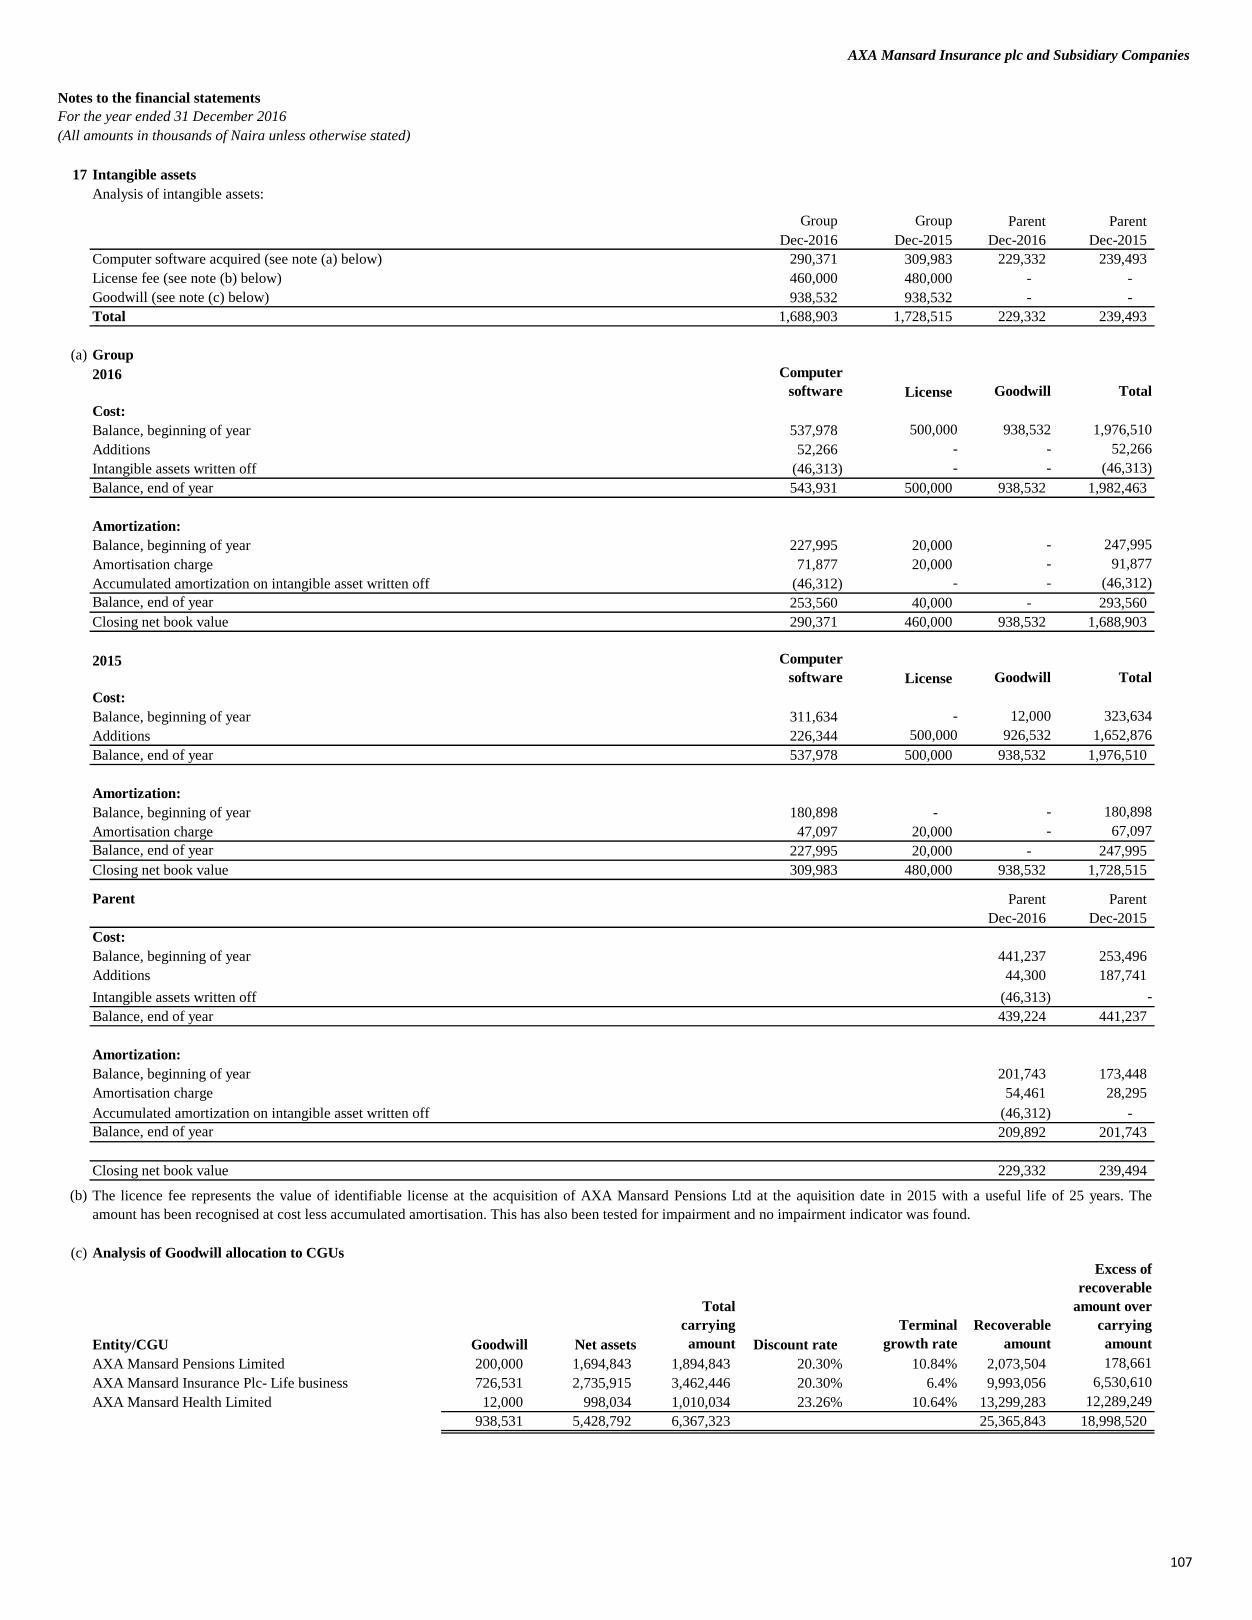
AXA Mansard Insurance plc and Subsidiary Companies
Notes to the financial statements
For the year ended 31 December 2016
(All amounts in thousands of Naira unless otherwise stated)
17 Intangible assets
Analysis of intangible assets:
Group Group Parent Parent
Dec-2016 Dec-2015 Dec-2016 Dec-2015
Computer software acquired (see note (a) below) 290,371 309,983 229,332 239,493
License fee (see note (b) below) 460,000 480,000 - -
Goodwill (see note (c) below) 938,532 938,532 - -
Total 1,688,903 1,728,515 229,332 239,493
(a) Group
2016 Computer
software License Goodwill Total
Cost:
Balance, beginning of year 537,978 500,000 938,532 1,976,510
Additions 52,266 - - 52,266
Intangible assets written off (46,313) - - (46,313)
Balance, end of year 543,931 500,000 938,532 1,982,463
Amortization:
Balance, beginning of year 227,995 20,000 - 247,995
Amortisation charge 71,877 20,000 - 91,877
Accumulated amortization on intangible asset written off (46,312) - - (46,312)
Balance, end of year 253,560 40,000 - 293,560
Closing net book value 290,371 460,000 938,532 1,688,903
2015 Computer
software License Goodwill Total
Cost:
Balance, beginning of year 311,634 - 12,000 323,634
Additions 226,344 500,000 926,532 1,652,876
Balance, end of year 537,978 500,000 938,532 1,976,510
Amortization:
Balance, beginning of year 180,898 - - 180,898
Amortisation charge 47,097 20,000 - 67,097
Balance, end of year 227,995 20,000 - 247,995
Closing net book value 309,983 480,000 938,532 1,728,515
Parent Parent Parent
Dec-2016 Dec-2015
Cost:
Balance, beginning of year 441,237 253,496
Additions 44,300 187,741
Intangible assets written off (46,313) -
Balance, end of year 439,224 441,237
Amortization:
Balance, beginning of year 201,743 173,448
Amortisation charge 54,461 28,295
Accumulated amortization on intangible asset written off (46,312) -
Balance, end of year 209,892 201,743
Closing net book value 229,332 239,494
(b)
(c) Analysis of Goodwill allocation to CGUs
Entity/CGU Goodwill Net assets
Total
carrying
amount Discount rate
Terminal
growth rate
Recoverable
amount
Excess of
recoverable
amount over
carrying
amount
AXA Mansard Pensions Limited 200,000 1,694,843 1,894,843 20.30% 10.84% 2,073,504 178,661
AXA Mansard Insurance Plc- Life business 726,531 2,735,915 3,462,446 20.30% 6.4% 9,993,056 6,530,610
AXA Mansard Health Limited 12,000 998,034 1,010,034 23.26% 10.64% 13,299,283 12,289,249
938,531 5,428,792 6,367,323 25,365,843 18,998,520
The licence fee represents the value of identifiable license at the acquisition of AXA Mansard Pensions Ltd at the aquisition date in 2015 with a useful life of 25 years. The
amount has been recognised at cost less accumulated amortisation. This has also been tested for impairment and no impairment indicator was found.
107

AXA Mansard Insurance plc and Subsidiary Companies
Notes to the financial statements
For the year ended 31 December 2016
(All amounts in thousands of Naira unless otherwise stated)
(i) AXA Mansard Health Limited
Significant estimates
The recoverable amount of this CGU would equal its carrying amount if the key assumptions were to change as follows:
From To % change
Impact on
recoverable
Cost of equity 20.30% 19.28% -5% 2,281,640
Terminal growth rate 10.6% 10.11% -5% 698,689
(ii) AXA Mansard Pensions Limited
Allocation of Goodwill to cash generating units
The identified goodwill has been allocated to the different Cash Generating Units (CGUs) within the group as follows:
Cash Generating Units N'000
AXA Mansard Pensions Limited 200,000
AXA Mansard Insurance Plc- Life Business 726,531
Goodwill 926,531
Assumptions Approach used in determining values
Cost of equity
Long term growth
Annual impairment testing of goodwill
Goodwill was assessed for impairment at the reporting date and no impairment trigger was identified.
The following table sets out the key assumptions, long term key growth rate and discount rate used in the value calculation for all CGUs.
Dec-2016 Dec-2015
Cost of equity 20.30% 22.09%
Terminal growth rate 10.84% 5.00%
Significant estimates - AXA Mansard Pensions Limited
The recoverable amount of this CGU would equal its carrying amount if the key assumptions were to change as follows:
2016 From To % change
Impact on
recoverable
amount (N'000)
Cost of equity 20.30% 19.28% -5% 265,500
Terminal growth rate 10.8% 10.30% -5% (90,829)
Significant estimates - AXA Mansard Insurance Plc- Life business
The recoverable amount of this CGU would equal its carrying amount if the key assumptions were to change as follows:
2016 From To % change
Impact on
recoverable
amount (N'000)
Cost of equity 20.30% 19.28% -5% 714,420
Terminal growth rate 6.4% 6.08% -5% (165,519)
Management believes that any reasonably possible change in the key assumptions on which the Life business's recoverable amount is based would not cause its carrying amount to
exceed its recoverable amount
On 1 May 2013, AXA Mansard Insurance plc acquired 99.9% of the share capital of AXA Mansard Health Limited for N12 million. The principal activity of AXA Mansard
Health Limited is the provision of health care services through health care providers and for that purpose is accredited with the National Health Insurance Scheme.
As a result of this acquisition, the Group has access to the local health insurance market thereby growing the Group's insurance network. The goodwill of N12m arising represents
the fair value of the consideration transferred as AXA Mansard Health Limited had a zero carrying value of its net assets at acquisition date. Cash was paid as consideration and
there was no contingent consideration. None of the goodwill recognised is expected to be deductible for income tax purposes.
On 1 January 2015, AXA Mansard Insurance Plc acquired 60% of the share capital of AXA Mansard Pensions Limited (formerly Penman Pensions) Limited. The Company’s
principal activity is the administration and management of Pension Fund Assets in line with the provisions of the Pension Reform Act 2014 and the relevant National Pension
Commission circulars. Cash was paid as consideration and there was no contingent consideration. None of the goodwill recognised is expected to be deductible for income tax
purposes.
2016
Management believes that any reasonably possible change in the key assumptions on which the Health business's recoverable amount is based would not cause its carrying amount
to exceed its recoverable amount.
AXA Mansard Pensions Limited and AXA Mansard Insurance plc - Life business CGUs generate revenues through their life assurance and asset management businesses. The
value-in-use calculations for the life assurance operations are determined using the discounted cash flow calculation. The cash flows attributable to the value of the CGUs are
determined with reference to latest approved five-year cashflow forecasts. Projections beyond the plan period are extrapolated using an inflation based growth assumption.
The value-in-use calculations for the asset management operations are similarly determined based on discounted cash flow models derived from the latest approved five-year
cashflow forecast. An additional two years of projections beyond the plan period are extrapolated using inflation based growth rates. The cash flows are discounted at economic
profit rates applicable to each individual CGU. The key assumptions used in the value-in-use calculations for the AXA Mansard Pensions Limited and AXA Mansard Insurance
Plc - Life business CGUs are as follows:
The goodwill recognised represents the price paid above the 60% of the fair value of the identifiable net assets of AXA Mansard Pensions Limited at the acquisition date, 1
January 2015. The acquisition of AXA Mansard Pensions Limited is strategic to the AXA Mansard Group in terms of a number of synergies including customer-base synergies,
cost synergies and contributing to the Group's goal of becoming Africa's number 1 One- stop financial service provider.
In accordance with the requirements of IAS 36 ‘Impairment of Assets’, goodwill is tested annually for impairment for each CGU, by comparing the carrying amount of each CGU
to its recoverable amount, being the higher of that CGU’s value-in-use or fair value less costs to sell. An impairment charge is recognised when the recoverable amount is less than
the carrying value.
Management believes that any reasonably possible change in the key assumptions on which the pension business' s recoverable amount is based would not cause its carrying
amount to exceed its recoverable amount
Based on risk free rate, market premium and beta
This is the weighted average growth rate used to extrapolate cash flows beyond the
budget period and it is based on the estimated growth rate for Nigeria.
108

AXA Mansard Insurance plc and Subsidiary Companies
Notes to the financial statementsFor the year ended 31 December 2016
(All amounts in thousands of Naira unless otherwise stated)
18 Property and equipment
(a) Group
Land Building Motor vehicle
Computer
equipment
Office
equipment
Furniture and
fittings Work in progress Total
Cost
Balance, 1 January 2016 389,664 477,875 727,862 525,210 388,392 864,379 - 3,373,382
Additions - - 30,694 55,793 52,188 50,592 13,693 202,959
Disposals - - (30,508) (2,491) (65) (1,606) - (34,669)
Balance, end of year 389,664 477,875 728,048 578,512 440,515 913,365 13,693 3,541,672
Accumulated depreciation
Balance, 1 January 2016 - 39,661 382,602 359,091 186,335 472,870 - 1,440,559
Charge for the year - 9,558 109,672 92,150 70,105 129,857 - 411,342
Disposals - - (23,083) (38) (65) (1,062) - (24,248)
Balance, end of year - 49,219 469,191 451,203 256,375 601,665 - 1,827,653
Net book value
Balance, 1 January 2016 389,664 438,214 345,260 166,119 202,057 391,509 - 1,932,823
At 31 December 2016 389,664 428,656 258,857 127,309 184,140 311,700 13,693 1,714,019
Parent
Land Building Motor vehicle
Computer
equipment
Office
equipment
Furniture and
fittings Work in progress Total
Cost
Balance, 1 January 2016 389,664 477,875 582,037 462,481 253,019 677,683 - 2,842,759
Additions - - 26,514 47,128 46,798 54,581 13,693 188,713
Disposals - - (26,008) (2,432) (65) (1,126) - (29,630)
Balance, end of year 389,664 477,875 582,543 507,177 299,752 731,138 13,693 3,001,842
Accumulated depreciation
Balance, 1 January 2016 - 39,659 315,422 334,493 158,995 418,721 - 1,267,290
Charge for the year - 9,558 87,942 71,607 42,403 105,035 - 316,545
Disposals - - (23,083) - (65) (1,062) - (24,210)
Balance, end of year - 49,217 380,282 406,100 201,334 522,693 - 1,559,625
Net book value
Balance, 1 January 2016 389,664 438,216 266,615 127,988 94,024 258,962 - 1,575,469
At 31 December 2016 389,664 428,658 202,261 101,077 98,418 208,445 13,693 1,442,216
109

AXA Mansard Insurance plc and Subsidiary Companies
Notes to the financial statementsFor the year ended 31 December 2016
(All amounts in thousands of Naira unless otherwise stated)
18 Property and equipment
(b) Group
Land Building Motor vehicle
Computer
equipment
Office
equipment
Furniture and
fittings Total
Cost
Balance, 1 January 2015 389,664 477,875 574,991 397,048 325,360 754,063 2,919,001
Acquired assets (Pensions) - - 49,433 139,528 7,559 42,477 238,997
Additions - - 185,065 124,886 62,711 102,982 475,644
Disposals - - (81,627) (136,252) (7,238) (35,143) (260,260)
Balance, end of year 389,664 477,875 727,862 525,210 388,392 864,379 3,373,382
Accumulated depreciation
Balance, 1 January 2015 - 30,103 280,241 280,412 125,436 322,417 1,038,609
Acquired assets (Pensions) - - 33,150 136,828 4,389 30,673 205,040
Charge for the year - 9,558 143,797 78,103 63,748 152,025 447,231
Disposals - - (74,586) (136,252) (7,238) (32,245) (250,321)
Balance, end of year - 39,661 382,602 359,091 186,335 472,870 1,440,559
Net book value
As at 31 December 2014 389,664 447,772 294,750 116,636 199,924 431,646 1,880,392
At 31 December 2015 389,664 438,214 345,260 166,119 202,057 391,509 1,932,823
Parent
Land Building Motor vehicle
Computer
equipment
Office
equipment
Furniture and
fittings Total
Cost
Balance, 1 January 2015 389,664 477,875 515,864 377,548 237,282 637,433 2,635,666
Additions - - 118,850 87,365 15,737 44,316 266,268
Disposals - - (52,677) (2,432) - (4,066) (59,175)
Balance, end of year 389,664 477,875 582,037 462,481 253,019 677,683 2,842,759
Accumulated depreciation
Balance, 1 January 2015 - 30,101 259,638 272,241 115,518 298,312 975,810
Charge for the year - 9,558 102,733 64,609 43,477 121,912 342,289
Disposals - - (46,949) (2,357) - (1,503) (50,809)
Balance, end of year - 39,659 315,422 334,493 158,995 418,721 1,267,290
Net book value
As at 31 December 2014 389,664 447,774 256,226 105,307 121,764 339,121 1,659,856
At 31 December 2015 389,664 438,216 266,615 127,988 94,024 258,962 1,575,469
110

AXA Mansard Insurance plc and Subsidiary Companies
Notes to the financial statements
For the year ended 31 December 2016
(All amounts in thousands of Naira unless otherwise stated)
19 Statutory deposit
20 Insurance liabilities
Group Group Parent Parent
Dec-2016 Dec -2015 Dec-2016 Dec -2015
– Outstanding claims (see note 20.1a) 3,066,314 2,059,584 3,065,044 2,026,109
– Claims incurred but not reported (see note 20.1b) 2,603,942 2,195,412 2,305,849 2,126,761
– Unearned premium (see note 20.2) 6,465,227 6,428,680 5,365,212 5,907,871
– Individual life reserve (see note 20.3) 531,269 368,431 531,269 368,431
– Annuity reserves (see note 20.4) 1,766,570 1,864,668 1,766,570 1,864,668
Total insurance liabilities, gross 14,433,322 12,916,775 13,033,944 12,293,840
Reinsurance receivables
Reinsurers’ share of outstanding claims 1,613,557 778,901 1,600,088 767,397
Recoverables from reinsurers on claims paid 1,148,745 177,044 1,148,745 177,044
Reinsurance share of individual life reserves 18,131 37,287 18,131 37,287
Reinsurance share of Incurred But Not Reported (IBNR) claims 788,686 625,724 788,686 625,724
Total reinsurers’ share of insurance liabilities (see note 11) 3,569,119 1,618,956 3,555,650 1,607,452
Net insurance liability 10,864,203 11,297,819 9,478,294 10,686,388
Current 9,730,931 8,279,124 8,331,553 7,656,189
Non-current 4,702,391 4,637,651 4,702,391 4,637,651
This represents amounts deposited with the Central Bank of Nigeria (CBN) pursuant to Section 10(3) of the Insurance Act, 2003. This amount is
not available for the day-to-day use in the working capital of the Company and so it is excluded from the cash and cash equivalents. Interest
earned on statutory deposits are included in interest income.
111

AXA Mansard Insurance plc and Subsidiary Companies
Notes to the financial statementsFor the year ended 31 December 2016
(All amounts in thousands of Naira unless otherwise stated)
20.1 – Outstanding claims
Group Group Parent Parent
Dec-2016 Dec -2015 Dec-2016 Dec -2015
Non-Life 2,664,626 1,438,873 2,664,626 1,438,873
Group life 400,418 587,236 400,418 587,236
Health 1,270 33,475 - -
3,066,314 2,059,584 3,065,044 2,026,109
Group Group Parent Parent
Dec-2016 Dec -2015 Dec-2016 Dec -2015
Balance, beginning of year 2,059,584 1,235,071 2,026,109 1,219,049
Additional claims expense during the year 8,954,937 6,775,402 6,884,603 5,933,563
Claims paid during year (8,282,150) (5,929,503) (6,179,612) (5,105,116)
Foreign exchange impact of dollar denominated claims 355,077 - 355,077 -
Claims reclassified to other creditors- Group life endowment fund (21,133) (21,387) (21,133) (21,387)
Balance, end of year 3,066,314 2,059,584 3,065,044 2,026,109
The aging analysis of the outstanding claims for the non life business is as follows:
Outstanding claims per claimant 0 - 90 days 91 - 180 days 181 - 360 days 360 days + Total
1 - 250,000 25,654 14,971 22,357 96,476 159,458
250,001- 500,000 19,705 6,885 10,393 38,599 75,582
500,001 - 1,500,000 50,218 28,858 23,879 114,416 217,370
1,500,001 - 2,500,000 33,789 16,053 16,803 81,385 148,030
2,500,001 - 5,000,000 44,871 9,923 29,657 90,966 175,418
5,000,001 - Above 228,282 746,588 655,143 258,756 1,888,768
Total 402,519 823,278 758,232 680,598 2,664,626
The aging analysis of the outstanding claims for the life business is as follows:
Outstanding claims per claimant 0 - 90 days 91 - 180 days 181 - 360 days 360 days + Total
1 - 250,000 1,874 514 764 11,344 14,496
250,001- 500,000 2,890 464 4,996 14,727 23,077
500,001 - 1,500,000 21,869 7,555 18,126 39,474 87,024
1,500,001 - 2,500,000 18,752 8,467 8,841 21,715 57,775
2,500,001 - 5,000,000 11,748 - 18,903 18,589 49,240
5,000,001 - Above 46,340 34,184 9,995 78,287 168,806
Total 103,473 51,184 61,625 184,136 400,418
– Claims incurred but not reported
Group Group Parent Parent
Dec-2016 Dec -2015 Dec-2016 Dec -2015
Non life business 1,322,443 1,478,507 1,322,443 1,478,507
Group life 983,405 648,254 983,405 648,254
Health 298,094 68,651 - -
2,603,942 2,195,412 2,305,848 2,126,761
IBNR, beginning of the year 2,195,412 1,719,404 2,126,761 1,707,208
Increase in IBNR 408,530 476,008 179,087 419,553
Balance, end of year 2,603,942 2,195,412 2,305,848 2,126,761
20.2 Unearned premium
Group Group Parent Parent
Dec-2016 Dec -2015 Dec-2016 Dec -2015
Non life business 4,871,518 5,279,889 4,871,518 5,279,889
Group life 493,694 627,982 493,694 627,982
Health 1,100,015 520,809 - -
6,465,227 6,428,680 5,365,212 5,907,871
Current 4,060,675 4,024,128 2,960,660 3,503,319
Non-current 2,404,552 2,404,552 2,404,552 2,404,552
112

AXA Mansard Insurance plc and Subsidiary Companies
Notes to the financial statementsFor the year ended 31 December 2016
(All amounts in thousands of Naira unless otherwise stated)
The movement in unearned premium during the year is as follows: Group Group Parent Parent
Dec-2016 Dec -2015 Dec-2016 Dec -2015
Balance, beginning of year 6,428,680 6,745,307 5,907,871 6,515,162
Movement during the year 36,547 (316,627) (542,659) (607,291)
Balance, end of year 6,465,227 6,428,680 5,365,212 5,907,871
20.3 Individual life reserves can be analysed as follows: Group Group Parent Parent
Dec-2016 Dec -2015 Dec-2016 Dec -2015
Individual life 531,269 368,431 531,269 368,431
531,269 368,431 531,269 368,431
Movement in individual life reserves: Group Group Parent Parent
Dec-2016 Dec -2015 Dec-2016 Dec -2015
Balance, beginning of year 368,431 465,923 368,431 465,923
Changes in individual life reserves 162,838 (97,492) 162,838 (97,492)
Balance, end of year 531,269 368,431 531,269 368,431
20.4 Annuity reserves can be analysed as follows: Group Group Parent Parent
Dec-2016 Dec -2015 Dec-2016 Dec -2015
Annuity 1,766,570 1,864,668 1,766,570 1,864,668
1,766,570 1,864,668 1,766,570 1,864,668
Movement in Annuity reserves: Group Group Parent Parent
Dec-2016 Dec -2015 Dec-2016 Dec -2015
Balance, beginning of year 1,864,668 1,127,293 1,864,668 1,127,293
Changes in annuity reserves (98,098) 737,375 (98,098) 737,375
Balance, end of year 1,766,570 1,864,668 1,766,570 1,864,668
21 Investment contract liabilities
Group Group Parent Parent
Dec-2016 Dec -2015 Dec-2016 Dec -2015
Guaranteed investment 2,734,268 2,656,066 2,734,268 2,656,066
Investment contract designated at fair value 2,916,273 7,657,492 2,916,719 4,130,895
5,650,541 10,313,558 5,650,987 6,786,961
The movement in deposit administration during the year can be divided into interest-linked and unitized fund. The movements in these two categories
of investment contract liabilities during the year are as follows:
Movements in amounts payable under investment contracts liabilities during the year are as shown below. The liabilities are shown inclusive of
interest accumulated to 31 December 2016. The movement in interest-linked funds during the year was as follows:
113
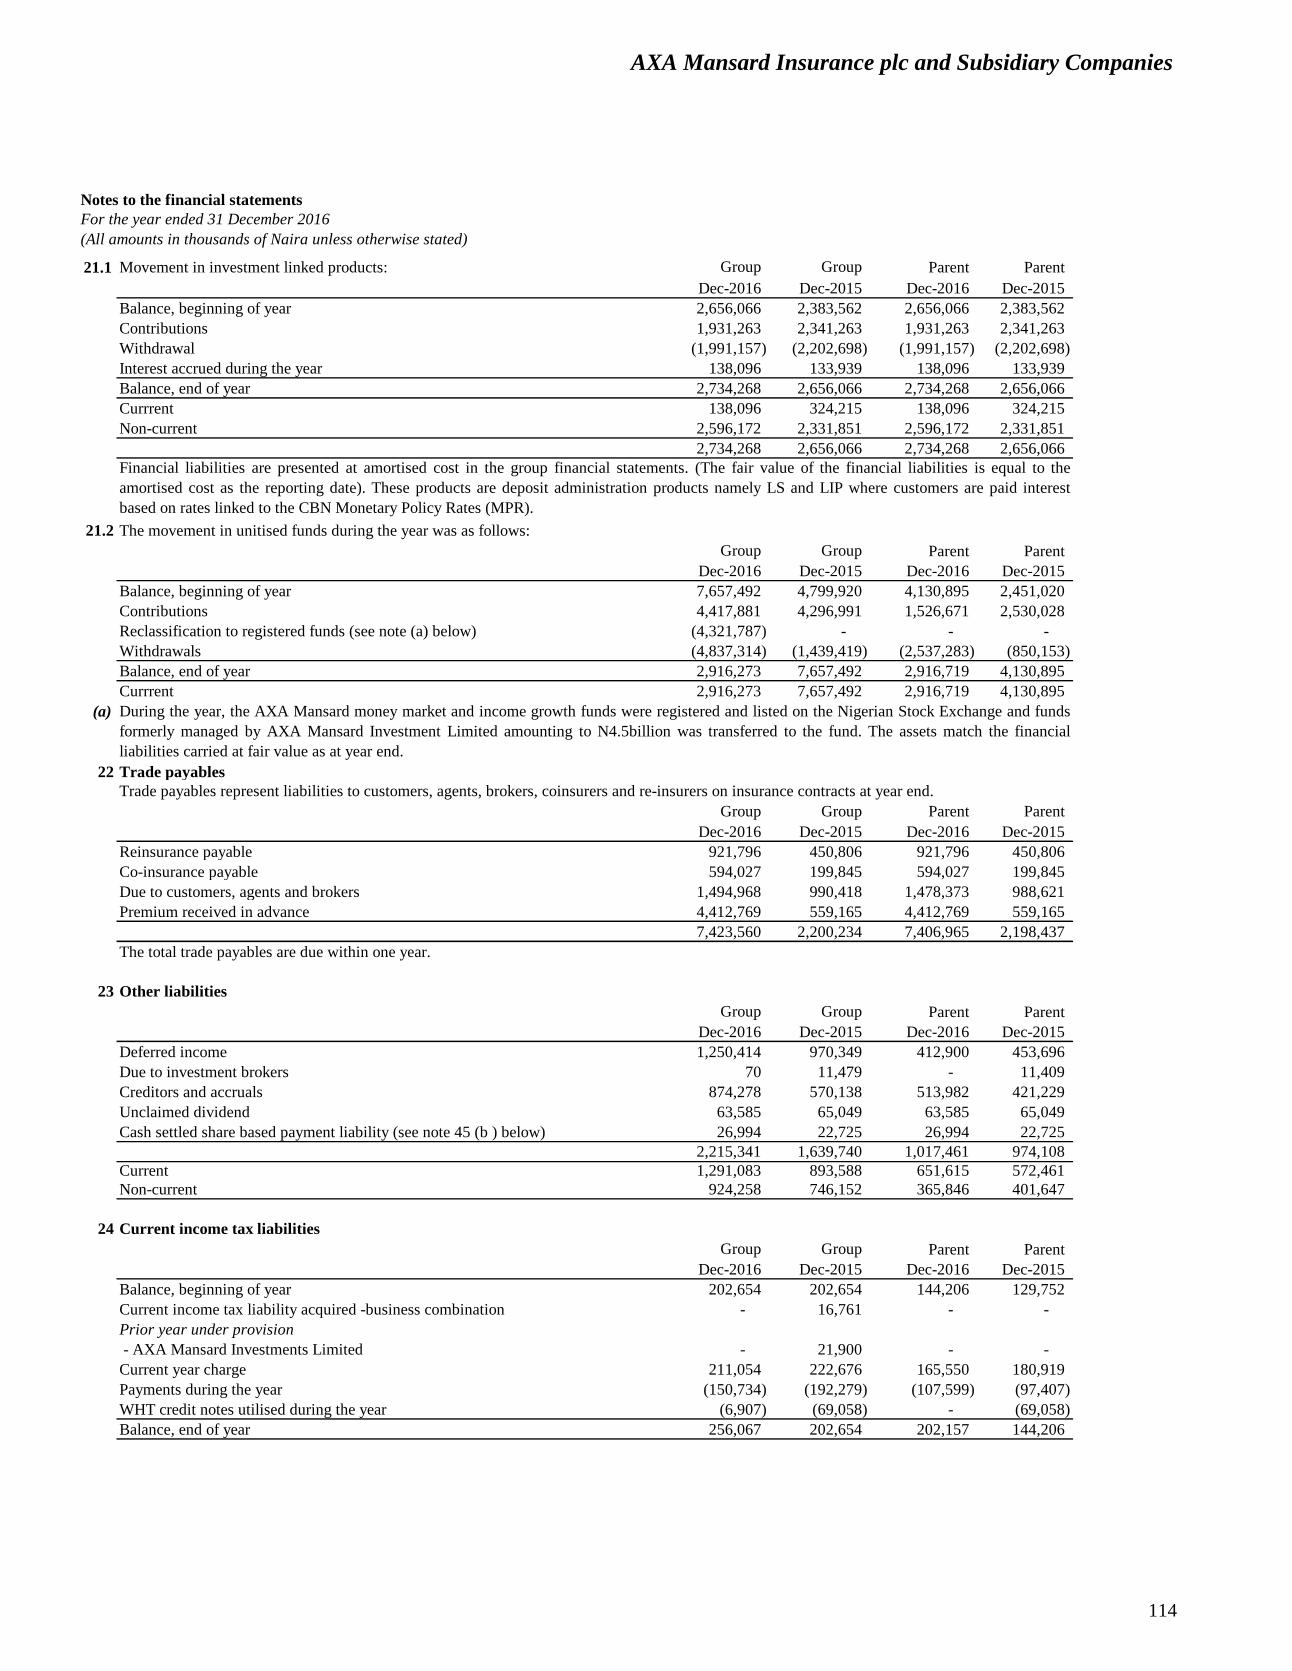
AXA Mansard Insurance plc and Subsidiary Companies
Notes to the financial statements
For the year ended 31 December 2016
(All amounts in thousands of Naira unless otherwise stated)
21.1 Movement in investment linked products: Group Group Parent Parent
Dec-2016 Dec-2015 Dec-2016 Dec-2015
Balance, beginning of year 2,656,066 2,383,562 2,656,066 2,383,562
Contributions 1,931,263 2,341,263 1,931,263 2,341,263
Withdrawal (1,991,157) (2,202,698) (1,991,157) (2,202,698)
Interest accrued during the year 138,096 133,939 138,096 133,939
Balance, end of year 2,734,268 2,656,066 2,734,268 2,656,066
Currrent 138,096 324,215 138,096 324,215
Non-current 2,596,172 2,331,851 2,596,172 2,331,851
2,734,268 2,656,066 2,734,268 2,656,066
21.2 The movement in unitised funds during the year was as follows:
Group Group Parent Parent
Dec-2016 Dec-2015 Dec-2016 Dec-2015
Balance, beginning of year 7,657,492 4,799,920 4,130,895 2,451,020
Contributions 4,417,881 4,296,991 1,526,671 2,530,028
Reclassification to registered funds (see note (a) below) (4,321,787) - - -
Withdrawals (4,837,314) (1,439,419) (2,537,283) (850,153)
Balance, end of year 2,916,273 7,657,492 2,916,719 4,130,895
Currrent 2,916,273 7,657,492 2,916,719 4,130,895
(a)
22 Trade payables
Group Group Parent Parent
Dec-2016 Dec-2015 Dec-2016 Dec-2015
Reinsurance payable 921,796 450,806 921,796 450,806
Co-insurance payable 594,027 199,845 594,027 199,845
Due to customers, agents and brokers 1,494,968 990,418 1,478,373 988,621
Premium received in advance 4,412,769 559,165 4,412,769 559,165
7,423,560 2,200,234 7,406,965 2,198,437
The total trade payables are due within one year.
23 Other liabilities
Group Group Parent Parent
Dec-2016 Dec-2015 Dec-2016 Dec-2015
Deferred income 1,250,414 970,349 412,900 453,696
Due to investment brokers 70 11,479 - 11,409
Creditors and accruals 874,278 570,138 513,982 421,229
Unclaimed dividend 63,585 65,049 63,585 65,049
Cash settled share based payment liability (see note 45 (b ) below) 26,994 22,725 26,994 22,725
2,215,341 1,639,740 1,017,461 974,108
Current 1,291,083 893,588 651,615 572,461
Non-current 924,258 746,152 365,846 401,647
24 Current income tax liabilities
Group Group Parent Parent
Dec-2016 Dec-2015 Dec-2016 Dec-2015
Balance, beginning of year 202,654 202,654 144,206 129,752
Current income tax liability acquired -business combination - 16,761 - -
Prior year under provision
- AXA Mansard Investments Limited - 21,900 - -
Current year charge 211,054 222,676 165,550 180,919
Payments during the year (150,734) (192,279) (107,599) (97,407)
WHT credit notes utilised during the year (6,907) (69,058) - (69,058)
Balance, end of year 256,067 202,654 202,157 144,206
Financial liabilities are presented at amortised cost in the group financial statements. (The fair value of the financial liabilities is equal to the
amortised cost as the reporting date). These products are deposit administration products namely LS and LIP where customers are paid interest
based on rates linked to the CBN Monetary Policy Rates (MPR).
Trade payables represent liabilities to customers, agents, brokers, coinsurers and re-insurers on insurance contracts at year end.
During the year, the AXA Mansard money market and income growth funds were registered and listed on the Nigerian Stock Exchange and funds
formerly managed by AXA Mansard Investment Limited amounting to N4.5billion was transferred to the fund. The assets match the financial
liabilities carried at fair value as at year end.
114

AXA Mansard Insurance plc and Subsidiary Companies
Notes to the financial statements
For the year ended 31 December 2016
(All amounts in thousands of Naira unless otherwise stated)
25 Borrowings
Group Group Parent Parent
Dec-2016 Dec-2015 Dec-2016 Dec-2015
Bank borrowings (see note (a) below) 3,506,545 3,351,463 - -
Loan note (see note (b) below) 719,266 676,767 - -
Total borrowings 4,225,811 4,028,230 - -
Current portion 1,269,301 1,269,301 - -
Non-current portion 2,956,510 2,758,929 - -
(a) Bank borrowings
(i)
(ii)
(b) Loan note
(c)
Group Group Parent Parent
Dec-2016 Dec-2015 Dec-2016 Dec-2015
Balance, beginning of the year 4,028,230 4,578,268 - -
Impact of foreign exchange rate changes 1,349,890 238,757 - -
Accrued interest 444,224 415,996 - -
Payments during the year (1,596,533) (1,204,791) - -
4,225,811 4,028,230 - -
26 Deferred income tax
(a) Liabilities
Group Group Parent Parent
Dec-2016 Dec-2015 Dec-2016 Dec-2015
Balance, beginning of year 286,941 279,106 125,362 120,330
Charge in income statement for the year 279,577 116,896 57,858 42,215
Tax charge /(reversals) relating to components of other comprehensive
income 1,011 (109,061) - (37,183)
Balance, end of year 567,529 286,941 183,220 125,362
Deferred income tax liability/(assets) is attributable to the following:
Property and equipment 130,473 70,110 131,293 73,435
Unrealised gain on foreign currency translation (387,285) 16,922 51,927 51,927
Fair value gain on investment property 843,495 219,782 - -
Unrelieved tax losses (19,154) (19,873) - -
Balance, end of year 567,529 286,941 183,220 125,362
2016
Group
Movement in deferred tax liability/ (assets):
Opening
Balance
Income
statement
Other
Comprehensive
Income
Closing
balance
Property and equipment 70,110 60,363 - 130,473
Unrealised gain/(losses) on foreign currency translation 16,922 (405,218) 1,011 (387,285)
Fair value gains on Investment property 219,782 623,713 - 843,495
Unrelieved tax losses (19,873) 719 - (19,154)
286,941 279,577 1,011 567,529
Parent
Movement in deferred tax liability:
Opening
Balance
Income
statement
Other
Comprehensive
Income
Closing
balance
Property and equipment 73,435 57,858 - 131,293
Unrealised gain on foreign currency translation 51,927 - - 51,927
125,362 57,858 - 183,220
Loan note represents N736,428,820 (2015: N676,767,293) unsecured facility granted to APD by Karsang Limited payable in 7 years commencing
October 2014. Interest is accrued at an effective interest rate of 10.41% and the loan is payable at maturity.
Bank borrowings are made up of two dollar denominated loans.
The movement in borrowing during the year is as follows:
Balance of USD 5,800,044 (2015: USD 8,705,709) represents facility granted to APD limited by GTBank Plc payable in 5 years commencing 30
June 2013. The principal and Interest is accrued and payable quarterly at an average rate of 90 days LIBOR less a spread of 200 basis point subject
to a floor annual rate of 10% resulting in an effective interest rate of 10%. An equitable mortgage on the Company's investment property (office
building) was used to secure the borrowing.
The second loan represents a USD6,024,693 (2015: USD8,037,234) facility granted to APD limited by GTBank Plc payable in 5 years commencing
from 23 September 2014. Interest is payable quarterly at an average rate of 90 days LIBOR less a spread of 200 basis point subject to a floor annual
rate of 10% resulting to an effective interest rate of 9.99%.
115

AXA Mansard Insurance plc and Subsidiary Companies
Notes to the financial statements
For the year ended 31 December 2016
(All amounts in thousands of Naira unless otherwise stated)
(b) Unrecognised deferred tax assets
Group Group Parent Parent
In thousands of Naira Dec-2016 Dec-2015 Dec-2016 Dec-2015
Property and equipment 25,251 26,932 25,251 26,932
Tax losses 1,664,665 1,202,557 1,664,665 1,202,557
Balance, end of year 1,689,916 1,229,489 1,689,916 1,229,489
27 Share capital:
27.1 Share capital comprises:
Group Group Parent Parent
Dec-2016 Dec-2015 Dec-2016 Dec-2015
(a) Authorized:
10,500,000,000 Ordinary shares of 50k each (Dec 2015:
10,500,000,000 ordinary shares) 5,250,000 5,250,000 5,250,000 5,250,000
(b) Issued and fully paid
10,500,000,000 Ordinary shares of 50k each 5,250,000 5,250,000 5,250,000 5,250,000
Movement in issued and fully paid shares
Group Group Parent Parent
Dec-2016 Dec-2015 Dec-2016 Dec-2015
Balance, beginning of period 5,250,000 5,250,000 5,250,000 5,250,000
Additional shares during the period - - - -
Balance, end of year 5,250,000 5,250,000 5,250,000 5,250,000
(i) Non-Life Business
Share capital comprises:
Group Group Parent Parent
Dec-2016 Dec-2015 Dec-2016 Dec-2015
8,500,000,000 Ordinary shares of 50k each 4,250,000 4,250,000 4,250,000 4,250,000
(ii) Life Business
Group Group Parent Parent
Dec-2016 Dec-2015 Dec-2016 Dec-2015
2,000,000,000 Ordinary shares of 50k each 1,000,000 1,000,000 1,000,000 1,000,000
27.2 Share premium
Share premium comprises additional paid-in capital in excess of the par value. This reserve is not ordinarily available for distribution.
Deferred tax assets relating to the Company's life business have not been recognised in respect of the following items:
116

AXA Mansard Insurance plc and Subsidiary Companies
Notes to the financial statements
For the year ended 31 December 2016
(All amounts in thousands of Naira unless otherwise stated)
27.3 Contingency reserves
The movement in this account during the year is as follows:
Group Group Parent Parent
Dec-2016 Dec-2015 Dec-2016 Dec-2015
Balance, beginning of the year 2,722,013 2,344,504 2,722,013 2,344,504
Transfer from retained earnings 451,887 377,509 451,887 377,509
Balance, end of year 3,173,900 2,722,013 3,173,900 2,722,013
Analysis per business segment
Group Group Parent Parent
Dec-2016 Dec-2015 Dec-2016 Dec-2015
Non-life business 2,822,252 2,405,692 2,822,252 2,405,692
Life business 351,648 316,321 351,648 316,321
Balance, end of year 3,173,900 2,722,013 3,173,900 2,722,013
(i) Non-Life Business
Group Group Parent Parent
Dec-2016 Dec-2015 Dec-2016 Dec-2015
Balance, beginning of year 2,405,692 2,064,569 2,405,692 2,064,569
Transfer from retained earnings 416,560 341,123 416,560 341,123
Balance, end of year 2,822,252 2,405,692 2,822,252 2,405,692
(ii) Life Business
Group Group Parent Parent
Dec-2016 Dec-2015 Dec-2016 Dec-2015
Balance, beginning of year 316,321 279,935 316,321 279,935
Transfer from retained earnings 35,327 36,386 35,327 36,386
Balance, end of year 351,648 316,321 351,648 316,321
27.4 Other reserves
Other reserves comprise of the following: Group Group Parent Parent
Dec-2016 Dec-2015 Dec-2016 Dec-2015
Capital reserves (see note (a) below) 2,500,000 2,500,000 2,500,000 2,500,000
Statutory reserves (see note (b) below) 18,667 14,629 - -
Share-based payment reserves (see note (c) below) 93,900 32,978 93,900 32,978
2,612,567 2,547,607 2,593,900 2,532,978
(a) Capital reserve
Group Group Parent Parent
Dec-2016 Dec-2015 Dec-2016 Dec-2015
Life business segment 1,000,000 1,000,000 1,000,000 1,000,000
Non-life business segment 1,500,000 1,500,000 1,500,000 1,500,000
2,500,000 2,500,000 2,500,000 2,500,000
(b) Statutory reserve
In compliance with Section 21 (1) of Insurance Act 2003, the contingency reserve for non-life insurance business is credited with the greater of 3%
of total premiums, or 20% of the profits. This shall accumulate until it reaches an amount equal to the greater of minimum paid-up capital or 50
percent of net premium. While for life business, the contingency reserves is credited with an amount equal to 1% of gross premium or 10% of net
profit (whichever is greater) and accumulated until it reached the amount of minimum paid up capital.
The Company's issued and fully paid capital was reconstructed by a special resolution at its Board meeting on 18th October, 2007, to achieve a
reduction of 50% with the result that the issued and fully paid capital will stand at N2,500,000,000 divided into 5,000,000,000 Ordinary shares at
50k each with the surplus nominal value arising from the reconstruction being transferred to the Company's capital reserve account. The
reconstruction was sanctioned by the Federal High Court of Nigeria, Lagos on 31st October 2007 and registered by the Corporate Affairs
Commission on 18th December 2007. The balance on the capital reserve was allocated between the non-life business and life business segments in
the proportion of their share capital, as follows:
In compliance with the Pensions Act (2014), AXA Mansard Pensions Ltd is required to reserve 12.5% of its profit after tax. This represents the
accumulation of the provision for all statutory reserves from 2011.
117
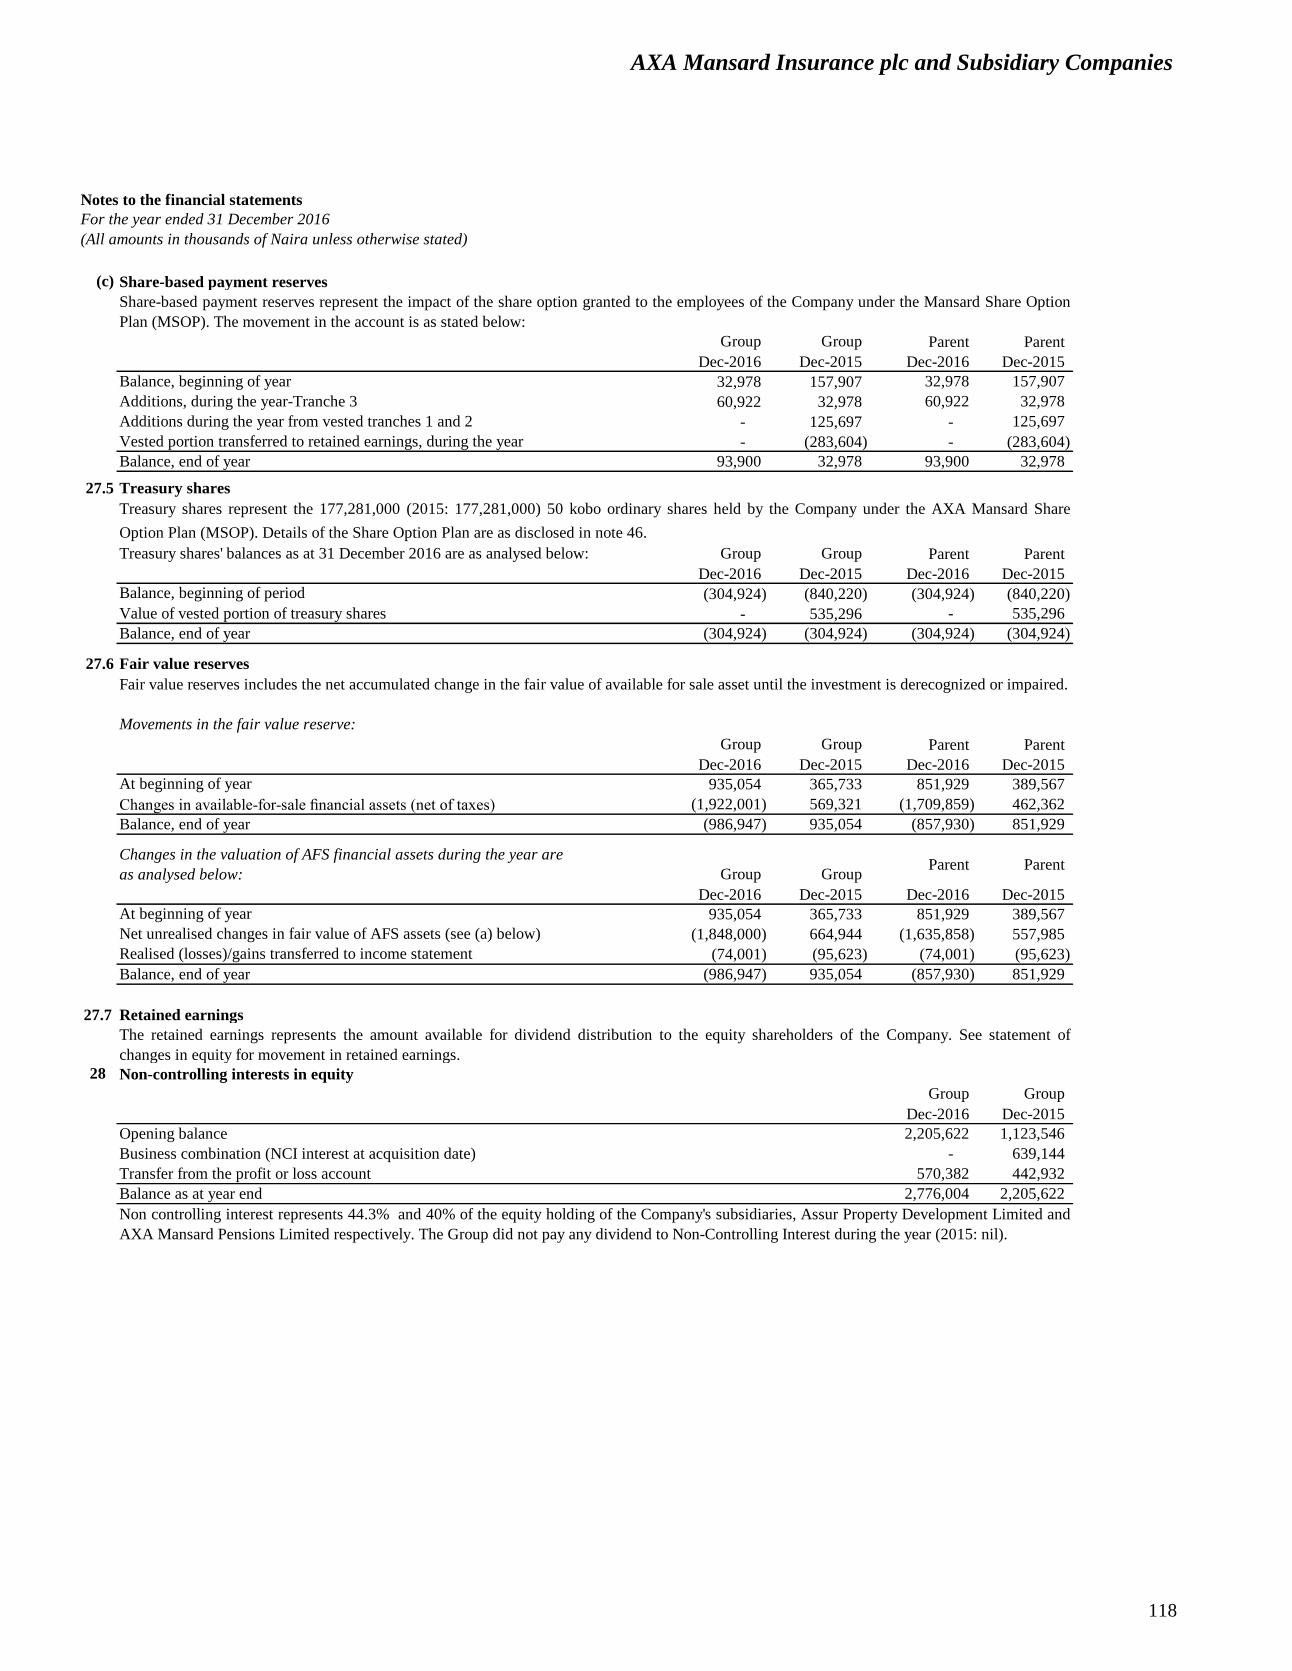
AXA Mansard Insurance plc and Subsidiary Companies
Notes to the financial statements
For the year ended 31 December 2016
(All amounts in thousands of Naira unless otherwise stated)
(c) Share-based payment reserves
Group Group Parent Parent
Dec-2016 Dec-2015 Dec-2016 Dec-2015
Balance, beginning of year 32,978 157,907 32,978 157,907
Additions, during the year-Tranche 3 60,922 32,978 60,922 32,978
Additions during the year from vested tranches 1 and 2 - 125,697 - 125,697
Vested portion transferred to retained earnings, during the year - (283,604) - (283,604)
Balance, end of year 93,900 32,978 93,900 32,978
27.5 Treasury shares
Treasury shares' balances as at 31 December 2016 are as analysed below: Group Group Parent Parent
Dec-2016 Dec-2015 Dec-2016 Dec-2015
Balance, beginning of period (304,924) (840,220) (304,924) (840,220)
Value of vested portion of treasury shares - 535,296 - 535,296
Balance, end of year (304,924) (304,924) (304,924) (304,924)
27.6 Fair value reserves
Movements in the fair value reserve:
Group Group Parent Parent
Dec-2016 Dec-2015 Dec-2016 Dec-2015
At beginning of year 935,054 365,733 851,929 389,567
Changes in available-for-sale financial assets (net of taxes) (1,922,001) 569,321 (1,709,859) 462,362
Balance, end of year (986,947) 935,054 (857,930) 851,929
Changes in the valuation of AFS financial assets during the year are
as analysed below: Group GroupParent Parent
Dec-2016 Dec-2015 Dec-2016 Dec-2015
At beginning of year 935,054 365,733 851,929 389,567
Net unrealised changes in fair value of AFS assets (see (a) below) (1,848,000) 664,944 (1,635,858) 557,985
Realised (losses)/gains transferred to income statement (74,001) (95,623) (74,001) (95,623)
Balance, end of year (986,947) 935,054 (857,930) 851,929
27.7 Retained earnings
28 Non-controlling interests in equity
Group Group
Dec-2016 Dec-2015
Opening balance 2,205,622 1,123,546
Business combination (NCI interest at acquisition date) - 639,144
Transfer from the profit or loss account 570,382 442,932
Balance as at year end 2,776,004 2,205,622
The retained earnings represents the amount available for dividend distribution to the equity shareholders of the Company. See statement of
changes in equity for movement in retained earnings.
Fair value reserves includes the net accumulated change in the fair value of available for sale asset until the investment is derecognized or impaired.
Non controlling interest represents 44.3% and 40% of the equity holding of the Company's subsidiaries, Assur Property Development Limited and
AXA Mansard Pensions Limited respectively. The Group did not pay any dividend to Non-Controlling Interest during the year (2015: nil).
Treasury shares represent the 177,281,000 (2015: 177,281,000) 50 kobo ordinary shares held by the Company under the AXA Mansard Share
Option Plan (MSOP). Details of the Share Option Plan are as disclosed in note 46.
Share-based payment reserves represent the impact of the share option granted to the employees of the Company under the Mansard Share Option
Plan (MSOP). The movement in the account is as stated below:
118

AXA Mansard Insurance plc and Subsidiary Companies
Notes to the financial statements
For the year ended 31 December 2016
(All amounts in thousands of Naira unless otherwise stated)
29 Contingencies and commitments
(a) Litigations and claims
(b) Operating leases
In thousands of Naira Dec-16 Dec-15
Less than one year 111,897 148,098
Between two and five years 82,321 36,397
30 Net premium income
Group Group Parent Parent
Dec-2016 Dec-2015 Dec-2016 Dec-2015
Gross premium written 20,713,129 16,574,614 17,330,219 15,009,324
Gross premium income
Non-life 13,885,348 11,370,756 13,885,348 11,370,756
Life (Group life and individual life) 3,156,186 3,071,866 3,156,186 3,071,866
Annuity 288,685 566,702 288,685 566,702
AXA Mansard Health (HMO) 3,382,911 1,565,290 - -
Provision for unearned premium
Non life 408,371 870,209 408,371 870,209
Group life 134,288 (262,918) 134,288 (262,918)
AXA Mansard Health (HMO) (579,205) (290,664) - -
Gross premium income 20,676,584 16,891,241 17,872,878 15,616,615
Re-insurance cost 9,385,675 6,440,038 9,300,026 6,400,436
-Non life 8,341,269 5,426,713 8,341,269 5,426,713
-Life 958,757 973,723 958,757 973,723
-AXA Mansard Health (HMO) 85,649 39,603 - -
Changes in prepaid re-insurance 341,771 546,268 366,865 552,078
-Non life 243,303 762,718 243,303 762,718
-Group life 104,406 (206,823) 104,406 (206,823)
-Individual life 19,156 (3,817) 19,156 (3,817)
-AXA Mansard Health (HMO) (25,094) (5,810) - -
Re-insurance expenses 9,727,446 6,986,307 9,666,891 6,952,514
Net premium income 10,949,138 9,904,934 8,205,987 8,664,101
31 Fee and commission income
Group Group Parent Parent
Dec-2016 Dec-2015 Dec-2016 Dec-2015
Policy administration services 995,557 984,844 995,557 984,844
32 Claims:
Claims expenses Group Group Parent Parent
Dec-2016 Dec-2015 Dec-2016 Dec-2015
Claims paid during the year (see note (a) below) 8,282,150 5,929,503 6,179,612 5,105,116
Movement in outstanding claims 672,786 845,900 704,990 828,447
Claims incurred 8,954,936 6,775,403 6,884,602 5,933,563
Outstanding claims- IBNR 408,530 476,008 179,087 419,553
Total claims and loss adjustment expense 9,363,466 7,251,411 7,063,689 6,353,116
Recoverable on IBNR (162,961) (151,831) (162,961) (151,831)
RI share of insurance liabilities (601,808) (1,168,257) (599,842) (1,168,257)
Recovered from re-insurers (1,782,796) (509,084) (1,776,733) (497,580)
Total claims expenses recovered from reinsurers (2,547,565) (1,829,172) (2,539,536) (1,817,668)
Net claims and loss adjustment expense 6,815,901 5,422,239 4,524,153 4,535,448
Fee income represents commission received on direct business and transactions ceded to re-insurance companies during the year under review.
The Group leases a number of branches and welcome centres under operating leases. The leases typically run for a period of 2 to 5 years, with an
option to renew the lease after that date. Lease payments are increased every two to three years to reflect market rentals.
As at 31 December 2016, the maturity profile of the operating leases are as follows:
The Company is presently involved in six (6) legal proceedings (2015: six (6)). These court cases arose in the normal course of business. In the
directors' opinion, after taking appropriate legal advice, the outcome of these legal claims will not give rise to any significant loss beyond the
amounts provided for in the outstanding claims balance at 31 December 2016.
119

AXA Mansard Insurance plc and Subsidiary Companies
Notes to the financial statements
For the year ended 31 December 2016
(All amounts in thousands of Naira unless otherwise stated)
(a) Claims paid during the year can be analysed as follows:
Group Group Parent Parent
Dec-2016 Dec-2015 Dec-2016 Dec-2015
Non life 4,182,182 3,421,312 4,182,182 3,421,312
Group life 1,367,371 1,135,459 1,367,371 1,135,459
Individual life 366,796 337,296 366,796 337,296
Annuity 263,264 211,049 263,264 211,049
HMO 2,102,538 824,387 - -
8,282,151 5,929,503 6,179,613 5,105,116
(b) Movement in outstanding claims during the year are as follows:
Group Group Parent Parent
Dec-2016 Dec-2015 Dec-2016 Dec-2015
Non life 891,808 613,835 891,808 613,835
Group life (186,818) 214,612 (186,818) 214,612
HMO (32,204) 17,453 - -
672,786 845,900 704,990 828,447
33 Underwriting expenses:
Group Group Parent Parent
Dec-2016 Dec-2015 Dec-2016 Dec-2015
Acquisition cost 1,855,580 1,661,879 1,767,747 1,621,512
Maintenance cost 216,067 182,565 216,067 182,565
2,071,647 1,844,444 1,983,814 1,804,077
Analysis of acquisition cost is as shown below:
Group Group Parent Parent
Dec-2016 Dec-2015 Dec-2016 Dec-2015
Acquisition cost paid during the year 1,840,462 1,748,079 1,764,209 1,712,361
Movement in deferred acquisition cost 15,118 (86,200) 3,538 (90,849)
1,855,580 1,661,879 1,767,747 1,621,512
Group Group Parent Parent
Dec-2016 Dec-2015 Dec-2016 Dec-2015
Non life 1,498,835 1,346,143 1,498,835 1,342,923
Life 268,912 315,736 268,912 278,589
Health 87,833 - - -
1,855,580 1,661,879 1,767,747 1,621,512
34 Investment income
Group Group Parent Parent
Dec-2016 Dec-2015 Dec-2016 Dec-2015
Dividend income 93,779 144,741 184,685 141,126
Interest income on investment securities 2,006,513 1,800,809 1,552,985 1,464,925
Interest income on cash and cash equivalents 286,086 327,855 273,346 234,521
Rental income 1,076,371 912,322 - -
Asset management fees (see note (a) below) 373,382 359,986 - -
3,836,131 3,545,713 2,011,016 1,840,572
(a) The asset management fees represent the net of gross management fees earned by the group after eliminating the asset management fees expenses
charged by AXA Mansard Investments Limited on other members of the AXA Mansard group.
Acquisition cost is further analysed into the life and non life business as stated below
120

AXA Mansard Insurance plc and Subsidiary Companies
Notes to the financial statementsFor the year ended 31 December 2016
35 Net (losses)/gains on financial instruments
Group Group Parent Parent
Dec-2016 Dec-2015 Dec-2016 Dec-2015
Gains on financial assets 563,245 91,924 427,615 82,552
Foreign exchange (losses)/gain (1,139,415) (190,683) 570,377 83,081
(576,170) (98,759) 997,992 165,633
36 Profit from investment contracts
Group Group Parent Parent
Dec-2016 Dec-2015 Dec-2016 Dec-2015
Interest income 360,255 280,409 360,255 280,409
Gains from sale of investments 451 59,149 451 59,149
Total interest income 360,706 339,558 360,706 339,558
Expenses
Guaranteed interest (138,096) (133,939) (138,096) (133,939)
Other expenses (23,660) (22,100) (23,660) (22,100)
Net profit 198,950 183,519 198,950 183,519
37 Other income
Group Group Parent Parent
Dec-2016 Dec-2015 Dec-2016 Dec-2015
Profit from sale of property and equipment 2,501 7,915 2,760 6,149
Sundry income 118,176 67,478 78,250 51,757
Interest income on loan to subsidiary - - 135,533 85,185
Total 120,677 75,393 216,543 143,091
38 Expenses for marketing and administration
Group Group Parent Parent
Dec-2016 Dec-2015 Dec-2016 Dec-2015
Marketing and administrative expenses 1,199,385 1,193,471 950,336 969,118
Direct selling cost 226,053 239,772 226,053 239,772
1,425,438 1,433,243 1,176,389 1,208,890
39 Employee benefit expense
Group Group Parent Parent
Dec-2016 Dec-2015 Dec-2016 Dec-2015
Wages and salaries 1,511,425 1,283,118 1,133,492 930,036
Other employee costs 139,496 140,198 115,012 126,212
52,321 48,485 38,686 29,015
Performance-based expenses 301,625 26,368 280,906 7,491
Equity-settled share-based payments (see note (45) for details) 38,197 120,595 38,197 120,595
Cash-settled shared based payment (see note (45) for details) 11,611 11,363 11,611 11,363
2,054,675 1,630,127 1,617,904 1,224,712
40 Other operating expenses
Group Group Parent Parent
Dec-2016 Dec-2015 Dec-2016 Dec-2015
Depreciation and amortisation charges 518,891 491,230 371,007 370,585
Professional fees 109,128 159,000 89,273 128,669
Directors' emolument and expenses 208,337 174,145 168,980 161,378
Contract services cost 741,531 709,158 656,918 670,632
Auditor's remuneration 35,943 32,228 29,000 24,902
Bank charges 76,967 47,352 49,748 38,544
Stamp duty charge on bank transactions 2,329 - 2,329 -
Insurance related expenses 114,073 78,392 111,739 65,101
Training expenses 93,773 132,919 80,441 128,787
Asset management fees expense - - 140,247 128,674
Information technology expenses 230,863 176,960 187,648 160,864
Other expenses 155,561 79,216 70,734 3,873
2,287,396 2,080,600 1,958,064 1,882,009
In accordance with Pension Reform Act 2014, the Group contributes 10.0% each of the qualifying staff's salary (Basic, transport, and housing). The
contributions are recognised as employee benefits expense when they are due.
Pension costs – defined contribution plans
121

AXA Mansard Insurance plc and Subsidiary Companies
Notes to the financial statementsFor the year ended 31 December 2016
41 Finance cost
Group Group Parent Parent
Dec-2016 Dec-2015 Dec-2016 Dec-2015
Interest expense 444,224 415,996 - -
444,224 415,996 - -
42 Income tax expense
Group Group Parent Parent
Dec-2016 Dec-2015 Dec-2016 Dec-2015
Company income tax
- Non life 77,109 112,921 77,109 112,921
- Life 88,441 67,998 88,441 67,998
- AXA Mansard Investments Limited 6,470 31,874 - -
- AXA Mansard Health Limited 30,000 19,437 - -
- AXA Mansard Pensions Limited 6,772 7,499 - -
Education tax
- AXA Mansard Health Limited 2,262 3,256 - -
- AXA Mansard Investments limited - 663 - -
- AXA Mansard Pensions Limited - 928 - -
211,054 244,576 165,550 180,919
Deferred tax
- Non life 57,858 42,215 57,858 42,215
- AXA Mansard Investments limited - (20,719) - -
- APD Limited 198,261 34,003 - -
- AXA Mansard Health Limited 28,310 40,967 - -
- AXA Mansard Pensions Limited (4,852) 20,430 - -
279,577 116,896 57,858 42,215
Total tax charge for the year 490,631 361,472 223,408 223,134
Group Group Parent Parent
Effective tax rate reconciliation analysis Dec-2016 Dec-2015 Dec-2016 Dec-2015
Profit before income tax 3,125,627 2,023,653 1,263,787 689,232
Tax calculated at domestic rate applicable in Nigeria at 30%
(2015:30%).937,688 607,096 379,136 206,770
Effect of:
Tax exempt income (1,272,598) (1,345,424) (765,293) (986,249)
119,400 901,528 220,607 858,116
Prior year underprovision 6,718 21,900 - -
Minimum tax 178,792 81,872 165,550 49,998
Dividend tax 30,000 94,500 - 94,500
490,631 361,472 223,408 223,135
43 Earnings per share
(a) Earnings per share - Basic
Group Group Parent Parent
Dec-2016 Dec-2015 Dec-2016 Dec-2015
Profit attributable to equity holders 2,064,614 1,219,249 1,040,379 466,098
Weighted average number of ordinary shares in issue (thousands)
(see note (a) (i) below)10,322,719 10,322,719 10,322,719 10,322,719
Basic earnings per share (kobo per share) 20.00 11.81 10.08 4.52
(i) Weighted average number of ordinary shares (basic)
Parent Parent
Dec-2016 Dec-2015
Issued ordinary shares at 1 January 10,322,719 10,322,719
Effect of ordinary shares issued during the year - -
Weighted-average number of ordinary shares at 31 December 10,322,719 10,322,719
Basic earnings per share is calculated by dividing the profit attributable to equity holders of the Company by the weighted average number of ordinary
shares in issue during the year, excluding ordinary shares purchased by the Company and held as treasury shares.
Interest expense represents finance cost recognized on APD Limited's loans during the year under review.
Tax on the Group's profit before tax differ from the theoretical amount that would arise using the weighted average tax rate applicable to profit of the
consolidated entities as follows:
Expenses not deducted for tax purposes
122

AXA Mansard Insurance plc and Subsidiary Companies
Notes to the financial statementsFor the year ended 31 December 2016
(b) Earnings per share- Diluted
Group Group Parent Parent
Dec-2016 Dec-2015 Dec-2016 Dec-2015
Profit attributable to equity holders 2,064,614 1,219,249 1,040,379 466,098
Weighted average number of ordinary shares in issue (thousands)
(see note (a) (i) below)10,486,501 10,407,334 10,486,501 10,407,334
Diluted earnings per share (kobo per share) 19.69 11.72 9.92 4.48
(i) Average number of ordinary shares (diluted)
Group Group
Dec-2016 Dec-2015
Issued ordinary shares at 1 January 10,407,334 10,322,719
Effect of ordinary shares issued during the year - -
Effect of treasury shares held 79,167 84,615
Effect of share options exercised - -
Weighted-average number of ordinary shares at 31 December 10,486,501 10,407,334
The calculation of diluted earnings per share has been based on the profit attributable to ordinary shareholders and the weighted-average number of
ordinary shares outstanding after adjustment for the effects of all dilutive potential ordinary shares.
123

AXA Mansard Insurance plc and Subsidiary Companies
Notes to the financial statements
For the year ended 31 December 2016
(All amounts in thousands of Naira unless otherwise stated)
44 Supplementary income statement information:
(a)
Group Group Company Company
Dec-16 Dec-15 Dec-16 Dec-15
Number Number Number Number
N720,001 – N1,400,000 1 11 - -
N1,400,001 – N2,050,000 4 8 - -
N2,050,001 – N2,330,000 - 2 - -
N2,330,001 – N2,840,000 90 57 70 49
N2,840,001 – N3,000,000 - 49 - 45
N3,000,001 – N4,500,000 104 37 84 25
N4,500,001 – N5,950,000 26 25 20 20
N5,950,001 – N6,800,000 4 24 2 20
N6,800,001 – N7,800,000 20 1 17 1
N7,800,001 – N8,600,000 1 11 - 8
N8,600,001 – N11,800,000 26 22 17 15
Above N11,800,000 31 17 24 10
307 264 234 193
Group Group Company Company
Dec-16 Dec-15 Dec-16 Dec-15
Number Number Number Number
Executive directors 3 3 3 3
Management staff 32 36 23 24
Non management staff 275 228 211 169
310 267 237 196
(b) Directors' remuneration:
Group Group Parent Parent
Dec-16 Dec-15 Dec-16 Dec-15
Executive compensation 119,866 84,621 119,866 84,621
Directors' fees 1,450 1,650 1,450 1,650
Other directors expenses 71,638 36,653 32,281 23,886 Defined contribution 1,786 1,786 1,786 1,786
Equity-settled share-based scheme 15,646 38,073 15,646 38,073
Cash-settled share-based scheme 15,383 11,362 15,383 11,362
225,769 174,145 186,412 161,378
ii.The directors' remuneration shown above (excluding pension contributions) includes:
Group Group Parent Parent
Dec-16 Dec-15 Dec-16 Dec-15
Chairman 10,078 10,078 10,078 10,078
Highest paid director:
Executive compensation and pension contribution 40,786 40,786 40,786 40,786
Equity-settled share-based scheme 9,549 30,149 9,549 30,149
Cash-settled share-based scheme 15,383 11,362 15,383 11,362
65,718 82,297 65,718 82,297
iii. The emoluments of all other directors fell within the following range:
Group Group Parent Parent
Dec-16 Dec-15 Dec-16 Dec-15
Number Number Number Number
N300,001 - N350,000 - - - -
N500,001 - N1,000,000 - - - -
N1,000,001- N1,500,000 7 7 7 7
N1,500,001 and above 4 4 4 4
11 11 11 11
i. Employees, other than the executive directors, whose duties were wholly or mainly discharged in Nigeria, received emoluments (excluding
pension contribution and other allowances) in the following ranges:
ii. The average number of full time persons employed by the Company during the period was as follow:
i. Remuneration paid to the directors was as follows:
124
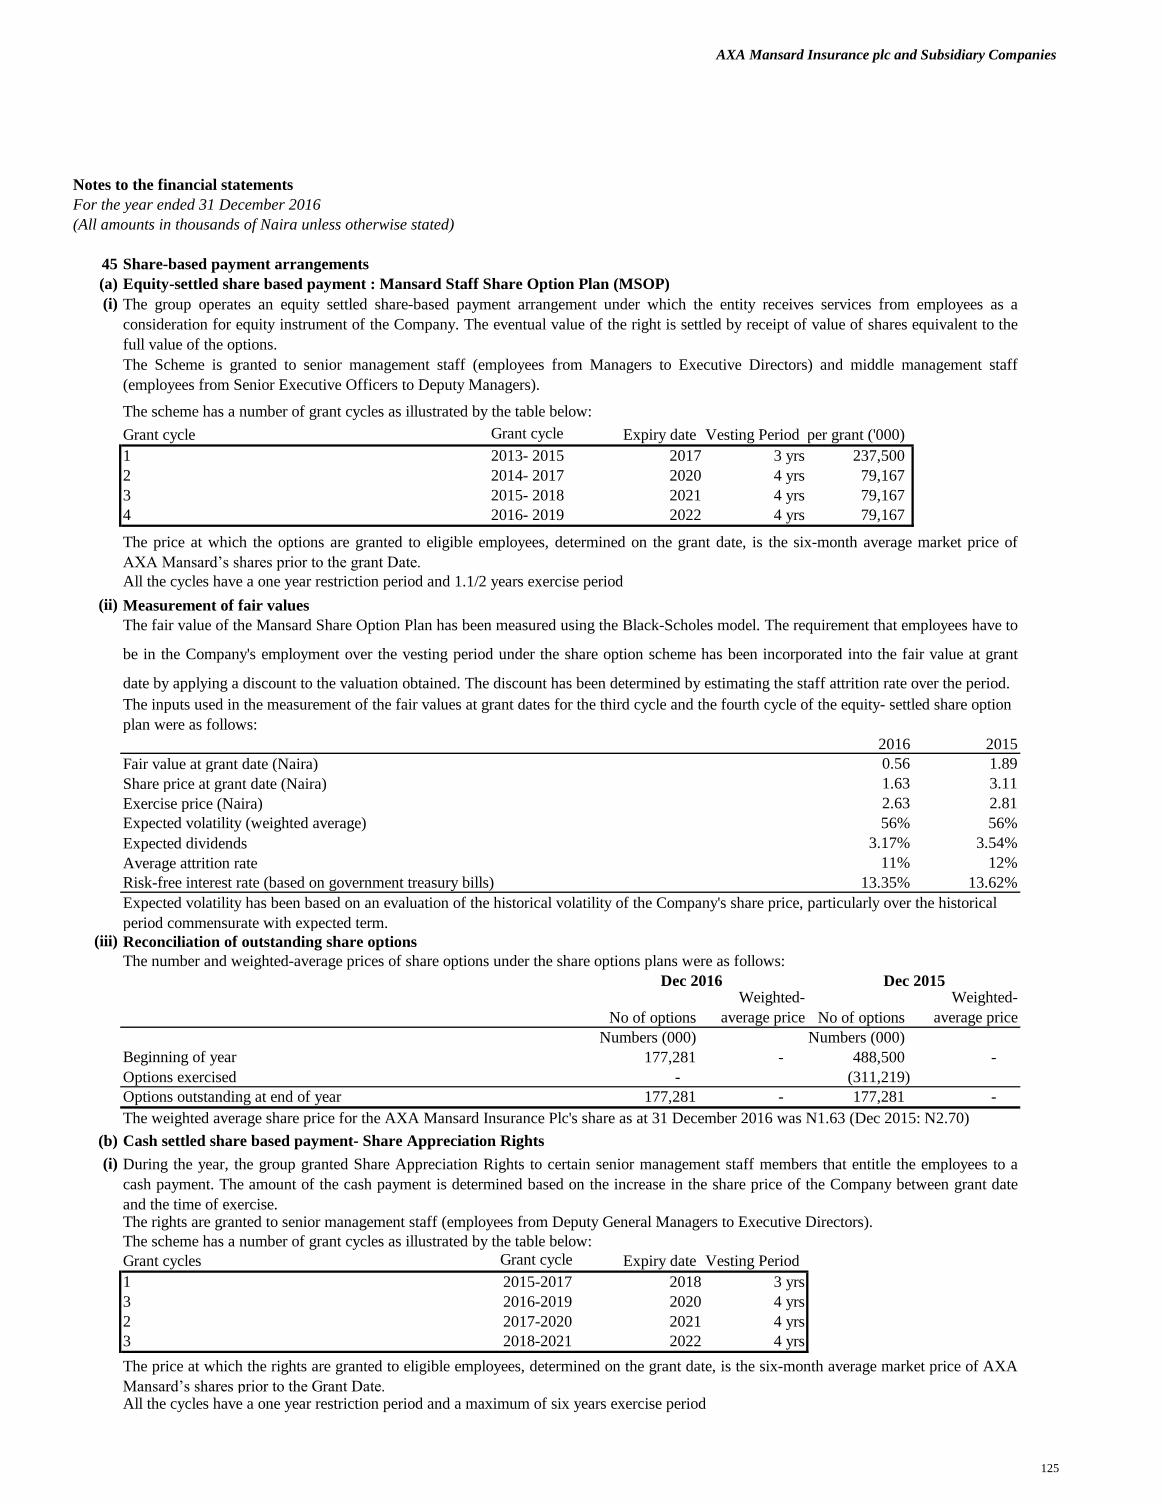
AXA Mansard Insurance plc and Subsidiary Companies
Notes to the financial statements
For the year ended 31 December 2016
(All amounts in thousands of Naira unless otherwise stated)
45 Share-based payment arrangements
(a) Equity-settled share based payment : Mansard Staff Share Option Plan (MSOP)
(i)
The scheme has a number of grant cycles as illustrated by the table below:
Grant cycle Grant cycle Expiry date Vesting PeriodShares per grant ('000)
1 2013- 2015 2017 3 yrs 237,500
2 2014- 2017 2020 4 yrs 79,167
3 2015- 2018 2021 4 yrs 79,167
4 2016- 2019 2022 4 yrs 79,167
All the cycles have a one year restriction period and 1.1/2 years exercise period
(ii) Measurement of fair values
2016 2015
Fair value at grant date (Naira) 0.56 1.89
Share price at grant date (Naira) 1.63 3.11
Exercise price (Naira) 2.63 2.81
Expected volatility (weighted average) 56% 56%
Expected dividends 3.17% 3.54%
Average attrition rate 11% 12%
Risk-free interest rate (based on government treasury bills) 13.35% 13.62%
(iii)
No of options
Weighted-
average price No of options
Weighted-
average price
Numbers (000) Numbers (000)
Beginning of year 177,281 - 488,500 -
Options exercised - (311,219)
Options outstanding at end of year 177,281 - 177,281 -
(b)
(i)
The scheme has a number of grant cycles as illustrated by the table below:
Grant cycles Grant cycle Expiry date Vesting Period
1 2015-2017 2018 3 yrs
3 2016-2019 2020 4 yrs
2 2017-2020 2021 4 yrs
3 2018-2021 2022 4 yrs
All the cycles have a one year restriction period and a maximum of six years exercise period
The weighted average share price for the AXA Mansard Insurance Plc's share as at 31 December 2016 was N1.63 (Dec 2015: N2.70)
The group operates an equity settled share-based payment arrangement under which the entity receives services from employees as a
consideration for equity instrument of the Company. The eventual value of the right is settled by receipt of value of shares equivalent to the
full value of the options.
The Scheme is granted to senior management staff (employees from Managers to Executive Directors) and middle management staff
(employees from Senior Executive Officers to Deputy Managers).
The price at which the options are granted to eligible employees, determined on the grant date, is the six-month average market price of
AXA Mansard’s shares prior to the grant Date.
Expected volatility has been based on an evaluation of the historical volatility of the Company's share price, particularly over the historical
period commensurate with expected term.
Reconciliation of outstanding share options
Dec 2016 Dec 2015
The number and weighted-average prices of share options under the share options plans were as follows:
The fair value of the Mansard Share Option Plan has been measured using the Black-Scholes model. The requirement that employees have to
be in the Company's employment over the vesting period under the share option scheme has been incorporated into the fair value at grant
date by applying a discount to the valuation obtained. The discount has been determined by estimating the staff attrition rate over the period.
The inputs used in the measurement of the fair values at grant dates for the third cycle and the fourth cycle of the equity- settled share option
plan were as follows:
Cash settled share based payment- Share Appreciation Rights
The rights are granted to senior management staff (employees from Deputy General Managers to Executive Directors).
The price at which the rights are granted to eligible employees, determined on the grant date, is the six-month average market price of AXA
Mansard’s shares prior to the Grant Date.
During the year, the group granted Share Appreciation Rights to certain senior management staff members that entitle the employees to a
cash payment. The amount of the cash payment is determined based on the increase in the share price of the Company between grant date
and the time of exercise.
125

AXA Mansard Insurance plc and Subsidiary Companies
Notes to the financial statements
For the year ended 31 December 2016
(All amounts in thousands of Naira unless otherwise stated)
(ii) Measurement of fair values
2016 2015
Fair value at grant date (Naira) 0.61 0.65
Share price at grant date (Naira) 1.63 1.63
Exercise price (Naira) 2.63 2.81
Expected volatility (weighted average) 47.11% 47.11%
Expected dividends 3.17% 3.53%
Average attrition rate 11% 11%
Risk-free interest rate (based on government treasury bills) 15.68% 16.65%
(d) The total expenses recognised in respect of the share option scheme are as follows:
Dec 2016 Dec 2015
Equity-settled share-based scheme- Staff 30,612 120,595
Equity-settled share-based scheme- Directors 7,584 38,073
Cash-settled share-based scheme -staff 3,795 11,363
Cash-settled share-based scheme- Directors 7,816 11,362
46 Dividend paid
Dec 2016 Dec 2015
Gross dividend declared 210,000 315,000
Dividend on treasury shares (3,161) (4,788)
Net dividend paid 206,839 310,212
During the year under review, the Directors declared and paid dividend in the sum of 2 Kobo (2015:3 kobo) per ordinary share on the issued
capital of 10,500,000,000 Ordinary Share of 50 kobo each (net of dividend on treasury shares) subject to the appropriate Withholding tax
deduction.
The inputs used in the measurement of the fair values at grant dates for the first grant cycle of the Share Appreciation Rights were as
follows:
The weighted average share price for the AXA Mansard Insurance Plc's share as at 31 December 2016 was N1.63 (Dec 2015: N2.63)
Expected volatility has been based on an evaluation of the historical volatility of the Company's share price, particularly over the historical
period commensurate with expected term.
The fair value of the Share Appreciation Rights has been measured using the Black-Scholes model. The requirement that employees have to
be in the Company's employment over the vesting period under the share option scheme has been incorporated into the fair value at grant
date by applying a discount to the valuation obtained. The discount has been determined by estimating the attrition rate of staff over the
period.
126

AXA Mansard Insurance plc and Subsidiary Companies
Notes to the financial statements
For the year ended 31 December 2016
47 Related parties
Parent
Subsidiaries
Transactions with key management personnel
Statement of financial position
(a) Loans and advances
(i) Loans and advances to key management personnel
In thousands of Nigerian Naira 2016 2015
Loans outstandings as at 1 January 27,400 30,358
Loans issued during the period 39,600 -
Loans repayment during the period (2,958) (2,958)
Loan outstanding, end of period 64,042 27,400
Net interest income earned 2,392 2,362
No provision has been recognised in respect of loans given to key management personnel (2015:Nil).
(ii) Loans and advances to subsidiaries
2016 2015
Loans outstanding as at 1 January 1,390,844 1,049,236
Net loans and advances issued during the year 1,568,262 256,423
Capitalised interest 135,533 85,185
Loans repayment during the year (982,300) -
Balance, end of period 2,112,339 1,390,844
No provision has been recognised in respect of loans and advances to related parties (2015:Nil).
(1) Income statement
Intercompany balances
2016 2015
Interest income earned on intercompany loans 135,533 85,185
Asset management fees 170,270 64,338
Key management personnel
Premium income - -
Other income - rental income - -
Directors' remuneration (See note (45(b) for details) 225,769 174,145
The ultimate beneficial of the Company, which is also the ultimate parent company, is Societe Beaujon AXA which owns 75% (through
Assur Africa Holdings) of the Company’s shares. The ultimate parent company is Societe Beaujon AXA under the Latin America and
Meditteranean operations. The remaining 25% of the shares are widely held.
Transactions between AXA Mansard Insurance Plc and the subsidiaries also meet the definition of related party transactions. Where these
are eliminated on consolidation, they are not disclosed in the consolidated financial statements.
The Group’s key management personnel, and persons connected with them are considered to be related parties for disclosure purposes. The
definition of key management includes close members of family of key personnel and any entity over which key management exercise
control. The key management personnel have been identified as the executive and non-executive directors of the Group. Close members of
family are those family members who may be expected to influence, or be influenced by that individual in their dealings with AXA
Mansard Insurance Plc.
The volume of related party transactions, outstanding balances at the period end, and related expense and income for the period are as
follows:
127

AXA Mansard Insurance plc and Subsidiary Companies
Other supplementary information

Notes to the financial statements
AXA Mansard Insurance plc and Subsidiary Companies
Claims Paid Triangulations as at 31 December 2016
Motor
Accident Period 0 1 2 3 4 5 6 7 8 9 10 11 12 13 14 15 16 17 18 19 20 21
2006_H1 43,025,502 80,462,056 92,237,721 93,026,095 94,858,286 94,858,286 94,858,286 94,858,286 94,858,286 94,858,286 94,858,286 94,858,286 94,858,286 94,858,286 94,858,286 94,858,286 94,858,286 94,858,286 94,858,286 94,858,286 94,858,286 94,858,286
2006_H2 69,402,712 112,855,720 133,459,369 133,757,670 133,757,670 133,757,670 133,757,670 133,757,670 133,757,670 133,757,670 133,757,670 133,757,670 133,757,670 133,757,670 133,757,670 133,757,670 133,757,670 133,757,670 133,757,670 133,757,670 133,757,670
2007_H1 127,013,479 262,300,698 282,805,867 293,373,111 303,798,228 307,233,637 310,128,174 310,128,174 310,128,174 313,518,823 313,676,743 314,271,345 314,271,345 314,271,345 314,271,345 314,271,345 314,271,345 314,271,345 314,271,345 314,271,345
2007_H2 168,630,024 343,340,891 355,345,425 363,525,371 363,525,371 363,525,371 363,525,371 363,525,371 363,525,371 363,579,438 363,579,438 363,579,438 363,579,438 363,579,438 363,579,438 363,579,438 363,579,438 363,579,438 363,579,438
2008_H1 277,879,211 496,639,599 556,715,073 559,943,610 560,668,304 560,885,918 564,191,309 564,517,674 564,714,505 576,963,379 576,963,379 576,963,379 576,963,379 576,963,379 576,963,379 576,995,356 576,995,356 576,995,356
2008_H2 241,225,858 415,721,105 448,865,987 450,139,248 451,040,068 462,258,842 462,792,448 487,110,211 487,112,314 487,112,314 487,112,314 487,112,314 487,112,314 504,198,119 505,770,615 505,770,615 505,770,615
2009_H1 367,675,525 496,872,592 523,320,840 525,187,258 525,433,232 526,183,434 526,573,023 526,573,023 526,573,023 526,573,023 526,573,023 526,573,023 526,573,023 526,947,362 526,947,362 526,947,362
2009_H2 384,007,450 614,016,353 653,878,763 670,429,779 678,268,607 679,856,796 679,862,230 679,862,230 679,862,230 680,977,208 681,254,070 681,254,070 681,480,009 681,480,009 681,480,009
2010_H1 496,501,130 718,653,885 753,717,946 770,739,549 783,477,268 783,488,807 783,545,055 783,545,055 784,218,528 784,218,528 784,218,528 784,218,528 784,218,528 784,218,528
2010_H2 445,342,184 730,013,875 780,827,765 784,073,770 785,364,202 787,871,164 787,885,991 787,885,991 789,409,017 789,409,017 789,431,193 789,431,193 789,431,193
2011_H1 483,633,821 697,114,917 718,596,394 731,454,077 747,483,138 759,937,649 759,937,649 759,937,649 759,937,649 759,937,649 759,937,649 759,937,649
2011_H2 531,332,564 846,475,322 899,245,522 906,273,808 945,523,185 947,406,239 957,268,584 957,268,584 957,268,584 957,268,584 957,268,584
2012_H1 632,320,472 1,016,687,892 1,073,631,903 1,127,680,617 1,133,056,021 1,133,471,141 1,137,777,019 1,137,936,848 1,139,026,760 1,139,026,760
2012_H2 556,051,694 896,125,422 989,877,935 1,013,374,160 1,018,901,411 1,032,408,201 1,033,511,772 1,036,764,711 1,044,786,852
2013_H1 606,450,736 908,993,917 965,273,405 969,072,983 969,646,515 970,516,370 973,891,367 973,986,547
2013_H2 624,654,863 958,287,898 1,006,485,333 1,022,767,194 1,040,834,142 1,041,515,521 1,041,515,521
2014_H1 706,871,803 958,209,098 1,016,075,949 1,032,574,914 1,039,918,559 1,040,789,855
2014_H2 703,864,482 1,023,903,976 1,062,470,088 1,104,261,310 1,130,702,432
2015_H1 724,841,552 997,333,312 1,041,519,684 1,061,502,133
2015_H2 792,930,902 1,018,938,768 1,055,190,174
2016_H1 762,931,375 1,018,128,240
2016_H2 653,329,610
653,329,610 1,018,128,240 262,259,272 64,168,821 68,232,344 8,214,941 681,379 3,470,178 11,275,079 1,089,912 - - - - - - - - - - - - 2,090,849,776
Fire
Accident Period 0 1 2 3 4 5 6 7 8 9 10 11 12 13 14 15 16 17 18 19 20 21
2006_H1 3,225,812 11,795,381 17,824,941 17,824,941 18,100,377 18,100,377 25,117,600 26,212,544 26,212,544 26,212,544 26,212,544 26,212,544 26,212,544 26,212,544 26,212,544 26,212,544 26,212,544 26,212,544 26,212,544 26,212,544 26,212,544 26,212,544
2006_H2 35,076,947 40,922,136 44,375,604 50,811,839 51,841,194 51,880,844 52,235,533 52,235,533 52,430,503 52,430,503 52,430,503 52,430,503 52,430,503 52,430,503 52,430,503 52,443,209 52,443,209 52,443,209 52,443,209 52,443,209 52,443,209
2007_H1 1,956,824 12,272,908 37,092,572 76,627,158 83,309,746 83,453,821 83,660,196 83,660,196 83,660,196 83,693,118 83,693,118 83,706,123 83,706,123 83,706,123 83,706,123 83,706,123 83,706,123 83,706,123 83,706,123 83,706,123
2007_H2 1,521,246 34,463,568 44,969,702 75,700,944 82,368,524 82,608,915 82,847,326 83,009,477 83,201,241 83,365,737 83,365,737 83,365,737 83,365,737 83,365,737 83,365,737 83,365,737 83,365,737 83,365,737 83,365,737
2008_H1 3,297,633 11,652,960 27,050,607 28,103,367 28,951,212 38,186,136 43,668,680 45,196,157 45,199,568 45,199,568 45,199,568 45,199,568 45,199,568 45,199,568 45,199,568 45,227,021 45,227,021 45,227,021
2008_H2 2,417,981 12,057,627 20,278,440 29,966,848 38,729,693 40,183,941 40,714,356 40,738,903 40,738,903 40,738,903 40,738,903 40,738,903 40,738,903 40,738,903 40,738,903 40,738,903 40,738,903
2009_H1 71,035,746 108,589,491 122,120,758 124,272,545 126,327,289 127,885,005 127,885,005 127,885,005 127,885,005 127,885,005 127,885,005 127,885,005 127,885,005 127,885,005 127,885,005 127,885,005
2009_H2 7,016,659 21,371,639 28,276,986 32,061,268 34,749,863 35,798,675 37,257,845 37,275,665 37,275,665 37,275,665 37,275,665 37,275,665 37,299,429 37,299,429 37,299,429
2010_H1 21,458,189 91,833,942 126,939,023 134,217,531 137,989,617 138,394,607 138,411,747 138,445,477 138,715,740 138,715,740 138,715,740 138,715,740 138,715,740 138,715,740
2010_H2 8,237,830 23,175,412 72,752,828 73,310,490 73,359,751 74,826,726 75,593,095 82,315,509 82,315,509 82,315,509 82,315,509 82,315,509 82,315,509
2011_H1 26,228,935 107,788,022 133,702,615 141,508,887 153,989,588 154,046,615 155,195,635 161,790,933 161,790,933 161,902,534 161,902,534 161,923,279
2011_H2 20,360,796 76,121,356 128,908,149 133,553,640 137,664,506 181,877,127 182,008,487 183,500,408 183,500,408 183,500,408 183,500,408
2012_H1 22,684,281 109,264,197 127,127,631 201,517,728 214,849,077 216,387,862 216,387,862 216,387,862 216,483,291 216,483,291
2012_H2 32,076,909 161,393,609 179,768,703 181,616,643 181,616,643 182,282,378 182,925,666 182,925,666 182,925,666
2013_H1 50,299,544 187,357,197 219,812,642 220,290,249 225,446,814 237,149,902 237,514,016 237,514,016
2013_H2 39,859,122 117,878,395 135,505,227 136,635,498 137,100,463 137,416,706 138,377,688
2014_H1 81,641,199 122,557,195 173,383,142 178,520,942 179,423,278 180,567,038
2014_H2 71,096,603 146,827,369 164,077,632 167,593,095 171,705,264
2015_H1 98,816,002 143,272,175 177,683,376 184,296,668
2015_H2 39,779,821 87,321,989 107,456,568
2016_H1 63,730,957 159,646,239
2016_H2 40,987,147
2016 claims paid 40,987,147 159,646,239 67,676,747 41,024,493 7,627,632 2,046,096 1,277,225 364,114 - 95,429 - 20,745 - - - - - - - - - - 320,765,867
General Accident
Accident Period 0 1 2 3 4 5 6 7 8 9 10 11 12 13 14 15 16 17 18 19 20 21
2006_H1 2,102,087 16,777,855 18,876,000 24,608,041 24,608,041 24,693,463 25,644,789 25,885,956 25,981,168 25,981,168 25,981,168 25,981,168 25,981,168 28,857,636 28,857,636 28,857,636 28,857,636 28,857,636 28,857,636 28,875,903 29,087,665 29,087,665
2006_H2 8,604,246 25,231,714 31,015,909 34,780,048 34,979,435 35,006,834 41,392,452 42,535,466 42,535,466 42,535,466 43,105,365 43,105,365 43,535,778 43,535,778 43,535,778 43,535,778 43,535,778 43,535,778 43,646,894 43,656,947 43,656,947
2007_H1 5,929,627 52,805,725 87,252,598 90,363,220 96,693,540 98,076,921 98,585,846 99,212,338 99,982,629 99,982,629 99,988,218 100,196,036 100,196,036 100,196,036 100,196,036 100,196,036 100,196,036 100,205,412 100,205,412 100,205,412
2007_H2 8,254,065 31,120,658 55,134,139 79,849,364 79,849,364 81,601,688 84,461,335 84,536,914 87,359,337 88,842,913 88,842,913 88,842,913 88,842,913 88,842,913 88,842,913 88,842,913 88,842,913 88,842,913 88,842,913
2008_H1 29,877,032 123,708,064 233,076,744 245,684,574 257,212,525 262,617,409 271,298,842 271,436,502 272,196,019 272,196,019 272,196,019 276,339,799 278,480,800 278,566,192 278,566,192 278,566,192 278,566,192 278,566,192
2008_H2 70,692,681 94,278,517 108,974,053 118,368,228 124,088,644 136,751,506 138,950,586 139,769,999 140,448,695 140,477,877 141,901,517 141,901,517 141,901,517 141,901,517 142,080,938 142,080,938 142,080,938
2009_H1 25,429,924 62,836,340 124,499,330 152,086,848 162,876,910 166,173,289 166,504,703 167,426,811 167,505,542 167,760,641 167,760,641 168,978,415 170,028,515 170,172,524 170,172,524 170,172,524
2009_H2 16,551,947 94,560,180 108,386,047 122,690,103 135,204,197 136,991,756 140,090,906 158,038,333 163,267,167 168,160,915 168,703,999 170,335,762 170,529,911 170,540,916 170,540,916
2010_H1 40,638,181 151,495,295 168,611,129 173,892,173 175,618,928 184,887,519 186,264,211 186,493,105 189,433,138 189,743,839 194,486,344 194,575,925 194,575,925 194,575,925
2010_H2 22,047,122 89,187,212 127,107,913 159,928,657 163,272,498 163,875,908 169,840,266 172,817,103 173,412,687 173,430,970 173,879,872 174,183,399 174,752,495
2011_H1 25,017,414 95,698,230 114,896,524 121,254,462 130,971,597 135,605,050 142,807,052 143,963,395 144,267,563 148,822,160 153,289,499 158,325,829
2011_H2 18,624,133 70,155,132 120,230,755 140,786,097 147,443,805 169,899,216 173,599,688 184,083,477 192,103,316 192,103,316 192,539,742
2012_H1 68,230,995 113,721,110 208,571,115 220,625,751 238,013,391 238,925,934 239,124,129 240,778,502 243,228,521 244,140,223
2012_H2 26,294,340 154,089,283 239,508,723 252,888,271 274,699,376 281,227,906 283,884,460 284,629,402 284,645,235
2013_H1 92,862,712 157,186,671 173,136,462 182,684,821 183,312,751 185,762,150 189,498,568 189,589,561
2013_H2 49,800,758 117,055,441 159,939,466 167,203,603 170,510,438 171,227,989 176,033,562
2014_H1 27,997,075 90,386,346 108,083,893 109,883,627 120,354,666 123,068,830
2014_H2 54,502,103 163,800,519 206,406,576 231,273,224 234,195,497
2015_H1 73,947,080 127,281,320 167,762,315 169,804,709
2015_H2 106,056,962 208,206,155 224,753,041
2016_H1 95,732,680 220,182,986
2016_H2 93,890,676
2016 claims paid 93,890,676 220,182,986 118,696,079 42,523,390 27,788,920 13,185,203 5,523,124 3,827,411 760,775 3,361,720 436,426 9,503,669 872,623 - 11,005 - - - - - 10,053 211,762 540,785,822
Development
Development
Development
129

Notes to the financial statements
AXA Mansard Insurance plc and Subsidiary Companies
Engineering
Accident Period 0 1 2 3 4 5 6 7 8 9 10 11 12 13 14 15 16 17 18 19 20 21
2006_H1 - 977,611 12,132,720 12,132,720 12,132,720 12,132,720 12,132,720 12,132,720 12,132,720 12,132,720 12,132,720 12,132,720 12,132,720 12,132,720 12,132,720 12,132,720 12,132,720 12,132,720 12,132,720 12,132,720 12,132,720 12,132,720
2006_H2 1,844,500 14,479,633 14,890,691 14,890,691 14,953,293 14,953,293 14,953,293 14,953,293 14,953,293 14,953,293 14,953,293 14,953,293 14,953,293 14,953,293 14,953,293 14,953,293 14,953,293 14,953,293 14,953,293 14,953,293 14,953,293
2007_H1 7,150 4,354,207 14,382,669 24,193,254 31,133,961 31,133,961 31,133,961 31,133,961 34,093,355 34,093,355 34,093,355 34,093,355 34,093,355 34,093,355 34,093,355 34,093,355 34,093,355 34,095,761 34,095,761 34,095,761
2007_H2 13,544,146 14,377,019 19,350,994 19,384,117 19,384,117 19,407,645 19,407,645 19,407,645 19,407,645 19,407,645 19,407,645 19,407,645 19,407,645 19,407,645 19,407,645 19,407,645 19,407,645 19,407,645 19,407,645
2008_H1 0 2,912,539 27,411,119 39,127,213 39,127,213 39,127,213 39,127,213 39,127,213 39,127,213 39,127,213 39,127,213 39,127,213 47,143,652 47,143,652 47,143,652 47,242,876 47,242,876 47,242,876
2008_H2 4,650,350 4,817,757 14,877,428 14,877,428 15,547,619 15,582,998 15,657,829 15,657,829 15,657,829 15,657,829 15,657,829 15,657,829 15,657,829 15,657,829 15,657,829 15,657,829 15,657,829
2009_H1 1,669,487 24,907,428 47,113,468 55,008,588 56,311,192 56,311,192 57,920,686 57,920,686 58,042,315 58,042,315 58,042,315 62,873,455 62,873,455 62,879,760 62,879,760 62,879,760
2009_H2 7,019,980 15,193,847 16,509,492 18,631,489 18,631,489 18,631,489 32,385,109 32,385,109 32,385,109 32,385,109 32,385,109 32,385,109 33,201,379 33,254,242 33,254,242
2010_H1 2,734,960 12,357,918 29,394,688 43,140,609 45,661,481 46,404,032 48,892,479 48,892,479 48,892,479 48,892,479 48,892,479 49,539,197 49,539,197 49,539,197
2010_H2 1,339,590 15,877,506 26,579,935 31,313,823 31,313,823 32,461,566 32,461,566 32,461,566 32,461,566 32,461,566 32,461,566 32,461,566 32,461,566
2011_H1 393,698 34,051,815 44,055,372 45,854,728 46,562,945 47,166,724 47,166,724 47,166,724 47,287,040 47,287,040 47,583,384 47,583,384
2011_H2 - 32,622,684 47,219,604 61,234,527 61,234,527 61,234,527 61,234,527 61,234,527 61,234,527 61,234,527 61,234,527
2012_H1 13,022,819 21,785,027 27,244,594 32,589,869 33,079,568 33,123,277 33,141,627 33,141,627 33,141,627 33,141,627
2012_H2 8,703,295 28,962,385 61,259,488 61,274,316 61,274,316 64,294,644 64,417,754 64,417,754 64,417,754
2013_H1 6,448,894 37,217,809 52,135,689 52,135,689 58,315,383 58,315,383 58,315,383 58,450,638
2013_H2 35,900,015 62,942,635 76,126,322 77,029,780 77,029,780 77,029,780 77,029,780
2014_H1 13,586,937 28,249,242 35,485,250 36,158,936 36,710,664 39,172,687
2014_H2 31,385,370 73,983,734 91,004,087 91,031,147 99,166,589
2015_H1 31,486,620 48,945,503 69,304,381 69,562,490
2015_H2 4,277,792 9,425,147 12,550,197
2016_H1 27,151,382 62,879,822
2016_H2 1,616,935
2016 claims paid 1,616,935 62,879,822 8,272,406 20,616,987 8,162,502 3,013,750 - 135,255 - - - 296,344 - - 52,863 - - - - - - - 105,046,864
Marine Cargo
Accident Period 0 1 2 3 4 5 6 7 8 9 10 11 12 13 14 15 16 17 18 19 20 21
2006_H1 723,379 22,821,898 23,290,709 23,290,709 23,290,709 23,290,709 25,280,888 25,280,888 25,280,888 25,280,888 25,280,888 25,280,888 25,280,888 25,280,888 25,280,888 25,280,888 25,280,888 25,280,888 25,280,888 25,280,888 25,280,888 25,280,888
2006_H2 1,620,500 6,034,822 9,275,692 9,275,692 9,275,692 9,275,692 9,275,692 9,275,692 9,275,692 9,275,692 9,275,692 9,275,692 9,275,692 9,275,692 9,275,692 9,275,692 9,275,692 9,275,692 9,275,692 9,275,692 9,275,692
2007_H1 - 6,315,056 6,451,062 6,609,497 10,073,632 10,882,211 10,882,211 10,882,211 10,882,211 10,882,211 10,882,211 10,882,211 10,882,211 10,882,211 10,882,211 10,882,211 10,882,211 10,882,211 10,882,211 10,882,211
2007_H2 5,521,450 34,618,068 92,217,836 97,559,716 97,734,678 102,930,907 102,940,333 102,940,333 102,940,333 102,940,333 102,940,333 102,940,333 102,940,333 102,940,333 102,940,333 102,940,333 102,940,333 102,940,333 102,940,333
2008_H1 1,518,676 5,552,565 6,342,282 12,016,872 12,083,803 12,122,643 12,122,643 12,122,643 12,122,643 12,122,643 12,122,643 12,122,643 12,122,643 12,122,643 12,122,643 12,122,643 12,122,643 12,122,643
2008_H2 2,548,936 13,510,127 22,464,794 23,189,233 23,189,233 23,252,404 23,319,548 23,319,548 23,319,548 23,618,775 23,618,775 23,618,775 23,710,703 23,710,703 23,710,703 23,710,703 23,710,703
2009_H1 2,447,455 21,988,030 31,450,733 32,945,300 35,064,596 35,064,596 35,064,596 35,064,596 35,064,596 35,064,596 35,064,596 36,311,883 36,311,883 36,311,883 36,311,883 36,311,883
2009_H2 2,616,553 26,562,274 33,507,201 49,388,967 50,045,830 53,189,696 53,189,696 53,258,225 53,258,225 53,302,555 53,302,555 53,302,555 53,302,555 53,302,555 53,302,555
2010_H1 101,820,051 118,532,858 122,914,772 123,361,139 123,361,139 125,542,640 126,775,582 128,534,215 128,534,215 129,286,116 129,286,116 129,286,116 129,286,116 129,286,116
2010_H2 9,318,814 40,261,884 48,619,547 51,483,984 51,483,984 51,543,194 51,591,499 51,748,451 51,748,451 51,748,451 51,748,451 51,748,451 51,748,451
2011_H1 30,182,594 60,547,927 60,661,838 60,661,838 60,685,055 63,519,184 63,625,204 80,471,577 80,471,577 81,644,304 81,644,304 81,644,304
2011_H2 60,110,726 83,616,386 107,964,379 129,054,938 129,331,963 129,331,963 129,331,963 129,331,963 129,331,963 129,331,963 129,331,963
2012_H1 91,987,742 111,126,492 113,975,862 123,615,011 123,615,011 123,615,011 123,615,011 123,615,011 123,615,011 123,615,011
2012_H2 86,233,857 115,958,318 122,364,140 127,017,641 127,017,641 127,581,535 127,581,535 127,581,535 127,581,535
2013_H1 2,489,241 20,540,796 20,876,976 20,876,976 20,876,976 23,294,531 23,294,531 23,294,531
2013_H2 18,333,621 31,330,953 32,681,421 79,038,925 79,038,925 79,129,969 81,957,029
2014_H1 12,596,287 31,948,278 31,948,278 31,948,278 32,202,777 40,784,491
2014_H2 9,492,586 19,666,197 19,666,197 20,525,186 44,811,453
2015_H1 8,819,110 16,180,863 17,269,247 19,048,486
2015_H2 2,686,565 7,322,880 12,132,442
2016_H1 1,417,498 2,558,652
2016_H2 376,322
2016 claims paid 376,322 2,558,652 9,445,877 2,867,623 25,145,257 8,836,213 2,918,103 - - - - - - - - - - - - - - - 52,148,046
Development
Development
130

Notes to the financial statements
AXA Mansard Insurance plc and Subsidiary Companies
Claims Paid Triangulations as at 31 December 2016
Marine Hull
Accident Period 0 1 2 3 4 5 6 7 8 9 10
2006 2,373,627 4,448,642 4,448,642 4,448,642 4,448,642 4,448,642 4,448,642 4,448,642 4,448,642 4,448,642 4,448,642
2007 21,102,205 31,476,647 32,183,171 32,183,171 32,183,171 32,183,171 32,183,171 32,183,171 32,183,171 32,183,171
2008 242,748 242,748 242,748 242,748 242,748 242,748 242,748 242,748 242,748
2009 21,663,761 53,025,923 53,025,923 53,025,923 53,025,923 53,025,923 53,025,923 53,025,923
2010 26,681,676 28,979,185 28,979,185 28,979,185 28,979,185 28,979,185 28,979,185
2011 - 11,708,091 11,708,091 11,708,091 11,708,091 11,708,091
2012 22,861,528 51,144,064 51,366,634 51,366,634 51,366,634
2013 3,797,634 4,050,735 17,900,569 17,900,569
2014 19,962,727 40,389,344 44,674,649
2015 5,336,677 6,097,264
2016 7,449,802
2016 Claims Paid 5,336,677 20,426,617 13,849,834 - - - - - - - 39,613,129
Development
131
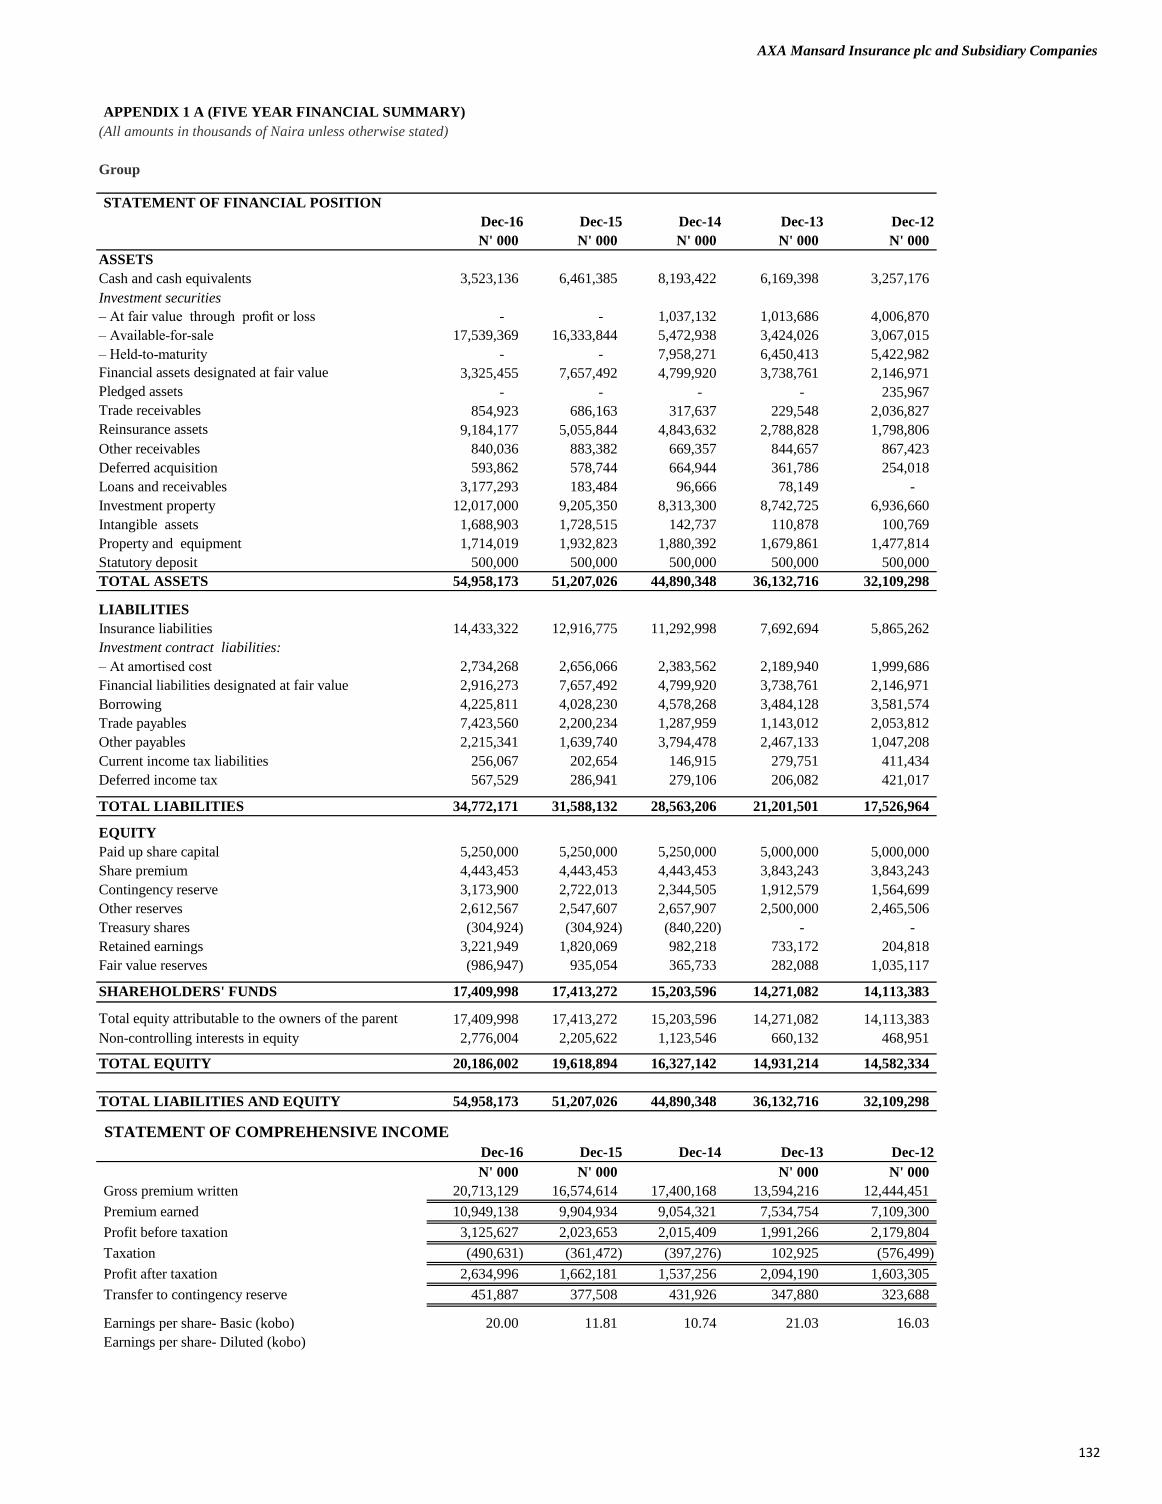
AXA Mansard Insurance plc and Subsidiary Companies
APPENDIX 1 A (FIVE YEAR FINANCIAL SUMMARY)
(All amounts in thousands of Naira unless otherwise stated)
Group
STATEMENT OF FINANCIAL POSITION
Dec-16 Dec-15 Dec-14 Dec-13 Dec-12
N' 000 N' 000 N' 000 N' 000 N' 000
ASSETS
Cash and cash equivalents 3,523,136 6,461,385 8,193,422 6,169,398 3,257,176
Investment securities
– At fair value through profit or loss - - 1,037,132 1,013,686 4,006,870
– Available-for-sale 17,539,369 16,333,844 5,472,938 3,424,026 3,067,015
– Held-to-maturity - - 7,958,271 6,450,413 5,422,982
Financial assets designated at fair value 3,325,455 7,657,492 4,799,920 3,738,761 2,146,971
Pledged assets - - - - 235,967
Trade receivables 854,923 686,163 317,637 229,548 2,036,827
Reinsurance assets 9,184,177 5,055,844 4,843,632 2,788,828 1,798,806
Other receivables 840,036 883,382 669,357 844,657 867,423
Deferred acquisition 593,862 578,744 664,944 361,786 254,018
Loans and receivables 3,177,293 183,484 96,666 78,149 -
Investment property 12,017,000 9,205,350 8,313,300 8,742,725 6,936,660
Intangible assets 1,688,903 1,728,515 142,737 110,878 100,769
Property and equipment 1,714,019 1,932,823 1,880,392 1,679,861 1,477,814
Statutory deposit 500,000 500,000 500,000 500,000 500,000
TOTAL ASSETS 54,958,173 51,207,026 44,890,348 36,132,716 32,109,298
LIABILITIES
Insurance liabilities 14,433,322 12,916,775 11,292,998 7,692,694 5,865,262
Investment contract liabilities:
– At amortised cost 2,734,268 2,656,066 2,383,562 2,189,940 1,999,686
Financial liabilities designated at fair value 2,916,273 7,657,492 4,799,920 3,738,761 2,146,971
Borrowing 4,225,811 4,028,230 4,578,268 3,484,128 3,581,574
Trade payables 7,423,560 2,200,234 1,287,959 1,143,012 2,053,812
Other payables 2,215,341 1,639,740 3,794,478 2,467,133 1,047,208
Current income tax liabilities 256,067 202,654 146,915 279,751 411,434
Deferred income tax 567,529 286,941 279,106 206,082 421,017
TOTAL LIABILITIES 34,772,171 31,588,132 28,563,206 21,201,501 17,526,964
EQUITY
Paid up share capital 5,250,000 5,250,000 5,250,000 5,000,000 5,000,000
Share premium 4,443,453 4,443,453 4,443,453 3,843,243 3,843,243
Contingency reserve 3,173,900 2,722,013 2,344,505 1,912,579 1,564,699
Other reserves 2,612,567 2,547,607 2,657,907 2,500,000 2,465,506
Treasury shares (304,924) (304,924) (840,220) - -
Retained earnings 3,221,949 1,820,069 982,218 733,172 204,818
Fair value reserves (986,947) 935,054 365,733 282,088 1,035,117
SHAREHOLDERS' FUNDS 17,409,998 17,413,272 15,203,596 14,271,082 14,113,383
Total equity attributable to the owners of the parent 17,409,998 17,413,272 15,203,596 14,271,082 14,113,383
Non-controlling interests in equity 2,776,004 2,205,622 1,123,546 660,132 468,951
TOTAL EQUITY 20,186,002 19,618,894 16,327,142 14,931,214 14,582,334
TOTAL LIABILITIES AND EQUITY 54,958,173 51,207,026 44,890,348 36,132,716 32,109,298
STATEMENT OF COMPREHENSIVE INCOME
Dec-16 Dec-15 Dec-14 Dec-13 Dec-12
N' 000 N' 000 N' 000 N' 000
Gross premium written 20,713,129 16,574,614 17,400,168 13,594,216 12,444,451
Premium earned 10,949,138 9,904,934 9,054,321 7,534,754 7,109,300
Profit before taxation 3,125,627 2,023,653 2,015,409 1,991,266 2,179,804
Taxation (490,631) (361,472) (397,276) 102,925 (576,499)
Profit after taxation 2,634,996 1,662,181 1,537,256 2,094,190 1,603,305
Transfer to contingency reserve 451,887 377,508 431,926 347,880 323,688
Earnings per share- Basic (kobo) 20.00 11.81 10.74 21.03 16.03
Earnings per share- Diluted (kobo)
132

AXA Mansard Insurance plc and Subsidiary Companies
APPENDIX 1 B (FIVE YEAR FINANCIAL SUMMARY)
(All amounts in thousands of Naira unless otherwise stated)
Parent
Dec-16 Dec-15 Dec-14 Dec-13 Dec-12
N' 000 N' 000 N' 000 N' 000 N' 000
ASSETS
Cash and cash equivalents 2,878,081 5,648,247 6,924,485 5,456,942 2,806,096
Financial assets
– Available-for-sale 14,234,470 13,973,364 4,706,891 2,994,663 3,067,015
– At fair value through profit or loss - - 992,790 767,073 3,797,654
– Financial assets designated at fair value 3,194,131 4,130,895 2,451,020 2,140,840 1,603,874
– Held-to-maturity - - 7,659,648 6,182,981 5,166,769
Loans and receivables 5,098,392 1,520,068 887,961 1,639,581 -
Pledged assets - - - - 235,967
Trade receivables 315,806 315,359 261,581 229,548 2,036,827
Reinsurance and coinsurance assets 9,134,825 5,033,551 4,838,653 2,788,828 1,798,807
Other receivables 555,287 493,179 604,793 876,728 1,769,005
Deferred acquisition 574,413 570,875 661,724 361,619 254,018
Investment in subsidiaries 3,919,573 3,919,573 2,034,326 3,199,661 2,687,661
Deferred tax asset - - - - -
Intangible assets 229,332 239,493 80,048 82,085 96,357
Property and equipment 1,442,216 1,575,469 1,659,857 1,569,233 1,468,003
Statutory deposit 500,000 500,000 500,000 500,000 500,000
TOTAL ASSETS 42,076,526 37,920,073 34,263,778 28,789,782 27,288,053
LIABILITIES
Insurance liabilities 13,033,944 12,293,840 11,034,635 7,680,663 5,865,263
Investment contract liabilities:
– At amortised cost 2,734,268 2,656,066 2,383,562 2,189,940 1,999,686
Financial liabilities designated at fair value 2,916,719 4,130,895 2,451,020 2,140,840 1,603,874
Borrowing - - - - 235,967
Trade payables 7,406,965 2,198,437 1,286,688 1,143,012 2,053,812
Other liabilities 1,017,461 974,108 2,810,196 1,818,637 504,978
Current income tax liabilities 202,157 144,206 129,752 272,615 392,300
Deferred income tax 183,220 125,362 120,330 19,442 214,377
TOTAL LIABILITIES 27,494,734 22,522,914 20,216,183 15,265,149 12,870,258
EQUITY
Paid up share capital 5,250,000 5,250,000 5,250,000 5,000,000 5,000,000
Share premium 4,443,453 4,443,453 4,443,453 3,843,243 3,843,243
Contingency reserve 3,173,900 2,722,013 2,344,505 1,912,579 1,564,699
Other reserves 2,593,900 2,532,978 2,657,907 2,500,000 2,500,000
Treasury shares (304,924) (304,924) (840,220) - -
Retained earnings 283,393 (98,290) 389,567 (13,277) 474,736
Fair value reserves (857,930) 851,929 (197,617) 282,088 1,035,117
SHAREHOLDERS' FUNDS 14,581,792 15,397,159 14,047,595 13,524,633 14,417,795
Total equity attributable to the owners of the parent 14,581,792 15,397,159 14,047,595 13,524,633 14,417,795
TOTAL EQUITY 14,581,792 15,397,159 14,047,595 13,524,633 14,417,795
TOTAL LIABILITIES AND EQUITY 42,076,526 37,920,073 34,263,778 28,789,782 27,288,053
STATEMENT OF COMPREHENSIVE INCOME
Dec-16 Dec-15 Dec-14 Dec-13 Dec-12
N' 000 N' 000 N' 000 N' 000N' 000 N' 000
Gross premium written 17,330,219 15,009,324 16,943,161 13,579,752 12,444,451
Premium earned 8,205,987 8,664,101 8,842,563 7,534,754 7,109,301
Profit before taxation 1,263,787 689,232 1,623,677 867,337 1,730,634
Taxation (223,408) (223,134) (386,880) 92,530 (350,581)
Profit after taxation 1,040,379 466,098 1,236,797 959,866 1,380,053
Transfer to contingency reserve 816,971 377,508 431,926 347,880 323,688
Earnings per share (kobo) 10.08 4.52 4.52 9.14 13.80
133
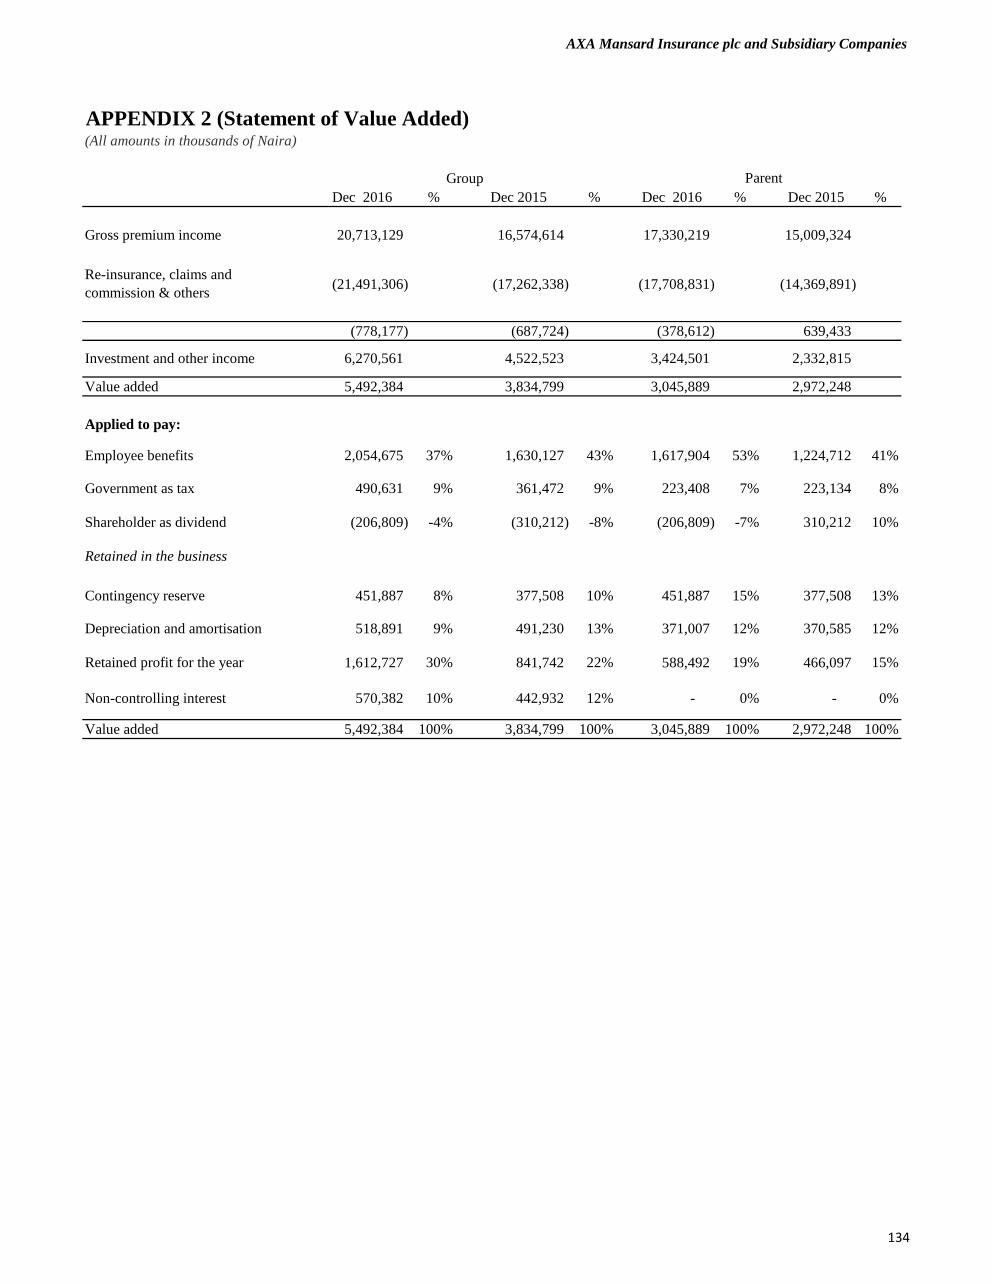
AXA Mansard Insurance plc and Subsidiary Companies
APPENDIX 2 (Statement of Value Added)(All amounts in thousands of Naira)
Dec 2016 % Dec 2015 % Dec 2016 % Dec 2015 %
Gross premium income 20,713,129 16,574,614 17,330,219 15,009,324
Re-insurance, claims and
commission & others(21,491,306) (17,262,338) (17,708,831) (14,369,891)
(778,177) (687,724) (378,612) 639,433
Investment and other income 6,270,561 4,522,523 3,424,501 2,332,815
Value added 5,492,384 3,834,799 3,045,889 2,972,248
Applied to pay:
Employee benefits 2,054,675 37% 1,630,127 43% 1,617,904 53% 1,224,712 41%
Government as tax 490,631 9% 361,472 9% 223,408 7% 223,134 8%
Shareholder as dividend (206,809) -4% (310,212) -8% (206,809) -7% 310,212 10%
Retained in the business
Contingency reserve 451,887 8% 377,508 10% 451,887 15% 377,508 13%
Depreciation and amortisation 518,891 9% 491,230 13% 371,007 12% 370,585 12%
Retained profit for the year 1,612,727 30% 841,742 22% 588,492 19% 466,097 15%
Non-controlling interest 570,382 10% 442,932 12% - 0% - 0%
Value added 5,492,384 100% 3,834,799 100% 3,045,889 100% 2,972,248 100%
Group Parent
134

AXA Mansard Insurance plc and Subsidiary Companies
AXA MANSARD INSURANCE PLC
APPENDIX 3 (SUMMARISED REVENUE ACCOUNTS (NON LIFE BUSINESS))
FOR THE YEAR ENDED 31 DECEMBER 2016
GENERAL
FIRE ACCIDENT MOTOR MARINE ENGINEERING OIL & ENERGY AVIATION AGRICULTURE DEC 2016 DEC 2015
=N=000 =N=000 =N=000 =N=000 =N=000 =N=000 =N=000 =N=000 =N=000 =N=000
REVENUE
Gross Premium Written 2,810,038 1,585,750 2,855,297 730,191 1,718,253 3,811,946 309,002 13,298 13,833,775 11,329,764
Add Reinsurance Inward Premium 28,200 8,523 6,146 3,424 2,516 1,323 1,441 - 51,573 40,991
2,838,238 1,594,273 2,861,443 733,615 1,720,769 3,813,269 310,443 13,298 13,885,348 11,370,755
Less Unexpired Risks Provision (154,203) (121,577) 285 3,167 278,794 398,376 227 3,301 408,370 870,209
Gross Premium Earned 2,684,035 1,472,696 2,861,728 736,782 1,999,563 4,211,645 310,669 16,599 14,293,717 12,240,964
Less Reinsurance Cost
Local Facultative Premium (1,819,338) (264,627) (96,827) (227,972) (1,398,488) (3,119,358) (146,371) - (7,072,981) (4,415,951)
Prepaid Reinsurance 168,287 7,997 33,595 3,378 (253,110) (210,713) 8,309 (1,048) (243,305) (762,717)
Reinsurance Treaty Premium (519,900) (45,533) (10,684) (233,132) (121,441) (312,347) (25,251) - (1,268,288) (1,010,762)
Net Premium (2,170,951) (302,163) (73,916) (457,726) (1,773,039) (3,642,418) (163,313) (1,048) (8,584,574) (6,189,430)
Net Earned Premium 513,084 1,170,533 2,787,812 279,056 226,524 569,227 147,356 15,551 5,709,143 6,051,534
Add Commission Received
Direct Business Commission 14,923 4,263 137 3,248 2,157 9,781 181 - 34,690 114,500
Local Facultative Comm 241,014 32,452 14,634 27,133 61,521 70,334 3,327 - 450,415 329,452
Reinsurance Treaty Comm 104,124 - - 64,935 45,267 76,505 154 - 290,985 235,205
Deferred Comm. Income (27,346) (2,990) (5,634) (4,944) 8,938 71,857 626 288 40,795 125,649
Investment income 37,583 85,740 204,204 20,441 16,593 41,695 10,794 1,139 418,188 274,749
370,298 119,465 213,341 110,812 134,476 270,172 15,082 1,427 1,235,072 1,079,555
Total Income 883,382 1,289,998 3,001,153 389,868 361,000 839,399 162,438 16,978 6,944,216 7,131,089
Expenses
Claims Paid 677,084 585,721 1,847,606 386,951 403,485 252,989 28,346 - 4,182,182 3,421,312
Outstanding Claims 744,681 69,505 (15,559) (26,380) 81,864 (130,029) 11,662 - 735,744 1,083,224
Gross Claims 1,421,765 655,226 1,832,047 360,571 485,349 122,960 40,008 - 4,917,926 4,504,536
Treaty Claims Recovered 390,292 152,861 30,821 166,137 54,785 59,666 - - 854,562 648,547
Facultative Claims Recovered 273 16,609 1,954 112,197 162,916 145,092 - - 439,041 48,542
Ri Claim Recoverable 748,268 132,946 24,263 (12,491) 48,048 (259,009) 16,293 - 698,318 620,535
Total Claims Recovered/Recoverable 1,138,833 302,416 57,038 265,843 265,749 (54,251) 16,293 - 1,991,921 1,317,624
Net claims Incurred 282,932 352,810 1,775,009 94,728 219,600 177,211 23,715 - 2,926,006 3,186,912
Underwriting Expenses (commission expenses) 452,635 217,542 207,115 107,231 119,475 150,344 39,735 1,959 1,296,036 1,100,110
Deferred Acquisition Cost (Comm) (20,048) (15,502) (4,450) (3,767) 367 38,853 677 330 (3,540) 90,849
Other acquisition Cost 52,739 462 98,201 19,644 174 35,116 - - 206,336 151,963
Maintenance Costs 36,616 21,716 39,942 7,090 4,932 39,126 4,974 - 154,396 118,512
Total underwriting expenses 521,942 224,218 340,809 130,198 124,948 263,439 45,386 2,289 1,653,229 1,461,434
Underwriting Profit 78,508 712,970 885,335 164,942 16,451 398,750 93,337 14,689 2,364,982 2,482,743
135
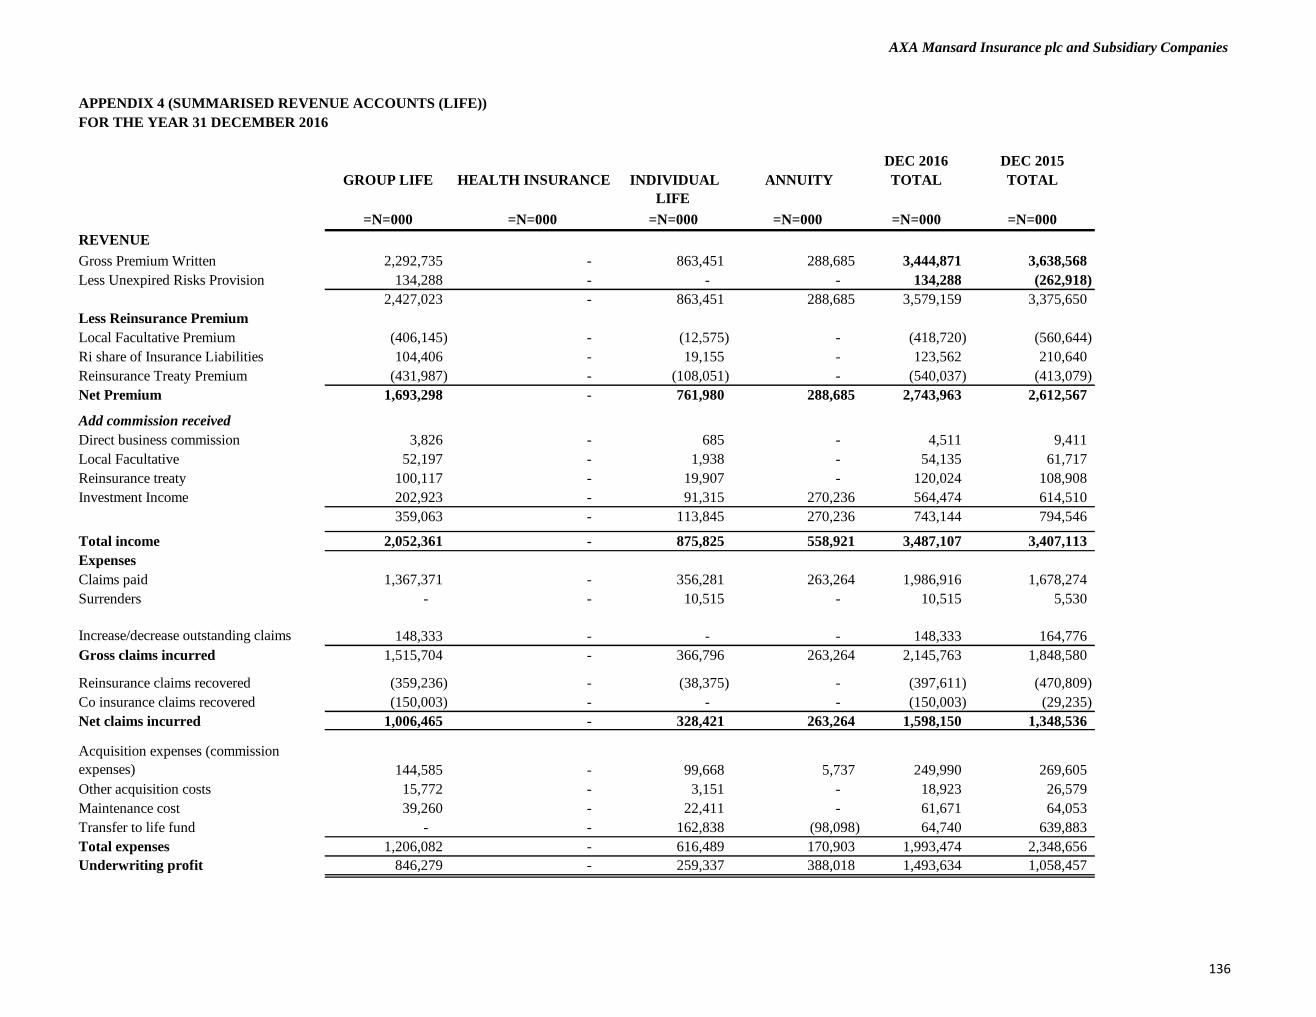
AXA Mansard Insurance plc and Subsidiary Companies
APPENDIX 4 (SUMMARISED REVENUE ACCOUNTS (LIFE))
FOR THE YEAR 31 DECEMBER 2016
DEC 2016 DEC 2015
GROUP LIFE HEALTH INSURANCE INDIVIDUAL
LIFE
ANNUITY TOTAL TOTAL
=N=000 =N=000 =N=000 =N=000 =N=000 =N=000
REVENUE
Gross Premium Written 2,292,735 - 863,451 288,685 3,444,871 3,638,568
Less Unexpired Risks Provision 134,288 - - - 134,288 (262,918)
2,427,023 - 863,451 288,685 3,579,159 3,375,650
Less Reinsurance Premium
Local Facultative Premium (406,145) - (12,575) - (418,720) (560,644)
Ri share of Insurance Liabilities 104,406 - 19,155 - 123,562 210,640
Reinsurance Treaty Premium (431,987) - (108,051) - (540,037) (413,079)
Net Premium 1,693,298 - 761,980 288,685 2,743,963 2,612,567
Add commission received
Direct business commission 3,826 - 685 - 4,511 9,411
Local Facultative 52,197 - 1,938 - 54,135 61,717
Reinsurance treaty 100,117 - 19,907 - 120,024 108,908
Investment Income 202,923 - 91,315 270,236 564,474 614,510
359,063 - 113,845 270,236 743,144 794,546
Total income 2,052,361 - 875,825 558,921 3,487,107 3,407,113
Expenses
Claims paid 1,367,371 - 356,281 263,264 1,986,916 1,678,274
Surrenders - - 10,515 - 10,515 5,530
Increase/decrease outstanding claims 148,333 - - - 148,333 164,776
Gross claims incurred 1,515,704 - 366,796 263,264 2,145,763 1,848,580
Reinsurance claims recovered (359,236) - (38,375) - (397,611) (470,809)
Co insurance claims recovered (150,003) - - - (150,003) (29,235)
Net claims incurred 1,006,465 - 328,421 263,264 1,598,150 1,348,536
Acquisition expenses (commission
expenses) 144,585 - 99,668 5,737 249,990 269,605
Other acquisition costs 15,772 - 3,151 - 18,923 26,579
Maintenance cost 39,260 - 22,411 - 61,671 64,053
Transfer to life fund - - 162,838 (98,098) 64,740 639,883
Total expenses 1,206,082 - 616,489 170,903 1,993,474 2,348,656
Underwriting profit 846,279 - 259,337 388,018 1,493,634 1,058,457
136
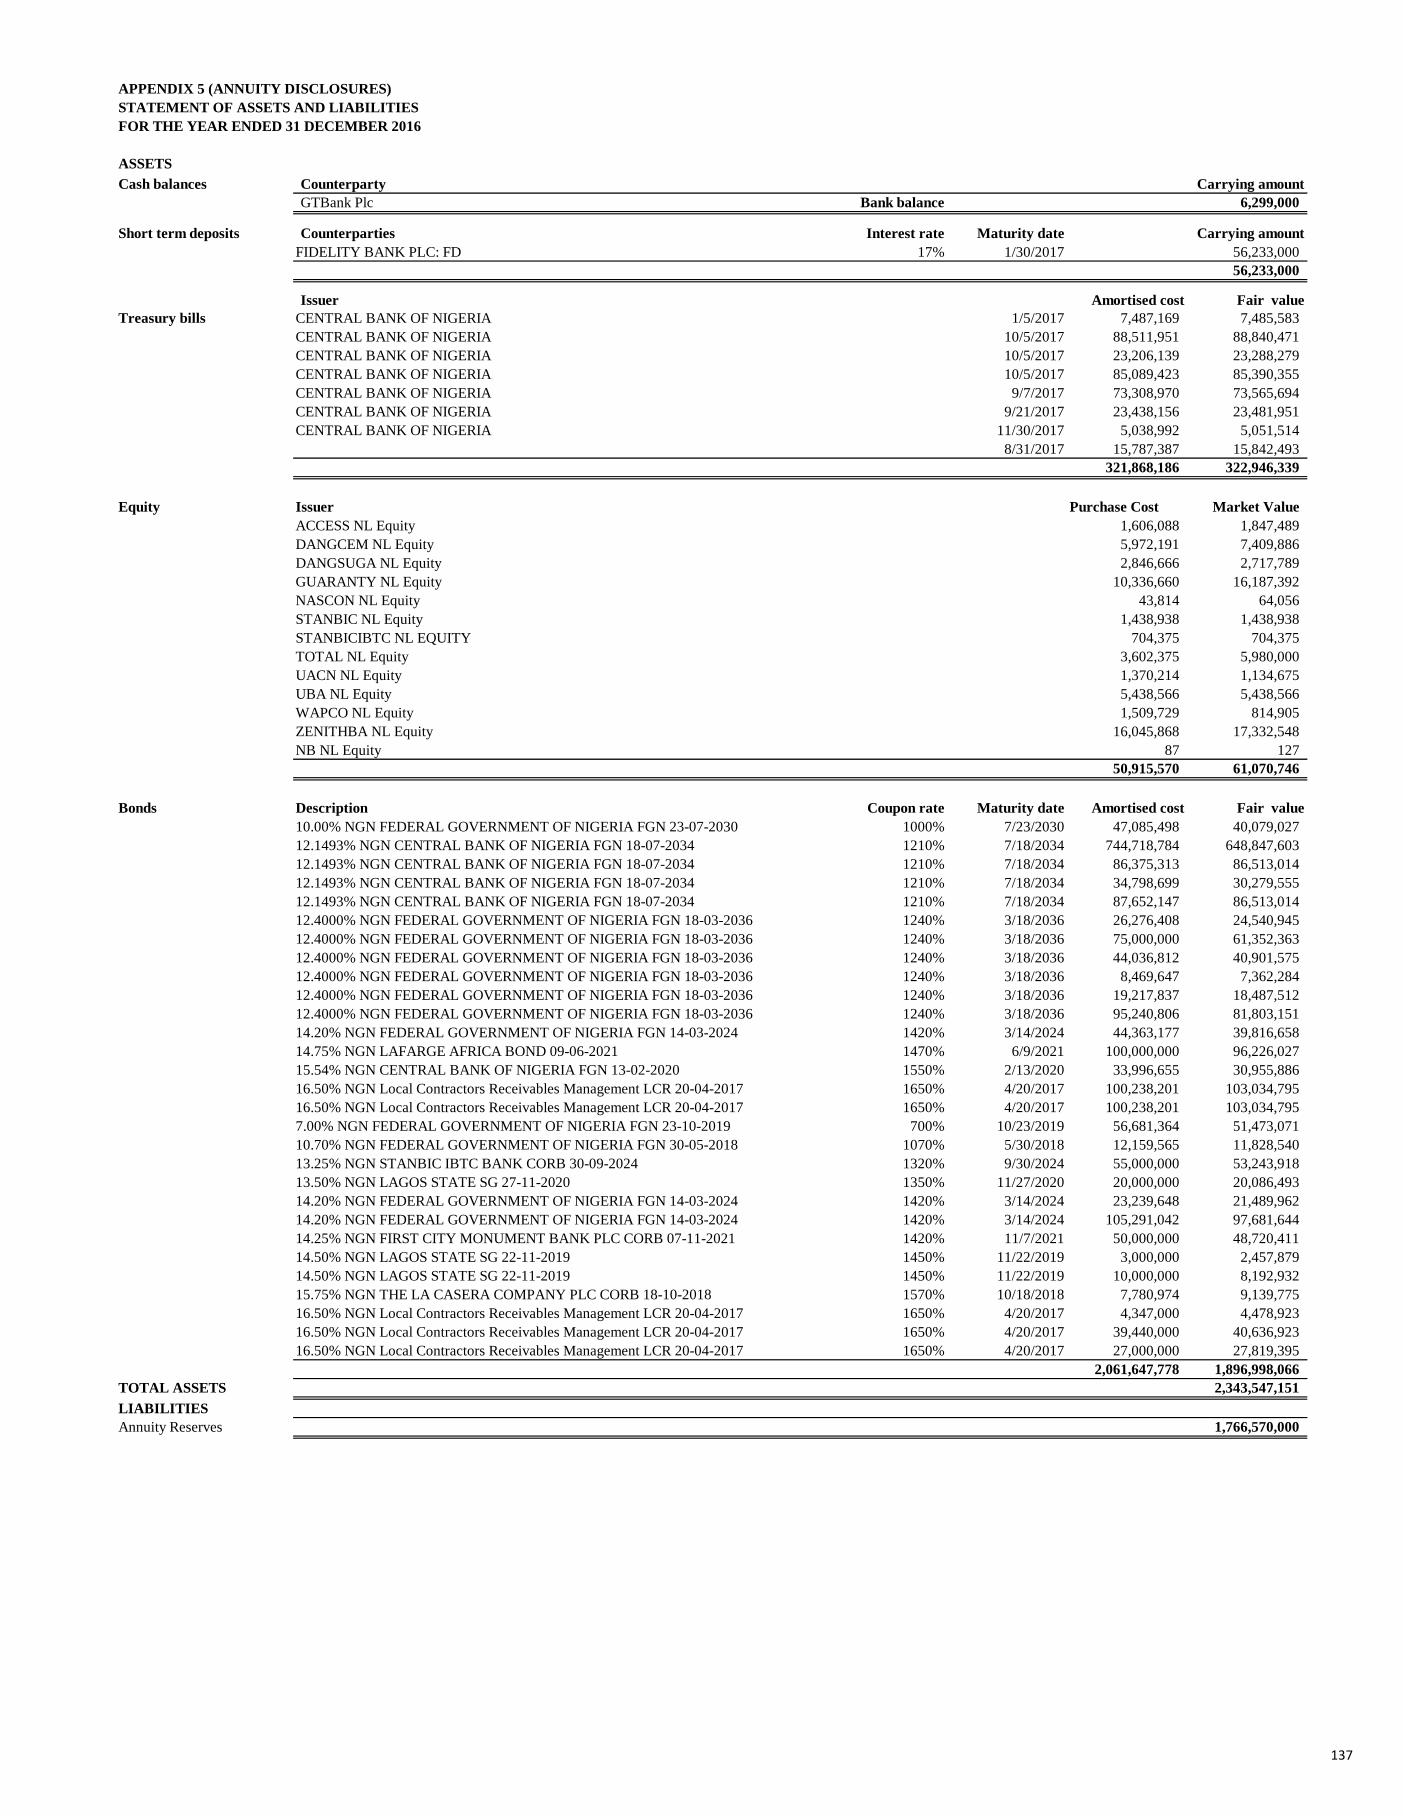
APPENDIX 5 (ANNUITY DISCLOSURES)
STATEMENT OF ASSETS AND LIABILITIES
FOR THE YEAR ENDED 31 DECEMBER 2016
ASSETS
Cash balances Counterparty Carrying amount
GTBank Plc Bank balance 6,299,000
Short term deposits Counterparties Interest rate Maturity date Carrying amount
FIDELITY BANK PLC: FD 17% 1/30/2017 56,233,000
56,233,000
Issuer Amortised cost Fair value
Treasury bills CENTRAL BANK OF NIGERIA 1/5/2017 7,487,169 7,485,583
CENTRAL BANK OF NIGERIA 10/5/2017 88,511,951 88,840,471
CENTRAL BANK OF NIGERIA 10/5/2017 23,206,139 23,288,279
CENTRAL BANK OF NIGERIA 10/5/2017 85,089,423 85,390,355
CENTRAL BANK OF NIGERIA 9/7/2017 73,308,970 73,565,694
CENTRAL BANK OF NIGERIA 9/21/2017 23,438,156 23,481,951
CENTRAL BANK OF NIGERIA 11/30/2017 5,038,992 5,051,514
8/31/2017 15,787,387 15,842,493
321,868,186 322,946,339
Equity Issuer Purchase Cost Market Value
ACCESS NL Equity 1,606,088 1,847,489
DANGCEM NL Equity 5,972,191 7,409,886
DANGSUGA NL Equity 2,846,666 2,717,789
GUARANTY NL Equity 10,336,660 16,187,392
NASCON NL Equity 43,814 64,056
STANBIC NL Equity 1,438,938 1,438,938
STANBICIBTC NL EQUITY 704,375 704,375
TOTAL NL Equity 3,602,375 5,980,000
UACN NL Equity 1,370,214 1,134,675
UBA NL Equity 5,438,566 5,438,566
WAPCO NL Equity 1,509,729 814,905
ZENITHBA NL Equity 16,045,868 17,332,548
NB NL Equity 87 127
50,915,570 61,070,746
Bonds Description Coupon rate Maturity date Amortised cost Fair value
10.00% NGN FEDERAL GOVERNMENT OF NIGERIA FGN 23-07-2030 1000% 7/23/2030 47,085,498 40,079,027
12.1493% NGN CENTRAL BANK OF NIGERIA FGN 18-07-2034 1210% 7/18/2034 744,718,784 648,847,603
12.1493% NGN CENTRAL BANK OF NIGERIA FGN 18-07-2034 1210% 7/18/2034 86,375,313 86,513,014
12.1493% NGN CENTRAL BANK OF NIGERIA FGN 18-07-2034 1210% 7/18/2034 34,798,699 30,279,555
12.1493% NGN CENTRAL BANK OF NIGERIA FGN 18-07-2034 1210% 7/18/2034 87,652,147 86,513,014
12.4000% NGN FEDERAL GOVERNMENT OF NIGERIA FGN 18-03-2036 1240% 3/18/2036 26,276,408 24,540,945
12.4000% NGN FEDERAL GOVERNMENT OF NIGERIA FGN 18-03-2036 1240% 3/18/2036 75,000,000 61,352,363
12.4000% NGN FEDERAL GOVERNMENT OF NIGERIA FGN 18-03-2036 1240% 3/18/2036 44,036,812 40,901,575
12.4000% NGN FEDERAL GOVERNMENT OF NIGERIA FGN 18-03-2036 1240% 3/18/2036 8,469,647 7,362,284
12.4000% NGN FEDERAL GOVERNMENT OF NIGERIA FGN 18-03-2036 1240% 3/18/2036 19,217,837 18,487,512
12.4000% NGN FEDERAL GOVERNMENT OF NIGERIA FGN 18-03-2036 1240% 3/18/2036 95,240,806 81,803,151
14.20% NGN FEDERAL GOVERNMENT OF NIGERIA FGN 14-03-2024 1420% 3/14/2024 44,363,177 39,816,658
14.75% NGN LAFARGE AFRICA BOND 09-06-2021 1470% 6/9/2021 100,000,000 96,226,027
15.54% NGN CENTRAL BANK OF NIGERIA FGN 13-02-2020 1550% 2/13/2020 33,996,655 30,955,886
16.50% NGN Local Contractors Receivables Management LCR 20-04-2017 1650% 4/20/2017 100,238,201 103,034,795
16.50% NGN Local Contractors Receivables Management LCR 20-04-2017 1650% 4/20/2017 100,238,201 103,034,795
7.00% NGN FEDERAL GOVERNMENT OF NIGERIA FGN 23-10-2019 700% 10/23/2019 56,681,364 51,473,071
10.70% NGN FEDERAL GOVERNMENT OF NIGERIA FGN 30-05-2018 1070% 5/30/2018 12,159,565 11,828,540
13.25% NGN STANBIC IBTC BANK CORB 30-09-2024 1320% 9/30/2024 55,000,000 53,243,918
13.50% NGN LAGOS STATE SG 27-11-2020 1350% 11/27/2020 20,000,000 20,086,493
14.20% NGN FEDERAL GOVERNMENT OF NIGERIA FGN 14-03-2024 1420% 3/14/2024 23,239,648 21,489,962
14.20% NGN FEDERAL GOVERNMENT OF NIGERIA FGN 14-03-2024 1420% 3/14/2024 105,291,042 97,681,644
14.25% NGN FIRST CITY MONUMENT BANK PLC CORB 07-11-2021 1420% 11/7/2021 50,000,000 48,720,411
14.50% NGN LAGOS STATE SG 22-11-2019 1450% 11/22/2019 3,000,000 2,457,879
14.50% NGN LAGOS STATE SG 22-11-2019 1450% 11/22/2019 10,000,000 8,192,932
15.75% NGN THE LA CASERA COMPANY PLC CORB 18-10-2018 1570% 10/18/2018 7,780,974 9,139,775
16.50% NGN Local Contractors Receivables Management LCR 20-04-2017 1650% 4/20/2017 4,347,000 4,478,923
16.50% NGN Local Contractors Receivables Management LCR 20-04-2017 1650% 4/20/2017 39,440,000 40,636,923
16.50% NGN Local Contractors Receivables Management LCR 20-04-2017 1650% 4/20/2017 27,000,000 27,819,395
2,061,647,778 1,896,998,066
TOTAL ASSETS 2,343,547,151
LIABILITIES
Annuity Reserves 1,766,570,000
137
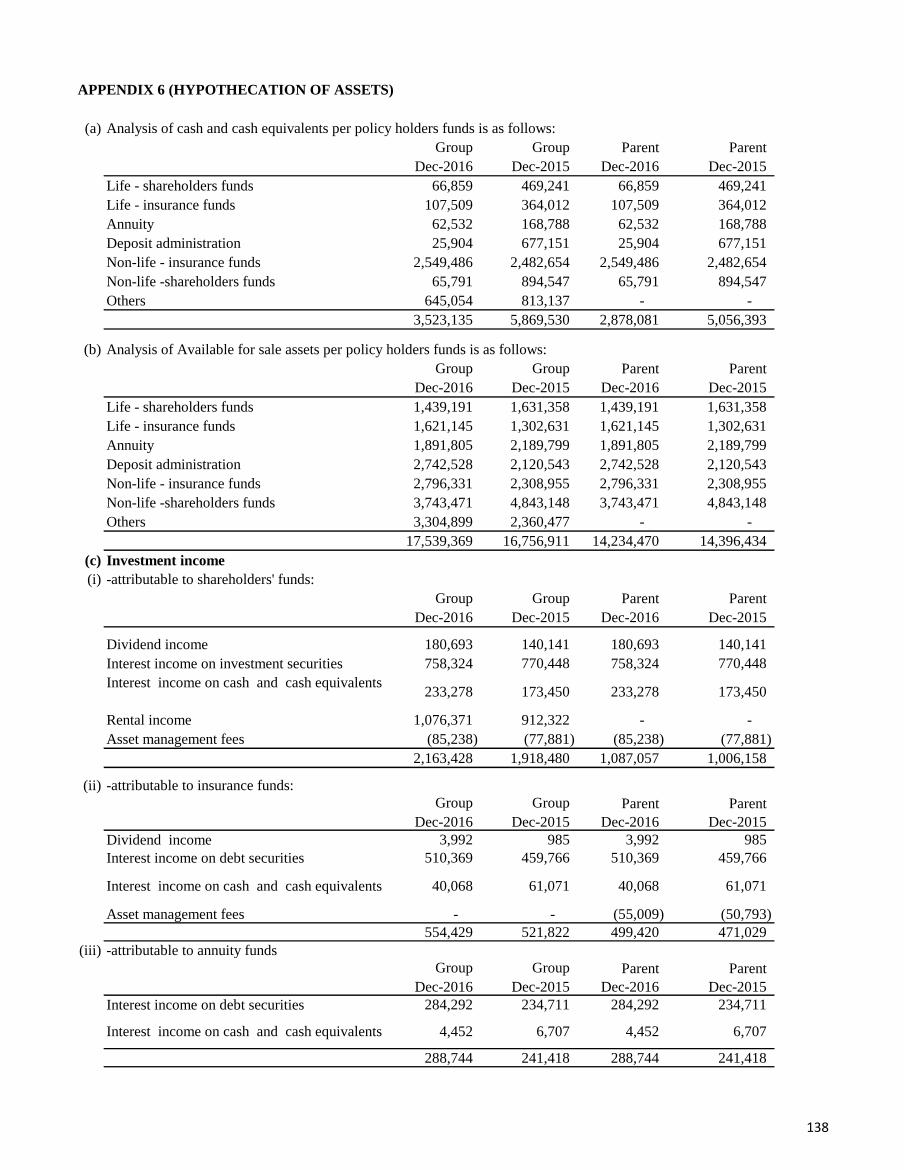
APPENDIX 6 (HYPOTHECATION OF ASSETS)
(a) Analysis of cash and cash equivalents per policy holders funds is as follows:
Group Group Parent Parent
Dec-2016 Dec-2015 Dec-2016 Dec-2015
Life - shareholders funds 66,859 469,241 66,859 469,241
Life - insurance funds 107,509 364,012 107,509 364,012
Annuity 62,532 168,788 62,532 168,788
Deposit administration 25,904 677,151 25,904 677,151
Non-life - insurance funds 2,549,486 2,482,654 2,549,486 2,482,654
Non-life -shareholders funds 65,791 894,547 65,791 894,547
Others 645,054 813,137 - -
3,523,135 5,869,530 2,878,081 5,056,393
(b) Analysis of Available for sale assets per policy holders funds is as follows:
Group Group Parent Parent
Dec-2016 Dec-2015 Dec-2016 Dec-2015
Life - shareholders funds 1,439,191 1,631,358 1,439,191 1,631,358
Life - insurance funds 1,621,145 1,302,631 1,621,145 1,302,631
Annuity 1,891,805 2,189,799 1,891,805 2,189,799
Deposit administration 2,742,528 2,120,543 2,742,528 2,120,543
Non-life - insurance funds 2,796,331 2,308,955 2,796,331 2,308,955
Non-life -shareholders funds 3,743,471 4,843,148 3,743,471 4,843,148
Others 3,304,899 2,360,477 - -
17,539,369 16,756,911 14,234,470 14,396,434
(c) Investment income
(i) -attributable to shareholders' funds:
Group Group Parent Parent
Dec-2016 Dec-2015 Dec-2016 Dec-2015
Dividend income 180,693 140,141 180,693 140,141
Interest income on investment securities 758,324 770,448 758,324 770,448
Interest income on cash and cash equivalents233,278 173,450 233,278 173,450
Rental income 1,076,371 912,322 - -
Asset management fees (85,238) (77,881) (85,238) (77,881)
2,163,428 1,918,480 1,087,057 1,006,158
(ii) -attributable to insurance funds:
Group Group Parent Parent
Dec-2016 Dec-2015 Dec-2016 Dec-2015
Dividend income 3,992 985 3,992 985
Interest income on debt securities 510,369 459,766 510,369 459,766
Interest income on cash and cash equivalents 40,068 61,071 40,068 61,071
Asset management fees - - (55,009) (50,793)
554,429 521,822 499,420 471,029
(iii) -attributable to annuity funds
Group Group Parent Parent
Dec-2016 Dec-2015 Dec-2016 Dec-2015
Interest income on debt securities 284,292 234,711 284,292 234,711
Interest income on cash and cash equivalents 4,452 6,707 4,452 6,707
288,744 241,418 288,744 241,418
138