
Automatic Recognition of Atypical Lymphoid Cells From...
9
168 Am J Clin Pathol 2015;143:168-176 DOI: 10.1309/AJCP78IFSTOGZZJN © American Society for Clinical Pathology AJCP / Original Article Automatic Recognition of Atypical Lymphoid Cells From Peripheral Blood by Digital Image Analysis Santiago Alférez, 1 Anna Merino, MD, PhD, 2 Laura Bigorra, 1,2 Luis Mujica, PhD, 1 Magda Ruiz, PhD, 1 and Jose Rodellar, PhD 1 From the 1 Universitat Politècnica de Catalunya, Barcelona, Spain, and 2 Department of Hemotherapy-Hemostasis, Hospital Clinic, Barcelona, Spain. Key Words: Atypical lymphoid cells; Hematologic cytology; Digital image processing; Automatic cell classification; Peripheral blood; Morphologic analysis Am J Clin Pathol February 2015;143:168-176 DOI: 10.1309/AJCP78IFSTOGZZJN ABSTRACT Objectives: The objective was the development of a method for the automatic recognition of different types of atypical lymphoid cells. Methods: In the method development, a training set (TS) of 1,500 lymphoid cell images from peripheral blood was used. To segment the images, we used clustering of color components and watershed transformation. In total, 113 features were extracted for lymphocyte recognition by linear discriminant analysis (LDA) with a 10-fold cross-validation over the TS. Then, a new validation set (VS) of 150 images was used, performing two steps: (1) tuning the LDA classifier using the TS and (2) classifying the VS in the different lymphoid cell types. Results: The segmentation algorithm was very effective in separating the cytoplasm, nucleus, and peripheral zone around the cell. From them, descriptive features were extracted and used to recognize the different lymphoid cells. The accuracy for the classification in the TS was 98.07%. The precision, sensitivity, and specificity values were above 99.7%, 97.5%, and 98.6%, respectively. The accuracy of the classification in the VS was 85.33%. Conclusions: The method reaches a high precision in the recognition of five different types of lymphoid cells and could allow for the design of a diagnosis support tool in the future. The timely detection of lymphoma and leukemia cells is necessary to provide patients with an adequate treatment that is decisive for their prognosis. Frequently, the blood smear provides the primary or only evidence for a specific diagnosis, remaining an important diagnostic tool even in the age of molecular analysis. 1,2 In the World Health Orga- nization classification, atypical cell morphology, along with immunophenotype and genetic changes, remains essential in defining lymphoid neoplasms. 3 Morphologic distinction between various lymphoid cell types requires experience and skill; moreover, objective values do not exist to define cytologic variables. Chronic lymphocytic leukemia (CLL) cells are typically small lymphocytes with clumped chroma- tin and scant cytoplasm. Hairy cells are larger than normal lymphocytes (N), and they have an abundant weakly baso- philic cytoplasm with irregular “hairy” margins. However, subtle differences in morphologic characteristics exhibited by some lymphoma and leukemia cells lead to a significant Upon completion of this activity you will be able to: • list and describe the main steps involved in the automation of the lymphoid cell classification process. • describe the methods used for feature extraction and analysis in the classification process reported. • recognize the outcome of the classification process and its practical value. The ASCP is accredited by the Accreditation Council for Continuing Medical Education to provide continuing medical education for physicians. The ASCP designates this journal-based CME activity for a maximum of 1 AMA PRA Category 1 Credit ™ per article. Physicians should claim only the credit commensurate with the extent of their participation in the activ- ity. This activity qualifies as an American Board of Pathology Maintenance of Certification Part II Self-Assessment Module. The authors of this article and the planning committee members and staff have no relevant financial relationships with commercial interests to disclose. Questions appear on p 305. Exam is located at www.ascp.org/ajcpcme. by guest on February 21, 2016 http://ajcp.oxfordjournals.org/ Downloaded from
Transcript of Automatic Recognition of Atypical Lymphoid Cells From...

168 Am J Clin Pathol 2015;143:168-176 DOI: 10.1309/AJCP78IFSTOGZZJN
© American Society for Clinical Pathology
AJCP / Original Article
Automatic Recognition of Atypical Lymphoid Cells From Peripheral Blood by Digital Image Analysis
Santiago Alférez,1 Anna Merino, MD, PhD,2 Laura Bigorra,1,2 Luis Mujica, PhD,1 Magda Ruiz, PhD,1 and Jose Rodellar, PhD1
From the 1Universitat Politècnica de Catalunya, Barcelona, Spain, and 2Department of Hemotherapy-Hemostasis, Hospital Clinic, Barcelona, Spain.
Key Words: Atypical lymphoid cells; Hematologic cytology; Digital image processing; Automatic cell classification; Peripheral blood; Morphologic analysis
Am J Clin Pathol February 2015;143:168-176
DOI: 10.1309/AJCP78IFSTOGZZJN
ABSTRACT
Objectives: The objective was the development of a method for the automatic recognition of different types of atypical lymphoid cells.
Methods: In the method development, a training set (TS) of 1,500 lymphoid cell images from peripheral blood was used. To segment the images, we used clustering of color components and watershed transformation. In total, 113 features were extracted for lymphocyte recognition by linear discriminant analysis (LDA) with a 10-fold cross-validation over the TS. Then, a new validation set (VS) of 150 images was used, performing two steps: (1) tuning the LDA classifier using the TS and (2) classifying the VS in the different lymphoid cell types.
Results: The segmentation algorithm was very effective in separating the cytoplasm, nucleus, and peripheral zone around the cell. From them, descriptive features were extracted and used to recognize the different lymphoid cells. The accuracy for the classification in the TS was 98.07%. The precision, sensitivity, and specificity values were above 99.7%, 97.5%, and 98.6%, respectively. The accuracy of the classification in the VS was 85.33%.
Conclusions: The method reaches a high precision in the recognition of five different types of lymphoid cells and could allow for the design of a diagnosis support tool in the future.
The timely detection of lymphoma and leukemia cells is necessary to provide patients with an adequate treatment that is decisive for their prognosis. Frequently, the blood smear provides the primary or only evidence for a specific diagnosis, remaining an important diagnostic tool even in the age of molecular analysis.1,2 In the World Health Orga-nization classification, atypical cell morphology, along with immunophenotype and genetic changes, remains essential in defining lymphoid neoplasms.3 Morphologic distinction between various lymphoid cell types requires experience and skill; moreover, objective values do not exist to define cytologic variables. Chronic lymphocytic leukemia (CLL) cells are typically small lymphocytes with clumped chroma-tin and scant cytoplasm. Hairy cells are larger than normal lymphocytes (N), and they have an abundant weakly baso-philic cytoplasm with irregular “hairy” margins. However, subtle differences in morphologic characteristics exhibited by some lymphoma and leukemia cells lead to a significant
Upon completion of this activity you will be able to:• list and describe the main steps involved in the automation of the
lymphoid cell classification process.•describe the methods used for feature extraction and analysis in the
classification process reported.• recognize the outcome of the classification process and its practical
value.
The ASCP is accredited by the Accreditation Council for Continuing Medical Education to provide continuing medical education for physicians. The ASCP designates this journal-based CME activity for a maximum of 1 AMA PRA Category 1 Credit ™ per article. Physicians should claim only the credit commensurate with the extent of their participation in the activ-ity. This activity qualifies as an American Board of Pathology Maintenance of Certification Part II Self-Assessment Module.
The authors of this article and the planning committee members and staff have no relevant financial relationships with commercial interests to disclose.
Questions appear on p 305. Exam is located at www.ascp.org/ajcpcme.
by guest on February 21, 2016http://ajcp.oxfordjournals.org/
Dow
nloaded from
AJCP / Original Article
Am J Clin Pathol 2015;143:168-176 169 DOI: 10.1309/AJCP78IFSTOGZZJN
© American Society for Clinical Pathology
number of false negatives in the routine screening. More-over, additional studies are expensive and time-consuming. This is why having an automated screening imaging system for decision support could reduce the cost and morbidity for patients.
The close collaboration between cytologists, mathema-ticians, and engineers over the past few years has made possible the development of automatic methods for digital image processing of normal blood cells. Some equipment is able to preclassify cells in different categories by applying neural networks and extracting a large number of measure-ments and parameters that describe the most significant cell morphologic characteristics.4 These systems, when integrated into the daily workload, represent an interesting technological advance since they are able to preclassify most of the normal blood cells in peripheral blood (PB).5,6
Atypical lymphoid cells are the most difficult patho-logic cells to classify by using morphologic features only.7 Few studies about automatic recognition of different atypical lymphoid cells with satisfactory results have been published. In most previous studies, the lymphoid cell classification has been addressed with pattern recognition systems to sepa-rate the cells into categories.8-11 Nevertheless, the image-processing techniques used in these works are not useful for
current digital images, since the present acquisition technol-ogy is based on charge-coupled device sensors.8
Among the difficulties of overcoming the automation of the lymphoid cell classification process from their morpho-logic characteristics, the most relevant are (1) to accurately solve the cell segmentation problem, which means separat-ing the cells of interest from the whole image; (2) to obtain descriptive features from the cells of interest, which allows high accuracy during the classification step; and (3) to train a classifier to distinguish accurately among the different lym-phoid subtypes.12,13 This article presents a complete method for lymphocyte recognition to allow the automatic classifica-tion of normal and four atypical lymphoid cells circulating in PB in mature B-cell lymphoid neoplasms.
Materials and Methods
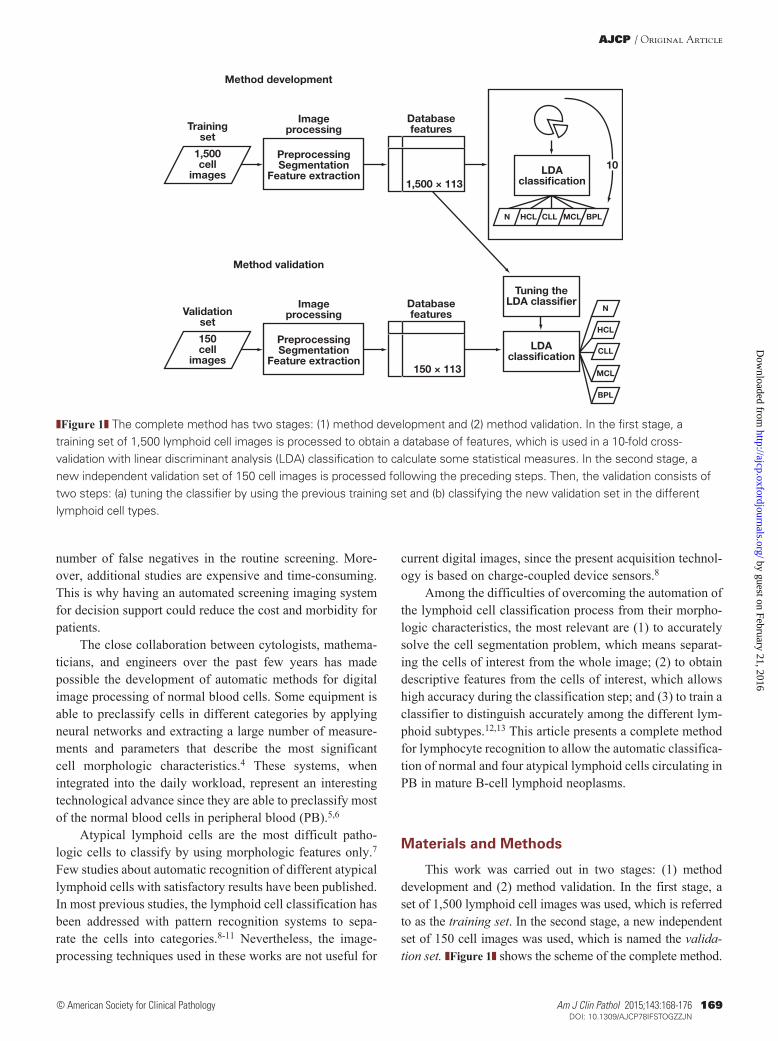
This work was carried out in two stages: (1) method development and (2) method validation. In the first stage, a set of 1,500 lymphoid cell images was used, which is referred to as the training set. In the second stage, a new independent set of 150 cell images was used, which is named the valida-tion set. ❚Figure 1❚ shows the scheme of the complete method.
Method development
Trainingset
1,500cell
images
Imageprocessing
PreprocessingSegmentation
Feature extraction1,500 × 113
Databasefeatures
LDAclassi�cation
10
N HCL CLL MCL BPL
Method validation
Validationset
150cell
images
Imageprocessing
PreprocessingSegmentation
Feature extraction150 × 113
Databasefeatures
LDAclassi�cation
Tuning theLDA classi�er
N
HCL
CLL
MCL
BPL
❚Figure 1❚ The complete method has two stages: (1) method development and (2) method validation. In the first stage, a training set of 1,500 lymphoid cell images is processed to obtain a database of features, which is used in a 10-fold cross-validation with linear discriminant analysis (LDA) classification to calculate some statistical measures. In the second stage, a new independent validation set of 150 cell images is processed following the preceding steps. Then, the validation consists of two steps: (a) tuning the classifier by using the previous training set and (b) classifying the new validation set in the different lymphoid cell types.
by guest on February 21, 2016http://ajcp.oxfordjournals.org/
Dow
nloaded from

Alférez et al / Automatic Recognition of Atypical Lymphoid Cells by Digital Image Analysis
170 Am J Clin Pathol 2015;143:168-176 DOI: 10.1309/AJCP78IFSTOGZZJN
© American Society for Clinical Pathology
Method DevelopmentThe method to achieve the automatic recognition
of lymphoid cells was performed through the following steps:
Blood Sample Preparation and Digital Image AcquisitionSamples from healthy donors and patients with CLL,
hairy cell leukemia (HCL), and mantle cell lymphoma (MCL) were included in this study. The diagnoses were established by clinical and morphologic findings as well as the characteristic immunophenotype of the lymphoid cells. Specifically, CLL cells had the following phenotype: CD5+, CD19+, CD23+, CD25+, weak CD20+, CD10–, FMC7–, and dim surface immunoglobulin expression. All patients with HCL had lymphoid cells with the following phenotype: CD11c+, CD25+, FMC7+, CD103+, and CD123+. Patients with MCL showed lymphoid cells with the following phenotype: CD5+, FMC7+, CD43+, CD10–, and BCL6–. B-prolymphocyte (BPL) images were obtained from trans-formed CLL.
Blood samples were obtained from the routine workload of the Core Laboratory of the Hospital Clinic of Barcelona. Venous blood was collected into tubes containing K3EDTA as an anticoagulant. Samples were analyzed by a cell counter (Advia 2120; Siemens Healthcare Diagnosis, Deerfield, IL), and PB films were automatically stained with May-Grün-wald-Giemsa in the SP1000i (Sysmex, Japan, Kobe) within 4 hours of blood collection.
Individual lymphoid cell images from PB had a resolu-tion of 363 × 360 pixels and were obtained by the CellaVi-sion DM96 system (CellaVision AB, Lund, Sweden). The quality of the smears and cell morphology was assessed by clinical pathologists (A.M. and L.B.) prior to the image study.
A training set of 1,500 lymphoid cell images from PB films was selected to evaluate the accuracy of our method. They were distributed as follows: 181 normal lymphocytes from healthy patients, 301 HCLs, 401 MCLs, and 617 CLLs. This group was divided into 542 CLL clumped chromatin typical lymphocyte images and 75 BPL images.
Clustering Color SegmentationThrough the segmentation step, lymphoid cells were
separated from other objects in the image.14-17 In this work, to segment the cells, we performed clustering by spatial kernel fuzzy c-means18-20 over the XYZ and CMYK color spaces and implemented the watershed trans-formation (WT)12,21 by obtaining three regions for each cell: (1) cell region, (2) nucleus region, and (3) peripheral zone around the cell. The cytoplasm region was obtained by the difference between the regions of the whole cell and the nucleus.
Feature ExtractionThe objective of this step was to obtain quantitative informa-
tion about the objects in the image under analysis. In the present work, 113 features were used related respectively to geometry (10), color and texture (102), and cytoplasm external profile (1). ❚Table 1❚ shows the distinct categories of the features that we used in this work. They are summarized as follows:
Geometric features. Geometric features were calculated for each individual cell as described in a previous study by the authors.12 These features are quantitative geometric interpretations of morphologic characteristics such as the size and the shape of both nucleus and cell, as well as the nucleus/cytoplasm ratio.
Color and texture features. We applied first-order statis-tical features (based on the histogram of each color compo-nent),22 second-order statistical features,23 and granulometri-cal features,24 which were described in the previous work.12 In addition, the novelty in this work was to apply them over the nucleus and the cytoplasm for each component of the Lab color space to extract new features.
❚Table 1❚Set of 113 Lymphoid Cell Features Extracted in the Method Described in This StudyFeature Description Quantitative Feature
Geometric features (n = 10)
Cell area Cell diameterCell conic eccentricity Cell perimeterNucleus area Nucleus diameterNucleus conic eccentricity
Nucleus perimeter
Nucleus/cytoplasm ratioNucleus eccentricity with respect to the cytoplasm
Color and texture features (n = 102)a
Cytoplasm Nucleus
First-order statistical features (12 × 3)b
Mean MeanStandard deviation Standard deviationSkewness SkewnessKurtosis KurtosisEnergy Energy Entropy Entropy
Second-order statistical features (14 × 3)b
Contrast Contrast Homogeneity HomogeneityCorrelation CorrelationEnergy EnergyEntropy EntropyVariance VarianceDifference variance Difference variance
Granulometrical features (8 × 3)b (based on granulometrical curve)
Mean MeanStandard deviation Standard deviationSkewness SkewnessKurtosis Kurtosis
Cytoplasmic profile feature (n = 1)
Estimation of the hairy projections
a Color and texture features were applied to the nucleus and cytoplasm for each component of the Lab color space.
b (No. of features × 3 color components): every feature was calculated over the three color components L, a, and b.
by guest on February 21, 2016http://ajcp.oxfordjournals.org/
Dow
nloaded from

AJCP / Original Article
Am J Clin Pathol 2015;143:168-176 171 DOI: 10.1309/AJCP78IFSTOGZZJN
© American Society for Clinical Pathology
Cytoplasmic profile feature. This feature was extracted to characterize the cytoplasm profile. It estimates the projec-tions of the cytoplasm using the peripheral region around the segmented cell. The cytoplasmic profile feature is obtained by using threshold segmentation to the green component and counting the pixels of this region.12
All features were stored in a numerical data matrix, which was used as the input data for the classification step.
Feature AnalysisThe objective of this step was to determine the most
relevant features for each cell type, which was achieved within the context of the information theory feature selec-tion by using the so-called conditional mutual information criteria.25,26
Principal component analysis (PCA) was used as a tool to visualize in a compact way all features stored in the data matrix of 1,500 (cell images) × 113 (features). PCA is a tech-nique that is commonly used to reduce the dimensionality of a big data set by its transformation into a new set of principal components linearly uncorrelated, searching the causes of variability and sorting the components by their importance.27
The above methods were not used in the classification step, but they were very useful in analyzing and visualizing the high number of data features.
ClassificationThe aim of this step was to obtain the automatic
recognition of normal and different types of atypical lymphoid cells from PB using the supervised classification method called linear discriminant analysis (LDA).28,29
To assess the efficiency of the proposed method, we performed a 10-fold cross-validation technique over the training set of 1,500 lymphoid cells. This technique randomly divides the data set into 10 equal-size subsets. A single subset is used as the testing data, while the remaining data are used for training. Then, the process is repeated 10 times. Finally, a confusion matrix is obtained to calculate some overall statistical measures.
Method ValidationTo validate the method, we included an independent
validation set of 150 new lymphoid cell images distributed as follows: 34 normal lymphocytes, 19 HCLs, 37 MCLs, 30 CLLs, and 30 BPLs. These images were acquired and seg-mented, and their features were extracted precisely through the same steps previously used for the training set. Next, the validation of the method consisted of performing the LDA technique in two steps: (1) tuning the classifier using the previous training set and (2) classifying the new validation set in the different lymphoid cell types.
Results
The developed segmentation algorithm was very effec-tive in separating three different regions of the cell image: cytoplasm, nucleus, and peripheral zone around the cell. This procedure is an essential part of the method to ensure the success of the final classification step. ❚Image 1❚ shows different examples of the segmentation step obtained in dif-ferent normal and atypical lymphoid cell images from PB.
For the classification, we used the 113 features men-tioned earlier and listed in Table 1. In addition, using infor-mation theory feature selection, we identified the 10 most ranked features by relevance and interdependence for each cell type. The two most important features were among the geometric ones: (1) cell perimeter and (2) nucleus/cytoplasm ratio. The remaining eight were color and texture features: (3) SD of the granulometrical curve of the L component of the nucleus, (4) mean of the b component of the nucleus, (5) SD of the b component of the cytoplasm, (6) entropy (first-order statistical) of the a component of the nucleus, (7) correlation of the L component of the nucleus, (8) homoge-neity of the a component of the nucleus, (9) kurtosis of the L component of the nucleus, and (10) eccentricity of the cell.
❚Figure 2❚ shows the first and second principal compo-nents derived from the whole set of 113 features obtained by PCA dimension reduction. It can be observed that the
❚Image 1❚ Segmentation results obtained in some images of lymphoid cells from peripheral blood: normal lymphocyte (N), hairy cell leukemia (HCL), chronic lymphocytic leukemia (CLL), mantle cell lymphoma (MCL), and B-prolymphocyte (BPL). The outer line delimits the cell from the external area; the middle line corresponds to the cytoplasm margin and the inner line to the nucleus perimeter (May-Grünwald-Giemsa, ×1,000).
by guest on February 21, 2016http://ajcp.oxfordjournals.org/
Dow
nloaded from

Alférez et al / Automatic Recognition of Atypical Lymphoid Cells by Digital Image Analysis
172 Am J Clin Pathol 2015;143:168-176 DOI: 10.1309/AJCP78IFSTOGZZJN
© American Society for Clinical Pathology
value was 94.7%, with an SD of 6.9%. All the specificity values were above 98.6%, with their SDs lower than 0.9%.
❚Image 2❚ shows some images corresponding to the dif-ferent lymphoid subtype classification results using the last fold of our first experiment. Each row corresponds to a dif-ferent lymphoid cell type (N, HCL, CLL, MCL, and BPL).
Validation of the Method❚Table 3❚ shows the classification results (confusion
matrix) in which the five-class classification accuracy was 85.33%. True-positive rates for each cell subtype were 94.12% for normal lymphoid cells, 94.74% for HCLs, 80.0% for CLLs, 89.19% for MCLs, and 70.0% for BPL.
Discussion
Morphologic examination of PB cells is the first ana-lytical step in the hematologic diagnosis, and it is a truly useful aid for the indication of further necessary tests. Since atypical lymphoid cells are the most difficult to be classi-fied using only morphologic features,7 the major goal of this work was to design a method combining segmentation, feature extraction, and classification algorithms that could be useful as a diagnosis support tool.
Cell morphology is susceptible to variations in the slide-making and staining process. With the aim of decreasing that variation, we obtained the images by a standard and repro-ducible method using automatic staining and the CellaVision DM96 analyzer (CellaVision AB). This equipment can scan the slides identifying different types of WBCs by artificial neural networks,4,5 but it is not able to separate the diverse atypical lymphoid cells circulating in PB.30
Normal and four atypical (CLL, HCL, MCL, and BPL) lymphoid cells were selected due to their characteristic mor-phology, and a high number were collected from the daily workload in our laboratory.
different subtypes of lymphoid cells presented a different position according to these principal components. CLL cells showed a PCA pattern more similar with respect to normal lymphocytes but very different with respect to HCL cells and BPL.
Method Performance EvaluationThe 1,500 cell images of the training set were classified
using LDA with 10-fold cross-validation. ❚Table 2❚ shows these results (confusion matrix), in which the rows represent the true diagnosis supplied by clinicians and the columns the predicted diagnosis given by the classification algorithm for each type of lymphoid cell. Every row was normalized with respect to the total number of cells of its respective type to represent the percentages with respect to the true diagnosis. The five-class classification accuracy was 98.07%, and we also calculated its SD to measure the variability between folds, which was 0.80%. Diagonal values were the true-pos-itive rates for each cell subtype, showing values of 99.45% for normal lymphoid cells, 97.67% for HCL, 98.71% for CLL, 97.5% for MCL, and 94.67% for BPL.
❚Figure 3❚ shows some statistical measurements of the five-type classification. Most of the precision values were above 99.7%, with their respective SDs lower than 1%, except for N and BPL cells, which presented values above 88.8% and SDs lower than 9.6%. Most of the sensitivity values were above 97.5%, with their SDs lower than 2%, while the BPL
–10,000
–8,000
–6,000
–4,000
–2,000
0
2,000
–1.0 –0.5 –1.0 0.5 1.0 1.5 2.0 2.5
4,000
6,000
HCLMCLCLLNormalBPL
Sec
ond
Pri
ncip
al C
om
po
nent
First Principal Component (× 104)
❚Figure 2❚ First and second principal components of all set of features obtained by principal components analysis (PCA) showing that the different subtypes of lymphoid cells presented a different position, taking into account these principal components of the set of features. Chronic lymphocytic leukemia (CLL) cells showed a similar PCA pattern with respect to normal lymphocytes but very different from hairy cell leukemia (HCL) cells and B-prolymphocytes (BPLs). MCL, mantle cell lymphoma.
❚Table 2❚Confusion Matrix of the LDA Classification and 10-Fold Cross-Validation for the Training Set
Predicted, %a
True N HCL CLL MCL BPL
N 99.45 0.00 0.00 0.00 0.55HCL 1.66 97.67 0.00 0.00 0.67CLL 0.92 0.00 98.71 0.19 0.18MCL 1.25 0.00 0.00 97.50 1.25BPL 4.00 1.33 0.00 0.00 94.67
BPL, B-prolymphocytes; CLL, chronic lymphocytic leukemia; HCL, hairy cell leukemia; LDA, linear discriminant analysis; MCL, mantle cell lymphoma; N, normal lymphocytes.
a The rows represent the true diagnosis and the columns the predicted diagnosis given by the classification algorithm for each type of lymphoid cell. Accuracy = 98.07% and SD = 0.80.
by guest on February 21, 2016http://ajcp.oxfordjournals.org/
Dow
nloaded from

AJCP / Original Article
Am J Clin Pathol 2015;143:168-176 173 DOI: 10.1309/AJCP78IFSTOGZZJN
© American Society for Clinical Pathology
With respect to the segmentation method, some authors have segmented only two regions of the cell (nucleus and cytoplasm).10,31-33 In a previous study,12 we used WT on the green color component to segment three regions (nucleus, cytoplasm, and the peripheral zone around the cell). In that study, the peripheral region of the cell was especially significant because it allowed us to evaluate the external profile of the cytoplasm. In the current study, we have seg-mented these three regions for each lymphoid cell but used the color information of the image instead of only one gray level, which has been very useful to extract the appropriate description about the cell.
Regarding the feature extraction step, Scotti33 calcu-lated only a few geometrical features over the cell, nucleus, and cytoplasm. Other authors calculated geometrical and statistical features of the nucleus.31,32 Angulo et al10 used extensively the granulometry over the luminance compo-nent to compute features for lymphocyte identification. In the current study, we have extended the texture features to multiple color components, obtaining a total of 113 features, combining geometrical, statistical, and granulo-metrical features to analyze the texture of the nucleus and the cytoplasm. This extension has permitted finding a better color and texture description of these regions. Nuclear characteristics are important features in morpho-logic diagnosis. The nuclear staining pattern reflects chro-matin organizations, and in addition, CLL cells typically contain clumped chromatin.34 We have calculated not only the cytoplasm profile feature described for the first time in our previous work12 but also its texture, which has been scarcely analyzed in the literature.
Furthermore, we have demonstrated that the size of the lymphoid cell (perimeter) and the nucleus/cytoplasm ratio are the two main features that comprise the most information regarding the type of cell. We have also found eight other relevant features: six contain information about the nuclear texture, one relates to the cytoplasm, and one concerns cell shape. All above morphologic features have been used in the conventional differential analysis of the cells under the microscope.
Moreover, the whole set of features has been repre-sented by using their two principal components. From the PCA dimension reduction, HCL cells were the subtype most separated from the rest of cells, which corresponds to the differences in the morphology of these cells with respect to the others. CLL cells were located very close to the normal lymphocytes and a portion of the MCL cells, which is in accordance with the subtle morphologic differ-ences between them. However, the classification process was able to separate with high confidence these types of lymphoid cells. Figure 2 shows a group of BPL cells overlapping the group of MCL cells, which is according to
❚Figure 3❚ Precision (A), sensitivity (B), and specificity (C) of the 10-fold cross-validation with linear discriminant analysis classification of the training set. Standard deviations are represented by the lines on the top of the bars. BPL, B-prolymphocyte; CLL, chronic lymphocytic leukemia; HCL, hairy cell leukemia; MCL, mantle cell lymphoma; N, normal lymphocytes.
Cell Type
% P
reci
sio
n
N HCL CLL MCL BPL0
20
40
60
80
100
Cell Type
% S
ensi
tivi
ty
N HCL CLL MCL BPL0
20
40
60
80
100
B
Cell Type
% S
pec
i�ci
ty
N HCL CLL MCL BPL0
20
40
60
80
100
C
A
by guest on February 21, 2016http://ajcp.oxfordjournals.org/
Dow
nloaded from

Alférez et al / Automatic Recognition of Atypical Lymphoid Cells by Digital Image Analysis
174 Am J Clin Pathol 2015;143:168-176 DOI: 10.1309/AJCP78IFSTOGZZJN
© American Society for Clinical Pathology
the morphologic similarities that they share. The separa-tion observed from the PCA plot is an indicator that both segmentation and feature extraction steps have been per-formed satisfactorily.
Concerning the classification process, Angulo et al10 clas-sified the morphologic features of the lymphoid cells in catego-ries using decision trees, but that work was not completed with further studies toward the specific discrimination among dif-ferent groups with a similar diagnosis. In addition, Yang et al35
classified five types of atypical blood cells, but they included precursor lymphoid neoplasms and acute myeloid leukemia blast cells. One of the main contributions of the present work is that the proposed method succeeded in classifying five types of lymphoid cells (normal and mature B-cell neoplasms).
The accuracy of the method has been truly satisfactory, with a very low SD. Precision, sensitivity, and specificity values had excellent values, while they were lower for N and BPL cells because the number of images for these two types
❚Image 2❚ Images corresponding to the different lymphoid subtype classification results using the last fold of our first experiment. Each row corresponds to a different lymphoid cell type: normal lymphocytes (N), hairy cell leukemia (HCL), chronic lymphocytic leukemia (CLL), mantle cell leukemia (MCL), and B-prolymphocytes (BPLs) (May-Grünwald-Giemsa, ×1,000).
by guest on February 21, 2016http://ajcp.oxfordjournals.org/
Dow
nloaded from

AJCP / Original Article
Am J Clin Pathol 2015;143:168-176 175 DOI: 10.1309/AJCP78IFSTOGZZJN
© American Society for Clinical Pathology
of cells was smaller and therefore less representative. More-over, the method has been satisfactorily validated through the classification of an independent validation set using a group of cells from new patients.
In summary, the method presented in this article started with the design of a segmentation procedure to obtain regions of interest in lymphoid cells; from them, descrip-tive features were extracted, and a combination of these characteristics was used in algorithms to classify normal and four different types of atypical lymphoid cells. The con-tribution of this work combining medical, engineering, and mathematical backgrounds is the development of a complete method that could allow the design of a practical diagnosis support tool in the future.
The addition of more features and other classification methods to the described method will allow classifying other types of atypical lymphoid cells. We are progressing with further work in this direction, in an area where this method could be useful in clinical practice.
Address reprint requests to Dr Merino: Dept of Hemotherapy-Hemostasis, CDB, Hospital Clinic of Barcelona, Villarroel 170, 08036 Barcelona, Spain; [email protected].
Acknowledgments: S. Alférez and L. Bigorra acknowledge the Universitat Politècnica de Catalunya for their PhD grants within the Biomedical Engineering Program.
References 1. Houwen B. The differential cell count. Lab Hematol.
2001;7:89-100. 2. Bain BJ. Diagnosis from the blood smear. N Engl J Med.
2005;353:498-507. 3. Swerdlow SH, Campo E, Harris NL, et al, eds. WHO
Classification of Tumours of Haematopoietic and Lymphoid Tissues. 4th ed. Lyon, France: IARC; 2008.
4. Ceelie H, Dinkelaar RB, van Gelder W. Examination of peripheral blood films using automated microscopy: evaluation of Diffmaster Octavia and Cellavision DM96. J Clin Pathol. 2007;60:72-79.
❚Table 3❚Confusion Matrix of the LDA Classification for the Validation Set
Predicted, %a
True N HCL CLL MCL BPL
N 94.12 0.00 0.00 5.88 0.00HCL 0.00 94.74 0.00 0.00 5.26CLL 16.67 0.00 80.00 3.33 0.00MCL 2.70 0.00 0.00 89.19 8.11BPL 0.00 0.00 0.00 30.00 70.00
BPL, B-prolymphocytes; CLL, chronic lymphocytic leukemia; HCL, hairy cell leukemia; LDA, linear discriminant analysis; MCL, mantle cell leukemia; N, normal lymphocytes.
a The rows represent the true diagnosis and the columns the predicted diagnosis given by the classification algorithm for each type of lymphoid cell. Accuracy = 85.33%.
5. Briggs C, Longair I, Slavik M, et al. Can automated blood film analysis replace the manual differential? an evaluation of the CellaVision DM96 automated image analysis system. Int J Lab Hematol. 2009;31:48-60.
6. Briggs C, Culp N, Davis B, et al. ICSH guidelines for the evaluation of blood cell analysers including those used for differential leucocyte and reticulocyte counting [published online March 25, 2014]. Int J Lab Hematol.
7. Gutiérrez G, Merino A, Domingo A, et al. EQAS for peripheral blood morphology in Spain: a 6-year experience. Int J Lab Hematol. 2008;30:460-466.
8. Bergmann M, Heyn H, Müller-Hermelink HK, et al. Automated recognition of cell images in high grade malignant lymphoma and reactive follicular hyperplasia. Anal Cell Pathol. 1990;2:83-95.
9. Sabino DMU, Da Fontoura Costa L, Rizzatti EG, et al. A texture approach to leukocyte recognition. Real Time Imaging. 2004;10:205-216.
10. Angulo J, Klossa J, Flandrin G. Ontology-based lymphocyte population description using mathematical morphology on color blood images. Cell Mol Biol. 2006;52:3-16.
11. Tuzel O, Yang L, Meer P, et al. Classification of hematologic malignancies using texton signatures. Pattern Anal Appl. 2007;10:277-290.
12. Alférez S, Merino A, Mujica LE, et al. Automatic classification of atypical lymphoid B cells using digital blood image processing [published online December 11, 2013]. Int J Lab Hematol.
13. Gonzalez JA, Olmos I, Altamirano L, et al. Leukemia identification from bone marrow cells images using a machine vision and data mining strategy. Intelligent Data Anal. 2011;15:443-462.
14. González RC, Woods RE. Digital Image Processing. Upper Saddle River, NJ: Prentice Hall; 2008.
15. Xu C, Prince JL. Snakes, shapes, and gradient vector flow. IEEE Trans Image Process. 1998;7:359-369.
16. Sadeghian F, Seman Z, Ramli AR, et al. A framework for white blood cell segmentation in microscopic blood images using digital image processing. Biol Proc Online. 2009;11:196-206.
17. Alférez E, Merino A, Mujica L, et al. Morphological features using digital image processing in lymphoid neoplasias [abstract]. Int J Lab Hematol. 2011;33(suppl 1):53.
18. Chen S, Zhang D. Robust image segmentation using FCM with spatial constraints based on new kernel-induced distance measure. IEEE Trans Syst Man Cybern B Cybern. 2004;34:1907-1916.
19. Zhang DQ, Chen SC. A novel kernelized fuzzy c-means algorithm with application in medical image segmentation. Artif Intell Med. 2004;32:37-50.
20. Chuang KS, Tzeng HL, Chen S, et al. Fuzzy c-means clustering with spatial information for image segmentation. Comput Med Imaging Graph. 2006;30:9-15.
21. Beucher S, Meyer F. The morphological approach to segmentation: the watershed transformation. In: Dougherty E, ed. Mathematical Morphology in Image Processing. New York, NY: Marcel Dekker; 1992:433-481.
22. Materka A, Strzeleck M. Texture analysis methods—a review. Technical University of Lodz, Institute of Electronics, COST B11 report, Brussels. 1998. http://www.eletel.p.lodz.pl/programy/cost/pdf_1.pdf. Accessed March 2, 2014.
23. Haralick RM, Shanmugan K, Dinstein I. Textural features for image classification. IEEE Trans Syst Man Cybern. 1973;3:610-621.
by guest on February 21, 2016http://ajcp.oxfordjournals.org/
Dow
nloaded from

Alférez et al / Automatic Recognition of Atypical Lymphoid Cells by Digital Image Analysis
176 Am J Clin Pathol 2015;143:168-176 DOI: 10.1309/AJCP78IFSTOGZZJN
© American Society for Clinical Pathology
24. Angulo JA. Mathematical morphology approach to the analysis of the shape of cells. In: Bonilla LL, Moscoso M, Platero G, et al, eds. Progress in Industrial Mathematics at ECMI 2006. Leganes, Spain: Springer; 2006:543-547.
25. Cheng H, Qin Z, Feng C, et al. Conditional mutual information-based feature selection analyzing for synergy and redundancy. ETRI J. 2011;33:210-218.
26. Brown G, Pocock A, Zhao MJ, et al. Conditional likelihood maximisation: a unifying framework for information theoretic feature selection. J Mach Learn Res. 2012;13:27-66.
27. Jolliffe I. Principal Component Analysis. New York, NY: John Wiley; 2005.
28. Fisher RA. The use of multiple measurements in taxonomic problems. Ann Eugen. 1936;7:179-188.
29. Guo Y, Hastie T, Tibshirani R. Regularized linear discriminant analysis and its application in microarrays. Biostatistics. 2007;8:86-100.
30. Merino A, Brugués R, Garcia R, et al. Comparative study of peripheral blood morphology by conventional microscopy and Cellavision DM96 in hematological and non hematological diseases [abstract]. Int J Lab Hematol. 2011;33(suppl 1):112.
31. Mohapatra S, Samanta SS, Patra D, et al. Fuzzy based blood image segmentation for automated leukemia detection. In: Devices and Communications (ICDeCom), 2011 International Conference on. IEEE; 2011:1-5.
32. Madhloom HT, Kareem SA, Ariffin H. A Robust feature extraction and selection method for the recognition of lymphocytes versus acute lymphoblastic leukemia. In: Advanced Computer Science Applications and Technologies (ACSAT), 2012 International Conference on. IEEE; 2012:330-335.
33. Scotti F. Automatic morphological analysis for acute leukemia identification in peripheral blood microscope images. In: 2005 IEEE International Conference on Computational Intelligence for Measurement Systems and Applications. IEEE; 2005:96-101.
34. Jahanmehr SH, Rogers M, Zheng J, et al. Quantitation of cytological parameters of malignant lymphocytes using computerized image analysis. Int J Lab Hematol. 2008;30:278-285.
35. Yang L, Tuzel O, Chen W, et al. Pathminer: a web-based tool for computer-assisted diagnostics in pathology. IEEE Trans Inf Technol Biomed. 2009;13:291-299.
by guest on February 21, 2016http://ajcp.oxfordjournals.org/
Dow
nloaded from


![superficial mycoses2 [Read-Only]iacld.ir/DL/workshop/superficialmycosesdrhashemi.pdf · Superficial MycosesSuperficial Mycoses PityriasisversicolorPityriasis versicolor Pityrosporosis](https://static.fdocuments.net/doc/165x107/5f0fe88d7e708231d4467c62/superficial-mycoses2-read-onlyiacldirdlworkshopsuperfi-superficial-mycosessuperficial.jpg)


![Mycology - Dr. Hashemi.ppt - iacld.ir · A yeastA yeast--like dematiaceus fungus, ... Erythrasma Definition: ... Mycology - Dr. Hashemi.ppt [Compatibility Mode] Author: bathaei](https://static.fdocuments.net/doc/165x107/5ad803fa7f8b9ab8378cd5eb/mycology-dr-iacldir-yeasta-yeast-like-dematiaceus-fungus-erythrasma.jpg)

