Automatic image acquisition, calibration and montage assembly...
17
Automatic image acquisition, calibration and montage assembly for biological X-ray microscopy B. W. LOO JR*, W. MEYER-ILSE² & S. S. ROTHMAN‡ *Bioengineering Graduate Group, University of California, San Francisco and Berkeley, School of Medicine, University of California, Davis, California, U.S.A. ²Center for X-Ray Optics, Ernest O. Lawrence Berkeley National Laboratory, MS 2-400, Berkeley, CA 94720, U.S.A. ‡Departments of Physiology and Stomatology, University of California, 513 Parnassus Avenue, Box 0444, San Francisco, CA 94143, U.S.A. Key words. Acinar cell, automatic image montage assembly, CCD camera, digital imaging microscopy, exocrine pancreas, image processing, microscope calibration, microscopic protein mass measurement, quantitative morphometry, synchrotron, transmission soft X-ray microscopy, zymogen granules. Summary We describe a system for the automatic acquisition and processing of digital images in a high-resolution X-ray microscope, including the formation of large-field high- resolution image montages. A computer-controlled sample positioning stage provides approximate coordinates for each high-resolution subimage. Individual subimages are corrected to compensate for time-varying, non-uniform illumination and CCD-related artefacts. They are then automatically assembled into a montage. The montage assembly algorithm is designed to use the overlap between each subimage and multiple neighbours to improve the performance of the registration step and the fidelity of the result. This is accomplished by explicit use of recorded stage positions, optimized ordering of subimage insertion, and registration of subimages to the developing montage. Using this procedure registration errors are below the resolution limit of the microscope (43 nm). The image produced is a seamless, large-field montage at full resolution, assembled automatically without human intervention. Beyond this, it is also an accurate X-ray transmission map that allows the quantitative measurement of anatomical and chemical features of the sample. Applying these tools to a biological problem, we have conducted the largest X-ray microscopical study to date. Introduction X-ray microscopy has some unique and attractive features as a tool for biological imaging (Schmahl et al., 1980; Rothman et al., 1990; Kirz et al., 1995). Among the most important are high contrast due to the natural constituent molecules in cells and tissues, and significantly higher resolution than visible light microscopy. In an X-ray microscope, low energy X-rays (with wavelengths ranging from 2 to 4 nm in this work) illuminate a sample, and an image is formed from the transmitted photons. Materials absorb these ‘soft’ X-rays in a manner highly dependent on their elemental and chemical composition (Henke et al., 1993). This ‘natural contrast’ permits quantitative mea- surement of the distribution of intrinsic cellular compo- nents (e.g. carbon, nitrogen, protein, DNA) without stains. In addition, the relatively high penetration of soft X-rays (up to several micrometres) allows imaging of a wide range of samples from standard embedded tissue sections of various thickness to whole cells in their native state (e.g. in aqueous media). High-resolution imaging is made possible by microfabricated diffractive optical elements that are used as lenses, called zone plates (Anderson & Kern, 1992; Schmahl et al., 1996), whose fine feature size allows imaging with 43 nm resolution in the microscope used here (Heck et al., 1999). This is five times the maximum resolution of a standard visible light microscope. In recent years, the development of high quality zone plate lenses as well as the availability of high brightness sources of X-rays, in the form of synchrotron radiation facilities, has allowed the building of a number of practical Journal of Microscopy, Vol. 197, Pt 2, February 2000, pp. 185–201. Received 23 February 1999; accepted 16 July 1999 q 2000 The Royal Microscopical Society 185 Correspondence to: Billy W. Loo Jr, Genteric Corporation, 2061 Challenger Drive, Alameda, CA 94501, U.S.A. E-mail: [email protected]
Transcript of Automatic image acquisition, calibration and montage assembly...

Automatic image acquisition, calibration and montageassembly for biological X-ray microscopy
B. W. LOO JR*, W. MEYER-ILSE² & S. S. ROTHMAN³
*Bioengineering Graduate Group, University of California, San Francisco and Berkeley, School of
Medicine, University of California, Davis, California, U.S.A.
²Center for X-Ray Optics, Ernest O. Lawrence Berkeley National Laboratory, MS 2-400, Berkeley,
CA 94720, U.S.A.
³Departments of Physiology and Stomatology, University of California, 513 Parnassus Avenue,
Box 0444, San Francisco, CA 94143, U.S.A.
Key words. Acinar cell, automatic image montage assembly, CCD camera, digital
imaging microscopy, exocrine pancreas, image processing, microscope calibration,
microscopic protein mass measurement, quantitative morphometry, synchrotron,
transmission soft X-ray microscopy, zymogen granules.
Summary
We describe a system for the automatic acquisition and
processing of digital images in a high-resolution X-ray
microscope, including the formation of large-®eld high-
resolution image montages. A computer-controlled sample
positioning stage provides approximate coordinates for
each high-resolution subimage. Individual subimages are
corrected to compensate for time-varying, non-uniform
illumination and CCD-related artefacts. They are then
automatically assembled into a montage. The montage
assembly algorithm is designed to use the overlap between
each subimage and multiple neighbours to improve the
performance of the registration step and the ®delity of the
result. This is accomplished by explicit use of recorded stage
positions, optimized ordering of subimage insertion, and
registration of subimages to the developing montage. Using
this procedure registration errors are below the resolution
limit of the microscope (43 nm). The image produced is a
seamless, large-®eld montage at full resolution, assembled
automatically without human intervention. Beyond this, it
is also an accurate X-ray transmission map that allows the
quantitative measurement of anatomical and chemical
features of the sample. Applying these tools to a biological
problem, we have conducted the largest X-ray microscopical
study to date.
Introduction
X-ray microscopy has some unique and attractive features
as a tool for biological imaging (Schmahl et al., 1980;
Rothman et al., 1990; Kirz et al., 1995). Among the most
important are high contrast due to the natural constituent
molecules in cells and tissues, and signi®cantly higher
resolution than visible light microscopy. In an X-ray
microscope, low energy X-rays (with wavelengths ranging
from 2 to 4 nm in this work) illuminate a sample, and an
image is formed from the transmitted photons. Materials
absorb these `soft' X-rays in a manner highly dependent on
their elemental and chemical composition (Henke et al.,
1993). This `natural contrast' permits quantitative mea-
surement of the distribution of intrinsic cellular compo-
nents (e.g. carbon, nitrogen, protein, DNA) without stains.
In addition, the relatively high penetration of soft X-rays (up
to several micrometres) allows imaging of a wide range of
samples from standard embedded tissue sections of various
thickness to whole cells in their native state (e.g. in aqueous
media). High-resolution imaging is made possible by
microfabricated diffractive optical elements that are used
as lenses, called zone plates (Anderson & Kern, 1992;
Schmahl et al., 1996), whose ®ne feature size allows
imaging with 43 nm resolution in the microscope used here
(Heck et al., 1999). This is ®ve times the maximum
resolution of a standard visible light microscope.
In recent years, the development of high quality zone
plate lenses as well as the availability of high brightness
sources of X-rays, in the form of synchrotron radiation
facilities, has allowed the building of a number of practical
Journal of Microscopy, Vol. 197, Pt 2, February 2000, pp. 185±201.
Received 23 February 1999; accepted 16 July 1999
q 2000 The Royal Microscopical Society 185
Correspondence to: Billy W. Loo Jr, Genteric Corporation, 2061 Challenger Drive,
Alameda, CA 94501, U.S.A. E-mail: [email protected]

X-ray microscopes (Thieme et al., 1998) that are only now
beginning to yield biological results. At this early stage,
much work is needed to make the X-ray microscope a useful
tool for routine research in biology and to exploit its features
fully. To achieve this goal, development is required in three
areas: microscope instrumentation, sample preparation,
and digital image acquisition and processing. This paper
deals primarily with the last of these. In it we describe how
we acquire image data and obtain accurate quantitative
information from them, and how we extend the high
resolution of the method over large ®elds of view. As a
practical matter, the methods must be automatic to allow
for the processing of large numbers of samples encompass-
ing large ®elds of view.
Quantitative imaging requires characterizing the proper-
ties and inherent sources of error of each component of the
microscope system. Two in particular concern us here. The
synchrotron source has a time-varying intensity and
pattern of illumination for which we must compensate,
and the charge-coupled device (CCD) camera used for image
recording introduces artefacts, such as dark current and
non-uniform pixel response. Although methods for correct-
ing CCD-related artefacts are standard and well documented
in the literature (e.g. Krivanek & Mooney, 1993), here we
describe our particular approach and the issues speci®c to
our system.
To take advantage of the high resolution of the X-ray
microscope, we must use high magni®cation and conse-
quently sacri®ce ®eld of view. This trade-off is found in
almost all forms of microscopy, regardless of the wavelength
of illumination (electrons, X-rays or visible light), particu-
larly in full-®eld imaging. This applies even to many forms of
scanning microscopy, as scanning stages often have a
smaller range of motion as the step size becomes ®ner. As
a result, it has been dif®cult to undertake projects that
require sampling large areas at high resolution, for example
studying samples with both small and large scale features,
or survey and screening studies. One solution to this
problem is to build large-®eld composite images from many
smaller high-resolution subimages, a process variously
referred to as montaging, mosaicking, ®eld stitching or
tiling. Automatic montage assembly for various kinds of
photography and videography has been developed extensively
in computer vision and graphics (e.g. Dani & Chaudhuri,
1995; Davis, 1998). Similar methods have been applied to
microscopic imaging, including the assembly of huge
montages in electron microscopy (Vogt et al., 1996), and
three-dimensional montages in visible light microscopy
(Turner et al., 1997). A number of commercial implementa-
tions are also available. Below we describe the system we
have designed for automatically acquiring digital images
and assembling large-®eld montages of arbitrary size at the
full resolution of the X-ray microscope and we demonstrate
its application to biological samples.
Methods
The X-ray microscope
We used a digital X-ray microscope, called XM-1 (Meyer-Ilse
et al., 1995, 1998), at the Advanced Light Source (ALS)
synchrotron radiation facility at Lawrence Berkeley
National Laboratory (LBNL). XM-1 is a conventional-type,
or full-®eld imaging, transmission microscope. A condenser
zone plate demagni®es the incoherent light source (a
bending magnet on the ALS) onto the sample, and an
objective zone plate images the sample onto an image
detector. Two components of the microscope, the image
detector and the sample stage, have a particular impact on
calibrating images and assembling large-®eld montages.
The image detector is a CCD camera, thinned and back-
illuminated for high ef®ciency detection of soft X-rays
(Wilhein et al., 1994). The CCD chip has a 1024 ´ 1024
array of 24 mm pixels. The ®eld of view of XM-1 in its most
heavily used con®guration is a circular area approximately
10 mm in diameter, and at 2400 ´ magni®cation (the one
most often used) this ®eld, projected to the image plane,
matches the width of the CCD. The corresponding pixel size
in the image is 10 nm. Often, we use subsampling by
binning CCD pixels together to reduce the exposure time
and data storage requirements. At 2 times binning, or a
20 nm pixel size, the Nyquist sampling criterion is still met
for 40 nm resolution. When total ®eld size is a more
important consideration than raw resolution, 4 times
binning can be used. The digital data from the CCD are
read directly into a computer, which facilitates subsequent
processing.
The sample positioning system, developed at LBNL, has a
unique design, with two separate sample stages, one each in
the X-ray microscope (XM), and an external visible light
microscope (VLM). Stage position readout is accomplished
using Heidenhain optical encoder scales in three orthogonal
directions on each stage, with readout increments of 20 nm.
A magnetic kinematic mounting system allows mounting
and unmounting of the sample on and off a stage with a
reproducibility comparable to the resolution of the micro-
scope, in the tens of nanometres. The three-dimensional
coordinate systems of the two stages are related to each
other by a matrix transformation incorporating the relative
offset, rotation, and skew between them. The correspon-
dence between positions in the two stages is accurate to less
than 2 mm in the object plane, and about 1 mm along
the optical axis, or approximately the depth of focus of both
the VLM (with a 0´6 NA objective lens) and the XM. Thus,
using this system it is possible to select and focus on sample
areas of interest entirely within the VLM. Sample exposure
to X-rays is thereby limited to the ®nal image recording,
minimizing dose. This is a critical consideration for dose-
sensitive samples. The sample stage coordinates at which
186 B. W. LOO JR ET A L .
q 2000 The Royal Microscopical Society, Journal of Microscopy, 197, 185±201

each image is acquired are recorded and saved with the
image data, and then used in the montage assembly process
as estimates of subimage position.
Acquisition of high-resolution subimages in XM-1
When acquiring subimages for montage assembly, the
centre and total width of the area of interest are recorded
using the graphical interface of the microscope control
software. A rectangular grid of equally spaced subimage
positions is then computed to cover the region. For circular
subimage ®elds, this pattern of coverage is not ideal, because
in order to have suf®cient overlap between neighbouring
subimages along the diagonals, there is more overlap than
necessary between horizontal and vertical neighbours. An
equidistant triangular pattern of coverage would be optimal,
and should be relatively easy to implement. The grid spacing
is typically between 5 and 6 mm, depending on the subimage
®eld diameter (usually about 8 mm), giving 0´5±2 mm (or
25±100 pixels in the case of 2 times binning) of maximum
overlap between neighbouring subimages.
Under computer control, the sample stage is sequentially
moved to each of the preselected subimage positions and the
sample is exposed. The current in the synchrotron storage
ring continuously decreases with time, resulting in
decreased source intensity. Thus, when acquiring each
subimage, the ring current is read, and exposure time
adjusted automatically to compensate. The exposure, or
product of ring current and exposure time measured in
milliampere-seconds (mAs), is kept approximately constant
across all subimages. At regular intervals in the subimage
acquisition sequence, preselected empty areas on the sample
window containing no sample features are exposed to
provide background images to be used for ®eld inhomo-
geneity correction (described below). The entire process,
except for user selection of the region of interest and
background areas, and the initial selection of the exposure
level, is automated.
Corrections applied to individual subimages
1. Dark current correction. The major sources of signal in
the CCD camera are charge generated by image-forming
X-ray photons, and dark current. Dark current in a CCD
pixel is due to the accumulation of thermally generated
charge carriers over the integration time, and is highly
dependent on temperature (Dereniak & Crowe, 1984). The
temperature of the CCD chip is maintained at ÿ50 8C by a
thermoelectric cooler to keep dark current at an acceptable
level. We modelled dark current signal in each pixel as an
af®ne linear function of integration (exposure) time that is
additive to the photon-produced signal. In addition, there is
an intensity offset that is added to the signal by the camera
readout electronics to prevent readout noise from generat-
ing negative intensity values.
Dark current images are collected for camera calibration
on a periodic basis by acquiring images with no light on the
camera. Multiple dark current images are acquired at each
of several different exposure times and several different
camera binning factors. Linear regression is performed on a
pixel by pixel basis, giving a slope and offset of dark current
versus exposure time for each pixel. Most of the offset
component is due to the above-mentioned intensity baseline
offset. Figure 1a is an image of the dark current slope in the
CCD camera. From these measurements, `bad' pixels are
identi®ed. These are pixels that saturate due to dark current
within a speci®ed exposure time, or have slope or offset
different from the mean of the array by more than a
speci®ed tolerance (typically 10 standard deviations), or are
unresponsive as demonstrated by a zero variance over
multiple exposures. Between 0´4 and 0´9% of the image
pixels are bad, depending on the binning factor, with the
higher proportion occurring with more binning. The dark
current slope and offset, and the bad pixels, are recorded in
a calibration ®le for each binning factor.
Each subimage is corrected for dark current by subtract-
ing a corresponding calculated dark current image, i.e. the
offset plus the slope times the exposure time of the
subimage. This is in principle a photometrically accurate
correction. This is different from the standard procedure of
subtracting a single acquired dark image with the same
exposure time as the subimage, and has the theoretical
advantage that it does not add the small amount of noise
due to statistical variations in dark current signal and
readout noise.
To illustrate the small magnitude of the dark current
contribution, the signal intensity due to X-ray photons in a
background image that is saturated to about 60% of
the camera's dynamic range in about 12 s (Fig. 1b) is
approximately 1200 times greater than the dark current
signal in that exposure time. A signi®cant increase in dark
current was noted once, which led to the discovery that the
CCD chip had lost contact with the thermoelectric cooler.
The problem resolved as soon as this was corrected. We
have also noted a very slow but measurable increase in dark
current with X-ray exposure over the lifetime of the
instrument, presumably due to radiation damage. This
can be seen to some extent in Fig. 1a in the pattern of dark
current slope, as some parts of the chip were much more
heavily exposed than others during the initial alignment of
optical components in the microscope.
2. Region of support selection and exposure normaliza-
tion. The ®eld of view in each subimage is circular and
therefore does not ®ll the entire square CCD pixel array. An
iris in front of the camera is used to block off areas outside
the ®eld of view, and can be adjusted to exclude scattered
q 2000 The Royal Microscopical Society, Journal of Microscopy, 197, 185±201
DIGITAL IMAGING METHODS FOR X-R AY MICROSCOP Y 187
light that is more intense at the periphery of the ®eld. The
information-containing area of the images, or region of
support, which is the same for all images with the same
camera iris setting, is identi®ed interactively. The remainder
of the pixels are masked off by setting them to a value of zero
(see Fig. 1c). A typical region of support has a diameter of
about 8 mm in the sample plane.
As described above, the exposure time is adjusted
automatically to compensate for decreasing beam intensity
over time. Any remaining differences in exposure between
subimages are balanced by dividing each subimage by its
measured exposure (in mAs).
3. Field inhomogeneity correction. The image ®eld may be
inhomogeneous because of non-uniform illumination and
non-uniform pixel response or sensitivity to light. Both
factors cause differing rates of signal accumulation between
pixels and cannot be isolated from each other. However, we
can simultaneously compensate for all sources of inhomo-
geneity that cause such a multiplicative effect by dividing
each sample image by a background image. Additive
phenomena, such as scattered light that reaches the
camera, are not properly corrected by this means. A
background image is an image of an area on the sample
holder that contains no sample features. In a perfect system,
such an image should have uniform intensity across the
®eld. Any inhomogeneity is due to artefacts. Figure 1b
shows a background image acquired in XM-1. Some of the
patterns on the image are due to debris or dirt on the
CCD camera that obstruct some pixels and thereby
decrease their sensitivity to X-rays by absorbing part of
the signal.
If the pattern of illumination were constant with time,
it would be possible to use the standard procedure of
normalizing all images to a single background image formed
by averaging several exposures with no sample in the beam.
However, we have found that during the course of a long
subimage acquisition sequence, the background pattern
changes smoothly with time, possibly due to a drift in the
position of the ALS beam or components in the optical path
(see Fig. 5). Therefore, background images must be acquired
at multiple time points throughout the subimage acquisi-
tion sequence. At each of these times, several empty areas
on the sample window are imaged. They are averaged
together to reduce the effect of photon shot noise, and the
effect of dirt or other features that are inadvertently
captured within any of the background images. To minimize
further the effect of extraneous features, the sample stage is
moved to an out-of-focus plane to blur them. Finally, if any
noticeable effects due to blemishes in the background image
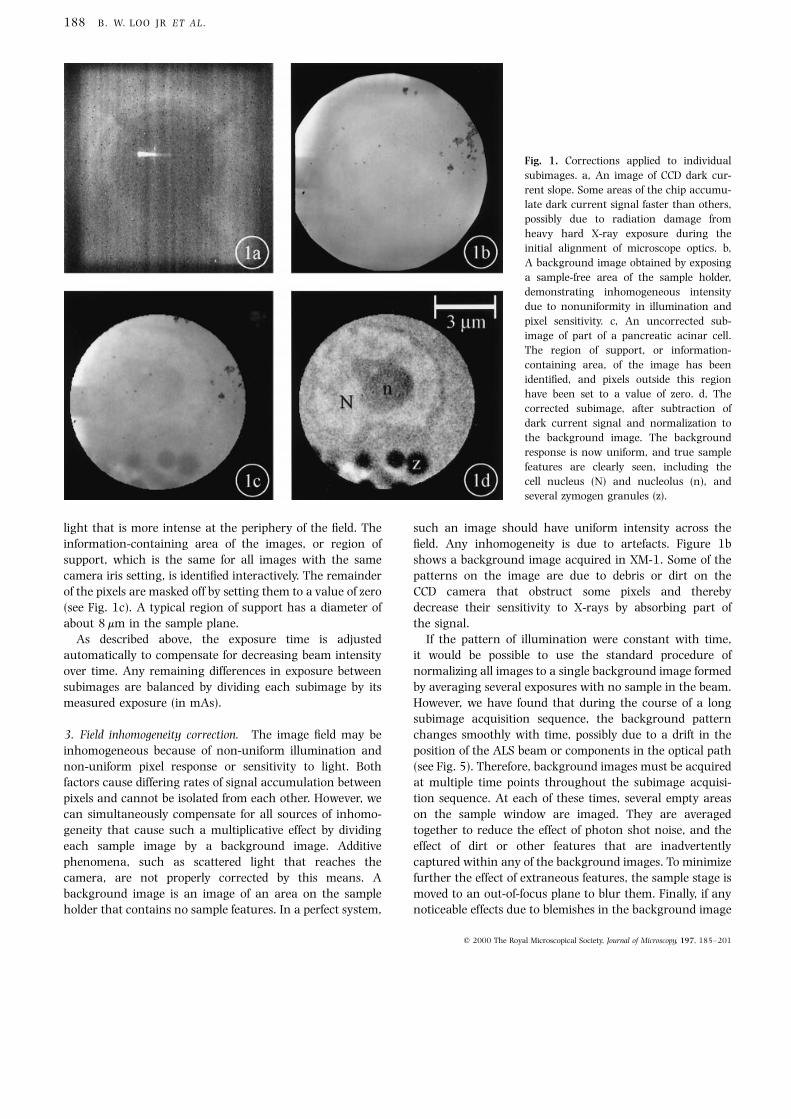
Fig. 1. Corrections applied to individual
subimages. a, An image of CCD dark cur-
rent slope. Some areas of the chip accumu-
late dark current signal faster than others,
possibly due to radiation damage from
heavy hard X-ray exposure during the
initial alignment of microscope optics. b,
A background image obtained by exposing
a sample-free area of the sample holder,
demonstrating inhomogeneous intensity
due to nonuniformity in illumination and
pixel sensitivity. c, An uncorrected sub-
image of part of a pancreatic acinar cell.
The region of support, or information-
containing area, of the image has been
identi®ed, and pixels outside this region
have been set to a value of zero. d, The
corrected subimage, after subtraction of
dark current signal and normalization to
the background image. The background
response is now uniform, and true sample
features are clearly seen, including the
cell nucleus (N) and nucleolus (n), and
several zymogen granules (z).
188 B. W. LOO JR ET A L .
q 2000 The Royal Microscopical Society, Journal of Microscopy, 197, 185±201

remain, the pixels can be identi®ed interactively and
replaced by the average of the corresponding pixels from
the other background images acquired at the same time.
Because background images are collected throughout the
subimage collection sequence, each subimage is bracketed
in time by two background images. The acquisition time of
every subimage and background image is recorded with the
image data. This allows the generation of a time inter-
polated background image for each subimage, by perform-
ing a pixel by pixel linear interpolation between the
bracketing background images.
Each background image is subjected to the same dark
current correction, region of support masking, and expo-
sure normalization as described for the individual sub-
images. Each subimage is then corrected by division by its
corresponding background image. As seen in Fig. 1d, the
corrected image shows only the true sample structure, with
a homogeneous background response. Despite these correc-
tions, we occasionally found a small amount of additional
intensity, particularly near the edges of the ®eld of view,
probably due to an additive signal such as scattered light in
the microscope system. This is usually only noticeable in an
assembled montage, where it appears as a small intensity
mismatch at the borders of neighbouring subimages (see
Fig. 6).
Assembling subimages into a large-®eld montage
After the individual subimages are corrected, they are
inserted into the montage. The goal is to register each
subimage accurately with the target region in the montage
into which it is to be inserted. We assume that magni®ca-
tion and rotation are constant over all subimages, and that
registration can be accomplished solely by translation. As
shown, the quality of the resulting registration reinforces
the validity of this assumption in our system. The ability to
register any two images with one another improves as the
feature overlap between them increases. The montage
assembly algorithm attempts to maximize feature overlap
between any subimage and its target area in the montage.
The recorded sample stage positions are used at multiple
steps in the process.
First, a subimage adjacency table is generated, identifying
which subimages neighbour which, based on their stage
positions and the subimage ®eld size de®ned by the region of
support mask, as described above. The dimensions of the
entire montage are similarly calculated, and the subimage
closest to the centre of the ®eld is identi®ed. Starting with
the centremost subimage, an optimized insertion order is
determined as follows: the adjacency table is used to
organize subimages into sequential generations of neigh-
bours, the ®rst generation being the immediate neighbours
of the centremost subimage, the next being their neigh-
bours, and so on. Subimages within each generation are
sorted in order of their distance from the centremost
subimage, again based on their stage positions.
Next, an empty image array is created with the
dimensions of the full montage, with a small margin added
to accommodate possible errors in the stage positions. A
correspondence is calculated between the pixel positions in
the montage and the stage positions. The centremost
subimage is then inserted into the appropriate position in
the montage. As each subsequent subimage is inserted, the
correspondence between pixel and stage positions allows
identi®cation of the target area of the developing montage
into which it will be inserted. This target area contains
contributions from the parts of previously inserted sub-
images that overlap with the current one. It is extracted
from the montage, and used as a reference image to which
the current subimage is registered. The amount of
translation or shift that must be applied to the subimage
to register it to the reference region is calculated. The
subimage is then inserted into the montage at a position
appropriately shifted relative to its corresponding stage
position.
This approach has a number of advantages. It saves on
computation because each subimage is registered only once
(with a corresponding reference region from the developing
montage) rather than pairwise with each of its neighbours.
Also, because reference regions contain data from more
than one previously registered subimage, there is much
more feature overlap with the subimage to be inserted than
there would be if registration were performed pairwise
between individual subimages. Figure 2a shows a subimage,
and the reference region from the developing montage to
which it is registered.
The registration step itself is a form of generalized
correlation operation (Knapp & Carter, 1976; Azaria &
Hertz, 1984) with the addition of a non-linear processing
step. The non-linear processing step, a gradient magnitude
operation, is performed ®rst on the subimage and its
reference image. This highlights the features in the images,
producing a bright signal at object edges, and a dark signal
in the relatively uniform areas in the background and in the
interior of objects. Figure 2b shows the gradient magnitude
images of the subimage and reference image in Fig. 2a. The
result is a sharpening of the peak produced by the
subsequent correlation step (Fig. 2 insets). We used a Sobel
gradient operator, which performs well in the presence of
typical noise levels, to compute the gradients of each
subimage and its reference image.
A ®ltered cross-correlation operation is then performed
on the gradient magnitude images to determine by what
amount the subimage should be shifted relative to its
reference image and therefore its recorded stage position.
Each cross-correlation is computed over a range of shifts
corresponding to zero plus and minus 0´6 mm with respect
to the stage position for the subimage being inserted. This
q 2000 The Royal Microscopical Society, Journal of Microscopy, 197, 185±201
DIGITAL IMAGING METHODS FOR X-R AY MICROSCOP Y 189

accommodates the largest anticipated shift based on the
accuracy of stage position readout, plus a safety margin. A
difference of Gaussians bandpass ®lter is applied to the
cross-correlation image to sharpen peaks while suppressing
noise. The position of the highest peak in the ®ltered cross-
correlation image is used to determine the shift to apply.
Figure 2c demonstrates that the peak position is unaffected
by the addition of a substantial amount of arti®cial
Gaussian noise. In this example, the standard deviation of
the noise was chosen to be two-thirds the difference in
intensity between the bars and spaces of the test structure
(signal-to-noise ratio, SNR, of 1´5), far more than typical for
this kind of imaging.
The subimage is then inserted into the montage at its
shifted coordinates. Figure 3a shows a registered set of
gradient magnitude subimages. Their corresponding cross-
correlation images are in Fig. 3b. While all the cross-
correlation images are scaled to comparable brightness in
the display, the range of the peak correlation intensities spans
nearly four orders of magnitude. With very few exceptions,
even at the lowest end of the range, the peaks are prominent
enough to identify the appropriate shift uniquely.
Fig. 2. Subimage registration. As each sub-
image (a, left) is inserted into the montage,
it is registered with respect to a reference
image extracted from its target area in the
developing montage (a, right). The refer-
ence image contains contributions from
more than one previously inserted sub-
image, increasing feature overlap and
the performance of the registration. The
registration step itself is a ®ltered cross-
correlation operation applied to the gradi-
ent magnitude images (b) of the subimage
and its reference image. The inset images
show the results of cross-correlation
between each of the subimage/reference
pairs. Using the gradient magnitude opera-
tion results in a signi®cantly sharper corre-
lation peak. The top of each inset pair is
the direct cross-correlation, while the bot-
tom is the ®ltered cross-correlation. Filter-
ing enhances the peak and suppresses the
slowly varying intensity background
caused by the small amount of overlap
between the images. c, The same as b, but
with a large amount of arti®cial noise
added to the source images. Despite the sig-
ni®cant degradation of the gradient magni-
tude images, the correlation peak is still
distinct and its position is unchanged.
190 B. W. LOO JR ET A L .
q 2000 The Royal Microscopical Society, Journal of Microscopy, 197, 185±201

Each pixel value in the areas of overlap between adjacent
subimages is computed as the average of all the subimage
pixels contributing to it. This increases the SNR in the areas
of overlap and minimizes wasted radiation exposure to any
part of the sample in the sense that all of the exposure goes
towards improving image quality. A completed montage of
thin gold structures used as high-resolution test objects is in
Fig. 4c.
Finally, as mentioned above, despite all the corrections there
is occasionally a noticeable intensity mismatch in the montage
at subimage borders, due to some uncorrected factor such as
scattered light. Without knowing the nature of the source of the
artefact, it is not possible to correct for it. However, its
appearance can be minimized by blending subimages into the
mosaic. Rather than doing a straight average in the overlapping
areas, a weighted average is used, with the weights for each
subimage tapering smoothly to zero near its border. Figure 6
shows the effect of this blending. This is, of course, not a true
correction, but still it is helpful in minimizing the impact of
the artefact on subsequent image analysis or processing,
such as automated image segmentation (Loo et al., 1996).
Results
Microfabricated resolution test objects
We evaluated the performance of our image acquisition
and processing system on real microscope images taken of
two thin gold structures microfabricated for the purpose of
testing microscope resolution. The two structures, each
with a diameter of 47 mm, together spanning a region
94 mm across, have features down to approximately 40 nm
in dimension. Figure 4c is a montage of the full ®eld of
view containing both test structures, a composite of 200
subimages. The insets are magni®ed views of the central
portions containing the ®nest features, demonstrating the
full resolution of the microscope. The pixel size is 20 nm.
The performance of the registration can be assessed by
comparing high-detail areas in the montage to the original
subimages containing the same features. Figure 4a shows
two original subimages from the central regions of the test
structures. No degradation in resolution is discernible in the
corresponding areas of the montage, despite overlap from
several subimages, indicating registration errors smaller
than the resolution limit of the microscope. In addition, as
mentioned above, the corresponding montage areas have
better SNR because of the contribution of signal from
multiple subimages.
Because of the montage assembly algorithm's essentially
perfect registration performance, at least on high contrast
structures such as the resolution test objects, we found that
it could be used to aid in a number of microscope
diagnostics. In comparing the recorded stage positions of
the subimages of the test objects to their adjusted positions,
we found a non-random pattern of discrepancy. These were
determined to be due to a 1´8% error in the microscope
magni®cation, corresponding to a 2´8 cm error in the
sample-to-CCD distance (over a total of 1´56 m), and a
0´398 rotation between the CCD camera and the sample
stage. No skew between the sample stage axes was
identi®ed. These errors are easily compensated for by a
simple matrix transformation. A small random mismatch
remained due to the limited precision of the optical encoder
readout. Initially, we found the mean error in the
determination of position to be substantially worse than
expected based on the manufacturer's speci®ed tolerance of
30 nm in the encoder readout. The problem was traced at
least in part to an incorrect voltage offset in the optical
encoders. After correction of this problem, the mean
position determination error, or the distance between each
recorded stage position of a subimage and its true position,
was 90 nm with a standard deviation of 50 nm. However,
because the direction of the error is random, the mutual
misregistration between any two adjacent subimages is
somewhat larger at about 110 nm on average, with a
standard deviation of 60 nm, suf®cient to cause substantial
degradation of the resolution without correction as seen in
Fig. 4b. This information can be used to set a limit on the
maximum shift to calculate in the registration step.
Biological samples
Applying the techniques to a biological problem (Rothman
et al., 1992; Loo et al., 1996), we set out to measure the
population statistics on the size, protein mass and number
of zymogen granules in pancreatic exocrine tissue. A
quantitative morphometry problem such as this requires
measurement of large samples to obtain a statistically
meaningful estimate of these population parameters. In
addition, it requires imaging large ®elds of view, because
zymogen granules are distributed very unevenly, usually
being clustered around ductal structures in the tissue.
Figure 7 is a montage of 400 subimages of a plastic
embedded tissue section of rat pancreas, nominally 0´75 mm
thick. The sample is unstained, and at the imaging
wavelength used (2´4 nm) the contrast in such a plastic
embedded sample is based primarily on the nitrogen content
of the tissue, effectively providing a density map of protein
and nucleic acid. The total ®eld of view is 110 mm across, or
about 2700 ´ 2700 pixels at 40 nm pixel size. The
pancreatic cells are arranged in cluster-like units called
acini, surrounding a duct system that conveys secreted
material eventually to the gut. At their apical end, adjacent
to the duct, the cells are packed with dense, sphere-like
zymogen granules. Supporting structures are seen, such as
red blood cell carrying capillaries, as are other intracellular
organelles, such as mitochondria. The magni®ed view in
Fig. 7b demonstrates additional ®ne structure, including
q 2000 The Royal Microscopical Society, Journal of Microscopy, 197, 185±201
DIGITAL IMAGING METHODS FOR X-R AY MICROSCOP Y 191
patterns of linear lucencies well beyond the ability of visible
light microscopes to resolve. These may represent endo-
plasmic reticulum cisternae orientated perpendicular to the
plane of sectioning, but whatever their identity they
indicate the high resolution of the method.
The zymogen granules, often under 1 mm in size, are
beyond the ability of the standard visible light microscope to
measure and count accurately. Nor is there a direct way to
quantify their protein content in either the visible light or
electron microscopes. With its combination of high resolu-
tion and natural contrast, X-ray microscopy, in particular,
large-®eld X-ray microscopy, can make all of the desired
measurements on zymogen granules (size, number, and
protein content) and is to the best of our knowledge the only
tool available at present to do so. Nearly 100 such montages
were assembled in this study, requiring the acquisition of
nearly 27 000 subimages, making it the largest X-ray
microscopical study to date. The biological results will be
published in a separate paper.
Discussion
We have developed digital imaging methods to help realize
and enhance key strengths of X-ray microscopy, in
particular high natural contrast permitting quantitative
measurements, and high resolution. Quantitative X-ray
imaging can only be accomplished by accounting for and
correcting several instrument-related sources of error. To
this end we have characterized the components of our
system and shown how photometrically accurate images
can be produced. We have also developed a method for
acquiring images that retains the high resolution of X-ray
microscopy while allowing an arbitrarily large ®eld of view.
Although parts are similar to methods found in the
literature, the montage assembly algorithm presented has a
number of distinguishing features. In particular, it makes
explicit use of recorded sample stage positions to estimate
the overall size of the montage ®eld and the distance
between subimages, to generate a subimage adjacency
table, to compute coordinates for extracting target regions
from the developing montage, and to calculate the required
size of the cross-correlation arrays. It also determines an
optimized subimage insertion order based on the adjacency
table and the distance of subimages from the centre of the
developing montage. These two features provide dependable
performance with arbitrary subimage acquisition order and
adjacency pattern. That is to say, no assumptions are
required about the spatial or temporal organization of the
subimages. The algorithm will assemble the montage from
all subimages that have a pathway of connectivity with a
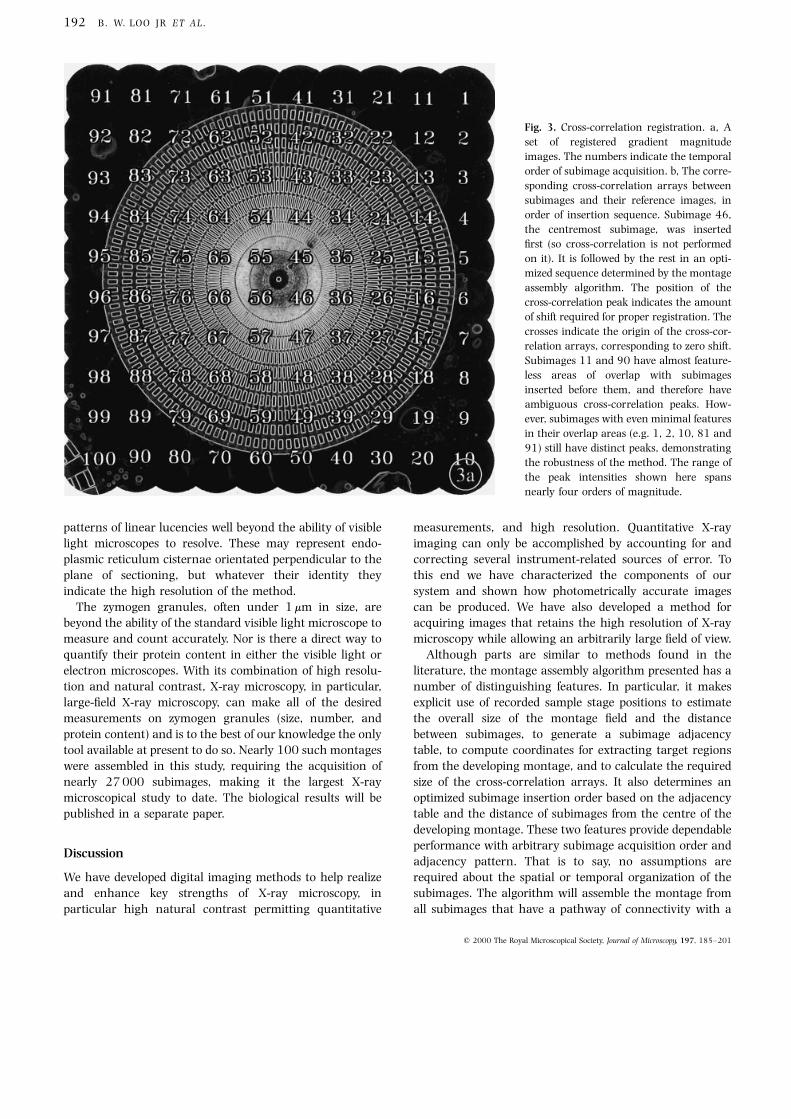
Fig. 3. Cross-correlation registration. a, A
set of registered gradient magnitude
images. The numbers indicate the temporal
order of subimage acquisition. b, The corre-
sponding cross-correlation arrays between
subimages and their reference images, in
order of insertion sequence. Subimage 46,
the centremost subimage, was inserted
®rst (so cross-correlation is not performed
on it). It is followed by the rest in an opti-
mized sequence determined by the montage
assembly algorithm. The position of the
cross-correlation peak indicates the amount
of shift required for proper registration. The
crosses indicate the origin of the cross-cor-
relation arrays, corresponding to zero shift.
Subimages 11 and 90 have almost feature-
less areas of overlap with subimages
inserted before them, and therefore have
ambiguous cross-correlation peaks. How-
ever, subimages with even minimal features
in their overlap areas (e.g. 1, 2, 10, 81 and
91) still have distinct peaks, demonstrating
the robustness of the method. The range of
the peak intensities shown here spans
nearly four orders of magnitude.
192 B. W. LOO JR ET A L .
q 2000 The Royal Microscopical Society, Journal of Microscopy, 197, 185±201

q 2000 The Royal Microscopical Society, Journal of Microscopy, 197, 185±201
Fig. 3. (Continued)
DIGITAL IMAGING METHODS FOR X-R AY MICROSCOP Y 193

Fig. 4. Performance of registration on microfabricated gold structures, with ®nest feature dimensions of about 40 nm. a, Two individual high-
resolution subimages from the central parts, containing the ®nest features, of each of the structures. Such images have been used to measure
the resolution of the microscope, determined to be 43 nm. The pixel size is 20 nm. b, Corresponding parts of the montage assembled using
only the recorded stage positions, without registration by cross-correlation. The stage position determination errors are suf®cient to degrade
the resolution signi®cantly. Arrows indicate some ®ne features in overlap regions that are blurred due to misregistration. c, The full montage
of both gold structures, registered using the montage assembly algorithm. It spans an area of about 104 ´94 mm (5200 ´ 4700 pixels at
20 nm pixel size). Inset images show the same central areas. Full resolution is preserved when compared to the individual subimages (a),
which demonstrates essentially perfect registration.
194 B. W. LOO JR ET A L .
q 2000 The Royal Microscopical Society, Journal of Microscopy, 197, 185±201

q 2000 The Royal Microscopical Society, Journal of Microscopy, 197, 185±201
Fig. 4. (Continued)
DIGITAL IMAGING METHODS FOR X-R AY MICROSCOP Y 195

speci®ed subimage, or the centremost one by default.
Registering subimages with extracted target regions of the
developing montage also affords certain advantages. First, it
is more robust, because any neighbours of a particular
subimage that have already been inserted contribute to its
reference image, increasing the amount of feature overlap.
It is also more computationally ef®cient because registration
is performed on each subimage only once. Moreover, the
approximate insertion position and the maximum shift are
already known from the stage position, reducing the search
space, and therefore computation. An optimization similar
to the latter is achieved in some other published algorithms
using a multi-resolution pyramid approach (Dani &
Chaudhuri, 1995; Vogt et al., 1996). However, these still
require pairwise cross-correlation operations between each
subimage and multiple neighbours.
As for the registration step itself, many methods have been
devised for mutually aligning images (e.g. Brown, 1992).
Ours can be considered a hybrid of the two main approaches,
i.e. signal processing/statistical analysis and computer
vision/image understanding. The ®rst is represented by
generalized correlation methods, in particular maximum
likelihood estimation (Knapp & Carter, 1976; Eversole &
Nasburg, 1983). This method can be thought of (Knapp &
Carter, 1976) as ®ltered cross-correlation in which two
®lters are applied. One is a whitening ®lter to deconvolve the
signal autocorrelation from the delta function representing
the image shift, and is generally high pass in nature for real-
world images (Pratt, 1974). The other is a SNR ®lter to
suppress frequencies with high noise power, and is generally
low pass in nature. Overall, the combined ®lters have
bandpass characteristics. The statistical nature of the
signal and noise components of the images must be
known, estimated, or assumed in order to determine the
exact ®lter weights. Instead of attempting to estimate
optimal ®lter parameters, we have simply chosen a generic
bandpass ®lter (the difference of Gaussians) that we have
found to work well on our images. In addition, the
derivation of the optimal estimate generally assumes a
large region of overlap between the signals or images.
However, when assembling montages in microscopy, an
attempt is generally made to overlap the subimage ®elds by
a narrow margin, especially when minimal sample expo-
sure is desired, as in ¯uorescence microscopy because of
bleaching, and electron and X-ray microscopies because of
radiation damage. In this case, the intersection between the
regions of support of the search and reference images
changes substantially with displacement, producing a
slowly varying intensity background in the correlation
image that can overwhelm the true peak (see Fig. 2). Here,
®ltering with the difference of Gaussians, which tapers to
zero weight at zero frequency, has the additional advantage
that it suppresses this low frequency intensity background.
The second approach consists of a wide variety of non-
linear operations that are designed to extract features from
the images to be registered. The correspondence between
these features can then be determined. For example, Turner
et al. (1997) identify speci®c landmarks such as cell nuclei
in the subimages by image segmentation, and register
corresponding ones. This approach can give highly accurate
registration. However, it requires that the segmented
features be well distributed in the regions of overlap
between subimages. In addition, segmentation algorithms
tend not to be generalizable to all kinds of sample. We have
found that the gradient magnitude operator, a step down
from true image segmentation, is a simple, general, and
reliable means of emphasizing features for registration in
images. Although it might be expected to perform poorly in
the presence of noise due to its high pass nature, this does
not seem to be a problem even when noise levels are much
higher than we have observed (see Fig. 2c).
There are weaknesses common to many montage
assembly algorithms, including the one described here. If
for some reason one of the subimages is incorrectly
registered, it can affect the positioning in the montage of
subsequently inserted subimages. This can happen under
Fig. 5. Effect of time varying pattern of illumination. The pattern of
illumination changes gradually with time, due to drift of either the
synchrotron source or microscope optics. In this montage of pan-
creatic tissue, 400 subimages, collected over about 3 h, are each
normalized to background images acquired just before the begin-
ning of the sequence (starting at the upper right corner). This
results in a signi®cant intensity gradient across the montage, and
mismatched intensities at subimage borders. When each subimage
is normalized to a time interpolated background image, con-
structed from multiple background images acquired throughout
the sequence, a proper correction is obtained (see Fig. 7).
196 B. W. LOO JR ET A L .
q 2000 The Royal Microscopical Society, Journal of Microscopy, 197, 185±201

certain unfavourable conditions, for example if the area of
overlap between a subimage and previously inserted
subimages is relatively featureless, or contains only features
that are periodic or have parallel edges. In such cases the
cross-correlation would have an ambiguous or non-unique
peak. Alternatively, features in the overlapping areas might
change between exposures. Exposure-induced changes in
the sample are frequently seen in biological electron
microscopy. They can also be seen with certain samples in
the X-ray microscope, particularly hydrated biological
samples, although we have not noticed it in the samples
we have used. This problem is complicated and might be
addressed by applying some kind of warping transform
designed to compensate for beam-induced artefact.
The ®rst problem, accumulated errors due to ambiguous
registration, appears more tractable however. Although the
optimum registration may be ambiguous between a sub-
image and previously inserted subimages, it might be better
between it and later subimages. Thus, one solution might be
to optimize the insertion order further by dynamic
reordering. If, during the registration step, the cross-
correlation peak for a subimage is smaller than some
signi®cance threshold, such as a certain number of
standard deviations above the mean value of the cross-
correlation image, the subimage can be moved to a later
position in the insertion list, such as in the next generation
of neighbours. Then by the time it is inserted, more of its
neighbours will have contributed to its target area in the
montage, increasing the chance of an unambiguous match.
Another strategy, at somewhat increased computational
expense, might be to perform global optimization of
registration across all the subimages. In this scheme,
pairwise cross-correlations would be precomputed between
all neighbouring subimages. The positions of all the
subimages would then be shifted simultaneously so as to
maximize the sum of all the cross-correlations, possibly by
an iterative algorithm. In this way, the shift applied to any
subimage would be most strongly in¯uenced by its position
relative to the neighbouring subimages with which it shares
the most features, regardless of the order of insertion. A
similar idea is described by Davis (1998).
An unexpected realization of montage assembly was that
the method could be used to calibrate microscopes. Indeed,
this may well be one of the most sensitive means available to
detect small errors in magni®cation, rotational misalign-
ment between the detector and sample stage, and sample
stage skew. Finally, automating some of the last remaining
q 2000 The Royal Microscopical Society, Journal of Microscopy, 197, 185±201
Fig. 6. Blending. When subimages are inserted into the montage,
the areas of overlap are constructed by averaging pixel values
from the contributing subimages (top). Despite the corrections
that have been applied, some residual uncorrected factor, possibly
scattered light, sometimes causes an intensity mismatch at the sub-
image borders (arrows). Blending can be performed (bottom) by
using a weighted average in the overlapping areas, with weights
that taper near the subimage borders. The result is seamless,
which facilitates subsequent image analysis.
DIGITAL IMAGING METHODS FOR X-R AY MICROSCOP Y 197

steps still requiring human interaction, such as background
region selection, blemish identi®cation in background
images, initial exposure selection, and subimage region of
support masking, can be accomplished entirely in software,
and would involve relatively simple computer vision
algorithms. Automatic sample focusing (in the VLM) could
also be implemented, and would require the addition of a
motorized VLM focusing stage.
Fig. 7. High-resolution, large-®eld montage of a pancreatic tissue section. a, The full montage of 400 subimages, spanning 110 ´ 110 mm
(about 2700 ´ 2700 pixels at 40 nm pixel size). The exocrine (acinar) cells of the pancreas are arranged in clusters called acini (A). Through-
out the tissue are capillaries (c), some of which are sectioned at the level of the capillary endothelial cell nucleus. Red blood cells (r) are also
seen. Several intracellular organelles are demonstrated in this view, including cell nuclei (N), mitochondria (m) and numerous dense, round
zymogen granules (zg) that store digestive enzymes prior to their secretion into the gut, clustered at the apical end of the acinar cells. b, Full
resolution view of the acinus in the centre of a. Again the nucleus (N), nucleolus (n), mitochondrion (m) and zymogen granule (z) are demon-
strated, but now in more detail. Patterns of ®ne linear lucencies are also visible in the basolateral region of some cells. These may represent
endoplasmic reticulum cisternae that are orientated perpendicular to the plane of sectioning (er).
198 B. W. LOO JR ET A L .
q 2000 The Royal Microscopical Society, Journal of Microscopy, 197, 185±201

The major accomplishments of this work, in addition to
the high quality images that were produced, were the
methods we adapted and developed to obtain photometri-
cally accurate X-ray images that allow quantitative
measurements of cellular structures, and to explore large
®elds of view at the maximum resolution of the microscope.
These capabilities were indispensable for the studies we
hoped to undertake. In particular, we planned to make
quantitative estimates, the ®rst of their kind, of the protein
mass of individual zymogen granules in situ, to establish
how that mass varies among these objects, and to
extrapolate such measurements, as well as parameters
such as size and number, to the population as a whole.
Aside from its particular biological interest, such a
capability would illustrate the utility of X-ray microscopy
for ultrastructural research, particularly when there is a
desire to obtain quantitative information about the chemi-
cal contents of an object. The use of automation and
montage assembly techniques makes it possible to overcome
a major shortcoming of X-ray microscopy as a practical tool
q 2000 The Royal Microscopical Society, Journal of Microscopy, 197, 185±201
Fig. 7. (Continued)
DIGITAL IMAGING METHODS FOR X-R AY MICROSCOP Y 199

for biological research to this point ± the inability to
examine a sample of suf®cient size to provide fully realized
generalizations about the material under study.
Acknowledgements
We wish to thank our colleagues at the Center for X-Ray
Optics and the Advanced Light Source at Lawrence
Berkeley National Laboratory, and at the University of
California, San Francisco, Berkeley, and Davis for their help
in this work. In particular, the following people have made
critical contributions, for which we are grateful: Erik H.
Anderson, David T. Attwood, Rolf H. Behrsing, John T.
Brown, Everett H. Harvey, John M. Heck, Aaron J. Lee,
Jesse Lee, Hector Medecki, Jos Polman, Ilse M. Sauerwald,
Hsien-Chen Tseng, Elise Y. Tung-Loo and Ryohei Urata.
B.W.L. gratefully acknowledges the support of a National
Institutes of Health training grant to the UCSF/UCB
Bioengineering Graduate Group, a Laboratory Graduate
fellowship from Associated Western Universities, Inc., and
a fellowship from the Regents of the University of
California. The XM-1 project and the ALS are supported
by the U.S. Department of Energy, Of®ce of Basic Energy
Sciences and Of®ce of Biological and Environmental
Research, and the Laboratory Directed Research and
Development Program of the E. O. Lawrence Berkeley
National Laboratory, under the Department of Energy
contract No. DE-AC03-76SF00098.
We would like to dedicate this paper to the memory of our
friend, colleague, and co-author, Werner Meyer-Ilse (1954±
1999). Dr Meyer-Ilse was the principal scientist responsible
for the development of the XM-1 transmission soft X-ray
microscope at Lawrence Berkeley National Laboratory used
in this study. The microscope was his passion, and he was
intimately involved in every aspect of its design, implemen-
tation, operation, and maintenance. He died on 14 July
1999 from injuries sustained in an automobile accident
while visiting his native Germany. Werner had a rare
combination of integrity, charity, brilliance, and profession-
alism, and he will be sorely missed.
References
Anderson, E.H. & Kern, D. (1992) Nanofabrication of zone plates
for X-ray microscopy. X-Ray Microscopy III: Proceedings of the
Third International Conference, London, September 3±7, 1990 (ed.
by A. G. Michette, G. R. Morrison and C. J. Buckley), pp. 75±78.
Springer-Verlag, Berlin.
Azaria, M. & Hertz, D. (1984) Time delay estimation by generalized
cross correlation methods. IEEE Transactions on Acoustics, Speech
and Signal Processing, ASSP-32, 280±285.
Brown, L.G. (1992) A survey of image registration techniques.
ACM Computing Surveys, 24, 325±376.
Dani, P. & Chaudhuri, S. (1995) Automated assembling of
images: image montage preparation. Pattern Recognition, 28,
431±445.
Davis, J. (1998) Mosaics of scenes with moving objects. Proceedings
of the 1998 IEEE Computer Society Conference on Computer Vision
and Pattern Recognition, Santa Barbara, California, pp. 354±360.
IEEE Computer Society, Los Alamitos.
Dereniak, E.L. & Crowe, D.G. (1984). Optical Radiation Detectors.
John Wiley & Sons, New York.
Eversole, W.L. & Nasburg, R.E. (1983) Maximum likelihood
estimation for image registration. Applications of Digital Image
Processing VI, San Diego, California, August 23±26, 1983 (ed. by
A. G. Tescher), pp. 190±194. Proceedings SPIE, Vol. 432.
Heck, J.M., Attwood, D.T., Meyer-Ilse, W. & Anderson, E.H. (1999)
Resolution determination in x-ray microscopy: an analysis of the
effects of partial coherence and illumination spectrum. J. X-Ray
Sci. Technol. 8, 95±104.
Henke, B.L., Gullikson, E.M. & Davis, J.C. (1993) X±ray interac-
tions: photoabsorption, scattering, transmission, and re¯ection
at E�50±30000 eV, Z�1±92. Atomic Data Nuclear Data Tables.
54, 181±342.
Kirz, J., Jacobsen, C. & Howells, M. (1995) Soft X-ray microscopes
and their biological applications. Q. Rev. Biophys. 28, 33±130.
Knapp, C.H. & Carter, G.C. (1976) The generalized correlation
method for estimation of time delay. IEEE Transactions on
Acoustics, Speech and Signal Processing, ASSP-24, 320±327.
Krivanek, O.L. & Mooney, P.E. (1993) Applications of slow-scan
CCD cameras in transmission electron microscopy. Ultramicro-
scopy. 49, 95±108.
Loo, B.W. Jr, Parvin, B. & Rothman, S.S. (1996) Two- and three-
dimensional segmentation for measurement of particles in the
analysis of microscopic digital images of biological samples.
Three-Dimensional Microscopy: Image Acquisition and Processing III,
San Jose, California, January 30±February 1, 1996 (ed. by C. J.
Cogswell, G. S. Kino and T. Wilson), pp. 209±215. Proceedings
SPIE, Vol. 2655.
Meyer-Ilse, W., Medecki, H., Brown, J.T., Heck, J.M., Anderson, E.H.,
Stead, A., Ford, T., Balhorn, R., Petersen, C., Magowan, C. &
Attwood, D.T. (1998) X-ray microscopy in Berkeley. X-Ray
Microscopy and Spectromicroscopy: Proceedings of the Fifth International
Conference, WuÈrzburg, August 19±23, 1996 (ed. by J. Thieme, G.
Schmahl, D. Rudolph and E. Umbach), pp. I-1±I-12. Springer, Berlin.
Meyer-Ilse, W., Medecki, H., Jochum, L., Anderson, E., Attwood, D.,
Magowan, C., Balhorn, R., Moronne, M., Rudolph, D. & Schmahl,
G. (1995) New high-resolution zone-plate microscope at Beamline
6.1 of the ALS. Synchrotron Radiation News, 8, 29±33.
Pratt, W.K. (1974) Correlation techniques of image registration.
IEEE Transactions on Aerospace and Electronic Systems, AES-10,
353±358.
Rothman, S., Anderson, E., Attwood, D., Batson, P., Buckley, C.,
Goncz, K., Howells, M., Jacobsen, C., Kern, D., Kirz, J., Rarback,
H., Rivers, M., Shu, D., Tackaberry, R. & Turek, S. (1990) Soft
x-ray microscopy in biology and medicine: status and prospects.
Physica Scripta, T31, 18±22.
Rothman, S.S., Goncz, K.K. & Loo, B.W. Jr (1992) Following protein
transport with the high resolution x-ray microscope. X-Ray
Microscopy III: Proceedings of the Third International Conference,
London, September 3±7, 1990 (ed. by A. G. Michette, G. R.
Morrison and C. J. Buckley), pp. 373±383. Springer-Verlag, Berlin.
200 B. W. LOO JR ET A L .
q 2000 The Royal Microscopical Society, Journal of Microscopy, 197, 185±201

Schmahl, G., Rudolph, D., Niemann, B. & Christ, O. (1980) Zone-
plate x-ray microscopy. Q Rev. Biophys. 13, 297±315.
Schmahl, G., Rudolph, D., Schneider, G., Thieme, J., Schliebe, T.,
Kaulich, B. & Hettwer, M. (1996) Diffraction optics for X-ray
imaging. Microelectron. Eng. 32, 351±367.
Thieme, J., Schmahl, G., Rudolph, D. & Umbach, E. (eds) (1998) X-ray
Microscopy and Spectromicroscopy: Proceedings of the Fifth Interna-
tional Conference, WuÈrzburg, August 19±23, 1996. Springer, Berlin.
Turner, J.N., Ancin, H., Becker, D.E., Szarowski, D.H., Holmes, M.,
O'Connor, N., Wang, M., Holmes, T. & Roysam, B. (1997)
Automated image analysis technologies for biological 3D light
microscopy. Int J. Imag. Syst. Technol. 8, 240±254.
Vogt, R.C., Trenkle, J.M. & Harmon, L.A. (1996) Mosaic construc-
tion, processing, and review of very large electron micrograph
composites. Applications of Digital Image Processing XIX, Denver,
Colorado, August 7±9, 1996 (ed. by A. G. Tescher), pp. 2±15.
Proceedings SPIE, Vol. 2847.
Wilhein, T., Rothweiler, D., Tusche, A., Scholze, F. & Meyer-Ilse, W.
(1994) Thinned, back-illuminated CCDs for x-ray microscopy. X-
Ray Microscopy IV: Proceedings of the Fourth International
Conference, Chernogolovka, Russia, September 20±24, 1993 (ed.
by V. V. Aristov and A. I. Erko), pp. 470±474. Bogorodskii
Pechatnik, Chernogolovka.
q 2000 The Royal Microscopical Society, Journal of Microscopy, 197, 185±201
DIGITAL IMAGING METHODS FOR X-R AY MICROSCOP Y 201