Author's personal copy - ATEX · structures, namely fcc, bcc and hcp. The fcc structure was ......
14
Author's personal copy Spatial correlation in grain misorientation distribution Benoı ˆt Beausir a,b, * , Claude Fressengeas a , Nilesh P. Gurao b , La ´szlo ´ S. To ´th a , Satyam Suwas b a Laboratoire de Physique et Me ´canique des Mate ´riaux, Universite ´ Paul Verlaine – Metz/CNRS, Ile du Saulcy, 57045 Metz, France b Department of Materials Engineering, Indian Institute of Science, Bangalore 560012, India Received 25 June 2009; received in revised form 20 July 2009; accepted 20 July 2009 Available online 21 August 2009 Abstract Grain misorientation was studied in relation to the nearest neighbor’s mutual distance using electron back-scattered diffraction mea- surements. The misorientation correlation function was defined as the probability density for the occurrence of a certain misorientation between pairs of grains separated by a certain distance. Scale-invariant spatial correlation between neighbor grains was manifested by a power law dependence of the preferred misorientation vs. inter-granular distance in various materials after diverse strain paths. The obtained negative scaling exponents were in the range of 2 ± 0.3 for high-angle grain boundaries. The exponent decreased in the pres- ence of low-angle grain boundaries or dynamic recrystallization, indicating faster decay of correlations. The correlations vanished in annealed materials. The results were interpreted in terms of lattice incompatibility and continuity conditions at the interface between neighboring grains. Grain-size effects on texture development, as well as the implications of such spatial correlations on texture modeling, were discussed. Ó 2009 Acta Materialia Inc. Published by Elsevier Ltd. All rights reserved. Keywords: Misorientation; Spatial correlation; Geometrically necessary dislocations; Grain boundary; Internal stresses 1. Introduction Studies of grain–boundary misorientation distributions commonly use the Mackenzie analysis [1]. In its original version, the analysis provides the probability density of misorientation between one grain and all other grains of a polycrystalline material while the modified version deals with correlated distribution. In this work only the misori- entations between one grain and its nearest neighbors are shown. This representation is very useful in assessing the grain–boundary character as well as the influence of grain–boundary properties on mechanical behavior [2]. It has also been used to generate initial grain orientations for further simulations of texture development [3]. How- ever, providing the distribution of misorientations and of grain–boundary types by their frequency of occurrence does not exhaust the description of the impact of grain boundaries on mechanical behavior. Texture development, recrystallization and many properties like fracture may also be controlled by the spatial arrangement of the grain– boundary orientation and misorientation distribution. For example, it has been suggested that c-axis orientation, polygonization and recrystallization in polycrystalline ice samples may be sensitive not only to grain-to-grain misori- entation but also to spatial aspects such as grain size or boundary length between neighboring grains [4,5]. How- ever, a general approach to the problem of defining a quan- titative measure for the spatial non-uniformity of the grain–boundary distribution has not been developed so far. In particular, the Mackenzie distribution overlooks the potential dependence of grain–boundary misorienta- tion on spatial aspects. It is therefore unable to reflect pos- sible correlation between grain–boundary misorientation and any distance characterizing the pairs of neighboring grains. Yet, if such a spatial correlation exists, grains can- not be considered separately and independently. Moreover, their rotation rates must be connected, which will have a 1359-6454/$36.00 Ó 2009 Acta Materialia Inc. Published by Elsevier Ltd. All rights reserved. doi:10.1016/j.actamat.2009.07.035 * Corresponding author. Address: Laboratoire de Physique et Me ´ca- nique des Mate ´riaux, Universite ´ Paul Verlaine – Metz/CNRS, Ile du Saulcy, 57045 Metz, France. E-mail address: [email protected] (B. Beausir). www.elsevier.com/locate/actamat Available online at www.sciencedirect.com Acta Materialia 57 (2009) 5382–5395
Transcript of Author's personal copy - ATEX · structures, namely fcc, bcc and hcp. The fcc structure was ......

Author's personal copy
Spatial correlation in grain misorientation distribution
Benoıt Beausir a,b,*, Claude Fressengeas a, Nilesh P. Gurao b, Laszlo S. Toth a, Satyam Suwas b
a Laboratoire de Physique et Mecanique des Materiaux, Universite Paul Verlaine – Metz/CNRS, Ile du Saulcy, 57045 Metz, Franceb Department of Materials Engineering, Indian Institute of Science, Bangalore 560012, India
Received 25 June 2009; received in revised form 20 July 2009; accepted 20 July 2009Available online 21 August 2009
Abstract
Grain misorientation was studied in relation to the nearest neighbor’s mutual distance using electron back-scattered diffraction mea-surements. The misorientation correlation function was defined as the probability density for the occurrence of a certain misorientationbetween pairs of grains separated by a certain distance. Scale-invariant spatial correlation between neighbor grains was manifested by apower law dependence of the preferred misorientation vs. inter-granular distance in various materials after diverse strain paths. Theobtained negative scaling exponents were in the range of �2 ± 0.3 for high-angle grain boundaries. The exponent decreased in the pres-ence of low-angle grain boundaries or dynamic recrystallization, indicating faster decay of correlations. The correlations vanished inannealed materials. The results were interpreted in terms of lattice incompatibility and continuity conditions at the interface betweenneighboring grains. Grain-size effects on texture development, as well as the implications of such spatial correlations on texture modeling,were discussed.� 2009 Acta Materialia Inc. Published by Elsevier Ltd. All rights reserved.
Keywords: Misorientation; Spatial correlation; Geometrically necessary dislocations; Grain boundary; Internal stresses
1. Introduction
Studies of grain–boundary misorientation distributionscommonly use the Mackenzie analysis [1]. In its originalversion, the analysis provides the probability density ofmisorientation between one grain and all other grains ofa polycrystalline material while the modified version dealswith correlated distribution. In this work only the misori-entations between one grain and its nearest neighbors areshown. This representation is very useful in assessing thegrain–boundary character as well as the influence ofgrain–boundary properties on mechanical behavior [2]. Ithas also been used to generate initial grain orientationsfor further simulations of texture development [3]. How-ever, providing the distribution of misorientations and ofgrain–boundary types by their frequency of occurrence
does not exhaust the description of the impact of grainboundaries on mechanical behavior. Texture development,recrystallization and many properties like fracture may alsobe controlled by the spatial arrangement of the grain–boundary orientation and misorientation distribution.For example, it has been suggested that c-axis orientation,polygonization and recrystallization in polycrystalline icesamples may be sensitive not only to grain-to-grain misori-entation but also to spatial aspects such as grain size orboundary length between neighboring grains [4,5]. How-ever, a general approach to the problem of defining a quan-titative measure for the spatial non-uniformity of thegrain–boundary distribution has not been developed sofar. In particular, the Mackenzie distribution overlooksthe potential dependence of grain–boundary misorienta-tion on spatial aspects. It is therefore unable to reflect pos-sible correlation between grain–boundary misorientationand any distance characterizing the pairs of neighboringgrains. Yet, if such a spatial correlation exists, grains can-not be considered separately and independently. Moreover,their rotation rates must be connected, which will have a
1359-6454/$36.00 � 2009 Acta Materialia Inc. Published by Elsevier Ltd. All rights reserved.
doi:10.1016/j.actamat.2009.07.035
* Corresponding author. Address: Laboratoire de Physique et Meca-nique des Materiaux, Universite Paul Verlaine – Metz/CNRS, Ile duSaulcy, 57045 Metz, France.
E-mail address: [email protected] (B. Beausir).
www.elsevier.com/locate/actamat
Available online at www.sciencedirect.com
Acta Materialia 57 (2009) 5382–5395

Author's personal copy
strong impact on the overall texture development. Indeed,Winther et al. [6] have shown that the variations in currentgrain orientations in a textured material are larger thanthose expected on the sole basis of differences in their initialorientations. These authors suggest that the unexpectedvariation is likely to originate in interactions with neigh-boring grains. Such spatial interactions are not properlyaccounted for in the polycrystal plasticity models currentlyused for the simulation of texture development, although inrecent times there has been the opinion that this aspectshould be taken into account. Spatial interactions arecertainly not accounted for in approaches using theconventional Taylor or Sachs assumptions. Self-consistentmodels do consider interactions between a homogeneousgrain and an equivalent infinite homogeneous matrix repre-senting the rest of the material [7], but only in an averageway, with no special consideration to length scales or tospecific neighbor grains. Bolmaro et al. [8] and Tomeet al. [9] account for the interactions between neighborgrains in a two-sites self-consistent scheme, by enforcingthe same lattice reorientation and maintaining the grains’relative misorientation, a condition dubbed “co-rotation”of neighbor grains. Crystal plasticity finite-element-basedmodels dedicated to texture development simulation mayaccount as well for interactions arising from the enforce-ment of continuity of the elastic spin at grain boundaries[10,11]. Finally the so-called LAMEL model [12–14] alsoaccounts for interactions between a grain and its nearestneighbors by assuming continuity of some components ofthe traction and velocity gradient tensors at grain bound-aries. All of these schemes tend to reduce the intensity ofthe simulated textures, in closer agreement with experimen-tal results. However, the continuity conditions proposed inRefs. [8–14] clearly lack the understanding of the interac-tions between dislocation content of grain boundaries,internal stresses arising from grain–boundary incompatibil-ity and deformation mechanisms in the neighboring grains.
Recent advances in the electron back-scattered diffrac-tion technique (EBSD) give access to information such asthe spatial location of grains in the scanned microstructurearea. Therefore, an extension of the original Mackenzieanalysis accounting, on a third axis, for some distancebetween grains now becomes feasible at reasonable expenseand a quantitative measure for the spatial non-uniformityof the grain–boundary distribution is possible to establish.From this information, the objective of the present paper isto give evidence for, and characterize quantitatively, thegrain-to-grain interactions. Further, it is to explain theirorigin as well as justify the need for “co-rotation type”
schemes in texture modeling. In this aim, the probabilityfor encountering a grain–boundary misorientation at acertain inter-granular distance has been systematicallyanalyzed. Spatial correlations in grain–boundary misorien-tation distributions have been investigated in diversemicrostructures spanning over a wide range of materials(pure and alloyed body-centered cubic (bcc), face-centeredcubic (fcc) and hexagonal close packed (hcp) metals), under
various loading conditions. In some deformation modes,process parameters like temperature and strain rate werealso varied. In addition several heat treatments were per-formed after deformation in some samples. The rest ofthe paper is laid out as follows. In Section 2, the detailsof materials and experimental conditions are presented aswell as a comprehensive account of the analysis. The actualexperimental results are shown in Section 3. A discussionincluding an analysis of lattice incompatibility across grainboundaries follows in Section 4, with concluding remarksin Section 5.
2. Experiments
Table 1 includes the main features of the 21 experimen-tal studies carried out to provide the background for thiswork, with details of the material, the nature of deforma-tion and the respective experimental conditions. The testsused pure and alloyed metals, which were selected to berepresentative examples of the three main crystallographicstructures, namely fcc, bcc and hcp. The fcc structure wassampled by nickel, copper, copper–0.3chromium and Cu–10Zn, the bcc structure by IF steel, and hcp by titanium,magnesium and Mg–3Al. The samples were deformed bytorsion, tension, compression, symmetric or asymmetricrolling and equal channel angular extrusion (ECAE). Insome experiments, two of these processes, such as ECAEand rolling, were used. As a consequence, the tests covereda wide range of plastic strain. Depending on the deforma-tion mode, the equivalent von Mises (EQVM) strainachieved was in the range of 0.36–5.7. The tests were alsoconducted in different temperature and strain-rate condi-tions, from room temperature (RT) to 300 �C and from10�4 s�1 to 0.3 s�1. After deformation, some of the sampleswere annealed for different periods of time to achieve differ-ent extent of static recrystallization. As a consequence ofthese treatments, the grain size of materials under investi-gation had a range from less than 1 lm in ECAEed mate-rials to several tens of lm in other materials.
Table 1 is subdivided into four parts. Part 1 containssamples subjected to deformation only, whereas Part 2includes samples that were deformed plus annealed. SeveralMg samples in which dynamic recrystallization took placeduring the tests have been grouped in the third part. Thelast part of the table presents three samples of Cu–0.3Crdeformed by four ECAE passes, with two of them annealedat 500 �C for 5 and 60 min.
All samples were systematically examined through elec-tron back-scattered diffraction (EBSD), using a FEI-SIRI-ON field emission gun scanning electron microscope(FEG–SEM). Grain neighbors were identified and listed.From the measurements, each grain could be characterizedby its orientation in the sample reference frame through itsthree Euler angles (u1, u, u2) and, in complement, by itslocation in the scanned area. The elementary pixel was cho-sen to be a square-shaped pixel with a size ranging from0.05 to 1 lm depending on the grain size. Sets of connected
B. Beausir et al. / Acta Materialia 57 (2009) 5382–5395 5383

Author's personal copy
and similarly oriented pixels (within a grain tolerance angleset to 5� for all samples) were grouped to define “grains”.Thus, the minimum misorientation between two grains is5�. Grains containing less than 2 pixels were not retainedfor the analysis. Although the pixel to pixel misorientationwithin a grain is small, the spread of orientation in a graincan be relatively large, as shown in Fig. 1. Once a grain isconstructed in this manner, it is represented by the spatialposition of its center of gravity in the 2D scan and an ori-entation that is the average of the orientation of all pixelsconstituting the grain. The scanned area was taken as largeas possible in order to obtain satisfactory statistical sam-pling, with as many indexed grains and pairs of grains aspossible (one pair is defined as a grain and one of its neigh-bors). The overall indexation rates were quite high andonly the measurement points above 0.1 confidence index(CI) were considered (CI being a statistical measure ofaccuracy in automated indexing, with a scale of 0–1). Table1 also includes the information about the number ofindexed grains and the number of pairs of grains involvedin each test. Using the Euler angles, and the orthogonalrotation tensor R mapping the sample reference frame onto
the grain reference frame, the rotation between two neigh-bor grains gi and gj can be expressed by the tensor
M ¼ Rgi � Rtgj; ð1Þ
where Rgi and Rgj are the rotation tensors of grains gi andgj, respectively. The rotation angle hij between grains gi andgj can be obtained from the tensor M as hij = arccos[(tr(M) � 1)/2] [1]. Depending on the crystal structure, anumber of symmetry matrices (24 for cubic and 12 for hex-agonal metals) have to be applied on Rgi and Rgj, to finallyretain the minimum of hij as the misorientation between thetwo grains [1]. In addition to misorientation, the distanceDij = |ri � rj| between the centers of gravity is calculatedfor each pair of grains. By complementing the conventionalMackenzie distribution with this distance information,we shall define the misorientation correlation function(MCF) as the probability density f(h, D) for the jointoccurrence of pairs of grains with misorientation h and sep-arated by distance D. Let us denote by ðh;DÞ the intervalsof length (Dh, DD) centered on the misorientation and dis-tance values (h, D), and Nð�h;DÞ the number of pairs of
Table 1Experimental details.
Part No. Material Test Temp.(�C)
EQVM Strain-rate(s�1)
Note Nb. ofgrains
Nb. ofpairs
Averagediameter(lm)
Averagedistance(lm)
1 M1 Cu Torsion RT 5.70 0.3 Recrystallization twins 16,001 29,171 1.67 6.73M2 Cu Torsion RT 4.66 10�2 Recrystallization twins 17,050 28,301 2.51 5.22M3 Cu Torsion RT 4.10 10�4 Mostly deformed grains 16,575 27,164 0.63 0.98M4 Ti Comp./X RT 0.36 3 � 10�4 Deformation twins 2878 7039 6.82 15.3M5 Ti Comp./Y RT 0.36 3 � 10�4 Deformation twins 845 2162 5.83 10.9M6 Ni Torsion RT 3.50 10�4 Mostly deformed grains 4206 9357 0.21 0.49M7 Cu–
10ZnTorsion RT 4.75 0.3 Mostly deformed grains 8638 20,903 1.02 1.30
M8 Cu–10Zn
Torsion RT 2.00 10�4 Mostly deformed grains 28,371 71,235 0.54 0.86
M9 Mg–3Al Torsion 250 0.45 10�4 Mostly DRXed grains 2213 5577 4.49 14.0M10 IF steel ECAE 3Bca 300 3.46 �2 � 10�3 Very small grains 1685 1698 0.21 0.96
2 M11 Ni Rolling RT 0.3 �10�2 Coarse grains, annealed1200 �C 10 h
185 423 146.2 231.6
M12 Mg ECAE 4Bc 250 4.62 �2.10�3 Annealed 500 �C one hour 1701 2589 23.9 109.3M13 Mg ECAE
3Bc + rolling (80%)250 + RT 4.59 �2.10�3 Annealed 500 �C one hour 498 903 53.8 115.5
3 M14 Mg ECAE 4A 250 4.62 �2 � 10�3 Mostly DRXed grains 5224 9497 5.5 8.48M15 Mg ECAE 4Bc 250 4.62 �2 � 10�3 Mostly DRXed grains 6388 15,701 5.72 7.76M16 Mg ECAE 4C 250 4.62 �2 � 10�3 Mostly DRXed grains 4865 10,329 6.21 8.84M17 Mg ECAE
3Bc + rolling (80%)250 + RT 4.59 �2 � 10�3 Mostly DRXed grains 5328 7060 1.88 3.41
M18 Mg Asymmetric rolling RT �1.68 �10�3 Mostly DRXed grains 7126 16,866 2.1 2.89
4 M19 Cu–0.3Cr
ECAE 4Bc RT 4.62 �2 � 10�3 Mostly deformed grains 11,065 23,797 0.36 0.74
M20 Cu–0.3Cr
ECAE 4Bc RT 4.62 �2 � 10�3 Annealed 500 �C 5 mn 3789 9872 0.63 1.18
M21 Cu–0.3Cr
ECAE 4Bc RT 4.62 �2 � 10�3 Annealed 500 �C 60 mn 5100 12,026 1.22 1.85
a “ECAE 3Bc” meaning 3 ECAE passes in route Bc.
5384 B. Beausir et al. / Acta Materialia 57 (2009) 5382–5395

Author's personal copy
grains simultaneously encountered in these two intervals. IfN is the total number of grains dealt with in the analysis,the probability density f(h, D) is defined as
Nð�h;DÞN
¼Z
�h
ZD
f ðh;DÞdhdD: ð2Þ
It is normalized such thatZh�
ZD�
f ðh;DÞdhdD ¼ 1 ð3Þ
where h� and D� are the largest misorientation and distanceintervals available in the EBSD map, respectively. In prac-tice, f(h, D) is approximated by the following summation:
f ðh;DÞ � Nð�h;DÞNDhDD
¼ 1
NDhDD
XN
i¼1
XN
j¼1
vDðDiÞv�hðhjÞ: ð4Þ
Here use is made of the “indicator” functions vDðDiÞ ¼ 1, ifDi 2 D and vDðDiÞ ¼ 0 otherwise, v�hðhjÞ ¼ 1 if hj 2 �h andv�hðhjÞ ¼ 0 otherwise. Note that, as it is a probability den-sity, f ðh;DÞ can be locally larger than one. Although ithas differences with the orientation correlation function(OCF) introduced by Adams et al. [15], the MCF thus de-fined is very similar in spirit. We recall that the OCF is theprobability density for the joint occurrence of grain orien-tation g at a point P and orientation g0 at point P0, where(P, P0) are separated by a vector r. Hence, the OCF de-scribes a point-to-point crystal orientation correlation inreal space, whereas the MCF is concerned with a grain-to-grain misorientation correlation accounting for grain-to-grain distance in an EBSD map. Also related to theMCF is the misorientation distribution function (MDF)defined by Bunge [16]. The MDF describes the probabilitythat a grain boundary separates grains of a certain misori-entation. However, any other information on distance thancontiguity through grain boundary is overseen. Providing
more detailed information than the MDF, while posing lessformidable technical challenges than the OCF, the MCFadequately provides insights into microstructure analysisand possible spatial correlation in misorientation distribu-tion. Thorough absence of spatial correlation should be re-flected by a complete independence of the MCF on thegrain-to-grain distance. The existence of a preferred dis-tance and a preferred misorientation should translate intoa Gaussian bell-shaped MCF. Spatial correlation arisingfrom grain-to-grain interactions should give rise to mono-tonically decreasing MCFs with distance, as will be seenwith more details in the next section. Note that, since allcorrelations are expected to vanish at large distances com-pared with the average grain size, only the nearest neigh-bors need to be considered in practice.
3. Results and analysis
Fig. 2 shows the MCF in four materials with distinctmicrostructural features such as twinning or dynamicrecrystallization. Two limiting effects can be noted at once.At very short distances, a finite resolution effect isobserved: the MCF drops down to zero, because there isa finite minimum grain size in the sample. Similarly, a finitesize effect occurs at large distances: clearly, the MCF mustalso be zero when the inter-granular distance exceeds thesize of the sample. Between these two extremes, the mapsin Fig. 2a–c for Materials 1, 10 and 4, respectively (seeTable 1) display marked maxima at short distances for spe-cific misorientation angles, with monotonic decay of theMCF as the distance increases, which suggests that the pre-ferred misorientations are mostly met at short inter-granu-lar distances. Fig. 2a corresponds to a copper sample(Material 1 in Table 1) deformed in torsion up to �e ¼ 5:7with an applied strain rate of 0.3 s�1. Two distinct peaksare seen in the MCF. They correspond to primary and sec-ondary recrystallization twins. The analysis shows that,under such conditions, primary recrystallization twins formin about 45% of the processed pairs of grains and second-ary recrystallization twins in about 15–20%. The differencein the descending trend of the peaks suggests that primaryrecrystallization twins are twice as large as secondarytwins, consistent with evidence that nucleation of second-ary twins is constrained by primary twins. Fig. 2b showsan IF steel sample (Material 10 in Table 1, obtained byECAE) with very small average grain size (about 0.2 lm).Primary recrystallization twins R3 and the CSL R13 arerespectively present in about 15% and 25% of the pairs ofgrains investigated, and the MCF extends well beyondthe average grain size. Fig. 2c shows titanium compressedup to �e ¼ 0:36 (Material 4 in Table 1). The figure showsthat tensile and compressive twins with about the same sizeoccur more frequently than low-angle grain boundariesand that they concern larger grains (see also the corre-sponding EBSD map in Fig. 3). In contrast, Fig. 2d showsa more even distribution with distance in Material 11(annealed cold-rolled nickel), which suggests that the pre-
0 40 80 120 160
Distance (µm)
0
10
20
30
Mis
orie
ntat
ion
(°)
intragranular misorientations
along line 1
along line 2
Fig. 1. Intra-granular misorientations in titanium compressed up to�e ¼ 0:36 (Material 4 in Table 1), see location of the lines in Fig. 3.
B. Beausir et al. / Acta Materialia 57 (2009) 5382–5395 5385

Author's personal copy
ferred misorientation, corresponding to primary recrystalli-zation twins R3, is met more uniformly in grains of all sizes.
The cross-sections of the three-dimensional distributionmaps by constant misorientation planes were analyzed. Inall cases considered in what follows but one explicitly men-tioned, cross-sections are drawn through the maximum ofthe MCF, and the latter is provided as a function of theinter-granular distance D in the selected plane. In all fig-ures, the parts of the curves affected by the finite resolutioneffects at small and large distances are removed. Let us con-sider first the samples listed in Part 1 of Table 1 (includingthose in Fig. 2abc at preferred misorientations h = 60�, 30�and h = 90�, respectively), shown in logarithmic scale inFig. 4a. In all the 10 cases, the curves can be fitted in powerlaw form F / d�s with exponent s = 2 ± 0.3. The finite sizeeffect is clearly in evidence, as several curves bow in anddepart from the linear trend at large distances. Remnantsof the finite resolution effect can also be noticed, with thecurve bowing in at short distances for some materials(Materials 1: copper in torsion, and 5: titanium in compres-sion). It was checked that fitting the curves with exponen-tial or C-function dependence was less convincing, asillustrated in Fig. 5 for the case of Material 1 (copper intorsion).
A power-law relationship F / d�s is indication of self-similarity of the dependency: regardless of the distance,the same scaling exponent s describes the asymptotic
behavior of F. Moreover, if the MCF satisfies the powerlaw F / d�s, it also obeys the functional equationF ðkdÞ ¼ k�sF ðdÞ (and vice versa). This scaling symmetryimplies that no characteristic length, i.e., no particularinter-granular distance is involved in the spatialdependence of the MCF. Thus, the power-law relationshipsuggests scale-invariant spatial correlation between neigh-boring grains. It is remarkable that this scaling behavioris found in materials with all major crystalline structures,irrespective of a particular loading path. It is valid for allthe range of grain size in the material, from less than1 lm in ECAEed IF steel (Material 10) to about 50 lmin titanium (Material 4). In order to ascertain the conjec-ture, surrogate sets of data were generated by disregisteringgrain misorientation and distance: specifically, misorienta-tion and distance of a particular pair of grains were disso-ciated and randomly redistributed among the same set ofgrains. Clearly, the conventional Mackenzie distributionremains unaffected in the process, since it does not involveinter-granular distance. Similarly, crystallographic textureplots do not reveal any difference between the two datasets. The spatial dependency of the surrogate distributionsis shown in Fig. 4b in logarithmic scales. It is clearly seenthat the scale-invariant behavior is lost in the surrogatedata. Instead, the misorientation first increases up to a pre-ferred inter-granular distance, beyond which it decreases. Acomparison with Fig. 4b confirms that the scaling behavior
Fig. 2. Misorientation correlation function (MCF) of copper after torsion (a), IF steel after ECAE (b), titanium after compression (c) androlled + annealed nickel (d).
5386 B. Beausir et al. / Acta Materialia 57 (2009) 5382–5395

Author's personal copy
in Fig. 4a is linked with correct registry of the pairs ofgrains, and that on splitting misorientation and inter-gran-ular distance, or ignoring distances, significant information
is lost. Before considering Part 2 of Table 1, let us mentionin addition that a cross-section of the distribution map forMaterial 4 through the local misorientation maximumðh ¼ 10�Þ obtained for low-angle grain boundaries (seeFig. 2c) also displays scale-invariant spatial correlation,but with larger scaling exponent s ffi 2.5 suggesting fasterdecay (not shown in a figure) than for high-angle grainboundaries. When the misorientation angle is even smaller,spatial correlation is altogether absent, as seen from the flatdistributions in Fig. 2.
In Part 2 of Table 1, materials listed were deformed andsubsequently annealed (including Material 11 alreadyshown in Fig. 2d). The cross-sections of the distributionmaps by equal misorientation planes are shown inFig. 6a. As could be guessed from Fig. 2d, fitting the curveswith power laws cannot be worked out and, instead, pre-ferred distances emerge from the analysis. Further,Fig. 6b shows that surrogate data sets built by randomlyredistributing misorientations and distances among thepairs of grains as detailed above, does not result in any sig-nificant change in the curves. Hence, correct registry of thepairs of grains is indifferent in Fig. 6, and scale-invariantspatial correlations evidenced in the set of materials inFig. 4a are clearly absent from the second set in Fig. 6. Itis certainly tempting to attribute this absence of long dis-tance correlation to the annealing treatment. Fig. 7a nowpresents the MCF vs. distance curves for the samples inPart 3 of Table 1. In those samples, significant dynamicrecrystallization (DRX) was detected in the course ofstraining. The curves bow in at their upper left part, sug-gesting a quite even distribution at very short distances,but their decreasing lower right part can be fitted with apower law with exponent s ffi 3.3. Fig. 7b shows the corre-sponding curves for the surrogate data: the scaling behav-
Fig. 3. Inverse pole figures of the transverse plane containing thecompression direction in titanium compressed up to �e ¼ 0:36 (Material 4in Table 1).
b 3 4 5 6 789 2 3 4 5 6 789 2 3 4 5 6 789 2 3 4 5 6 7891E+0 1E+1 1E+2 1E+3
D (µm)
2
3
456789
2
3
456789
2
3
456789
1E-4
1E-3
1E-2
MC
F
M1 - Cu - Torsion - 0.3 s-1
M2 - Cu - Torsion - 7.7.10-3 s-1
M3 - Cu - Torsion - 7.7.10-5 s-1
M4 - Ti - Compression - 1
M5 - Ti - Compression - 2
M6 - Ni - Torsion - 7.7.10-5 s-1
M7 - Cu-10Zn - Torsion - 0.3 s-1
M8 - Cu-10Zn- Torsion - 7.7.10-5 s-1
M9 - AM30 - Torsion - 7.7.10-5 s-1
M10 - IF Steel - ECAE
Surrogate data
2 3 4 5 6 7 8 9 2 3 4 5 6 7 8 9 2 3 41E-1 1E+0 1E+1
D (µm)
23456789
23456789
23456789
23456789
23
1E-4
1E-3
1E-2
1E-1
1E+0
MC
F
-1.92
-1.85-1.72
-1.70
-2.07
-2.11
-1.92-2.25 -2.07
-1.79
a
Real data M1 - Cu - Torsion - 0.3 s-1
M2 - Cu - Torsion - 7.7.10-3 s-1
M3 - Cu - Torsion - 7.7.10-5 s-1
M4 - Ti - Compression - 1
M5 - Ti - Compression - 2
M6 - Ni - Torsion - 7.7.10-5 s-1
M7 - Cu-10Zn - Torsion - 0.3 s-1
M8 - Cu-10Zn- Torsion - 7.7.10-5 s-1
M9 - AM30 - Torsion - 7.7.10-5 s-1
M10 - IF Steel - ECAE
Fig. 4. Misorientation correlation functions (MCF) as function of distance D for deformed samples (samples in Part 1 of Table 1) at preferredmisorientation (a) as measured data and (b) surrogate data.
B. Beausir et al. / Acta Materialia 57 (2009) 5382–5395 5387

Author's personal copy
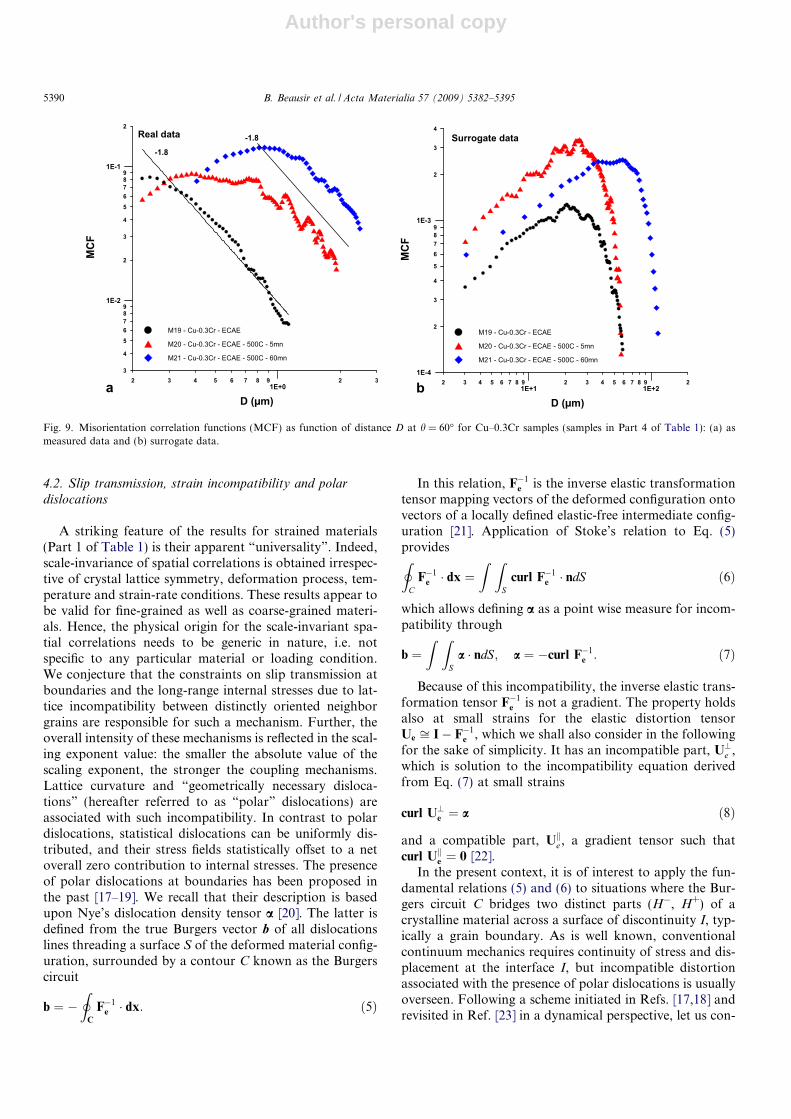
ior present in Fig. 7a is clearly lost when randomization ofdistance vs. misorientation is plotted. Hence, the figure sug-gests scale-invariant spatial correlations, although with fas-ter decay than in “only deformed” materials (Fig. 4a).Finally, the results for three Cu–0.3%Cr samples (Part 4of Table 1) deformed up to four passes of ECAE, two ofthese samples being subsequently annealed at 500 �C for5 and 60 min, respectively, are presented in Fig. 8 by iso-levels of the MCF. Real data are plotted in Fig. 8a–c,and surrogate data in Fig. 8d–f. Two preferred misorienta-tions are seen at about 10� and 60� in purely deformed sam-ples (Fig. 8a) with a maximum occurring at 0.3 lm. Notethat the grain size obtained from the four ECAE passesamounts to 0.2 lm. After 5 min of annealing, the 10� mis-
orientation maximum vanishes, while the 60� misorienta-tion peak strongly increases and extends over the range(0.3–0.7 lm) (Fig. 8b). After annealing for 1 h, the grainsgrow by static recrystallization, which levels further themisorientation peak over the distance range (0.3–1.5 lm).Surrogate data (Fig. 8d–f) consistently show more homoge-neous distribution than their real data counterparts. Cross-sections at 60� misorientation of these iso-level maps areplotted in Fig. 9a,b. As can be seen from Fig. 9a, scalingbehavior with exponent s � 2 is obtained for the deformedsample in Fig. 8a, for the whole range of distances. Whenthe material is annealed, the range of scaling behavior isdegraded at short distances, where misorientation becomesmore homogeneous and a preferred characteristic distanceis seen. However, the slope s � 2 is still perceived on ashorter range at long distances. Clearly, these last twocurves resemble more and more their surrogate data coun-terparts (see Fig. 9b). These results are clearly supportingthe notion that annealing lessens spatial correlation in themisorientation distribution.
4. Discussion
4.1. Effect of measuring method
It might be argued, not unreasonably, that the results inSection 3 are relative to an EBSD map (a particular imageof the material), but not to the material itself. For example,the analysis is such that a grain inside the map has no corre-lation with a grain outside the map, and, hence, there is map-dependency of the results. However, these effects impact pri-marily on grains located close to the borders of the map, andthey are of limited concern once the number of grains pro-cessed in the map is made large enough (usually several thou-sands in our data sets). Similarly, maps are two-dimensional
2.00 6.00 10.00 14.00 18.004.00 8.00 12.00 16.00 20.00
D (µm)
0.01
0.02
0.03
0.04
0.00
0.01
0.02
0.03
0.04
MCF
M1 - Cu - Torsion - 0.3 s-1
Power, log(Y)=B*log(X)+A
Exponential, log(Y)=B*X+A
Gamma law, k=1.3, theta=4
Fig. 5. Comparison of power law, exponential law and gamma law fittingson copper sample deformed in torsion at 0.3 s�1 (Material 1).
b4 5 6 7 8 9 2 3 4 5 6 7 8 9 2 3
3+E12+E1D (µm)
2
3
4
5
6
7
89
2
1E-5
1E-4
MCF
M11 - Ni - rolling + Annealing
M12 - Mg - ECAE - 4 passes route Bc - Annealed - 500°C
M13 - Mg - ECAE + Rolling - Annealed - 500°C
Surrogate data
a 4 5 6 7 8 9 2 3 4 5 6 7 8 9 2 3 42+E11+E1
D (µm)
3
4
56789
2
3
4
56789
2
1E-4
1E-3
MCF
M11 - Ni - rolling + Annealing
M12 - Mg - ECAE - 4 passes route Bc - Annealed - 500°C
M13 - Mg - ECAE + Rolling - Annealed - 500°C
Real data
Fig. 6. Misorientation correlation functions (MCF) as function of distance D for annealed samples (samples in Part 2 of Table 1) at preferredmisorientation (a) as measured data and (b) surrogate data.
5388 B. Beausir et al. / Acta Materialia 57 (2009) 5382–5395

Author's personal copy
representations of real materials, which are three-dimen-sional. Apart from strongly anisotropic morphologies, suchas lamellar or columnar crystals, two-dimensional mapscan, however, be chosen to be representative of the real mate-rial morphology. There is also some degree of arbitrariness inthe choices made in implementing the analysis. For example,the distance between grains is defined as the distance betweentheir centers of gravity and, as already mentioned, the crystalorientations are defined as averages over their cross-sectionwith the plane of the map to account for intragranular orien-tation gradients in defining their misorientation. Althoughother options are possible, these choices do not seem unrea-sonable if crystal orientation gradients are such that individ-
ual grains can be defined at all. It might be argued that weonly account for the interactions of a particular grain withits nearest neighbors. If spatial correlations are to be uncov-ered, one may wonder why they should not extend to moreremote grains. However, the origin of the spatial interactionlies in the material contiguity corresponding to intergrainconnection. Hence, the probability (Eq. (2)) makes morephysical sense when limited to the grain nearest neighbors.Since the correlations quickly decrease with distance, withexponent at least of the order of 2, extending the summationto all pairs of grains would screen short-distance correlationsby overwhelming the statistics with large numbers of uncou-pled grains.
b2 3 4 5 6 7 8 9 2 3 4 5 6
2+E11+E1D (µm)
2
3
4
5
6789
2
3
4
1E-5
1E-4
MCF
M14 - Mg - ECAE - 4 passes route A - 250°C
M15 - Mg - ECAE - 4 passes route Bc - 250°C
M16 - Mg - ECAE - 4 passes route C - 250°C
M17 - Mg - ECAE + Rolling
M18 - Mg - ASR - RT
Surrogate data
a 2987654321+E10+E1
D (µm)
2
3
456789
2
3
456789
2
1E-4
1E-3
1E-2
MCF
M14 - Mg - ECAE - 4 passes route A - 250°C
M15 - Mg - ECAE - 4 passes route Bc - 250°C
M16 - Mg - ECAE - 4 passes route C - 250°C
M17 - Mg - ECAE + Rolling
M18 - Mg - ASR - RT
-3.3 -3.3 -3.3
Real data
Fig. 7. Misorientation correlation functions (MCF) as function of the distance D for samples where significant DRX took place (samples in Part 3 ofTable 1) at preferred misorientation (a) as measured data and (b) surrogate data.
Fig. 8. Iso-levels of the misorientation correlation function (MCF) as function of distance D and misorientation h for Cu–0.3Cr samples (samples in Part 4of Table 1): (a–c) as measured data and (d–f) surrogate data.
B. Beausir et al. / Acta Materialia 57 (2009) 5382–5395 5389
Author's personal copy
4.2. Slip transmission, strain incompatibility and polar
dislocations
A striking feature of the results for strained materials(Part 1 of Table 1) is their apparent “universality”. Indeed,scale-invariance of spatial correlations is obtained irrespec-tive of crystal lattice symmetry, deformation process, tem-perature and strain-rate conditions. These results appear tobe valid for fine-grained as well as coarse-grained materi-als. Hence, the physical origin for the scale-invariant spa-tial correlations needs to be generic in nature, i.e. notspecific to any particular material or loading condition.We conjecture that the constraints on slip transmission atboundaries and the long-range internal stresses due to lat-tice incompatibility between distinctly oriented neighborgrains are responsible for such a mechanism. Further, theoverall intensity of these mechanisms is reflected in the scal-ing exponent value: the smaller the absolute value of thescaling exponent, the stronger the coupling mechanisms.Lattice curvature and “geometrically necessary disloca-tions” (hereafter referred to as “polar” dislocations) areassociated with such incompatibility. In contrast to polardislocations, statistical dislocations can be uniformly dis-tributed, and their stress fields statistically offset to a netoverall zero contribution to internal stresses. The presenceof polar dislocations at boundaries has been proposed inthe past [17–19]. We recall that their description is basedupon Nye’s dislocation density tensor a [20]. The latter isdefined from the true Burgers vector b of all dislocationslines threading a surface S of the deformed material config-uration, surrounded by a contour C known as the Burgerscircuit
b ¼ �I
C
F�1e � dx: ð5Þ
In this relation, F�1e is the inverse elastic transformation
tensor mapping vectors of the deformed configuration ontovectors of a locally defined elastic-free intermediate config-uration [21]. Application of Stoke’s relation to Eq. (5)providesI
CF�1
e � dx ¼Z Z
Scurl F�1
e � ndS ð6Þ
which allows defining a as a point wise measure for incom-patibility through
b ¼Z Z
Sa � ndS; a ¼ �curl F�1
e : ð7Þ
Because of this incompatibility, the inverse elastic trans-formation tensor F�1
e is not a gradient. The property holdsalso at small strains for the elastic distortion tensorUe ffi I� F�1
e , which we shall also consider in the followingfor the sake of simplicity. It has an incompatible part, U?e ,which is solution to the incompatibility equation derivedfrom Eq. (7) at small strains
curl U?e ¼ a ð8Þ
and a compatible part, Uke , a gradient tensor such thatcurl Uke ¼ 0 [22].
In the present context, it is of interest to apply the fun-damental relations (5) and (6) to situations where the Bur-gers circuit C bridges two distinct parts (H�, H+) of acrystalline material across a surface of discontinuity I, typ-ically a grain boundary. As is well known, conventionalcontinuum mechanics requires continuity of stress and dis-placement at the interface I, but incompatible distortionassociated with the presence of polar dislocations is usuallyoverseen. Following a scheme initiated in Refs. [17,18] andrevisited in Ref. [23] in a dynamical perspective, let us con-
b 2 3 4 5 6 7 8 9 2 3 4 5 6 7 8 9 22+E11+E1
D (µm)
2
3
4
5
6789
2
3
4
1E-4
1E-3
MCF
M19 - Cu-0.3Cr - ECAE
M20 - Cu-0.3Cr - ECAE - 500C - 5mn
M21 - Cu-0.3Cr - ECAE - 500C - 60mn
Surrogate data
a 32987654321E+0
D (µm)
3
4
56789
2
3
4
56789
2
1E-2
1E-1
MCF
M19 - Cu-0.3Cr - ECAE
M20 - Cu-0.3Cr - ECAE - 500C - 5mn
M21 - Cu-0.3Cr - ECAE - 500C - 60mn
-1.8
-1.8Real data
Fig. 9. Misorientation correlation functions (MCF) as function of distance D at h = 60� for Cu–0.3Cr samples (samples in Part 4 of Table 1): (a) asmeasured data and (b) surrogate data.
5390 B. Beausir et al. / Acta Materialia 57 (2009) 5382–5395

Author's personal copy
sider the Burgers circuit sketched in Fig. 10. The unit vec-tor n normal to the interface I is oriented from H� to H+
and l is an arbitrary unit vector lying in the interface.The Burgers circuit is a rectangle of length L in the direc-tion of vector l and width h = h� + h+ in the transversedirection, oriented by the cross product n � l (H� andH+ have respective width h� and h+). According to rela-tions (5) and (6), it is seen that
8l 2 I ;Z Z
Sa � ðn� 1ÞdS ¼ �
IC
F�1e � dx: ð9Þ
Let us assume that a continuous distribution of polar dis-locations exists on both sides of the interface, as well as a sin-gular distribution of surface dislocations a(I) along theinterface. The limit of continuous fields approaching theinterface I from above is assigned the superscript “+”, andthat of fields approaching I from below the superscript “�”.Hence, the discontinuity in a field x at the interface is denoted[x] = x+ � x�. Note that the components of the distributiona(I) of surface dislocations are expressed as the non-dimen-sional ratio of a Burgers vector length nb over a segmentlength L in the direction of unit vector l, whereas the compo-nents aij of tensor a have dimension m�1 (Burgers vectorlength over unit area m�2). In the limit of the Burgers circuitcollapsing onto point P when h�, h+ tend to zero and L
shrinks along l, relation (9) becomes
8l 2 I ; aðIÞ � n� l ¼ �½F�1e � l: ð10Þ
Using the tensor cross product A � n defined as:8l; ðA� nÞt � l ¼ At � l� n, relation (10) can also be writtenin the form:
8l 2 I ; ðatðIÞ � nÞt � l ¼ ½F�1e � l ð11Þ
or, equivalently,
ðatðIÞ � nÞt � n ¼ ½F�1e � n: ð12Þ
This relation between the dislocation content of theinterface and the jump in the inverse elastic transformationit accommodates can be thought of as a generalized Frank–Bilby relation [17,18]. To see this, assume for example thatthe elastic deformation be negligible on both sides of theinterface. Hence, the material deforms in a purely visco-plastic manner and the elastic transformation tensorreduces to its orthogonal part: Fe ¼ Re; R�1
e ¼ Rte, which
represents material rotation. For the sake of simplicity,we shall further assume infinitesimal rotations. ThenF�1
e ¼ Rte ffi I� xe, where xe is the skew-symmetric part
of the elastic distortion tensor Ue, i.e., the elastic spin ten-sor. Introducing the equivalent elastic spin vector Xe suchthat: 8l; xe � l ¼ Xe � l, relation (11) becomes.
8l 2 I ; ðatðIÞ � nÞt � l ¼ �½Xe � l: ð13ÞEq. (13) provides the dislocation content of the interfaceaccommodating the discontinuity in the elastic spin, whichessentially achieves the purpose of Frank’s relation. Forexample, assume that the jump in elastic spin belongs tothe interface, say: ½Xe ¼ h n� l. Then ½Xe � l ¼
h ðn� lÞ � l ¼ �h n, and the left-hand side of Eq. (13) isðatðIÞ � nÞt � l ¼ h n, or equivalently: aðIÞ � l� n ¼ h n.Defining the singular dislocation density aðIÞ as: aðIÞ ¼ðnb=LÞb t, where B ¼ ðnb=LÞb is the Burgers vector andt the line vector (b and t being unit vectors), it is seen fromthe last equation that b = n, t = l � n and L/n = b/h.Hence, the surface dislocation density aðIÞ describes theinterface I as a tilt boundary, composed of edge disloca-tions with line direction aligned with the elastic spin andBurgers vector normal to the interface. The well-knownrelation L/n = b/h describes the spacing of dislocations inthe tilt boundary. In such a model, the interface is viewedas having no width, and any jump in rotation betweenthe neighboring crystals can be accommodated by a singu-lar dislocation distribution, by just choosing the appropri-ate dislocation spacing according to Frank’s relation.Hence, this model does not predict any correlation in therotation of neighboring crystals. In contrast, if the intentis to describe the grain boundary as a region of finite width,the notion of a singular dislocation density must be surren-dered, and the distribution of the dislocation density in theinterface area must be considered as continuous in bothcrystals H� and H+ (as well as other field variables). Inthe context of such a continuous model for grain bound-aries, the generalized Frank–Bilby relation (12) becomes
½F�1e � n ¼ 0 ð14Þ
or equivalently
8l 2 I ; ½F�1e � l ¼ 0: ð15Þ
Whereas in the singular representation of a grain bound-ary, there is no material continuity along the interface,Eq. (15) implies “tangential continuity” across the inter-face. Indeed, the inverse elastic mapping of any tangentialmaterial vector of the deformed configuration must lead tothe same material vector on both sides of the interface.Using the standard elastic–plastic decomposition of thetransformation gradient tensor F ¼ Fe � Fp [24], the tangen-tial continuity condition ((14) and (15)) on F�1
e can be com-plemented by a reverse condition on Fp. Indeed, continuityof the displacement is required by continuum mechanics,
I
C
l
n h+
h-
P ln×
S
L
H +
H −
Fig. 10. Sketch of interface I between sub-domains (H�, H+), with normalvector n. The unit vector l is an arbitrary vector in the interface. TheBurgers circuit C surrounds surface S bridging over the interface I, andoriented by the cross-product n � l normal to surface S.
B. Beausir et al. / Acta Materialia 57 (2009) 5382–5395 5391

Author's personal copy
which implies that the inverse transformation gradient F�1
satisfies tangential continuity along the interface
½F�1 � n ¼ 0 or 8l 2 I ; ½F�1 � l ¼ 0 ð16Þa condition commonly referred to as Hadamard’s kine-matic compatibility condition [25]. Hence, the jump ½F�1
e in the elastic transformation tensor is offset by a jump[Fp] in the plastic transformation tensor satisfying therelation
8l 2 I ; ½F�1e � l ¼ ½Fp � F�1 � lþ Fp � ½F�1 � l ¼ 0 ð17Þ
or, substituting Eq. (16) in Eq. (17),
8l0 2 I0; ½Fp � l0 ¼ 0; l0 ¼ F�1 � l: ð18ÞHere (l0, I0) are the images of (l, I) in the reference config-uration, mapped from (l, I) through the inverse transfor-mation gradient. If n0 is a vector normal to the interfaceI0 in the reference configuration, Eq. (18) is equivalent to
½Fp � n0 ¼ 0: ð19ÞIn order to understand the implications of the result
(Eqs. (14)–(19)), it may be useful to reconsider the exampleof a purely viscoplastic material submitted to infinitesimaltransformations. Eq. (13), which is relevant to that case,now becomes
8l 2 I ; ½Xe � l ¼ 0 ð20Þwhich implies
½Xe ¼ 0: ð21ÞHence, continuity of the elastic spin is required across
the interface. This condition can also be retrieved fromthe dynamic continuity condition set out in Ref. [23] (seeRefs. [26,27]). Thus, although a singular model is eligible,a more accurate (continuous) description of the grainboundary implies the existence of spatial correlationsbetween neighboring crystals, because limiting values ofthe elastic spin from the two sides of the surface of discon-tinuity are required to be equal. When material elasticity isincluded in the description, the correlation in crystal rota-tion is less stringent than the strict co-rotation implied byEq. (21). Indeed, still assuming infinitesimal transforma-tions, Eq. (15) becomes in that case
Ue � n ¼ 0; 8l 2 I ; ½Xe � l ¼ �½ee � l: ð22ÞProjecting onto the orthogonal frame (e1 = l, e2 = n � l,e3 = n), one obtains in component form
½Xe1 ¼ ½ee
23; ½Xe2 ¼ ½ee
31; ½Xe3 ¼ ½ee
12: ð23Þ
Here, ee is the symmetric part of the elastic distortiontensor Ue, i.e., the elastic deformation tensor. Like Ue, ee
has an incompatible part, e?e , due to the presence of polardislocations, and a compatible part, eke , which contributesto the solution of the elasto-plastic boundary value prob-lem. Due to the presence of e?e , Eqs. (22) and (23) show thatthe jump in elastic spin across the grain boundary is depen-dent on the presence of polar dislocations in this area. Such
a result comes in full support of the conjecture presentedup front in this section. It shows that a consistent theoryof texture development needs to have non-local character,and that the latter derives from lattice incompatibility inthe grain–boundary region.
Gradients in the elastic spin are in direct relation withthe polar dislocation content, as testified by the followingrelation [21]:
grad Xe ¼ curl ete � at � 1
2trðaÞI
� �: ð24Þ
Hence, the above conjecture can be experimentally ver-ified by investigating intragranular lattice rotation gradi-ents, particularly in the vicinity of grain boundaries. Theprocedure is the very same as that utilized in Section 3for grain-to-grain misorientation. An example is presentedin Fig. 1 for a large grain in Material 4 (compressed tita-nium). Two oriented lines were selected (see Fig. 3) alongwhich misorientation with respect to the dot-marked refer-ence point was calculated. Along Line 1, the misorientationremains nearly constant (less than 2–3� variation) on thefirst 50 lm then strongly increases to finally reach 28� closeto the opposite grain boundary. On Line 2, largerfluctuations (4–5�) are seen in the first 120 lm then, similarto Line 1, the misorientation increases by about 20� in20 lm close to the grain boundary. These strong gradientsare indication of the presence of a large density of polardislocations in the neighborhood of grain boundaries,which is supporting the views expressed earlier. Note thatthe length scale over which the influence of the tangentialcontinuity conditions (14), (22) and (23) reaches into thematerial is not implied by these conditions. The scalinglaws uncovered in Section 3 as well as the above measure-ments show that it extends well into the first neighborgrains. Similar measurements described in Ref. [28] alsosupport these views.
4.3. Incidental dislocation boundaries
On average, the incidental dislocation boundaries(IDBs), which separate dislocation cells and develop smallmisorientation angles, were not considered in the presentpaper, because, as already mentioned, the minimum mis-orientation angle was set to a much larger value: 5�. How-ever, the relative absence of correlation noticed above forsmall misorientation angles is consistent with their proper-ties. Indeed, IDBs are thought to form by statistical trap-ping of glide dislocations, a mechanism not involving thelattice incompatibility associated with the presence of polardislocations [29–31]. Further, plots of scaled IDB distribu-tions reveal the existence of a universally preferred misori-entation [29–31], a property at odds with the scale-invariance shown here for high-angle boundaries. Notethat the higher-angle boundaries between dislocation cellsreferred to as “geometrically necessary boundaries” donot convincingly show the same statistical features as IDBs[29–31], which is again consistent with the present under-
5392 B. Beausir et al. / Acta Materialia 57 (2009) 5382–5395

Author's personal copy
standing. Finally, there is no obstacle to extending thepresent analysis to dislocation cell boundaries by settingthe minimum misorientation angle to a value smallerthan 5�.
4.4. Effect of grain refinement during large plastic strain
Severe plastic deformation (SPD) not only leads to theformation of dislocation cells and IDBs but usually resultsin the fragmentation of the grains that initially compose thepolycrystal. At extreme strains, an outcome of grain refine-ment can be the production of ultra-fine-grained polycrys-tals with exceptional mechanical properties (see a review ofSPD processes in Ref. [32]). ECAE is one of the mostpromising techniques that are used for this purpose. Largepart of our database was obtained by using this techniqueand substantial amount of grain size reduction is believedto have taken place in those tests.
Grain refinement can be looked at as a result of latticeincompatibility developing in the initial grains. The grad-ual increase in misorientation across initial sub-grainboundaries can be attributed to pile-ups of the polar dis-locations that produce lattice curvature in this area. It isplastic strain which drives the progressive transformationof low-angle sub-grain boundaries into high-angle bound-aries. As shown above, this process changes dramaticallythe MCF, whose character shifts from uncorrelatedto spatially correlated. While it cannot be excludedthat the new grains keep the misorientation of theirparent grains during fragmentation, polar dislocationsare still present in their new boundary area, with theconsequences described in Section 4.2. The continuityconstraints lead to an orientational relationship betweenthe new grains. This interaction is expected to be stron-ger near to the grain boundary, which suggests that theorientational constraint should be more stringent insmaller grains.
4.5. Effect of annealing: low-angle boundaries
Since one of the most prominent effects of annealing isto relax internal stresses, the above conjecture is also con-firmed a contrario by the absence of spatial correlationsapparent in Fig. 6 in samples annealed after straining. Fur-ther support to the conjecture is obtained from Fig. 9,which provides evidence for the decay of spatial correla-tions and the shortening of the scaling range when theannealing treatment is made stronger. Additional argu-ments in support of the conjecture can be made from thefaster decay (or absence) of spatial correlations in the caseof low-angle grain boundaries and in samples undergoingdynamic recrystallization (DRX) (Fig. 7). Indeed, low-angle grain boundaries are considered as being associatedwith low intensity of internal stresses, and one of the pri-mary effects of DRX is to lower this intensity level in therecrystallized grains by erasing incompatible lattice rota-tion gradients.
4.6. Grain-size dependence
The presence of polar dislocations at grain boundariesas a result of constraints on grain-to-grain slip transmissionhas been recognized as being of primary significance in theinterpretation of the grain-size dependence of the flowstress, i.e. the Hall–Petch effect. Indeed, boundaries act asstrong barriers to dislocation motion, as evidenced by dis-location pile-ups. The propagation of plastic slip activityacross grain boundaries by activation of sources in neigh-bor grains is also thought to be related to the internal stres-ses originating from these dislocation pile-ups, aphenomenon commonly used to explain the propagationof Luders bands. Interactions between polar dislocationsand grain boundaries are even more complex when bound-aries are set into motion through twinning or dynamicrecrystallization. It is to be mentioned here that powerlaw statistics have also been shown to characterize thescale-invariant self-organization of plastic activity in icepolycrystals, as reflected by the associated acoustic emis-sion [33]. In this paper, the property was ascribed to spatialcorrelations in relation with long-range interactions andincompatible lattice distortion. Although the average grainsize sets an internal length scale reflecting a barrier to dis-location motion, the authors have shown that the self-orga-nized character of plastic activity extends towards lengthscales much larger than the average grain size [33], whichcomes in support of the present findings.
4.7. Effect on texture strength
By appending the elastic spin continuity condition (20)to the framework of a finite deformation crystal viscoplas-tic finite element setting, Mach et al. [26] have predictedtexture development in rolling simulations for face-cen-tered cubic (fcc) metals. Their results reproduce the trendalready alluded to in the present paper to reduced intensityof the predicted crystallographic texture with respect toTaylor-type or viscoplastic self-consistent type predictions,and match more closely the experimental data. Includingincompatible lattice distortion in the continuity conditions,as done in Eqs. (21) and (22), might lead to an additionalimprovement of the predictions. Another direct conse-quence of the grain-to-grain spatial correlation evidencedin this paper is that the strength of the crystallographic tex-ture should be higher in coarse-grained than in fine-grainedmaterials. Indeed, the large value of the probability forencountering a specific boundary pattern at short inter-granular distances limits the propensity of the strainingpath to generate marked textures in fine-grained materials.Experimental evidence of a grain size effect on texturestrength can be found in recent papers [34,35]. Jain et al.[34] show that the texture strength index increases withgrain size in magnesium alloy AZ31B after annealing(Table 1, Ref. [34]) and suggest that this issue is criticalin the grain-size dependence of the twin volume fractionafter tensile loading. Park and Szpunar [35] provide similar
B. Beausir et al. / Acta Materialia 57 (2009) 5382–5395 5393
Author's personal copy
information for the cold rolling textures developed in twosamples of electrical steel: Fig. 2 of Ref. [35] shows a muchstronger texture component in the large grained steel thanin the fine-grained steel. These authors also suggest thatthis difference can be considered as being inherited fromthe texture difference between the two steels in the annealedstate. Similar observation was reported by Anderson et al.[36] while examining rolling texture of Cu/Nb polycrys-talline multilayers with variable thicknesses, where theKurdjumov–Sachs orientation relationship was validacross the fcc/bcc interface. The experimental rolling tex-tures indicated that the Kurdjumov–Sachs relation was lostfor the “thick” layers, while it was preserved to a largedegree for the “thin” layers, which is consistent with thetrends implied by our scaling relations.
5. Conclusion
Scaling laws have been uncovered in the distribution ofgrain misorientation vs. inter-granular distance in variousmaterials under diverse loading paths corresponding to dif-ferent processing methods. In the absence of annealing, thescaling exponent is of the order of s = 2 ± 0.3 for high-angle grain boundaries, however, it increases (in absolutevalue) for low-angle grain boundaries, or under dynamicrecrystallization. Sequential annealing after deformationleads to uncorrelated distributions. These results argue forinter-granular scale-free spatial correlations through con-straints on slip transmission across boundaries, long-rangeinternal stresses due to strain incompatibility between dis-tinctly oriented neighbor grains, and for lattice curvatureassociated with the presence of polar dislocations at grainboundaries. In the framework of a field dislocation theory,such correlation assumes the form of tangential continuityconditions on the inverse elastic transformation tensor oron the plastic transformation tensor, in the deformed andreference configurations respectively. In an infinitesimaltransformation setting, these conditions provide the jumpin the elastic spin vector across the boundary as a functionof the jump in the incompatible elastic distortion.
Implications of the scale-invariant law on misorienta-tion vs. inter-granular distance and grain-to-grain continu-ity conditions are the trend to milder texture development,and the size dependence of the latter. The coarser the grainstructure, the stronger is the texture induced by the strainpath. Several experimental verifications of the effect wereprovided; however, a more systematic investigation is stilldesirable. From the point of view of modeling, our resultsimply that a consistent theory of texture developmentneeds to have non-local character, since limiting values ofelastic spin on both sides of a grain boundary should havea relationship.
Acknowledgments
The authors would like to acknowledge the Departmentof Science and Technology (DST), Government of India
for providing financial grant for a part of this project.The work also used the facility set up under InstituteNanoscience Initiative sponsored by DST-FIST programat IISc, Bangalore. The authors gratefully acknowledgeSatyaveer Singh Dhinwal and Somjeet Biswas (IISc, Ban-galore) for their help in the experiments, Armand J. Beaud-oin, Louisette Priester, Thiebaud Richeton and AnthonyD. Rollett for their suggestions and careful reading of themanuscript.
Appendix. Supplementary material
A Fortran program for the calculation of the Misorien-tation Correlation Function can be found at www.benoit-beausir.e3b.org.
References
[1] Mackenzie JK. Biometrika 1958;45:229.[2] Gertsman VY, Tangri K. Acta Metall Mater 1995;43:2317.[3] Ryoo HS, Hwang SK, Kim MH, Kwun SI, Chae SW. Scr Mater
2001;44:2583.[4] Alley RB, Gow AJ, Meese DA. J Glaciol 1995;41:197.[5] Durand G, Persson A, Samyn D, Svenssson A. Earth Planet Sci Lett
2008;265:666.[6] Winther G, Margulies L, Schmidt S, Poulsen HF. Acta Mater
2004;52:2863.[7] Hill R. J Mech Phys Solids 1965;13:89.[8] Bolmaro RE, Lebensohn RA, Brokmeier HG. Comp Mater Sci
1997;9:237.[9] Tome CN, Lebensohn RA, Necker CT. Metall Mater Trans
2002;33A:2635.[10] Bolmaro RE, Fourty A, Signorelli JW, Brokmeier HG. Mater Sci Eng
2006;14:1.[11] Signorelli JW, Turner PA, Sordi V, Ferrante M, Vieira EA, Bolmaro
RE. Scr Mater 2006;55:1099.[12] Delannay L, van Houtte P, Samajdar I. J Phys IV 1999;9:43.[13] van Houtte P, Delannay L, Samajdar I. Textures Microstruct
1999;31:109.[14] van Houtte P, Li S, Seefeldt M, Delannay L. J Int Plast 2005;21:589.[15] Adams BL, Morris PR, Wang TT, Willden KS, Wright SI. Acta
Metall 1987;35:2935.[16] Bunge HJ. Texture analysis in materials science. London: Butterworth;
1982.[17] Frank FC. In: Symposium on the plastic deformation of crystalline
solids. Pittsburgh: Mellon Institute; 1950. p. 150 [NAVEXOS-P-834].[18] Bilby BA. Bristol conference report on defects in crystalline
solids. London: The Physical Society; 1955. p. 123.[19] Ashby MF. Philos Mag 1970;21:399.[20] Nye JF. Acta Metall 1953;1:153.[21] Kroner E. Continuum theory of defects in physics of defects. In:
Balian R et al., editors. Les Houches, Session XXXV, 1980. NorthHolland Publishing Company; 1981.
[22] Acharya A. J Mech Phys Solids 2001;49:761.[23] Acharya A. Philos Mag 2007;87:1349.[24] Lee EH. J Appl Phys 1969;36:1.[25] Hadamard J. Lec�ons sur la propagation des ondes et les equations de
l’hydrodynamique. Paris: Herman; 1903.[26] Mach J, Beaudoin AJ, Acharya A. Continuity in the plastic strain rate
and its influence on texture evolution. J Mech Phys Solids; in press.[27] Mach J. PhD thesis, University of Illinois at Urbana Champaign,
2009.[28] Mishra SA, Pant P, Narasimhan K, Rollett AD, Samajdar I. Scr
Mater 2009;61:273–6.
5394 B. Beausir et al. / Acta Materialia 57 (2009) 5382–5395

Author's personal copy
[29] Hughes DA, Liu Q, Chrzan DC, Hansen N. Acta Mater1997;45:105–12.
[30] Hughes DA, Liu Q, Chrzan DC, Hansen N. Phys Rev Lett1998;81:4664–7.
[31] Godfrey A, Hughes DA. Scr Mater 2004;51:831–6.[32] Valiev RZ, Langdon TG. Prog Mater Sci 2006;51:881–981.
[33] Richeton T, Weiss J, Louchet F. Nature Mater 2005;4:465.[34] Jain A, Duygulu O, Brown DW, Tome CN, Agnew SR. Mater Sci
Eng 2008;486A:545.[35] Park JT, Szpunar JA. J Magn Magn Mater 2008;321:1928.[36] Anderson PM, Bingert JF, Misra A, Hirth JP. Acta Mater
2003;51:6059.
B. Beausir et al. / Acta Materialia 57 (2009) 5382–5395 5395