Author's personal copy - UTSAs personal copy ... Wolfgang, 2004; Smart, 2009; ... While there is...
13
This article appeared in a journal published by Elsevier. The attached copy is furnished to the author for internal non-commercial research and education use, including for instruction at the authors institution and sharing with colleagues. Other uses, including reproduction and distribution, or selling or licensing copies, or posting to personal, institutional or third party websites are prohibited. In most cases authors are permitted to post their version of the article (e.g. in Word or Tex form) to their personal website or institutional repository. Authors requiring further information regarding Elsevier’s archiving and manuscript policies are encouraged to visit: http://www.elsevier.com/copyright
Transcript of Author's personal copy - UTSAs personal copy ... Wolfgang, 2004; Smart, 2009; ... While there is...

This article appeared in a journal published by Elsevier. The attachedcopy is furnished to the author for internal non-commercial researchand education use, including for instruction at the authors institution
and sharing with colleagues.
Other uses, including reproduction and distribution, or selling orlicensing copies, or posting to personal, institutional or third party
websites are prohibited.
In most cases authors are permitted to post their version of thearticle (e.g. in Word or Tex form) to their personal website orinstitutional repository. Authors requiring further information
regarding Elsevier’s archiving and manuscript policies areencouraged to visit:
http://www.elsevier.com/copyright
Author's personal copy
Construct validation of the Behavior and Instructional Management Scale
Nancy K. Martin*, Daniel A. SassUniversity of Texas, San Antonio, USA
a r t i c l e i n f o
Article history:Received 19 July 2009Received in revised form2 December 2009Accepted 7 December 2009
Keywords:Behavior managementDisciplineInstructional managementClassroom managementValidityReliability
a b s t r a c t
Beliefs related to classroom management vary among teachers and play an important role in classrooms.Despite the importance of this construct, valid measures have proven difficult to develop. This studyevaluated the psychometric properties of the Behavior and Instructional Management Scale (BIMS),a short but valid measure of teachers' approaches to behavioral and instructional management. Resultsrevealed a two-factor solution that possessed a good model fit, with large estimated factor loadings usingconfirmatory factor analysis. Evidence of validity was obtained with the Ohio State Teacher Efficacy Scale.Internal consistency for both subscales was adequate. Implications for future research are discussed.
� 2009 Elsevier Ltd. All rights reserved.
1. Introduction
Classroom management has consistently been identified asa salient concern for teachers (Ladd, 2000; Willower, Eidell, & Hoy,1967). In addition, a meta-analysis of 50 years of researchconcluded that classroommanagement is a powerful component ofthe overall classroom climate as it impacts the level of studentengagement, the frequency of inappropriate behavior, and, byextension, the quality of student learning (Wang, Haertel, & Wal-berg, 1994).
Although often used interchangeably, classroom managementand discipline are not synonymous. The term discipline typicallyrefers to the structures and rules describing the behavior expectedof students and teacher efforts to ensure that students comply withthose rules. However, the literature generally defines classroommanagement as an umbrella term that encompasses teacher effortsto oversee the activities of the classroom including studentbehavior, student interactions and learning (Burden, 2000; Evert-son & Harris, 1999; Evertson & Weistein, 2006; Good & Brophy,2000; Iverson, 2003). It is operationalized as behavioral tendenciesthat teachers utilize to conduct daily instructional activities. Thesetendencies reflect the teacher's discipline, communication, andinstructional styles. All of these aspects manifest in the teacher'spreferences and efforts to attain desirable educational goals. Still,
there is no general consensus regarding the specific facets of theconstruct.
Teachers' beliefs and attitudes regarding the nature of studentbehaviors and how to manage classrooms vary and can play animportant role in the determination of their behavior (Erden &Wolfgang, 2004; Smart, 2009; Urich & Tobin, 1989; Willower et al.,1967;Wolfgang & Glickman,1980, 1986). As teachers form opinionsabout how classrooms should be managed, they attempt to oper-ationalize their beliefs by institutionalizing a code for classroominteractions and behaviors (Smart, 2009; Urich & Tobin, 1989).Observation of classroom teachers is one excellent way to gaininformation regarding classroom management beliefs and prac-tices. However, research suggests other means may also beappropriate and provides evidence of a relationship betweenteachers' behaviors and their beliefs. Urich and Tobin (1989)describe a first-year teacher's ideological evolution from “teacheras comedian” “to” “teacher as social director.” This shift in thinkingresulted in changes in teaching behavior and striking improve-ments in the classroom environment. Similarly, Smart's (2009)observational study triangulated teacher interviews regardingbeliefs with classroom behaviors. Thus, it seems feasible that a linkexists between teacher beliefs and perceptions regarding classroommanagement style and proclivity to behavior.
Clearly, the study of this construct has important implications forthe dynamics of teaching and learning. Although a large corpus ofresearch exists regarding discipline, the body of knowledge relatedto the broader construct of classroommanagement is much smaller.Research in this area has been stymied by the complexity of the
* Corresponding author at: The University of Texas-San Antonio, Department ofEducational Psychology, One UTSA Circle, San Antonio, TX 78249, USA.
E-mail address: [email protected] (N.K. Martin).
Contents lists available at ScienceDirect
Teaching and Teacher Education
journal homepage: www.elsevier .com/locate/ tate
0742-051X/$ e see front matter � 2009 Elsevier Ltd. All rights reserved.doi:10.1016/j.tate.2009.12.001
Teaching and Teacher Education 26 (2010) 1124e1135

Author's personal copy
construct and the nature and quality of instruments presentlyavailable to measure it. In order to create significant momentum inthis field of research, a quality instrument is needed. To that end, thepurpose of this paper is to present a new measure of the construct.
1.1. Nature and quality of existing measures
Historically, research has relied on the widespread use of twoinstruments, the Pupil Control Ideology (PCI) (Willower et al., 1967)and the Beliefs on Discipline Inventory (BDI) (Glickman & Tamashiro,1980; Wolfgang & Glickman, 1980, 1986). Both scales are focused onthe narrower concept of discipline rather than the broader constructof classroom management.
Similarly, in an effort to measure teachers' efficacy related toclassroom management, a number of scales include a dimensionthat attempts to address this facet of the construct, e.g.: ClassroomManagement/Discipline Efficacy, and theOhio State Teacher EfficacyScale (De la Torre Cruz & Casanova Arias, 2007; Emmer & Hickman,1991; Tschannen-Moran & Woolfolk Hoy, 2001). However, theseinstruments address teachers' perceptions regarding their ability tocreate an orderly classroom rather than their approach to it.Although one's efficacy and classroom management approach arelikely related, the two are not the same. This premise furtherdemonstrates the need for a behavior management and instruc-tional management scale, as the approach taken purportedlydepends on both the teachers' attitudes and the classroom envi-ronment. Stated differently, what a teacher believes is the bestbehavior and instructional management style may not be realizeddepending on the class environment.
BasedontheBeliefsonDiscipline Inventory (Wolfgang&Glickman,1980), Martin and colleagues developed the Attitudes and Beliefson ClassroomControl Inventory (ABCC) (Martin, Yin, & Baldwin,1998;Martin, Yin, & Mayall, 2007), formerly titled the Inventory of Class-room Management Style (ICMS) (Baldwin & Martin, 1994). Althoughthis instrument addresses the broader construct of classroommanagement, neither the original nor revised versions are withoutpsychometric concerns.Onemajorproblemwith thismeasurewasthevery high interfactor correlation, thus making it inappropriate forfactor analysis models and lacking discriminate validity. In addition,researchers often cannot use these subscales in combination giventhat multicollinearity often existed and thus neither predictor wouldprovide any unique variability. Also troubling, is the fact that itemsoften did not load on the theorized factor structure using an explor-atory factor analysis (EFA) (Henson, 2003; Savran & Cakiroglu, 2003).Clearly, a more refined instrument is needed.
1.2. Theoretical framework
Howteachers interactwithstudents isbasedontheirpersonal setsof beliefs regarding how children develop (Erden &Wolfgang, 2004).The teacher's objectives and approach will vary depending on thetheoretical lens through which he or she views their students.GlickmanandTamashiro (1980) andWolfgang (1995) conceptualizeda framework to explain teacher beliefs regarding child development.Based on an integration of theoretical perspectives, the underlyingcontinuum of control underlies the dimensions within the BIMS andhypothesizes three approaches to teacherestudent interaction: non-interventionist, interventionist, and interactionalist.
The non-interventionist assumes the child has an inner drive thatneeds to find its expression in the real world. Interventionists anchorthe opposite end of the continuum and emphasize what the outerenvironment does to shape the human organism in a particular way.The non-interventionist is the least directive and controlling, whilethe interventionist is most controlling. Traditional behavior modifi-cation provides the theoretical foundation for the interventionist's
school of thought. Models of classroom management such as thosedeveloped by Canter (1992) or Jones (Jones, 1987; Jones & Jones,1990) are examples of the interventionist approach. Proponents ofBerne (1964), Kohn (1996), Harris (1967) (transactional analysis),Ginott (1972) (congruent communication), or Gordon (1974)(teacher effectiveness training) are considered non-interventionists.
Midway between these two extremes, interactionalists focus onwhat the individual does to alter the external milieu, as well aswhat the environment does to shape the individual. Interaction-alists work to find solutions acceptable to both the teacher andstudents and use some of the same techniques as both non-inter-ventionists and interventionists. Theories developed by Adler,Dreikurs, and Glasser provide the framework for interactionalistideology (Wolfgang, 1995). Cooperative Discipline (Albert, 1989)and Judicious Discipline (Gathercoal, 1990) are examples of class-room management models based on interactionalist ideology.While it is assumed that teachers believe and act according to allthree approaches, one usually predominates (Wolfgang, 1995;Wolfgang & Glickman, 1980).
1.3. The connection between behavior management and instruction
It makes sense that the teacher's approach to instruction wouldbe related to their methods of behavior management (WoolfolkHoy & Weinstein, 2006). For example, one would expect directinstruction to be accompanied by a focus on rules, repetition ofacademic skills to be coupled with expectations of obedience.Conversely, student-focused instruction such as discussion andactive inquiry present higher activity and noise levels in theclassroom and result in different behavior management challenges.
In practice, however, the connection between instruction andbehavior management may be inconsistent. While it is widelyaccepted that teachers vary in their classroom approaches, indi-vidual teachers may also vary within themselves. For example,teachers who focus on constructivist approaches to instruction maysimultaneously emphasize strict adherence to rules. AsMcCaslin andGood (1998) explain, “Educators have created an oxymoron:a curriculum that urges problem solving and critical thinking anda management system that requires compliance and narrowobedience” (p. 73). While there is little research to document ordispute this mismatch, Garrett's (2006) qualitative study lends someevidence that a lack of connection between how teachers' thinkabout instruction versus behavior management may exist. Whileteachers thought about instruction as teacher/student-centered,they did not view behavior management through the same lens.
The overarching goal of this paper is to evaluate a new instru-ment, the Behavior and Instructional Management Scale (BIMS).The BIMS is a relatively brief, posited psychometrically soundinstrument that measures teachers' perceptions of theirapproaches to both behavior management and instructionalmanagement. As indicated above, other measures assess eitherteacher beliefs or teacher efficacy regarding behavior and instruc-tional management, but to our knowledge a psychometricallysound instrument that evaluates teacher perceptions of their actualclassroom behaviors is unavailable. Therefore, this measure iscritical to the study of differences that may exist between one'sbeliefs and the ability to execute them within the classroom.
2. Methods
2.1. Participants
Data were collected online from 550 certified teachers employedby three (two urban and one rural) public school districts in thesouthwestern United States. Most participants were females (81.6%)
N.K. Martin, D.A. Sass / Teaching and Teacher Education 26 (2010) 1124e1135 1125

Author's personal copy
and employed by urban school districts (90.0%). The participant poolwas composed of 3.3% African-American,1.1% Asian, 61.4% Caucasian,31.6% Hispanic, .9% Native American, and 1.8% biracial. Participantsranged in age from 23 to 66, with an average age of 41.82 years(sd ¼ 10.87).
The majority of teachers taught either elementary (55.3%) ormiddle (33.0%) school, with only 10.6% at the high school level. Afew teachers (1.1%) taught a mixture of elementary, middle, and/orhigh school. Teachers taught classes across the curriculum,including both required and elective courses, with an average classsize of 23.2 students (sd ¼ 15.67, Q1 ¼ 20, Q3 ¼ 25). Most teachersearned either Bachelors (41.3%) or Masters (35.6%) degrees, witha few earning a Doctorate (.4%). A small percentage of teachersreported being enrolled in or taking some Masters (19.4%) orDoctorate (3.3%) level classes. Years of experience ranged from oneto 44, with a mean of 13.51 years (sd ¼ 9.59). Nearly all teacherswere certified (98.7%) and teaching in their certification area(99.3%), with most (83.7%) receiving their teacher certification froma traditional university preparation program. Finally, nearly allteachers (87.3%) reported that they received classroom manage-ment training and/or instruction within the past five years.
2.1.1. Measures2.1.1.1. Theoretical development of the Behavior and InstructionalManagement Scale (BIMS). Within this study, classroom manage-ment style is defined as a multi-faceted construct that includes twoindependent constructs: behavior management and instructionalmanagement. The continuum of control posited by Glickman andTamashiro (1980) and Wolfgang (1995) provides the theoreticalfoundation for each of the two components. Even though teachersfall on this range, their places may vary with regard to managinginstruction and classroom behaviors.
Behavior management (BM) is similar to, but different, fromdiscipline in that it includes pre-planned efforts to preventmisbehavior as well as the teacher's response to it. Specifically, thisfacet includes establishing rules, forming a reward structure, andproviding opportunities for student input. Emmer, Evertson, andAnderson (1980) documented one of the primary differencesbetween effective and ineffective classroom managers was themanner in which they formulated and implemented classroomrules. Still, classroom rules are of little assistance if students are notmotivated to follow them. As Evertson andWeistein (2006) explain,“. how a teacher achieves order is as important as whethera teacher achieves order” (p. 4). Establishing an effective rewardstructure and encouraging student input can be useful tools in theprevention of misbehavior and the maintenance of order in theclassroom environment.
Instructional management (IM) addresses teachers' instruc-tional aims and methodologies and includes aspects such asmonitoring seatwork and structuring daily routines as well as theteacher's use of lecture and student practice versus interactive,participatory approaches to instruction. To what degree does theteacher encourage students to actively interact in the classroom?When designing lessons, towhat extent does he or she consider thenature of students e their interests, needs, and background?
The manner in which the teacher approaches instructional taskscontributes to the general classroom atmosphere and classroommanagement style (Burden, 1995; Kounin, 1970; McNeely & Mertz,1990; Reeve & Jang, 2006; Weinstein & Mignano, 1993). Nowhere isthis better documented than in Kounin's classic (1970) study oforderly and disorderly classrooms. Concepts such as smoothness andmomentum of instruction were consistently found to be character-istics of well-planned lessons that prevented off task behaviors.Further, McNeely and Mertz's (1990) study revealed that studentteachers began their field experience by focusing on quality lesson
planning. By the end of their experience, however, they had begun tosee students as the “enemy” and shifted the focus of lesson planningfrom activities designed to encourage learning to those likely todiscourage disruption. More recently, Reeve and Jang (2006)revealed that instructors supportive of student autonomy differ inthe types of instructional behaviors from more controlling teachers.
2.1.1.2. Construction of the BIMS. The BIMS was developed in fivestages to create the subscales of Behavior Management andInstructional Management. First, operational definitions for thehypothesized dimensions were developed. Second, a large set ofitems was generated based on these operational definitions andexisting literature, as well as classroom expertise and observations.Third, students enrolled in a graduate course titled ClassroomManagement andMotivationwere surveyedandasked todeterminethe clarity and content validity of each item on a six-point scaleranging from (1) “not at all” to (6) “very well/very clear.” In additionto the operational definitions to rate content validity, students werealso asked to supply written feedback for any items that were eitherunclear or unrelated to the constructs. Fourth, items were revisedbased on student feedback and pilot tested using a small sample(n ¼ 94) of K-12 teachers enrolled in a variety of graduate levelcourses. Using this small sample, preliminary exploratory factoranalyses and reliability analyses were conducted. This informationwas used to modify those items with poor estimated factor patternloadings or those that reduced the measure's internal consistency.Items that exhibited limited variability were either revised orremoved from the instrument. Finally, to re-evaluate those itemswith limited variability, the instrument was pilot tested again witha small (n ¼ 36) sample of K-12 classroom teachers.
At the conclusion of this five-step process, the BIMS (seeAppendix) was composed of two subscales with 24 items under-lying the proposed classroom management constructs: BehaviorManagement (12 items) and Instructional Management (12 items).A6-point response scale from “stronglyagree” to “stronglydisagree”was utilized and scoring for some items was reversed. A scorefor each subscale is obtained byaveraging responses across all itemsor by means of factor analysis.
According to the continuum originally suggested by Wolfgangand Glickman (1980, 1986), endorsement of an item reflects thedegree of control the teacher asserts over students. High subscalescores indicate a more controlling, interventionist approach whilelower scores are indicative of a less controlling belief in thatdimension of classroom management style.
2.1.1.3. Ohio State Teacher Efficacy Scale (OSTES, Tschannen-Moran &Woolfolk Hoy, 2001). To provide convergent and discriminatevalidity evidence for the BIMS, teacher data were also collected onthe OSTES. Teachers' sense of efficacy, defined as, “. teachers'judgments about their abilities to promote students' learning”(Woolfolk Hoy & Spero, 2005), can have significant impact in theclassroom thus relationships with behavior and instructionalmanagement are likely. To increase specificity, Tschannen-Moranand Woolfolk Hoy (2001) explained the construct (based on Gibson& Dembo, 1984 research) to include three dimensions of teacherefficacy measured by the OSTES.
The constructs are Efficacy for Instructional Strategies, Efficacyfor Classroom Management, and Efficacy for Student Engagement.The Instructional Strategies factor addresses the teacher'sperceived ability to tailor instruction to meet student needs andincludes aspects, such as gauging learning vis-à-vis their instruc-tional approach and questioning techniques. The ClassroomManagement factor assesses the teacher's efficacy related to bothpreventive and reactive attempts to control student behavior. TheStudent Engagement factor focuses on the teacher's efficacy to
N.K. Martin, D.A. Sass / Teaching and Teacher Education 26 (2010) 1124e11351126

Author's personal copy
foster support for student learning and motivate all students,including difficult and struggling learners. The short and longversions of the OSTES assess these three constructs with 4- and 8-items per factor, respectfully.
Psychometric research conducted by Tschannen-Moran andWoolfolk Hoy (2001) provided reasonably good evidence of validityand reliability. An exploratory factor analysis with a Varimaxrotation revealed a 3-factor solution for both the short and fullversions, along with a single higher-order factor of teacher efficacy.This higher-order factor was expected given the high interfactorcorrelations (r > .60) within their study.
Evidence of concurrent validly was revealed as the OSTESsubscales were correlated with scales on the Teacher EfficacyScales (Hoy & Woolfolk, 1990) and the Rand Items. The short andlong versions of the OSTES were also highly correlated acrossthe three subscales (r > .95). Tschannen-Moran and WoolfolkHoy (2001) reported relatively high estimated internal consistency(Cronbach's a) coefficients for both the short (a0s > .80) and long(a0s > .85) versions of the OSTES. The estimated coefficients usingour data for the long and short versions were .87 and .78, .92 and.88, and .90 and .85 on the Efficacy for Instructional Strategies,Efficacy for Classroom Management, and Efficacy for StudentEngagement, respectively.
2.2. Procedures
Data were collected online from certified teachers employed atsix high schools (five urban and one rural) as well as themiddle andelementary schools that feed into them. Based on the assumptionthat teachers may differ depending on the school context, datawere drawn from a thorough cross-section of school clusterschosen based on their socio-economic and ethnic profiles. Princi-pals at the selected campuses were sent an email asking them toforward an invitation to participate to their teachers. The email wassent to 81 principals (57 elementary, 17 middle school, & 7 highschool). The email included a link to the consent form and surveys.A follow up reminder was emailed approximately one week later toeach principal. Unfortunately, a response rate could not be calcu-lated given that there was no way to determine howmany teachersactually received the email.
3. Statistical analyses
3.1. Missing data
A central component to data analysis is the consideration ofmissing data and how best to treat it. Rubin (1976) proposed threetypes of missingness: missing completely at random (MCAR),missing at random (MAR), and missing not at random (MNAR).Statistical analyses are largely robust to missing data when theamount of missingness is minimal (in terms of percent of missingdata) or MCAR (Muthén, Kaplan, & Hollis, 1987). As the amount ofmissingness increases or data are MAR or MNAR, traditionalmissing data methods (e.g., listwise deletion, pairwise deletion,simple imputation, mean imputation, etc.) often produce biasedparameter estimates and reduced statistical power (Enders, 2001).
If data are MCAR or MAR, modern procedures, such as fullinformation maximum likelihood (FIML) estimation and multipleimputations, can ameliorate estimation bias and increased statis-tical power. Although the percent of missing data was minimal(1.1%), all missing data were treated using the FIML estimationprocedure within Mplus given that data were assumed to be MAR.Regardless of how the data are missing (i.e., MAR or MNAR), FIMLperforms better than most other missing data methods.
3.2. Model fit
The statistics employed to evaluate model fit for exploratoryfactor analysis (EFA) and confirmatory factor analysis (CFA) werethe c2, Tucker-Lewis Index (TLI), Comparative Fit Index (CFI),Standardized Root Mean Square Residual (SRMR) or Weighted RootMean Square Residual (WRMR), and Root Mean Square Residual(RMSEA). Description of these model fit statistics can be obtainedfrom Bollen (1989), Hoyle (1995), and Hu and Bentler (1999).
It is well known that c2 statistics are nearly always large andstatistically significant for complexmodels. Moreover, the c2 statisticis sensitive to large sample sizes and departures from multivariatenormality and, therefore, may reject well fitting models. For thesereasons, less emphasis was placed on the c2 statistics compared tothe othermodel fit statistics (e.g., TLI, CFI, SRMR/WRMR&RMSEA). Ingeneral, CFI and TLI statistics greater than .90 were considered as an“adequate” model fit, whereas values greater than .95 were deemedas a “good”model fit (Hu & Bentler,1999). They denote fit indexes forRMSEA and SRMRvalues less than .08 and .06, respectively, as “good”and values between .08 and .10 as “mediocre”. Acceptable values forWRMR, which are used with the CFA models, are currently unavail-able. However, values closer to one are desirable. Note that the CFI,TLI, RMSEA, and SRMR cut points are only for validated for CFAmodels, as they have not been formally determined for EFA. Instead,CFI and TLI values closer to one and SRMR and RMSEA closer to zerowere considered better for EFA models.
4. Instrument evaluation
The BIMS was analyzed in three separate studies. In Study 1, theoriginal 24 items were reduced to 12 items using an EFA witha smaller subsection of the sample. For Study 2, the remainder ofthe sample was used to evaluate the psychometric properties of the12-item BIMS using CFA. Study 2 also obtained reliability estimatesfor each subscale. Finally, Study 3 addressed the discriminate andconvergent validity of the 12-item BIMS.
4.1. Study 1
4.1.1. Purpose of study 1The purposes of Study 1 were twofold: 1) provide preliminary
evidence of the psychometric properties of the 24-item BIMS and 2)reduce the number of items to create a 12-item version (6 for BM &6 for IM) with acceptable psychometric properties. More specifi-cally, the first set of analyses was conducted to determine thoseitems that “best“ measure each construct. In essence, this studyfollowed the recommendation of DeVellis (2003, p. 63) by creatingmore items than intended for use. This step is critical, as pastresearch has produced extremely high interfactor correlates, whichare not conducive to factor analysis (see Gorsuch, 1983) andprovides little unique variance in later statistical analyses.
4.1.2. Instrument lengthDeVellis (2003, p. 66) indicated that the item pools are often
three or four times larger than the desired final instrument length(e.g., academic tests), but at times as small as 50% larger forconstructs that are difficult to measure (e.g., psychologicalconstructs). For this study, twice as many items were written thanwere actually intended for use given that the behavior andinstructional management constructs are often difficult to assess(or there are only so many different behaviors that can bemeasured) as reported in the Introduction. While reducing thenumber of items on an already validated instrument could poten-tially impact the psychometric properties, this shortcoming is ofless concern during instrument development.
N.K. Martin, D.A. Sass / Teaching and Teacher Education 26 (2010) 1124e1135 1127

Author's personal copy
Study 1 sought to create a subset of items that “most purely”measure behavior and instructionalmanagement. The difficultywithinstrument development is determining the optimal number ofitems necessary to measure each construct, as one must weigh thetrade-off between instrument length and reliability. Worthingtonand Whittaker (2006) advocated for creating instruments that takeno more than 15e20 min to administer. Clearly neither our 24- or12-item instrument would take more than 15 min, but this instru-mentwas developedwith the assumption that researcherswill likelycombine it with other teacher variables (e.g., motivation, efficacy,teaching style, burnout, etc.).
With this literature in mind, 24 items were written (12 perfactor) with the intent of retaining the best 12 items (six per factor).Six items per factor was selected for two reasons: 1) Past measuresof teacher variables have often found similar lengths appropriateand effective (e.g., Hui & Chan, 1996; McLaney & Hurrell, 1988;Tschannen-Moran & Woolfolk Hoy, 2001) and 2) most importantly,our research revealed that adding additional items did not signifi-cantly increase the internal consistency or the factor structureintegrity. The latter is critical during instrument development(Worthington & Whittaker, 2006).
4.1.3. Sample sizes for factor analyzesAs indicated later, only 200 subjects were utilized for the EFA,
thus leaving 350 for the CFA. Suggested the following sample sizeguidelines for factor analyses: 100 ¼ poor, 200 ¼ fair, 300 ¼ good,500 ¼ very good, 1000 or more ¼ excellent. However, more recentempirical research (MacCallum, Widaman, Zhang, & Hong, 1999)revealed that the adequacy of factor analysis results depend moreon the data characteristics (i.e., communalities) than on the samplesize employed. As can be calculated from Table 1 and Fig. 1,the communalities (defined as the sum of the squared loadings foreach item) were generally moderate to large in size. Therefore thesample sizes should be adequate for both the EFA and CFA based onthe guidelines of MacCallum et al. (1999). In any case, due to itsexploratory nature, a smaller sample size (n¼ 200) was selected forStudy 1 (i.e., the EFAs) given that the estimated factor pattern
loading stability was less of a concern compared to the confirma-tory portion of this study. Consequently, a larger sample size(n ¼ 350) was selected for Study 2 (i.e., the CFA) to ensure morestable and accurate estimates factor loading andmodel fit statistics.
4.1.4. Statistical analysis with EFAFrom the larger sample (n ¼ 550), a random sample of partici-
pants (n ¼ 200) was selected for Study 1. Using the 24-item fullscale (12 measuring Behavior Management & 12 measuringInstructional Management), data were analyzed using an EFAwithin Mplus 5.21 (Muthén & Muthén, 1998e2007). This analysiswas performed on a polychoric correlation matrix using aweightedleast-squares with mean and variance (WLSMV) estimationprocedure with an oblique CF-Equamax rotation. The CF-Equamaxrotation, which combines the Quartimax and Varimax criteria (seeBrowne, 2001), simplifies both variables and factors complexity byspreading the variances more equally across the factors (Gorsuch,1983). Therefore, items that cross-loaded, or loaded on both factors,could more easily be detected. This rotation criterion is criticalgiven that the factors (i.e., Behavior Management & InstructionalManagement) are often highly correlated and one aim of this studywas to increase discriminate validity and create two reasonablyuncorrelated (i.e., r < .50) factors.
A two-factor solutionwas extracted given that itemswerewrittenfor only two factors. Again, the EFA was conducted to 1) shorten theinstrument and 2) detect those items that are the “most pure”measure of each factor. For this reason, items were deleted in thefollowing order 1) loaded on the incorrect factor, 2) possesseda higher cross-loading on another factor (defined as having factorpattern loadings > .30), and 3) had a small estimated factor loading(l< .40) on the theorized factor. Itemswere removed independentlybased on the item severity until six items remained per subscale.
4.1.5. ResultsThe results of the initial EFA model with 24 items indicated
a dominant two-factor solution based on the scree plot andeigenvalues, with factors 1 and 2 explaining 24.66 and 17.5 percentof variance, respectively. Additional support for the two-factormodel was obtained using the model fit statistics, c2
(229) ¼ 673.350, p < .001, CFI ¼ .934, TLI ¼ .921, RMSEA ¼ .098,SRMR ¼ .072, as this model fit is significantly better than the one-factor model, c2 (252) ¼ 2749.352, p < .001, CFI ¼ .629, TLI ¼ .594,RMSEA ¼ .223, SRMR ¼ .165. The three-factor model produceda noticeable increase in model fit, c2 (207) ¼ 461.730, p < .001,CFI ¼ .962, TLI ¼ .950, RMSEA ¼ .078, SRMR ¼ .055. However, thisthird factor, which only explained 6.91% of the variance andwas notof theoretical interest. Instead, the intent was to remove any itemsthat may be measuring a third factor.
Despite the evidence of a two-factor model, this EFA was onlyused to shorten the measure and eliminate items that appearedproblematic. Using the initial factor loading matrix (see Table 1), theitems were removed sequentially based onwhether items loaded onthe wrong factor (e.g., BM5) and had larger cross-loading magni-tudes. In general, several items either had large factor patternloadings on the incorrect factor or large cross-loadings. This waspartially expected given past research with these scales. After eachitem was removed, another EFA was conducted until there were sixitems per factor. This approachwas employed given that the removalof items influences the other estimated factor pattern loadings.
The final set of items (see Table 1) revealed a two-factor solutionwith factors 1 and 2 explaining 31.80 and 22.84 percent of variance,respectively. Although factors 1 and 2 had large eigenvalues of3.816 and 2.741, respectfully, factor 3 only had an eigenvalue of .953that explained 7.94 percent of the variance. Additional support forthe two-factor model was achieved from the model fit statistics,
Table 1Estimated factor pattern loading matrix for the initial and final EFA model.
Initial EFA model Final EFA model
Factor 1 Factor 2 Factor 1 Factor 2
BM1 *.53 .06 BM1 *.50 .09BM2 *.76 *�.19 BM2 *.70 �.14BM3 .06 *.35 BM8 *.58 .15BM4 *.47 �.10 BM9 *.69 *.20BM5 L.11 *.68 BM11 *.88 .02BM6 *.26 �.06 BM12 *.64 �.14BM7 *.58 *.22 IM2 .17 *.66BM8 *.59 *.20 IM3 .10 *.65BM9 *.63 *.27 IM5 .04 *.66BM10 *.56 *.46 IM6 �.14 *.65BM11 *.82 .09 IM9 .05 *.56BM12 *.63 �.10 IM12 �.05 *.83IM1 *.65 L.17IM2 *.18 *.64IM3 .03 *.67IM4 *.61 .02IM5 .05 *.63IM6 *�.18 *.66IM7 .13 *.60IM8 *.53 *.33IM9 �.01 *.68IM10 *.60 L.16IM11 *.50 *L.21IM12 �.08 *.78
Note. Bolded estimated factor pattern loadings reflect items theorized to loadtogether based on content. Factor pattern loadings marked with an “*” werestatistically significant at a* ¼ .05.
N.K. Martin, D.A. Sass / Teaching and Teacher Education 26 (2010) 1124e11351128

Author's personal copy
c2 (43) ¼ 92.153, p < .001, CFI ¼ .978, TLI ¼ .966, RMSEA ¼ .076,SRMR ¼ .050, with the three-factor model only providing a modestimprovement in model fit, c2 (33) ¼ 49.056, p < .001, CFI ¼ .993,TLI ¼ .986, RMSEA ¼ .049, SRMR ¼ .034.
To test the estimated factor pattern loadings for statisticalsignificance, the formula a* ¼ a/dc was used to calculate the newcritical value corrected for Type 1 error (Cudeck & O'Dell, 1994). Inthe equation to compute a*, dc ¼ vf � f(f � 1), where v is thenumber of variables (i.e., items), f is the number of factors, and a isthe original critical value (i.e., a ¼ .05). Therefore, the new two-tailed critical value was a* ¼ .001 (za* ¼ �3.29) for the initial EFAmodel and a* ¼ .002 (za* ¼ �3.09) for the final EFA model.
The estimated factor pattern loadings for the finalmodel (Table 1)revealed that each item had large and statistically significant factorloadings on its hypothesized factor. In addition, the cross-loadingswere relatively small (i.e., l < .20), and in most cases statisticallynon-significant. The interfactor correlation was fairly small (r ¼ .12),suggesting these factors are measuring unique constructs.
4.1.6. DiscussionThe primary objective of Study 1 was to create a reasonably
short and useable instrument to measure teacher's perceptions oftheir behavior and instructional management styles. This isimportant as participants, in general, are more likely to completeshorter surveys (Dillman, 2000). This shorter version of the BIMSalso provided good preliminary factorial validity evidence based onthe good model fit and estimated factor pattern loadings. Ingeneral, all the estimated factor pattern loadings on the expectedfactors were large, with relatively small cross-loadings.
Given the nature of Study 1, one major limitation needs to beaddressed. Several alternative forms or sets of items could havebeen evaluated or used to create the shortened version of the BIMS.In other words, selecting items from the larger population of itemsin many ways may be arbitrary and researchers could use alter-native procedures to shorten the instrument. Given that all theitems provided good content validity as indicated by contentexperts and similar distribution characteristics, the choice of usingEFA seemed reasonable. Moreover, this approach is commonlyemployed and recommended within research to shorten measuresbased on statistical evidence (Coste, Guillemin, Pouchot, & Ferma-nian, 1997; Worthington & Whittaker, 2006).
The results of Study 1 are promising as the creation of the BIMSis a step toward clarifying the construct of classroom management.Further, this new instrument is broader in scope than both the PCI(Willower et al., 1967) and the BDI (Glickman & Tamashiro, 1980;Wolfgang & Glickman, 1980, 1986). Initial validation evidence alsoindicates that the BIMS is preferable to the ABCC (Martin et al.,1998; Martin et al., 2007). However, because more evidenceregarding the BIMS' psychometric properties is necessary, Study 2was carried out.
4.2. Study 2
4.2.1. Purpose of Study 2The purpose of Study 2 was to assess the psychometric prop-
erties of the shortened measurement via a separate sample usingCFA. The first set of analyses tested for factorial validity using CFA,whereas the second set of analyses investigated the measure's
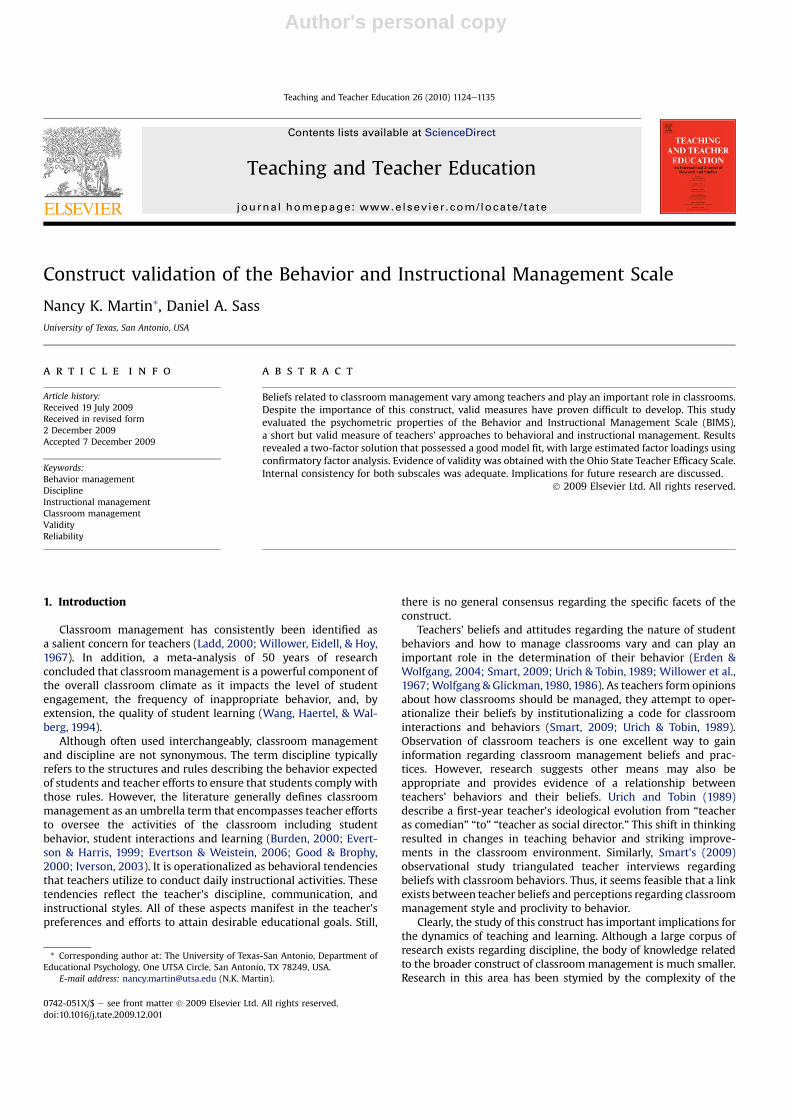
Fig. 1. Estimated factor loadings from the CFA for the shortened version of the BIMS.
N.K. Martin, D.A. Sass / Teaching and Teacher Education 26 (2010) 1124e1135 1129

Author's personal copy
reliability. While the CFA was conducted using the secondsubsample (i.e., n¼ 350), the reliability analyses were conducted onthe complete sample (i.e., n ¼ 550) to provide better parameterestimates of internal consistency for future research.
4.2.1.1. Statistical analysis with CFA. The CFA model was estimatedusing a polychoric correlation matrix with a WLSMV estimatorgiven that data were categorical. For the CFA model, the first factorloading (i.e., reference indicators) on each factor was set to 1.00for latent variable scaling and statistical identification. The esti-mated factor loadings are provided in Fig.1. All other factor loadingswere fixed at zero, with the residuals uncorrelated.
4.2.2. Results4.2.2.1. Confirmatory factor analysis results. CFA analyses revealedan adequate to good model fit for the proposed model (see Fig. 1), c2
(28) ¼ 126.271, p < .001, CFI ¼ .932, TLI ¼ .949, RMSEA ¼ .100,WRMR ¼ 1.142. For this model all the residuals were assumed to beuncorrelated. Given the model fit was slightly lower than desired forthe RMSEA, the modification indices were evaluated and indicatedthat correlating the residuals for BM9 and IM9 would improve themodel fit. Using the DIFFTEST procedure within Mplus (see Aspar-ouhov&Muthén, 2006) to compare nestedmodels using theWLSMVestimation procedure, the results revealed a statistically significantimprovement in model fit as a consequence of the correlated resid-uals, Dc2 (1) ¼ 35.092, p < .001, DCFI ¼ .013, DTLI ¼ .010,DRMSEA¼�.010,DWRMR¼�.103.Given these error termsare likelydependent upon one another due to item ordering (i.e., these itemsfollowed one another on the measure), these residuals were corre-lated to yield an overall good to excellentmodel fit,c2 (28)¼ 106.637,p < .001, CFI ¼ .945, TLI ¼ .959, RMSEA ¼ .090, WRMR¼ 1.040.
Its worth noting that the model fit for the entire sample(n ¼ 550) was comparable to the subsample without correlatedresiduals, c2 (30) ¼ 186.402, p < .001, CFI ¼ .927, TLI ¼ .947,RMSEA ¼ .097, WRMR ¼ 1.342, and when the BM9 and IM9residuals were correlated, c2 (30) ¼ 162.576, p < .001, CFI ¼ .938,TLI¼ .953, RMSEA¼ .092,WRMR¼ 1.262. As with the subsample ofn ¼ 350, the model fit using the entire sample did significantlyimprove with the correlated residuals, Dc2 (1) ¼ 32.676, p < .001,DCFI ¼ .011, DTLI ¼ .006, DRMSEA ¼ �.005, DWRMR ¼ �.080.However, practically speaking the model fit was not considerablygreater based on the CFI, TLI, RMSEA, and WRMR.
In addition to the good overall model fit, estimated factorloadings (see Fig. 1) were all large (l > .45) and statisticallysignificant at .004 (.05/12). Collectively, these results suggest thateach item is highly correlated with the theorized factor as indicatedby the estimated factor loadings, while also uncorrelated with theother factor. In addition, this model produced a two-factor modelwith a relatively low interfactor correlation, suggesting that thesefactors capture unique information related to classroom manage-ment. The only concern was the correlated residuals, which mayhave simply occurred due to item order rather than item content.From a content perspective, these items (see Appendix) do notappear to be measuring another factor.
4.2.2.2. Reliability analyses. An analysis of the Behavior Manage-ment subscale revealed good internal consistency (i.e., Cronbach'salpha) for the six items (a ¼ .774), with an average inter-itemcorrelation of .377 (sd ¼ .091). The average corrected item-totalcorrelation for this subscale was .529 (sd¼ .071), which suggests theitems have good discrimination. Results for the InstructionalManagement subscale also showed a good internal consistency forthe six items (a¼ .770),with an average inter-item correlation of .365(sd ¼ .092). The average corrected item-total correlation for thissubscale was .522 (sd ¼ .086), which again suggests good item
discrimination. For both subscales, the internal consistency wouldnot increase with the removal of an item. Overall, these resultsprovide evidence of adequate to good internal consistently measuresbasedonNunnally's (1978) standardsand strong itemdiscrimination.
4.2.3. DiscussionStudy 2 evaluated the psychometric properties of the 12-item
version of the BIMS and provided promising results. Based on thegoodmodel fit for the samples of 350 and 550, these results provideevidence of strong factorial validity given that each indicator (oritem) is highly correlated with its corresponding factor and notwith the other factor. As seen in Fig. 1 for the n¼ 350 subsample, allthe estimated factor loadings were greater than .45 and themodification indices did not indicate that any of the items cross-loaded. Also of significance is the strong discriminate validity, asBehavior Management and Instructional Management are not toohighly correlated (F1,2 ¼ .22). This finding is critical given that pastmeasures (Martin et al.,1998;Martin et al., 2007) of these constructsproduced factors so highly correlated that neither provided anyunique information, nor could they both be employed in otherstatistical analyses without creating multicollinearity problems.
The primary reason for the smaller interfactor correlationwithinthis study was the extreme attention given during item writing toensure that itemswere onlymeasuring the intended construct. Thisis critical as both EFA and CFA attempt to minimize cross-loadings,which consequently results in larger interfactor correlations whenitems measure both factors. Past research with these constructscontained items that sometimes measured both behavioral andinstructional management, thus increasing the interfactor corre-lations and producing poor discriminate validity. By removingitems with larger cross-loadings within the EFA, this reduced theinterfactor correlations within the CFA (and the EFA).
Although it is very common for researchers to modify model fitusing the modification indicated, as Browne (2001) and otherssuggest, this essentially results in CFA becoming partially explor-atory. This may be inappropriate (see Asparouhov & Muthén, 2006;Browne, 2001; Gerbing & Hamilton, 1996; Hurley et al., 1997) as themodel modifications may produce a significantly better fittingmodel simply as a result of a capitalization on chance (Gorsuch,1983; MacCallum, Roznowski, & Necowitz, 1992). Consequently, itis important for future research to vary item order to determinewhether the correlated residuals for BM9 and IM9 occurred simplydue to chance, the item ordering, or if in fact these items sharecommon variance unrelated to the factor.
4.3. Study 3
4.3.1. Purpose of Study 3The purpose of Study 3 was to evaluate the discriminate and
convergent validity of the BIMS using the entire sample. Based onconceptual differences, operational definitions, and content, it washypothesized that Behavior Management would be slightly corre-lated with Instructional Management, but not with Efficacy forInstructional Strategies or Efficacy for Student Engagement.Further, it was hypothesized that there would be a negativecorrelation between Behavior Management and Efficacy for Class-room Management (Enochs, Scharmann, & Riggs, 1995; Henson,2003; Woolfolk & Hoy, 1990; Woolfolk, Rosoff, & Hoy, 1990). Simi-larly, it was expected that Efficacy for Instructional Strategies,Efficacy for Classroom Management, and Efficacy for StudentEngagement would be negatively correlated to InstructionalManagement, as all three teacher efficacy scales have an instruc-tional component to them (Allinder, 1994; Berman, McLaughin,Bass, Pauly, & Zellman, 1977; Guskey, 1988; Stein & Wang, 1988;Tschannen-Moran & Woolfolk Hoy, 2001).
N.K. Martin, D.A. Sass / Teaching and Teacher Education 26 (2010) 1124e11351130

Author's personal copy
4.3.2. ResultsTo investigate discriminate and convergent validity of the BIMS,
the entire sample (n ¼ 476) of teachers who completed both theBIMS and OSTES were evaluated. Notice that several of the teachers(n ¼ 74) did not complete the OSTES and therefore were droppedfrom these analyses. To take into account measurement error, thecorrelation matrix (i.e., interfactor correlation or V matrix) fromthe CFA was evaluated. This analysis also allowed for an evaluationof the estimated factor loadings and model fit from a differentsubsample with the BIMS, while also reevaluating the OSTES'sfactorial, discriminate, and convergent validity.
The CFA analysis, which paralleled the statistical procedureabove with the addition of the OSTES factors, produced a poor toadequate model fit based on the CFI, RMSEA, and WRMR using thefull OSTES version, c2 (112) ¼ 825.252, p < .001, CFI ¼ .877,TLI ¼ .967, RMSEA ¼ .116, WRMR ¼ 1.661. Note that this poor andinconsistent model fit was a direct result of the full OSTES version.With the exception of the TLI, the other model fit statistics werepoor when the full OSTES versionwas analyzed separately from theBIMS, c2 (79) ¼ 929.711, p < .001, CFI ¼ .801, TLI ¼ .972,RMSEA¼ .150, WRMR¼ 1.654. It should be noted that the poor andinconsistent model fit was likely attributable to the extremely largeinterfactor correlations (r > .90) between the OSTES factors.
Given this poor model fit, the short OSTES version was assessedand revealed a good to excellent model fit, c2 (34) ¼ 223.497,p < .001, CFI ¼ .941, TLI ¼ .988, RMSEA ¼ .108, WRMR ¼ .910.
Consequently, the short OSTES version was used to establish thediscriminate and convergent validity of the BIMS. Despite thisimproved model fit, the interfactor correlations were stillextremely high (r> .85) for the short OSTES version, indicating thatdiscriminate validity was poor.
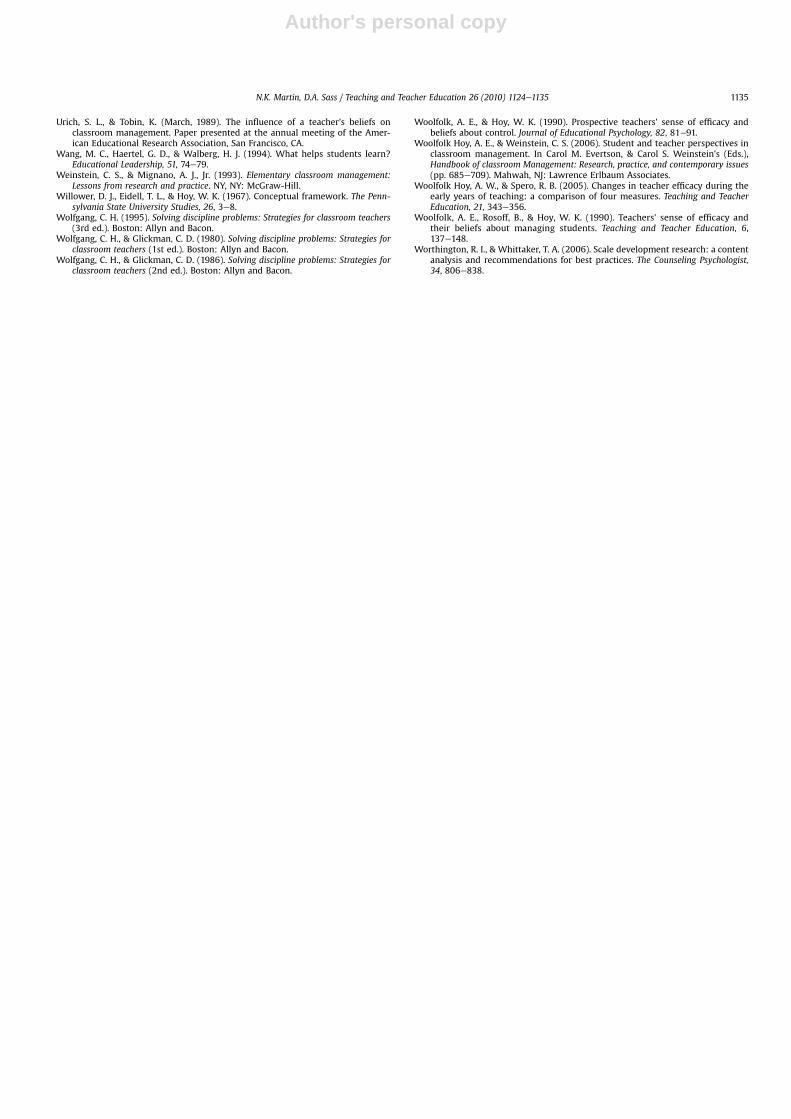
The results of the CFA model with the short OSTES version andBIMS (see Fig. 2 & Table 2) revealed a good to excellent model fit, c2
(75) ¼ 400.701, p < .001, CFI ¼ .933, TLI ¼ .971, RMSEA ¼ .096,WRMR ¼ 1.337. Similar to Study 2 using the sample size of 350,correlating the IM9 and BM9 residuals did not significantly improvethe model fit from a practical standpoint, but instead only froma statistical perspective, Dc2 (1) ¼ 23.595, p < .001, DCFI ¼ .002,DTLI ¼ .000, DRMSEA ¼ �.002, DWRMR ¼ �.017. Therefore, theseresiduals were not correlated. Instead, a small cross-loading(l3,12¼ .23)betweenBM2and theEfficacy forClassroomManagementfactor produced the greatest change in model fit, Dc2 (1) ¼ 39.013,p< .001,DCFI¼ .013,DTLI¼ .006,DRMSEA¼�.011,DWRMR¼�.142,and an overall excellent model fit, c2 (77) ¼ 339.562, p < .001,CFI¼ .946, TLI¼ .977, RMSEA¼ .085,WRMR¼ 1.195. Taking this cross-loading into account, the estimated factor loadings and interfactorcorrelations are provided in Fig. 2 and Table 2, respectively.
In terms of discriminate and convergent validity, these analysesverified our hypothesis that BehaviorManagement would be slightlycorrelated with Instructional Management (r ¼ .24), but not withEfficacy for Instructional Strategies (r ¼ �.02) or Efficacy for StudentEngagement (r ¼ �.12). Further, our hypothesis that there would be
Fig. 2. Estimated factor loadings from the CFA testing the BIMS and OSTES collectively, with the correlations between factors reported in Table 2.
N.K. Martin, D.A. Sass / Teaching and Teacher Education 26 (2010) 1124e1135 1131

Author's personal copy
a negative correlation between Behavior Management and Efficacyfor Classroom Management (r ¼ �.19) was supported, although thiscorrelation was much smaller than anticipated. The strong negativecorrelations (r's>�.50) between Efficacy for Instructional Strategies,Efficacy for Classroom Management, and Efficacy for StudentEngagement and Instructional Management were also confirmed(see Table 2), as all three teacher efficacy scales have an instructionalcomponent embedded in them. Overall, these results provide goodevidence of discriminate and convergent validity.
4.3.3. A supplemental analysis of the OSTESOur analyses revealed a large degree of multicollinearity
between the OSTES factors, suggesting these scales possess poordiscriminate validity (see Table 2) and that perhaps a singlemeasure of efficacy, as measured by the OSTES, is more feasible. Tosubstantiate this finding with the OSTES short and full version, twoEFAs using a WLSM estimator and a polychoric correlation matrixwith a CF-Equamax rotation were conducted.
Results revealed a one-factor solution based on the scree plotand eigenvalues. The eigenvalues and percent of variance explainedfor factors 1, 2, and 3were 7.274 (60.6%), .943 (7.9%), and .695 (5.8%),respectively, for the short version. In addition, the data fit a one-factor model very well, c2 (54) ¼ 550.722, p < .001, CFI ¼ .984,TLI ¼ .980, RMSEA ¼ .139, SRMR ¼ .051. This finding was replicatedfor the long OSTES version, with the eigenvalues and percent ofvariance explained of 13.559 (56.5%), 1.513 (6.3%), and 1.052 (4.4%)for factors 1, 2, and 3, respectively, and a good model fit, c2
(252) ¼ 3283.607, p < .001, CFI ¼ .972, TLI ¼ .969, RMSEA ¼ .159,SRMR ¼ .064. Although statistically these OSTES subscales providelittle unique information, from a content standpoint these threesubscales are conceptually distinct. Given that each subscalemeasures efficacy within the classroom related to instruction, it isnot surprising that these subscales are so highly correlated.
4.3.4. DiscussionStudy 3 explored the discriminate and convergent validity of the
BIMS, with results confirming the hypothesized relationships. Asexpected, the relationships between the BIMS' two subscalesrevealed relatively independent relationships, thus providingevidence of discriminate validity. Substantiation of convergent anddiscriminate validity was also determined by considering relation-ships of IM and BM to components of the OTES: instructionalstrategies, student engagement and classroommanagement. Resultsrevealed statistically significant inverse relationships betweenInstructional Management and the components of teacher efficacy(as measured by the short version of the OTES). Teachers with higherlevels of efficacy regarding instructional strategies, student engage-ment, and classroom management are less likely to take a directiveapproach in implementing tactics tomanage instruction. Conversely,the relationship between behavior management and the threeteacher efficacy variables was relatively small. This finding wasanticipated given that how a teacher manages student behaviors is
likely unrelated to their perceived ability to effectively manageclassroom instruction and keep students engaged.
The above results support previous research in that teacherefficacy is not necessarily strongly related to how a teacher handlesclassroommanagement (Henson, 2003; Henson & Chambers, 2005;Hoy & Woolfolk, 1990; Savran & Cakiroglu, 2003; Woolfolk & Hoy,1990). Specifically, teachers with a high sense of efficacy tended tofavor more humanistic and less controlling management orienta-tions (Henson, 2003; Hoy & Woolfolk, 1990; Woolfolk & Hoy, 1990;Woolfolk et al., 1990).
To increase our understanding of the OTES's psychometricproperties, additional analyses on both the long and short versions ofthe OTES were conducted. These results revealed a one-factor solu-tion based on the eigenvalues andmodel fit statistics, which supportthe position above that the OTES possesses weak discriminate val-idity. This conclusion is not entirely different from that of Tschannen-Moran and Woolfolk Hoy (2001), who explained that both versionsof the OTES could be used to create a second-order factor calledefficacy due to the higher interfactor correlations. However, ourresults differed from Tschannen-Moran and Woolfolk Hoy (2001) inthat our interfactor correlations were noticeably higher. Possibleexplanations for these correlation differences could be how thesecorrelations were estimated (total raw scores vs. CFA, as CFA correctsfor measurement error and weights the items based on the factorloadings), sample characteristics, and/or sample size. Regardless, thisstudy chose to use the subscale scores since these aspects of efficacyvary in concept and in content.
5. Conclusions
The ability to identify, define, and measure the facets of class-room control will provide the means to address a variety of researchquestions regarding classroom dynamics that, to date, have beenlargely untapped. The three studies presented here provide evidencefor a brief, psychometrically sound instrument designed to measurethe aspects of teachers' beliefs toward managing behavior andinstruction. Study 1 utilized EFA to examine the 24-item version ofthe BIMS and reduce it to 12 items. The second and third studiesexamined the validity (via factorial, discriminate, & convergent val-idity) and reliability estimates of the shortened version. Collectively,these study provided evidence of adequate psychometric properties.This study also provides validation evidence of the OSTES.
The short version of the BIMS appears to be a promising andemerging measure. However, at this early stage in its development,additional analyses regarding the BIMS' psychometric properties areneeded. At this juncture,we recommend that researchers collect datafrom the 24-item version and determine whether the same 12-itemshort versionmanifests. Further, it is also critical that future researchassess the optimal number of items to measure behavior andinstructional management. For this study, increasing the number ofitems did not improve the measurement precision (i.e., reliability),but future research may draw a different conclusion with differentsamples. Moreover, larger sample sizes for the EFAmay yield slightlydifferent results and therefore additional research is needed.
Along a similar vein, it is possible that participants' responses toan individual item will be influenced by preceding items. Thusaltering the order in which the items are administered is worthy ofstudy. As a result, researchers should consider interspersing BM andIM statements by changing the order the items are administered.Additional information regarding the psychometric properties(e.g., concurrent validity, predictive validity, construct validity, etc.)would bolster the instrument's psychometric foundation.
When considering the construct of teacher control, it is impor-tant to recognize that behavior and instructional managementstyles are probably similar to teacher efficacy in that they are not
Table 2Interfactors (F0s) between the BIMS and teacher efficacy subscales that correspondto the CFA in Fig. 2. Interfactor correlations on the BIMS and OSTES short version.
Measure BM IM IS CM SE
BM e
IM .24 e
IS �.02 L.59 e
CM L.19 L.51 .87 e
SE �.12 L.65 .88 .91 e
Note. BM ¼ Behavior Management, IM ¼ Instructional.Management, IS ¼ Instructional Strategies, CM ¼ Classroom.Management, and SE ¼ Student Engagement. Using a Bonferroni adjustment(.05/10), bolded correlations were statistically significant at p ¼ .005.
N.K. Martin, D.A. Sass / Teaching and Teacher Education 26 (2010) 1124e11351132

Author's personal copy
static qualities. Rather they are allegedly contextual in nature e
a combination of both the person and the environment. Forexample, research indicates that teacher efficacy may varydepending on a variety of variables, such as cultural backgrounds(Lin, Gorrell, & Taylor, 2002), professional maturity (De la Torre Cruz& Casanova Arias, 2007; Woolkfolk Hoy & Spero, 2005), or schoolsetting (urban, suburban, or rural) (Knoblauch & Woolfolk Hoy,2008). Similarly, teacher perceptions regarding behavior andinstructional management should be viewed as qualities that maychange over time and situations (i.e., responses may depend on theschool, classroom, curricular context, age of students, etc.). Thus,future research should study the stability of these attributes andwhether this instrument assesses characteristics of teachers,workplace setting, or both. Accordingly, the authors are not claim-ing that this instrumentmeasures stable teacher characteristics, butinstead only reported behaviors within the current teacher context.
As there are limitations with all research, these studies are noexception. Because of the manner in which data were collected, thereturn rate cannot be determined. Therefore, these results could besample specific; teachers who responded may be qualitativelydifferent from the population at large. In other words, the resultsmay be biased if volunteer subjects are fundamentally differentfrom the general population. Factors associated with sampling bias,which could include restriction of range and ultimately biasedmeans and variances, could produce biased factor analysis results.Thus, future research is needed to replicate these results withindifferent sample sizes and characteristics.
A related potential limitation is the method of data collection.These data were collected online to increase efficiency, and becausepast researchhas foundhigher response rates and shorter time framesfor the data collection process (Mertler, 2002). Due to the increaseduse of online data collection, research into online data collection hasbeen examined at length. Findings have been fairly consistent inconcluding that thepaperepencil andonline surveys yield results thatare basically interchangeable (Cronk & West, 2002; Krantz & Dalal,2000). In addition, research indicates that online data collection is
reliable, valid, and reasonably representative (Meyerson & Tryon,2003). In any case, future research should test whether the currentresults remain using a paperepencil administration of the BIMS.
Further, none of the three studies addressed the important ques-tion of invariance across groups (e.g., grade levels, content areas,gender, age, etc). For example, the extent to which the BIMS is aneffective measure across elementary, middle and high school levelsremains unknown and presents a question pertinent for futurestudies. Stated differently, testing whether the factor structure (inparticular the factor loadings and intercepts) is invariant across gradelevels ensures that teachers at these different grade levels interpretthe items similarly, thus allowing for accurate mean comparisons. Inaddition, it is important to note that the BIMS is a self-report instru-ment that attempts to measure teachers' approaches to classroomcontrol. Therefore, concurrent validity related to observational data isneeded to verify this self-report instrument.
Still, the BIMS holds promise, as it appears to be a useful tool foradvancing the measurement of this important construct andaddressing a variety of important research questions. For example,what are the implications for ushering new teachers into theprofession e for preparing pre-service teachers and mentoringnovice educators? To what extent are teachers consistent withinthemselves regarding their approaches to instruction and behaviormanagement? What is the relationship between teacher controland other variables such as teacher stress, burnout, and turn over?Finally, and perhaps most important, what is the nature of therelationship between teachers' approaches to classroom controland student efficacy, stress, achievement, or persistence in school?
There can be little doubt that teachers encounter a variety ofexperiences in the classroom. Their beliefs regarding these expe-riences, and the manner in which they approach them, worktogether to create a unique and individual style of classroommanagement. A more clear understanding of the construct hasimportant implications for the classroom. To that end, the Behaviorand Instructional Management Scale appears to be a timely andworthwhile tool for research regarding this important topic.
Appendix
Directions: For each statement below, please mark the response that best describes what you do in theclassroom. There are no right or wrong answers, so please respond as honestly as possible.
Stronglyagree
Agree Slightlyagree
Slightlydisagree
Disagree Stronglydisagree
1. I nearly always intervene when students talk at inappropriate times during class. (BM1) 6 5 4 3 2 12. I use whole class instruction to ensure a structured classroom. (IM1) 6 5 4 3 2 13. I strongly limit student chatter in the classroom. (BM2) 6 5 4 3 2 1*4. I nearly always use collaborative learning to explore questions in the classroom. (IM2) 6 5 4 3 2 15. I reward students for good behavior in the classroom. (BM3) 6 5 4 3 2 1* 6. I engage students in active discussion about issues related to real world applications. (IM3) 6 5 4 3 2 17. If a student talks to a neighbor, I will move the student away from other students. (BM4) 6 5 4 3 2 18. I establish a teaching daily routine in my classroom and stick to it. (IM4) 6 5 4 3 2 1*9. I use input from students to create classroom rules. (BM5) 6 5 4 3 2 1*10. I nearly always use group work in my classroom. (IM5) 6 5 4 3 2 1*11. I allow students to get out of their seat without permission. (BM6) 6 5 4 3 2 1*12. I use student input when creating student projects. (IM6) 6 5 4 3 2 113. I am strict when it comes to student compliance in my classroom. (BM7) 6 5 4 3 2 1*14. I nearly always use inquiry-based learning in the classroom. (IM7) 6 5 4 3 2 115. I firmly redirect students back to the topic when they get off task. (BM8) 6 5 4 3 2 116. I direct the students' transition from one learning activity to another. (IM8) 6 5 4 3 2 117. I insist that students in my classroom follow the rules at all times. (BM9) 6 5 4 3 2 1*18. I nearly always adjust instruction in response to individual student needs. (IM9) 6 5 4 3 2 119. I closely monitor off task behavior during class. (BM10) 6 5 4 3 2 120. I nearly always use direct instruction when I teach. (IM10) 6 5 4 3 2 121. I strictly enforce classroom rules to control student behavior. (BM11) 6 5 4 3 2 122. I do not deviate from my pre-planned learning activities. (IM11) 6 5 4 3 2 123. If a student's behavior is defiant, I will demand that they comply with my classroom rules. (BM12) 6 5 4 3 2 1*24. I nearly always use a teaching approach that encourages interaction among students. (IM12) 6 5 4 3 2 1
Note. Bolded items represent the 12 items used for the abbreviated scale. Although items are labeled here as BM and IM, these markers did not appear on the versioncompleted by the subjects.* ¼ item is reverse scored.
N.K. Martin, D.A. Sass / Teaching and Teacher Education 26 (2010) 1124e1135 1133

Author's personal copy
References
Albert, L. (1989). A teacher's guide to cooperative discipline: How to manage yourclassroom and promote self-esteem. Circle Pines, MN: AGS.
Allinder, R. M. (1994). The relationship between efficacy and the instructionalpractices of special education teachers and consultants. Teacher Education andSpecial Education, 17, 86e95.
Asparouhov, T., & Muthén, B. (May 26, 2006). Robust chi square difference testingwith mean and variance adjusted test statistics. Mplus Web Notes: No. 10.
Baldwin, B. & Martin, N.K. (1994, April). Using factor analysis to establish constructvalidity of an Inventory of ClassroomManagement Style. Paper presented at themeeting of the American Educational Research Association, New Orleans, LA.
Berman, P., McLaughin, M., Bass, G., Pauly, E., & Zellman, G. (1977). Federal programssupporting educational change. Col. VII: Factors affecting implementation andcontinuation (Report No. R-1589/7-HEW). Santa Monica, CA: The Rand Corpo-ration. (ERIC document reproduction service No. 140 432).
Berne, E. (1964). Games people play: The psychology of human relations. New York:Ballantine Books.
Bollen, K. A. (1989). Structural equations with latent variables. New York, NY: Wiley.Browne, M. W. (2001). An overview of analytic rotation in exploratory factor
analysis. Multivariate Behavioral Research, 36, 111e150.Burden, P. R. (1995). Classroom management and discipline. White Plains, NY:
Longman.Burden, P. R. (2000). Powerful classroom management strategies: Motivating students
to learn. Thousand Oaks, CA: Corwin Press.Canter, L. (1992). Assertive discipline: Positive behavior management for today's
classroom. Santa Monica, CA: Lee Canter & Associates.Coste, J., Guillemin, F., Pouchot, J., & Fermanian, J. (1997). Methodological
approaches to shortening composite measurement scales. Journal of ClinicalEpidemiology, 50, 247e252.
Cronk, B. C., & West, J. L. (2002). Personality research on the Internet: a comparisonof web-based and traditional instruments in take-home and in-class settings.Behavior Research Methods, Instruments, and Computers, 34, 177e180.
Cudeck, R., & O'Dell, L. L. (1994). Applications of standard error estimates in unre-stricted factor analysis: significance tests for factor loadings and correlations.Psychological Bulletin, 115, 475e487.
De la Torre Cruz, M. J., & Casanova Arias, P. F. (2007). Comparative analysis ofexpectancies of efficacy in in-service and prospective teachers. Teaching andTeacher Education, 23, 641e652.
DeVellis, R. F. (2003). Scale development: Theory and applications (2nd ed.). Thou-sand Oaks, CA: Sage Publications.
Dillman, D. A. (2000). Mail and internet surveys: The tailored design method. NewYork: J. Wiley.
Emmer, E. T., Evertson, C. M., & Anderson, L. M. (1980). Effective classroommanagement at the beginning of the school year. The Elementary School Journal,80(5), 219e231.
Emmer, E. T., & Hickman, J. (1991). Teacher efficacy in classroom management anddiscipline. Educational and Psychological Measurement, 51, 755e765.
Enders, C. K. (2001). The performance of the full information maximum likelihoodestimator in multiple regression models with missing data. Educational andPsychological Measurement, 61, 713e740.
Enochs, L. G., Scharmann, L. C., & Riggs, I. M. (1995). The relationship of pupil controlto preservice elementary science teacher self-efficacy and outcome expectancy.Science Education, 79, 63e75.
Erden, F., & Wolfgang, C. H. (2004). An exploration of the differences in prekin-dergarten, kindergarten, and first grade teachers' beliefs related to disciplinewhen dealing with male and female students. Early Child Development and Care,174, 3e11.
Evertson, C., & Harris, S. (1999). Support for managing learning-centered class-rooms: the classroom management and organization program. In H. JeromeFreiberg's (Ed.), Beyond behaviorism: Changing the classroom managementparadigm (pp. 57e74). Boston, MS: Allyn & Bacon.
Evertson, C. M., & Weistein, C. S. (2006). Classroom management as a field ofinquiry. In C. M. Evertson, & C. S. Weinstein's (Eds.), Handbook of classroommanagement: Research, practice, and contemporary issues (pp. 3e15). Mahwah,NJ: Lawrence Erlbaum Associates.
Gathercoal, F. (1990). Judicious discipline (2nd ed.). Davis, CA: Caddo Gap Press.Garrett, T. (2006). Studente and TeachereCentered Classroom Management: A Case
Study of Three Teachers’ Beliefs and Practices. Paper presented at the annualmeeting of the American Educational Research Association, San Francisco, CA.
Gerbing, D. W., & Hamilton, J. G. (1996). Viability of exploratory factor analysis asa precursor to confirmatory factor analysis. Structural Equation Modeling, 3,62e72.
Gibson, S., & Dembo, M. (1984). Teacher efficacy: a construct validation. Journal ofEducational Psychology, 76, 569e582.
Ginott, H. (1972). Teacher and child. NY: Macmillan.Glickman, C. D., & Tamashiro, R. T. (1980). Clarifying teachers' beliefs about disci-
pline. Educational Leadership, 37, 459e464.Good, T. L., & Brophy, J. E. (2000). Looking in classrooms (8th ed.). New York, NY:
Addison-Wesley Educational Publishers.Gordon, T. (1974). Teacher effectiveness training. New York: Wyden.Gorsuch, R. L. (1983). Factor analysis (2nd ed.). Hillsdale, N.J: Erlbaum.Guskey, T. R. (1988). Teacher efficacy, self-concept, and attitudes toward the imple-
mentation of instructional motivation. Teaching and Teacher Education, 4, 63e69.
Harris, T. A. (1967). I'm OK e You're OK. New York: Avon Books.Henson, R. K. (2003). Relationships between preservice teachers' self-efficacy, task
analysis, and classroom management beliefs. Research in the Schools, 10, 53e62.Henson, R. K., & Chambers, S. M. (2005). Personality type as a predictor of teaching
efficacy and classroom control in emergency certification teachers. Education,24, 261e268.
Hoy, W. K., & Woolfolk, A. E. (1990). Socialization of student teachers. AmericanEducational Research Journal, 27, 279e300.
Hoyle, R. H. (1995). Structural equation modeling: Concepts, issues, and applications.Thousand Oaks, CA: Sage Publications.
Hu, L. T., & Bentler, P. M. (1999). Cutoff criteria for fit indexes in covariance structureanalysis: conventional criteria versus new alternatives. Structural EquationModeling, 6, 1e55.
Hui, E. K. P., & Chan, D. W. (1996). Teacher stress and guidance work in Hong Kongsecondary school teachers. British Journal of Guidance and Counseling, 24,199e211.
Hurley, A. E., Scandura, T. A., Schriesheim, C. A., Brannick, M. T., Seers, A.,Vandenberg, R. J., & Williams, L. J. (1997). Exploratory and confirmatory factoranalysis: Guidelines, issues, and alternatives. Journal of Organizational Behavior,18, 667e683.
Iverson, A. M. (2003). Building competence in classroom management and discipline.Upper Saddle River, NJ: Merrill/Prentice-Hall.
Jones, F. (1987). Positive classroom discipline. NY, NY: McGraw-Hill.Jones, V. F., & Jones, L. S. (1990). Responsible classroom discipline (3rd ed.). Boston:
Allyn and Bacon.Kohn, A. (1996). Beyond discipline: From compliance to community. Alexandria, VA:
Association for Supervision and Curriculum Development.Kounin, J. S. (1970). Discipline and group management in classrooms. NY, NY: Holt,
Rinehart & Winston.Knoblauch, D., & Woolfolk Hoy, A. E. (2008). “Maybe I can teach those kids.” The
influence of contextual factors on student teachers' efficacy beliefs. Teachingand Teacher Education, 24, 166e179.
Krantz, J. H., & Dalal, R. (2000). Validity of web-based psychological research. InM. H. Birnbaum (Ed.), Psychological experiments on the Internet (pp. 35e60). SanDiego, CA: Academic Press.
Ladd, K. L. (2000). A comparison of teacher education programs and graduate'sperceptions of experiences. Dissertation Abstracts International (UniversityMicrofilms No. 9998491).
Lin, H., Gorrell, J., & Taylor, J. (2002). Influence of culture and education on U.S. andTaiwan preservice teachers’ efficacy beliefs. Journal of Educational Research, 96(1), 37e46.
MacCallum, R. C., Roznowski, M., & Necowitz, L. B. (1992). Model modification incovariance structure analysis: The problem of capitalization on chance.Psychological Bulletin, 111, 490e504.
MacCallum, R. C., Widaman, K. F., Zhang, S., & Hong, S. (1999). Sample size in factoranalysis. Psychological Methods, 4, 84e99.
McCaslin, M., & Good, T. L. (1998). Moving beyond Management as Sheer Compli-ance: Helping Students to Develop Goal Coordination Strategies. EducationalHorizons, 76(4), 169e176.
McLaney, M. A., & Hurrell, J. J. (1988). Control, stress, and job satisfaction inCanadian nurses. Work and Stress, 2, 217e224.
McNeely, S. R., & Mertz, N. T. (1990, April). Cognitive constructs of preserviceteachers: research on how student teachers think about teaching. Paper pre-sented at the annual meeting of the American Educational Research Associa-tion, Boston, MA.
Martin, N. K., Yin, Z., & Baldwin, B. (1998). Construct Validation of The Attitudes andBeliefs on Classroom Control Inventory. Journal of Classroom Interaction, 33(2),6e15.
Mertler, C. (2002). Demonstrating the potential for web-based survey methodologywith a case study. American Secondary Education, 30, 49e61.
Martin, N. K., Yin, Z., & Mayall, H. (2007). The Attitudes & Beliefs on ClassroomControl Inventory-Revised and Revisited: A Continuation of Construct Valida-tion. Journal of Classroom Interaction, 42(2), 11e20.
Meyerson, P., & Tryon, W. (2003). Validating internet research: a test of thepsychometric equivalence of internet and in-person samples. Behavior ResearchMethods, Instruments, and Computers, 35, 614e620.
Muthén, B. O., Kaplan, D., & Hollis, M. (1987). On structural equation modeling withdata that are not missing completely at random. Psychometrika, 55, 107e122.
Muthén, L. K., & Muthén, B. O. (1998e2007). Mplus user's guide. Los Angeles, CA:Muthén & Muthén.
Nunnally, J. C. (1978). Psychometric theory (2nd ed.). New York: McGraw-Hill.Reeve, J., & Jang, H. (2006). What teachers say and do to support students'
autonomy during a learning activity. Journal of Educational Psychology, 98(1),209e218.
Rubin, D. B. (1976). Inference and missing data. Biometrika, 63, 581e592.Savran, A., & Cakiroglu, J. (2003). Differences between elementary and secondary
preservice teachers' perceived efficacy beliefs and their classroom managementbeliefs. The Turkish Online Journal of Educational Technology, 2(4).
Smart, J. (2009, April). A case study of an Italian teacher's behavior managementbeliefs, practices, and related classroom interactions. Paper presented at theannual meeting of the American Educational Research Association, San Diego, CA.
Stein, M. K., & Wang, M. C. (1988). Teacher development and school improvement:the process of teacher change. Teaching and Teacher Education, 4, 171e187.
Tschannen-Moran, M., & Woolfolk Hoy, A. (2001). Teacher efficacy: capturing anelusive construct. Teaching and Teacher Education, 17, 783e805.
N.K. Martin, D.A. Sass / Teaching and Teacher Education 26 (2010) 1124e11351134
Author's personal copy
Urich, S. L., & Tobin, K. (March, 1989). The influence of a teacher's beliefs onclassroom management. Paper presented at the annual meeting of the Amer-ican Educational Research Association, San Francisco, CA.
Wang, M. C., Haertel, G. D., & Walberg, H. J. (1994). What helps students learn?Educational Leadership, 51, 74e79.
Weinstein, C. S., & Mignano, A. J., Jr. (1993). Elementary classroom management:Lessons from research and practice. NY, NY: McGraw-Hill.
Willower, D. J., Eidell, T. L., & Hoy, W. K. (1967). Conceptual framework. The Penn-sylvania State University Studies, 26, 3e8.
Wolfgang, C. H. (1995). Solving discipline problems: Strategies for classroom teachers(3rd ed.). Boston: Allyn and Bacon.
Wolfgang, C. H., & Glickman, C. D. (1980). Solving discipline problems: Strategies forclassroom teachers (1st ed.). Boston: Allyn and Bacon.
Wolfgang, C. H., & Glickman, C. D. (1986). Solving discipline problems: Strategies forclassroom teachers (2nd ed.). Boston: Allyn and Bacon.
Woolfolk, A. E., & Hoy, W. K. (1990). Prospective teachers' sense of efficacy andbeliefs about control. Journal of Educational Psychology, 82, 81e91.
Woolfolk Hoy, A. E., & Weinstein, C. S. (2006). Student and teacher perspectives inclassroom management. In Carol M. Evertson, & Carol S. Weinstein's (Eds.),Handbook of classroom Management: Research, practice, and contemporary issues(pp. 685e709). Mahwah, NJ: Lawrence Erlbaum Associates.
Woolfolk Hoy, A. W., & Spero, R. B. (2005). Changes in teacher efficacy during theearly years of teaching: a comparison of four measures. Teaching and TeacherEducation, 21, 343e356.
Woolfolk, A. E., Rosoff, B., & Hoy, W. K. (1990). Teachers' sense of efficacy andtheir beliefs about managing students. Teaching and Teacher Education, 6,137e148.
Worthington, R. I., & Whittaker, T. A. (2006). Scale development research: a contentanalysis and recommendations for best practices. The Counseling Psychologist,34, 806e838.
N.K. Martin, D.A. Sass / Teaching and Teacher Education 26 (2010) 1124e1135 1135