Author Index - soft-toxsoft-tox.org/files/meeting_abstracts/SOFT_2010_meeting_abstracts.pdf ·...
133
Author Index SOFT 2010 Annual Meeting Richmond, VA Abbott, L S32 Cheng, H P33 Abraham, T P39 Chester, S S46 Adams, W S15 Chiang, C S10 Alford, I P3 Choo, R S47 Almazan, P P27, P50, P51 Chronister, C P57 Ananias, D S30 Clabaugh, M S45 Anderson, D S05, S17 Clark, D P71 Annoni, J S25 Clay, D P56 Appenzeller, M S25 Clouette, R S32 Aqeel, Z P73 Cochran, J P58 Aranda, R S39 Coffing, M P40 Armstrong, K P40 Coleman, S P4, P5 Arrocho, M P64 Collins, A S46 Augsburger, M P18 Concheiro, M S47 Backer, R S46 Cone, E P57, S30, S31, S33 Bailey, K P56 Conté Miller, M P31, P63, P64 Baker IV, D P53 Cooper, G S09, S18 Baldwin, D P44 Corbett, M S22 Barbieri, E S15 Coulter, C P1, S29 Barnes, A P39, P49, S26, S27 Countryman, S P21, P73 Battistella, G S25 Cox, D P19 Baylor, M P28, P38, P47,S13, S36, S48 Coyer, M P11 Beauchamp, S P62 Crankshaw, O S36 Beeson, J P62 Crews, B P27, P50, P51, S40 Bell, T P6 Crouch, D S33 Bell, W P17 Dahn, T P20, P29 Benoit, M S44, S49 Darwin, W S10, S14 Binkley, J P26, S42 Davies, G P34, P37 Binz, P P18 De Castro, A S50 Bishop-Freeman, S P66 De Quintana, S S17 Black, D S33 Dean, D P69 Bloom Oquendo, J P31 Desbrow, C P34, P35, P36, P37 Blum, K S30, S31 Desrosiers, N P69 Botch, S P9, P14 Diamond, F S17 Bourland, J P1, S46 Diehl, D P72 Brewer, J S37 Donnelly, E P6 Brewer, W P48 Donohue, J P70 Brinkhagen, L S28 Dooley, P P22 Brower, J P66, S07 Doorn, S S36 Brown, J S07 Dowthwaite, G P34, P35, P36, P37 Brunelli, B S32 Drummer, O S20 Brunson, T P59 Dudle, M P68 Buchanan, J P46 Durkin, E P65 Buchhalter, A S31 Elbogen, J S05 Buclin, T S25 Elian, A P15, P61 Budin, N P18 Elliott, S P65, S06 Bunten, H S02 El Sohly, M S34 Burbach, C P46 Ervin, J P29 Bush, D P47 Esposito, F P38 Bynum, N P28, S13 Evans, J P65, S06 Byrd, J P10 Evans, L P57 Cabrices, O P48 Favrat, B P18, S25 Cadet, J S10 Fernandez, C P21 Cairns, T S34, S38 Fitzgerald, R S41 Calverley, R P34, P35, P36, P37 Fitzgerald, S P6 Campbell, J P6 Fleming, S P68 Capacio, B S12 Folker-Calderón, D S49 Caplan, Y S33 Fornari, E S25 Caraiman, D P19 Forrest, A S08 Carter, P P4, P5 Forsman, M S28 Cawthon, B S33 Fowler, D P67 Chao, O S34, S38 Frazee III, C P68 Chen, B P7 Fritch, D S30, S31 Cheng, C S34, S38 Furton, K S03
Transcript of Author Index - soft-toxsoft-tox.org/files/meeting_abstracts/SOFT_2010_meeting_abstracts.pdf ·...

Author Index
SOFT 2010 Annual Meeting Richmond, VA
Abbott, L S32 Cheng, H P33 Abraham, T P39 Chester, S S46 Adams, W S15 Chiang, C S10 Alford, I P3 Choo, R S47 Almazan, P P27, P50, P51 Chronister, C P57 Ananias, D S30 Clabaugh, M S45 Anderson, D S05, S17 Clark, D P71 Annoni, J S25 Clay, D P56 Appenzeller, M S25 Clouette, R S32 Aqeel, Z P73 Cochran, J P58 Aranda, R S39 Coffing, M P40 Armstrong, K P40 Coleman, S P4, P5 Arrocho, M P64 Collins, A S46 Augsburger, M P18 Concheiro, M S47 Backer, R S46 Cone, E P57, S30, S31, S33 Bailey, K P56 Conté Miller, M P31, P63, P64 Baker IV, D P53 Cooper, G S09, S18 Baldwin, D P44 Corbett, M S22 Barbieri, E S15 Coulter, C P1, S29 Barnes, A P39, P49, S26, S27 Countryman, S P21, P73 Battistella, G S25 Cox, D P19 Baylor, M P28, P38, P47,S13, S36, S48 Coyer, M P11 Beauchamp, S P62 Crankshaw, O S36 Beeson, J P62 Crews, B P27, P50, P51, S40 Bell, T P6 Crouch, D S33 Bell, W P17 Dahn, T P20, P29 Benoit, M S44, S49 Darwin, W S10, S14 Binkley, J P26, S42 Davies, G P34, P37 Binz, P P18 De Castro, A S50 Bishop-Freeman, S P66 De Quintana, S S17 Black, D S33 Dean, D P69 Bloom Oquendo, J P31 Desbrow, C P34, P35, P36, P37 Blum, K S30, S31 Desrosiers, N P69 Botch, S P9, P14 Diamond, F S17 Bourland, J P1, S46 Diehl, D P72 Brewer, J S37 Donnelly, E P6 Brewer, W P48 Donohue, J P70 Brinkhagen, L S28 Dooley, P P22 Brower, J P66, S07 Doorn, S S36 Brown, J S07 Dowthwaite, G P34, P35, P36, P37 Brunelli, B S32 Drummer, O S20 Brunson, T P59 Dudle, M P68 Buchanan, J P46 Durkin, E P65 Buchhalter, A S31 Elbogen, J S05 Buclin, T S25 Elian, A P15, P61 Budin, N P18 Elliott, S P65, S06 Bunten, H S02 El Sohly, M S34 Burbach, C P46 Ervin, J P29 Bush, D P47 Esposito, F P38 Bynum, N P28, S13 Evans, J P65, S06 Byrd, J P10 Evans, L P57 Cabrices, O P48 Favrat, B P18, S25 Cadet, J S10 Fernandez, C P21 Cairns, T S34, S38 Fitzgerald, R S41 Calverley, R P34, P35, P36, P37 Fitzgerald, S P6 Campbell, J P6 Fleming, S P68 Capacio, B S12 Folker-Calderón, D S49 Caplan, Y S33 Fornari, E S25 Caraiman, D P19 Forrest, A S08 Carter, P P4, P5 Forsman, M S28 Cawthon, B S33 Fowler, D P67 Chao, O S34, S38 Frazee III, C P68 Chen, B P7 Fritch, D S30, S31 Cheng, C S34, S38 Furton, K S03
Author Index
SOFT 2010 Annual Meeting Richmond, VA
Garg, U P68 Kugelberg, F S28 Gebhardt, M P56 Kullberg, K P21 Gerostamoulos, D S20 Kuntz, D P40 Gesseck, A P52 Kushnir, M P54 Gillen, S S01 Labay, L S17 Giroud, C S25 Lacey, J S29 Glinn, M P62 Lambing, M P24 Goldberger, B P57 Landry, B P9, P14 Goodwin, R P39, S14, S27 Langman, L S24 Gorelick, D P39, S10, S27 Latyshev, S P27, P50, P51, S40 Gorniak, J P53 Law, W P8 Gray, T P49, S50 Lawrence, R S12 Griffin, T S41 Layne, J P73 Gullberg, R S04, S10 LeBeau, M P43, S35, S37, S39 Gutierrez, R P51 Lee, D S26 Hackett, J P15, P61 Lee, H P7 Haggerty, B P60 Lee, T P16 Haglock, C P54 Levine, B P67 Hargrove, R P66 Lewallen, C P28, S13 Harper, R P8 Lewis, C P9, P14 Hart, E P38 Liang, W S02 Hassan, H S18 Lichtman, A P60 Hearn, L S03 Liddicoat, L S23 Heffron, B S49 Lingamfelter, D P68 Heim, J P26, S42 Lintemoot, J S05 Heltsley, R S33 Liu, C P33 Hepler, B P55 Liu, H P16, S45 Herold, D S41 Liu, P P7 Herreño Sáenz, D P64 Liu, R P7 Hill, V S34, S38 Lo, W P33 Himes, S S39 Lodder, H P34, P35, P36, P37Ho, J P9, P14 Lundström, C S28 Holland, M S01 Maeder, P S25 Huang, D P33 Maggitti, A P23 Huang, M P7 Mahmoud, H P56 Huestis, M P39, P49, S01, S10, S14, S26, S27, S47, S50 Mahon, F S06 Hughes, J S40 Mall, J S25 Hurt, L S49 Mangin, P S25 Huynh, K P1, P2 Marin, S P30 Isenschmid, D P55 Marinetti, L P4, P5 Janer Figueroa, J P63, P64 Marrero, M P63 Jarvis, M S43 Martin, J P72 Johnson, R S47, S50 Masselot, A P18 Johnson, T S32 Masters, B P40 Johnson, W S21 Matsui, P S38 Jones, H S47, S50 Mauron, Y P18 Jones, R P34, P35, P36, P37 McGivern, P P6 Jordan, A P18 McKinnon, T P17 Jordan, S P34, P35, P36, P37 McLaughlin, P S16 Jufer, R P67 McMillin, G P30 Kang, J P33 McMullin, M P23 Karas, R S19 Meixner, M P40 Kardos, K S31 Meléndez Negrón, M P31, P63, P64 Karschner, E S14 Merves, M P57 Keenan, F P24 Mikel, C P27, P50, P51, S40 Kelley-Baker, T S29 Miles, A S23 Kelly, D S27 Miller, E P42 Kelly, K P21 Miller, M S39 Kennedy, P P58 Milman, G S26, S27 Keppel, M S15 Mitchell, J P28, P38, P47, S13, S36, S48Kolbrich Spargo, E P39 Montgomery, M P43, S35, S37, S39 Kozak, M P10 Moore, C P1, P2, S29 Kraner, J P56 Moore, K P12, S48 Kronstrand, R S28 Morgan, S P48
Author Index
SOFT 2010 Annual Meeting Richmond, VA
Morjana, N P71 Shipkowski, K S36 Morris, J S45 Shults, T S11 Morris-Kukoski, C P43, S35 Siefring, G P71 Moser, F S33 Silva Torres, L P64 Moshin, J S45 Silver, R P32 Moule, R P8 Simmons, V P46 Murray, G P32 Sinculer, C S49 Mylonas, R P18 Singh, A S22 Naso, C P67 Slawson, M P41 Negrusz, A S44, S49 Smith, C S06 Nguyen, N P73, P21 Smith, DL P66 Nielsen, S P32, P41 Smith, DW P17 Nonnemacker, S S30, S31 Smith, J S12 Norris, H P42 Soares, J P2 Nyströmand, I S28 Soler Rodríguez, R P64 Ofsa, W P23 Springfield, A P9, P14 Osselton, D P44, P45, S02, S16 Staples, D S42 Pace, N S43 Staub, C S25 Pérez Cruz, L P64 Steiner, R S48 Pesce, A P27, P50, P51, S40, S41 Stoppacher, R S01 Peterson, B S04 Stout, P P28, S13, S36, S48 Pfeifer, E S24 Sukta, A S44 Phillips, E P24 Sutheimer, C P47 Pieters, R S23 Taddei, L S44, S49 Plant, S P35, P36 Taylor, A P19 Pleitez, O S05 Teem, D P55 Poklis, A P12, P13, P22, P52, P60 Telepchak, M P15 Poklis, J P12, P13, P60 Terrell, A P20, P29 Pope, H S10 Thomas, A S25 Pounder, D S02, S16 Thmpson, J P6 Predescu, R S32 Tiffany, S P42 Ramsey, J P45 Tiscione, N P3 Rana, S P59, S45, S51 Tolliver, S S03 Rehder Silinski, M P28 Torrance, H S09 Reichardt, E P44, P45 Trass, M P73 Richards-Waugh, L P56 Uralets, V P59, S51 Rigdon, A P11, P58 Van Natta, K P10 Ripple, M P67 Varner, M P32 Rivera Nevárez, J P64 Vázquez, E P63 Robert, T S33 Vincent, M P1, P2 Roberts, M P30 Wallington, J S20 Roeser, C P57 Wang, A P16, S45 Rollins, D P41, P42 Wang, G P1, P2 Romero, E S29 Warren, J P71 Ropero Miller, J P28, S13, S36, S48 Watterson, J P69, P70 Rosenthal, M P27, P50, P51 West, C P27, P50, P51, S30Ross, W P59, S51 West, R P27, P50, P51, S40, S41Rowland, B S32 Wheeler, C P9, P14 Ruiz Colón, K P31, P64 Wiebelhaus, J P60 Rummel, M P73 Wilkins, D P32, P41, P42 Sabharwal, K P68 Williams, L P34, P35, P36, P37Sample, R S32 Winecker, R P66, S07 Sánchez, C P73 Wise, L P60 Sapp, L S43 Wolf, C P12, P13, P22, P52, P60Sawyer, J P54 Wolfe, M P13 Schaff, J P43, S35 Wood, M P25, P30 Schaffer, M S34, S38 Wort, C S20 Scheidweiler, K P39 Wright, S S14 Schreiber, A S43 Wu, M P7 Schwilke, E S10, S27 Wyman, J P69 Schwope, D S01, S27 Yang, M P19 Shan, X P3 Yeatman, D P3 Shanks, K P20 Young, M P72 Shakleya, D S47, S50 Zarwell, L S19

Author Index
SOFT 2010 Annual Meeting Richmond, VA
Zichterman, A S33

Key Word Index KEYWORDS ABSTRACTS
SOFT 2010 Annual Meeting
Richmond, VA
Acidic/Neutral Drugs P53 Adulterant P63 Alcohol P21, S22 Alternative Matrix P39 Alternative Samples S16 Amitriptyline P69 Amphetamines P29, S35 Anabolic Steroids S42, S49 Androgen P54 Antidepressants P20, S20, S40 Antidoping P41 Autopsy S08 Basic Drugs P53 Benzodiazepines P11, P30, S02, S20 Benzoylecgonine P24, P43 Biochemistry S08 Biomarkers S12 Blood P3, P29, S18, S19, S28, S29 Buprenorphine/Norbuprenorphine P1, P12, S07, S47 Boldenone S49 Butalbital S31 Caffeine P57 Cannabimimetic P60 Cannabinoids/Cannabis P23, P49, P60, S01, S25, S27, S38, S26 Carisoprodol P3 Cathinones P65, S06 Cheminformatics S48 Chiral S05 Chlordiazepoxide S17 Citalopram P4, P69 Clinical Chemistry Analyzer P40 Clonazepam S28 Cocaine P43, P46, P63, S30, S34, S39 Cocaine-N-Oxide S39 Codeine S03 Collection Standardization S37, S48 Combined Analysis P14 Comparison S13 Concateno Certus P44 Conjugation S46 Contamination S19 Crash Risk S20 Creatinine P7 Cross-Reactivity P1, P2 Cutoffs P27, P50 CYP2B6 S02 DART-AccuTOF™ S48 Database S48
Key Word Index KEYWORDS ABSTRACTS
SOFT 2010 Annual Meeting
Richmond, VA
Death S08 Deconvolution P26, S42 Derivatization P12, S17 DFSA P26 Difluoroethane P68, S23 Dipstick P8 Disposable Pipette Extraction P48 Doping S44 DRE S04 Driving/Drivers S04, S20, S21, S24, S29 Drug of Abuse P28, P45, P73, S11, S41 Drug Recognition Expert S23 Drug Testing S11 Drugs P18, S24, S29 DUID P39 EDDP P2, P6 Equine Urine S44, S49 EMDP P2 ELISA P3-P5 EMIT P71 Energy Shot P57 Endogenous Steroids P41 Enzymatic P8 Ethanol P21, P51 Ethical Concerns S11 Ethyl Glucuronide P35, P51 Ethyl Sulphate P51 EVOLUTE AX P35 Fatalities S06, S09, S24 Flunarizine P67 Fentanyl P52 Fluoxetine / Norfluoxetine P66 GC/Gas Chromatography P21, P57, S15 GC/MS P22, P46, P53, S17, S49 GC/MS/MS P41, S38 GCxGC-TOFMS P58, S42 General Unknown Screening S43 GHB P8 Glycol S15 Growth Rate S37 Hair P43, S34-S39 Hallucinogens P15 Hanging P67 Headspace P55 Herbal High Composition P59 Herbal Incense P58 Heroin Metabolite P71 High Throughput P19
Key Word Index KEYWORDS ABSTRACTS
SOFT 2010 Annual Meeting
Richmond, VA
HPLC P52 Huffing P68 Human Urine S51 Hydrolysis P49 Hydroxyzine P63 Illicit Drug Use P27 Immunoassay P1, P2, P40, P47, P62, P71 Impaired Driving S23 Impairment S21 In Utero Drug Exposure S47, S50 Inhalant P68 Ion Trap S41 JWH-Compounds P59, S45, S51 Ketamine/Norketamine P45, P70 LC/MS P19, S07, S39 LC/MS/MS P11-P13, P15-P19, P25-P32, P34-P37, P48,
P50, P54, P60, P61, S13, S28, S34, S40, S41, S43-S46, S51
LC-TOF P25, P26, S40 Levamisole P46 Library search P18 LTM Capillary Columns P23 Marijuana S04, S38 Mass Spectrometry P25, S12 Matrix Effect P9, P14 MDMA P39 Meconium P49 Measurement Uncertainty P43, S35 Mephedrone P36, P65, S06, S09 Methadone P2, P6, S02, S50 Method Validation P9, P14 Methamphetamine S05, S35 Methylene Blue S36 Microscopy S36 Morphine S03 Multiplex 2D-LC P19 Multi-Dimensional GC P23 Multiplexing P54 Multi-Targeted Screening S43 New Cannabis Use S10 Nicotine Biomarkers P42 Nicotine Metabolite P32 µ-Opioid Receptor OPRMI S02 Opiates/Opioids/Opioids Addition P6, S30 Oral Fluid P38-P42, P44, S01, S26-S33 Pain/Pain Management P50, P51, S33 Phenobarbital S31 Performance Characteristics P7
Key Word Index KEYWORDS ABSTRACTS
SOFT 2010 Annual Meeting
Richmond, VA
Phenazepam P56, P61, S21 Plasma P42, S14, S27 Poly-Drug P64 Poppy Seed Tea P56 Postmortem P4, P5, P31, P56, P67, S03, S05, S07, S15, S16 Prediction Model S10 Pregabalin P16 Prescription Drugs S11, S20 Propanal P21 Propanolol P21 Proficiency Testing P38 Purity P45 Ramelteon P17 Randox P62 Reference Materials S36 Requirement S22 Residual Cannabinoid Excretion S10 Rhodamine B S36 Sample Analysis P19 SAMSHA P24, P47, P73 Sativex® S14 Screen (Screening) P25, P40, P44, P62, S16 Screening Method S51 Secobarbital S31 Segmental Analysis P43, S35, S37 Self-Report S30 SEM S36 Serum P30, P32 Simulating Driving S25 Skeletal Tissues P69, P70 Smoking S25 Solid Phase Extraction/SPE P11, P15, P36, P48, P61, P72, P73, S44, S49 Specimen Validity Testing P7 SSRI’S P66 Stability S18 Stoppers P55 Suicide P65 Sulfur Mustard S12 Supported Liquid Extraction (SLE) P34, P37 Sympathomimetic Amines P24 Synthetic Cannabinoids P58, P59 Tandem MS P72 Tamoxifen P37 Tapentadol P16, S46 Test S22 Tetrahydrocannabinol/THC P10, P34, P72, S01, S14, S26, S27 Toxicity P64 Toxicology P9

Key Word Index KEYWORDS ABSTRACTS
SOFT 2010 Annual Meeting
Richmond, VA
Turbo Flow P10 Tramadol P22 Transdermal Patch P52 Trazodone P5 Tricyclic Antidepressants P13 Umbilical Cord S47, S50 UPLC/TOF P20 Urine/Urine Drug Screening/UrineTesting P3, P10, P13, P20, P22, P50, S32, S33, S40, S49 Urine Drug Confirmation S41 Validation P28, S13 Vials P55 VOC’s S19 Volatiles S18 Workplace Drug Testing P28, S32 Xylazine P31, P64 Z-Drugs P17 Zolpidem P17, P33 Zopiclone P17, P33 Zaleplon P17, P33
SOFT 2010 Annual Meeting Richmond, VA
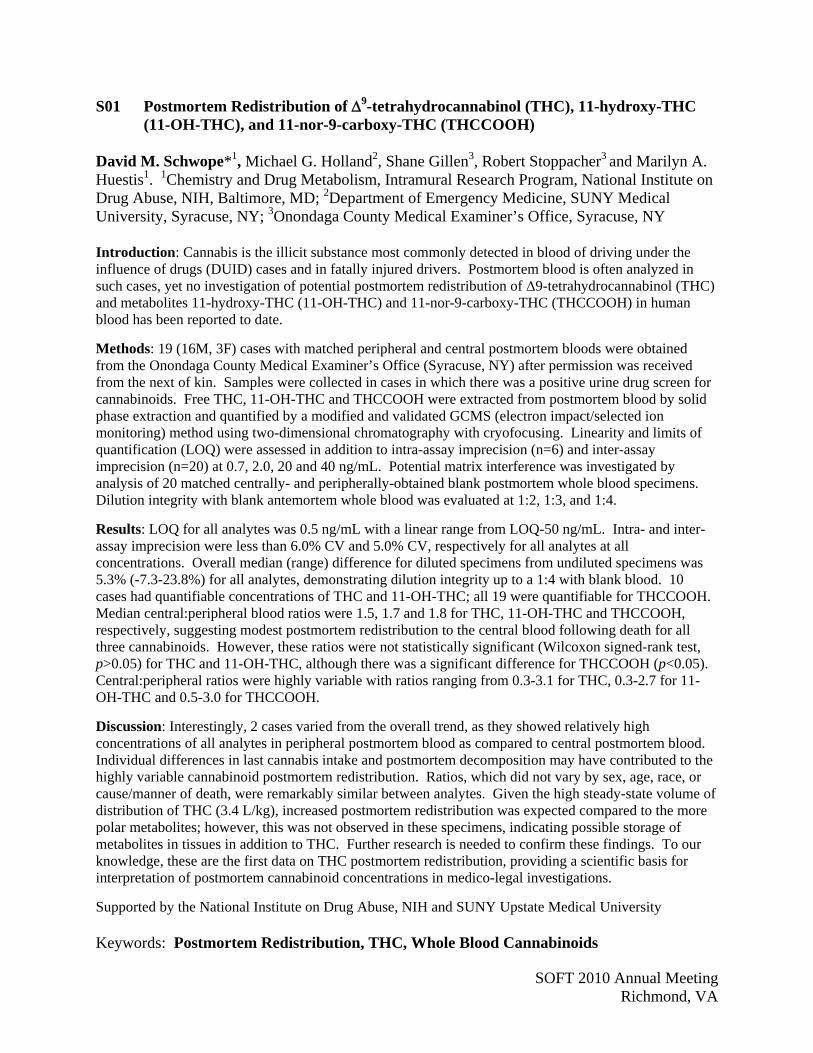
S01 Postmortem Redistribution of 9-tetrahydrocannabinol (THC), 11-hydroxy-THC (11-OH-THC), and 11-nor-9-carboxy-THC (THCCOOH)
David M. Schwope*1, Michael G. Holland2, Shane Gillen3, Robert Stoppacher3 and Marilyn A. Huestis1. 1Chemistry and Drug Metabolism, Intramural Research Program, National Institute on Drug Abuse, NIH, Baltimore, MD; 2Department of Emergency Medicine, SUNY Medical University, Syracuse, NY; 3Onondaga County Medical Examiner’s Office, Syracuse, NY Introduction: Cannabis is the illicit substance most commonly detected in blood of driving under the influence of drugs (DUID) cases and in fatally injured drivers. Postmortem blood is often analyzed in such cases, yet no investigation of potential postmortem redistribution of Δ9-tetrahydrocannabinol (THC) and metabolites 11-hydroxy-THC (11-OH-THC) and 11-nor-9-carboxy-THC (THCCOOH) in human blood has been reported to date.
Methods: 19 (16M, 3F) cases with matched peripheral and central postmortem bloods were obtained from the Onondaga County Medical Examiner’s Office (Syracuse, NY) after permission was received from the next of kin. Samples were collected in cases in which there was a positive urine drug screen for cannabinoids. Free THC, 11-OH-THC and THCCOOH were extracted from postmortem blood by solid phase extraction and quantified by a modified and validated GCMS (electron impact/selected ion monitoring) method using two-dimensional chromatography with cryofocusing. Linearity and limits of quantification (LOQ) were assessed in addition to intra-assay imprecision (n=6) and inter-assay imprecision (n=20) at 0.7, 2.0, 20 and 40 ng/mL. Potential matrix interference was investigated by analysis of 20 matched centrally- and peripherally-obtained blank postmortem whole blood specimens. Dilution integrity with blank antemortem whole blood was evaluated at 1:2, 1:3, and 1:4.
Results: LOQ for all analytes was 0.5 ng/mL with a linear range from LOQ-50 ng/mL. Intra- and inter-assay imprecision were less than 6.0% CV and 5.0% CV, respectively for all analytes at all concentrations. Overall median (range) difference for diluted specimens from undiluted specimens was 5.3% (-7.3-23.8%) for all analytes, demonstrating dilution integrity up to a 1:4 with blank blood. 10 cases had quantifiable concentrations of THC and 11-OH-THC; all 19 were quantifiable for THCCOOH. Median central:peripheral blood ratios were 1.5, 1.7 and 1.8 for THC, 11-OH-THC and THCCOOH, respectively, suggesting modest postmortem redistribution to the central blood following death for all three cannabinoids. However, these ratios were not statistically significant (Wilcoxon signed-rank test, p>0.05) for THC and 11-OH-THC, although there was a significant difference for THCCOOH (p<0.05). Central:peripheral ratios were highly variable with ratios ranging from 0.3-3.1 for THC, 0.3-2.7 for 11-OH-THC and 0.5-3.0 for THCCOOH.
Discussion: Interestingly, 2 cases varied from the overall trend, as they showed relatively high concentrations of all analytes in peripheral postmortem blood as compared to central postmortem blood. Individual differences in last cannabis intake and postmortem decomposition may have contributed to the highly variable cannabinoid postmortem redistribution. Ratios, which did not vary by sex, age, race, or cause/manner of death, were remarkably similar between analytes. Given the high steady-state volume of distribution of THC (3.4 L/kg), increased postmortem redistribution was expected compared to the more polar metabolites; however, this was not observed in these specimens, indicating possible storage of metabolites in tissues in addition to THC. Further research is needed to confirm these findings. To our knowledge, these are the first data on THC postmortem redistribution, providing a scientific basis for interpretation of postmortem cannabinoid concentrations in medico-legal investigations.
Supported by the National Institute on Drug Abuse, NIH and SUNY Upstate Medical University Keywords: Postmortem Redistribution, THC, Whole Blood Cannabinoids

SOFT 2010 Annual Meeting Richmond, VA
S02 Linkage between Methadone Fatality and OPRM1 and CYP2B6 Gene Variants Hannah Bunten*1, Wei-Jun Liang1, Derrick J. Pounder2 and David Osselton1. 1Centre for Forensic Sciences, Bournemouth University, Dorset, UK; 2Centre for Forensic and Legal Medicine, University of Dundee, Scotland Methadone is a medication valued for its effectiveness in the treatment of heroin addiction. However it is a potent drug with rising numbers of methadone associated mortalities reported over the years. We examined CYP2B6 and µ-opioid receptor (OPRM1) gene variations on individual susceptibility to methadone. Genomic DNA was extracted from the whole blood of 40 individuals whose deaths were attributed to methadone use. CYP2B6*4,*9, and *6 alleles and the OPRM1 A118G variant were analysed by SNP genotyping. CYP2B6 *4, *9, and *6 were associated with higher post-mortem methadone concentrations (p ≤ 0.05). OPRM1 A118G was also associated with higher post-mortem methadone concentrations, but this was not statistically significant (p=0.39). However, the mean post-mortem benzodiazepine concentration associated with OPRM1 118 GA carriers was twice that of AA (p=0.004) when found in combination with methadone, a finding not seen for morphine. Therefore the risk of methadone fatality may be predetermined in part by CYP2B6*6 and A118G. Keywords: Methadone, Benzodiazepines, µ-Opioid Receptor (OPRM1), CYP2B6

SOFT 2010 Annual Meeting Richmond, VA
S03 Evaluating the Relationship between Postmortem and Antemortem Morphine and Codeine Concentrations in Whole Blood
Samantha S. Tolliver*1,2, W. Lee Hearn1 and Kenneth G. Furton2. 1Miami-Dade County Medical Examiner Department, Miami, FL; 2Florida International University, Department of Chemistry and Biochemistry, Miami, FL
The purpose of this study was to examine the relationship between antemortem (AM) and postmortem (PM) morphine and codeine concentrations in whole blood. In addition, the effects of antemortem to death interval as well as the postmortem interval were considered during the interpretive process. The cases of fourteen human subjects are presented here with an average postmortem interval of 28.9 hours (13.5 – 48 hours) and an average antemortem to death interval of 8.4 hours (ranging from 9 minutes to 24 hours). Drug concentrations were obtained from AM blood collected from local hospitals in Miami, Fl, USA, while postmortem blood was obtained from the Miami-Dade County Medical Examiner Department in Miami, FL. The results obtained for this study indicated that factors such as metabolism and postmortem interval can affect postmortem drug concentrations in ways that are at times unpredictable. In all, 61% of the morphine cases and 77% of the codeine cases appeared to be affected by postmortem redistribution. Keywords: Postmortem, Morphine, Codeine

SOFT 2010 Annual Meeting Richmond, VA
S04 Evaluation of Drug Recognition Expert Reports in Marijuana Cases Brianna L. Peterson* and Rod L. Gullberg. Washington State Patrol, Seattle, WA The Drug Recognition Expert (DRE) program is regulated by the International Association of Chiefs of Police and National Highway Traffic Safety Administration. The program was designed to train law enforcement officers with the knowledge and skills to determine if an individual is under the influence of drug(s), and identify the broad category(ies) of drugs inducing the observable signs and symptoms of impairment. For the cannabis category, the indicators include lack of convergence (LOC) present, pupil size normal to dilated, elevated pulse rate, and elevated blood pressure. In addition, horizontal gaze nystagmus (HGN) and vertical nystagmus (VGN) are not present, reaction to light is normal, and body temperature is normal. The main focus of this study was to evaluate the effectiveness of these physiological indicators in a DRE examination to correctly identify the cannabis drug category. In addition, a comparison was made between indicators for cases that were positive for only carboxy-THC (THC-COOH) versus cases that were positive for both THC and THC-COOH. This study examined impaired driving cases that were submitted to the Washington State Patrol. All blood samples were tested for alcohol using headspace gas chromatography and underwent a drug screen by enzyme multiplied immunoassay (EMIT). Cases that were positive by EMIT for cannabinoids were confirmed using gas chromatography/mass spectrometry (THC limit of detection = 1.0 ng/mL). Cases were not considered that were positive for any substance other than THC or THC-COOH.
Calculations were based on 101 THC-COOH positive only cases (mean = 18.4 ng/mL, median = 13.4 ng/mL, range = 2.1 to 81.7 ng/mL) and 147 THC positive only cases (THC: mean= 7.3 ng/mL, median = 5.7 ng/mL, range = 1.6 – 25 ng/mL; THC-COOH: mean =74.1 ng/mL, median = 61.7 ng/mL, range = 6 - >200 ng/mL). Overall, the case subjects were 85% male, average age of 25 years, and 82% Caucasian.
THC only THC-COOH only HGN present 9% 11% VGN present 0% 2% LOC present 66% 47% Dilated pupil size 55% 55% Normal reaction to light 76% 77% Elevated pulse rate 57% 57% Elevated blood pressure (systolic/diastolic)
45% / 22% 45% / 25%
Normal body temperature 73% 87%
Other prevalent indicators were bloodshot eyes (86% THC, 81% THC-COOH) and eyelid tremors (81% THC and THC-COOH). In addition, subjects performed poorly on the walk and turn test (72% THC, 81% THC-COOH). THC has been reported to have a psychological effect of altered time perception. The subjects estimated 30 seconds during the Romberg test; 40% of THC and 49% of THC-COOH cases provided a response that was not within the range of 25 to 35 seconds. This data shows that lack of convergence is strongly associated with the presence of THC (p=0.003). The other indicators were consistent between THC and THC-COOH cases. This may indicate that due to the short half-life of THC and the extended time of an arrest that requires a DRE examination, the THC concentrations may be falling below levels of detection before the blood draw can occur. However, THC may have been active in the system during the exam and causing physiological effects that were observed by the officer.
Keywords: Marijuana, DRE, Driving
SOFT 2010 Annual Meeting Richmond, VA
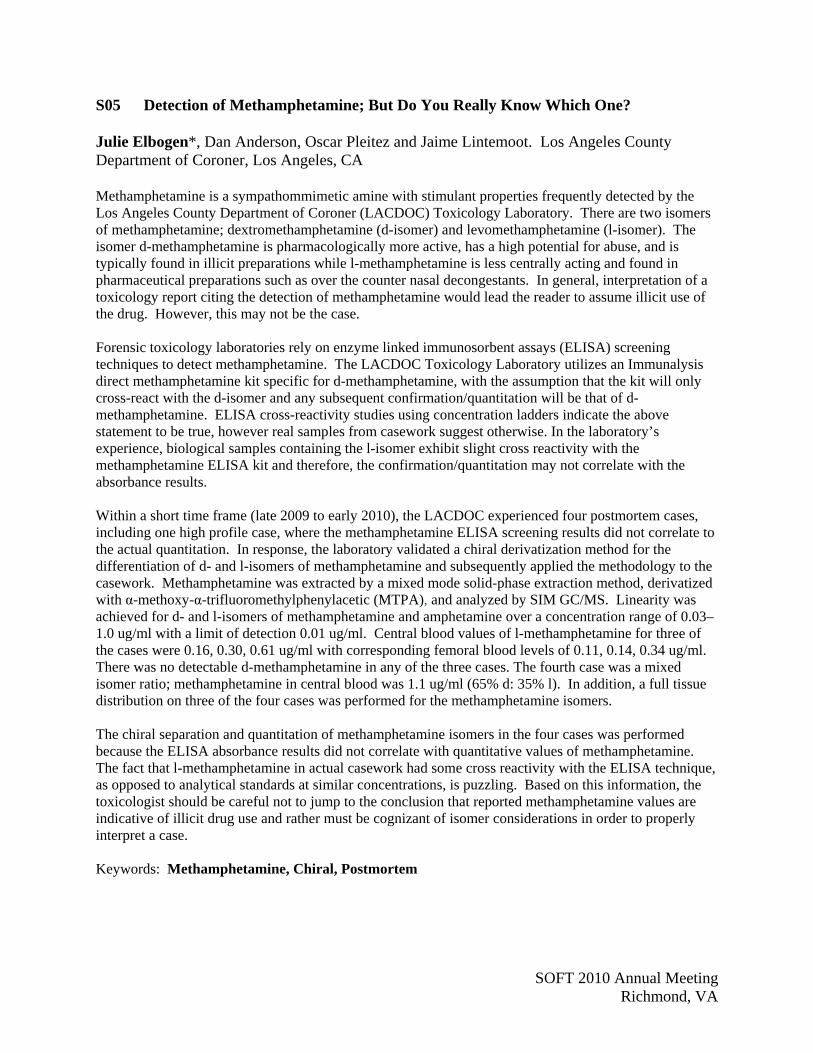
S05 Detection of Methamphetamine; But Do You Really Know Which One? Julie Elbogen*, Dan Anderson, Oscar Pleitez and Jaime Lintemoot. Los Angeles County Department of Coroner, Los Angeles, CA Methamphetamine is a sympathommimetic amine with stimulant properties frequently detected by the Los Angeles County Department of Coroner (LACDOC) Toxicology Laboratory. There are two isomers of methamphetamine; dextromethamphetamine (d-isomer) and levomethamphetamine (l-isomer). The isomer d-methamphetamine is pharmacologically more active, has a high potential for abuse, and is typically found in illicit preparations while l-methamphetamine is less centrally acting and found in pharmaceutical preparations such as over the counter nasal decongestants. In general, interpretation of a toxicology report citing the detection of methamphetamine would lead the reader to assume illicit use of the drug. However, this may not be the case.
Forensic toxicology laboratories rely on enzyme linked immunosorbent assays (ELISA) screening techniques to detect methamphetamine. The LACDOC Toxicology Laboratory utilizes an Immunalysis direct methamphetamine kit specific for d-methamphetamine, with the assumption that the kit will only cross-react with the d-isomer and any subsequent confirmation/quantitation will be that of d-methamphetamine. ELISA cross-reactivity studies using concentration ladders indicate the above statement to be true, however real samples from casework suggest otherwise. In the laboratory’s experience, biological samples containing the l-isomer exhibit slight cross reactivity with the methamphetamine ELISA kit and therefore, the confirmation/quantitation may not correlate with the absorbance results. Within a short time frame (late 2009 to early 2010), the LACDOC experienced four postmortem cases, including one high profile case, where the methamphetamine ELISA screening results did not correlate to the actual quantitation. In response, the laboratory validated a chiral derivatization method for the differentiation of d- and l-isomers of methamphetamine and subsequently applied the methodology to the casework. Methamphetamine was extracted by a mixed mode solid-phase extraction method, derivatized with α-methoxy-α-trifluoromethylphenylacetic (MTPA), and analyzed by SIM GC/MS. Linearity was achieved for d- and l-isomers of methamphetamine and amphetamine over a concentration range of 0.03–1.0 ug/ml with a limit of detection 0.01 ug/ml. Central blood values of l-methamphetamine for three of the cases were 0.16, 0.30, 0.61 ug/ml with corresponding femoral blood levels of 0.11, 0.14, 0.34 ug/ml. There was no detectable d-methamphetamine in any of the three cases. The fourth case was a mixed isomer ratio; methamphetamine in central blood was 1.1 ug/ml (65% d: 35% l). In addition, a full tissue distribution on three of the four cases was performed for the methamphetamine isomers. The chiral separation and quantitation of methamphetamine isomers in the four cases was performed because the ELISA absorbance results did not correlate with quantitative values of methamphetamine. The fact that l-methamphetamine in actual casework had some cross reactivity with the ELISA technique, as opposed to analytical standards at similar concentrations, is puzzling. Based on this information, the toxicologist should be careful not to jump to the conclusion that reported methamphetamine values are indicative of illicit drug use and rather must be cognizant of isomer considerations in order to properly interpret a case. Keywords: Methamphetamine, Chiral, Postmortem

SOFT 2010 Annual Meeting Richmond, VA
S06 The Arrival of the Next Big Thing – Mephedrone and Other Cathinone Derivatives in Fatalities
Simon Elliott*1, Julie Evans1, Christopher Smith1 and Frances Mahon2. 1(ROAR) Forensics Ltd, Malvern, UK; 2State Laboratory, Celbridge, Ireland Since the explosion in substituted phenylethylamines and tryptamines, designer drug chemistry has lead to alternative groups (e.g. piperazines) being used as a basis for the next generation of drugs of abuse. The possibility of cathinone (from the Catha Edulis plant) as a framework drug has been known for some time but only recently has this been reflected in production, availability and use of these drugs. They include beta-keto versions of the amphetamines and include; mephedrone (4-methylmethcathinone), methylone (bk-MDMA), butylone (bk-MBDB), methedrone (bk-PMMA), flephedrone (fluoromethcathinone), and methylenedioxypyrovalerone (MDPV). Due to the lack of international control, such drugs are often sold via the Internet as plant food or bath salts and are referred to as “Legal Highs” by suppliers and users. However, in April 2010 they have now been controlled under the 1971 Misuse of Drug Act in the UK. This work has arisen from the sudden and increasing occurrence of the detection of cathinone derivatives in toxicological investigation of fatalities. Although cathinone derivatives have only been detected in 18 cases, this represents a very short period of time (3 months) and additional cases are expected. Of these, the majority involved mechanical suicide (hanging, gunshot and asphyxiation) providing an alternative cause of death. 2 cases also involve passengers of vehicles in road traffic collisions. Overall, the predominant derivative found was mephedrone (17 cases) but methylone (3 cases), butylone (2 cases), flephedrone (2 cases) and MPDV (3 cases) have also been detected. Other drugs and/or alcohol were detected in the vast majority of cases. The post mortem blood mephedrone concentrations in fatalities with no alternative mechanical cause of death ranged from <0.08 - 0.24 mg/L. Mephedrone concentrations in fatalities with an alternative mechanical cause of death ranged from <0.08 - 1.20 mg/L. As a comparator, an in life blood mephedrone concentration of 1.06 mg/L was measured in a suspected driving under the influence of drink or drugs case. As expected, post mortem mephedrone urinary concentrations varied widely between <0.08 - 70.6 mg/L. Methylone and butylone in the absence of mephedrone were found in one death with corresponding post mortem blood concentrations of 11.0 mg/L and 1.72 mg/L, respectively. Very little information is known about the pharmacology and toxicology of mephedrone and the other cathinones but a few discrete case studies have been published and indicate the group may act in a similar way to other stimulants (e.g. amphetamine and MDMA). However, it is difficult to interpret any measured concentrations due to the current paucity of published data. We believe this work will benefit such interpretation, particularly as many of the cases involve an alternative cause of death which may allow better identification of “true” cathinone fatalities. Keywords: Cathinones, Fatalities, Mephedrone
SOFT 2010 Annual Meeting Richmond, VA
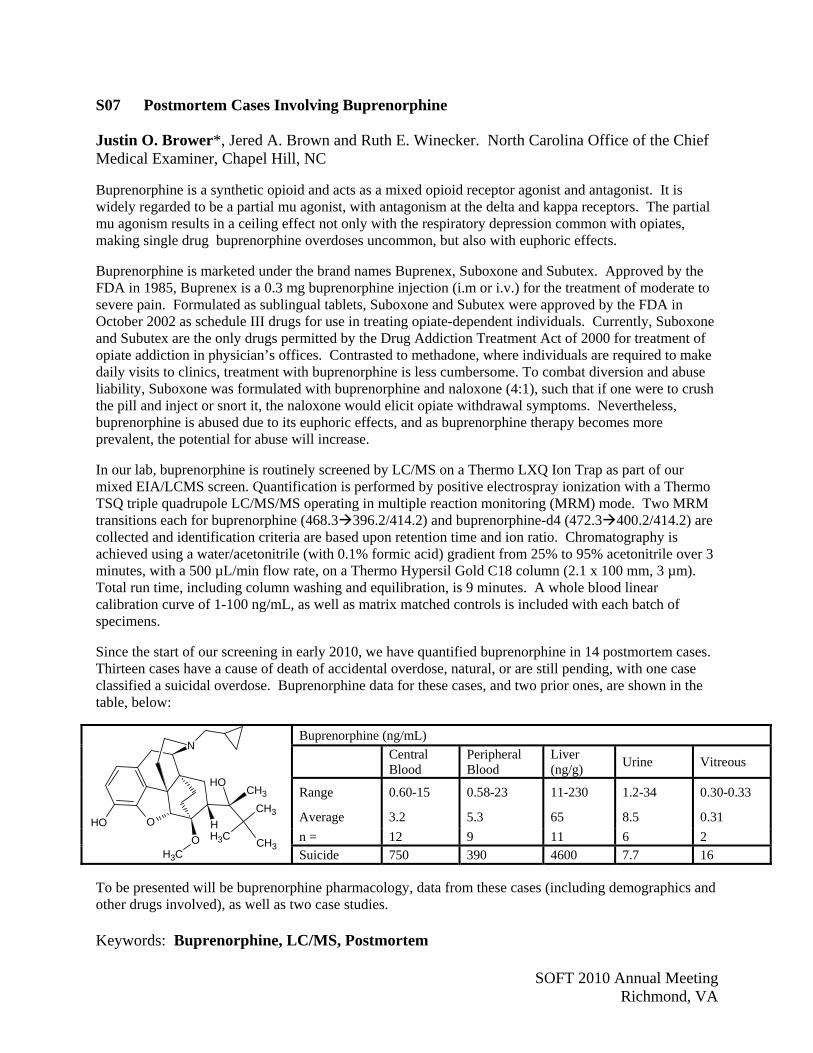
S07 Postmortem Cases Involving Buprenorphine Justin O. Brower*, Jered A. Brown and Ruth E. Winecker. North Carolina Office of the Chief Medical Examiner, Chapel Hill, NC Buprenorphine is a synthetic opioid and acts as a mixed opioid receptor agonist and antagonist. It is widely regarded to be a partial mu agonist, with antagonism at the delta and kappa receptors. The partial mu agonism results in a ceiling effect not only with the respiratory depression common with opiates, making single drug buprenorphine overdoses uncommon, but also with euphoric effects. Buprenorphine is marketed under the brand names Buprenex, Suboxone and Subutex. Approved by the FDA in 1985, Buprenex is a 0.3 mg buprenorphine injection (i.m or i.v.) for the treatment of moderate to severe pain. Formulated as sublingual tablets, Suboxone and Subutex were approved by the FDA in October 2002 as schedule III drugs for use in treating opiate-dependent individuals. Currently, Suboxone and Subutex are the only drugs permitted by the Drug Addiction Treatment Act of 2000 for treatment of opiate addiction in physician’s offices. Contrasted to methadone, where individuals are required to make daily visits to clinics, treatment with buprenorphine is less cumbersome. To combat diversion and abuse liability, Suboxone was formulated with buprenorphine and naloxone (4:1), such that if one were to crush the pill and inject or snort it, the naloxone would elicit opiate withdrawal symptoms. Nevertheless, buprenorphine is abused due to its euphoric effects, and as buprenorphine therapy becomes more prevalent, the potential for abuse will increase. In our lab, buprenorphine is routinely screened by LC/MS on a Thermo LXQ Ion Trap as part of our mixed EIA/LCMS screen. Quantification is performed by positive electrospray ionization with a Thermo TSQ triple quadrupole LC/MS/MS operating in multiple reaction monitoring (MRM) mode. Two MRM transitions each for buprenorphine (468.3396.2/414.2) and buprenorphine-d4 (472.3400.2/414.2) are collected and identification criteria are based upon retention time and ion ratio. Chromatography is achieved using a water/acetonitrile (with 0.1% formic acid) gradient from 25% to 95% acetonitrile over 3 minutes, with a 500 µL/min flow rate, on a Thermo Hypersil Gold C18 column (2.1 x 100 mm, 3 µm). Total run time, including column washing and equilibration, is 9 minutes. A whole blood linear calibration curve of 1-100 ng/mL, as well as matrix matched controls is included with each batch of specimens. Since the start of our screening in early 2010, we have quantified buprenorphine in 14 postmortem cases. Thirteen cases have a cause of death of accidental overdose, natural, or are still pending, with one case classified a suicidal overdose. Buprenorphine data for these cases, and two prior ones, are shown in the table, below:
Buprenorphine (ng/mL)
Central Blood
Peripheral Blood
Liver (ng/g)
Urine Vitreous
Range 0.60-15 0.58-23 11-230 1.2-34 0.30-0.33
Average 3.2 5.3 65 8.5 0.31
n = 12 9 11 6 2 Suicide 750 390 4600 7.7 16
To be presented will be buprenorphine pharmacology, data from these cases (including demographics and other drugs involved), as well as two case studies. Keywords: Buprenorphine, LC/MS, Postmortem
OOH
OCH3
N
CH3
CH3
CH3
CH3OH
H
SOFT 2010 Annual Meeting Richmond, VA
S08 Simple Metabolic Investigations – The Underused Arrow in the Forensic Toxicologist’s Quiver?
A. Robert W. Forrest*. Office of HM Coroner, East Riding of Yorkshire & Kingston - upon – Hull and Centre for Analytical Sciences, University of Sheffield, Yorkshire, UK
When a person is found dead unexpectedly and the post mortem examination does not reveal an anatomical cause of death, and often even if it does, samples will be taken for toxicology. There are occasions when toxicology does not yield the full answer that will enable the English coroner to establish how the deceased came to his death or the US Medical Examiner to establish the cause and manner of death. In many such cases, provided suitable samples have been collected, simple clinical chemistry tests may provide additional, helpful, information. [1]. This is the case both when a toxicology screen is negative and when the interpretation of the toxicology results is facilitated by a knowledge of, for example, renal function.
The most useful additional sample, not always collected routinely, is vitreous humor. The sample is easy to collect, but before it is collected thought should always be given to the possible need for histological examination of the eyeball as in, for example, a suspected child abuse homicide. Collecting vitreous is often useful in investigating drug misuse death, as 6-monoäcetylmorphine concentrations are often higher in vitreous than in blood. [2].
More reproducible results are achieved on carrying out biochemical analyses on vitreous if the sample is centrifuged and the supernatant used for analysis. Urea, creatinine, electrolytes, glucose, ketones, including ß-hydroxybutyrate and acetone, lactate and electrolytes can all be measured in vitreous by routine clinical chemistry laboratory techniques and can all assist elucidating the cause and manner of death in circumstances where anatomic pathology and toxicology findings alone are inconclusive.
GC/MS methods may be used for ß-hydroxybutyrate. [3]. Biochemical analyses on blood, urine and, occasionally, cerebrospinal fluid can also provide useful assistance in some cases.
In the course of the presentation, I will present a number of cases where biochemical analyses have assisted in their resolution. These will include cases were the deceased has been found dead in circumstances raising suspicion (beta hydroxy butyrate in a partially undressed male found in a disarrayed room, deaths in custody where the deceased has been though to be drunk and wasn’t (vitreous sodium, creatinine, glucose and beta hydroxybutryate in a case of missed HyperOsmolar Non ketotic diabetic coma (HONK) and deaths in hospices and care homes where allegations of euthanasia on the basis of a very high pm blood total morphine concentration (Vitreous creatinine). References:
1. Forrest AR. Toxicological and biochemical analyses. In: Burton JL, Rutty GN, eds. The Hospital Autopsy. 3rd ed: Hodder Arnold 2010
2. Wyman J, Bultman S. Postmortem distribution of heroin metabolites in femoral blood, liver, cerebrospinal fluid, and vitreous humor. J Anal Toxicol. 2004;28(4):260-3
3. Elliott S, Smith C, Cassidy D. The post-mortem relationship between beta-hydroxybutyrate (BHB), acetone and ethanol in ketoacidosis. Forensic Sci Int. 2010;198(1-3):53-7
Keywords: Biochemistry, Autopsy, Death

SOFT 2010 Annual Meeting Richmond, VA
S09 Mephedrone Fatalities in Scotland Hazel Torrance* and Gail Cooper. Forensic Medicine and Science, University of Glasgow, Glasgow, UK In the UK there has been considerable public interest in mephedrone. Throughout 2009 mephedrone’s popularity grew and it was considered the fourth most popular drug behind cannabis, cocaine and ecstacy. Several fatalities have been attributed to mephedrone use by the media, although few have been confirmed. As an emerging drug of abuse, there is very little data in published literature to assist in interpreting concentrations in blood with regards to toxic or impairment effects. There are currently two papers which describe cases of mephedrone use: the first is a fatality from Maryland, USA, where both mephedrone and heroin were implicated in the cause of death; the second is an A&E admission from London, UK, who subsequently recovered. In April 2010, the UK government made mephedrone a Class B drug banning its possession, supply and use. Due to increased speculation about the danger mephedrone may represent, Forensic Medicine and Science adapted our currently ISO/IEC 17025 accredited amphetamines method to include mephedrone. Our amphetamines method uses solid phase extraction to clean up the matrix before derivatising with PFPA and analysing using GCMS. Individual deuterated standards are used as internal standards for each analyte except mephedrone where MDA-d5 was used. Whilst adapting our method to include mephedrone we received 2 postmortem cases where mephedrone was suspected to be involved. In both instances the methamphetamine ELISA test was triggered positive in addition to mephedrone showing up in our basic drug screen. Subsequently we received a further two postmortem cases where mephedrone was not initially suspected but was identified by our screening procedures and quantified. The mephedrone concentrations in these cases ranged from 1.7 – 22mg/L in blood. In at least 2 of these cases the cause of death was recorded as mephedrone intoxication. In the fourth case the cause of death was a stab wound to the heart. There is an urgent need for more information on drug concentrations in blood to help improve our understanding of mephedrone and its role in fatalities and impairment. Keywords: Mephedrone, Fatalities

SOFT 2010 Annual Meeting Richmond, VA
S10 Differentiating New Cannabis Use from Residual Urinary Cannabinoid Excretion in Chronic, Frequent Cannabis Users
Eugene W. Schwilke*1,2, Rod G. Gullberg3, William D. Darwin1, C. Nora Chiang4, Jean Lud Cadet5, David A. Gorelick6, Harrison G. Pope7 and Marilyn A. Huestis1. 1Chemistry and Drug Metabolism, 5Molecular Neuropsychiatry, and 6Office of the Scientific Director, IRP, National Institute on Drug Abuse (NIDA), NIH, Baltimore, MD; 2AIT Laboratories, Indianapolis, IN; 3Washington State Patrol, Seattle, WA; 4Division of Pharmacotherapies and Medical Consequences of Drug Abuse, NIDA, NIH, Rockville, MD; 7McLean Hospital/Harvard Medical School, Belmont, MA
Introduction: Cannabis is the most widely used illegal drug in the world. Detection of its use is an important aspect of drug monitoring in drug treatment, workplace, military, and criminal justice settings. We previously published models for predicting new cannabis use in less than daily cannabis smokers, but to date, there are no guidelines for differentiating new cannabis use from residual cannabinoid excretion following chronic, daily exposure. The goal was to develop and empirically validate a mathematical model for identifying new cannabis use in chronic, daily cannabis smokers. Models were based on urinary creatinine-normalized (CN) 11-nor-9-carboxy-∆9-tetrahydrocannabinol (THCCOOH) excretion. Methods: For model development, every urine specimen produced for 30 days by 48 daily cannabis smokers initiating abstinence was analyzed. Participants resided on a secure research unit under continuous monitoring precluding access to drugs. For model validation, 67 daily cannabis smokers participating in an outpatient study of neurocognitive impairment agreed to remain abstinent and provided daily urine specimens for 28 days to monitor compliance. Urinary THCCOOH was determined by gas chromatography mass spectrometry with a limit of quantification of 2.5 µg/L, and urine creatinine (CN) by a modified Jaffe method. Urine THCCOOH was normalized to CN, yielding ng/mg CN-THCCOOH concentrations. Urine concentration ratios were determined from 123,513 specimen pairs collected 2-30 days apart. Results: A mono-exponential model (with two parameters, initial urine specimen CN-THCCOOH concentration and time between specimens) provided a reasonable data fit. Prediction intervals with varying probability levels (80, 90, 95 and 99%) provide upper ratio limits for each urine specimen pair. Ratios above these limits suggest cannabis re-use. Disproportionate numbers of ratios were higher than expected for some participants, prompting development of two additional rules that avoid misidentification of re-use in participants with unusual CN-THCCOOH excretion patterns. Conclusion: For the first time, a validated model is available to aid in the differentiation of new cannabis use from residual cannabinoid excretion in chronic, daily cannabis users. We offer four different probability cutoffs with varying degrees of stringency, i.e., varying probabilities of false-positive and false-negative new cannabis use identification. A choice of cutoffs provides flexibility in selecting the appropriate probability to optimize model applicability in a specific setting. This new tool for identifying cannabis relapse should be valuable for clinicians, toxicologists, drug treatment staff, and workplace, military, and criminal justice drug testing programs.
This research was supported by the Intramural Research Program, National Institute on Drug Abuse, NIH, Contract N01DA-1-8817 and NIDA grants RO1-06522 and R01- DA10346
Keywords: Prediction Model, New Cannabis Use, Residual Cannabinoid Excretion

SOFT 2010 Annual Meeting Richmond, VA
S11 The Misuse and Misinterpretation of Drug Test Results in Managing Prescription Drug Abuse — Legal, Technical and Ethical Concerns
Theodore F. Shults*. Chairman of the American Association of Medical Review Officers, Research Triangle Park, NC The epidemic of prescription drug abuse has presented physicians, MROs, employers and regulators with a difficult and complex challenge. The management of prescription drug abuse by drug testing presents a different model than the management of illegal drugs. The identification of prescription drug abuse is fundamentally a diagnostic decision, as distinguishable from determining illegal use based on the verification of a prescription. Nevertheless, employers and physicians are being sold “quick and easy” analytical drug testing solutions for prescription drug use, told they can distinguish “abuse” from therapeutic use based on “adjusted” quantitative urine results and various metabolic profiles and criteria. Using these approaches, three areas of error in prescription drug test interpretation are seen: 1) The use of “adjusted” quantitative values and/or upper cutoff levels for distinguishing compliance from abuse, without consideration of tolerance, variability in metabolism, time of administration, and the variability of pain and pain perception; 2) The unawareness of “process impurities” found in prescription drugs to explain the presence of non-prescribed drugs (e.g., hydrocodone found in prescription oxycodone); 3) The discounting of minor metabolic pathways, atypical metabolism and induced metabolism as explanations for unexpected results (e.g., the absence of a drug or metabolite due to induced metabolism). Examples of inappropriate interpretations of analytical results and the adverse consequences will be discussed, and a list of known process impurities will be presented. The paucity of scientific peer-reviewed data and support for the validity of using “adjusted” and unadjusted quantitative values to determine drug abuse presents significant legal and ethical concerns. Misleading marketing of laboratory testing that gives rise to inappropriate and invalid interpretations of prescription drug test results sets the stage for liability for employers, third-party administrators, professionals and laboratories for violation of state and federal disability acts, and undermines the integrity of toxicology and utility of drug testing as a legitimate tool. Keywords: Drug Testing, Prescription Drug Abuse, Ethical Concerns
SOFT 2010 Annual Meeting Richmond, VA
S12 Mass Spectrometry Methods for the Verification of Human Exposure to the Chemical Warfare Agent Sulfur Mustard
J. Richard Smith*, Benedict R. Capacio and Richard J. Lawrence. United States Army Medical Research Institute of Chemical Defense, Analytical Toxicology Division, Aberdeen Proving Ground, MD In recent years, a number of analytical methods have been developed for the analysis of biomarkers resulting from exposure to sulfur mustard. The majority of methods utilize gas chromatography (GC) or liquid chromatography (LC) in conjunction with mass spectrometry (MS). Sulfur mustard is a small molecular weight compound that readily reacts with nucleophiles, such as water, or with nucleophilic sites of macromolecules and upon exposure can result in extensive damage to the skin, eyes, and lungs. The chemical reactions produce a number of free metabolites and stable adducts to macromolecules that can be exploited for analysis in urine, blood, or tissue samples. In a small number of cases of suspected human exposure, biomedical specimens have been made available for testing. At the present time, there are five metabolites that have been identified in the urine of sulfur mustard-exposed individuals. Our primary method of analysis targets two biomarkers that are formed following the reaction of sulfur mustard with glutathione. The biomarkers can be analyzed individually using LC-MS-MS. They can also be analyzed as a single analyte following a reduction step using TiCl3 by either LC-MS-MS or GC-MS-MS. The single reduced analyte method for LC-MS-MS utilizes both C18 and NH2 SPE extractions of the urine and includes the addition of a 13C-labeled form of the analyte as an internal standard. Samples are analyzed using an Agilent Zorbax Bonus RP column and an isocratic mobile phase of 2 mM ammonium formate/methanol/acetic acid (85/15/0.1%). Mass spectrometry parameters include positive ion electrospray and multiple reaction monitoring. The lower limit of quantitation for the assay was determined to be 0.1 ng/mL. Whereas urinary metabolites undergo relatively rapid elimination from the body, blood components offer biomarkers that have the potential to be used for verification long after the exposure incident. For blood proteins, two different approaches have been utilized most commonly. Proteins can be enzymatically digested to produce a smaller peptide with the sulfur mustard adduct attached. Methods of this type have been developed for both hemoglobin and albumin. An alternate approach has been to cleave adducts from free carboxylic acid sites of plasma proteins. This is currently our primary blood verification assay. The sulfur mustard adducts are cleaved from protein using base and released as thiodiglycol. Following derivatization of the thiodiglycol and the internal standard (d8-thiodiglycol) using pentafluorobenzoyl chloride, the analytes are analyzed using GC-MS with a DB-5ms capillary column (30 m x 0.25 mm i.d., 0.25 µM film thickness). MS parameters include methane negative ion chemical ionization and selected ion monitoring. The lower limit of quantitation was determined to be 1.56 nM based on standards prepared from in vitro exposure of sulfur mustard in human plasma. The method has been applied to blood specimens obtained from an accidental human exposure to sulfur mustard and was able to detect plasma biomarkers in samples obtained 42 days after the exposure incident. Acknowledgments/Disclaimer: This work was supported by the Defense Threat Reduction Agency - Joint Science and Technology Office, Medical S&T Division. The opinions, interpretations, conclusions, and recommendations are those of the author(s) and are not necessarily endorsed by the US Army. Keywords: Sulfur Mustard, Biomarkers, Mass Spectrometry

SOFT 2010 Annual Meeting Richmond, VA
S13 A Comparison of the Validity of GC-MS and LC-MS-MS Analysis of Urine Samples II: Amphetamine, Methamphetamine, (+/-)-3,4-Methylenedioxyamphetamine, (+/-)-3,4-Methylenedioxymethamphetamine, (+/-)-3,4-Methylenedioxyethylamphetamine, Phencyclidine and (±)-11-Nor-9-carboxy-Δ9-tetrahydrocannabinol
Peter Stout, Nichole Bynum*, Cynthia Lewallen, John Mitchell, Michael Baylor and Jeri Ropero-Miller. RTI International, Center for Forensic Sciences, Research Triangle Park, NC On November 25, 2008, the U.S. Department of Health and Human Services posted a final notice in the Federal Register authorizing the use of liquid chromatography/tandem mass spectrometry (LC-MS-MS) and other technologies in federally regulated workplace drug testing (WPDT) programs. To support this change, it is essential to explicitly demonstrate that LC-MS-MS as a technology can produce results at least as valid as gas chromatography/mass spectrometry (GC-MS), the long-accepted standard in confirmatory analytical technologies for drugs of abuse. In October 2009 a comparison study was published for benzoylecgonine, morphine, codeine, and 6-acetylmorphine. A continuation of that study was performed, focusing on amphetamine, methamphetamine, (+/-)-3,4-methylenedioxyamphetamine, (+/-)-3,4-methylenedioxymethamphetamine, (+/-)-3,4-methylenedioxyethylamphetamine, phencyclidine, and (±)-11-nor-9-carboxy-Δ9-tetrahydrocannabinol. A series of manufactured control urine samples (n= 10 for each series) were analyzed with replication by five federally regulated laboratories using GC-MS and at RTI International using LC-MS-MS. Interference samples were analyzed by GC-MS and LC-MS-MS as well as previously confirmed urine specimens of WPDT origin. Matrix effects were also assessed for LC-MS-MS analyses. Results indicated that LC-MS-MS analyses produced results at least as precise, accurate, and specific as GC-MS for the analytes investigated in this study. Matrix effects, while evident, could be controlled by the use of matrix-matched controls and calibrators with deuterated internal standards. Keywords: LC-MS/MS, Validation, Comparison

SOFT 2010 Annual Meeting Richmond, VA
S14 Plasma Cannabinoid Pharmacokinetics Following Controlled Sativex® and Oral THC Administration
Erin L. Karschner*1, W. David Darwin1, Robert S. Goodwin1, Stephen Wright2 and Marilyn A. Huestis1. 1Chemistry and Drug Metabolism, Intramural Research Program, National Institute on Drug Abuse, National Institutes of Health, Baltimore, MD; 2GW Pharma Ltd., Salisbury, UK Background: Synthetic THC (Marinol®) is currently approved in the US for treatment of nausea and emesis secondary to cancer chemotherapy, as well as AIDS anorexia. Sativex® is a cannabis plant extract oromucosal spray delivering 2.5 mg cannabidiol (CBD) and 2.7 mg Δ9-tetrahydrocannabinol (THC) per actuation. Phase III clinical trials are currently underway to determine the efficacy of Sativex® as an adjunct to opioids in the treatment of cancer pain. There are indications that CBD modulates THC’s subjective effects, but it is unclear whether this is due to a pharmacokinetic or pharmacodynamic interaction. Methods: Cannabis smokers provided written informed consent to participate in this randomized, placebo-controlled, double blind, double dummy, within- and between-subject Institutional Review Board-approved study. Five dosing sessions were separated by at least 5 days: synthetic oral THC, 5 and 15 mg; low (5.4 mg THC and 5.0 mg CBD) and high dose (16.2 mg THC and 15.0 mg CBD) Sativex®; and placebo. Plasma specimens were extracted, derivatized and analyzed for CBD, THC, 11-hydroxy-THC (11-OH-THC) and 11-nor-9-carboxy-THC (THCCOOH) with a validated two-dimensional gas chromatography mass spectrometry method. Limits of quantification were 0.25 ng/mL for CBD, THC and THCCOOH and 0.125 ng/mL for 11-OH-THC. Results: When correcting for baseline cannabinoid concentrations, significant differences (p<0.05) in maximum plasma concentrations and area under the curve (AUC0→10.5) were observed between low and high doses of each treatment for all analytes. After low and high dose Sativex®, mean ± SE plasma CBD Cmax and Tmax were 1.6 ± 0.4 ng/mL at 3.7 ± 0.5 h and 6.7 ± 2.0 ng/mL at 4.0 ± 0.5 h, respectively. THC plasma Cmax and Tmax were 4.7 ± 0.9 ng/mL at 3.2 ± 0.3 h following 5 mg oral THC, and 14.3 ± 2.7 ng/mL at 3.4 ± 0.5 h after 15 mg oral THC. After low and high dose Sativex®, mean THC plasma Cmax and Tmax were 5.1 ± 1.0 ng/mL at 3.3 ± 0.3 h and 15.3 ± 3.4 ng/mL at 4.0 ± 0.5 h, respectively. Mean peak 11-OH-THC concentrations were higher and trended towards significance (F(1,23)=3.18, p=0.09) following 15 mg oral THC (11.1 ± 2.0 ng/mL; 3.4 ± 0.4 h) compared to high dose Sativex® (8.4 ± 1.2 ng/mL; peak 3.9 ± 0.5 h). Also, a statistical trend was observed for 11-OH-THC AUC0→10.5 between 15 mg oral THC and high dose Sativex (F(1,23)=3.25, p=0.085). THCCOOH mean Cmax and Tmax were 69.3 ± 17.6 ng/mL at 4.4 ± 0.5 h and 133.6 ± 36.3 ng/mL at 4.9 ± 0.5 for 5 and 15 mg oral THC, respectively. Mean peak THCCOOH concentrations were 108.0 ± 30.5 ng/mL at 4.4 ± 0.7 h after low dose and 126.6 ± 25.9 ng/mL at 4.8 ± 0.3 h following high dose Sativex®. No significant Cmax, Tmax, or AUC0→10.5
differences were observed between similar Sativex® and oral THC doses for all analytes. Discussion: Cannabinoid concentrations were highly variable, potentially from degradation in the gut, first pass metabolism and enterohepatic reabsorption. Additionally, during Sativex® administration, a portion of the dose may be swallowed, increasing variability in cannabinoid concentrations. No statistically significant pharmacokinetic differences were observed after similar Sativex® and oral THC doses, indicating that modulation of THC’s effects are not due to a pharmacokinetic interaction between THC and CBD. Supported by the Intramural Research Program, NIH, National Institute on Drug Abuse Keywords: Sativex®, THC, Plasma

SOFT 2010 Annual Meeting Richmond, VA
S15 Postmortem Analysis of Ethylene Glycols after Brake Fluid Ingestion Wendy R. Adams*, Edward J. Barbieri and Michael Keppel. NMS Labs, Willow Grove, PA Among the glycols, much is already known about the toxicology of ethylene glycol, a common ingredient in antifreeze. Diethylene glycol and other glycols share many characteristics with ethylene glycol but are rare findings in forensic toxicology investigations. We recently performed analysis on biological samples from a case involving a suspected brake fluid ingestion. An unresponsive male was found inside his locked vehicle with a partially consumed container of DOT 3 brake fluid on the floor inside. Glycols and glycol ethers were listed as the main ingredients. We tested for diethylene glycol, triethylene glycol and tetraethylene glycol in peripheral blood, urine, bile and vitreous fluid from the case. Gas chromatography with mass spectrometry (GC/MS) was used to identify each of the glycols. Quantitation was performed using standard addition and gas chromatography with flame ionization detection (GC/FID). 1,2-Butanediol was used as the internal standard. The relative proportions of the glycols found in DOT 3 brake fluid were similar to the proportions found in vitreous fluid and blood (see table below). However, the triethylene glycol greatly exceeded tetraethylene glycol in peripheral blood and bile, suggesting there may be a difference in the pharmacokinetic parameters for these two compounds.
Diethylene Glycol
Triethylene Glycol
Tetraethylene Glycol
DOT 3 Amount (% Weight)
14 5 8
Peripheral Blood (mg/dL)
36 18 9.8
Bile (mg/dL) 59 30 18
Vitreous Fluid (mg/dL)
14 5.8 3.4
Urine (mg/dL) 15 6.6 5.3
A method combining GC/MS with GC/FID and standard addition was successfully applied to the analysis of brake fluid components in postmortem fluids. The ability to quantitate several glycols at once in the same specimen provided a way to confirm the source of the glycols as DOT 3 brake fluid. The comparison of levels in different fluids is also useful for the interpretation of postmortem redistribution and pharmacokinetic properties. Keywords: Glycol, Postmortem, Gas Chromatography
SOFT 2010 Annual Meeting Richmond, VA
S16 Evaluation of the Randox Whole Blood Drugs of Abuse Arrays I and II for the Analysis of Alternative Post-Mortem Toxicology Samples
Poppy A. McLaughlin*1, Derrick J. Pounder2 and M. David Osselton1. 1Centre for Forensic Sciences, Bournemouth University, Poole, UK; 2Centre for Forensic and Legal Medicine, Dundee, UK Introduction: The Randox whole blood Drugs of Abuse (DOA) Array I and II are designed to analyse small aliquots of whole blood samples for several drugs / drug classes simultaneously. We describe a procedure that permits the whole blood DOA assays to be used for screening post-mortem specimens of urine, vitreous humor, liver and muscle in addition to blood in a mortuary environment whilsy the post-mortem examination is in progress. The combined use of the DOA I and II arrays are capable of detecting amphetamine, barbiturates, benzodiazepines, benzoylecgonine, buprenorphine, cannabinoids, fentanyl, ketamine, lysergic acid diethylamide (LSD), methadone, methaqualone, methylamfetamine, methylenedioxymethamfetamine (MDMA), opioids, phencyclidine (PCP) and propoxyphene. The ability to screen non-conventional tissue specimens may be of value in cases where conventional samples are unavailable e.g. exhumations, decomposed and embalmed bodies. Method: Femoral blood, vitreous humor, urine, psoas muscle and liver tissue were removed during routine post-mortem examinations. The liver and muscle were cut into one centimetre cubes and homogenised with one millilitre of assay SPE diluent. The homogenates were then centrifuged for 10 minutes at 3000 rpm and 70 microlitres of the supernatant transferred to conical bottomed Eppendorf tubes. Blood, urine and vitreous humor (~70 microlitres) were transferred directly to Eppendorf tubes as per the tissue supernatant. All of the samples were then diluted 1:3 with assay SPE diluent and applied to the biochip immunoassay following the manufactures specified whole blood protocol. All cases subsequently underwent confirmatory analysis using high performance liquid chromatography with diode array detection (HPLC-DAD) and liquid chromatography tandem mass spectrometry (LC-MS/MS). Results: Good agreement was obtained between the Randox biochip immunoassays and confirmatory analysis. The DOA I array was used to screen a range of tissues from 76 post-mortems, 35 of which were confirmed as positive by HPLC-DAD and LC-MS/MS for either, or a combination of, opiates, benzodiazepines, methadone and barbiturates. Of those positive cases, urine and liver sample screens were 100% in agreement with the confirmation results. Femoral blood, vitreous humor and psoas muscle were between 80 and 92 % in agreement with confirmatory analysis. Cannabiods were screened positive in 14 cases however no confirmatory analysis was undertaken. With the DOA II assay, 38 sets of post-mortems samples were screened; 20 were confirmed positive for generic opioids, and specifically for oxycodone, fentanyl and/or buprenorphine. In 85% of those positive cases, positive screening results were obtained in all the tissues analysed from a single donor. The discrepancies between assay screening and confirmatory analysis may reflect differences in drug distribution between tissues as well as confirmatory analyses detecting concentrations lower than the cut-offs of the assay. Conclusions: In cases where alternative specimens are submitted for toxicological analysis the Randox whole blood DOA Arrays I and II can be used to screen vitreous humor, urine, liver, psoas muscle and blood. The procedure is simple and the entire process can be undertaken in the mortuary offering an opportunity to perform rapid near-body drug screening during the post-mortem. The variety of tissues that can be screened may obviate the need to remove large tissue samples for laboratory analysis, saving time and costs, particularly in negative cases. Keywords: Screening, Post-Mortem, Alternative Samples

SOFT 2010 Annual Meeting Richmond, VA
S17 Chlordiazepoxide: A New Twist on an Old Drug Laura M. Labay *1, Francis X. Diamond1, Sarah B. DeQuintana2 and Dan T. Anderson2. 1NMS Labs, Willow Grove, PA; 2Los Angeles Department of the Coroner, Los Angeles, CA Chlordiazepoxide (Librium®) is a benzodiazepine that is often prescribed as part of an alcohol withdrawal program to relieve anxiety and control agitation. The analytical challenges associated with the quantification of this drug in biological specimens are well known and documented. Most notably, chlordiazepoxide (CDE) is thermally unstable and undergoes degradation when analyzed by most gas chromatographic-based methods. While this difficulty may be circumvented by the use of techniques not involving a heated instrument injection port, many laboratories still rely upon these types of methods to quantify CDE. Because of this, it is important to consider the entire spectrum of complexities associated with the analysis of CDE by the frequently employed technique of gas chromatography/mass spectrometry (GC/MS).
Two trimethyl silylating (TMS) agents, N-Methyl-N-(trimethylsilyl)trifluoroacetamide (MSTFA) and N, O-Bis(trimethylsilyl)trifluoroacetamide (BSTFA), are commonly employed in the analysis of benzodiazepines by GC/MS. However, these two TMS agents do not interact with chlordiazepoxide (CDE) in the identical fashion as would theoretically be expected. In short, when MSTFA was used as the derivatizing agent, several characteristic high mass ions were produced. In contrast, CDE did not undergo derivatization when BSTFA was used in the sample preparation scheme and as a result, mass ions (m/z 282, 283 and 284) identical to underivatized CDE were formed. The following table lists ions that are produced for CDE and D5-CDE with the use of BSTFA and MSTFA:
Derivatization Agent CDE D5-CDE BSTFA 282, 283 and 284 287, 288 and 289 MSTFA 411, 391 and 480 416, 396 and 485
The quantitative results obtained from the analysis of postmortem blood samples were lower when MSTFA was used in comparison to when CDE was derivatized with BSTFA or in its underivatized state. Furthermore, analysis performed by HPLC yielded consistent results with the MSTFA-derivatized CDE. The following tables list the results of the cases:
CASE 1 Blood Type CDE (BSTFA) CDE (MSTFA) HPLC Heart-Analysis 1 4100 ng/mL 1600 ng/mL --- Heart-Analysis 2 2800 ng/mL 1500 ng/mL 1300 ng/mL Femoral 2100 ng/mL 1300 and 1200 ng/mL* ---
CASE 2 Blood Type CDE (BSTFA) CDE (MSTFA) HPLC Heart 1300 ng/mL 260 and 240 ng/mL* Less than 250 ng/mL
* Analysis performed twice.
The above observations were investigated and after a search of the literature, an article by Entwistle (1986) was located that described a CDE reduction product named desoxychlordiazepoxide (desoxy-CDE). This product was determined to form in some postmortem samples and in samples stored for an extended period of time. The article also postulated that desoxy-CDE was unlikely to be produced by normal metabolic routes. In addition, the primary mass spectral ions produced by desoxy-CDE and underivatized CDE were reported to be the same.
Based upon the totality of the findings and the observations described above, when the underivatized compound was analyzed by a GC method, the quantitative results for CDE reflected the total of CDE and its reduction product desoxy-CDE. This information helps provide further insights into the analysis of a drug that, while not new, is still seen in current day forensic toxicology cases.
Keywords: Chlordiazepoxide, Derivatization, Gas Chromatography/Mass Spectrometry

SOFT 2010 Annual Meeting Richmond, VA
S18 The Effect of Preservative and Antioxidant Reagents on the Stability of Volatiles in Blood
Huda Hassan* and Gail Cooper. Forensic Medicine and Science, University of Glasgow, Scotland, UK The stability of common volatiles was investigated under controlled conditions over a period of 50 days. Blood was spiked with ethanol, methanol, isopropanol and n-propanol at 20 and 80mg/dL and acetone at 20 and 80 mg/L. Aliquots were stored at 25, 4, and -20 ºC with or without a preservative (sodium fluoride) or antioxidant (sodium metabisulphite). Samples were analysed using headspace gas chromatography with a flame ionisation detector (HS-GC-FID) utlising t-butanol as internal standard. Acetone levels increased while isopropanol and n-propanol levels decreased in both preserved and unpreserved samples at room temperature and when refrigerated. Methanol remained stable in the presence of a preservative and antioxidant in all conditions. Formation of ethanol was observed in samples stored at room temperature or refrigerated without preservative. All volatiles were stable when stored in the freezer. A further evaluation of the stability of ethanol in real case samples was also undertaken. Blood samples collected under Section 5 of the Road Traffic Act are stored in vials containing both preservative and antioxidant. 219 blood samples received within Forensic Medicine and Science at the University of Glasgow over a period of 5 years were initially analysed and refrigerated until the case was heard in court. Following completion the samples were removed from the refrigerator and stored at room temperature for varying periods of time spanning 5 years. A loss of on average 30% of the ethanol content was observed when the samples were re-analysed. Seventy-one paired preserved and unpreserved post-mortem blood samples stored in the refrigerator for six months were re-analyzed. Loss of ethanol was observed in approximately 50% of the 71 preserved samples and 40% of unpreserved samples. An increase in ethanol concentration of between 34 to 55% was observed in approximately 7% of the preserved samples and 25 % of unpreserved samples after 6 months of storage in a refrigerator. Keywords: Volatiles, Stability, Blood

SOFT 2010 Annual Meeting Richmond, VA
S19 Volatile Organic Compound Contamination of Vacutainer Blood Collection Tubes in an Unsolved Death Investigation
Roman Karas*1 and Lucas Zarwell2. 1FBI Laboratory Chemistry Unit, Quantico, VA; 2Office of the Chief Medical Examiner, Washington DC Volatile organic compounds (VOCs) are present in many commercially available household products. Such products include but are not limited to: solvents, paints, lacquers, cleaning agents, pesticides, and gasoline. Many VOCs are also used as an inhalant drug for their intoxicating properties. Volatile organic solvents are central nervous system depressants. They are capable of causing a range of effects upon inhalation and/or ingestion, including but not limited to: nausea, vomiting, dizziness, incoordination, unconsciousness, and death. The blood collected in an unsolved and unusual homicide case was thoroughly analyzed in order to provide any additional information as to the mode of death. The only remaining sample from the three year old investigation was a small portion of blood that had been collected in a standard gray-stoppered Vacutainer collection tube. Ethylbenzene, m,p-xylene, and o-xylene were qualitatively detected by headspace gas chromatography with mass spectrometry (HS-GC-MSD), and confirmed using headspace gas chromatography with flame ionization detection (HS-GC-FID). Quantitation by HS-GC-MSD yielded ethylbenzene, m,p-xylene and o-xylene at 120 ± 30 ng/mL, 140 ± 40 ng/mL, and 100 ± 30 ng/mL respectively (99.8% confidence level). In order to assess the significance of the values obtained, a thorough literature search on VOCs in blood samples was performed. Reference values for the detected VOCs spanned a wide range, encompassing both background, nonfatal, and fatal exposures. Additionally, several critical references pointed to the possibility of VOC contamination introduced to the Vacutainer via the rubber stoppers commonly used in commercially available blood collection tubes, further confounding interpretation of the results. In order to provide a more robust interpretation, five (5) blood specimens from unrelated cases that were stored under similar conditions were obtained. These cases were from routine investigations in which exposure to VOCs was not suspected. Ethylbenzene, m,p-xylene, and o-xylene were detected at similar concentrations in all five reference specimens, thereby indicating the most likely source of the VOCs was the collection tube itself. This case is illustrative of the toxicologist’s responsibility to properly characterize matrices and storage conditions, particularly when dealing with unusual case scenarios or seldom encountered analytes. Additionally, a thorough grasp of relevant literature can aid in interpreting the significance of quantitative values. Keywords: VOCs, Contamination, Blood
SOFT 2010 Annual Meeting Richmond, VA
S20 The Involvement of Prescribed Drugs in Road Trauma Dimitri Gerostamoulos*1,2, Jennifer Wallington1, Catherine Wort1 and Olaf H. Drummer.1,2. Victorian Institute of Forensic Medicine; 2Department of Forensic Medicine, Monash University, Australia Coroner’s files and toxicological records of fatally-injured drivers in Victoria, Australia from 2000 to 2006 were reviewed to establish the role of prescribed drugs on crash risk. 1381 driver fatalities were included in the study which represented over 97% of all driver fatalities in this period. Drugs of any type were found in 29.8% of the study group and alcohol (0.05 gram/100 mL) was found in 29.5%. The most common drugs detected that are legally available by prescription were opioids (6.0%), benzodiazepines (5.6%), anti-depressants (5.5%) and anti-convulsants (0.9%). As expected, the prevalence of these prescription drugs favored the older driver (60 years), while the younger driver (25 years) was more likely to consume illicit drugs such as amphetamines and cannabis. Each driver was assessed for responsibility using a previously published and validated method. The crash risk of drivers taking opioids, benzodiazepines, or anti-depressants (including the serotonin reuptake inhibitors), for whom sufficient numbers were available, were not significantly over-represented compared to the drug –free control group, however crash risk was elevated for drivers using cannabis and amphetamines. These data show that drivers using medicinal drugs as prescribed do not show significant crash risk even if drugs are potentially impairing. Keywords: Prescription Drugs, Crash Risk, Anti-Depressants, Benzodiazepines, Drivers
SOFT 2010 Annual Meeting Richmond, VA
S21 Phenazepam in Wisconsin Drivers William Johnson*. Wisconsin State Laboratory of Hygiene, Toxicology Section, Madison, WI Phenazepam is a little discussed benzodiazepine developed in 1970’s Soviet Union. It is currently produced in Russia and other Commonwealth of Independent States (CIS) countries. Phenazepam is used in the treatment of epilepsy, alcohol withdrawal, insomnia and anxiety. While phenazepam use is accepted in Europe it is neither regulated nor scheduled in the United States or UK. The recent detection of phenazepam in the blood of Wisconsin drivers is likely attributable to the availability of the drug through internet sales. Phenazepam is available for purchase in 100 mg to 100 gram quantities of bulk powder. Structurally similar to 1-4 benzodiazepines such as diazepam, nordiazepam and lorazepam, phenazepam interacts with the GABAA receptor to cause driving impairment akin to ethanol and other central nervous system (CNS) depressants. While little information on dosage and metabolism is available, one regimen noted was 0.5 mg, 2-3 times daily. One on-line recreational user equated 1 mg phenazepam to 5 mg diazepam. Benzodiazepines present analytical challenges to the forensic toxicology laboratory. The Wisconsin State Laboratory of Hygiene (WSLH) routinely tests for diazepam, nordiazepam, chlordiazepoxide, alprazolam, clonazepam, lorazepam, oxazepam and temazepam. Occasionally, positive benzodiazepine screening tests do not yield confirmed drugs in that class. Recent casework presented such a challenge. Two whole blood specimens were negative for ethanol and drugs but triggered a positive benzodiazepine screen. An unknown peak was identified in the basic drug procedure with benzodiazepine-like mass spectra matching to 7-bromo-5-(2-chlorophenyl)-1,3-dihydro-1,4-benzodiazepin-2-one. Further investigation of these cases pointed to the generic name of phenazepam. An analytical standard was purchased from Lipomed and evaluated utilizing an n-butyl chloride liquid:liquid extraction with acid back extraction. The resulting mass spectrum was identical to that of the unknown. Elimination of the back extraction yields improved linearity and chromatography, with mass-selective detection preferred. Phenazepam at 50 ng/mL cross-reacts with a blood EMIT benzodiazepine screen where the positive control is lorazepam at 40 ng/mL. Since September 2009 phenazepam has been identified in four Operating While Intoxicated (OWI) cases (n = 3 male, n = 1 female). In all cases, ethanol was not detected. In three cases a crash occurred and phenazepam was the only drug identified. Two cases were from the same individual, collected two days apart by different agencies. Phenazepam results ranged from 280 – 550 ng/mL. Field sobriety testing was limited due to injuries in two of the four cases but the impairment observed was similar to CNS depressants: slow/slurred speech, disorientation, lethargy and poor balance. Case histories will be reviewed. Keywords: Phenazepam, Drivers, Impairment

SOFT 2010 Annual Meeting Richmond, VA
S22 Sample Requirements (Pressure, Flow-Rate, Volume, Duration) of Investigated Breath Alcohol Test Devices (Alcotest 7410®, Alert J5®) and Instruments (Intoxilyzer 5000/5000EN®, Breathalyzer 900/900A®, BAC Datamaster®)
Michael R. Corbett* and Anu R. Singh. Faculty of Science, Forensic Science, University of Ontario Institute of Technology, Oshawa, Ontario, Canada An effective use of breath alcohol test devices and instruments is assisted with an objective understanding of sample requirements that include pressure, flow-rate, volume and duration. When available, the purported generic information is incomplete, and without independent external evaluation. A diagnostic test system was developed that incorporated independent methods for measuring test sample characteristics. A pump provided air samples through configurations that included connector block and sample measurement equipment. Pressure using three capacitance transducers was linear with two spring gauges (y=0.9875x–0.1813; r2=0.9988, n=144). Flow-rate using two float-ball gauges was linear with two automated vane spirometers (y=0.9893x+0.1284; r2=0.9858, n=96). Volume using two automated vane spirometers was linear with a manual vane spirometer (y=1.0002x–0.0159, r2=0.9991, n=40). Volume using a manual vane spirometer was 2.99 litres for a 3.0-L calibration syringe (±5 mL specification). Time was measured using an automated vane spirometer and a NIST-traceable stopwatch. The characteristics of the diagnostic test system were twice confirmed and consistent on separate occasions one year apart. The sample requirements of the device or instrument investigated were determined by gradually increasing the air pressure/flow-rate until the threshold was achieved. The minimum required pressure, flow-rate, volume and duration are summarized in the table below with a range derived from the number of devices or instruments investigated. All measurements were performed in quadruplicate. All devices and instruments investigated were in good working order. The minimum sample volume was achieved using the minimum pressure/flow-rate. However the minimum sample duration (not conducted on the Breathalyzer 900/900A®) was achieved using a higher pressure/flow-rate than the minimum.
Device/Instrument Pressure (inches of water)
Flow rate (L/min)
Volume (L)
Minimum Duration (sec)
Extended Duration* (sec)
Alcotest 7410® (n=2) 1.02-1.26 5.5-5.7 0.63-0.81 4.95-5.41 7.21-8.53
Alert J5® (n=1) 1.19 12.5 1.00 4.00 4.37
Breathalyzer 900/900A® (n=34) 3.50-4.22 0.4-2.6 0.055** NA <2
BAC Datamaster® (n=1) 0.98 2.2 0.83 3.40 22.51
Intoxilyzer 5000® (n=5) 1.46-16.8 4.2-10.2 0.77-1.43 3.81-4.25 7.04-11.12
Intoxilyzer 5000EN® (n=2) 1.63-3.56 3.8-9.5 0.42-1.50 1.79-4.19 5.91-6.87 *from minimum pressure/flow rate ** volume of sample chamber
Sample requirements varied between the devices and instrument investigated, and more importantly, within the same model. The variation in some sample requirements for breath alcohol tests indicates this may be a relevant source for consideration in some applications, such as where initial reasonable attempts from a test subject to provide samples are ultimately deemed a failure to comply. We propose a quality system for the breath alcohol test process that has a complete cumulative record of use with unique identification of the alcohol test device or instrument. The availability of this information in a spreadsheet format amenable to statistical analyses, along with other application details (eg. test operator), would assist in demonstrating the reliability of the application of the alcohol test system for internal and independent external review.
Keywords: Alcohol, Test, Requirement

SOFT 2010 Annual Meeting Richmond, VA
S23 1,1-Difluoroethane Abuse and Driving Impairment in Wisconsin Ryan Pieters*, Amy Miles and Laura Liddicoat. Wisconsin State Lab of Hygiene, Madison, WI 1,1-difluoroethane (DFE), also known as Freon 152a, is a propellant found in commercially available cans of compressed air. It is widely abused for its euphoric effects but can also cause hallucinations and unconsciousness. DFE’s short-lived impairing effects make detection a challenge for law enforcement officers. Over the last four years the Wisconsin State Laboratory of Hygiene (WSLH) has seen an increase in the number of drivers suspected to be under the influence of DFE. Until May of 2008, WSLH relied solely on an officer’s suspicion of DFE abuse to proceed with outsourced testing for DFE. As of May 2008, WSLH has been able to screen for DFE in samples submitted for testing while performing headspace alcohol analysis. In June 2010, WSLH validated a method for reporting the presence of DFE in blood. In this paper we present data from 29 cases of Wisconsin drivers suspected of driving under the influence of DFE from 2006 through 2009. Blood samples were collected in gray top vacuum tubes containing sodium fluoride and potassium oxalate. The mean age of the subjects was 30 years (range 17-55, median 26) with 19 males and 10 females. The mean amount of time from the initial contact with the arresting officer to the time of blood sample collection was 86 minutes (range 24-179, median 77). The mean elapsed time from blood sample collection to the time of the outsourced DFE analysis (LOD 0.135 mcg/ml) was 51 days (N=14, range 12-203, median 31). The mean elapsed time from blood sample collection to the time of WSLH DFE analysis (LOD 0.540 mcg/ml) was 281 days (N=14, range 175-423, median 265) with all but 3 samples still positive for DFE. 23 of the 29 cases were also screened for drugs other than DFE. Of these 19 cases were found to have one or more other drugs with THC (6) and alprazolam (4) the most frequently found. Police reports were obtained in 22 cases. Sixteen of those cases were crashes, two were single car rollover accidents and the other fourteen were stationary object crashes. SFST information indicated two-thirds of the drivers were impaired with many of the officers noting slurred speech, confused behavior and dilated pupils. Three of the subjects were evaluated by a DRE officer, with all having HGN present and failed Romberg test. Other typical inhalant indicators found in at least one of the DRE evaluations included lack of convergence, elevated pulse, slow reaction to light, flushed face, slow speech, confused demeanor, unsteady coordination and glassy, bloodshot or watery eyes. Two of the three DRE evaluated subjects were positive for drugs other than DFE, however, all of the DREs opined inhalants and one used the arresting officer’s SFST data to complete the evaluation and formulate the opinion. Although the effects of DFE may dissipate before law enforcement can perform SFSTs, driving history shows clear impairment in all cases. Blood testing can verify recent use even if field sobriety testing no longer indicates impairment. Analysis of the blood sample can be performed up to a year post collection and still verify the presence of DFE. Keywords: Difluoroethane, Impaired driving, Drug Recognition Expert

SOFT 2010 Annual Meeting Richmond, VA
S24 Drugs in Driving Fatalities In Olmsted County Minnesota Loralie J. Langman*1 and Eric A. Pfeifer 2. 1Drug/Toxicology Laboratory, Mayo Clinic, Rochester, MN; 2Coroner’s Office, Olmsted County, Rochester, MN Objective: Toxicology results were included in the study retrospectively from cases January 1, 2000 to December 31, 2009, where the deceased was identified as the driver involved in a fatal motor vehicle incident investigated by the Olmsted County Coroner's service. Methods: Drug screening was performed for illicit drugs including morphine, cocaine and metabolite, amphetamines, and cannabinoids (THC) by immunoassay. Basic, acidic and neutral drugs were screened by liquid-liquid extraction followed by GC-MS electron impact detection. Volatiles were assayed by GC-FID. Results: There have been 51 driving fatality investigations where a full drug screen was conducted. Three cases had no toxicology testing performed. Approximately 42% (N=20) of the cases had a negative toxicology screen. The remaining positive cases (N=28) had at least one drug identified. Of the cases containing drugs, 14 had 1 drug detected, 12 had 2, 1 had 3, and 1 had 4. Ethyl alcohol (EA) was detected most frequently (N=20) with a mean EA concentration of 0.17 ± 0.07 % and the median 0.20 %. Conclusions: The preliminary study indicated that EA is the drug most frequently associated with driving fatalities, followed by THC and cocaine. There doesn’t appear to be significant difference in case age vs. different drugs detected. However, due to the relatively small number of cases in the preliminary study, a difference may not yet be apparent. Keywords: Drugs, Driving, Fatalities

SOFT 2010 Annual Meeting Richmond, VA
S25 Cannabinoids Time-Profiles, Subjective and Clinical Effects, Simulating Driving Capability after Smoking a Joint Made of Neat Cannabis Containing 11% THC Christian Giroud*1, Aurélien Thomas1, Giovanni Battistella2, Philippe Maeder2, Jean-Frédéric Mall3,6, Jean-Marie Annoni4,5, Monique Appenzeller3, Thierry Buclin3, Christian Staub1, Patrice Mangin1, Eleonora Fornari2 and Bernard Favrat1. 1University Center of Legal Medicine, Lausanne – Geneva; 2Department of Radiology and CIBM, Centre Hospitalier Universitaire Vaudois (CHUV) and University of Lausanne; 3 Division of Clinical Pharmacology and Toxicology, CHUV, Lausanne; 4Neuropsychology Unit, Clinic of Neurology, Department of Clinical, Neuroscience, Geneva; 5Department of Neurology, CHUV, Lausanne; 6Department of Psychiatry, CHUV, Prilly, Switzerland Objectives : Our aim was to study the brain regions involved in a divided attention tracking task related to driving in occasional cannabis smokers. In addition we assessed the relationship between THC levels in whole blood and changes in brain activity, behavioral and psychomotor performances. Methods: Twenty-three male and healthy cannabis smokers participated to two independent cross-over fMRI experiments before and after smoking a neat cannabis joint (360 mg cannabis, 11% THC) and a placebo according to a fixed paced inhalation procedure. The paradigm was based on a visuo-motor tracking task, alternating active tracking blocks with passive tracking viewing and rest condition. Half of the active tracking conditions included randomly presented traffic lights as distractors. Blood samples were taken at regular intervals to determine the time-profiles of the major cannabinoids. Their levels during the fMRI experiments were interpolated from concentrations measured by GC-MS/MS just before and after brain imaging. Subjective and mood effects and the willingness to drive under various fictitious scenarios were assessed through VAS questionnaires. Results: The subjective feeling of intoxication, of high and the liking effects showed wide variations after smoking. The anxious feeling and liking the effects were totally unpredictable and not correlated with the blood levels. Simulating driving data, such as the deviation between target and cursor, the time of correct tracking and the reaction time during traffic lights appearance showed a statistical significant impairment of subject’s skills due to THC intoxication. Highest THC whole blood concentrations were measured soon after smoking and ranged from 28.8 to 167.9 ng/ml. The interpolated concentrations reached values of a few ng/ml (2.9-23.7 ng/ml, mean value: 9.4 ng/ml) during the 20 min-fMRI experiment carried out 45 minutes after starting the inhalation. fMRI results pointed out that under the effect of THC, high order visual areas (V3d) and Intraparietal sulcus (IPS) showed an higher activation compared to the control condition. The opposite comparison showed a decrease of activation during the THC condition in the anterior cingulate gyrus and orbitofrontal areas. In these locations, the BOLD showed a negative correlation with the THC level. Conclusions: Acute cannabis smoking significantly impairs performances and brain activity during active tracking tasks, partly reorganizing the recruitment of brain areas of the attention network. Neural activity in the anterior cingulate might be responsible of the changes in the cognitive controls required in our divided attention task. Wide variations in THC levels were observed despite the paced smoking procedure and the fixed amount of cannabis smoked in order to standardize the inhalation process. Similar large variations were also observed for the subjective effects and the willingness to drive. Keywords: Cannabis, Smoking, Simulating Driving,
SOFT 2010 Annual Meeting Richmond, VA
S26 9-Tetrahydrocannabinol (THC), 11-hydroxy-THC (11-OH-THC), 11-nor-9-carboxy-THC (THCCOOH), Cannabidiol (CBD) and Cannabinol (CBN) Concentrations in Oral Fluid Collected by Expectoration and the Quantisal™ Device
Dayong Lee*, Garry Milman, Allan J. Barnes and Marilyn A. Huestis. Chemistry and Drug Metabolism, IRP, National Institute on Drug Abuse, NIH, Baltimore, MD Introduction: Oral fluid collection is easy and non-invasive, providing a readily available biological fluid for monitoring illicit drug use in clinical, workplace, and forensic settings. Oral fluid concentrations following controlled drug administration are needed to improve interpretation of oral fluid results. Methods: 37 oral THC (20 mg, Marinol®) doses were administered over 8 days to daily cannabis users, residing on a closed research unit, who provided written informed consent for this IRB-approved study. Paired oral fluid specimens, obtained by expectoration and the Quantisal collection device were collected before, during, and after multiple, round the clock oral THC doses of up to 120 mg/day. Specimens were analyzed for THC, 11-OH-THC, THCCOOH, CBD and CBN by two dimensional GC/MS, according to a previously published assay (Milman et al. 2010 J Chromatography A). Limits of quantification (LOQ) in expectorated oral fluid were 0.25 ng/mL for all analytes, except CBN (1 ng/mL) and THCCOOH (5 pg/mL). LOQs of 0.5 ng/mL oral fluid were achieved for THC, 11-OH-THC, and CBD, 1.0 ng/mL for CBN and 7.5 pg/mL for THCCOOH in specimens collected with the Quantisal device. Results: 360 paired expectorant and Quantisal oral fluid specimens were collected from 10 cannabis smokers; there was insufficient volume in 5 (1.1%) highly viscous expectorated specimens. In the 355 matched specimen pairs, THC was detected in 13.8% (49) expectorated specimens and 21.1% (75) Quantisal specimens, despite the higher Quantisal LOQ. THC concentrations were 0.25-113.6 ng/mL in expectorants and 0.50-316.5 ng/mL for Quantisal. A significant difference (χ2=-5.62; p<0.001) and poor correlation (r = 0.24; p = 0.028) were observed for THC concentrations in the two oral fluid collection types. Similar THCCOOH detection rates (96.9 and 98.3%) and maximum concentrations (1390.3 and 1057.4 pg/mL) were observed for oral fluid collected by expectoration and with the Quantisal device, respectively. THCCOOH concentrations were significantly correlated (r = 0.56; p<0.001) with no significant differences (χ2=-0.52; p=0.601) between collection mode. 11-OH-THC was present in only one expectorant at 0.5 ng/mL, and not in any Quantisal specimen. CBD was identified in 1 expectorant (0.4 ng/mL) and 1 Quantisal (1.4 ng/mL) specimen. CBN concentrations in 3 expectorants were 1.2-14.9 ng/mL, and in 4 Quantisal oral fluid specimens 1.2 – 10.9 ng/mL. Conclusions: Oral fluid expectoration provides quantification of intact samples with a known sample volume and cost savings. However, participants and analysts preferred specimen collection and analysis with the Quantisal device. Quantisal specimens contained less food debris and mucous resulting in fewer analytical challenges. Even with a higher LOQ, Quantisal oral fluid collection provided specimens with better detection rates than expectoration. These results highlight the importance of collection method in oral fluid drug tests and aid in the interpretation of drug test results. Supported by the Intramural Research Program, National Institute on Drug Abuse, NIH and the NIDA-MPRC Residential Research Support Services Contract HHSN271200599091-CADB. Keywords: Oral Fluid, Tetrahydrocannabinol, Cannabinoids

SOFT 2010 Annual Meeting Richmond, VA
S27 Oral Fluid/Plasma Cannabinoid Ratios Following Around-the-Clock Multiple Controlled Oral THC Doses
Garry Milman*1, Eugene W. Schwilke1,2, David M. Schwope1, Allan J. Barnes1, Robert S. Goodwin1, Deanna L. Kelly3, David A. Gorelick4 and Marilyn A. Huestis1. 1Chemistry and Drug Metabolism and 4Office of the Scientific Director, Intramural Research Program, National Institute on Drug Abuse, NIH, Baltimore, MD; 2 AIT Laboratories, Indianapolis, IN; 3Maryland Psychiatric Research Center, University of Maryland School of Medicine, Baltimore, MD
Introduction: Understanding the relationship of Δ9-tetrahydrocannabinol (THC) and metabolites in oral fluid (OF) and plasma is important for interpreting toxicology results in treatment, workplace and driving under the influence of drugs (DUID) settings. Cannabis smoke is a major source of THC deposition in OF, while passive diffusion from blood is the primary source following oral THC administration. 11-nor-9-carboxy-THC (THCCOOH) also was recently identified in OF. The relationship of cannabinoids in OF and plasma is complex and incompletely characterized, due to the lack of controlled drug administration studies.
Methods: 10 daily cannabis smokers provided written informed consent to participate in this IRB-approved study. 37 oral THC (20 mg Marinol®) doses were administered around-the-clock with increasing frequency over 8 days (120 mg THC/day maximum) to daily cannabis smokers residing on a closed research unit. Simultaneous OF (collected with the Quantisal™ device) and venous plasma specimens were obtained before, during, and after THC dosing. THC, 11-hydroxy-THC (11-OH-THC), and THCCOOH were quantified by GCMS with limits of quantification of 0.25, 0.5, 0.25 g/L in plasma, and 0.5, 0.5, 0.0075 g/L in OF, respectively.
Results: THC was present in only 20.7% of OF specimens, with the highest concentrations from previously self-administered smoked cannabis (range 0.6-481.9 g/L), while all 360 plasma specimens were positive for THC (range 1.2-67.6 g/L) and 11-OH-THC (range 0.6-38.9 g/L). 11-OH-THC was not identified in OF. THCCOOH was the most prevalent analyte, appearing in 98.2% of OF specimens (range 0.0075-1.1 g/L). THCCOOH concentration range in plasma was 13.3-497.9 g/L. THCCOOH concentrations steadily increased during dosing in OF and plasma, while THC only increased in plasma. THC positive OF specimens were primarily found immediately after admission (due to previously self –administered smoked cannabis) and decreased over time. THC OF/P ratios decreased rapidly to <1 within the first 2 collections after admission, ranging from 0.03 to 9.5 with a median ratio of 0.3. The median THCCOOH OF/P ratio was 0.7 (range 0.02 to 8.7). Log-transformed THCCOOH OF and plasma concentrations were significantly correlated (r=0.63; p<0.001), albeit with a 1000-fold concentration difference and high inter-subject variability. Log-[THC] OF and plasma concentrations were poorly correlated (r=0.30; p<0.001). T
Conclusion: These controlled THC administration data document high inter-subject variability and clearly show that prediction of plasma THC from OF concentrations should not be attempted.
Supported by the Intramural Research Program, National Institute on Drug Abuse, NIH and NIDA-MPRC Residential Research Support Services Contract HHSN271200599091CADB
Keywords: Oral Fluid, Plasma, Tetrahydrocannabinol, Cannabinoids
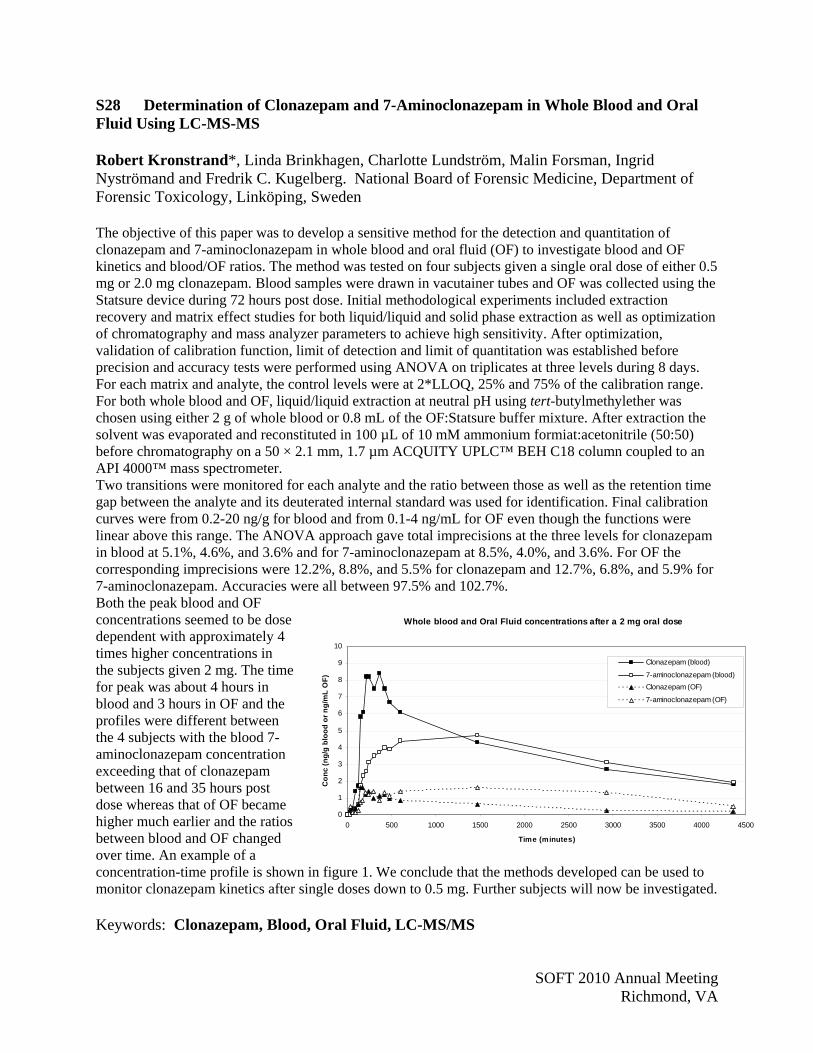
SOFT 2010 Annual Meeting Richmond, VA
S28 Determination of Clonazepam and 7-Aminoclonazepam in Whole Blood and Oral Fluid Using LC-MS-MS Robert Kronstrand*, Linda Brinkhagen, Charlotte Lundström, Malin Forsman, Ingrid Nyströmand and Fredrik C. Kugelberg. National Board of Forensic Medicine, Department of Forensic Toxicology, Linköping, Sweden The objective of this paper was to develop a sensitive method for the detection and quantitation of clonazepam and 7-aminoclonazepam in whole blood and oral fluid (OF) to investigate blood and OF kinetics and blood/OF ratios. The method was tested on four subjects given a single oral dose of either 0.5 mg or 2.0 mg clonazepam. Blood samples were drawn in vacutainer tubes and OF was collected using the Statsure device during 72 hours post dose. Initial methodological experiments included extraction recovery and matrix effect studies for both liquid/liquid and solid phase extraction as well as optimization of chromatography and mass analyzer parameters to achieve high sensitivity. After optimization, validation of calibration function, limit of detection and limit of quantitation was established before precision and accuracy tests were performed using ANOVA on triplicates at three levels during 8 days. For each matrix and analyte, the control levels were at 2*LLOQ, 25% and 75% of the calibration range. For both whole blood and OF, liquid/liquid extraction at neutral pH using tert-butylmethylether was chosen using either 2 g of whole blood or 0.8 mL of the OF:Statsure buffer mixture. After extraction the solvent was evaporated and reconstituted in 100 µL of 10 mM ammonium formiat:acetonitrile (50:50) before chromatography on a 50 × 2.1 mm, 1.7 µm ACQUITY UPLC™ BEH C18 column coupled to an API 4000™ mass spectrometer. Two transitions were monitored for each analyte and the ratio between those as well as the retention time gap between the analyte and its deuterated internal standard was used for identification. Final calibration curves were from 0.2-20 ng/g for blood and from 0.1-4 ng/mL for OF even though the functions were linear above this range. The ANOVA approach gave total imprecisions at the three levels for clonazepam in blood at 5.1%, 4.6%, and 3.6% and for 7-aminoclonazepam at 8.5%, 4.0%, and 3.6%. For OF the corresponding imprecisions were 12.2%, 8.8%, and 5.5% for clonazepam and 12.7%, 6.8%, and 5.9% for 7-aminoclonazepam. Accuracies were all between 97.5% and 102.7%. Both the peak blood and OF concentrations seemed to be dose dependent with approximately 4 times higher concentrations in the subjects given 2 mg. The time for peak was about 4 hours in blood and 3 hours in OF and the profiles were different between the 4 subjects with the blood 7-aminoclonazepam concentration exceeding that of clonazepam between 16 and 35 hours post dose whereas that of OF became higher much earlier and the ratios between blood and OF changed over time. An example of a concentration-time profile is shown in figure 1. We conclude that the methods developed can be used to monitor clonazepam kinetics after single doses down to 0.5 mg. Further subjects will now be investigated. Keywords: Clonazepam, Blood, Oral Fluid, LC-MS/MS
Whole blood and Oral Fluid concentrations after a 2 mg oral dose
0
1
2
3
4
5
6
7
8
9
10
0 500 1000 1500 2000 2500 3000 3500 4000 4500
Time (minutes)
Co
nc
(ng
/g b
loo
d o
r n
g/m
L O
F)
Clonazepam (blood)
7-aminoclonazepam (blood)
Clonazepam (OF)
7-aminoclonazepam (OF)
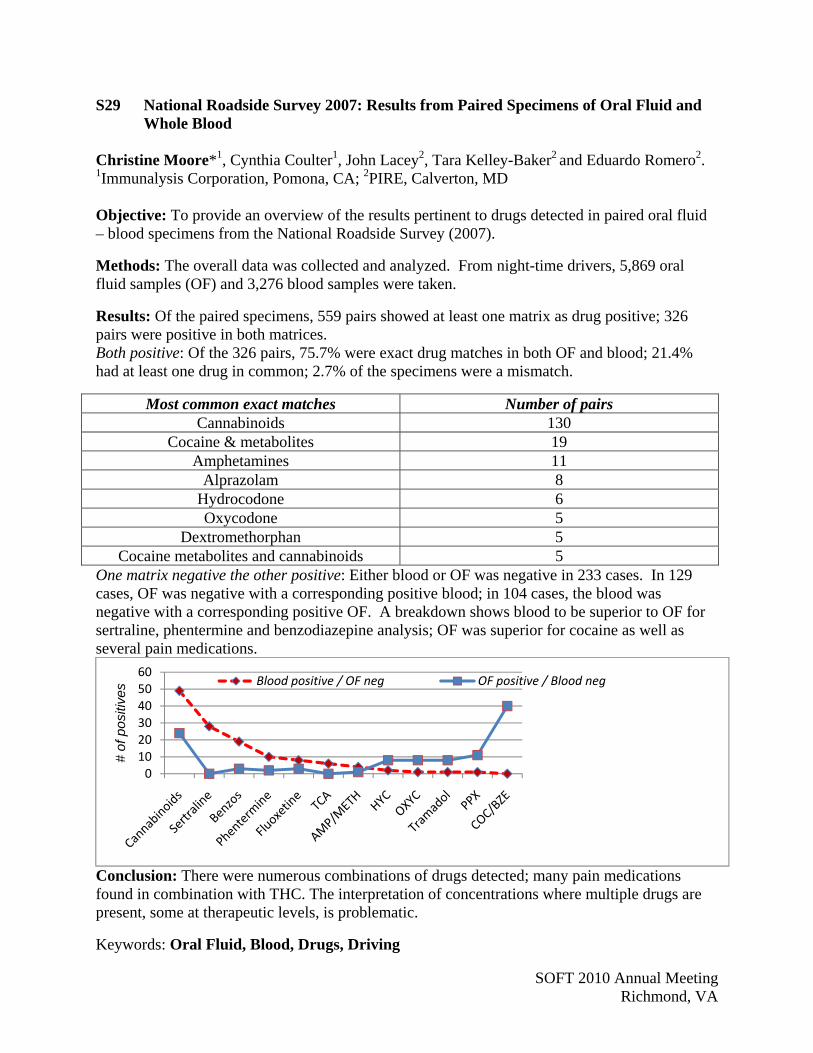
SOFT 2010 Annual Meeting Richmond, VA
S29 National Roadside Survey 2007: Results from Paired Specimens of Oral Fluid and Whole Blood
Christine Moore*1, Cynthia Coulter1, John Lacey2, Tara Kelley-Baker2 and Eduardo Romero2. 1Immunalysis Corporation, Pomona, CA; 2PIRE, Calverton, MD Objective: To provide an overview of the results pertinent to drugs detected in paired oral fluid – blood specimens from the National Roadside Survey (2007).
Methods: The overall data was collected and analyzed. From night-time drivers, 5,869 oral fluid samples (OF) and 3,276 blood samples were taken.
Results: Of the paired specimens, 559 pairs showed at least one matrix as drug positive; 326 pairs were positive in both matrices. Both positive: Of the 326 pairs, 75.7% were exact drug matches in both OF and blood; 21.4% had at least one drug in common; 2.7% of the specimens were a mismatch.
Most common exact matches Number of pairs Cannabinoids 130
Cocaine & metabolites 19 Amphetamines 11
Alprazolam 8 Hydrocodone 6 Oxycodone 5
Dextromethorphan 5 Cocaine metabolites and cannabinoids 5
One matrix negative the other positive: Either blood or OF was negative in 233 cases. In 129 cases, OF was negative with a corresponding positive blood; in 104 cases, the blood was negative with a corresponding positive OF. A breakdown shows blood to be superior to OF for sertraline, phentermine and benzodiazepine analysis; OF was superior for cocaine as well as several pain medications.
Conclusion: There were numerous combinations of drugs detected; many pain medications found in combination with THC. The interpretation of concentrations where multiple drugs are present, some at therapeutic levels, is problematic.
Keywords: Oral Fluid, Blood, Drugs, Driving
0102030405060
# of
pos
itive
s Blood positive / OF neg OF positive / Blood neg

SOFT 2010 Annual Meeting Richmond, VA
S30 Comparisons of Oral Fluid Tests for Cocaine and Opiates by Homogeneous Screening Assay; LC/MS/MS Confirmation, and Recent Self-Reported Drug Use in Methadone Treatment Subjects
Dean Fritch*1, Kristen Blum1, Sheena Nonnemacker1, Christopher West2, Davina Ananias2 and Edward J. Cone3. 1OraSure Technologies, Bethlehem, PA; 2Roche Diagnostics, Indianapolis, IN; 3Johns Hopkins School of Medicine, Baltimore, MD The effectiveness of substance abuse treatment programs is monitored by self-reported drug use and objectively measured by drug testing. A significant drawback to relying upon self-reported drug use as an outcome measure is the questionability of accuracy. Subjects may not know how much drug they have used, cannot remember, or be intentionally untruthful. Oral fluid testing for drugs of abuse in this population offers significant advantages over urine including observed collection, reduced risk of adulteration and substitution, and a close correspondence between drug and metabolite concentrations in oral fluid and blood. The objective of this study was to evaluate the accuracy of two recently developed homogeneous screening assays (Roche DAT) for cocaine and opiates in oral fluid specimens collected from subjects participating in an outpatient methadone treatment program. The study was approved by an Institutional Review Board and each subject provided informed consent. Subjects (n = 400) provided an oral fluid specimen and completed a short questionnaire on illicit drug use over the last seven days. Oral fluid was collected with the Intercept® Oral Fluid Collection device, screened by immunoassay (IA) for cocaine metabolite and opiates, and analyzed by LC/MS/MS. Sensitivity, specificity, and agreement were calculated by comparison of responses by IA versus LC/MS/MS at their respective cutoff concentrations for cocaine metabolite (3 versus 2 ng/mL, benzoylecgonine) and opiates (10 versus 10 ng/mL, morphine or codeine). The results of the comparison of IA with LC/MS/MS for the 400 specimens are tabulated below:
# TP # TN # FP # FN % Sensitivity % Specificity % Agreement Cocaine metabolite 155 243 0 2 98.7 100 99.5 Opiates 35 351 13 1 97.2 96.4 96.5
Comparison of self-reports of recent drug use (within 7 days) with test results are shown below:
Cocaine Opiates Self-Reported Use # Subjects TPs, # (%) # Subjects TPs, # (%) Used, within 2 days 87 82 (94.3) 60 16 (26.7) Used, within days 3-7 33 28 (84.8) 33 5 (15.2) No use 280 45 (16.1) 307 14 (4.6)
The authors conclude that the Roche DAT assays for cocaine metabolite and opiates in oral fluid are highly sensitive and specific and agree well with spectrometric analyses. In contrast, comparison of oral fluid TPs with subjects’ self-reported recent drug use was variable: for those who reported cocaine use, test results were in good agreement (>84%); for those who reported heroin use, lower rates of agreement were apparent. In addition, numerous subjects failed to report recent drug use. Keywords: Oral Fluid, Cocaine, Opiates, Self-Report

SOFT 2010 Annual Meeting Richmond, VA
S31 Butalbital, Phenobarbital, and Secobarbital Detection in Oral Fluid, Plasma and Urine
Edward J. Cone*1, Dean Fritch2, Kristen Blum2, Sheena Nonnemacher2, Keith Kardos2 and August R. Buchhalter3. 1Johns Hopkins School of Medicine, Baltimore, MD; 2OraSure Technologies, Bethlehem, PA; 3Pinney Associates, Bethesda, MD Although current abuse of barbiturates is relatively low compared to other classes of abused drugs, their narrow margin of safety, risk of dependence, and clinical abuse liability remain a health concern. Limited information is available on the disposition of barbiturates in different biological matrices. We conducted a clinical study of the disposition of barbiturates in oral fluid, plasma and urine following single dose administration to healthy subjects. The study was approved by an Institutional Review Board and each subject provided informed consent. Three parallel groups of 15 subjects were administered a single oral therapeutic dose of one barbiturate: butalbital (50 mg), phenobarbital (30 mg), or sodium secobarbital (100 mg). Of the 45 subjects, 31 were male and 14 were female; the average age (range) of the subjects was 35.2 (18-60) yrs. Subjects remained at the clinic for two confinement periods, the first 36 hr post-dose and again at 48-52 hr. Oral fluid specimens were collected via bilateral collection (Intercept®; one on each side of the mouth, simultaneously). Blood specimens were obtained via separate venipuncture approximately 2 minutes prior to collection of oral fluid specimens. Urine specimens were collected via separate collection pools of varying periods. Plasma and urine specimens were analyzed for barbiturates by GC/MS on an Ion Trap Quadrupole. The limit of quantitation (LOQ) was 100 ng/mL. Oral fluid specimens were analyzed by LC/MS/MS with an LOQ of 8 ng/mL. The three barbiturates were detectable in oral fluid and plasma within 15-60 min of administration and in the first urine pooled collection at 2 hr; butalbital and phenobarbital remained detectable in all specimens through 48-52 hr, whereas secobarbital was frequently negative in the last collection. Mean Cmax and Tmax data are tabulated below. Oral fluid and plasma Tmax data for the three barbiturates were shorter than urine.
Cmax (Range), ng/mL Oral Fluid* Plasma Urine Butalbital 225.6 (127 - 336) 1294.5 (858 - 2400) 798.1 (497 - 1888) Phenobarbital 123.3 (100 - 161) 826.1 (670 - 1044) 1275.1 (665 - 2138) Secobarbital 190.5 (84 - 331) 1969.9 (1514 - 3620) 406.3 (232 - 653) Tmax (Range), hrs Oral Fluid Plasma Urine Butalbital 0.7 (0.25 - 2.0) 0.9 (0.5 - 2) 8.1 (2 - 14) Phenobarbital 3.8 (0.50 - 14.0) 3.1 (0.5 - 8) 19.1 (8 - 52) Secobarbital 1.2 (0.50 - 3.0) 1.1 (0.5 - 2) 2.8 (2 - 12)
*Oral Fluid concentrations are reported uncorrected for buffer dilution by the Intercept device. In conclusion, this study demonstrated that single, oral therapeutic doses of butalbital, phenobarbital and secobarbital are excreted in readily detectable concentrations in oral fluid over a period of approximately two days. Their time courses of appearance and elimination were similar to that observed for plasma and urine. Keywords: Oral Fluid, Butalbital, Phenobarbital, Secobarbital
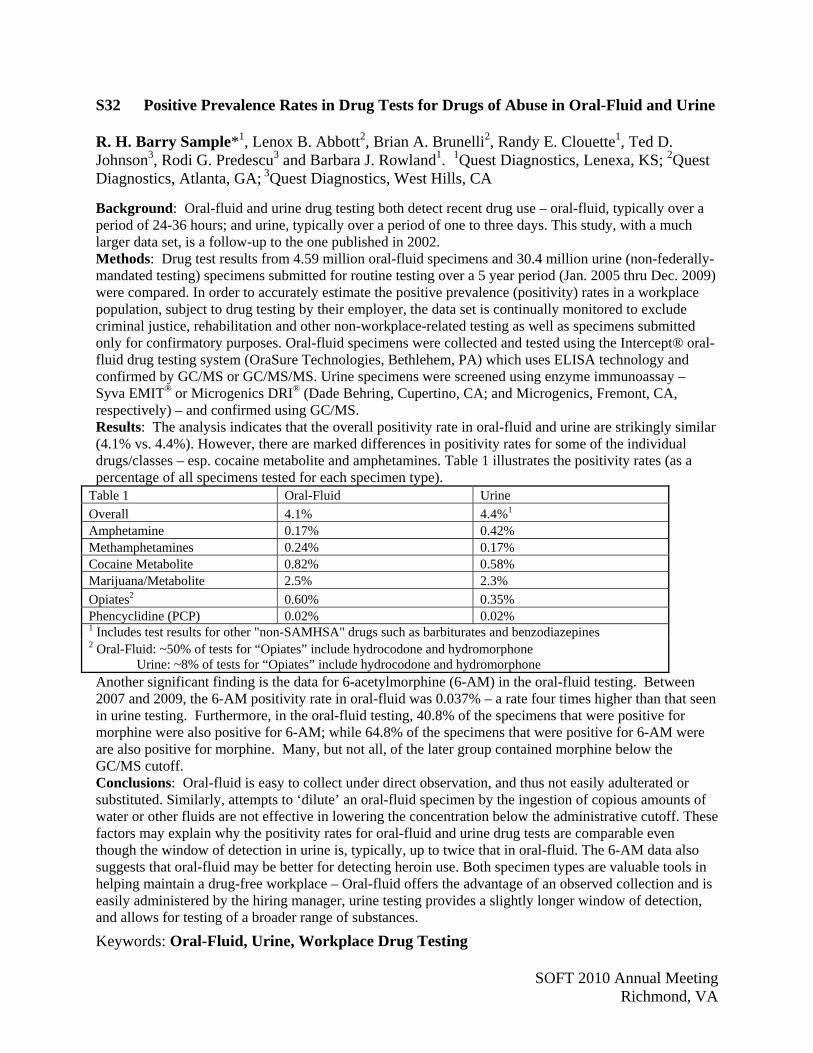
SOFT 2010 Annual Meeting Richmond, VA
S32 Positive Prevalence Rates in Drug Tests for Drugs of Abuse in Oral-Fluid and Urine R. H. Barry Sample*1, Lenox B. Abbott2, Brian A. Brunelli2, Randy E. Clouette1, Ted D. Johnson3, Rodi G. Predescu3 and Barbara J. Rowland1. 1Quest Diagnostics, Lenexa, KS; 2Quest Diagnostics, Atlanta, GA; 3Quest Diagnostics, West Hills, CA
Background: Oral-fluid and urine drug testing both detect recent drug use – oral-fluid, typically over a period of 24-36 hours; and urine, typically over a period of one to three days. This study, with a much larger data set, is a follow-up to the one published in 2002. Methods: Drug test results from 4.59 million oral-fluid specimens and 30.4 million urine (non-federally-mandated testing) specimens submitted for routine testing over a 5 year period (Jan. 2005 thru Dec. 2009) were compared. In order to accurately estimate the positive prevalence (positivity) rates in a workplace population, subject to drug testing by their employer, the data set is continually monitored to exclude criminal justice, rehabilitation and other non-workplace-related testing as well as specimens submitted only for confirmatory purposes. Oral-fluid specimens were collected and tested using the Intercept® oral-fluid drug testing system (OraSure Technologies, Bethlehem, PA) which uses ELISA technology and confirmed by GC/MS or GC/MS/MS. Urine specimens were screened using enzyme immunoassay – Syva EMIT® or Microgenics DRI® (Dade Behring, Cupertino, CA; and Microgenics, Fremont, CA, respectively) – and confirmed using GC/MS. Results: The analysis indicates that the overall positivity rate in oral-fluid and urine are strikingly similar (4.1% vs. 4.4%). However, there are marked differences in positivity rates for some of the individual drugs/classes – esp. cocaine metabolite and amphetamines. Table 1 illustrates the positivity rates (as a percentage of all specimens tested for each specimen type).
Table 1 Oral-Fluid Urine
Overall 4.1% 4.4%1 Amphetamine 0.17% 0.42% Methamphetamines 0.24% 0.17% Cocaine Metabolite 0.82% 0.58% Marijuana/Metabolite 2.5% 2.3%
Opiates2 0.60% 0.35% Phencyclidine (PCP) 0.02% 0.02% 1 Includes test results for other "non-SAMHSA" drugs such as barbiturates and benzodiazepines 2 Oral-Fluid: ~50% of tests for “Opiates” include hydrocodone and hydromorphone Urine: ~8% of tests for “Opiates” include hydrocodone and hydromorphone Another significant finding is the data for 6-acetylmorphine (6-AM) in the oral-fluid testing. Between 2007 and 2009, the 6-AM positivity rate in oral-fluid was 0.037% – a rate four times higher than that seen in urine testing. Furthermore, in the oral-fluid testing, 40.8% of the specimens that were positive for morphine were also positive for 6-AM; while 64.8% of the specimens that were positive for 6-AM were are also positive for morphine. Many, but not all, of the later group contained morphine below the GC/MS cutoff. Conclusions: Oral-fluid is easy to collect under direct observation, and thus not easily adulterated or substituted. Similarly, attempts to ‘dilute’ an oral-fluid specimen by the ingestion of copious amounts of water or other fluids are not effective in lowering the concentration below the administrative cutoff. These factors may explain why the positivity rates for oral-fluid and urine drug tests are comparable even though the window of detection in urine is, typically, up to twice that in oral-fluid. The 6-AM data also suggests that oral-fluid may be better for detecting heroin use. Both specimen types are valuable tools in helping maintain a drug-free workplace – Oral-fluid offers the advantage of an observed collection and is easily administered by the hiring manager, urine testing provides a slightly longer window of detection, and allows for testing of a broader range of substances.
Keywords: Oral-Fluid, Urine, Workplace Drug Testing

SOFT 2010 Annual Meeting Richmond, VA
S33 Oral Fluid is a Viable Alternate to Urine in Pain Management Testing Rebecca Heltsley*1, Anne Zichterman1, David L. Black1,2, Dennis J. Crouch1, Beverly Cawthon1, Tim Robert1, Frank Moser1, Yale H. Caplan3 and Edward J. Cone4. 1Aegis Sciences Corporation, Nashville, TN; 2Vanderbilt University Pathology Department, Nashville, TN; 3National Scientific Services, Baltimore, MD; 4Johns Hopkins School of Medicine, Baltimore, MD Acute and chronic pain is widespread and is one of the leading causes of physician visits. As physicians seek to ensure availability of appropriate medications for pain patients with legitimate medical needs, they also attempt to minimize the risk of misuse, addiction and diversion. Properly conducted laboratory drug tests identify recent use of prescribed and non-prescribed drugs. Oral fluid (saliva) testing for drugs offers some advantages over urine as a test matrix, such as observed collection, but has not been evaluated as an alternate test matrix for monitoring drug use by pain patients. This study compared oral fluid drug test results with urine results in specimens, collected in close proximity, from 133 chronic pain patients undergoing treatment at four clinics. The study was approved by an Institutional Review Board and each patient provided informed consent. Oral fluid specimens were collected per manufacturer’s instructions with Quantisal™ (Immunalysis Corporation, Pomona, CA) saliva collection devices. Oral fluid specimens were by analyzed for 38 drugs and/or metabolites by validated High Pressure Liquid Chromatography-Tandem Mass Spectrometry (HPLC-MS-MS) procedures. Accompanying urine specimens were initially screened and presumptive positives were confirmed by mass spectrometry. Comparison of test results for oral fluid, urine and self-reported, prescribed drug use and comparison of unreported non-prescribed or illicit drug use is shown in the table. Generally for prescribed drugs, there was high concordance between self-reported drug use and oral fluid and urine test results. The overall concordance for oral fluid with urine was 89.8% and 10.2% of the results were discordant. The greatest discordance was a lower detection rate for benzodiazepines by oral fluid. A total of 67 tests (N = 48 patients) were positive for drugs not prescribed including 9 positive tests for cocaine and 10 positive tests for marijuana. Two patients were positive for both drugs. The overall concordance for oral fluid versus urine was 56.7% and discordance was 43.3%. The greatest differences between the specimen results was in tests for cocaine and marijuana where oral fluid produced a greater numbers of positive results. For marijuana, there were 8 positive oral fluid specimens, 4 positive urine specimens, and only 2 specimens were positive by both tests.
Prescribed Drug
# Patient Reports
% Positive Oral Fluid
% Positive Urine
% Concordance (OF+/Urine+)
% Concordance (OF-/Urine-)
% Discordance (OF+/Urine-)
% Discordance (OF-/Urine+)
225 79.1 82.2 75.6 14.2 3.6 6.7
Non-prescribed or Illicit Drug # Patient Positives
% Positive Oral Fluid
% Positive Urine
% Concordance (OF+/Urine+)
% Concordance (OF-/Urine-)
% Discordance (OF+/Urine-)
% Discordance (OF-/Urine+)
67 82.1 74.6 56.7 N/A 25.4 17.9 These data offer a broad array of information across numerous licit and illicit drug classes on the potential use of oral fluid in pain management testing. There was generally a high concordance between oral fluid and urine specimens compared to self-reported prescribed drug use. However, oral fluid testing performed slightly better than urine for the detection of non-prescribed and illicit drug use in this population.
Keywords: Oral Fluid, Urine, Pain Management

SOFT 2010 Annual Meeting Richmond, VA
S34 Development and Validation of an LC/MS/MS Method for the Detection of Cocaine and Cocaine Metabolites in Hair as an Indicator of Cocaine Use
Michael Schaffer*1, Oscar Chao1, Mahmoud ElSohly2, Chen Chih Cheng, Virginia Hill1 and Thomas Cairns1. 1Psychemedics Corporation, Culver City, CA; 2ElSohly Laboratories, Oxford, MS Background: The analysis of cocaine (COC) in hair included (1) washing the sample and analyzing the last wash; (2) Optimizing recovery of the parent drug and metabolites from hair at an appropriate pH; (3) Optimizing derivitization to ensure separation of underivatized benzoylecgonine (BE) from norcocaine (NOR); (4) Optimizing solid phase extraction, (5) Validating the instrumental method, (6) Mass Spectrometry (MS) criteria for verification of a positive result, and (7) Using a wash criterion to distinguish environmental contamination from ingestion.
Objective: Develop a method for determining multiple cocaine metabolites in hair samples from several populations at the required low levels. The instrument was a triple quadrupole LC/MS/MS system operating in the positive ion mode. Single quadrupole instruments have not been demonstrated to offer sufficient sensitivity for all analytes.
Methods: An LC/MS/MS method was developed to measure COC, BE, NOR, cocaethylene (CE), and meta-, para- and ortho-hydroxycocaine (m-OH-C, p-OH-C, o-OH-C) in 10 mg of hair. Analyses were performed on either a triple quadrupole API 2000 Perkin Elmer Sciex MS or an API 3000 equipped with an atmospheric pressure ionization source via an Ion Spray. The MS was operating in the multiple reaction mode (MRM). The instrument was operating at unit resolution on both Q1 and Q3. For LC, a binary pump with an autosampler ISS 200 Perkin Elmer or series LC/20 AD Shimadzu binary pump with Leap Technologies autosampler was utilized with a 50 X 2.1mm, Hypersil-Kestone C8 column (Thermo Scientific) packed with 5 µm sized particles. The product ions for COC and its internal standard COC-d3 were m/z 182 and m/z 185, respectively. Ions m/z 210 and m/z 213 were monitored for BE and its d3 internal standard (IS); ions m/z 196 and m/z 199 for CE and its d3 IS; ions m/z 168 and m/z 171 for NOR and its d3 IS; and ions m/z 182 and m/z 185 for m-OH-C, p-OH-C, o-OH-C and its d3 IS. Method validation included optimization of linearity, precision, carryover, selectivity, sensitivity, precision, recovery, stability, ion suppression, and uncertainty measurement at the LLOQ.
Results: Yearly median results for COC in nearly 56,000 workplace samples from 2005 to 2010 were 27.1 (2005), 28.9, 27.5, 25.2, 24.3, 21.8 (2010). BE averaged 14% for the entire time period. Yearly median results for COC in a Criminal Justice population for the same period were 32.1 (2005), 33.7, 40.9, 29.6, 32.1, and 31.8 (2010), with BE averaging 17% overall. The LC/MS/MS assay, with results confirmed by a second laboratory (ElSohly), provides adequate sensitivity and reliability for the quantitative identification of cocaine and its metabolites at the levels necessary for identification.
Conclusions: The results support the use of this rigorous method as a very reliable method for the identification and quantitation of cocaine and multiple metabolites in hair samples. Keywords: Cocaine, LC-MS/MS, Hair
SOFT 2010 Annual Meeting Richmond, VA
S35 Measurement Uncertainty in Quantitative Segmental Analysis of Hair for Amphetamine and Methamphetamine
Madeline A. Montgomery*, Marc A. LeBeau, Cynthia Morris-Kukoski and Jason Schaff. Federal Bureau of Investigation, Laboratory Division, Quantico, VA There has been a significant increase in the number of published reports of quantitative segmental analysis of hair for drugs, metabolites, and poisons over the past two decades. More recently, there has been an increased demand to know the uncertainty of quantitative measurements so that there is a better understanding of the significance of these measurements. We demonstrate here the calculations for determining the uncertainty of performing quantitative segmental analysis of hair for methamphetamine (METH) and amphetamine (AMPH). This laboratory’s standard operating procedure for the segmental analysis of AMPH and METH in hair involves cutting hair into 1-cm (or more) segments and weighing 25 mg of each into sample vials. The hair segments are washed three times and then dried before pulverization. Isotopically-labeled internal standards are added to the pulverized hair before an overnight extraction with methanol. The methanol is removed, taken to dryness, reconstituted in deionized water, and extracted with a mixed organic solvent at an alkaline pH. The organic layer from this extract is taken to dryness and reconstituted. Quantitative analyses are conducted by LC/MS/MS with a multi-point calibration curve. Following a simplified GUM approach, a thorough evaluation of the sources of uncertainty for this method was undertaken. These sources include 1) weighing the hair samples; 2) purity of the stock solutions of AMPH and METH; 3) pipette delivery of stock standards to prepare intermediate standards; 4) volumetric flasks used for preparation of intermediate standards; 5) pipette delivery of intermediate standards to prepare working standards; 6) volumetric flasks used for preparation of working standards; 7) pipette delivery of working standards to prepare calibrators; 8) pipette delivery of internal standards; and 9) reproducibility of the method. The combined uncertainty of these components for AMPH and METH was determined to be 6.1% and 8.6%, respectively. Using a 99.8% confidence level, these values correspond to expanded uncertainties of 21% and 30%, respectively. These uncertainty values are reported with any quantitative findings generated using this analytical method. Keywords: Measurement Uncertainty, Hair, Segmental Analysis, Methamphetamine, Amphetamine

SOFT 2010 Annual Meeting Richmond, VA
S36 Ultrastructural Evaluation of Human Hair by Microscopy for the Determination of Morphological Differences
Jeri D. Ropero-Miller, Peter R. Stout*, Kelly Shipkowski, John M. Mitchell, Michael R. Baylor, Stacy S. Doorn, and Owen S. Crankshaw. RTI International, Research Triangle Park, NC
Introduction: Certified reference materials are used as a quality control measure, including controls involved in the drug testing of human hair. Efforts to produce reference materials for use in hair drug testing has proven to be complicated, time and cost prohibitive because of batch to batch variability. It has been postulated that the variability is the result of differences in structure between human hair from different sources. To better understand the relationship between hair structure and the extent of drug absorption, research which elucidates variances in the physical and chemical structure is needed.
Objective: The goal of this research is to examine hair samples from two ethnic groups representing three different hair colors and compare and contrast their structural characteristics. In future studies, these data will be correlated to drug absorption in an attempt to determine if drug uptake can be better predicted by observed morphological differences.
Methods: Hair samples were obtained from individuals with three different hair colors and two different ethinicities (Caucasian Blonde, Caucasian Brunette, and African American) and analyzed for pre-existing drugs.Those samples shown to be negative for drugs were collected and stored for further analysis. Twelve Caucasian Blonde samples, twelve Caucasian Brunette samples, and eleven African American samples were ultimately utilized. Hairs from each sample were examined employing a variety of microscopy techniques including scanning electron microscopy (SEM), freeze-fracturing combined with SEM, fluorescence microscopy, and brightfield microscopy. During fluorescence and brightfield microscopy, hairs were stained with methylene blue and rhodamine B and the extent of stain penetration examined.
Results: Multiple images of each sample were taken during each stage of microscopy and compiled into individual portfolios for visual examination and comparison. Rhodamine B and methylene blue produced similar staining patterns when observed with bright field microscopy, but due to variations in excitation wavelengths, rhodamine B fluoresced significantly better than methylene blue when examined with fluorescence microscopy. Significant differences were observed not only between hairs of different ethnicities, but between hairs within a single ethnicity as well. Deposition of dye was largely associated with the cuticular scale edges. In hair with damage or missing cuticle, the cortex was strongly stained. The thickness and number of cuticular scale layers was also examined between individuals and between ethnic groups. The SEM examination was instrumental in revealing the ultrastructural details of the relationship between the cuticle and cortex, and in demonstrating the wide variability in cuticle form and delamination from the main hair body.
Conclusion: This preliminary data suggests that the collection of structural data from visual examination of the hair may allow for the differences in hair morphology to be applied to data regarding differences in the permeability of hair to drugs. This information may also be useful to improve the reproducibility in the future production of hair reference materials. Keywords: Hair, Reference Materials, Methylene Blue, Rhodamine B, Microscopy, SEM

SOFT 2010 Annual Meeting Richmond, VA
S37 The Effect of Growth Rate Variation and Sample Collection on Segmental Analyses of Hair
Marc A. LeBeau*, Madeline A. Montgomery and Jason Brewer. Federal Bureau of Investigation, Laboratory Division, Quantico, VA There are two fundamental assumptions in interpreting results of segmental analysis of hair for drugs, metabolites, and poisons. The first assumption is that hair grows at an average rate of 1 cm/month. Second is that hair is collected by cutting it directly next to the scalp. The purpose of this study was to evaluate the variability associated with the growth rate of human head hair, as well as the ability to uniformly collect hair next to the scalp. The results were used to determine how these factors affect the interpretation of results generated in segmental analysis of hair. A thorough literature review was conducted to determine the range of linear growth of human head hair from the vertex posterior and occipital regions. The results were compiled to establish the average (1.06 cm/month); however, the range of growth rates is noteworthy and suggests that conclusions based on the 1-cm/month growth rate could be significantly skewed. Separately, a study was undertaken to evaluate collection of hair. Oral instructions and a written standard collection procedure for head hair were provided to fourteen volunteers. The experience levels among the collectors varied from novice to expert. Each volunteer collected hair from dolls with short- and long-hair. Following each collection, the hair remaining at the sampling area was measured to determine how close to the scalp the cuts were made. Further, the variability in the lengths of hair remaining at the sampled area was also documented. From this study, we determined that 0.8 ± 0.1 cm of hair was left on the scalp. When considering this amount of hair left on the scalp, the use of a growth rate of 1.06 cm/month, and the assumption that it takes two weeks for newly formed hair in the follicle to reach the scalp, we find that the first 1-cm of hair typically corresponds to hair formed 1.3 ± 0.2 to 2.2 ± 0.4 months (95% confidence) earlier. The impact of these findings as it relates to the corresponding time for each additional segment is demonstrated. As a result of these findings, we recommend that hair collection methods be modified to instruct the collectors to shave the sample from the head as opposed to cutting with scissors. Further, we recommend that collection be delayed 8 weeks after a suspected exposure to ensure that the sample fully represents the exposure period. The results of this study suggest that the variability in the growth rate of human head hair, as well as the inconsistent collection of hair, significantly affect the interpretation of results from segmental analysis of hair. Keywords: Hair, Collection, Growth Rate, Segmental Analysis
SOFT 2010 Annual Meeting Richmond, VA
S38 Development and Validation of a GC/MS/MS Method for the Detection of Sub-Picogram Levels of Carboxy-THC in Hair as an Indicator of Marijuana Use
Michael Schaffer*, Oscar Chao, Chen Chih Cheng, Virginia Hill, Thomas Cairns and Paul Matsui. Psychemedics Corporation, Culver City, CA
Background: The interpretation of marijuana use through the measurement of parent THC and THC metabolite (carboxy-THC) found in hair has always been an analytical challenge. Some laboratories wash the hair before analysis, some rely more on parent THC, and a few offer analysis of carboxy-THC at the levels required to designate a donor sample positive due to ingestion. Additional qualifiers of controls at or near 40% of the cutoff make this measurement analytically challenging, requiring the most state-of-the-art MS technology.
Objective: This laboratory investigated the possibility of determining carboxy-THC in the hair of marijuana users, using a modified GC/MS/MS method which utilized two distinct derivatives of carboxy-THC as the endpoints in the analysis. The method was used with hair samples collected as part of a clinical study for an FDA 510K submission, with a population of criminal justice samples, and with a population of workplace samples. The lowest levels of detection possible were sought in order to measure decreasing levels of drug in a hair sample as its donor ceases to use the drug either during rehabilitation, or in a back-to-work scenario.
Methods: A GC/MS/MS method was developed to measure the presence of Carboxy-THC in hair. Analysis was performed on a triple quadrupole Thermo TSQ 7000 GC/MS/MS system, operating in Negative Chemical Ionization Mode. Quantitation determinations were performed in the multiple reaction mode (MRM). Sample preparation consisted of washing, liquification of the hair sample, and utilization of solid phase extraction, with a dual derivatization which produced two separate quantitative results with two separate retention times for comparison purposes, using high molecular weight fragments. The product ions monitored were m/z 524 and m/z 474 for Carboxy THC and m/z 533, and m/z 483 for Carboxy THC-d9. Method validation included selectivity, linearity, bias, sensitivity limits, stability, recovery, carryover, quality control and some uncertainty measurements at the LLOQ.
Results: Using a cutoff of 1 pg carboxy-THC/10 mg hair, the laboratory identified 62,518 positive workplace samples in the years 2005 – 2010. These had a median concentration of 9.3 pg carboxy-THC/10 mg hair. In a criminal justice population where a cutoff of 0.5 pg/10 mg hair was applied, the median concentration of 6783 samples over the same time period was 6.7 pg carboxy-THC/10 mg hair. A rehabilitation population of 63 patients had a median of 7.7 pg carboxy-THC/10 mg hair. A change in the median hair values over the time period was not observed. The GC/MS/MS assay provides adequate sensitivity and reliability for the quantitative identification of the presence of carboxy-THC in hair samples.
Conclusions: We conclude that the use of the dual derivative approach for the measurement of carboxy-THC in hair at either the proposed cutoff of 0.5 or 1.0 pg/10 mg hair can be used for the most accurate use of hair analysis to indicate marijuana use—i.e., the detection and quantitation of the marijuana metabolite. We also recommend that this metabolite be used with aggressively washed hair to unequivocally identify users from nonusers at the lower levels of detection. Keywords: Marijuana (Carboxy-THC), GC-MS/MS, Hair
SOFT 2010 Annual Meeting Richmond, VA
S39 Detection of a Unique Cocaine Metabolite in Hair: Cocaine-N-oxide Roman Aranda IV*, Mark L Miller, Sarah Himes, Madeline A Montgomery, and Marc A LeBeau. U.S. Federal Bureau of Investigation, Laboratory Division, Quantico, VA The prevalence of cocaine in some environments has been proposed to result in the positive detection of cocaine via hair analyses, which could be confused with indicating cocaine ingestion. In order to differentiate between cocaine found exogenously in hair due to environmental exposure and cocaine that has been ingested, we analyzed for a unique potential metabolite of cocaine in hair, cocaine-n-oxide (CNO), to help distinguish between in vivo and in vitro cocaine positives. CNO is an identified cocaine metabolite, present in plasma after cocaine ingestion, and is potentially deposited in human hair. As a test for cocaine ingestion, using a unique metabolite of cocaine, CNO analysis does not require washing of the hair to give a more definitive result. Experimental variables were examined to increase the yield of CNO in the extracts such as time, temperature, solvent, acid percentage, and the extent of hair grinding. An HPLC/MS/MS method was developed using the Symbiosis HPLC system with an Xterra C18 column utilizing an acetonitrile gradient that reaches 100% acetonitrile with 0.1% formic acid. The samples were analyzed with an ABI QTRAP 5500 mass spectrometer using 3 MRMs per compound to monitor the presence of CNO and other COC products in a variety of human hair samples. Samples of human hair of negative and positive cocaine controls and a collected mix of unknown hair were ground using 2.4 mm glass beads in a FastPrep FP120 bead grinding machine. The compounds of interest were extracted from ~10g of hair using a 2:1 Water:Methanol in 0.1% Formic Acid mixture overnight at room temperature. MS/MS transitions were monitored for ten compounds, for which standards were available or were custom synthesized: cocaine, CNO, norcocaine, benzoylecgonine, cocaethylene, ecgonine methyl ester, ecgonine and m-, o-, p-hydroxycocaines. Results indicate a wide range of CNO concentrations existing in hair. The mass of CNO detected in samples is estimated at picogram (pg) levels on-column. CNO was not detected in the negative control hair samples. The detection of CNO suggests that the metabolite can be used to discriminate between environmental exposure and in vivo cocaine via HPLC/MS/MS analyses of hair. Keywords: Cocaine, Cocaine-N-oxide, Hair, LC/MS

SOFT 2010 Annual Meeting Richmond, VA
S40 Rapid Antidepressant Screening in Urine Using UPLC Coupled with Accurate-Mass TOF-MS
Bridgit Crews*1, John Hughes2, Charles Mikel1, Sergey Latyshev1, Robert West1 and Amadeo Pesce1. 1Millennium Research Institute, San Diego, CA; 2Agilent Technologies, Pleasanton, CA Low doses of antidepressants, including tricyclic antidepressants, are prescribed for the treatment of pain management patients. Therefore there is a need to monitor patient compliance for these medications. Typical immunoassay methods of detecting antidepressants are semi- or non- specific and for many cases only detect high or toxic levels of the medications and/or their metabolites. We developed a high-speed method using both accurate mass and UPLC retention time using time-of-flight mass spectrometry (TOF-MS) with an enhanced-sensitivity ESI interface to detect and confirm antidepressants and metabolites in urine. Limits of detection for most of the target compounds are low picogram on-column (~10 ng/mL). The target compounds for the method include both traditional tricyclics (TCAs) and newer (SSRI, SNRI) antidepressants. The method combines the use of accurate-mass data (sub 2-ppm mass accuracy) with ultrafast HPLC or UPLC. Retention times with UPLC separation are reproducible to 0.05 minutes or better. Sample preparation consists of 5-fold dilution and filtration of urine, or liquid-liquid extraction followed by reconstitution. The data analysis approach utilizes Agilent Technologies MassHunter and Personal Compound Database and Library software and a database derived from an Agilent 1700-compound accurate-mass database. The data analysis routine first generates extremely narrow-mass-window extracted ion chromatograms for expected m/z species for each target compound (automatically calculated from formulae in the database). A background-subtracted spectrum is then obtained from each peak, and the target compound is identified by: retention time match (calibrated with standards), combined mass error for the primary adduct and isotopes, and Score (a weighted average of scores for adduct mass error, correct isotope spacing, correct isotope ratios and retention time match for the target molecule). The data analysis is automated, and both retention time and mass error criteria have been developed to identify a reliable presumptive positive. A concise report is generated which includes figures of merit for the identification, extracted ion chromatograms and mass spectra. The TOF approach makes it possible to add analytes to the screen simply by adding the formula and retention time of a new analyte to the database and also allows for retrospective searching for target compounds not originally sought. The combination of UPLC with accurate-mass TOF-MS provides a fast, sensitive and specific method for screening urine samples for 26 commonly encountered antidepressants with an automated analysis under six minutes. Keywords: Antidepressants, LC/TOF, Urine

SOFT 2010 Annual Meeting Richmond, VA
S41 Dilute and Shoot: Comparison of Selected Reaction Monitoring with Full Scan MS/MS for Amphetamines, Opiates and Cocaine Metabolite
Robert Fitzgerald*1,2, Terrance Griffin1, Robert West3, Amadeo Pesce3 and David Herold1,2. 1VA Medical Center, San Diego, CA; 2University of California-San Diego, San Diego, CA; 3Millenium Laboratories, San Diego, CA Objective: Our objective was to develop a simplified LC/MS/MS procedure for quantifying and confirming drugs of abuse directly from urine specimens using selected reaction monitoring (SRM) and full scan product ion spectra, respectively. We compared identification based on full scan product ion obtained in an ion trapping mode with ion ratios obtained using a triple quadrupole mass spectrometer operated in the SRM mode. Methods: Deuterium labeled internal standards are added to 200 μL of urine which is then diluted 1:10 with water for analysis for amphetamines, methamphetamine and benzoylecgonine. For opiates, internal standards are added to 1 mL of urine, samples are diluted with 400 μL of glucuronidase solution (5000 U/mL in 1.0 M acetate buffer), and hydrolyzed at 50oC for 2 hours. Samples are centrifuged and one to three uL is injected into the ABI 4000 linear ion trap MS/MS. We compared the signal to noise of full scan product ion spectra obtained in the triple quadrupole mode with the ion trap mode. Full scan product ion spectra were obtained in the data dependent mode and identification was based on a purity fit of greater than 70. Full scan identifications were compared with SRM identifications that were based on a +/- 30% ion ratio of the calibrator qualifier ion. Results: The ion trap provided about 100 fold increase in signal to noise as compared with the triple quadrupole for full scan product ion spectra while scanning at a faster rate, thus the trap mode was used in subsequent full scan product ion experiments. Selecting appropriate triggers for obtaining full scan product ion spectra minimized space charging for specimens that contained high concentrations of drugs. One hundred urine specimens were analyzed by both methods for amphetamines and cocaine metabolite with 100% concordance between full scan and SRM identification. Initial comparison of 100 opiates demonstrated one false negative hydrocodone using the full scan procedure that was caused by an interferent in the internal standard ion channel. This false negative was resolved by changing the chromatographic conditions. Subsequent analysis of 63 opiate positive specimens also demonstrated 100 % concordance between full scan and SRM. Conclusion: This is one of the first demonstrations that uses selected reaction monitoring and full scan product ion spectra for confirmation of presumptive positive urine drug screens directly from urine specimens. There was 100% concordance between the full scan identification and the SRM results for identification of amphetamine, methamphetamine, benzoylecgonine, morphine, codeine, hydrocodone, hydromorphone, oxycodone and oxymorphone. The ability to “dilute and shoot” reduces the turnaround time for results while still providing a high degree of specificity. Keywords: LC-MS/MS, Drugs of Abuse, Ion Trap, Urine Drug Confirmations

SOFT 2010 Annual Meeting Richmond, VA
S42 Enhanced Detection and Separation For Anti-doping Control Screening Using Two Dimensional Gas Chromatography Time-of-Flight Mass Spectrometry (GCxGC-TOFMS)
John Heim*, Joe Binkley and Doug Staples. Life Science and Chemical Analysis Centre - LECO Corporation, St. Joseph, MI This research demonstrates the advantage of comprehensive two dimensional gas chromatography coupled with time-of-flight mass spectrometry (GCxGC-TOFMS) to increase detectability and separate anabolic steroids from the complex urine sample matrix. Anti-doping control screening in urine is a complicated and labor intensive analysis requiring sensitive instrumentation and optimized chromatographic separations. This proof of concept investigation presents a practical method utilizing GCxGC-TOFMS for the identification and quantification of six androgenic anabolic steroids in urine. Established methods for steroid analysis in urine depend heavily on one dimensional gas chromatographic separations and selected ion monitoring (SIM) mass spectrometry techniques. This experimentation employs GCxGC to increase peak capacity and resolution in combination with TOFMS detection followed by data processing with deconvolution software algorithms for positive confirmation and quantitation of anabolic steroids in urine.
A steroid mixture containing stanozolol, 4-hydroxystanozolol, boldenone, norandrosterone, 3-hydroxystanozolol, and 17α-methylandrostan-3α-17β-diol was prepared from standards obtained commercially. Stanozolol and its metabolites are known to be particularly difficult to detect and separate chromatographically. Results for the identification of 3-hydroxystanozolol at the 2ppb level are presented. Methyltestosterone was used as an internal standard (ISTD). Initial sample preparation method development focused on the acid hydrolysis of conjugated steroids, extraction, and established trimethylsilyl derivatization procedures used for steroid profiling in doping control. Urine aliquots of 2mL were spiked with the steroid standard mixture for analysis. Samples were hydrolysed for 1 hour at 50°C after addition of 0.8M sodium phosphate buffer to pH 6.0, ß-glucuronidase, and methyltestosterone (ISTD). The solution was then alkalinized with potassium carbonate solution to pH 9.0 prior to liquid-liquid extraction with tert-butylmethylether (MTBE). The extractions were dried under nitrogen and then the residues were derivatized with 100 µL of MSTFA-NH4I-ethanethiol (1000:2:6, v/m/v) for 30 minutes at 60°C. The derivatized samples were subsequently analyzed by GCxGC-TOFMS. GCxGC analysis was conducted using a dual column set of differing column stationary phases and dimensions. Separated components were detected by TOFMS which provides continuous full range non-skewed mass spectral information along with the fast acquisition rates required for optimal detection of the peak data density generated by comprehensive GCxGC analysis.
Results from this study show significant improvements in chromatographic resolution and peak capacity, as well as the enhanced analyte detectability that GCxGC-TOFMS provides. Successful trace level identifications and limits of detection of the six steroid standard mixture will be shown at or below the 2ng/mL (2ppb) level. Additional results for the steroids used in this study show a five point quantitative calibration linearity of greater than 99.9% from 2 to 100ng/mL. The data will illustrate the increased resolving power and peak capacity of GCxGC as well as the advantage of simultaneous full mass range data acquisition which TOFMS provides for optimal peak identification and mass spectral deconvolution. This exploratory research investigation demonstrates favorable and practical applicability of GCxGC-TOFMS for the positive identification of anabolic steroids at the lowest allowable concentration limits meeting the strict guidelines set by the World Anti-doping Agency (WADA). Keywords: GCxGC-TOFMS, Deconvolution, Anabolic Steroids
SOFT 2010 Annual Meeting Richmond, VA
S43 Simultaneous Multi-Targeted and Unknown Screening of Forensic Urine Samples by LC/MS/MS with Automated Library Searching for Compound Identification
Michael Jarvis*1, Nadia Pace1, Andre Schreiber1 and Lisa Sapp2. 1AB SCIEX, Concord, Ontario, Canada; 2AB SCIEX, Framingham, MA Rapid and reliable screening methods for drugs and pharmaceuticals are required for the detection of xenobiotics in forensic intoxication cases. While a variety of analytical techniques are in use, LC/MS/MS analysis has become increasingly popular for forensic toxicology screening due to the advantages it offers in terms of selectivity, sensitivity, and speed of analysis. Conventional multi-targeted screening by LC/MS/MS using Multiple Reaction Monitoring (MRM) is highly selective, and yields significantly improved sensitivity over ‘full-scan’ experiments, however this mode of operation does not provide information about any unanticipated analytes present in a sample. Conversely, true General Unknown Screening (GUS) using ‘full-scan’ MS monitoring offers the advantage of providing information about all analytes present in a sample, but this mode of operation diminishes the ability to observe low-abundance analytes in complex biological matrices. A complete solution for forensic toxicology screening should provide both highly sensitive, highly selective detection of expected analytes, and the detection of true unknowns, all in a single, rapid sample analysis. Furthermore, the identification and confirmation of any unknowns should be fully automated. The objective of this work is to investigate whether the available software and hardware tools are sufficient for successfully detecting known and unknown analytes in forensic samples, in a single analysis, on a standard QTRAP® mass spectrometer. Data was obtained using an AB SCIEX 4000 QTRAP® LC/MS/MS system coupled with a Shimadzu Prominence LC system. The mass spectrometer analysis consisted of three looped experiments: (1) MRM detection of 40 target analytes, using the Scheduled MRM™ algorithm, (2) Enhanced Mass Spectrum (EMS) monitoring using the linear ion trap, for simultaneous detection of unknowns, and (3) Enhanced Product Ion (EPI) dependent scans using the linear ion trap, automatically triggered to collect full-scan MS/MS fragmentation spectra for any unknowns detected in experiment (2). The EPI data were collected using the Collision Energy Spread (CES) feature to ensure that the resulting spectra were rich in fragmentation information, and contained low-, medium-, and high-energy fragment ions. These spectra were automatically searched against a spectral library containing more than 1250 compounds, to confirm the identity of the unknowns. Forensic urine samples of drug abusers were analyzed using simple, generic sample preparation protocols and the targeted/unknown screening method described above. The results were compared to those obtained when the identical samples were analyzed using (i) an MRM-only method for detection of target analytes, and (ii) a separate GUS-only method. The comparison indicates that for simultaneous targeted/unknown screening, the limits of detection are comparable to those obtained by MRM screening alone. In addition, the targeted/unknown screening method identified all of the unknowns found by the GUS-only method. The combined targeted/unknown screening method did suffer from longer cycle times, leading to fewer data points across a chromatographic peak, however this method proved to be more than adequate for toxicology screening purposes. In conclusion, the flexibility of the QTRAP® platform allows forensic toxicology laboratories to reap the benefits of both multi-targeted and unknown screening on a single instrument, in a single analysis. Keywords: LC-MS/MS, General Unknown Screening, Multi-Targeted Screening

SOFT 2010 Annual Meeting Richmond, VA
S44 The Detection of Various Performance-Enhancing Drugs in Race Horse Urine Using High Flow Strong Cation Exchange Solid Phase Extraction and Liquid Chromatography-Electrospray-Tandem Mass Spectrometry
Andre Sukta, Lisa Taddei, Marc Benoit and Adam Negrusz*. Animal Forensic Toxicology Laboratory, University of Illinois at Chicago, Chicago, IL A typical testing protocol for urine samples collected post-race from winning horses includes preliminary screening, usually by some kind of EIA, and subsequent confirmation by GC-MS or LC-MS. In our laboratory every urine specimen is initially screened on 66 different ELISA plates. In 2010 a new testing protocol was established by the Thoroughbred Owners and Breeders Association (TOBA). The 2010 protocol added several new compounds to the mandatory drug testing list. In addition, the existing urine screening thresholds for many other substances were significantly lowered in all graded stakes races. As a result, much of the screening that previously had been performed by ELISA had to be abandoned due to the insufficient sensitivity. For other substances recently introduced to the mandatory testing protocol, the ELISA kits are not available. In this context the aim of this work was to develop a simple and quick screening procedure for a large number of urine specimens using SPE followed by the ESI-LC-MS-MS for the following compounds (ng/mL): formoterol (10), gabapentin (50), levorphanol (2), modafinil (20), ractopamine (5), xylazine (20), clenbuterol (1), nalorphine (20), and butorphanol (10). Two sets of controls were prepared by spiking 5 mL aliquots of negative control horse urine with: 1) all drugs at the threshold levels, and 2) 5 times the threshold levels. In addition, the mixture of drugs was prepared at the threshold levels and analyzed without the extraction. All urine samples were hydrolyzed overnight with beta-glucuronidase / aryl sulphatase (370C, pH 5) and extracted on high flow SCX XTRACKT® SPE columns (10 mL, 500 mg). After final elution from the column with DCM:methanol:ammonium hydroxide; 78:20:2, the solvents were evaporated to dryness (400C) with nitrogen and reconstituted in 100 mcL of methanol and water mixture (90:10). The 30 mcL volume was injected on analytical column (Agilent Eclipse XDB C18, 100 mm x 3 mm, 3.5 mcm). The separation of all compounds was achieved using mobile phase (methanol and water, both with 2% of formic acid) delivered in gradient by Agilent 1200 LC system coupled to an Agilent 6410 triple quad mass spectrometer. The instrument was working in the MRM mode and positive ions were acquired using electrospray ionization. The results show a good recovery for all analytes (formoterol, gabapentin, levorphanol, modafinil, ractopamine, xylazine, clenbuterol, nalorphine, butorphanol) from equine urine using high flow SCX SPE allowing for screening at low threshold levels. The ion suppression / enhancement were determined for all compounds tested. The method is suitable and sensitive for screening the large number of specimens for several performance-enhancing substances. Keywords: SPE, LC-MS/MS, Doping, Equine Urine

SOFT 2010 Annual Meeting Richmond, VA
S45 A Screening Method for Major Metabolites of JWH-018 and JWH-073 in Human Urine Using a Hybrid Triple Quadrupole Linear Ion Trap System
Hua-fen Liu*1, Sumandeep Rana2, Jeremiah Morris3, Jenny Moshin1, Matthew Clabaugh1 and Alexandre Wang1. 1AB SCIEX, Foster City, CA; 2Redwood Toxicology Laboratory, Santa Rosa, CA; 3Johnson County Crime Lab, Mission, KS Introduction: JWH-018 and JWH-073 are two main active ingredients of K2. They act as cannabinoid agonist at both CB1 and CB2 receptors. JWH-018 is more selective to subtype CB2 and JWH-073 is more selective to subtype CB1. When smoked or orally ingested, K2 produces some effects that are similar to those of cannabis. Several countries and few states in the US have placed legal restrictions on these compounds. To establish a screening method for K2 is relatively challenging because of the multiple active ingredients present in K2 along with the relatively short half-life for the parent compounds. In addition, there is no control sample available for the urine specimens obtained from the street. The most effective screening method should include detection of the metabolites of these active ingredients and their corresponding parents. To resolve these challenges, JWH-018 and JWH-073 were incubated in human liver microsomes individually and in vitro phase I metabolite pathways were identified for each compound. Based on these in vitro studies, the metabolites of each active ingredient in both phase I and corresponding phase II conjugates were identified in the human urine specimens from the street. A screening method was developed on the hybrid triple quadrupole linear ion trap system to utilize MS2 spectrum library generated from both in vitro human liver microsomes and positive human urine samples. Methods: JWH-018 and JWH-073 reference material were obtained from Cayman Chemical Company. JWH-018 and JWH-073 were incubated in human liver microsomes individually. The in vitro samples were used to generate phase I metabolite MS2 library for the two active ingredients on a QTRAP® LC-MS/MS system. Two positive urine specimens were collected from different individuals claiming to have smoked K2 to generate the corresponding phase II metabolite conjugates MS2 library. Results: A MS2 library of major phase I and II metabolites and respective parent drugs (JWH-018 and JWH-073) was established. Both K2 active ingredients were extensively metabolized in human urine by mono-, di-hydroxylation, or hydroxylated N-dealkyl, carboxy, reduced di- hydoxy and corresponding glucuronide conjugation. A fast workflow for K2 routine screening of urine samples using MRM triggered enhanced product ion scan with library confirmation was developed. Keywords: JWH-018, JWH-073, LC-MS/MS

SOFT 2010 Annual Meeting Richmond, VA
S46 Determination of Conjugated and Unconjugated Tapentadol (Nucynta®) and N-Desmethyltapentadol in Authentic Urine Specimens by UPLC/MS/MS.
James A. Bourland*, Ayodele A. Collins, Scot A. Chester, and Ronald C. Backer. Ameritox, Midland, TX A total of 51 urine specimens from pain management patients dosed with Nucynta® (Tapentadol) that previously tested positive for total tapentadol and N-desmethyltapentadol were reconfirmed for the presence of tapentadol, tapentadol glucuronide, N-desmethyltapentadol and N-desmethyltapentadol glucuronide using Ultra Performance Liquid Chromatography Tandem Mass Spectrometry (UPLC/MS/MS) in multiple reaction monitoring (MRM) mode. Urine samples (25�L) were diluted 400X, centrifuged and analyzed using a BEH Shield RP 18 (2.1 X 50 mm X 1.7�m) UPLC column. The mobile phase was a gradient from 90% A (0.1% formic acid) and 10% B (acetonitrile) to 10% A/ 90% B in 1.5 minutes using a 0.4 mL/min flow rate. An initial investigation into the characterization of metabolites was performed using a hybrid quadrupole-time of flight (QTOF) mass spectrometer. Data using accurate mass determination and structural elucidation confirmed the presence of predicted metabolites and aided the MRM method development for the two glucuronide metabolites, in lieu of suitable analytical reference standards. The linearity of the method for both tapentadol and N-desmethyltapentadol demonstrated correlation coefficients (R2) above 0.99 and linear ranges from 50-500,000 ng/mL for tapentadol and 100-500,000 ng/mL for N-desmethyltapentadol. The intraday precision of the assay for both analytes ranged from 2.2 to 6.9 % over three concentrations; the interday precision for both analytes ranged from 1.2 to 8.4%. The re-analysis was performed without hydrolysis and the intact glucuronides were characterized in a semi-quantitative fashion while unconjugated results were expressed quantitatively. The mean relative percentages of tapentadol, tapentadol-glucuronide, N-desmethyltapentadol and N-desmethyltapentadol glucuronide were 6%, 89%, 1% and 4%, respectively. Although, most of the drug was present as conjugated tapentadol, all previously confirmed positives utilizing a hydrolysis procedure confirmed positive for unconjugated tapentadol above the 100 ng/mL cut-off without the aid of hydrolysis. Keywords: Tapentadol, Conjugation, LC-MS/MS

SOFT 2010 Annual Meeting Richmond, VA
S47 Umbilical Cord Monitoring of In Utero Drug Exposure to Buprenorphine, and Correlation with Maternal Dose and Neonatal Outcomes
Marta Concheiro*1,2, Hendreé E. Jones3, Rolley E. Johnson3,4, Robin Choo5, Diaa M. Shakleya1 and Marilyn A. Huestis1. 1Chemistry and Drug Metabolism, Intramural Research Program, National Institute on Drug Abuse, National Institutes of Health, Baltimore, MD; 2Dpto. Anatomía Patológica y Ciencias Forenses, Facultad de Medicina, Universidad de Santiago de Compostela, Spain; 3Department of Psychiatry and Behavioral Sciences, Johns Hopkins School of Medicine, Baltimore, MD; 4Reckitt Benckiser Pharmaceuticals, Inc., Richmond, VA; 5Department of Natural Sciences, University of Pittsburgh, Titusville, PA Introduction: Buprenorphine-assisted therapy is approved for the treatment of opioid-dependent non-pregnant women in multiple countries, and currently under investigation in the U.S.A. in pregnant women. Meconium and umbilical cord tissue and plasma specimens were collected from infants born to mothers who were receiving buprenorphine treatment for opioid dependence. These specimens provided a controlled drug administration model for evaluating drug disposition in the maternal-fetal dyad. Methods: Buprenorphine, opiates, cocaine, and their metabolites were quantified in 5 umbilical cord specimens from buprenorphine-maintained pregnant women by 2 fully validated LCMS methods. Correlations between buprenorphine umbilical cord concentrations and maternal dose and neonatal outcomes (1 and 5 min Apgar score, estimated gestational age, birth weight, head circumference, length, hospital stay duration form birth until discharge to the research unit, and neonatal abstinence syndrome) were investigated, and umbilical cord concentrations were compared to matched umbilical cord plasma and meconium. Statistical analyses were performed with SPSS version 13.0. P<0.05 was considered statistically significant. Umbilical cord also was investigated for the presence of heroin and cocaine and their metabolites to document relapse to illicit drugs. The study was approved by the National Institute on Drug Abuse and Johns Hopkins Bayview Medical Center’s Institutional Review Boards and participants provided written informed consent. Results: Buprenorphine metabolites were detected in all umbilical cord specimens, but buprenorphine itself was absent. Metabolites were uniformly distributed across the tissue (CV<23.1%), and median (range) concentrations were norbuprenorphine 2.5ng/g (1.2 to 5.1ng/g), buprenorphine-glucuronide 3.0ng/g (1.7 to 4.2ng/g), and norbuprenorphine-glucuronide 18.0ng/g (8.3 to 23ng/g). Umbilical cord concentrations were similar to those in umbilical cord plasma, and lower (16 to 210 fold) than meconium concentrations. Norbuprenorphine-glucuronide concentrations in meconium were significantly positively correlated with norbuprenorphine in umbilical cord (P=0.033, r=0.908, n=5), and norbuprenorphine concentrations in meconium were significantly negatively correlated with norbuprenorphine-glucuronide in umbilical cord (P=0.014, r=-0.949, n=5). Buprenorphine-glucuronide concentrations in umbilical cord were significantly correlated with mean maternal daily buprenorphine dose from enrollment to delivery (P=0.050, r=0.879, n=5), and with mean daily dose during the 3rd trimester (P=0.031, r=0.912, n=5). No correlations were found between buprenorphine umbilical cord marker concentrations and neonatal outcomes. Opiate concentrations were lower (200 fold) in umbilical cord than in matched meconium specimens, and cocaine was not detected in any umbilical cord specimen, despite positive meconium results. Discussion: In this preliminary study, correlations were found between umbilical cord BUP-Gluc concentrations and maternal BUP daily dose throughout pregnancy and in the 3rd trimester, but not between umbilical cord BUP biomarkers' concentrations and neonatal clinical outcomes. NBUP-Gluc was the main metabolite detected in umbilical cord, albeit in low concentrations. Umbilical cord and umbilical cord plasma BUP metabolite concentrations were similar, but of much lower magnitude than those found in meconium. Umbilical cord tissue could be useful for the identification of recent drug consumption in cases where umbilical cord plasma is not available, as analysis of plasma is simpler than tissue. Conclusion: Although umbilical cord tissue is an interesting matrix available in adequate amounts immediately at delivery, these preliminary data suggest that its usefulness to detect in utero illicit drug exposure and to predict neonatal outcomes appears to be limited as compared to other available matrices. Supported by the Intramural Research Program, National Institute on Drug Abuse, NIH. Keywords: Buprenorphine, Umbilical Cord, In Utero Drug Exposure
SOFT 2010 Annual Meeting Richmond, VA
S48 Development of a Web-Accessible Cheminformatic Mass Spectral Database for Shared Utilization by Forensic Laboratories
Jeri D. Ropero-Miller1, Peter R. Stout1, Katherine Moore*2, Robert Steiner3, John M. Mitchell1 and Michael R. Baylor1. 1RTI International, Research Triangle Park, NC; 2Virginia Commonwealth University, Richmond, VA; 3Virginia Department of Forensic Sciences (VDFS), Richmond, VA Introduction: Cheminformatic databases are used for searching unknown spectra against reference spectra and for retrieval of chemical data such as structural information. In addition to traditional mass spectra, NMR and FTIR are also included to improve compound identification. The forensic utility of these data bases varied due to the existence of relevant compounds and spectral methods, data quality, accessibility, and ability to search against reference spectra. Forensic applications of these databases routinely contain spectra from traditional instrumentation, such as electron ionization mass spectrometers (MS) and do not allow for cross-searching of other spectral methods. Direct Analysis in Real Time (DART) is a novel ion source coupled to an accurate mass time-of-flight (AccuTOFTM) mass analyzer DART has been primarily employed for controlled substances identification by forensic laboratories. Currently, there are no public databases that incorporate DART spectra, requiring laboratories to create in-house discipline specific library resulting in unnecessary duplicity. These in-house libraries are not readily accessible to the public. Objective: The goal of this project is to create a free Web-accessible library with multiple spectral methodologies that allows electronic searching and comparison of unknown spectra against verified reference spectra. Specifically, the intention is to include nominal mass, accurate mass, NMR, and FTIR spectra. Methods: Users upload spectra through a Web portal to an editorial review board where selected, external ‘collaborator reviewers’ evaluate the spectra based on established criteria. RTI staff, as the ‘database curator’, also review the data and the reviewers’ recommendations on whether the spectra should be accepted, rejected, or accepted with revisions. If all criteria are met the spectra is approved and moved into the cheminformatic database for public accessibility. Otherwise, the spectra are either rejected or the contributing user may be contacted to determine if better spectra can be submitted. Duplicity of a compound within the cheminformatic databases can be limited or eliminated as appropriate. Inclusion of DART spectra into the database required spectral evaluation and comparison by RTI and VDFS laboratories. Several commonly altered DART parameters were investigated to determine whether enough spectral dissimilarity existed to cause a false identification in the developed database. Collection of reference drug standards at RTI using the same instrumental parameters as VDFS evaluated the inter-laboratory reproducibility. A form has been developed to systematically document and evaluate spectra under varying DART conditions and instrument parameters thus allowing the assessment of their affects on DART spectra and the matching quality within the database. Results: The current public database consists of 2,400 EI mass spectra previously housed in the American Academy of Forensic Sciences MS database and 224 compound records each with one to four DART spectra at different CID voltages collected simultaneously using function switching at VDFS. It appears that function switching sacrifices sensitivity for more spectral detail. All compounds have been analyzed and parameters documented for optimization and acceptable ranges by VDFS. Currently, the same procedures are being finalized for DART analysis at RTI. Conclusion: The results will provide a standardized collection range of parameters that will not affect matching efficiency of the developed database. Development of a unified database of DART spectra will help expand DART-AccuTOFTM into routine forensic analysis. Inclusion of other spectral data will enable a more definitive compound identification. Keywords: Cheminformatics, DART-AccuTOFTM, Database, Collection Standardization

SOFT 2010 Annual Meeting Richmond, VA
S49 Detection of Anabolic Steroid Boldenone in Equine Urine after Controlled Administration to Horses
Brendan Heffron1, Marc Benoit1, Lisa Taddei1, Laura Hurt1, Courtney Sinculer1, Dawn Folker-Calderon2 and Adam Negrusz*1. 1Animal Forensic Toxicology Laboratory, University of Illinois at Chicago, Chicago, IL; 2Illinois Racing Board, Chicago, IL Boldenone (BOL) (1,4-androstadiene-3-one-17β-ol) is an anabolic steroid designed primarily for veterinary use and it is sold as BOL undecylenate (Equipose®). BOL is structurally similar to testosterone with the exception being dehydrogenation at the C-1,2 positions. The quantitation of BOL in urine is challenging because BOL is excreted as either sulphate or glucoronide bound conjugates (nearly 90%) arising from Phase II metabolism. Just a few years ago BOL was identified in extracts from intact male horse urine. The benefits of therapeutic BOL administration include protein synthesis, muscle growth and erythropoiesis. However, the potential of BOL abuse has led to its regulation by equine racing authorities. In this study, the concentration of BOL in equine urine after IM administration of 500 mg of Equipose® to 3 horses was investigated. Urine was collected by the Foley catheter introduced into the horse’s urinary bladder and the sterile urine collection bag attached to the end of the catheter. Urine samples were collected from 0 to 840 hours post-administration and kept frozen until analyzed. Six-point calibration curves for both free and conjugated BOL in equine urine were prepared (10-320 ng/mL) with testosterone-d3 as an internal standard. The accuracy and precision was determined using control urine preparations (15 and 300 ng/mL). Five mL urine aliquots were hydrolyzed overnight using beta-glucuronidase (370C, pH 5), followed by SPE (C18, 500 mg, 10 mL cartridges, United Chemical Technologies). After column conditioning, boldenone from the glucuronide fraction was eluted using ethyl ether. The second elution from the column (sulphate fraction) was achieved using “solvolysis” solution (50 mL ethyl ether, 10 mL methanol, 3 drops sulfuric acid). The collected eluent was then incubated overnight at 370C to completely free boldenone from its sulphate conjugate. Both eluted fractions (ethyl ether and “solvolysis” solutions) were subsequently cleaned using liquid-liquid extraction. After solvent evaporation and derivatization (methoxylamine and MSTFA), all samples were analyzed using GC-MS. Standard curves for free and conjugated BOL were linear over the concentration range (correlation coefficient 0.991 or higher). The LOD and LOQ were 3 and 8 ng/mL, respectively. The relative accuracy values for control urine preparations for BOL and BOL conjugates were never greater than 13.6%. For all three horses, quantifiable amounts of BOL were detected by 4 hours post-administration. Peak concentrations were found between days 3 and 9. BOL concentration in urine fell below 15 ng/mL (legislative threshold) by day 30 in all horses. No BOL was detected by day 35 post-administration. Keywords: Anabolic Steroids, Boldenone, SPE, GCMS, Urine
SOFT 2010 Annual Meeting Richmond, VA
S50 Methadone and EDDP Disposition in Umbilical Cord and Correlations with Maternal Dose and Neonatal Outcomes
Ana de Castro*1,2, Hendreé E. Jones3, Rolley E. Johnson3,4, Teresa R. Gray1, Diaa M. Shakleya1 and Marilyn A. Huestis1. 1Chemistry and Drug Metabolism, National Institute on Drug Abuse, NIH, Baltimore, MD; 2University Institute of Legal Medicine, University of Santiago de Compostela, Santiago de Compostela, Spain; 3Department of Psychiatry and Behavioral Sciences, Johns Hopkins University School of Medicine, Baltimore, MD; 4Reckitt Benckiser Pharmaceuticals Inc., Richmond, VA
Objective: To assess methadone and EDDP (2-ethylidene-1,5-dimethyl-3,3-diphenylpyrrolidine) disposition in umbilical cord, and possible correlations with maternal methadone dose and neonatal outcomes, and the usefulness of this alternative matrix to detect in utero exposure to other common drugs of abuse. Methods: Pregnant opioid-dependent women receiving methadone-assisted pharmacotherapy provided written informed consent to participate in this National Institute on Drug Abuse Institutional Review Board approved study. At birth, umbilical cords were collected and analyzed for methadone, EDDP, cocaine, benzoylecgonine, morphine, codeine and 6-acetylmorphine by a validated LCMS method. Results were compared to matched meconium and placenta specimens. Correlations between methadone and EDDP concentrations in umbilical cord and maternal methadone dose, neonatal birth parameters, neonatal abstinence syndrome (NAS), and placental and meconium methadone and EDDP concentrations were evaluated using SPSS version 18.0 software. The window of drug detection in umbilical cord was determined by comparing cocaine and opiate results in umbilical cord with thrice-weekly matched urine specimens collected throughout gestation. Results: Methadone and EDDP concentrations in 19 umbilical cords ranged from 29.7 to 262.2.0 ng/g (mean±SD140.359.8; median 151.0) and 8.2 to 240.8 ng/g (65.650.2; 52.8), respectively, and were lower than placental concentrations (308.0-2647.0 ng/g methadone and 35.9-517.4 ng/g EDDP). Umbilical cord concentrations also were much lower than those in meconium, where EDDP, rather than methadone, was the predominant analyte (85.0-21902.4 ng/g methadone and 6375.0-80503.0 ng/g EDDP). Statistically significant positive correlations were found for methadone concentrations in umbilical cord and methadone mean daily dose (r=0.515), mean dose during the 3rd trimester (r=0.563) and methadone cumulative daily dose (r=0.535). EDDP concentrations in umbilical cord and EDDP/methadone concentration ratio also were statistically correlated to newborn length (r=0.536 and 0.487, respectively), peak NAS score (r=0.596 and 0.579, respectively) and time to peak NAS score (r=0.506 and r=0.589, respectively). Methadone concentrations in umbilical cord and placenta, as well as EDDP/methadone concentration ratio in both matrices also were statistically positively correlated (r=0.694 and r=0.639, respectively). Finally, EDDP concentrations in umbilical cord were positively correlated to methadone meconium concentrations (r=0.530). Meconium identified many more cocaine and opiate positive specimens than umbilical cord. Based on urine screening results throughout pregnancy, the umbilical cord window of drug detection for cocaine and opiates appears to be shorter than two weeks based on these preliminary data. Conclusion: For the first time, methadone and EDDP disposition in umbilical cord, and correlations between umbilical cord concentrations and maternal methadone dose and neonatal outcomes are described. Although these are the first data collected and additional research in other cohorts are needed, our results demonstrate that umbilical cord methadone and metabolite concentrations might predict the need for NAS treatment, and the window of drug detection appears to be much shorter in umbilical cord than meconium. Meconium remains the matrix of choice for identifying in utero drug exposure; however, umbilical cord could be a useful alternative when meconium is unavailable. This research was funded by the Intramural Research Program, National Institute on Drug Abuse, National Institutes of Health and the Dirección Xeral de Investigacion, Desenvolvemento e Innovación, Consellería de Innovación e Industria (AA-053), Galicia, Spain.
Keywords: Methadone, Umbilical Cord, In Utero Drug Exposure

SOFT 2010 Annual Meeting Richmond, VA
S51 Routine Screening of Human Urine for Synthetic Cannabinoids by LC-MS/MS
Utilizing Spectrum Based Library Search Sumandeep Rana*, Victor P. Uralets and Wayne B. Ross. Redwood Toxicology Laboratory, Santa Rosa, CA
Introduction: Herbal materials sprayed with psychoactive chemicals are sold in the US under brand names K2, K3, spice, genie, smoke, pot-pourri, buzz, pulse, hush etc. They are sold with deceptive disclaimer “insence… not for human consumption”, but obviously they are intended for smoking. JWH-018 and JWH-073 are two of the main synthetic cannabinoid receptor agonists found in many of these herbal preparations. Products containing these “synthetic cannabinoids” are banned in many countries and recently in a few states in the US. Legal restrictions on these compounds are likely to be imposed on the Federal level as well. A method for routine screening of these compounds in human urine has been recently developed. We tested known and unknown urine samples with this method for the presence of JWH-018, JWH-073 and their metabolites.
Methods: Urine specimens were collected 12 hr, 24 hr and 48 hr after smoking from one individual. Seven urine specimens were collected from subjects suspected of smoking K2 herbal product, two of them admitted use 24 hours prior to collection. A number of urine specimens during 4 day period were collected from one individual after oral ingestion of 5 mg of JWH-018. All samples were diluted 1:2 and 1:5 with acetonitrile and analyzed by an MS2 spectrum based library search method developed on a hybrid triple quadrupole linear ion trap system. The method included detection of parent compounds and six metabolites for each of the active components. Chromatographic separation of the various metabolites was achieved on a Pinnacle DB biphenyl, 5µ x 50mm x 2.1mm column linked to a pre-column with the same phase. The mobile phases were 0.1% formic acid with 2mM ammonium formate and 0.1% formic acid with 2mM ammonium formate in acetonitrile. The gradient was started at 10% organic mobile phase and increased to 90% organic in 8 minutes. It was kept at this condition for two minutes and then reduced to the original condition of 10% organic. Sample volume was 10 µL with a flow rate of 0.5 mL per minute.
Results: Multiple hydroxylated metabolites of JWH-018 and JWH-073 in free and conjugated forms and a carboxylated metabolite of JWH-018 were detected in human urine up to 24 hr post smoking. JWH-018 hydroxy-metabolite in both free and conjugated form was detected in the 48 hr urine after smoking. The hydroxylated desalkyl metabolite, common for JWH-018 and JWH-073, was detected only in a few specimens. After oral JWH-018 dosing, metabolites were detected for 3 days. Surprisingly, hydroxy- JWH-073 was also detected post JWH-018 ingestion, indicating possible demethylation and subsequent oxidation. Parent compounds were not detected (LOD=0.5 ng/mL) in any of the specimens. Procedure was applied to 1000 routine specimens, 336 of which were found positive.
Conclusions: Routine analysis of human urine for “Herbal High” products containing JWH-018 and JWH-073 was successfully implemented in our lab. Since parent compounds are not found in urine, detection relies on monitoring free and glucuronidated alkyl-hydxroxylated and alkyl-carboxylated metabolites. The window of detection of JWH-018 and JWH-073 metabolites in urine appears to be relatively short. More research is needed to evaluate elimination time of these compounds.
Keywords: JWH-018, JWH 073, Human Urine, Screening Method, LC-MS/MS

SOFT 2010 Annual Meeting Richmond, VA
P01 The Importance of Norbuprenorphine Cross-Reactivity in a Buprenorphine Urine Immunoassay
Guohong Wang1, Kim Huynh1, James Bourland2, Michael Vincent*1, Cynthia Coulter1 and Christine Moore1. 1Immunalysis Corporation, Pomona, CA; 2Ameritox LLC, Midland, TX Introduction Buprenorphine, an opiate antagonist is metabolized by N-dealkylation to norbuprenorphine, and glucuronide conjugation of both buprenorphine (BUP) and norbuprenorphine (nor-BUP). Aim: The objective was to evaluate the analytical performance of two commercially available urine buprenorphine immunoassays (Immunalysis (IMM) & Microgenics (MCG)). IMM has almost identical cross-reactivity (100%) with both free BUP and nor-BUP; while the MCG has cross reactivity with free BUP and conjugated BUP but no nor-BUP cross-reactivity. For the MCG assay, cross-reactivity with opiates was observed and the use of an elevated cutoff is recommended instead of 5 ng/mL suggested by MCG (1). Additionally 15.3% of samples from patients treated with Suboxone showed no detectable buprenorphine (2). The combination of these observations could result in increasing false negatives. Methods: Specimens from patients treated with BUP and from patients taking other opiates were analyzed using both homogeneous enzyme immunoassays (HEIA). The MCG screening cut-off was raised to 20ng/mL; the IMM cut-off set to the IMM recommendation of 5ng/mL, since no opioid cross reactivity was observed at this level. Results:
MCG 20ng/mL cut-off + - IMM HEIA 5ng/mL cut-off + 49 13 _ 1 37 LC-MS/MS 5ng/mL cut-off + - IMM HEIA 5ng/mL cut-off + 62 1 - 0 37 Of the 14 discrepant samples, 13 samples screened positively by IMM and negatively by MCG; one screened negatively by IMM and positively by MCG. The specimens were confirmed for the presence of BUP, BUP-glucuronide, nor-BUP, and nor-BUP-glucuronide. 13 contained nor-BUP or nor-BUP glucuronide and 1 confirmed negatively. Conclusion: The IMM BUP immunoassay yielded excellent agreement with the LC-MS/MS method. The sensitivity, specificity and accuracy of the assay for IMM were 100%, 97%, and 99%; MCG 79%, 97%, and 86%, respectively at the concentrations described. References:
1) Pavlic M et al. Int J Legal Med 119(6); 2005:378-81 2) Hull, MJ et al. J Anal Toxicol 32 (7); 2008: 516-21
Keywords: Buprenorphine, Norbuprenorphine, Immunoassay, Cross-reactivity

SOFT 2010 Annual Meeting Richmond, VA
P02 The Development of a Methadone Immunoassay for Urine with Significant Cross Reactivity to Methadone Metabolites
Kim Huynh*, Michael Vincent, Guohong Wang, Christine Moore and James Soares. Immunalysis Corporation, Pomona, CA Introduction Methadone is metabolized by N-demethylation and cylization to EDDP and further N-demethylation to EMDP. Due to variations in enzyme activity (CYP450 3A4) among individuals there are considerable variations in methadone metabolism and excretion. Analysis of consecutive urine samples from patients in a methadone treatment programs have shown 9.4% of the samples contain EDDP only and 4% contain methadone only with the rest containing a combination of the two analytes (1). Current immunoassays employed for screening methadone or EDDP in urine are extremely specific, resulting in some laboratories having to perform two immunoassay screens: one for methadone at a cut-off concentration of 300 ng/mL; one for EDDP at a cut-off concentration of 100 ng/mL. Aim: Our objective was to develop a single immunoassay with significant cross reactivity to methadone and its metabolites. Such an assay would enable laboratories to screen urine for methadone and minimize the reporting of false negatives containing only EDDP, due to fast metabolization. Methods: The G6PDH enzyme immunoassay developed had a dose response range from 0 to 1000 ng/mL of methadone. Rate precision at 100 ng/mL, 300 ng/mL and 500 ng/mL of methadone was less than 1%. Cross reactivity to EDDP, EMDP and methadol was 80%, 30% and 80%, respectively. Results: The immunoassay was challenged using a 300 ng/mL methadone screening cutoff with 100 urine specimens obtained from a pain management laboratory. The assay correctly identified 77 positive urine specimens including 6 urine specimens containing only EDDP at concentrations ranging from 108 to 452 ng/mL with corresponding methadone concentrations below 100 ng/mL. There was 1 urine specimen that screened positively that contained only 106 ng/mL of methadone and no EDDP. The positive screen may have been caused by other methadone metabolites.
Confirmation: Methadone 300ng/mL or EDDP at 100 ng/mL
+ - Immunoassay: 300ng/mL cut-off + 77 1 _ 0 22
Conclusion: The sensitivity, specificity and accuracy of the developed assay were 98%, 100%, and 99%; at the concentrations described. Laboratories currently testing for methadone and EDDP now have the option of using one broad spectrum immunoassay screen or two individual specific immunoassays. References: Orsulak, PJ et al. SOFT-TIAFT poster #2 1998 Keywords: Methadone, EDDP, EMDP, Immunoassay, Cross-reactivity

SOFT 2010 Annual Meeting Richmond, VA
P03 Enzyme Linked Immunosorbant Assay (ELISA) Validation for Detection of Carisoprodol in Blood and Urine
Dustin T. Yeatman*, Ilene Alford, Nicholas B. Tiscione and Xiaoqin Shan. Palm Beach County Sheriff’s Office, West Palm Beach, FL
Objective: The validation of a semi-quantitative method for the rapid screening of blood and urine specimens by ELISA using the Neogen Carisoprodol Kit. Method: Neogen Carisoprodol Kit assay instructions for incubation times, reagent volumes and sample volumes were followed unless otherwise specified. Blood samples were diluted with an additional 2x on-board dilution due to the higher cutoff level used in this validation. Results: To evaluate carryover a blank sample was analyzed following a positive sample at 50,000 ng/mL. The Dynex DSX analyzer uses disposable pipette tips for sampling. No carryover was detected by the assay. The sensitivity for this method was evaluated by the analysis of standards at successively lower levels to determine the concentration of a low control with significantly different response than the negative control. This was determined using a statistical analysis comparing the average low and blank responses. The LOD was determined to be 125 ng/mL for both blood and urine assays. To evaluate accuracy eight known negative samples were screened using the mid control as the cutoff level (1000ng/mL) for each assay. All samples were below the cutoff. Eight samples containing amounts of the target analyte at the high control level (10000ng/mL) were screened using the mid control as the cutoff concentration for each assay. All samples screened above the cutoff. Specificity was evaluated by the analysis of samples spiked up to 300,000 ng/mL with meprobamate. There was no cross reactivity for meprobamate by the Neogen Carisoprodol Kit. There were no false positives for carisoprodol resulting from screening with the Neogen Kit during validation of known samples or for the 38 case samples confirmed by GC/MS. Drift was evaluated by analyzing 24 replicates at the concentration of the mid control. No drift was observed. When comparing the average of the 24 replicates to the mid control, no bias was observed. The reproducibility was determined by calculating the coefficient of variation (CV) for intra-run replicate measurements of each assay at the low, mid and high concentrations. The CV was less than or equal to 5.0% for all assays.
URINE Level (ng/mL) N Mean O.D. Std Dev CV (%) Low Control 125 8 1.315 0.034 2.6 Mid Control 1000 24 0.798 0.026 3.3 High Control 10000 8 0.507 0.025 5.0 BLOOD Level (ng/mL) N Mean O.D. Std Dev CV Low Control 125 8 0.882 0.037 4.2 Mid Control 1000 24 0.611 0.029 4.8 High Control 10000 8 0.373 0.015 4.0 Summary: The Neogen Carisoprodol ELISA kit is a highly sensitive, specific and rapid screening procedure to detect carisoprodol in blood and urine. Keywords: Carisoprodol, Blood, Urine, ELISA

SOFT 2010 Annual Meeting Richmond, VA
P04 An Evaluation of the Neogen Corporation’s ELISA Citalopram Kit Using Quantified Postmortem Blood Citalopram Values
Phillip Quinton Carter*1, Laureen Marinetti1 and Skyler Colman2. 1Montgomery County Coroner’s Office/ Miami Valley Regional Crime Laboratory, Dayton, OH; 2Neogen Corporation, Lexington, KY Citalopram (Celexa®) is an antidepressant drug commonly detected in forensic toxicology laboratories. At the Montgomery County Coroner’s Office (MCCO), postmortem blood and urine specimens are screened using a gas chromatograph/mass spectrometer (GC/MS). All citalopram positive specimens are subsequently quantified using a liquid-liquid basic extraction with a gas chromatograph/nitrogen phosphorous detector (GC/NPD). Recently, Neogen Corporation released an ELISA kit for citalopram and its major metabolite, N-desmethylcitalopram, which appears at about one third the concentration of citalopram. The ELISA kit displays a cross reactivity of 109% for this metabolite. The sensitivity and accuracy of the ELISA kit were determined by a comparison of the ELISA percent binding to the citalopram blood concentrations obtained from MCCO casework. Postmortem urine specimens were used as an additional matrix strictly for qualitative purposes. Seventy postmortem blood specimens were analyzed and produced a mean percent binding of 23, a median of 25, and a range of 6 to 62. In relation to percent binding, GC/NPD blood concentrations yielded a mean of 420 ng/mL, a median of 300 ng/mL and a range of < 50 ng/mL to 2,700 ng/mL. Fifty-three urine specimens were also analyzed in conjunction with the blood specimens. Negative controls had a percent binding as high as 105 and positive controls had a percent binding as low as 6 with a weighed in concentration of 500 ng/mL. Therefore, it could be determined that the kit produced a percent binding value that clearly differentiated a positive specimen from a negative specimen. According to the data, as the blood concentration of citalopram increased, the percent binding decreased, producing an inverse relationship between the blood concentration and the percent binding. Based on the guidelines for reporting confirmation values at MCCO, the limit of quantification by GC/NPD is 50 ng/mL for citalopram. Anything less than this level is reported as < 50 ng/mL. Since there were eleven specimens reported as < 50 ng/mL, the actual citalopram concentrations of these specimens were unknown. However, because the concentration was so low, it was only pertinent that these eleven specimens yield a percent binding greater than that of the negative control. From the experimentation, it could be determined that the citalopram kit’s limit of detection was at least 50 ng/mL. This concentration falls below the range that citalopram is toxicologically relevant for postmortem casework, and therefore would be satisfactory in meeting a laboratory’s requirements for a screening procedure. Keywords: ELISA, Citalopram, Postmortem

SOFT 2010 Annual Meeting Richmond, VA
P05 An Evaluation of the Neogen Corporation’s ELISA Trazodone Kit Using Quantified Postmortem Blood Trazodone Values
Phillip Quinton Carter*1, Laureen Marinetti1 and Skyler Colman2. 1Montgomery County Coroner’s Office/ Miami Valley Regional Crime Laboratory, Dayton, OH; 2Neogen Corporation, Lexington, KY Trazodone (Desyrel®) is an antidepressant drug commonly detected in forensic toxicology laboratories. At the Montgomery County Coroner’s Office (MCCO), postmortem blood and urine specimens are screened using a gas chromatograph/mass spectrometer (GC/MS). All trazodone positive specimens are subsequently quantified using a liquid-liquid basic extraction with a gas chromatograph/nitrogen-phosphorous detector (GC/NPD). Recently, Neogen Corporation released an ELISA kit for trazodone with little to no cross reactivity with other drugs. The sensitivity and accuracy of the ELISA kit was determined by the comparison of the ELISA percent binding to the quantified trazodone blood concentrations obtained from MCCO casework. Postmortem urine specimens were used as an additional matrix strictly for qualitative purposes. Thirty-five postmortem blood specimens were analyzed and produced a mean percent binding of 27, a median of 24, and a range of 4 to 71. In relation to percent binding, GC/NPD blood concentrations yielded a mean of 580 ng/mL, a median of 240 ng/mL and a range of < 50 ng/mL to 6,600 ng/mL. Negative controls had a percent binding as high as 105 and positive controls had a percent binding as low as 2 with a weighed in concentration of 5,000 ng/mL. Therefore, it could be determined that the kit produced a percent binding value that clearly differentiated a positive specimen from a negative specimen. According to the data, as the blood concentration of trazodone increased, the percent binding decreased, producing an inverse relationship between the blood concentration and the percent binding. Based on the guidelines for reporting confirmation values at MCCO, the limit of quantification by GC/NPD is 50 ng/mL for trazodone. Since the exact blood concentrations of the five specimens that were < 50 ng/mL were not known, it was only pertinent that these five specimens yielded a percent binding less than that of the negative control. From the experimentation, it could be determined that the trazodone kit’s limit of detection was at least 50 ng/mL. This level falls below the concentration that trazodone becomes toxicologically relevant for postmortem casework, and therefore would be satisfactory in meeting a laboratory’s requirements for a screening procedure. Keywords: ELISA, Trazodone, Postmortem
SOFT 2010 Annual Meeting Richmond, VA
P06 Determination of Methadone and its Metabolite EDDP in Urine with Assay Kits Applicable to the RX Series Analysers
P. McGivern, E. Donnelly, J. Thompson, R. Bell*, J. Campbell and S.P. Fitzgerald. Randox Laboratories, Crumlin, Co Antrim, UK Methadone is used as a substitute for heroin and other opiates in the detoxification and/or maintenance treatments for opioid addiction. The screening of methadone in urine is relevant for evaluating compliance/misuse. Methadone is metabolized to EDDP and some subjects metabolise methadone so quickly that they appear as negative upon screening. On the other hand, adulteration of urine to disguise additional use of illicit drugs or to fake treatment compliance by spiking small amounts of methadone in urine can be detected when a positive methadone assay is concurrent with a negative EDDP assay. We report the performance evaluation of two assay kits for qualitative/semi-quantitative analysis of methadone and EDDP in urine with ready to use reagents on the RX series analysers. This is of value as a convenient screening tool in treatment programs or to monitor misuse. With these competitive assays, the change in absorbance at 340nm is measured, this is directly proportional to the amount of drug in the specimen. The assay kits consist of two ready to use liquid reagents and are applicable to the fully automated RX series analysers (RX Daytona, RX Imola), which include dedicated software for data management. For a cut-off of 300ng/ml, sensitivity was determined as 4 and 10ng/ml (methadone) and 7 and 3ng/ml (EDDP) for RX Imola and RX Daytona respectively (assay range up to 1000ng/ml). The precision (n=88) of the qualitative analysis expressed as %CV for both assays was typically<6.6 and for the semi-quantitative assessment was typically<5.2 for different concentration levels. The percentage agreement with GC/MS (n=60) was>80%(methadone) and 98.3% (EDDP) in both systems. Data show reproducibility and accuracy of these assay kits for the determination of methadone and EDDP in urine on the RX series analysers using ready to use liquid reagents. This represents a convenient analytical tool for the monitoring of these compounds. Keywords: Methadone, EDDP, Opioid Addiction

SOFT 2010 Annual Meeting Richmond, VA
P07 Performance Characteristics of Creatinine Assays Pao-Hsiu Liu1, Hei Hwa Lee2, Mei-Han Huang1, Meng-Yan Wu1, Bai Hsiun Chen2,3,4 and Ray H. Liu*1. 1Department of Medical Technology, Fooyin University, Kaohsiung Hsien, Taiwan; 2Department of Laboratory Medicine, Kaohsiung Medical University Hospital, Kaohsiung, Taiwan; 3Graduate Institute of Medicine, College of Medicine; 4Center of Excellence for Environmental Medicine, Kaohsiung Medical University, Kaohsiung, Taiwan Specimen validity testing (SVT) has become an essential component of workplace drug testing in the U.S. The regulatory agency in the Taiwanese government is currently assessing the impact of specimen adulteration and SVT on its limited urine drug testing programs. In support of this effort, we have conducted a series of study on various components of SVT; preliminary data derived from the creatinine study are hereby presented. Three commercial creatinine assays have been studied in our laboratories, in which two (DRI® Creatinine-Detect Test® and Syva® Creatinine Validity Test) are intended for “quantitative determination of creatinine” as an indicator of urine specimen adulteration; while the third assay (InfinityTM Creatinine Liquid Stable Reagent) is intended for “quantitative determination of creatinine in human serum”. All assays are based on Jaffe reaction; specifically, creatinine reacts with alkaline picrate to produce a reddish color complex; color measurement (at 505 nm) is used for concentration determination of creatinine in the test sample. The number and concentration of calibrators provided by these assays’ manufacturers are different; for this study, the same set of standard creatinine solutions (0–30 mg/dL), prepared in-house, was used for assay calibration. A Hitachi 717 clinical chemistry analyzer was used for all measurements, adopting parameters recommended by respective manufacturers (with some exceptions). Performance parameters studied included: (a) calibration characteristics, mainly the slope of linear regression analysis (change of response per unit change of creatinine concentration); (b) measurement precision; (c) separation of responses for samples at the critical cutoff points from samples with concentrations at their respective vicinities; and (d) lower limit of quantitation. Exemplar data summarized in Table 1 indicate assay A is more sensitive (larger response change per unit change of creatinine concentration), with better measurement precision at 2.0 and 5.0 mg/dL. It can therefore (a) better separate signals generated by samples with 2.0 and 5.0 mg/dL of creatinine from those generated by respective samples with ±20% concentration differences; and (b) reach a lower limit of quantitation.
Table 1. Characteristics (calibration, precision, separation of response) of creatinine assays Linear regression analysis Precision dataa Separation datab Assay (0, 2, 5, 12.5, 20, 30 mg/dL) 2.0 5.0 1.6 vs 2.0 2.0 vs 2.4 4.0 vs 5.0 5.0 vs 6.0 A y = 70.5 x + 5.29; r2 = 1.0000 2.23; 1.0 5.35; 0.59 135/159 (24) 165/182 (17) 308/378 (70) 387/450 (63) B y = 27.7 x + 2.55; r2 = 0.9999 1.96; 2.7 4.93; 0.70 48/54 (6) 60/64 (4) 112/137 (25) 141/162 (21) C y = 22.2 x + 1.98; r2 = 0.9999 2.02; 5.6 5.03; 1.7 43/42 (–1) 52/51 (–1) 90/110 (20) 117/134 (17) a “2.0” and “5.0” are targeted creatinine concentrations (mg/dL) of standards; the numbers in the body of the table (e.g., “2.23; 1.0”) are observed mean
concentration and CV in % (n = 5). b Using the data in the first sub-column as examples, “1.6 vs 2.0” are targeted creatinine concentrations (mg/dL) of standards. The data in the body of the
table, e.g., “135” in “135/159” is the “mean delta absorbance ( 10,000) plus 2 standard deviations” (n = 5) of the 1.6 mg/dL standard; while “159” is the “mean delta absorbance ( 10,000) minus 2 standard deviations” of the 2.0 mg/dL standard. “24” inside parentheses is the difference between 135 and 159.
Keywords: Specimen Validity Testing, Creatinine, Performance Characteristics

SOFT 2010 Annual Meeting Richmond, VA
P08 A New Dipstick for Screening GHB in Urine by Enzymatic Method Wai Tak Law, Robert Harper and Ronald Moule*. PortaScience, Moorestown, NJ Objective: Evaluation of the new PortaGHB™ dipstick with urine samples Background: Gamma-Hydroxybutyric Acid (GHB), a colorless, odorless chemical, has become one of the most dangerous illicit drugs of abuse today. It has become known as one of the "date-rape" drugs, and there is also an increasing trend that GHB is being used as a recreational drug. The only method available for detecting low concentrations of GHB in bodily fluids are GC/MS or LC/MS/MS. There are no immunology based reagent methods available for rapid screening of this drug. None of the many currently available over-the-counter GHB test cards and kits has the sensitivity or specificity to detect low concentrations of GHB. The concept of using a specific enzymatic method to assay GHB in fluids was originally developed at the University of California at Santa Barbara. The enzyme gamma-hydroxybutyrate dehydrogenase (GHB-DH) was cloned from Ralstonia eutropha, expressed as a stable fusion protein, and purified. GHB-DH catalyses the reaction of GHB with NAD to produce NADH, and a diaphorase coupled tetrazolium dye reaction results in the production of a purple color dye complex. Methods: The reagents were stabilized and produced in a simple-to-use dipstick format for screening low levels of GHB in urine samples. The PortaGHB dipsticks have a 5 mm x5 mm reagent pad on a 7 cm dipstick. The reagent pad is dipped into the test samples held in a cup and removed quickly. Purple color develops on the reagent pad and after 3 minutes is compared to a color chart. Results: A color chart is provided with the PortaGHB dipstick that indicates three semi-quantitative GHB concentrations. The 0 µg/mL level indicates that no significant GHB in present, the 50 µg/mL level indicates slight positive, and the 500 µg/mL level indicates strong positive. Thirty normal urine samples with <50 µg/mL GHB, and fifteen GHB spiked urine samples in the range of 50-2,000 µg/mL were tested. The PortaGHB dipsticks worked very well as a tool for the rapid screening of urine GHB samples. The dipsticks detected 100% normal urine samples with low GHB present correctly, and 93% of spiked samples with a 50 µg/mL GHB threshold level. An independent clinical testing of 676 urine samples conducted by the University of San Francisco confirmed that the PortaGHB dipstick could be utilized as a simple-to use rapid test for screening patients who are unconscious and/or exhibiting signs of being potential date-rape victims Conclusion: The PortaGHB test is the first specific and sensitive dipstick suitable for rapid screening of low levels of GHB in urine samples. Keywords: GHB, Dipstick, Enzymatic
SOFT 2010 Annual Meeting Richmond, VA
P09 Method Validation of Analysis of Liquid Biological Specimens and Matrix Effects: Sympathomimetic Amines, Cocaine/Cocaine Metabolites and Other Analytes
Sabra Botch*, Connie Lewis, Joyce Ho, Cheryl Wheeler and Beryl Landry and Angela Springfield. Tarrant County Medical Examiner, Fort Worth, TX Introduction: Laboratory guidelines frequently recommend that calibrators and controls be matrix-matched or similar. This often presents some difficulties when analyzing more than one type of biological specimen in grouped analysis as certain controls are not available commercially. Further, when similar matrixes are used in controls and calibrators they may not adequately represent post-mortem case specimens. Regulations require that more than one sample type be analyzed to confirm the presence of a compound. Our laboratory has found that grouped analysis of similar compounds is more efficient, reduces the amount of supplies needed, and decreases turn around time for reporting. Methods: Our laboratory conducted method validation studies using urine, whole blood and plasma to determine if a matrix effect could be determined. Whole blood, plasma, and urine were obtained from UTAK© Laboratories. Quality control (QC) mixes were commercially obtained from UTAK© (Urine Drug Screen), Biochemical Diagnostics© (DetectabuseTM Custom Liquid Control), and Bio-Rad© (LiquicheckTM Urine Toxicology Control Level C4). The controls were analyzed in the same analytical batches with calibrators using urine, whole blood, and plasma spiked with Cerilliant© standards containing: amphetamine, methamphetamine, 3, 4-Methylenedioxyamphetamine (MDA), 3, 4-Methylenedioxymethamphetamine (MDMA), phentermine, diphenhydramine, ephedrine, ketamine, cocaine, cocaethylene, and benzoylecgonine. Internal standard (IS) solutions were prepared using the following Cerilliant© standards: amphetamine D5, methamphetamine D5, MDA D5, MDMA D5, ephedrine D3, diphenhydramine D3, cocaine D3, cocaethylene D3, and benzoylecgonine D3. Samples were extracted on UCT Clean Screen© solid phase extraction columns under alkaline conditions and subsequently evaporated to dryness under warm air. The samples were reconstituted with 200 uL of 50:50 acetonitrile and formate buffer. The analytical method used a Thermo Finnegan TSQ Quantum Discovery Max© (Thermo Fisher Scientific Inc.) operating in positive electrospray MS/MS mode using A Thermo Hypersil Gold PFP, 100 x 2.1 mm, 5um column; Phenommenex Security Guard cartridge C18 (ODS Octadecyl) 4mm L x 2.0 mm ID. At an injection volume of 2 ul, samples were run isocratically at 300 uL/minute with 30% formate buffer (pH3) and 70% acetonitrile (1% formic acid). Results: Calculated concentration for analytes in the positive controls fell within +/- 20% of the target value regardless of which matrix type was used. Retention time for IS fell within +/- 2% of their expected retention time (RT) relative to the QC mixes. Retention time for analytes fell within +/- 2% of the target RT determined from analysis of the QC mixes. The linear regression (r2) analysis correlation coefficient was determined to be ≥ 0.98. The linear range and limit of quantitation for each of the previously mentioned analytes was determined to be 20 ng/mL for the limit of detection and lower limit of quantitation as 20 ng/mL. The upper limit of quantitation was determined to be 2000 ng/mL in all matrixes. Through our studies, we have demonstrated that the validity of analysis is not compromised regardless of matrix type represented in analytical controls and calibrators. This presentation shall provide the results of these validation studies. Conclusion: The method validation presented here shows that regardless of the matrix type used for calibrators and controls the analytical results of case samples are not compromised if matrix-match is not possible. For high case-load laboratories, grouped analysis may present a valid option to improve efficiency. Keywords: Toxicology, Matrix Effect, Method Validation

SOFT 2010 Annual Meeting Richmond, VA
P10 A TurboFlow™ Online Sample Preparation LC-MS/MS Method for Quantitation of THC Metabolites in Urine
Kristine Van Natta*1, James Byrd2 and Marta Kozak1. 1Thermo Fisher Scientific, San Jose, CA; 2Thermo Fisher Scientific, Franklin, MA Introduction: Tetrahydrocannabinaol (THC) is the active compound in Marijuana. Its metabolites, (±)-11-Hydroxy-Δ9-THC (11-OH-THC), and (±)-11-nor-9-Carboxy-Δ9-THC (11-COOH-THC) are analyzed in forensic laboratories to determine involvement of Marijuana in crimes. Up to now, sensitive methods involved laborious sample preparation including SPE, liquid-liquid extraction and derivitization. Objective: To develop a simple, efficient and cost effective LC-MS method utilizing TurboFlow on-line sample preparation and optimized detector conditions to collect robust, accurate and precise data with quantitation limits recommended by SOFT DFSA Committee. Method: Urine is fortified with deuterated internal standards and then incubated with ß-glucuronidase. The incubated mixture is precipitated with acetonitrile then centrifuged. The supernatant is transferred to an HPLC vial and 100 µl is injected onto the turbo-flow column (Thermo Scientific C18 XL, 50x0.5 mm) at 20% methanol and 80% 0.1% formic acid for on-line sample preparation. Following TurboFlow preparation, the analytes are automatically transferred to the analytical column (Thermo Scientific Hypersil GOLD PFP 50x2.1mm, 5 µm) and subjected to a gradient from 5 to 90% methanol over 2 minutes and held at 90% methanol for another two minutes. Analytes are detected on a Thermo Quantum Ultra triple quadrupole mass spectrometer equipped with a HESI source and operating in positive SRM mode monitoring two transitions per analyte as follows: for 11-OH-THC 331.2 201.1(quantifier) and 193.1 (qualifier); for D3-11OH-THC internal standard 334.2 201.1 (quantifier) and 196.1 (qualifier); for 11-COOH-THC 315.2299.2 (quantifier) and 193.1 (qualifier); and for D3-11-COOH-THC internal standard 348.2 302.2 (quantifier) and 196.1 (qualifier). Method accuracy and precision were determined by obtaining intra- and inter-day data. Matrix effects were investigated using urine from six different donors, three male and three female. Results: Detection limits of 2 ng/mL were achieved for both analytes. Accuracy and precision were both within 15% for the lowest QC sample. No matrix effects were detected when compared to samples prepared with solvent in place of urine. Conclusion: The developed method meets forensic lab requirements and at the same time is more efficient and cost effective than traditional methods using solid phase or liquid-liquid extraction or derivitization required by GC-MS techniques. Most of the savings in samples preparation is achieved by implementing online sample preparation with the TurboFlow technology. Keywords: THC, TurboFlow, Urine
SOFT 2010 Annual Meeting Richmond, VA
P11 Development of a Fast Extraction and LC/MS/MS Analysis Method for Benzodiazepines and Metabolites in Blood and Urine
Amanda Rigdon*1 and Michael Coyer2. 1Restek, Bellefonte, PA; 2Northern Tier Research, Mayfield, PA Benzodiazepines are widely used for anxiety and sleep disorders such as restless leg syndrome. These drugs are also often prescribed in conjunction with pain management medications, due to their ability to relieve pain caused by stress and anxiety. While the analysis of benzodiazepines by GC/MS is relatively straightforward, GC/MS analysis of benzodiazepine metabolites can prove to be problematic. Although benzodiazepine parent compounds do not necessarily require derivatization to analyze by GC/MS, metabolites such as 7-amino diazepam require time-consuming derivatization steps for quantitative analysis. Due to the time involved for sample extraction, concentration, and derivatization for GC/MS analysis of samples for benzodiazepines, many analysts are considering transferring their methods to LC/MS/MS methodologies, which do not require as much sample preparation prior to analysis. The purpose of this project was to develop a fast extraction and analysis method for LC/MS/MS analysis of benzodiazepines and their metabolites in urine, whole blood and plasma, while simultaneously maximizing column lifetime. The compounds analyzed included clonazepam, diazepam, lorazepam, flunitrazepam, prazepam, trazolam, and 7-amino, desmethyl, and desalkyl metabolites. The analytes were spiked into blank blood and urine, the urine samples were enzymatically hydrolyzed, then all samples were and either diluted or extracted. The diluted samples were diluted 20:1 with mobile phase. The extracted samples were extracted using 100mg CleanScreen Xcel I cartridges on a positive pressure manifold. 20uL of each sample was analyzed on an API-4000 MS/MS detector coupled with a Shimadzu UFLCXR HPLC set at a flow rate of 0.6mL/min. The mobile phase consisted of water and acetonitrile to which 0.2% formic acid and 2mm ammonium formate was added. The samples were analyzed using a gradient from 30% organic to 95% organic over 5 minutes. The amount of time allowed for rinsing at 95% organic varied with each matrix. 2 minutes of equilibration time was allowed at the end of each run. The column used for all analyses was a 5µm, 50mm x 2.1mm Ultra II Biphenyl RP-HPLC column. The column was not equipped with a guard column in order to evaluate column longevity. The MS/MS detector was operated in positive MRM mode, monitoring three transitions for each compound. Scheduled MRMs were employed to improve data acquisition rate. The LOD for this method ranged from 0.1 ng/mL for high responding compounds such as flurazepam to 5 ng/mL for poor responding compounds such as bromazepam. LOQs ranged from 0.5ng/mL to 25ng/mL. Linearity was evaluated from 0.1 ng/mL to 1000 ng/mL. For extracted samples, recoveries ranged from 73% to 101%, with recovery of most compounds around 95%. Column longevity data was collected for each extraction method using whole blood extracts and compared to column longevity when analyzing whole blood samples prepared with a simple ‘crash and shoot’ preparation. In conclusion, a fast SPE extraction coupled with a fast LC/MS/MS method and robust LC column allows for improved throughput compared to GC/MS methods, as well as reduced instrument downtime due to improved column lifetime. Keywords: Benzodiazepines, LC/MS/MS, SPE

SOFT 2010 Annual Meeting Richmond, VA
P12 Determination of Buprenorphine and Norbuprenorphine in Urine Using Benzoyl Chloride Derivatives
Katherine N. Moore*1, Justin L. Poklis2, Carl E. Wolf3, Alphonse Poklis1,2,3. Departments of 1Forensic Science, 2Pharmacology and Toxicology and 3Pathology, Virginia Commonwealth University, Richmond, VA Introduction: In applying standard forensic practices to mass spectrometric analysis, it is axiomatic that ion ratios of multiple m/z fragments be used to identify a given drug. Current high pressure liquid chromatographic mass spectrometry/mass spectrometric (HPLC/MS/MS) methods with electrospray ionization for the determination of buprenorphine (BUP) and norbuprenorphine (NBUP) in biological specimens produce a precursor ion that transitions into product ions of low abundance. This study presents a validated HPLC/MS/MS method for the determination of BUP and NBUP in urine by their benzoyl chloride derivatives, which produce product ions of sufficient abundance for quantification and identification. Experimental Design: Liquid chromatography was performed on a Shimadzu SCL HPLC system. Separation was completed on a Shimadzu C18 column (4.6x50 mm), using isocratic elution at a flow rate of .5 mL/min with 1 mM ammonium formate: methanol at 5:95. The injection volume was 20 µL and the total run time was less than 5 minutes from injection to injection. An Applied Biosystems 3200 Q Trap equipped with an electrospray ion source was used. Positive ionization was performed in multiple reaction monitoring (MRM) mode. Transition ions for BUP derivative were m/z 572 m/z 500 (55 ev) and m/z 105 (84 ev). Monitored transitions for NBUP were m/z 622 m/z 548 (40 eV) and m/z 148 (30 eV). Transitions for norbuprenorphine-d3 and buprenorphine-d4 benzoyl chloride derivatives were m/z 625 m/z 515 (40ev) and m/z 576 m/z 504 (55 eV), respectively. Hydrolysis with β-glucronidase at 55 ̊C for two hours was completed prior to derivatization. The derivative was formed by a 1 mL addition of 4 N sodium hydroxide and 100 µL of benzoyl chloride to 500 µL of urine. Liquid/liquid extraction was performed by addition of 4 mL chloroform: 2-propanol at 9:1. The organic layer was dried down under nitrogen and reconstituted with 200 µL of methanol. Results: The method was validated on the following parameters: sensitivity, carryover, linearity, precision, accuracy, specificity, recovery, and matrix effects. Linearity for both analytes was from 0.25 to 2,000 ng/ mL. No carryover was observed. LOD and LOQ for BUP and NBUP were 0.25 ng/ mL and 1 ng/ mL, respectively. Calibrators used were 10, 25 and 500 ng/ mL. Percent Relative Standard Deviation (%RSD) for Interday precision was < 7% for NBUP and < 8% for BUP. Intraday precision for BUP was < 6 %RSD and < 12% RSD for NBUP. Thirty-nine anayltes at 1,000 ng/mL were analyzed with no interferences with BUP and NBUP. The current method was compared to previous methods based on sensitivity, transitions for quantification, and initial sample and injection volume. A set of urine samples containing BUP (n = 48) and NBUP (n = 58) were analyzed and the results were compared to analyte concentrations obtained with GC/MS assay. Method correlation for BUP and NBUP were 0.9754 and 0.8367, respectively. Conclusion: Derivatization of BUP and NBUP with benzoyl chloride successfully increased the sensitivity of LC/MS/MS analysis by using less initial and injection volume, increasing product ion abundance, and producing characteristic transition ion fragmentation. This project was supported by the National Institute on Drug Abuse (NIDA) Center for Drug Abuse grant P50DA005274. Keywords: Buprenorphine and Norbuprenorphine, Derivatization, LC/MS/MS

SOFT 2010 Annual Meeting Richmond, VA
P13 Analysis of Tricyclic Antidepressants in Urine by LCMSMS M. Lauren Wolfe1, Carl E. Wolf*1,2, Justin L. Poklis3 and Alphonse Poklis1,2,3. Departments of 1Forensic Science, 2Pathology and 3Pharmacology and Toxicology, Virginia Commonwealth University, Richmond, VA Analysis of tricyclic antidepressants (TCAs) using high performance liquid chromatography (LC) has been the norm for many years, but liquid chromatography/mass spectrometer (LC/MS) is becoming more prominent, due to higher resolution, short analysis times, and simpler sample preparation. TCAs are some of the oldest anti-depressants, but are being analyzed at a higher frequency due to being more widely prescribed in chronic pain management treatment. Since many of the TCAs are structurally similar, LC analysis times are generally long. The objective of the study was to develop a method to quickly analyze sixteen of the most common TCAs and their metabolites in urine. The optimum method involved extracting TCAs from 1 ml of urine alkalinized with 0.2 ml of 0.2N NaOH and 2 ml of hexane:ethyl acetate (1:1), and the solvent was evaporated to dryness before reconstitution with 100 uL of LC mobile phase. LC/MS conditions and retention times (RT) are as follows: Waters Alliance 2690 separation module (Waters, Milford, MA, USA) with a Quattro II quadrupole mass spectrometer (MS/MS) using an eletrospray in positive mode (ESI+) (Micromass, Altrincham, England) controlled by MassLynx 3.5 software system. The mobile phase consisted of 20 mM ammonium formate:methanol (20:80) at a flow rate of 0.5 mL/min. The injection volume was 10 uL. Capillary, cone, and extractor voltages were maintained at 3.2kV, 35V, and 5V, respectively. Source block and desolvation temperatures were maintained at 100°C and 200°C, respectively. Collision Energies (CE) are listed in the table. The analytical column was an Allure Biphenyl 5 micron, 100 x 3.2mm (Restek Corp, Bellefonte, PA). Acquisition Mode: Multiple Reaction Monitoring (MRM) TCA RT Quant Ion CE (eV) Qual Ion CE (eV) Norfluoxetine 2.04 296 > 30 8 296 > 134 15 Fluoxetine 2.18 310 > 148 8 310 > 44 5 Nordoxepin 2.92 266 > 235 15 266 > 107 23 Maprotiline 3.81 278 > 250 20 278 > 219 24 Desipramine 3.81 267 > 72 15 267 > 236 15 Nortriptyline 4.11 264 > 233 14 264 > 91 19 Doxepin 4.40 280 > 235 15 280 > 107 23 Norclomipramine 4.70 301 > 301 6 301 > 72 18 Imipramine 5.74 281 > 86 16 281 > 281 5 Amoxapine (IS) 5.59 314 > 271 25 Cyclobenzaprine 5.74 276 > 231 18 276 > 216 24 Amitriptyline 6.18 278 > 233 17 278 > 91 25 Trimipramine 6.18 295 > 100 19 295 > 58 35 Mirtazapine 7.22 266 > 195 25 266 > 72 20 Clomipramine 7.66 315 > 86 17 315 > 58 38 Trazodone 1 0.33 374 > 176 25 374 > 148 34
Within run precision yielded CVs <12%, and recoveries were greater than 70% for all TCAs. The method developed is simple, fast, and rigorous for the extraction, separation, identification and quantification of sixteen TCAs and metabolites in urine. This project was supported by the National Institute on Drug Abuse (NIDA) Center for Drug Abuse grant P50DA005274. Keywords: Tricyclic Antidepressants, LC/MS/MS, Urine
SOFT 2010 Annual Meeting Richmond, VA
P14 Method Validation of the Combined Analysis of Liquid Biological Specimens and Matrix Effects: Tricyclics Antidepressants, SSRIs, Antipsychotics and Other Basic Drugs
Connie Lewis*, Sabra Botch, Joyce Ho, Cheryl Wheeler, Beryl Landry and Angela Springfield. Tarrant County Medical Examiner’s Office, Fort Worth, TX Objective: Historically, tricyclics antidepressants, SSRIs, antipsychotics, and other basic drugs have been typically extracted and analyzed individually during toxicological analysis. This caused an increase in wait time, energy, and an increase of supplies used to run effectively and efficiently. By grouping drug analytes together, we have decreased wait time, energy, and supplies needed. In the past few years, method validations of combined analysis, along with matrix effects using controls and calibrators of plasma, whole blood, and urine have been conducted in our laboratory. Issues arose since commercial controls are not available in all matrix types. Also, commercial controls in their matrix may not truly represent a medical examiner’s case samples (i.e. vitreous humor, tissues, decompositions). This poster presentation will display method and matrix validations on our combined analysis extraction using LC/MS/MS. Methods: Our laboratory conducted method validation studies using urine, whole blood, and plasma to determine if there were any matrix effects while combining several analytes. The following analytes were included in this study: amitriptyline, nortriptyline, imipramine, desipramine, doxepin, nordoxepin, cyclobenzaprine, burpropion, citalopram, mirtazapine, paroxetine, sertraline, venlafaxine, norvenlafaxine, diltiazem, doxylamine, duloxetine, hydroxyzine, midazolam, propoxyphene, norpropoxyphene, promethazine, quetiapine, trazadone, and zolpidem. Samples were extracted on UCT® (Clean Screen) solid phase columns in alkaline conditions, dried under warm air, and then reconstituted with 50:50 acetonitrile: formate buffer. The analytical method used a Thermo Finnegan TSQ Quantum Discovery Max® (Thermo Fisher Scientific Inc.) operating in positive electrospray MS/MS mode for identification and quantitation of commercially obtained controls and biological fluids. The column used was Thermo Hypersil Gold PFP, 100 x 2.1 mm with a 5µm particle size. Five microliters of prepared samples were run isocratically @ 300 µl/minute with 30% formate buffer (pH 3) and 70% Acetonitrile (1% formic acid added). Whole blood, plasma, and urine matrices were obtained from UTAK® Laboratories. Quality control (QC) mixes were commercially obtained from UTAK® (High Range SSRI 7 Plus), UTAK® (Tricyclic Antidepressants High Range), UTAK® (Antipsychotic HR), UTAK® (Mid-range Trazadone), Bio-Rad® (Liquicheck TM Urine Toxicology Control Level C4). In-house controls were made from Cerilliant® and/or Grace-Alltech®. The controls were analyzed in the same analytical batches with calibrators using urine, whole blood, and plasma spiked with Cerilliant® and/or Grace-Alltech® standards. Internal standard (IS) solution was prepared using Cerilliant® and Grace-Alltech® deuterated standards. Results: Through ‘grouped’ method validation studies, it has been shown that the validity of the analysis is not compromised when in fact all matrix types are not represented in analytical controls. Calculated concentration for analytes in the positive controls fell within +/- 20% of the target value regardless of which matrix type was used. Retention time for internal standard fell within +/- 2% of their expected retention time (RT) relative to the QC mixes. Retention time for analytes fell within +/- 2% of the target RT determined from analysis of the QC mixes. The linear regression (r2) analysis correlation coefficient was determined to be ≥ 0.98. The lower limit of quantitation for each of the previously mentioned analytes was determined to be 20 ng/ml and the upper limit of quantitation was determined to be 2000 ng/ml making the linear range from 20 ng/ml to 2000 ng/ml for all matrixes. We have successfully demonstrated the combined analysis is valid using previously stated matrices. Conclusion: We have combined over 25 drugs together; these drug analytes run well together without compromise to individual analytes. The combined analysis extraction/run decreases turnaround time for reporting. Also, there was no significant effect on controls and calibrators with any of the matrices used. Grouped analysis proves to be a valid option to improved efficiency in high case-load laboratories. Keywords: Method Validation, Matrix Effects, Combined Analysis

SOFT 2010 Annual Meeting Richmond, VA
P15 Analysis of Psilocybin and Psilocin in Urine Using SPE and LC-MS/MS Jeffery Hackett*1, Albert A. Elian2 and Michael J. Telepchak1. 1UCT, Bristol, PA; 2Massachusetts Police State Crime Laboratory, Sudbury, MA In this presentation, attendees will learn about the extraction of psilocybin and its metabolite (psilocin) from urine using readily available solid phase cartridges and tandem mass spectrometry. Use of this method allows analysts to provide data on both compounds in urine samples where it has not been previously available. Method: Extraction (SPE) was performed on mixed mode column (C8/SCX) conditioned with methanol, deionized water, and pH 6 buffer (3 mL, 3 mL and 1 mL, respectively) prior to sample loading. Urine samples (1 mL) were adjusted to pH 6 with 0.1 M phosphate buffer (5 mL) and an internal standard added (ethyl morphine). After loading the sample, the sorbent was washed with deionized water and methanol (3 mL of each, respectively). Each SPE column was eluted with 3 mL of a solvent consisting of ethyl acetate containing 2% ammonium hydroxide followed by 3 mL of methanol containing 4% ammonium hydroxide. The individual eluates were collected, evaporated to dryness and dissolved in mobile phase (50 μL). These solutions were combined for analysis by LC-MS/MS in positive multiple reaction monitoring (MRM) mode. Data is presented for MRM’s of psilocybin (284.9 → 205.2, 240.0), psilocin (205.6 → 116.1, 115.1), and ethyl morphine (314.2 →152.2, 128.3), respectively. Liquid chromatography was performed in gradient mode employing a 50 x 2.1 mm C18 analytical column and a mobile phase consisting of acetontitrile and 0.1% aqueous formic acid. The gradient was programmed to run from 5% to 90% acetonitrile in 4.0 minutes and then back to 5% for re-injection. The flow rate was 0.5 mL/ minute. The total run time for each analysis was less than 5 minutes. In this presentation, representative chromatograms are shown to illustrate the efficiency of the chromatography and analysis. Results: The limits of detection/ quantification for this method were determined to be 5 ng/ mL and 10 ng/ mL, respectively for both psilocybin and psilocin. The method was found to be linear from 10 ng/ mL to 1000 ng/ mL (r2>0.999). Data is presented to show that recoveries of psilocybin and psilocin were found to be greater than 85%. Interday and Intraday analysis of psilocybin/psilocin were found to < 5% and < 8%, respectively. Matrix effects were determined to be < 6%. Conclusion: The use of this new procedure for the analysis of psilocybin and psilocin will be of great use to analysts in the field of forensic toxicological analysis as the concentrations of both drugs in urine can now to be reported rather than just the metabolite value alone. Keywords: Hallucinogens, LC-MS/MS, SPE
SOFT 2010 Annual Meeting Richmond, VA
P16 An LC-MS/MS Analytical Method for Pregabalin and Tapentadol Analysis in Urine and Plasma
Theresa Lee*, Alexandre Wang and Hua-Fen Liu. AB SCIEX, Foster City, CA Many drug tests simply determine the absence or presence of certain drugs classes. To develop an optimal treatment plan and to identify potential pain medication abuse or misuse, more information is needed. This poster will highlight an analytical method to analyze two pain medications that have recently received FDA approval. LC-MS/MS analysis can provide a fast analysis time as well as accurate, precise and reproducible results. Here we present a method for the determination of pregabalin and tapentadol in both serum and urine using a triple quadrupole-ion trap mass spectrometer. Pregabalin (Lyrica) is an anticonvulsant; it relieves neuropathic pain and for the treatment of fibromyalgia. Tapentadol (Nucynta) is a narcotic pain reliever prescribed for moderate to severe pain. The method development process evaluated different sample preparation procedures, calibration curve construction, column selection, mobile phase selection, and ion suppression. Minimal sample preparation is required; simple ‘dilute-and-shoot’ for urine samples and a simple protein precipitation for plasma samples. This analysis was performed on an Ultra II Biphenyl 5µm 50x2.1mm column with an injection volume of 20µL, flow rate of 0.8mL/min and a total run time under 2.5 minutes. Mobile phase A consisted of water with 0.1% formic acid and mobile phase B consisted of acetonitrile with 0.1% formic acid. The gradient started at 5% mobile phase B which was increased to 95% over a 1.5min interval, held at 95% for 0.4min and then re-equilibrated at 5% for 0.5min. The mass spectrometer was operated in multiple reaction monitoring mode (MRM) in positive ion mode. Source conditions included CUR of 20psi, CAD gas Medium, IS Voltage of 2000V, Temperature of 600°C, Gas 1 and 2 of 60psi. The transitions monitored were m/z 160/142 and 160/124 for pregabalin and m/z 222/107 and 222/121 for tapentadol. The assay was shown to be accurate and precise with %CV and % accuracy within ±15% of nominal across the full linear range (1ng/mL to 1000ng/mL). Estimated LOD for pregabalin was 100pg/mL and for tapentadol was 10pg/mL. Keywords: Liquid Chromatography-Tandem Mass Spectrometry, Pregabalin, Tapentadol

SOFT 2010 Annual Meeting Richmond, VA
P17 Catchin’ Some ZZZ’s: LC-MS/MS Analysis of Zolpidem, Zopiclone, Zaleplon, and Ramelteon Tracy A. McKinnon*, Dustin W. Smith and Wendy C. Bell. South Carolina Law Enforcement Division, Columbia, SC It is estimated that approximately one-third of the general population is affected by insomnia, while 10-15% of adults endure chronic insomnia. Sedatives, hypnotics, antidepressants, and antihistamines, among others, have been widely available either by prescription or over-the-counter for decades to help sufferers combat this debilitating medical condition. Over the past two decades, the “Z Drugs” (Zolpidem in 1993, Zopiclone in 1994, and Zaleplon in 1999) were approved for use as GABAA-binding sedative-hypnotics in the United States for the short-term treatment of insomnia. More recently, Ramelteon (in 2005), a selective melatonin receptor agonist, was introduced for the long-term management of insomnia. Due to the inherent nature of these medications to induce and prolong sleep as well as their possible CNS interactions, particularly of the Z Drugs, this group is of extraordinary interest in both human performance and postmortem forensic toxicology cases. There has been relatively limited literature dealing with the analysis of this class of drugs, quite possibly due to the low limits of detection necessary for qualitative and quantitative determinations. Here, a liquid chromatography-tandem mass spectrometry method is described for the quantitation and confirmation of Zolpidem, Zopiclone, Zaleplon, and Ramelteon in most matrices encountered in a forensic toxicology laboratory. Blood, urine, tissue homogenates, bile, gastric, and ocular samples (1-mL aliquots) were spiked with a mix of deuterated internal standards. After pre-treatment, the samples were extracted using United Chemical Technologies CLEAN SCREEN DAU solid phase extraction columns, collecting both the acidic/neutral and basic fractions for instrumental analysis. The combined fractions were then evaporated and transferred to high-recovery sample vials and then reconstituted in 150 μL of 0.1% formic acid for LC-MS/MS analysis. Analyses were performed on a Varian ProStar® HPLC with a Model 410 Autosampler coupled to a Varian 1200L Quadrupole MS/MS. Injections of 25 μL were made onto a Waters Symmetry® 3.5 micron 2.1 x 150 mm C8 column with a Waters Symmetry® 3.5 micron 2.1 x 10 mm guard column, which were held isothermally at 35°C using the integrated Varian column oven. The mobile phase was established as A: 0.1% formic acid in deionized/distilled water and B: methanol with a flow of 0.200 mL/min. The initial solvent gradient held at 30% B for 2.0 minutes, ramped to 95% B by 15.0 minutes (where it held for 2.5 minutes), then returned to initial conditions for a total run time of 22.0 minutes. This method provides excellent linearity from 1.0 ng/mL to 500 ng/mL with correlation coefficients (r2) greater than 0.999 for each analyte. The limits of detection for Zolpidem, Zopiclone, Zaleplon, and Ramelteon are 0.20, 0.50, 0.50, and 0.30 ng/mL, respectively, and the limits of quantitation are 0.20, 1.0, 0.70, and 0.90 ng/mL, respectively. Extraction efficiency, evaluated in blood only, at 2.5, 25, and 250 ng/mL ranged from 99% - 117% for all four analytes. Ion suppression studies revealed that there actually tended to be enhancement at the low- and mid-range quality control concentrations and only negligible suppression at the high concentration for blood. Ion suppression in gastric samples was greatest at the low- and mid-range concentrations, and generally less than 20% in the other matrices, while enhancement was seen in all matrices at the 250 ng/mL control. Intraday and interday precision and accuracy was determined in blood only (CV < 9% for all compounds, accuracy ranged from 89% to 123% for all compounds, both intra- and interday). Keywords: Z Drugs, Zolpidem, Zopiclone, Zaleplon, Ramelteon, LC-MS/MS

SOFT 2010 Annual Meeting Richmond, VA
P18 LC-MS/MS Screening Via Spectra Library Search in a Large Scale Forensic Toxicology Study
Pierre-Alain Binz1,2*, Annette Jordan3, Roman Mylonas2, Yann Mauron2, Bernard Favrat3, Marc Augsburger3,4, Alexandre Masselot1,2 and Nicolas Budin2. 1Swiss Institute of Bioinformatics, Geneva, Switzerland; 2Geneva Bioinformatics (GeneBio) SA, Geneva, Switzerland; 3University Centre of Legal Medicine, Geneva and Lausanne, Switzerland; 4Swiss Center for Human Applied Toxicology, Geneva, Switzerland LC-MSMS combined with library search is an emergent screening method in clinics, forensic toxicology and food testing. Compared to GC-MS (EI spectra), LC-MSMS instrumentation generates heterogeneous fragmentation patterns and mass accuracy. Current dot-product based algorithms display strong limitations while facing this variability. In addition, currently available libraries do not cover the range of molecules of interest for each instrument. We are testing here the performance and robustness of the SmileMS algorithm in a large scale forensic toxicology study, using different spectral libraries generated with varying acquisition conditions. Overall ease of use and time spent on data evaluation are also considered. The study involves saliva samples from a cohort of 1015 randomly selected drivers. Toxicological analysis using LC-MSMS is performed on an AB SCIEX quadrupole – linear trap instrument. Fragmentation spectra are searched with SmileMS against a dedicated home-made Qtrap library (108 compounds) and others. A number of psychoactive substances and illicit drugs, including cocaine, amphetamines, benzodiazepines, antidepressors, opiates and neuroleptics are identified when searching the home-made library. Compared with a classical algorithm (Analyst1.4 and NIST MS Search), the X-Rank algorithm in SmileMS shows in general, but not only for these substances, a superior discrimination power and a better FP/FN rate (factor 3 both for FP and FN in favour of SmileMS). The algorithm is robust enough to confidently identify the same molecules in libraries generated from other instruments, as highlighted by those found when searching the NIST_msms library (made out of linear traps, Paul traps, Triple quadrupoles, QqTOFs and others). The overall ergonomy of the software allows for a drastically reduced time for processing and validation of the results compared with the classical algorithm approach. Keywords: LC-MSMS, Library Search, Drugs

SOFT 2010 Annual Meeting Richmond, VA
P19 Increasing Throughput by Multiplexing an LC-MS/MS Drug Screening Method Adrian M. Taylor*, Min Yang, David M. Cox and Doina Caraiman. AB SCIEX, Concord, Ontario, Canada LC/MS/MS has emerged as a reliable method to perform both screening and confirmation of drugs in urine without the setup requirements of immunoassay or the time-consuming sample preparation and derivatization required for GC/MS confirmation. Multiplexing LC systems, and synchronizing to a single MS, can generate the high throughput needed by modern day laboratories to analyze increasing numbers of samples but maintain or improve turn around times. An integrated multiplex system has been specifically designed to synchronize two LC systems and a mass spectrometer, allowing injection of samples into two LC streams in parallel. The most commonly used screening category for drugs of abuse, NIDA-5 (National Institute on Drug Abuse), includes Cannabinoids, Opiates, Amphetamines, Cocaine and Phencyclidine (PCP). In urine, the target drugs and/or metabolites are amphetamine, methamphetamine, PCP, codeine, morphine, benzoylecgonine, 6-monoacetylmorphine (6-MAM) and, (±)-11-nor-9-Carboxy-Δ9-THC (THC-COOH). A new method for rapid screening, confirming, and quantifying drugs of abuse in urine has been developed based on an integrated multiplex LC-MS system. Spiked urine calibrators were prepared using Surine negative control covering 20 to 20000 ng/mL concentration ranges for amphetamine, codeine, morphine, benzoylecgonine, 6-monoacetylmorphine and THC-COOH, and 2-2000 ng/mL for methamphetamine and PCP. Low and Mid quality controls were also prepared, 80 and 400 ng/mL respectively, for methamphetamine and PCP and 800 and 4000 ng/mL respectively for the other analytes. Sample preparation included a hydrolysis step and analyses of the resulting supernatant by LC/MS/MS. The two-stream integrated multiplex LC/MS/MS system used to detect, confirm and quantify drugs of abuse in urine consisted of a mass spectrometer, 2 autosamplers, 2 gradient LC pump systems, a shared column loading pump, a column oven, and switching valves for stream selection. All devices were controlled via the mass spectrometer software and device driver. The switching valves were controlled with precise timing to manage the flow path of each LC stream to perform injection loop loading and LC gradient elution. Targeted MS data acquisition was enabled by selecting a retention time window around the peaks of interest. Calibration curves were derived from peak area ratios (analyte/internal standard) using a least squares regression of the ratio versus the nominal concentration of the calibration curve standard. Deviations from the regression line were calculated by using the regression equation to back calculate the concentration at each calibration standard level. Concentrations of QC samples were also calculated from these regression curves, using the calculated peak area ratios. A quadratic regression type was used for amphetamine, benzoylecgonine, and 6-acetylmorphine with weighting factor of 1/X. A linear regression type was used for methamphetamine, PCP, codeine, morphine, and, (±)-11-nor-9-Carboxy-Δ9-THC with 1/X2 weighting factor where X is the concentration of a given calibration standard level. Calibration curves consisting of nine standard curve concentrations were constructed for each LC stream, both streams producing comparable results. Limit of Quantification (LOQ) of 2 ng/mL, for PCP and methamphetamine, and 20 ng/mL for all the other analytes were obtained. Most %CVs at the LOQ were below 10%, all within 15%. Accuracy at the LOQ ranged from 87 to 101%. Using the Multiplex LC-MS system in the NIDA-5 analysis, cuts out the time around the peaks of interest allowing this time to be spent performing the injector wash and preloading the next sample. The Multiplex LC-MS system therefore cuts the analysis time of the singleplex LC/MS/MS method in half. Keywords: High Throughput, Multiplex 2D-LC, Sample Analysis, LC-MS

SOFT 2010 Annual Meeting Richmond, VA
P20 A Dual Quantitative/Qualitative Screening Analysis for 32 Antidepressants and Metabolites in Human Urine by UPLC/TOF
Kevin G. Shanks*, Tim Dahn and Andrea R. Terrell. AIT Laboratories, Indianapolis, IN Few methods for antidepressant determination in urine provide the necessary sensitivity for drug facilitated sexual assault cases. SOFT’s recommended maximum detection limits for antidepressants in urine are 10 ng/mL; therefore, following SOFT’s guidelines, a novel method for the extraction and quantitative analysis of multiple antidepressant drugs and their metabolites in postmortem and clinical human urine specimens using ultra performance liquid chromatography with time of flight mass spectrometry (UPLC/ToF) is described. Additionally, the method is suitable for use as a qualitative screen for the presence of different antidepressants and metabolites. Deuterated internal standards and sodium bicarbonate buffer (pH 12) were added to 500 microliters of specimen. Hexane with 2% isoamyl alcohol was added and the specimens were vortex mixed and centrifuged at 3,500 RPM. The supernatant was evaporated to dryness under nitrogen and the residue reconstituted in 200 microliters of DI water and transferred to an autosampler vial. Seven microliters were injected on a Waters Acquity UPLC system coupled to a Waters LCT Premier XE time of flight mass spectrometer. The column was a Waters Acquity UPLC BEH C18, 2.1 x 100 mm, 1.7 µm particle size, held at 40˚C. Mobile phases consisted of 0.05% Formic Acid in DI water and Optima grade Acetonitrile. Initial mobile phase composition was 72% aqueous and 28% organic and a gradient elution was performed. The mass spectrometer was operated in W-optics mode over the mass range 50 - 600 amu. Capillary voltage was 3200 volts. Scans were completed in positive ionization mode; a lower aperture voltage scan was used for parent mass identification and a higher aperture voltage scan used to identify parent mass fragmentation by in-source collision induced dissociation (CID). Dynamic range enhancement (DRE) extended the linear range. The method was accurate, precise, and sensitive for the quantitation of amitriptyline, clomipramine, cyclobenzaprine, desipramine, doxepin, fluoxetine, imipramine, norclomipramine, nordoxepin, norfluoxetine, nortriptyline, paroxetine, and trimipramine. Calibration range for all quantitative analytes was 25 ng/mL – 500 ng/mL. Intra-run accuracy ranged from 85.0% - 111.5%; inter-assay accuracy ranged from 88.0% - 105.5 %. Intra-assay imprecision ranged from 0.7 - 8.7% CV; inter-assay imprecision ranged from 1.9% - 7.9% CV. Qualitative reporting of 2-hydroxydesipramine, 2-hydroxyimipramine, 10-hydroxyamitriptyline, 10-hydroxynortriptyline, bupropion, citalopram, cyclobenzaprine n-oxide, desmethylcitalopram, duloxetine, fluvoxamine, hydroxybupropion, mCPP, norsertraline, norvenlafaxine, paroxetine metabolite I, paroxetine metabolite II, sertraline, trazodone, and venlafaxine was also accomplished within the same analytical run. The method was applied to forensic postmortem cases, drug facilitated sexual assaults as well as clinical and therapeutic drug monitoring applications such as compliance monitoring for chronic pain treatment. Limits of detection (LOD) were generally 5 ng/mL or less. Compared to typical analytical methods for antidepressants in urine, this method has an expanded library of analytes, remarkable speed, sensitivity and specificity, and may be highly useful in a forensic or clinical laboratory. Keywords: Antidepressants, Urine, UPLC/TOF
SOFT 2010 Annual Meeting Richmond, VA
P21 Improved Blood Alcohol Analysis by Resolution of Previously Undetected Co-elution of Propanal with Ethanol
Kali Kullberg*, Chris Fernandez, Matthew Trass, Kory Kelly, Ngoc Nguyen, and Sky Countryman. Phenomenex, Torrance, CA Though the determination of alcohol abuse in drunk driving cases via Gas Chromatography (GC) is more reliable than the breathalyzer test, the analytical procedure is not infallible. Previous work has shown that the commonly used internal standard, n-propanol, can be formed by bacterial contamination in post-mortem samples. Recently another reason to avoid n-propanol has been discovered and that is the formation of Propanal in some blood samples. Propanal completely co-elutes with Ethanol using typical GC columns, which is why this problem might have previously gone unnoticed. This work provides a method for resolving Propanal from Ethanol for accurate BAC analysis. Due to the unique selectivity of the columns used, Propanal was separated on both columns using a simple 40C isothermal program and a flow of 7.5 mL/min. The retention times of Ethanol and were 1.53 and 1.91 minutes respectively on the Zebron ZB-BAC1, and 1.85 and 2.08 minutes respectively on the Zebron ZB-BAC2 column. This work also demonstrates how these columns separate additional compounds, such as t-Butanol, n-Propanol, and 2-Butanol, in order for labs to use an internal standard other than n-propanol. For the analysis, a calibration curve was prepared with analytes at concentrations of 0.025, 0.050, 0.100, 0.200, and 0.400 % in water (total volume) inside a 20 mL headspace vial. The concentration of internal standards in each sample was always at 0.100 %. Analysis of each sample was conducted on an Agilent 6890 gas chromatograph equipped with an Overbrook Scientific Inc. (HT-200) autosampler and two capillary GC columns (Zebron ZB-BAC1 and ZB-BAC2). The columns were installed such that they would lead from the same injection port and guard column and split off into two separate flame ionization detectors. Linearity, LOD, LOQ, and reproducibility were also evaluated for the columns. The calibration curve for all compounds was found to be linear with correlation coefficients (R2) within a range of 0.9980 –0.9998. The agreement in quantitative results between each of the three possible internal standards was very good, indicating that either t-Butanol or 2-Butanol would be suitable alternatives to n-Propanol for method internal standards. Method LOD and LOQ were determined to be less than 0.0003 % and 0.001 % respectively for all compounds. These levels are below the required detection limits of the method, indicating that sensitivity requirements were met. This work demonstrates how columns with unique selectivities, the Zebron ZB-BAC1 and ZB-BAC2, can resolve Propanal from Ethanol. It also demonstrates that these columns can separate t-Butanol, n-Propanol, and 2-Butanol, making it possible for use of any of these compounds as an internal standards. Keywords: GC, Blood Alcohol, Ethanol, Propanal, Propanol

SOFT 2010 Annual Meeting Richmond, VA
P22 Improved Method for the Analysis of Tramadol and its N and O-desmethyl Metabolites in Urine by GC/MS
Paul N. Dooley*, Carl E. Wolf and Alphonse Poklis. Department of Pathology, Virginia Commonwealth University, Richmond, VA Tramadol (Ultram), a narcotic opioid analgesic available since 1977, has increased in use in the treatment of non-malignant chronic pain. Past studies have included analysis of tramadol and / or its metabolites N-desmethyl tramadol and / or O-desmethyl tramadol. N-desmethyl tramadol is present in urine in the unconjugated form, where O-desmethyl tramadol is present in the urine as unconjugated and conjugated (glucuronide and sulfate) form. Thus, the reporting of O-desmethyl metabolite concentration in urine would be arbitrarily low. The purpose of this study was to develop and validate a GCMS method for the analysis of tramadol and its N and O-desmethyl metabolites in urine. The study also involved improving the poor chromatographic resolution of these analytes, due to the free hydroxyl group on the cyclohexyl ring of the molecule. Tramadol, N and O-desmethyl metabolites, and 50 ng of protriptyline (internal standard) were extracted from 1.0 mL of ��glucuronidase hydrolyzed urine with 0.2 mL of 2N sodium hydroxide and 0.5 mL of chloroform: isopropanol (9:1). The chloroform: isopropanol layer was isolated and evaporated to dryness. Propionic anhydride derivatives were prepared of the analytes, which were then analyzed by GC/MS. Chromatographic separation was achieved using a DB-5 capillary column (30 m x 0.32 mm, 0.25 um). Ions monitored for tramadol were 58, 188, 319 m/z, for N-desmethyl tramadol were 44, 276, 305 m/z, for O-desmethyl tramadol were 58, 174, 305 m/z, and for protriptyline, 191 and 319 m/z. Concentrations were determined using calibrators over the range of 50 - 5000 ng/ml for tramadol and 100- 10,000 ng/ml for the N and O-desmethyl metabolites. The linear regression for all calibration curves had r2 values ≥ 0.99 The limit of detection (LOD) was 25 ng/ml for tramadol and 50 ng/ml for the N and O-desmethyl metabolites; limit of quantitation (LOQ) was 50 ng/ml for tramadol and 100 ng/ml for the N and O-desmethyl metabolites. Within run precision was demonstrated at 200 ng/ml and 1000 ng/ml with CV < 15%. The method was found to be robust and reliable for the routine quantitative analysis of tramadol and its N and O-desmethyl metabolites in urine. Keywords: Urine, Tramadol, N-desmethyl Tramadol, O-desmethyl Tramadol, GC/MS
SOFT 2010 Annual Meeting Richmond, VA
P23 Multi-dimensional GC/MS Analysis of Δ-9-THC and Primary Metabolites in Human Whole Blood, Serum, and Plasma
Alex Maggitti*, Matthew McMullin and William Ofsa. NMS Labs, Willow Grove, PA Testing for Δ-9-THC and primary metabolites (11-OH-THC and THC-COOH) in blood, serum, and plasma is a known challenge in forensic toxicology. Our laboratory met this challenge by implementing 2D-GC/MS in conjunction with a new technology called LTM (Low Thermal Mass) GC columns. The GCxGC/MS system is configured with a GC (Agilent 7890A), MSD (Agilent 5975C), Agilent dean switch, Agilent Auxiliary Electronic Pressure Control (EPC), Flame Ionization Detector (FID), Agilent Low Thermal Mass (LTM) module, and two Agilent LTM columns (DB17MS and DB1MS). For evaluation the same sample and patient specimen extracts (~300) were analyzed on the current GC/MS system and the described GCxGC/MS system. Following direct comparison, we found the GCxGC/MS system drastically improved method selectivity, sensitivity, and reproducibility. Because of the system’s ability to “heart-cut” analytes of interest from one LTM column to the other and focus then separate the analytes on two capillary column stationary phases, we were able to increase the signal to noise ratio. After evaluating our lowest calibrator for each analytes least abundant qualifying ion we saw in an increase in the signal to noise ratio from ~ 10:1 (GC/MS) to ~ 100:1 (GCxGC/MS). This in-turn improved the limit of detection (LOD) by an order of magnitude (from ~1.0 ng/mL for THC and 5.0 ng/mL for 11-OH-THC and THC-COOH to ~0.1ng/mL and 0.5 ng/mL, respectively). Other benefits of this configuration including heart-cutting and back-flushing were made possible by Agilent’s dean switch and Auxiliary EPC. Both of these tools prevent unwanted sample extract from reaching the LTM columns and the detector’s ion source. As a result maintenance including; the replacement of columns and cleaning or replacing the ion source has been required less frequently. Because of the described innovations in gas chromatography, development and implementation of a selective, sensitive, and cost effective method for the analysis of cannabinoids in a variety of biological matrices has been realized. Other method development work has been performed using 3D-GC/MS instead of the described 2D-GC/MS. By adding a second dean switch and capillary column (DB5MS) in the GC oven we were able to add a third dimension of analyte focusing and separation to the analytical method. With these minor adjustments to the platform we now have the ability to perform heart-cuts from a column in the GC oven to the first LTM column and again from the first LTM column to the second. Improvements include greater consistency in chromatography and the reduction of interferences. As a result, sample preparation time can be reduced from ~ 4 hrs to ~2 hrs per sample batch, and the required sample volume reduced from 1.0 mL – 0.50 mL. Developmental work using the described GCxGCxGC/MS method has great potential to improve the identification and quantification of cannabinoids in serum, plasma, whole blood, and tissue specimens following validation. Keywords: Multi-dimensional GC, Low Thermal Mass (LTM) Capillary Columns, Cannabinoids

SOFT 2010 Annual Meeting Richmond, VA
P24 Revalidation of Sypathomimetic Amines and Benzoylecgonine Due to SAMHSA’s 2010 Revised Workplace Drug Testing Program Guidelines
Matthew Lambing*, Eric Phillips and Fergus Keenan. Thermo Fisher Scientific, Austin, TX The United States Substance Abuse and Mental Health Services Administration (SAMHSA) released a revision to the Mandatory Guidelines for Federal Workplace Drug Testing Programs, scheduled to become effective in 2010. As part of the new guidelines, multiple changes have been made for the confirmation and quantification of both the amphetamine-class and benzoylecgonine urine analyses. Because of these revisions, forensic toxicology laboratories that adhere to SAMHSA guidelines must revalidate methodology to incorporate these changes. In addition to SAMHSA’s previously published guidelines for the analysis of amphetamine and methamphetamine, three amphetamine-analogue drugs have been added to the panel: 3,4-methylenedioxyamphetamine (MDA), 3,4 methylenedioxymethamphetamine (MDMA), and 3,4-methylenedioxyethylamphetamine (MDEA). The confirmatory cutoff concentration level for the regulated amphetamines will be lowered from 500 ng/mL to 250 ng/mL. SAMSHA has also lowered the confirmatory cutoff concentration level for benzoylecgonine to 100 ng/mL from the pervious level of 150 ng/mL. Routine forensic toxicology methods for the confirmation and quantification of the amphetamine-class drugs and for benzoylecgonine in human urine has been developed using the Thermo Scientific ISQ Single Quadrupole GC-MS system. Sample preparation was performed on collected urine using solid phase extraction and derivatized (Amps = TFAA and BE = HFIP/PFPA). Confirmation and quantification were performed on the ISQ™ single quadrupole GC-MS operated in selected ion monitoring (SIM) mode. Identification of the drugs were based on their retention times and ion ratios. A 15 m x 0.25 mm x 0.25 µm TraceGOLD TG-5MS (Thermo Fisher Scientific) column was used for chromatographic separation. For each analyte tested, linearity was demonstrated between 25-25,000 ng/mL for the amphetamine-class drugs, and 10-12,500 ng/mL for benzoylecgonine, with correlation coefficient (R2) values of 0.9990 or better based on the one-point calibration. Multiple injections at the 40% and 125% QC levels demonstrated coefficients of variation (CV) of 5% or lower or each compound tested. Interference was not seen from coeluting matrix compounds. The methodology described offers a means for a forensic toxicology laboratory to confirm and quantify the 5-panel sympathomimetic amines and benzoylecgonine in human urine by the newly revised SAMHSA guidelines. Keywords: Benzoylecgonine, Sympathomimetic Amines, SAMSHA

SOFT 2010 Annual Meeting Richmond, VA
P25 Rapid and Reliable TOF Screening Using the Novel Data Acquisition Mode - MSE Michelle Wood*. Waters Corporation, MS Technologies Centre, Manchester, UK Objective: To investigate the utility of the innovative data acquisition mode - MSE, for the screening of toxicants in human samples. Introduction: Laboratories are frequently required to perform broad screening techniques on complex biological samples in order to identify drugs of abuse and other toxicants. In recent years there has been an increased interest in the use of Time-of-Flight (TOF) technology for this purpose, owing to the high level of specificity offered by exact mass data. Whilst exact mass libraries can be automatically generated without reference material i.e., from molecular formulae, a lack of supporting information can lead to false positive results in the analysis of authentic samples and can hinder data-review. Consequently, wherever possible, additional information should be used to increase confidence in drug identification. MSE is a novel acquisition mode which facilitates collection of confirmatory exact mass fragment ions. Methods: Drug standards were separated using an ACQUITY UPLC® system fitted with an ACQUITY UPLC HSS C18 column (2.1 x 150mm). The column was maintained at 50oC and eluted with a gradient of ammonium formate (A) and acetronitrile (B); initial conditions were 87% B, increasing to 95% B. The total run-time was 15 min. A XevoTM G2 QTOF mass spectrometer (Waters) was used in MSE mode which involves the rapid alternation between two functions: the first, acquired at low energy, provides exact mass precursor ion spectra; the second, at elevated energy (ramp 10-40eV), provides high energy exact mass of the fragment ions for additional confirmatory purposes. Authentic urine samples were extracted using liquid:liquid extraction performed under basic conditions or simply diluted. Results: A database comprising more than 700 toxicologically relevant analytes/metabolites was developed. The database includes exact mass of the precursor ion, retention time (RT) and is supplemented with specific exact mass fragment ion information. MassFragmentTM was used to confirm the validity of the fragment ions and to assign logical molecular structures prior to their addition to the database. Thirty authentic samples were analysed using the developed method and the results compared to those obtained by the REMEDi HS drug profiling system (Bio-Rad). These data will be presented and discussed. In summary MSE identified more significantly more analytes than REMEDi system. A combination of several other screening techniques including GC-MS and HPLC-DAD were subsequently used to verify these additional findings as true positives. The superior sensitivity of the developed method meant that even with the dilution-only samples, 100% of analytes identified by REMEDi were detected. The increased specificity of the method led to significant improvements in the ease of data review and reporting. Conclusions: A database for more than 700 analytes has been developed. TOF data is acquired using a novel mode i.e., MSE. Identification is based on RT and an exact mass ‘fingerprint’ which includes exact mass of the precursor ion and up to four fragment ions. The fragmented data adds confidence in identification, helps to differentiate between isobaric species and greatly improves both the ease and speed of data reporting. Keywords: Toxicological Screening, QTOF, Novel, MSE

SOFT 2010 Annual Meeting Richmond, VA
P26 Analysis of Case Study Urine Samples for Presence of Drug Facilitated Sexual Assault (DFSA) Drugs by Gas Chromatography-Time of Flight Mass Spectrometry (GC-TOFMS)
Joe Binkley and John Heim*. Life Science and Chemical Analysis Centre, LECO Corporation, St. Joseph, MI The use of drugs to facilitate sexual assault is on the rise. Alcohol, illicit drugs, and over the counter medications have been detected in a high percentage of urine samples collected from victims of alleged sexual assaults. In some cases these substances are willingly taken by the victims and in others they are administered to facilitate a sexual assault. By law, an individual incapacitated by drugs or alcohol is unable to consent to sexual intercourse whether the substances were taken voluntarily or otherwise. Therefore, detection of a DFSA drug in a victim’s system would aid in prosecution of those guilty of these crimes. A GC-TOFMS method was developed for analysis of DFSA drugs in urine samples submitted from sexual assault cases. The method is shown below. Injection: 1µL, splitless at 280°C Column: Phenomenex ZB-DRG-1, 10m x 0.18mm x 0.18µm film Carrier: He, ramped flow Oven: 40°C (hold 2 min), 50°C/min to 280°C (hold 10 min) TOFMS: EI @ -70eV, Source Temp: 300°C, Acquisition Rate: 20 spectra/second, Saved Mass Range: 30-500 m/z Positive control urine samples spiked with various drug classes were analyzed. Once the analytes of interest were identified using the NIST mass spectral search database, they were used to create a reference table within the data processing software. The reference feature of the data processing software allows mass spectral and retention time match criteria to be set. This reference was then used to process case study samples for the presence of DFSA drugs. This data shows successful use of GC-TOFMS to screen urine samples from DFSA cases for the presence of several drug classes including but not limited to amphetamines, anesthetics, anti-depressants, benzodiazepines, cocaine, methadone, methaqualone, opiates, phencyclidine (PCP), and sedatives. There were twenty-four case study samples analyzed using the GC-TOFMS method developed. Of these samples, sixteen tested positive for the presence of at least one drug that would fit the DFSA drug profile. The ability of TOFMS to provide non-skewed full mass range spectra at high acquisition rates allows for optimal performance of mass spectral deconvolution algorithms. These deconvolution algorithms were critical to the automated processing which significantly reduces the data analysis time burden placed on the analyst. Keywords: Drug Facilitated Sexual Assault, GC-TOFMS, Deconvolution

SOFT 2010 Annual Meeting Richmond, VA
P27 Determination of Illicit Drug Cutoff Values in a Pain Patient Population Robert West*, Bridgit Crews, Sergey Latyshev, Charles Mikel, Perla Almazan, Amadeo Pesce, Cameron West and Murray Rosenthal. Millennium Research Institute, San Diego, CA Background: Laboratories testing for the illicit drugs cocaine, marijuana, and methamphetamine use cutoffs established by the Substance Abuse and Mental Health Services Administration (SAMHSA). It is important to know whether these cutoffs capture most of the illicit drug use. The pain patient population is well-known to have a significant incidence of use of these illicit drugs. This offers an opportunity to evaluate whether the SAMHSA-derived cutoffs are appropriate or whether they are set too high. Purpose: To use quantitative urine drug excretion data determined by liquid chromatography–tandem mass spectrometry (LC-MS/MS) analysis (Mikel et al Ther Drug Monit. 2009. 31: 746-748) to calculate cutoffs needed to best determine patient illicit drug use. Methods: An Agilent 1200 series binary pump SL LC system, well plate sampler, thermostatted column compartment, paired with an Agilent QQQ mass spectrometer and Agilent Mass Hunter software were used for analysis. Chromatographic separation was performed using an acetonitrile formic acid water gradient running at 0.4 mL/min and a 2.1 x 50 mm, 1.8 �m Zorbax SB C18 column. Mobile phase A = 0.1% formic acid in water, B = 0.1% formic acid in acetonitrile, and column temperature was set to 50 ° C. The Agilent 6410 Triple Quadrupole mass spectrometer (QQQ) was operated in the ESI positive mode. MRM mode was used for quantitation. The optimized parameters were as follows: gas temperature, 350° C; drying gas, 12 L/min; nebulizer gas (nitrogen), 35 psi; capillary voltage, 3000 V; Dwell time (msec), 50; fragmentor voltage, 60. Two transitions were used for each analyte: Methamphetamine-D5 155.1 → 92.1 Methamphetamine 150.1 → 119.1; 150.1 → 91.1 Benzoylecgonine-D3 293.1 → 171.1 Benzoylecgonine 290.1 → 168.1; 290.1 → 105 COOH-THC-D3 348.2 → 330.2 COOH-THC 345.2 → 327.2; 345.2 → 299.2 Values at 50% of the lower limit of quantitation for all the analytes tested were used in the calculations. The LLOQ were the following: COOH-THC, 15 ng/mL; Benzoylecgonine, 50 ng/mL; Methamphetamine, 100 ng/mL. CVs at the lower limit of quantitation were less than 20%. A non-parametric 2.5% estimator was used to establish each cutoff. A second, nonparametric calculation used normalized creatinine values, resulting in the excretion being expressed as nanograms of excreted drug per gram of creatinine. Results: Cutoffs established using these calculations included at least 95% of the data for the illicit drugs (number of samples, LLOQ and CV in parentheses). Cocaine metabolite (6,496, 50 ng/mL, 5%), marijuana (17,782, 15 ng/mL, 14.1%) methamphetamine (1,691, 100 ng/mL 6.8%) Conclusions: These cutoffs were significantly lower than those suggested by SAMHSA and may better identify patients in chronic opioid therapy for pain using these three illicit drugs. The limitation is that only values one-half of our lower limits of quantitation were used. Keywords: Cutoffs, LC-MS/MS, Illicit Drug Use

SOFT 2010 Annual Meeting Richmond, VA
P28 A Comparison of the Linearity, Precision, and Accuracy from the Analysis of Drugs of Abuse in Urine Using Two LC-MS/MS Platforms
Cynthia M. Lewallen*, Peter R. Stout, Nichole D. Bynum, Melanie A. Rehder Silinski, John M. Mitchell, Michael R. Baylor and Jeri D. Ropero-Miller. RTI International, Research Triangle Park, NC Introduction: On November 25, 2008, the U.S. Department of Health and Human Services posted a final notice in the Federal Register authorizing the use of liquid chromatography/tandem mass spectrometry (LC-MS-MS) and other technologies in federally regulated workplace drug testing (WPDT) programs. To support this change, it is essential to explicitly demonstrate that minimally accepted criteria established for LC-MS-MS as a technology can produce results by multiple LC-MS-MS platforms. This effort compliments other work comparing results to gas chromatography-mass spectrometry (GC-MS), the long-accepted standard in confirmatory analytical technologies for drugs of abuse. Two particular configurations that are gaining popularity among forensic laboratories are a triple quadrupole (QQQ) and a hybrid triple quadrupole/linear ion trap (QTRAP). Both systems have the ability to detect and quantify drugs at the sub-nanogram level, and the QTRAP has the added capabilities of an ion trap for drug/metabolite characterization. Objective: The goal of this project is to compare the Agilent 6410 QQQ LC-MS-MS system (Santa Clara, CA) and the ABSciex 4000 QTRAP (Foster City, CA) LC-MS-MS system based on a series of manufactured control urine validation samples (n= 10 for each analyte) containing amphetamine, methamphetamine, (+/-)-3,4-methylenedioxyamphetamine, (+/-)-3,4-methylenedioxymethamphetamine, (+/-)-3,4-methylenedioxyethylamphetamine, phencyclidine, benzoylecgonine, codeine, morphine, 6-acetylmorphine, and (±)-11-nor-9-carboxy-Δ9-tetrahydrocannabinol at concentrations ranging from 10% to 2000% of cutoffs under federally regulated WPDT programs. Methods: Samples were manufactured at RTI International (Research Triangle Park, NC) using stock materials separate from those used for controls and calibrators. The drugs of interest were extracted by solid phase extraction and three replicate analyses were analyzed first by the Agilent QQQ and then by the ABSciex QTRAP. Statistical tests conducted using Microsoft Excel 2007 (Seattle, WA) included calculation of average, standard deviation, % CV and linear regression analyses with subsequent analysis of variance (ANOVA) of the regression fit. For these tests, significance was assigned at the p < 0.05 level. Results: Results indicated that analyses conducted on the two LC-MS-MS platforms produced nearly identical results for precision, accuracy and linearity urine validation samples. A few statistically significant differences were observed at high concentrations of target compounds, likely due to differences in optimization rather than instrument performance. Both instruments were able to reliably reproduce product ion ratios, but the values of the ratios produced by the two instruments were significantly different. Conclusions: Both the Agilent QQQ and the ABSciex QTRAP mass spectral platforms performed acceptably and consistently during a linearity, precision, and accuracy study for urine drugs of abuse analytes included in U.S. federally regulated workplace drug testing programs. Keywords: LC-MS/MS, Workplace Drug Testing, Drugs of Abuse, Validation, QTRAP, QQQ
SOFT 2010 Annual Meeting Richmond, VA
P29 Utility of “Wrong-Way-Round” ESI-MS/MS in the Quantification of Amphetamine, Methamphetamine, MDMA, Ephedrine, and Pseudoephedrine in Human Whole Blood and Serum Samples
Joseph F. Ervin*, Tim Dahn and Andrea R. Terrell. AIT Laboratories, Indianapolis, IN Wrong-way-round” ESI refers to an ionization technique contrary to conventional practice, an example being the use of a basic mobile phase to ionize basic drugs. In an application of this concept, a procedure for the rapid extraction and quantification of amphetamine, methamphetamine, MDMA, ephedrine, and pseudoephedrine from human whole blood and serum using protein-precipitation (PPT) extraction and ultra performance liquid chromatography coupled with tandem mass spectrometry (UPLC/MS/MS) was developed. Amphetamines are a class of sympathomimetic amines that comprises a number of legal and illicit drugs. Amphetamine, the lead drug in the class, has been used since 1935 for its stimulant effects in the treatment of obesity, narcolepsy and hypotension. Methamphetamine is a methylated derivative of amphetamine and the d-isomer has received notoriety as a drug of abuse. Both amphetamine and methamphetamine are Schedule II controlled substances. MDMA (Ecstasy) is a Schedule I ring-substituted derivative of methamphetamine used as a recreational drug-of-abuse. Ephedrine and pseudoephedrine are both naturally-occurring substances found in some Ephedra-species plants and are used in over-the-counter treatments for upper-airway congestion and constriction. 100 µL of sample (to which appropriate deuterated internal standard had been added) was precipitated using 1 mL of cold acetonitrile. A solution of 1% HCl in methanol was added to the supernatant prior to evaporation under nitrogen. This step was essential to convert the analytes to their HCl salts to prevent evaporation with the solvent. The samples were then reconstituted and injected on a Waters Acquity UPLC using a gradient elution of ammonium formate (pH 11.1) and acetonitrile and a BEH C18 2.1x50mm column. Mass spectrometric selective detection was provided by a Waters TQD tandem mass spectrometer operating in ESI+ MRM mode. Previous methods have required extensive extractions (such as SPE), longer total run-times, derivatization, did not separate the ephedrine/pseudoephedrine pair, or were unsuitable for post-mortem samples. By using a basic mobile phase (pH 11.1) with UPLC the analytes showed enhanced retention and resolution on the column (vs. using a 0.1% formic acid mobile phase) allowing for separation of ephedrine and pseudoephedrine in a short run-time - 3.5 minutes total run-time per sample. It also allowed for better separation of analytes from matrix interferences often seen in post-mortem matrices. Linearity over the range 50 ng/mL to 2000 ng/mL (25-1000 ng/mL for ephedrine) was established using deuterated analogs as internal standards. The methodology showed very good intra-run precision in serum (QCs spiked at 200 and 800 ng/mL [100 and 400 ng/mL for ephedrine]) with %CV values ranging from 0.9 – 9.8% for all analytes. Inter-run precision experiments produced %CV values ranging from 3.9 - 7.5% for all analytes. In our lab, the reported method proved to be a rapid and robust assay for the quantitation of amphetamine, methamphetamine, MDMA, ephedrine, and pseudoephedrine in forensic applications and compliance monitoring. Keywords: Blood, UPLC/MS/MS, Amphetamines

SOFT 2010 Annual Meeting Richmond, VA
P30 A Quantitative UPLC/MS/MS Assay for 21 Benzodiazepine Drugs, Zolpidem and Zopiclone in Serum
Mark Roberts*1, Stephanie J. Marin2, Gwen A. McMillin 2,3 and Michelle Wood1. 1 Waters Corporation, MS Technologies Centre, Manchester, UK; 2ARUP Institute for Clinical and Experimental Pathology, Salt Lake City, UT; 3Department of Pathology, University of Utah School of Medicine, Salt Lake City, UT Introduction: The analysis of benzodiazepines is an important issue for the forensic toxicologist. These central nervous system depressants are amongst the most frequently prescribed drugs in the western world for the symptomatic treatment of anxiety and sleep disorders. Long term use can lead to tolerance, dependence and withdrawal effects. They are often used recreationally in combination with other drugs particularly cocaine and heroin. Benzodiazepines have also been reported in drug-facilitated crimes. Objectives: To quantitate 21 benzodiazepines, Zolpidem and Zopiclone in human serum and plasma using a UPLC/MS/MS method. Methods: Following addition of deuterated internal standards, samples were extracted by liquid/liquid extraction and under basic conditions. After drying down and reconstitution in 80:20 mixture of water and methanol, the extracted analytes were separated on a UPLC system (Waters). An ACQUITY UPLC BEH C18 column (2.1 x 100mm, 1.7µm) was used, eluted with a gradient of 0.1% formic acid in water and 0.1% formic acid in methanol. The chromatographic run-time was 7.5 min. The mass spectrometer used for detection was a TQD (Waters). Two MRM transitions i.e., qualifier and quantifier transitions, were monitored for each analyte; one transition was used for each of the deuterated analogues. Authentic serum and plasma samples were analysed by the UPLC/MS/MS method and calculated concentrations for drugs detected were compared to results obtained using a published method based on HPLC/MS/MS for 13 analytes with SPE sample preparation [1]. Results: The new UPLC/MS/MS method was evaluated for intra- and inter-day accuracy and precision, linearity, recovery, matrix effects and extracted sample stability. Over a five day study the average r2 values for linearity from 1 to 1,000 ng/mL were all above 0.995 apart from alpha-hydroxy triazolam which was 0.975 for 1-100 ng/mL. The intra-day and inter-day % RSD values were better than 15% and the % deviation from the expected concentration values were less than +/- 11%. Recoveries ranged from 62 to 89% and matrix effects ranged from -28% to +6%. The limit of detection (LOD) obtained from this method were 1 ng/mL for all compounds except lorazepam, nordiazepam, oxazepam and temazepam which were 5 ng/mL. Tolerances for ratios of quantifier to qualifier ions were set to 15% for all analytes. For authentic samples (n = 48) there was excellent correlation between the UPLC/MS/MS results and previous results by HPLC/MS/MS with r2 values of above 0.98. Conclusions: This UPLC/MS/MS method is a suitable technique to analyse a broad range of benzodiazepines in human serum and plasma and offers fast, reliable and sensitive results. The new method permitted the analysis of a further nine analytes in comparison to the previously-published method. References: [1] Marin S. J. et al. Journal of Analytical Toxicology (2008) 32: 491-498 Keywords: Benzodiazepines, Serum, UPLC/MS/MS

SOFT 2010 Annual Meeting Richmond, VA
P31 Simultaneous Determination of Xylazine, Morphine, Codeine, 6-Monoacetylmorphine, Cocaine and Benzoylecgonine in Postmortem Blood by
Ultra Performance Liquid Chromatography/Tandem Mass Spectrometry (UPLC-MS/MS)
Kazandra Ruiz Colón*1, Margarita Meléndez2, María S. Conte Miller2 and Joseph Bloom Oquendo1. 1Medical Sciences Campus-University of Puerto Rico; 2Institute of Forensic Sciences of Puerto Rico, Puerto Rico Xylazine commonly call “the horse anesthetic” in Puerto Rico, has been found in combination with morphine and 6-monoacetylmorphine (6-MAM), codeine, cocaine and benzoylecgonine (BE) in 9 postmortem cases between 2003 and 2007 at the Institute of Forensic Sciences (IFS). In all those cases xylazine was determined to be the cause of death. Xylazine is marketed as a veterinary drug, used as a sedative, analgesic and muscle relaxant for large animals, such as deer, ruminants and horses. Xylazine is not approved for human use because it has been proven harmful. Currently, three separate analyses are required to determine all the aforementioned drugs at the IFS’s toxicology laboratory. The analyses for morphine, 6-MAM, codeine, cocaine and BE were performed using solid phase extraction (SPE) and GC/MS. The analysis of xylazine was performed using protein precipitation and LC/MS. Procedures are labor-intensive and time consuming due to sample preparation and a great amount of sample was used. In order to simultaneously determine all drugs, a selective, rapid and sensitive UPLC-MS/MS method was developed using just 250 µL of postmortem blood. Postmortem blood was pretreated for protein precipitation with acetonitrile. The separation was performed on an Acquity UPLC HSS T3 1.8 µm 2.1 x 50 mm column with a mobile phase consisting of 0.1% formic acid in water and acetonitrile at a flow rate of 0.5 mL/min. The total run time was 2.5 min, with a limit of detection of 1 ng/mL for cocaine and xylazine, 2 ng/mL for 6-MAM, and 10 ng/mL for morphine, codeine and BE. Keywords: Xylazine, Postmortem, UPLC/MS/MS

SOFT 2010 Annual Meeting Richmond, VA
P32 An UPLC-HILIC-MS/MS Method for the Quantitative Analysis of Nicotine, Five Nicotine Metabolites and Two Minor Tobacco Alkaloids in Neonatal Serum
Gordon J. Murray1*, Shannon M. Nielsen1, Robert M. Silver2, Michael W. Varner2 and Diana G. Wilkins1. 1University of Utah, Center for Human Toxicology, Salt Lake City, UT; 2University at Utah Hospital, Department of Obstetrics and Gynecology, Salt Lake City, UT
Objectives: To develop and validate a sensitive and specific ultra performance liquid chromatography-hydrophilic interaction chromatography-tandem mass spectrometry (UPLC-HILIC-MS/MS) method for the simultaneous quantification of nicotine (NIC), cotinine (COT), trans-3-hydroxycotinine (3-HC), norcotinine (NCOT), trans-nicotine-1’-N-oxide (NNO), nornicotine (NNIC), anatabine (AT) and anabasine (AB) in neonatal serum. Method: Deuterated internal standard solution (NIC-d3, COT-d3, 3-HC-d3, NCOT-d4, NNO-d3, NNIC-d4, AT-d4 and AB-d4) was added to 250 µL of human serum (5 ng/mL). 750 µL of 2 % aqueous formic acid was added, followed by vortexing. The diluted serum sample was then subjected to solid-phase extraction (SPE) using Oasis® MCX (1 mL, 30 mg) strong cation exchange cartridges (Waters® Corporation, MA) and the extracts were reconstituted in 75 µL of MeCN:MeOH (75:25, v/v). Reconstituted extracts were injected in full-loop mode (5 µL loop) onto a Waters Acquity® BEH-HILIC column (50 mm x 2.1 mm, 1.7 µm, Waters, MA) with a gradient system consisting of 10 mM ammonium formate with 5 % methanol (pH 4.0), and acetonitrile at a flow rate of 0.4 mL/min. Two MRM transitions were monitored for each analyte with the exception of NCOT (which produced only one fragment ion) using a Quattro Premier XE™ triple quadrupole mass spectrometer (Waters® Corporation, MA) with MassLynx™ v 4.1 software. Validation: The method was fully validated to include an evaluation of linearity over the expected range for each analyte, limit of quantification (LOQ), specificity, extraction recovery, matrix effects, matrix stability, and intra- (n=5) and inter-assay imprecision (n=15) for 3 batches. Results: The calibration curves were calculated using linear regression with a 1/ᵡ weighting (all R2 ≥ 0.99). The selected range for each analyte in serum was: COT (0.25-100 ng/mL); 3-HC, NNO (0.50-100 ng/mL); NIC, AT (0.75-100 ng/mL); and NCOT, NNIC, AB (1-100 ng/mL). Intra- and inter-assay imprecision were < 20 % for all analytes. The mean extraction recovery (n=5) in serum ranged from 78.0 – 104.3% for all analytes over the three quality control (QC) levels examined. Furthermore, matrix effects (n=5) resulting in either ion suppression or enhancement were calculated to be < 20 %. Method sensitivity and specificity was demonstrated through the high-throughput analysis of 2,131 neonatal human serum samples. Conclusion: A novel UPLC-HILIC-MS/MS method for the simultaneous extraction and quantification of nicotine, five nicotine metabolites and two minor tobacco alkaloids from human serum has been successfully developed and validated. Supported by NIH Grant Number: U10-HD-045944 Keywords: Nicotine Metabolites, Serum, UPLC-HILIC-MS/MS

SOFT 2010 Annual Meeting Richmond, VA
P33 Simultaneous Determination of Zolpidem, Zopiclone and Zaleplon in Urine by UPLC-MS/MS
Wei-Hsin Lo*, Da-Kong Huang, Chiareiy Liu, Hwei-Fang Cheng and Jaw-Jou Kang. Food and Drug Administration, Department of Health, Executive Yuan, Taipei, Taiwan An ultra-performance liquid chromatography-tandem mass spectrometry (UPLC-MS/MS) method was established for the simultaneous determination of zolpidem, zopiclone, zaleplon and metabolites in urine. A 96-well Oasis® HLB solid-phase-extraction (SPE) plate was used for the urine sample preparation. The SPE plates are conditioned using acetonitrile, equilibrated using water. The samples are loaded onto the SPE plates and washed using water. The analytes are eluted using elution solvent. Chromatography was performed with an ACQUITY UPLC® BEH PHENYL (1.7 μm particle size, 2.1 × 50 mm), and the mobile phase was composed of methanol and 10 mM ammonium acetate adjusted to pH 4.00 with 99% formic acid (1:1, v/v) at flow rate 350 μL/min. 10 μL of the sample aliquot was injected into the UPLC-MS/MS. A separation run with isocratic elution was completed in 1 min. For the determination of zolpidem, zopiclone, zaleplon and metabolites, data were acquired with the multiple reaction monitoring (MRM) using two precursor ion/product ion transition for each analyte in this UPLC-MS/MS method. Deuterated analogues were used as internal standards for the quantification and the confirmation of qualification. UPLC-MS/MS parameters are listed below.
Compound Precursor Ion (amu)
Product Ion (amu)
Dwell Time (msec)
DP (V)
FP (V)
EP (V)
CE (V)
CXP (V)
Zolpidem 308.2 235.2 20 30 400 11 46 18 308.2 263.2 20 30 400 11 35.5 20 Zopiclone 389.2 245.1 20 11 400 10 23 20 389.2 217.1 20 11 400 10 45 16 Zaleplon 306.2 236.2 20 30 400 11 38 18 306.2 264.2 20 30 400 11 30 20 Zolpidem Phenyl-4-Carboxylic Acid 338.1 265.2 20 30 400 10 49 20 338.1 293.1 20 30 400 10 37 23 Zopiclone N-Oxide 405.1 143.1 20 19 400 10 19 10 405.1 245.1 20 19 400 10 30 18 N-Desmethyl Zopiclone 375.2 245.1 20 22 400 10 25 19 375.2 217.1 20 22 400 10 44 16 Zolpidem-d6 314.4 235.3 20 30 400 10 48 17.5 314.4 263.2 20 30 400 10 36 20 Zopiclone-d4 393.3 245.1 20 11 400 10 24 20 393.3 217.1 20 11 400 10 45 17 Zaleplon-d5 311.3 269.3 20 28 400 10 31 21 311.3 237.2 20 28 400 10 38 18 Zolpidem-d6 Phenyl-4-Carboxylic Acid 344.3 265.2 20 30 400 10 50 20 344.3 293.1 20 30 400 10 38 23 Zopiclone-d8 N-Oxide 413.2 152.2 20 35 400 10 23 11 413.2 245.1 20 35 400 10 31 20 N-Desmethyl Zopiclone-d8 383.1 245.1 20 21 400 10 25 19 383.1 217.1 20 21 400 10 45 16
Linearity was established in the concentration range of 20-200 ng/mL (r>0.9950). The limits of detection were 1 and 10 ng/mL for zolpidem and the other analytes, respectively. Intra- and inter-day precisions were determined each by triplicate of spiked urine samples at six concentration levels. The relative standard deviations of intra- and inter-day precisions were 1.1%-8.3% and 1.4%-9.6%, respectively. Accuracy ranged from 90.1% to 108.0%. Keywords: Zolpidem, Zopiclone, Zaleplon

SOFT 2010 Annual Meeting Richmond, VA
P34 Extraction of THC and Metabolites from Urine and Plasma Using Supported Liquid Extraction (SLE) Prior to UPLC-MS/MS Analysis
Rhys Jones*, Lee Williams, Helen Lodder, Geoff Davies, Steve Jordan, Richard Calverley, Claire Desbrow and Gary Dowthwaite. Biotage GB Limited,Ystrad Mynach, Hengoed, UK Introduction: Cannabis is one of the most widely abused substances in the world. The naturally occurring cannabinoids found in plant species bind to receptors in the brain and cause sensations of relaxation and calm. Widespread misuse has led to the necessity for rapid and reliable methods for the analysis and quantitation of cannabinoids and metabolites. The most prevalent markers in biological samples taken from cannabis abusers are THC(Δ9-tetrahydrocannanbinol), cannabidiol, cannabinol in addition to the major THC metabolites; 11-hydoxy-Δ9-THC and 11-nor-9-carboxy-Δ9-THC. Aims: This poster demonstrates a rapid and reliable 96-well Supported Liquid Extraction assay for the extraction of the various markers for cannabis misuse prior to UPLC-MS/MS analysis. Methods: Supported Liquid Extraction, using ISOLUTE SLE+, was performed on blank human plasma and urine spiked with THC and metabolites. For method development purposes the typical spike concentration when extracting 100 µL of matrix was set to 400 ng/mL. Extraction conditions were evaluated using human matrix pre-treated (1:1, v/v) with various buffers to provide effective pH control (from pH 3 to 10.5) and extraction was investigated using various water immiscible extraction solvents (hexane, MTBE, DCM and EtOAc). All samples were analyzed using a Waters Acquity UPLC coupled to a Quattro Premier XE triple quadrupole mass spectrometer. Chromatography was achieved using an Acquity UPLC BEH C18 column (1.7μ, 100 x 2.1 mm id) held at 35 °C with an isocratic mobile phase of 0.1% formic acid aq and 0.1% formic acid/MeOH at 0.5 mL/min. Positive ions were acquired using electrospray ionization operated in the MRM mode (Δ9-THC 315.2 > 193.1; Cannabidiol 315.2 > 135.0; Cannabinol 311.2 > 223.1; 11-OH-Δ9-THC 331.2 > 313.3; 11-nor-COOH-Δ9-THC 345.1 > 327.2). Results: Hexane demonstrates extraction efficiencies greater than 80% at a range of loading pH conditions for the non polar cannabinoids, however, more polar metabolites showed little or no extraction with this solvent. DCM, EtOAc and MTBE demonstrated recoveries greater than 80% for the metabolites at various loading pH’s but the less polar cannabinoids showed slightly lower recoveries. Optimization of extraction volume and mixed solvents also resulted in recoveries greater than 80% for both matrices. Plasma experiments showed that DCM extractions gave recoveries between 80-98% using pre-treatment with 1% formic acid. Urine experiments showed better results using different pre-treatment, 0.1% formic acid combined with an elution solvent of EtOAc. Urine recoveries between 85-98% were also observed when using two 500 µl aliquots of DCM followed by MTBE. Full results will be shown in the final poster. Conclusion: This poster demonstrates the extraction of various cannabis markers from human matrices using Supported liquid extraction demonstrating extraction efficiencies between 80-98% with corresponding RSDs below 10%. Keywords: Supported Liquid Extraction, THC, UPLC-MS/MS

SOFT 2010 Annual Meeting Richmond, VA
P35 Extraction of Ethyl Glucuronide (EtG) Using a New Resin-based Mixed-Mode Strong Anion Exchange SPE Sorbent Prior to UPLC-MS/MS Analysis
Rhys Jones*, Lee Williams, Helen Lodder, Steve Jordan, Steve Plant, Richard Calverley, Claire Desbrow and Gary Dowthwaite. Biotage GB Limited, Ystrad Mynach, Hengoed, UK Introduction: Ethyl glucuronide is a metabolite formed in the body by glucuronidation of ethanol and is a useful bio-marker in forensic toxicology. As a result rapid and reliable methods for analysis and quantitation from various matrices are required. Aims: This poster will demonstrate the use of a new resin-based mixed-mode strong anion exchange SPE sorbent for the extraction of ethyl glucuronide from a variety of human biological fluids. Methods: Blank human plasma and urine were spiked with ethyl glucuronide and extracted using EVOLUTE AX in the 25mg 96-Well plate format. 50-100 µL of matrix was pre-treated and spiked with EtG at 500 ng/mL prior to extraction. The generic method is based on the use of a 50mM NH4OAc buffer at pH 7. Columns were equilibrated with MeOH followed by pH7 buffer. Samples were loaded and sequentially washed with 95/5 pH7 buffer/MeOH followed by MeOH. Analyte elution was effected using acidified organic solvents such as MeOH and ACN. All samples were analyzed using a Waters Acquity UPLC coupled to a Quattro Premier XE triple quadrupole mass spectrometer. Chromatography was performed on a Acquity UPLC BEH C18 (1.7 µ, 2.1 x 50) using isocratic conditions of 80/20 0.1% formic acid aqueous and methanol at 40 °C. Negative ions were acquired using electrospray ionization operated in the MRM mode (221>84.9 and 221>74.9). Results: EtG extraction demonstrated recoveries greater than 80% with corresponding RSDs below 10% from both plasma and urine using a slightly modified SPE protocol. The modification of the pH 7 method for urine was a result of the ionic strength of the matrix. Substantial breakthrough was observed if any buffers were used in the pre-treatment or column conditioning. Final extracts due to the nature of the matrix showed some ion suppression. Significant modification of the method was then undertaken to improve extract cleanliness. The resulting protocol demonstrated extraction efficiencies greater than 85% with far improved extract cleanliness. Conclusion: Here we demonstrate the use of a new resin-based mixed-mode strong anion exchange SPE sorbent for the extraction of ethyl glucuronide providing high extraction efficiencies and low RSDs from various human biological fluids. This poster does not detail a validated method for the extraction of EtG but provides an improved approach in terms of overall recovery and cleanliness which in turn leads to improvements in precision and accuracy when performing method validation. Keywords: EVOLUTE AX, EtG, UPLC-MS/MS

SOFT 2010 Annual Meeting Richmond, VA
P36 Mephedrone: Evaluation of Extraction Using Mixed-Mode Cation Exchange SPE with UPLC-MS/MS Analysis
Rhys Jones*, Lee Williams, Helen Lodder, Steve Jordan, Steve Plant, Richard Calverley, Claire Desbrow and Gary Dowthwaite. Biotage GB Limited, Ystrad Mynach, Hengoed, UK Introduction: Mephedrone (MCAT) is a ‘designer drug’ synthesized to mimic the amphetamine class of compounds. Due to its perceived ‘ecstasy like’ effects of euphoria, excitement and alertness combined with ease of availability, this previously unregulated drug has found widespread abuse in the UK in recent years. Harmful effects associated with mephedrone are still being studied but after several deaths linked to abuse of the drug, the UK Government have re-categorized this as a Class B substance. Aims: This poster evaluates the use of mixed-mode cation exchange SPE for the extraction of mephedrone from various human biological fluids. Methods: Human plasma, urine and whole blood were spiked with mephedrone and extracted using 3 different mixed-mode cation exchange SPE sorbents: ISOLUTE HCX, silica-based strong cation exchange; EVOLUTE CX, resin-based strong cation exchange; and EVOLUTE WCX, resin-based weak cation exchange SPE in the 96-Well plate format. Initial spike concentrations were set to 10 ng/mL when extracting 100 µL of matrix. 100 µL of matrix was pre-treated with buffer (1:3, v/v) and extracted using generic cation exchange SPE protocols. All samples were analyzed using a Waters Acquity UPLC coupled to a Premier XE triple quadrupole mass spectrometer. Chromatography was achieved using an Acquity UPLC BEH C18 column (1.7μ, 50 x 2.1 mm id) held at 35 °C with an isocratic mobile phase of 60/40 0.1% formic acid aq and 0.1% formic acid/MeOH at 0.5 mL/min. Positive ions were acquired using electrospray ionization operated in the MRM mode (178.1 > 145.0 and 178.1 > 160.0). Results: ISOLUTE HCX and EVOLUTE CX utilize a basic elution solvent (2-5% NH4OH). Similarly to amphetamines it was necessary to adjust this basic solvent with acid as mephedrone exhibits recovery losses when evaporation takes place under basic conditions. EVOLUTE CX when using the generic pH 6 method demonstrated extraction efficiencies of 90, 100 and 99% for plasma, urine and whole blood respectively and corresponding RSDs below 4%. ISOLUTE HCX showed recoveries greater than 80% for plasma and whole blood but urine recoveries were typically less than 60% using the same pH 6 method as EVOLUTE CX. Modification of this method resulted in recovery gains for all matrices and urine improved to above 75%. EVOLUTE WCX demonstrated extraction efficiencies below 65% using the generic pH7 protocol. This method was modified and improvements in extraction efficiencies were noted for all matrices. One advantage of using a weak cation exchange SPE sorbent is the use of an acidic extraction solvent so no modification of the elution solvent was required. Conclusion: This work demonstrates the extraction of mephedrone using various forms of mixed-mode cation exchange SPE. High reproducible recoveries were obtained for all matrices tested using modified generic SPE protocols. Keywords: Mephedrone, Mixed-Mode Strong Cation Exchange SPE, UPLC-MS/MS

SOFT 2010 Annual Meeting Richmond, VA
P37 Extraction of Tamoxifen and Metabolites from Urine and Plasma Using Supported Liquid Extraction (SLE) Prior to LC-MS/MS Analysis
Lee Williams*, Rhys Jones, Helen Lodder, Geoff Davies, Steve Jordan, Richard Calverley, Claire Desbrow and Gary Dowthwaite. Biotage GB Limited, Hengoed, UK Introduction: Tamoxifen is an important estrogen receptor antagonist primarily used in breast cancer therapy. More recently its action has also been shown to inhibit prostate cancer. It’s mode of action also reduces the secondary effects linked to adsorption of androgen anabolic steroids. As a result the International Olympic Committee designated tamoxifen as a ‘banned substance’. This widespread use along with various forms of misuse has led to the necessity of rapid and reliable methods for its analysis and quantification. Aims: Here we demonstrate a rapid and reliable 96-well Supported Liquid Extraction assay for the extraction of tamoxifen and metabolites from various human biological fluids. Methods: Supported Liquid Extraction, using ISOLUTE SLE+ 96-well plates, was performed on blank human plasma and urine spiked with tamoxifen and metabolites. Extraction conditions were evaluated using 100 µL human matrix pre-treated (1:1, v/v) with various buffers to provide effective pH control (from pH 3 to 10.5). Extraction was investigated using various water immiscible extraction solvents (1 mL); hexane; MTBE; DCM; and EtOAc. All samples were analyzed using a Waters Acquity UPLC coupled to a Quattro Premier XE triple quadrupole mass spectrometer. Chromatography was achieved using an Acquity UPLC BEH C18 column (1.7μ, 100 x 2.1 mm id) held at 35 °C with a mobile phase of 0.1% formic acid aq and 0.1% formic acid/MeCN at 0.6 mL/min. The initial gradient was set to 25% 0.1% formic acid/MeCN increasing to 65% over 1.6 minutes. Initial starting conditions were maintained at 1.7 minutes. Positive ions were acquired using electrospray ionization operated in the MRM mode (Endoxifen 374.2 > 58.0; 4-OH-Tamoxifen 388.2 > 72.0; N-desmethyltamoxifen 358.2 > 58.0; Tamoxifen 372.2 > 72.0). Results: The extraction of tamoxifen and its metabolites; 4-hydroxytamoxifen, N-desmethyltamoxifen and N-desmethyl-4-hydroxytamoxifen (endoxifen) from urine and plasma were investigated in this study. For method development purposes initial spike concentrations were set to 200 ng/mL when extracting 100 µL of matrix. On the whole both matrices showed similar trends, however some subtle differences were observed. Overall, the data suggests that a range of loading pH/extraction solvent combinations result in recoveries in excess of 70% for tamoxifen/metabolites with RSD’s below 10% for both matrices. The final choice of conditions relies on selecting the method with acceptable recoveries and cleanest extracts. Full results, discussion and conclusions will be shown in the final poster. Conclusion: This poster shows the applicability of SLE+ to extract tamoxifen and metabolites from plasma and urine demonstrating reproducible extraction efficiencies and corresponding RSDs below 10%. Keywords: Tamoxifen, Supported Liquid Extraction, UPLC-MS/MS

SOFT 2010 Annual Meeting Richmond, VA
P38 An International Oral Fluid Proficiency Testing Program Francis M. Esposito*, E. Dale Hart, John M. Mitchell and Michael R. Baylor. Center for Forensic Sciences, RTI International, Research Triangle Park, NC Introduction and Objective: In December 2007, RTI initiated an oral fluid (OF) Proficiency Testing Program which assessed the initial testing and confirmatory quantification of 27 drug analytes. Data presented are from 8 surveys sent to 34 laboratories in North America, Canada and Europe. Methods: OF samples were prepared to contain 3 to 5 analytes in a synthetic OF matrix with no preservatives. Each survey consisted of 5 samples of 3mL. Laboratories could analyze the OF samples as neat OF or as OF diluted with collection tube buffer, but with no collection pad. Laboratories used mass spectrometry-based confirmatory test methods to identify and quantify both directed analytes and analytes that were positive by initial testing (immunoassay using the kit manufacturer’s cutoff, C/O). Results: Initial Testing: Drug class cutoffs for the immunoassays varied by reagent manufacturer. The first table presents initial test positives for Substance Abuse and Mental Health Services Administration (SAMHSA) analytes with a group mean concentration between 1.4 to 1.7 times proposed cutoff. Four analytes had positive rates <100% as a result of group means below some manufacturers’ cutoffs. Confirmatory Testing: The second table summarizes analytes with >35 results. The mean % difference between the group mean and the target value reflects the accuracy and stability of each sample preparation. THC had the largest mean % difference and % CV, principally due to analytical difficulties and possible loss of analyte during storage.
Conclusions: It appears that some initial test reagents do not exhibit sufficient sensitivity to meet SAMHSA cutoffs. Comparison of “group versus target” means indicates accurate manufacture of samples; however, there was significant variability in % CVs, ranging from 11.0 to 23.7.
Keywords: Proficiency Testing, Oral Fluid
SAMHSA Proposed C/O, (ng/mL)
Manuf. Cutoffs (ng/mL)
Group Mean (ng/mL)
Initial Test % Positive (n = # labs reporting)
10 3-10 15.1 100(20)
40 20-40 60.9 100(24)
20 10-30 43.1 100(21)
4 3-30 6.2 92(25)
50 30-120 79.3 88(25)
20 10-30 33.6 86(22)
50 30-300 87.9 58(19)
Analyte Values (n)
Mean % CV
Target Ranges (ng/mL)
Group Mean Ranges (ng/mL)
Mean % Difference (Group vs. Target)
Nordiazepam 39 15.7 5-30 4.7-30.6 0.9 Benzoylecgonine 201 16.9 30-150 32.3-146.8 3.0 Phencyclidine 95 11.0 15-30 14.2 – 26.9 -5.2 Methamphetamine 161 13.5 40-125 39.2-129.9 5.8 Cocaine 118 20.7 30-100 33.6-111.9 5.9 MDMA 67 14.5 50-75 56.6-76.8 5.9 Morphine 190 16.2 25-200 25.7-217.5 6.1 Codeine 128 15.1 25-120 23.8-122.4 6.1 6-acetylmorphine 165 18.8 6-20 6.4-20.2 6.1 Methadone 42 16.4 30-125 27-115.1 -7.1 Amphetamine 177 14.1 50-200 60.8-226.4 12.5 THC 285 23.7 4-20 2.8-15.1 -17.8

SOFT 2010 Annual Meeting Richmond, VA
P39 3,4-Methylenedioxymethamphetamine (MDMA) and Metabolites Distribution in Oral Fluid Collected Using Intercept® Device Following Controlled Oral MDMA Administration
Karl B. Scheidweiler*1, Tsadik T. Abraham1, Allan J. Barnes1, Erin A. Kolbrich Spargo1,2, David A. Gorelick3, Robert S. Goodwin1 and Marilyn A. Huestis1. 1Chemistry and Drug Metabolism, and 3Office of the Scientific Director, National Institute on Drug Abuse, National Institutes of Health, Baltimore, MD; 2Southwestern Institute of Forensic Sciences, Dallas, TX There is interest in oral fluid as an alternative matrix for drug testing because it can be collected non-invasively while under direct observation; however, there are few controlled 3,4-methylenedioxymethamphetamine (MDMA) administration studies to guide interpretation. Nine healthy volunteers with a history of MDMA use (2 male Caucasians, 5 male African Americans and 2 female African Americans) provided written informed consent to participate in this National Institute on Drug Abuse Institutional Review Board-approved research study. While residing on a closed research unit under continuous observation, participants were administered placebo, 1.0 and 1.6mg/kg oral MDMA, typical recreational doses, during three separate sessions in double-blind, random order. Disposition of MDMA and its metabolites methylenedioxyamphetamine (MDA), 4-hydroxy-3-methoxymethamphetamine (HMMA) and 4-hydroxy-3-methoxyamphetamine (HMA) in oral fluid collected with the Intercept® device (Orasure Technologies, Inc; Bethlehem, PA, USA) was investigated 0.3-143h after MDMA administration. Drug concentrations were determined by gas chromatography-mass spectrometry with limits of quantification of 15ng/mL for MDMA and MDA, and 30 ng/mL for HMMA and HMA. MDMA, the primary analyte in oral fluid, was initially detected 0.3-1.5h after dosing, with maximum concentrations (Cmax) of 1336.5-2950.0 and 1882.5-6312.2ng/mL after 1.0 and 1.6mg/kg MDMA, respectively. MDA appearance was significantly delayed compared to MDMA (p<0.05), first appearing from 0.6-11.1h with Cmax 24.5-106.0 and 48.2-221.4ng/mL after low and high doses, respectively. MDA was never present without MDMA. HMMA and HMA were not detected in oral fluid. MDMA and MDA were ≥LOQ for up to 48h. Oral fluid testing guidelines for MDMA and MDA proposed by the European initiative; Driving Under the Influence of Drugs, Alcohol and Medicines (DRUID) and the Substance Abuse and Mental Health Services Administration (SAMHSA) propose 25 and 50ng/mL cutoff concentrations, respectively. After the high dose, mean times of last detection (Tlast) for MDMA and MDA were similar at the LOQ and DRUID cutoffs, while mean Tlast was significantly longer at the LOQ compared to the SAMHSA cutoff (p<0.05). The only significant differences between DRUID and SAMHSA proposed cutoffs were decreased MDA Tlast at the higher SAMHSA cutoff (p<0.05). 79, 75 and 72% of specimens were MDMA positive after the low and 87, 85 and 81% positive after the high MDMA dose at the LOQ, DRUID and SAMHSA cutoffs, respectively. For MDA; 46, 25 and 6.6% of specimens were positive after the low, and 66, 53 and 25% after the high dose at these same cutoffs. There was considerable inter- and intra-subject variability in MDMA and MDA oral fluid concentrations, especially during the first 10h after MDMA, possibly caused by MDMA-induced dry mouth. After low dose MDMA, median MDMA half-lives were 4.8h (range: 3.6-10.2h) and 6.4h (range: 3.9-10.0h) after the high dose. Median MDA half-lives were significantly longer than MDMA: 8.2h (range: 2.1-16.1h) and 9.5h (range: 4.8-16.0h) after low and high dose MDMA, respectively. These data suggest that oral fluid may be a useful alternative matrix for monitoring MDMA use and will help guide toxicologists, clinicians and practitioners interpreting oral fluid test results. Funding for this research was provided by the National Institutes of Health, Intramural Research Program, National Institute on Drug Abuse. Keywords: Oral Fluid, Alternative Matrix, DUID, MDMA

SOFT 2010 Annual Meeting Richmond, VA
P40 Performance Evaluation of DAT Oral Fluid Amphetamines, Methamphetamine, Opiates and Phencyclidine Assays on Roche Hitachi
M. J. Coffing*1, D. Kuntz2, M. Meixner2, K. Armstrong2 and B. Masters1. 1Roche Diagnostics Operations Inc., Indianapolis, IN; 2Clinical Reference Laboratory, Inc, Lenexa, KS Objective: The study goal was to evaluate analytical performance of DAT Oral Fluid Assays for determination of amphetamines, methamphetamines, MDMA (Amphetamines and Methamphetamine); morphine, codeine, 6-acetylmorphine (Opiates); and Phencyclidine, respectively, in oral fluid under routine laboratory conditions. Imprecision and agreement with routine immunoassays and reference methods were evaluated according to standardized protocols. Methods: Roche oral fluid turbidimetric immunoassays are based on kinetic interaction of microparticles in solution (KIMS). In conjunction with Intercept® Oral Specimen Collection Device from OraSure Technologies, Inc. (OTI), the assays utilize single cutoff concentrations of 40 ng/mL for Amphetamines and Methamphetamine, 10 ng/mL for Opiates, and 2 ng/mL for Phencyclidine. All assays have semi-quantitative and qualitative applications; only semi-quantitative were used in this trial. MODULAR ANALYTICS <P> module results are compared, with those of OTI Intercept® Micro-plate EIA. A combination of routine drug-of-abuse oral fluid samples and spiked samples were used for method comparison. Discrepant samples were analyzed by LC-MS/MS. Results: Intra-assay imprecision (21 replicates/run; 3 runs) resulted in SDs ≤2.6 for sample concentration below assay cutoff and %CVs ≤7.8%. Method Comparison: 406 specimens were analyzed for Amphetamines, Methamphetamines and Opiates; 301 specimens for Phencyclidine. All positives, all discordant specimens, and 10% of all negative specimens were confirmed. Overall agreement between Roche and OTI screening methods prior to confirmation was Amphetamines 95%; Methamphetamine 99.3%; Opiates 97.8%; Phencyclidine 96.7%. Agreement between Roche method and LC-MS/MS was Amphetamines 99.5%; Methamphetamine 99.5%; Opiates 98.8%; Phencyclidine 99.7%. Conclusion: Roche DAT Oral Fluid assays yielded a high level of agreement with OTI Intercept® Micro-plate EIA (in all cases >95%) and with LC-MS/MS (in all cases >98%) in this study. These products are not cleared for use in the U.S. A 510(k) submission is pending. MODULAR is a trademark of Roche. All other product names and trademarks are the property of their respective owners. Keywords: Drugs-of-Abuse Screening, Oral Fluids, Immunoassay, Clinical Chemistry Analyzer

SOFT 2010 Annual Meeting Richmond, VA
P41 Analysis of Endogenous Steroids in Oral Fluid Using Gas Chromatography-Tandem
Mass Spectrometry Matthew H. Slawson*, Shannon M. Nielsen, Douglas E. Rollins and Diana G. Wilkins. Center for Human Toxicology, University of Utah, Salt lake City, UT Endogenous urinary steroids are often measured in antidoping applications to evaluate changes in normal physiological values. Endogenous steroids are those steroids (and metabolites) which are naturally produced by the body. Examples include testosterone, epitestosterone, dehydroepiandrosterone (DHEA), androsterone, etiocholanolone, dihydrotestosterone (DHT), ‐ and ‐ androstanediols. In urine, the concentrations of endogenous steroids can monitored over time in an individual and the concentrations and concentration ratios (e.g. testosterone: epitestosterone) can be used to establish an individual’s steroid profile. This profile can be examined longitudinally over time and any observed deviations in the profile may indicate doping has occurred. While urine is usually used to create the steroid profile, oral fluid offers some distinct advantages. It may more accurately reflect concentrations of steroids circulating in the blood, and it is a less invasive sample to collect. This second distinction enables the possibility of an increased number of data points being collected over a given time period to strengthen the statistical power of the data comprising the steroid profile. An oral fluid method was developed for the analysis of the commonly analyzed endogenous steroids testosterone, epitestosterone, DHEA, androsterone, etiocholanolone, DHT, ‐ and ‐ androstanediol. A mixture of artificial oral fluid and stabilizing buffer (1:3) used in the QuantiSal (Immunalysis, Pomona, CA) oral fluid collection device (QuantiSal matrix) was used as the matrix for the preparation of standards and QCs. 2 mL aliquots of QuantiSal matrix fortified with steroid analytes (0.0025 – 0.5 ng/mL) and internal standard (0.1 ng/mL of methyltestosterone) were extracted utilizing a liquid-liquid extraction method routinely used in antidoping protocols. Extracted residues were derivatized with N-methyl-N-trimethylsilyltrifluoroacetamide prior to analysis. An Agilent QQQ model 7000B triple quadrupole gas chromatography/mass spectrometer system with a DB1-MS (30m, 0.25 i.d., 0.1 mm film) capillary column was used for analysis. The GC column was interfaced with an integrated backflush valve. Electron ionization and selected reaction monitoring were used to detect unique MS/MS transitions for each analyte. For those analytes where MS/MS transitions were identical (e.g. androsterone, etiocholanolone; testosterone, epitestosterone) chromatographic resolution was used to identify the individual analytes. Instrument control and data quantification was performed using MassHunter software. Calibration curves were linear from 0.0025 – 0.5 ng/mL of QuantiSal matrix for testosterone, epitestosterone, dihydrotestosterone, dehydroepiandrosterone, androsterone and etiocholanolone; and from 0.01 – 0.5 ng/mL ‐ and ‐ androstanediol. Quality control samples fortified at 0.025, 0.05, 0.25 ng/mL of QuantiSal matrix were quantitative within 20% of target values. In a preliminary, IRB approved clinical study (#00035515), human volunteers were provided the QuantiSal collection device to collect baseline oral fluid samples for steroid analysis. The QuantiSal collection pad absorbs 1 mL of oral fluid, which is transferred to a vial containing 3 mL of stabilizing buffer. Oral fluid from the pad equilibrates with the stabilizing buffer and 2mL of this collection device fluid is used for the analysis. In the male subjects (3 individuals, 11 collections), testosterone concentrations ranged from 0.003-0.008 ng/mL collection device fluid, DHEA concentrations ranged from 0.006 – 0.013 ng/mL collection device fluid. DHT, androsterone, eticholanolone, ‐ and ‐ androstanediols were not detected under these conditions. In females, (3 individuals, 9 time points) only DHEA could be quantified and ranged from 0.007 – 0.13 ng/mL. These preliminary data suggest that endogenous steroids relevant to doping control are quantifiable at low concentrations in the oral fluid of healthy, non-doping individuals. Ongoing studies are investigating recovery of steroids from the collection device, the ability to measure these steroids in oral fluid at different time points during the day and following the effect of an application of transdermal testosterone. This work is funded by the Partnership for Clean Competition. Keywords: Antidoping, Oral Fluid, Endogenous Steroid Profile, GC-MS/MS
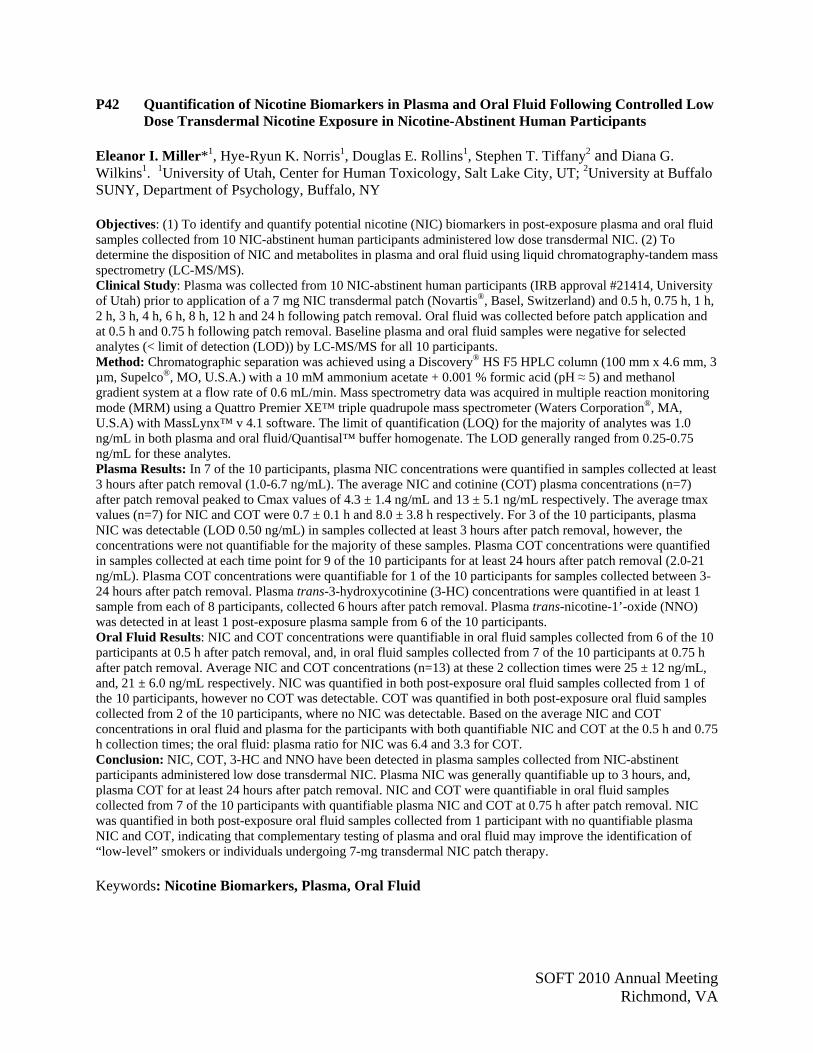
SOFT 2010 Annual Meeting Richmond, VA
P42 Quantification of Nicotine Biomarkers in Plasma and Oral Fluid Following Controlled Low Dose Transdermal Nicotine Exposure in Nicotine-Abstinent Human Participants
Eleanor I. Miller*1, Hye-Ryun K. Norris1, Douglas E. Rollins1, Stephen T. Tiffany2 and Diana G. Wilkins1. 1University of Utah, Center for Human Toxicology, Salt Lake City, UT; 2University at Buffalo SUNY, Department of Psychology, Buffalo, NY Objectives: (1) To identify and quantify potential nicotine (NIC) biomarkers in post-exposure plasma and oral fluid samples collected from 10 NIC-abstinent human participants administered low dose transdermal NIC. (2) To determine the disposition of NIC and metabolites in plasma and oral fluid using liquid chromatography-tandem mass spectrometry (LC-MS/MS). Clinical Study: Plasma was collected from 10 NIC-abstinent human participants (IRB approval #21414, University of Utah) prior to application of a 7 mg NIC transdermal patch (Novartis®, Basel, Switzerland) and 0.5 h, 0.75 h, 1 h, 2 h, 3 h, 4 h, 6 h, 8 h, 12 h and 24 h following patch removal. Oral fluid was collected before patch application and at 0.5 h and 0.75 h following patch removal. Baseline plasma and oral fluid samples were negative for selected analytes (< limit of detection (LOD)) by LC-MS/MS for all 10 participants. Method: Chromatographic separation was achieved using a Discovery® HS F5 HPLC column (100 mm x 4.6 mm, 3 µm, Supelco®, MO, U.S.A.) with a 10 mM ammonium acetate + 0.001 % formic acid (pH ≈ 5) and methanol gradient system at a flow rate of 0.6 mL/min. Mass spectrometry data was acquired in multiple reaction monitoring mode (MRM) using a Quattro Premier XE™ triple quadrupole mass spectrometer (Waters Corporation®, MA, U.S.A) with MassLynx™ v 4.1 software. The limit of quantification (LOQ) for the majority of analytes was 1.0 ng/mL in both plasma and oral fluid/Quantisal™ buffer homogenate. The LOD generally ranged from 0.25-0.75 ng/mL for these analytes. Plasma Results: In 7 of the 10 participants, plasma NIC concentrations were quantified in samples collected at least 3 hours after patch removal (1.0-6.7 ng/mL). The average NIC and cotinine (COT) plasma concentrations (n=7) after patch removal peaked to Cmax values of 4.3 ± 1.4 ng/mL and 13 ± 5.1 ng/mL respectively. The average tmax values (n=7) for NIC and COT were 0.7 ± 0.1 h and 8.0 ± 3.8 h respectively. For 3 of the 10 participants, plasma NIC was detectable (LOD 0.50 ng/mL) in samples collected at least 3 hours after patch removal, however, the concentrations were not quantifiable for the majority of these samples. Plasma COT concentrations were quantified in samples collected at each time point for 9 of the 10 participants for at least 24 hours after patch removal (2.0-21 ng/mL). Plasma COT concentrations were quantifiable for 1 of the 10 participants for samples collected between 3-24 hours after patch removal. Plasma trans-3-hydroxycotinine (3-HC) concentrations were quantified in at least 1 sample from each of 8 participants, collected 6 hours after patch removal. Plasma trans-nicotine-1’-oxide (NNO) was detected in at least 1 post-exposure plasma sample from 6 of the 10 participants. Oral Fluid Results: NIC and COT concentrations were quantifiable in oral fluid samples collected from 6 of the 10 participants at 0.5 h after patch removal, and, in oral fluid samples collected from 7 of the 10 participants at 0.75 h after patch removal. Average NIC and COT concentrations (n=13) at these 2 collection times were 25 ± 12 ng/mL, and, 21 ± 6.0 ng/mL respectively. NIC was quantified in both post-exposure oral fluid samples collected from 1 of the 10 participants, however no COT was detectable. COT was quantified in both post-exposure oral fluid samples collected from 2 of the 10 participants, where no NIC was detectable. Based on the average NIC and COT concentrations in oral fluid and plasma for the participants with both quantifiable NIC and COT at the 0.5 h and 0.75 h collection times; the oral fluid: plasma ratio for NIC was 6.4 and 3.3 for COT. Conclusion: NIC, COT, 3-HC and NNO have been detected in plasma samples collected from NIC-abstinent participants administered low dose transdermal NIC. Plasma NIC was generally quantifiable up to 3 hours, and, plasma COT for at least 24 hours after patch removal. NIC and COT were quantifiable in oral fluid samples collected from 7 of the 10 participants with quantifiable plasma NIC and COT at 0.75 h after patch removal. NIC was quantified in both post-exposure oral fluid samples collected from 1 participant with no quantifiable plasma NIC and COT, indicating that complementary testing of plasma and oral fluid may improve the identification of “low-level” smokers or individuals undergoing 7-mg transdermal NIC patch therapy. Keywords: Nicotine Biomarkers, Plasma, Oral Fluid

SOFT 2010 Annual Meeting Richmond, VA
P43 The Uncertainty in Quantitative Segmental Analysis of Hair for Cocaine and Benzoylecgonine
Cynthia Morris-Kukoski*, Marc A. LeBeau, Madeline A. Montgomery and Jason Schaff. Federal Bureau of Investigation, Laboratory Division, Quantico, VA The past two decades have witnessed a significant rise in reports of quantitative segmental analysis of hair for drugs, metabolites, and poisons in the scientific literature. To properly interpret quantitative results of these analyses, the uncertainty of the measurements must be evaluated. We demonstrate here the calculations for determining the uncertainty of performing quantitative segmental analysis of hair for cocaine (COC) and its primary metabolite, benzoylecgonine (BE). This laboratory’s standard operating procedure for the segmental analysis of COC and BE in hair involves cutting hair into 1-cm (or more) segments and weighing 25 mg each into sample vials. The hair segments are washed three times and then dried before pulverization. Isotopically-labeled internal standards are added to the pulverized hair before an overnight extraction with methanol. The methanol is removed, taken to dryness, reconstituted in deionized water, and extracted with a mixed organic solvent at an alkaline pH. The organic layer from this extract is taken to dryness and reconstituted for COC analysis, while the aqueous layer is further extracted with methylene chloride, taken to dryness, and reconstituted for BE analysis. Quantitative analyses are conducted by LC/MS/MS with a multi-point calibration curve. Following a simplified GUM approach, a thorough evaluation of the sources of uncertainty for this method was undertaken. These sources include 1) weighing the hair samples; 2) purity of the stock solutions of COC and BE; 3) pipette delivery of stock standards to prepare working standards; 4) volumetric flasks used for preparation of working standards; 5) pipette delivery of intermediate standards to prepare calibrators; 6) pipette delivery of internal standards; and 7) reproducibility of the method. The combined uncertainty of these components for COC and BE was determined to be 7.5% and 8.1%, respectively. Using a 99.8% confidence level, these values correspond to expanded uncertainties of 28% and 32%, respectively. These uncertainty values are reported with any quantitative findings generated using this analytical method. Keywords: Measurement Uncertainty, Hair, Segmental Analysis, Cocaine, Benzoylecgonine

SOFT 2010 Annual Meeting Richmond, VA
P44 Comparison of the Effects of Different Foods and Drinks on the Orasure “Intercept” and Concanteno “Certus” Oral Fluid Collection Devices and Immunoassay Screening
Eva M Reichardt*1, Dene Baldwin2 and David Osselton1. 1Centre for Forensic Sciences, Bournemouth University, Poole, UK; 2Concateno, Abingdon, UK
Introduction: Oral fluid (OF) drug testing has become increasingly popular during recent years as an alternative matrix for drugs of abuse (DOA) testing. OF is simple and easy to collect and offers a non-invasive means of sample collection that can be applied for use in the work place, hospitals, drug treatment centres and at the roadside. Although numerous studies have been published in relation to OF drug detection and identification, little work has been undertaken to investigate the effects of common beverages and foods. This study investigates the effects of common foods, drinks and oral hygiene products on the Orasure “Intercept” and new Concateno “Certus” OF collection devices. Method: Non-drug using human volunteers were asked to consume each of the substances selected for testing including fruits, common beverages, sweets and oral hygiene products. After consumption, OF was collected using the Orasure “Intercept” and new Concanteno “Certus” OF collection devices a) immediately after mouth emptying and b) 10 minutes after mouth emptying. The volume, pH and time for collection of samples was recorded. OF samples were subsequently analysed using immunoassay to observe whether the substances affected the immunoassay screening system. Results: Donors commented that in comparison to the Concateno “Certus” OF collector, the Orasure “Intercept” collector tasted salty and took longer to collect samples. The “Intercept” device collected an average of 0.55 mL in the 3 minutes recommended by the manufacturer whereas the “Certus” device collected an average of 1.15 mL in an average of 1.67 minutes. In general OF pH showed little change for most of the substances tested with the exception of vinegar. Two opiate false positive results were observed following the consumption of fruit juice and one amphetamine false positive result following the consumption of vinegar were observed with the “Intercept” collector. Conclusion: The Concateno “Certus” OF collection device was shown to collect larger volumes of OF more consistently, in a shorter time frame and with fewer false positive presumptive tests than the Orasure “Intercept”. Keywords: Oral fluid, Concateno Certus, Immunoassay Screening

SOFT 2010 Annual Meeting Richmond, VA
P45 Purity of “Street” Ketamine Preparations Retrieved from Night Club Amnesty Bins in London.
Eva Maria Reichardt*1, John Ramsey2 and David Osselton1. 1Centre for Forensic Sciences, Bournemouth University, Poole, UK; 2TICTAC Communications Ltd, St George’s University of London, UK Introduction: Ketamine has been widely used in medicine and veterinary practice for its anaesthetic and analgesic properties linked with minimal respiratory depression. More recently the drug has gained popularity as a recreational substance amongst young people. Street prices of the drug vary between £10 and £20 per gram in the UK. The UK club magazine Mixmag survey of its readers in 2009 shows 51% used ketamine in last year, 32% in last month and 18% use it weekly. 30% experienced stomach pains after taking ketamine and 20% experienced urinary tract problems (more in women). A number of reports have appeared in the medical literature suggesting a possible link between ketamine misuse and kidney and bladder disorders. The pathological cause of the bladder related problems is at present unknown and it is uncertain whether they are attributable to ketamine or to impurities that may be present in street preparations. Little information is available concerning the purity of street ketamine hence analysis was undertaken on street preparations of the drug retrieved from amnesty bins in London night clubs. In this paper, we describe the analysis of street ketamine to determine the purity of samples commonly available and to identify what impurities might be present. Method: Street ketamine samples were analysed using HPLC to determine the percentage of ketamine present. Samples were also analysed by electron microscopy, colour tests, FTIR, GC/MS and TLC in an attempt to determine the nature of any impurities present. Results: The purity of samples containing Ketamine only ranged between 65 - 100 % (mean = 87.9%; SD = 11.66%). Benzocaine was the principal impurity detected and ranged between 2.75 - 16.60% (mean = of 7.27%; SD = 3.96%). Ketamine in samples containing Benzocaine ranged between 49.9 - 84 % (mean = 67.21 %; SD = 9.71 %). Conclusion: The majority of street ketamine samples were of high percentage purity suggesting that ketamine may be responsible for effects on the urogenital system. This also supports the observation that a number of patients undergoing clinical therapy with ketamine have reported similar symptomology. Keywords: Ketamine, Drugs of Abuse, Purity

SOFT 2010 Annual Meeting Richmond, VA
P46 Incidence of Levamisole in Urine Previously Confirmed Positive for Cocaine and Benzoylecgonine by GC/MS
Vanessa Simmons*1, Jennie Buchanan2 and Cynthia Burbach1. 1Department of Toxicology, Colorado Department of Public Health and Environment, Denver, CO; 2Denver Health and Hospital Authority Rocky Mountain Poison and Drug Center, Denver, CO Background: Levamisole is a common veterinary pharmaceutical used to treat worm infestations in sheep, cattle and pigs. It is increasingly being used as a cocaine adulterant as it can be readily purchased as a white powder worldwide. Levamisole is known to cause agranulocytosis, and necrotic vasculitides with known cocaine users reporting to local hospitals with opportunistic infections, and skin vasculitides. While law enforcement has reported levamisole contamination of up to 70% of cocaine samples, they have not reported how many cocaine users will have systemic absorption of levamisole. Objective: The objective of this abstract is to provide a summary of the prevalence of levamisole in urine samples of patients who were stopped by law enforcement for suspicion of driving under the influence in 2009 who also screened and confirmed positive for cocaine and benzoylecgonine. Methods: 150 samples for the year 2009 were screened for cocaine using Enzyme Multiplied Immunoassay Technique (EMIT), of those samples, 51 were then determined to be positive for cocaine and/or benzoylecgonine during a basic drug extraction with UCT Clean Screeen® extraction columns and analysis on an Agilent 5890 GC with a 5973 mass selective detector via selective ion monitoring (SIM). The presence of levamisole was analyzed for by performing a basic drug extraction using UCT Clean Screeen® extraction columns on samples previously confirmed for cocaine and/or benzoylecgonine by GCMS in SIM mode. Samples were subsequently analyzed by gas chromatography/mass spectrometry (GC/MS) on an Agilent 5890 GC with a 5973 mass selective detector via scan. Results: 51 patients were included in the study. Levamisole was detected in 29 or 57% of samples containing cocaine in this population (Figure 1). In 2% of patients levamisole was detected alone. Of the patients who tested positive for levamisole 71% were male and 29% were female. Multiple other drugs were also present (Figure 2).
Discussion: Over half of patients who tested positive for cocaine also had levamisole in their urine. In patients who tested positive for cocaine and levamisole 25% of these patients also had narcotics, anti-depressants, antihistamines, sleep aids and/or muscle relaxants in their urine. This adds to the mounting body of evidence that the current cocaine supply is commonly contaminated with levamisole. Keywords: Levamisole, Cocaine, GC/MS
Figure 2 Additional Drugs Figure 1 Cocaine and Levamisole
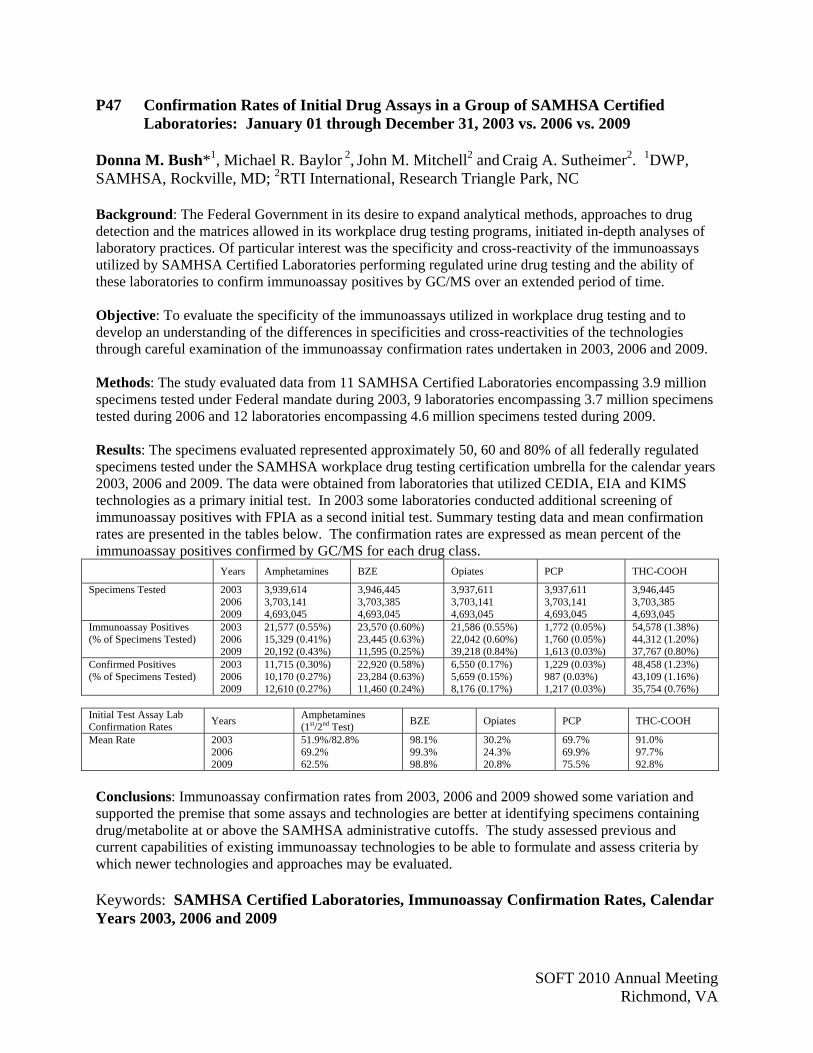
SOFT 2010 Annual Meeting Richmond, VA
P47 Confirmation Rates of Initial Drug Assays in a Group of SAMHSA Certified Laboratories: January 01 through December 31, 2003 vs. 2006 vs. 2009
Donna M. Bush*1, Michael R. Baylor 2, John M. Mitchell2 and Craig A. Sutheimer2. 1DWP, SAMHSA, Rockville, MD; 2RTI International, Research Triangle Park, NC Background: The Federal Government in its desire to expand analytical methods, approaches to drug detection and the matrices allowed in its workplace drug testing programs, initiated in-depth analyses of laboratory practices. Of particular interest was the specificity and cross-reactivity of the immunoassays utilized by SAMHSA Certified Laboratories performing regulated urine drug testing and the ability of these laboratories to confirm immunoassay positives by GC/MS over an extended period of time. Objective: To evaluate the specificity of the immunoassays utilized in workplace drug testing and to develop an understanding of the differences in specificities and cross-reactivities of the technologies through careful examination of the immunoassay confirmation rates undertaken in 2003, 2006 and 2009. Methods: The study evaluated data from 11 SAMHSA Certified Laboratories encompassing 3.9 million specimens tested under Federal mandate during 2003, 9 laboratories encompassing 3.7 million specimens tested during 2006 and 12 laboratories encompassing 4.6 million specimens tested during 2009. Results: The specimens evaluated represented approximately 50, 60 and 80% of all federally regulated specimens tested under the SAMHSA workplace drug testing certification umbrella for the calendar years 2003, 2006 and 2009. The data were obtained from laboratories that utilized CEDIA, EIA and KIMS technologies as a primary initial test. In 2003 some laboratories conducted additional screening of immunoassay positives with FPIA as a second initial test. Summary testing data and mean confirmation rates are presented in the tables below. The confirmation rates are expressed as mean percent of the immunoassay positives confirmed by GC/MS for each drug class.
Years Amphetamines BZE Opiates PCP THC-COOH
Specimens Tested 2003 2006 2009
3,939,614 3,703,141 4,693,045
3,946,445 3,703,385 4,693,045
3,937,611 3,703,141 4,693,045
3,937,611 3,703,141 4,693,045
3,946,445 3,703,385 4,693,045
Immunoassay Positives (% of Specimens Tested)
2003 2006 2009
21,577 (0.55%) 15,329 (0.41%) 20,192 (0.43%)
23,570 (0.60%) 23,445 (0.63%) 11,595 (0.25%)
21,586 (0.55%) 22,042 (0.60%) 39,218 (0.84%)
1,772 (0.05%) 1,760 (0.05%) 1,613 (0.03%)
54,578 (1.38%) 44,312 (1.20%) 37,767 (0.80%)
Confirmed Positives (% of Specimens Tested)
2003 2006 2009
11,715 (0.30%) 10,170 (0.27%) 12,610 (0.27%)
22,920 (0.58%) 23,284 (0.63%) 11,460 (0.24%)
6,550 (0.17%) 5,659 (0.15%) 8,176 (0.17%)
1,229 (0.03%) 987 (0.03%) 1,217 (0.03%)
48,458 (1.23%) 43,109 (1.16%) 35,754 (0.76%)
Initial Test Assay Lab Confirmation Rates
Years Amphetamines (1st/2nd Test)
BZE Opiates PCP THC-COOH
Mean Rate 2003 2006 2009
51.9%/82.8% 69.2% 62.5%
98.1% 99.3% 98.8%
30.2% 24.3% 20.8%
69.7% 69.9% 75.5%
91.0% 97.7% 92.8%
Conclusions: Immunoassay confirmation rates from 2003, 2006 and 2009 showed some variation and supported the premise that some assays and technologies are better at identifying specimens containing drug/metabolite at or above the SAMHSA administrative cutoffs. The study assessed previous and current capabilities of existing immunoassay technologies to be able to formulate and assess criteria by which newer technologies and approaches may be evaluated. Keywords: SAMHSA Certified Laboratories, Immunoassay Confirmation Rates, Calendar Years 2003, 2006 and 2009

SOFT 2010 Annual Meeting Richmond, VA
P48 Comprehensive Analysis of Drugs of Abuse in Whole Blood Using Cleanup Tips and LC/MS/MS
Oscar G. Cabrices*, William E. Brewer and Stephen L. Morgan. University of South Carolina, Columbia, SC
Recently, reports of protein precipitated blood specimens have been analyzed directly by LC/MS/MS without additional solid-phase extraction (SPE) or cleanup procedures. These methods have been primarily utilized for rapid screening purposes. Positively identified drugs and metabolites in forensic cases are subsequently analyzed using SPE with more stringent quality control for quantitative analysis and confirmation. It is understandable that labs would prefer to not use SPE due to the additional time and costs associated with the analyses.
We have developed a new Disposable Pipette Extraction (DPX) method that is used as a “cleanup” method rather than traditional SPE. In this DPX method, the sorbent contained in the pipette tips are used to extract the matrix instead of the drugs and metabolites of interest. This provides a very rapid method because no conditioning, wash and elution steps are required. The solutions are simply aspirated into the cleanup tips, mixed with the sorbent by aspirating air bubbles (or shaking), and then dispensed into the vials or tubes for subsequent analysis. With these “cleanup tips”, protein precipitated samples can be rapidly processed in just seconds, and therefore negligible time is added to the sample preparation.
The major advantages to using the cleanup tips are that ion suppression and matrix effects are negligible, and this leads to more reproducible results and more accurate quantitation. In addition, this quick cleanup method provides a means of performing the screening and confirmation in one run (by using a single deuterated internal standard for each drug class), reducing costs and improving case turnaround time. In this study, analyses of over 40 drugs of abuse in whole blood are shown with recoveries greater than 70% and RSDs less than 10%. The drugs and metabolites include opiates (morphine, oxymorphone, hydromorphone, codeine, oxycodone, hydrocodone), opioids (fentanyl, norfentanyl, buprenorphine, norbuprenorphine, methadone, EDDP), benzodiazepines (nordiazepam, diazepam, clonazepam, nitrazepam, flunitrazepam, α-OH-alprazolam, oxazepam, lorazepam, alprazolam, temazepam, 7-aminoclonazepam, 7-aminoflunitrazepam), analgesics (propoxyphene, norpropoxyphene, tramadol, o-desmethyltramadol), anticonvulsants (carisoprodol, meprobamate, gabapentin), stimulants (amphetamine, methamphetamine, MDMA, MDEA, benzoylecgonine, cocaine, methylphenidate, MDA, phetermine) and PCP. Most recoveries are app. 90% with losses primarily attributable to the protein precipitation step. Applications for analysis of meconium are also presented. Also, examples using complete automation are shown, making the sample preparation of these difficult matrices non-tedious. Improvements in chain-of-custody and sample integrity are also described.
Analytical Procedure: All analyses were performed using an Agilent 1100 HPLC with a Zorbax Eclipse Plus C18 column (2.1 x 100mm, 1.8 um), an AB SCIEX 3200 Q-Trap with electrospray source and GERSTEL MPS 2XL autosampler configured with an Active Washstation. Sample injections were made using a 6 port (0.25mm) Cheminert C2V injection valve outfitted with a 20uL stainless steel sample loop. LC Method Parameters: Mobile Phase: A - 5mM ammonium formate with 0.05% formic acid; B – 0.05% formic acid in methanol. Flow rate was 0.35 mL/min. Ramp: 5% B for 0.5 min, 30% B at 1.5 min, 70% B at 3.5 min, 90% B at 4.5 min, 90% B at 6.5 min, 5% B at 7.5 min.
Keywords: Solid Phase Extraction, Disposable Pipette Extraction, LC/MS/MS

SOFT 2010 Annual Meeting Richmond, VA
P49 Effect of Hydrolysis on Identifying Prenatal Cannabis Exposure Teresa R. Gray*, Allan J. Barnes and Marilyn A. Huestis. Chemistry and Drug Metabolism, National Institute on Drug Abuse, National Institutes of Health, Baltimore, MD Identification of prenatal cannabis exposure is important due to potential cognitive and behavioral consequences; however, it is not clear if hydrolyzing meconium specimens is necessary to maximize identification of affected infants. A two-dimensional gas chromatography-mass spectrometry method for the quantification of cannabinol, 9-tetrahydrocannabinol (THC), 11-hydroxy-THC (11-OH-THC), 8β,11-dihydroxy-THC, and 11-nor-9-carboxy-THC (THCCOOH) in human meconium was developed and validated. Alkaline, enzymatic and enzyme-alkaline tandem hydrolysis conditions were optimized with THC- and THCCOOH-glucuronide reference standards.
Limits of quantification ranged from 10-15 ng/g and calibration curves were linear to 500 ng/g. Bias and intra-day and inter-day imprecision were <12.3%. No carryover to 1000 ng/g, and no endogenous or exogenous interferences were observed. Analytes were stable at room temperature (24 h), 4C (72 h), on the autosampler (36 h) and after three freeze-thaw cycles.
Hydrolysis efficiencies were analyte-dependent; THC-glucuronide was effectively cleaved by 5000 U E. coli -glucuronidase per 0.25 g meconium incubated overnight at 37°C (97.9 ± 7.9%), but was unaffected by incubation in strongly basic conditions at 60°C for 30 min. Conversely, THCCOOH-glucuronide was most sensitive to alkaline hydrolysis (89.3 ± 7.1%), and less so to enzymatic hydrolysis (15.5 ± 1.8%). Enzyme-alkaline tandem hydrolysis maximized efficiency for both glucuronides (99.9 ± 9.0% for THC-glucuronide and 97.8 ± 4.7% for THCCOOH-glucuronide). For enzymatic and enzyme-alkaline tandem hydrolysis procedures, performance was negatively affected by particulate matter in the meconium homogenate. Following methanol homogenization, THC-glucuronide hydrolysis efficiency improved from a mean ± SD of 24.5 ± 1.9% to 99.6 ± 3.6%; THCCOOH-glucuronide efficiency was not affected.
Fifty-six authentic meconium specimens were analyzed by the enzyme, alkaline, enzyme-alkaline tandem and non-hydrolyzed methods. Identification of cannabinoid-positive meconium specimens increased substantially following alkaline (N=42) and enzyme-alkaline (N=40) hydrolysis, as compared to non-hydrolyzed (N=27) and enzyme (N=26) hydrolyzed results due to increased THCCOOH detection and concentrations. Although no 11-OH-THC glucuronide standard is available, enzymatic hydrolysis yielded a ten-fold increase in the number of 11-OH-THC-positive authentic specimens.
In conclusion, 11-OH-THC and THCCOOH appear to be significantly glucuronidated; therefore, hydrolysis should be employed to maximize identification of cannabis-exposed neonates. The widest range of cannabis biomarkers are achieved with enzyme-alkaline tandem hydrolysis.
This research was funded by the Intramural Research Program, National Institute on Drug Abuse, National Institutes of Health. Keywords: Cannabinoids, Meconium, Hydrolysis, Glucuronide, -glucuronidase

SOFT 2010 Annual Meeting Richmond, VA
P50 Determination of Medication Cutoff Values in a Pain Patient Population A. Pesce, C. Mikel*, R. West, B. Crews, S. Latyshev, P. Almazan, C. West and M. Rosenthal Millennium Research Institute, San Diego, CA Background: Laboratories testing for pain medications typically use cutoffs established by the Substance Abuse Mental Health Services Administration (SAMHSA) or by the manufacturers of immunoassay reagents. Our research suggests that these cutoffs are inappropriately high for monitoring patients being prescribed opioids for treatment of chronic pain. At these cutoffs a significant percentage of compliant patients are incorrectly deemed as non-compliant. Purpose of the study: To use quantitative urine drug excretion data determined by liquid chromatography–tandem mass spectrometry (LC-MS/MS) analysis (Mikel et al Ther Drug Monit. 2009. 31: 746-748) to calculate cutoffs needed to best determine patient compliance with prescribed medications. Methods: The LC-MS/MS method used Agilent 1210 triple quad mass spectrometers, deuterated internal standards, and Xorbax columns with an acetonitrile formic acid water gradient, Values one half of the lower limit of quantitation and higher for all the analytes tested were used. The CVs at the lower limit of quantitation were less than 20%. A non-parametric 2.5% estimator was used to establish each cutoff. A second, nonparametric calculation used normalized creatinine values, resulting in the excretion being expressed as nanograms of excreted drug per gram of creatinine. Results: Cutoffs established using these calculations included at least 95% of the data for the drugs (number of samples, LLOQ and CV in parentheses). 7-aminoclonazepam, (20,190, 20ng/mL, 10.2%) alpha-hydroxalprazolam, (35,196, 20ng/mL, 7.40%) buprenorphine, (6,739, 10ng/mL, 18%) carisoprodol (10,416, 100ng/mL, 8.7%) , hydrocodone (81,196, 50ng/mL, 5.4%) hydromorphone (77,729, 50ng/mL, 6%), meperidine, (2226, 50ng/mL, 3.9%) meprobamate, (19,708, 100ng/mL, 12.8%) methadone, (16,716 50ng/mL, 8.9%) morphine, (30,154, 50ng/mL, 7%) oxycodone,(57,545 50ng/mL, 7%) oxymorphone, (65.919 50ng/mL, 8%) propoxyphene (5,127 100ng/mL, 7.4%) and tramadol (9,878 100ng/mL, 7%) gave cutoffs near the lower limit of quantitation. One exception was with the drug codeine, where the lower limit could not be identified. Conclusions: These cutoffs were significantly lower than those suggested by SAMHSA and the immunoassay manufacturers and better identify patient compliance in a representative population of pain patients. The limitation is that only values one-half of our lower limit of quantitation were used. By using population values, laboratories can establish appropriate cutoffs for best monitoring pain patient medication compliance. Keywords: Pain Patients, Cutoffs, LC-MS/MS, Patient Compliance, Urine Drug Testing

SOFT 2010 Annual Meeting Richmond, VA
P51 An Improved Method of Determining Ethanol Use in a Chronic Pain Population B. Crews, S. Latyshev*, R. West, R.Gutierrez, C. Mikel, P. Almazan, A. Pesce, C. West and M.Rosenthal, Millennium Research Institute, San Diego, CA
Determining ethanol use in the pain patient population being treated with chronic opioid therapy is critically important to the treating physician. Urinary ethanol, ethyl glucuronide, and ethyl sulfate have been used to identify alcohol use. Because urine samples are shipped to references laboratories, the possibility of glucose fermentation during transit producing ethanol complicates interpretation. Purpose of the Study: To establish whether ethanol-positive urine samples were due to ingestion or fermentation during shipping. Method: The method used to detect the ethanol was an enzyme assay (Microgenics DRI ethanol). We developed a “dilute and shoot” assay to detect ethyl glucuronide and ethyl sulfate in urine using liquid chromatography-tandem mass spectrometry (LC-MS/MS). Patient urines were diluted with internal standards prior to analysis. HPLC multiplexing was performed using a Thermo Fisher Aria Transcend LX-4 and TSQ Quantum Ultra QQQ instrument. The analytical range was from 500 ng/mL to 10,000 ng/mL with a coefficient of variation of less than 15% at the upper and lower limits of quantitation. All spectra were collected using electrospray ionization with the mass spectrometer running in negative mode. In MRM mode two transitions are used to analyze a single compound. The quantitative transition used for EtG was 221 -> 75, the qualitative transition was 221 -> 85. The transition used for EtG-D5 was 226 -> 75. The quantitative transition used for EtS was 125 -> 97, the qualitative transition was 125 -> 80. The transition used for EtS-D5 was 130 -> 98. The accuracy of the assays were determined using two quality control samples obtained from Microgenics as part of the immunoassay kit for EtG and an in-house prepared quality control sample with a concentration of 200 ng/mL for EtS. Calibrators were prepared from 100 ug/mL EtG or EtS in methanol, obtained from Lipomed and subsequently diluted in synthetic urine to the concentrations of 100, 500, 1000, 2000, 5000, or 10,000 ng/mL. HPLC grade water and acetonitrile were obtained from VWR Westchester PA. EtG-D5 and EtS-D5 internal standards with a concentration of 100ng/mL in methanol were obtained from Lipomed and diluted to working concentrations in HPLC grade H2O. Quantitative analysis is performed using LC Quant software. Results: In an attempt to establish whether ethanol-positive urine samples can be specific for ethanol use, we examined 9,400 consecutive urines from pain patients for the presence of ethanol, ethyl glucuronide, ethyl sulfate, and glucose. We obtained 94 ethanol-positive urine samples from pain patients, which were further tested for ethyl glucuronide, ethyl sulfate, and glucose. Only 62 of the 94 samples contained ethyl glucuronide or ethyl sulfate. 63 of the 94 samples had glucose values above 10 mg/dL. Four of the 32 ethyl glucuronide-negative patients had ethanol levels > 500 mg/dL, which are non-physiologic. Limitations: Limitations of the study include the lack of demographic data beyond treatment with opioids for chronic pain. Conclusions: Roughly one-third of the time ethanol-positive urine samples that have been shipped are positive because of fermentation, not because of patient alcohol consumption. Confirmatory testing showing the presence of the ethanol metabolites ethyl glucuronide and ethyl sulfate is needed to validate that the ethanol is due to consumption. The presence of glucose, while common in the ethanol-positive samples, is not an absolute indicator that the ethanol was due to fermentation. To determine if we could differentiate ethanol formation by fermentation from that produced by ingestion, we incubated 67 ethanol-positive samples for a period of seven days at room temperature in a stable environment. Ethanol values increased in some samples over time while they decreased in others. In general, the effect of the incubation was random and so it was not possible to show that added incubation time increased the levels of ethanol in urine by fermentation. This data suggests that Urine Drug Testing screens positive for ethanol should always be confirmed with subsequent ethyl glucuronide and ethyl sulfate analysis. Keywords: Pain Population, Ethanol, Ethyl Glucuronide, Ethyl Sulfate, Urine Drug Testing

SOFT 2010 Annual Meeting Richmond, VA
P52 The Availability of Fentanyl from Transdermal Patches in Gastric and Oral Fluids Ashley Gesseck*1, Carl E. Wolf1,2 and Alphonse Poklis1,2. Departments of 1Forensic Science and 2Pathology, Virginia Commonwealth University, Richmond, VA
We studied the in vitro dissolution of fentanyl from transdermal patches in simulated gastric and oral fluid. When a drug is administered orally in solid form as a tablet, capsule or other solid form the rate of absorption and often bioavailability maybe influenced by how fast the drug dissolves or is released in the fluids at the absorption site. Fentanyl is commonly administered through a transdermal patch at varying amounts for the relief of chronic pain. These patches are designed to release fentanyl for dermal absorption at various doses of 12.5, 25, 50, 75, and 100 ug fentanyl per hour. However, fentanyl patches may be abused by freezing the patch and cutting it into small pieces, “Chiclets”, which are then chewed or ingested. The total amount of fentanyl in a 50ug/hr patch is 5mg, a potentially lethal dose if completely adsorbed from the oral cavity while chewing. Therefore, we studied the dissolution of fentanyl from a 50 ug/h patch labeled to contain 5 mg of fentanyl. The fentanyl patches were cut into various sizes: 1/4, 1/8, and 1/16 of a patch, and placed into either simulated gastric (40mM HCl) or oral fluid (0.9%NaCl) at room temperature and at body temperature, (370C). Aliquots of the fluids were sampled at various time points and analyzed by HPLC-UV (Wolf and Poklis. J. Anal. Toxicol. 29:711, 2005). Fentanyl was released from the patch Chiclets into the gastric fluid at a faster rate than into oral fluid, whether at room temperature or 370C. Within 30 minutes of soaking in stimulated gastric fluid at body temperature the average dissolution of fentanyl from the 1/4, 1/8 and 1/16 size Chiclets was; 61%, 25% and 81%, respectively. However, within 30 minutes of soaking in stimulated oral fluid at body temperature the average dissolution of fentanyl from the 1/4, 1/8 and 1/16 size Chiclets was only; 8%, 12% and 7%, respectively. Dissolution rates for gastric and oral fluids at room temperature were very slow, with recovery of very small percentages of fentanyl. Given the 5mg dose of fentanyl present in a transdermal patch, the poor dissolution in oral fluid of fentanyl may service as a protective mechanism for those who abuse this product by chewing the patch Chiclets. While fentanyl is well released in gastric contents, it has a reported bioavailability of only 30%, thus, greatly reducing the intensity of its pharmacological effects in swallowed doses. Keywords: Fentanyl, HPLC, Transdermal Patch

SOFT 2010 Annual Meeting Richmond, VA
P53 Reduce Your Backlog: Adopt a Single Solid Phase Extraction Approach to Detect/Quantify Basic, Acidic/Neutral, Sympathomimetic Amines, and Cocaine/Metabolites using Mini-Bore Fast GC/MS
Daniel D Baker IV* and Jan M. Gorniak. The Office of the Franklin County Coroner, Columbus, OH
The development of methodologies utilizing newly available technologies and advancements in analytical chemistry and their systematic application to forensic toxicology is presented herein. A validated procedure of performing the analysis of basic, acidic/neutral, sympathomimetic amines and cocaine/metabolites with a single solid phase extraction has been developed. The application of this procedure has resulted in faster instrumental analysis times, increased number of analytes detected and quantified by a single procedure, increased sensitivity, reduced sample volume requirements, improved chromatographic resolution and efficiency and ultimately faster toxicology case turnaround time. The author’s complete basic methods, acidic/neutral methods, derivatization methods, S.O.P’s, validation data, and QC worksheets will be available free on jump-drives for “plug-‘n-play” dissemination at the poster location.
Certified reference standards were purchased from Cerilliant to prepare grouped A and B calibrator solutions and Grace to prepare grouped A and B quality control solutions. A total of 12 sympathomimetic amines (SMA’s), 68 basic drugs including cocaine and cocaethylene, and 12 acidic/neutral drugs were divided and pooled into two groups, A or B, based on GC/MS retention times to achieve baseline separation of pooled compounds. The extraction procedure uses UCT Clean Screen solid phase extraction columns (#ZSDAU020.) The sample size required is 1 mL of whole blood, serum, or tissue homogenates. The extraction procedure is available from UCT and results in acidic/neutral drug elution, then separately, basic drug elution. Internal standards used are glutethimide and methapyrilene respectively. Typical limits of detection of basic drugs ranged between 12.5 ng/mL to 50 ng/mL. The key is that, extracts are manipulated with derivatizing reagents on an “as needed basis” for 12 SMA’s (HFBA), benzoylecgonine, quetiapine, and hydroxyzine (MSTFA) and re-injected with appropriate derivatized A or B calibrators and QC’s as opposed to separate and additional targeted extractions saving time, effort, and expense.
Gas chromatography column technology in recent years allows toxicologists to separate more complex mixtures than past. The availability of mini-bore capillary columns with an internal diameter (I.D.) of 0.18 mm is a direct replacement for the old narrow-bore 0.25 mm I.D. columns in GC/MS instruments. Mini-bore capillary columns are more efficient in resolving peaks and can therefore, be used at much shorter lengths while retaining peak resolution at faster run times. The author custom ordered a Phenomenex ZB-50, 10m, 0.18 mm I.D. x 0.18 um df with a 2 m integrated guard column for basic drug analysis. This column produced a total run time of 16.75 min. The author custom ordered a Phenomenex ZB-DRUG-1 10 m 0.18 mm I.D. x 0.18 um df with a 2 m integrated guard column for acidic/neutral analysis resulting in a total run time is 10.5 min. The increased mini-bore efficiency has allowed the author to perform five-point calibration curves for 68 basic drugs and 12 acidic/neutral drugs and validate the curves using only 15 total extraction positions with each batch of cases (A mix CAL Levels 1-5, and B mix CAL levels 1-5, A mix QC low and hi, B mix QC low and hi, negative QC.) The short 2 m guard columns keep retention times consistent run to run. Full scan target ion quantitations are used in both methods. Modern GC/MS electronic pressure control (EPC) valves permitted Pulsed-Splitless injection increasing sensitivity over split injections, and retained narrow peak width commonly associated with split injections. Furthermore, EPC ramped column flows force those late-eluting compounds off the column faster, resulting in faster overall run-times. Since implementation of this procedure, 182 basic and 36 acidic/neutral compounds of forensic interest have been chromatographed and mass selectively detected.
Keywords: Basic, Acidic/Neutral, GC/MS

SOFT 2010 Annual Meeting Richmond, VA
P54 A Multiplexed Method for the Determination of Androgens in Serum and Plasma by HPLC-MS/MS
Carrie J. Haglock*1, Mark M. Kushnir1, 2 and Jason Sawyer1. 1ARUP Laboratories, Salt Lake City, UT; 2ARUP Institute for Clinical and Experimental Pathology, Salt Lake City, UT Androgens are naturally occurring sex hormones, responsible for the development of the reproductive system and secondary sex characteristics. Dehydroepiandrosterone (DHEA) and androstenedione are androgen precursors of male and female sex hormones. Testosterone is a bioactive androgen responsible for development of male specific gender characteristics and important for many non-gender specific functions. The ability of testosterone to enhance muscle mass has made it and its precursors natural substitutes for anabolic steroids. As a result, the International Olympic Committee (IOC) Medical Commission added DHEA to the list of prohibited compounds in late 1996. In this assay, three androgens are quantitated: DHEA, androstenedione, and testosterone. To efficiently handle testing a large number of samples, a multiplexed method was developed using a Thermo Scientific TLX2 autosampler system and an API4000 triple quadrupole mass spectrometer (AB/Sciex). DHEA, androstenedione, testosterone and their corresponding deuterated internal standards are extracted from 200 µL of serum using 1 mL of methyl tert-butyl ether (MTBE). The sample extracts are evaporated and derivatized with 5% hydroxylamine in a methanol/water mix. Chromatographic separation is achieved using gradient elution with a two dimensional column approach. A Phenomenex Kinetex C18 (50 x 2.10 mm, 2.6 µm) connected to a C18 guard cartridge is switched in line with two stacked C6 guard cartridges to achieve separation of the androgens. Two transitions are monitored for each analyte and its corresponding internal standard. Concentrations are determined using calibrators over the range of 0.05 – 2 ng/mL. Precision for the assay met the acceptance criteria of a total CV of < 15% at all tested concentrations. The limits of quantitation for DHEA, androstenedione, and testosterone were 0.05, 0.03, and 0.01 ng/mL, respectively. The upper limits of linearity were determined to be 9, 42, and 25 ng/mL, respectively. The method was found to be acceptable for routine quantitative analysis of androgens in serum and plasma in a high volume laboratory. Keywords: Androgen, HPLC-MS/MS, Multiplexing

SOFT 2010 Annual Meeting Richmond, VA
P55 Comparison of Soft Gray Butyl, Red Rubber, and Ultra Pure Teflon/Silicone Rubber Stoppers Used in Headspace GC Alcohol Analysis
Denice M. Teem*, Daniel S. Isenschmid and Bradford R. Hepler. Wayne County Medical Examiner’s Office, Detroit, MI
There are several different types of stoppers available for use with headspace vials used for alcohol and/or volatiles analysis. Discussions regarding the most appropriate stoppers to be used when performing headspace analysis for volatiles prompted this study in which we compared the analytical results using three different types of stoppers with standard 20 mm headspace vials sealed with aluminum metal crimp caps. Soft gray butyl, red rubber and ultra pure Teflon/silicon rubbers stoppers, crimp caps and vials were provided by Shamrock Glass for this study.
Sixty-three post-mortem blood specimens, stored at -15C, previously confirmed for ethanol at concentrations ranging from 0.000-0.446 g/dL were included. Each blood sample was run in duplicate using each of the three stopper types, along with calibrators and controls containing 0.0, 0.05, 0.10, 0.20, 0.30, and 0.50 g/dL ethanol, a separate methanol, isopropanol and acetone control, and water and air blanks.
Briefly, blood (0.1 mL) was diluted 1:10 with an aqueous n-propanol (0.0160 g/dL) internal standard solution using a Hamilton pipettor-diluter. Analysis was performed on a Perkin Elmer AutoSystem XL GC equipped with a Turbomatrix 110 headspace autosampler. Separation was performed on a 5% carbowax 20m, 60/80 Carbopack B, 6ft x 1/8 in. column with detection by flame ionization (FID).
There were two separate blood samples where the difference (*) of the replicate samples was greater than 0.011 g/dL ethanol (which would require reanalysis in accordance with this laboratory’s SOP). One instance was with a Teflon/silicone stopper and the other with a red rubber stopper.
Gray butyl Teflon/silicone Red rubber %CV 0.4217 0.4211 0.4226 * 0.4467 * 0.4261 0.4296 2.27 0.2681 0.2652 0.2683 0.2686 0.2861 * 0.2749 * 2.82
The average %CV for any specimen above the limit of quantitation (0.02 g/dL) (n=55) across the 6 replicate analyses (three different stoppers, in duplicate) ranged from 0.59-3.26, with the overall average %CV for all specimens being 1.34.
There did not appear to be any concentration-related differences between stoppers used. All 6 replicates were within 0.011 g/dL, regardless of concentration, except as previously noted. In addition, there did not appear to be any extraneous peaks or baseline changes regardless of the stopper used.
Our sample population did not provide enough representative cases to compare results for volatiles other than ethanol, above their limits of quantitation.
Based on the data, there appears to be no difference in the results obtained using the soft gray butyl, red rubber or the ultra pure Teflon/silicon rubbers stoppers when performing routine GC-FID headspace analysis for volatiles using the procedures in place at this laboratory.
Keywords: Stoppers, Head-Space, Vials
SOFT 2010 Annual Meeting Richmond, VA
P56 Fatality Involving the Ingestion of Phenazepam and Poppy Seed Tea Kristen M. Bailey*, Lauren L. Richards-Waugh, David J. Clay, Myron A. Gebhardt, Hamada E. Mahmoud and James C. Kraner. Office of the Chief Medical Examiner, Charleston, WV Phenazepam is a benzodiazepine derivative which has been in clinical use in Russia since 1978 and is not available by prescription in the United States; however, it is attainable through various internet websites, sold either as tablets or as a reference grade crystalline powder. Presented here is the case of a 42 year-old Caucasian male who died as the result of combined phenazepam, morphine, codeine, and thebaine intoxication. A vial of white powder labeled “Phenazepam, Purity 99%, CAS No. 51753-57-2, Research Sample,”a short straw, and several poppy seed pods were found on the scene. Investigation revealed that the decedent had a history of ordering medications over the internet and that he had consumed poppy seed tea (PST) prior to his death. Samples were prepared by protein precipitation with1.0 mL cold acetonitrile/methanol (85:15). Chromatographic separation of benzodiazepines and opiates was performed using a Waters Acquity UPLC® with an Acquity UPLC® BEH C18 2.1 x 100 mm (1.7 μm) column (Waters, Milford, MA). MS/MS analysis was carried out using a Waters TQ Detector with ionization in electrospray positive mode. Target compounds were analyzed using multiple reaction monitoring (MRM), with one quantification transition and two target transitions monitored for drugs of interest, while only a quantification transition and a single target transition were monitored for deuterated internal standards. Phenazepam, morphine, codeine, and thebaine were quantified in the blood at 386 ng/mL, 116 ng/mL, 85 ng/mL, and 72 ng/mL, respectively. This case is unique in that (i) phenazepam and PST are rarely observed in postmortem investigations; (ii) it is the only reported fatality involving both phenazepam and PST; and (iii) the phenazepam and the instructions for use and preparation of PST were apparently obtained by the user through the internet. Key words: Phenazepam, Poppy Seed Tea, Postmortem
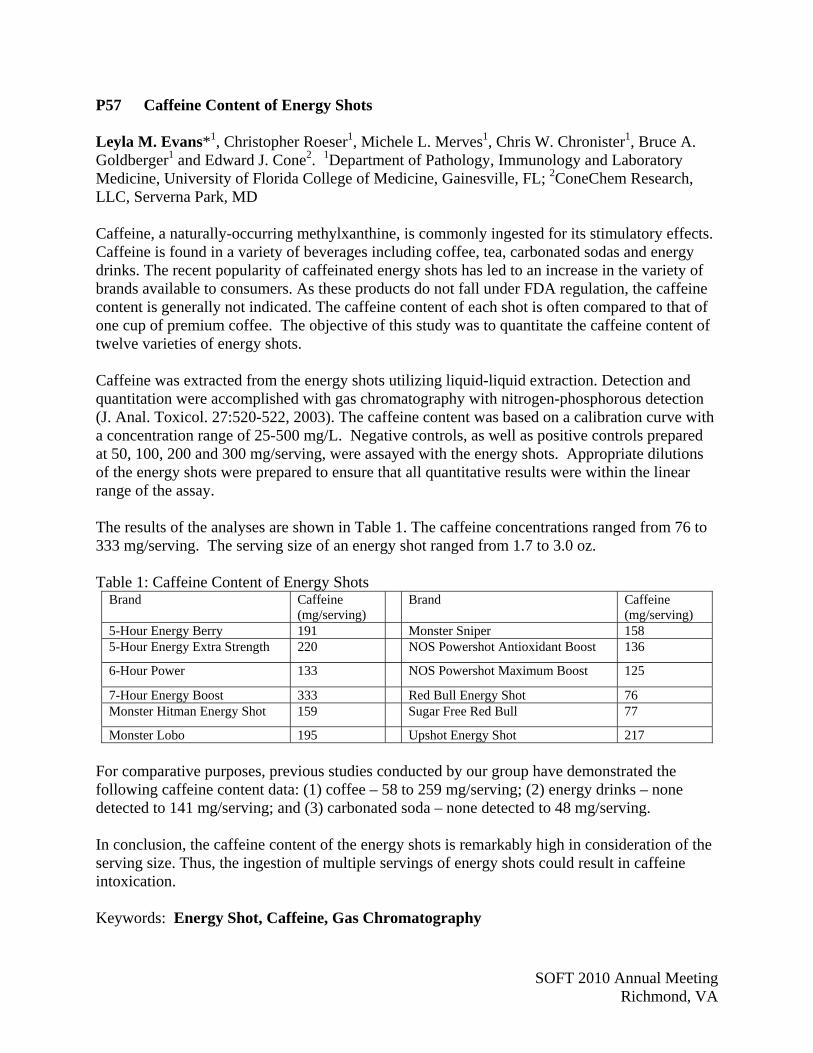
SOFT 2010 Annual Meeting Richmond, VA
P57 Caffeine Content of Energy Shots Leyla M. Evans*1, Christopher Roeser1, Michele L. Merves1, Chris W. Chronister1, Bruce A. Goldberger1 and Edward J. Cone2. 1Department of Pathology, Immunology and Laboratory Medicine, University of Florida College of Medicine, Gainesville, FL; 2ConeChem Research, LLC, Serverna Park, MD Caffeine, a naturally-occurring methylxanthine, is commonly ingested for its stimulatory effects. Caffeine is found in a variety of beverages including coffee, tea, carbonated sodas and energy drinks. The recent popularity of caffeinated energy shots has led to an increase in the variety of brands available to consumers. As these products do not fall under FDA regulation, the caffeine content is generally not indicated. The caffeine content of each shot is often compared to that of one cup of premium coffee. The objective of this study was to quantitate the caffeine content of twelve varieties of energy shots. Caffeine was extracted from the energy shots utilizing liquid-liquid extraction. Detection and quantitation were accomplished with gas chromatography with nitrogen-phosphorous detection (J. Anal. Toxicol. 27:520-522, 2003). The caffeine content was based on a calibration curve with a concentration range of 25-500 mg/L. Negative controls, as well as positive controls prepared at 50, 100, 200 and 300 mg/serving, were assayed with the energy shots. Appropriate dilutions of the energy shots were prepared to ensure that all quantitative results were within the linear range of the assay. The results of the analyses are shown in Table 1. The caffeine concentrations ranged from 76 to 333 mg/serving. The serving size of an energy shot ranged from 1.7 to 3.0 oz. Table 1: Caffeine Content of Energy Shots
Brand Caffeine (mg/serving)
Brand Caffeine (mg/serving)
5-Hour Energy Berry 191 Monster Sniper 158 5-Hour Energy Extra Strength 220 NOS Powershot Antioxidant Boost 136
6-Hour Power 133 NOS Powershot Maximum Boost 125
7-Hour Energy Boost 333 Red Bull Energy Shot 76 Monster Hitman Energy Shot 159 Sugar Free Red Bull 77
Monster Lobo 195 Upshot Energy Shot 217 For comparative purposes, previous studies conducted by our group have demonstrated the following caffeine content data: (1) coffee – 58 to 259 mg/serving; (2) energy drinks – none detected to 141 mg/serving; and (3) carbonated soda – none detected to 48 mg/serving. In conclusion, the caffeine content of the energy shots is remarkably high in consideration of the serving size. Thus, the ingestion of multiple servings of energy shots could result in caffeine intoxication. Keywords: Energy Shot, Caffeine, Gas Chromatography

SOFT 2010 Annual Meeting Richmond, VA
P58 Characterization of Commercially-Available Herbal Incense Products Using QuEChERS Extraction and GCxGC-TOFMS
Amanda Rigdon*1, Jack Cochran1 and Paul Kennedy2. 1Restek Corporation, Bellefonte, PA; 2Cayman Chemical, Ann Arbor, MI In the past few years, a new product called ‘K2’, ‘spice’, or ‘legal marijuana’ has gained popularity. Although there are many products marketed as herbal incense, all are mixtures of herbs such as pink lotus, marshmallow, and baybean. These mixtures are not marketed for human consumption, but there have been many reports of cannabis-like highs when these products are smoked. Even though these blends are marketed as containing only natural products, some blends, such as Spice Gold, have been found to contain synthetic cannabinoids such as JWH-018, JWH-072, HU-210, as well as several other analogs. It is believed that these unlisted ingredients are responsible for the ‘high’ experienced by the user rather than from the other natural ingredients present in the product. Since these are relatively new products, there is little data available regarding the analysis of samples containing synthetic cannabinoids. Since herbal incense is a mixture of unknown dried plant material, the matrix for sample analysis is extremely complex, which can lead to problems in identifying and quantifying analytes of interest. Several years ago, QuEChERS (Quick, Easy, Cheap, Effective, Rugged, Safe) was adopted by the food safety industry for the extraction of a wide range of pesticides and other residues from food matrices. While QuEChERS is relatively new to the field of forensics and forensic toxicology, this approach can also prove useful in the extraction of a wide range of drug products from very complex matrices. When coupled with a comprehensive two-dimensional gas chromatographic (GCxGC) system and a time-of-flight mass spectrometer (TOFMS), drug compounds can be efficiently separated from complex matrices, while at the same time gathering a large amount of data on the sample matrix itself. The objective of this project was twofold: 1) to characterize the matrix for herbal incense blends by GCxGC-TOFMS and determine if differences between ‘spice’ products exist and 2) to evaluate the efficacy of QuEChERS extraction and dSPE cleanup methods coupled with GCxGC-TOFMS for the identification of synthetic cannabinoids in herbal incense matrices. Several herbal incense blends including Spice Gold, Puff, and K2 were obtained from internet sources, and extracted using the QuEChERS approach. The extracts were then analyzed by GCxGC-TOFMS with no additional cleanup steps in order to analyze matrix components. Cleanup methods for reducing matrix interference were then investigated. The cleanup methods that will be detailed are dispersive solid phase extraction (dSPE) cleanup with varying sorbents, and cartridge SPE cleanup methodologies. The results from the various cleanup methods will be presented. The presence or absence of synthetic cannabinoids including JWH-018 and JWH-072 was determined by comparison with reference standards obtained from a reputable source. The presence of other synthetic cannabinoids for which there was no reference standard were tentatively reported based on mass spectral data from TOFMS. In conclusion, QuEChERS extraction and dSPE cleanup, coupled with GC x GC-TOFMS methodology, provides a viable approach for the identification of synthetic cannabinoids in varied and complex matrices. Keywords: Synthetic Cannabinoids, GCxGC-TOFMS, Herbal Incense
SOFT 2010 Annual Meeting Richmond, VA
P59 Quantitative Composition of Synthetic Cannabinomimetics in “Herbal High” Products Sumandeep Rana*, Victor P. Uralets, Tara Brunson and Wayne B. Ross. Redwood Toxicology Laboratory, Santa Rosa, CA Introduction: Synthetic cannabinmimetics are chemical compounds that mimic the effect of Δ9-tetrahydrocannabinol (THC), the principle active ingredient of cannabis. Like THC, they bind to cannabinoid receptors in the brain and other organs as the endogenous ligand anandamide. These cannabinoid receptor agonists, were initially developed as therapeutic agents for the treatment of pain. However, the desired properties could not be separated from unwanted psychoactive effects. Several of these cannabinoids have been detected in herbal smoking mixtures, so-called incense. These products are sold over the internet and at head shops with commercial names like K2, K3, spice, wood stock, earthquake, buzz, pulse and many more. They do not contain cannabis but when smoked, produce effects similar to those of cannabis. Products containing these synthetic cannabinoids are banned in many European countries, Russia and a few states in USA. The aim of our study was to quantitatively identify the main psychoactive ingredient in these preparations. Methods: Reference material for the synthetic cannabinoids was obtained from Cayman Chemicals. Thirty different “Herbal High” products were purchased over the internet. Thirty mg of each product were weighed and dissolved in 1mL of methanol. Samples were mixed for 10 min and then 100 µL of the supernatant was analyzed by EI GC/MS as free underivatized and as TMS- derivatives. After identification of the active ingredients, calibration curves were preprared for the respective compounds using reference material. Three, 30 mg samples of each product were quantitatively analyzed. JWH-compounds were analyzed without derivatization using Fentanyl-D5 as the internal standard and CP47,497-C8 was analyzed after TMS derivatization using 11-nor-9-carboxy ΔTHC-D3 as the internal standard. Results: Thirteen products out of the 30 contained only JWH-018 with concentration ranging from 6 to 28 mg per 1g of the plant material. Nine products (including 8 flavors of K2 tested) contained both JWH-018 and JWH-073 with JWH-073 concentration equal to or exceeding that of JWH-018 except one where the concentration of JWH-018 was greater than JWH-073. The concentrations of JWH-018 and JWH-073 in these preparations were between 8-23 and 6-29 mg/g of the plant material respectively. Four products contained only CP47, 497-C8 homologue with concentrations ranging from 10 to 14 mg/g. Fout products were found to contain three drugs, CP 47,497-C8, JWH-073 and JWH-250 in an approximate ratio of 7:2:1. The concentrations of the active compounds in these were 5-13 mg/g, 2-4 mg/g and 1-2 mg/g of the plant material respectively. Conclusion: K2 flavors were found to contain the highest concentrations of active ingredients. Considerable variations between three replicates of some brands (up to 34%) suggest uneven distribution of drugs in the plant material. Keywords: Synthetic Cannabinoids, JWH-Compounds, Herbal High Composition
SOFT 2010 Annual Meeting Richmond, VA
P60 Detection of Cannabimimetic Compounds in Mice Blood after Exposure to “Buzz” Smoke
Brenda J. Haggerty*1, Justin L. Poklis2, Carl E. Wolf3, Laura E. Wise2, Jason M. Wiebelhaus2, Aron H. Lichtman2 and Alphonse Poklis1,2,3. Departments of 1Forensic Science, 2Pharmacology and Toxicology, and 3Pathology, Virginia Commonwealth University, Richmond, VA Since 2004, various herbal incense products such as Spice, Buzz, Pulse, K2 and Black Magic have been available via the internet and at various retail outlets. These products reported to be blends of plants material capable of producing a marijuana-like high when smoked. DNA testing showed that the plant species listed as ingredients were not always present. Chemical analyses performed on these products have identified a variety of synthesized cannabimimetic compounds present. These compounds interact with the CB1 receptors in the nervous system in a similar manner to Δ9-tetrahydrocannibinol (THC), the main active compound in marijuana. We will present a method to identify and quantify in blood six cannabimimetic compounds identified in herbal incense products by high performance liquid chromatography/mass spectrometry/mass spectrometry (HPLC/MS/MS). A HPLC/MS/MS method was developed for the analysis of cannabimimetics; JWH-018, JWH-073, JWH-250, JWH-398, HU-210, and CP-47,497, along with THC and its carboxylic acid metabolite THCA, in blood using an Applied Biosystems 3200 Q trap with a turbo V source for TurbolonSpray attached to a Shimadzu SCL HPLC system. The compounds were isolated by liquid/liquid extraction using cold acetonitrile. Chromatographic separation was performed under isocratic conditions using 20% water with 10mM ammonium acetate and 80% acetonitrile mobile phase on a Zorbaz eclipse XDB-C18 column, 4.6 x 75 mm, 3.5 micron (Agilent Technologies, USA). The following transition ions (m/z) were monitored by multi reaction monitoring (MRM) in positive ion mode: JWH-018 (342> 155, 342> 127) , JWH-073 (328> 155, 328> 127), JWH-250 (336> 121, 336> 91), JWH-398 (376> 189, 376> 161), THC (315> 318, 315> 259); and in negative ion mode: HU-210(385> 367, 385> 301), CP-47,497 (317> 299, 317> 245), and THCA (343> 299, 343> 245). THC-d3 (318> 196) and THCA-d3 (346> 302) were used as internal standards for the positive and negative mode ions respectively. Linearity was determined for THC, JWH-018, JWH-073, JWH-398, and THCA at 1-200 ng/mL and for HU-210 and CP-47,497 at 1-100 ng/mL. The limit of Detection (LOD) was set at 1ng/mL. Six C57BL6 mice were sacrificed twenty minutes after exposure to the smoke of 200 mg of the herbal incense product sold “Buzz” found to contain: JWH-018, 5.4 mg/mg; JWH-250 ng/mg and JWH-398, 113ng/mg. The blood concentrations were determined for JWH-018; 77, 68, 54, 166, 63 and 66 ng/mL. JWH-250 and JWH-398 were not detected. The presented method was able to detect and quantify the cannabimimetic, JWH-018, in blood after exposure to the smoke of the herbal incense product “Buzz”. The animal study was approved by the Institutional Animal Care and Use Committee of Virginia Commonwealth University in accordance with the National Institute of Health Guide for the Care and Use of Laboratory Animals. This project was supported by the National Institute on Drug Abuse (NIDA) Center for Drug Abuse grant R01DA02396, R01DA03672, and P50DA005274. Keywords: Cannabinoids, Cannabimimetic, LC/MS/MS

SOFT 2010 Annual Meeting Richmond, VA
P61 Driving Under the Influence of Drugs: Analysis of Phenazepam in Blood Albert A. Elian*1 and Jeffery Hackett2. 1Massachusetts Police State Crime Laboratory, Sudbury, MA; 2UCT, Bristol, PA In this presentation, attendees will learn about the extraction and analysis of a non common benzodiazepine (Phenazepam) in a drugs and driving case. Use of this information should allow forensic toxicologists to better interpret data on this drug. Method: In this method (which makes use of mixed mode solid phase extraction (SPE) columns), whole blood (calibrators, controls, and case samples) was adjusted to pH 6 with 0.1 M phosphate buffer (3 mL) and an internal standard (diazepam-d5) added. The samples were applied to C8/SCX SPE columns preconditioned with methanol, deionized (DI) water, and phosphate buffer (3, 3, and 1 mL, respectively). After washing the SPE with DI water, acetic acid, methanol, and drying, elution was performed with 3 mL of dichloromethane/isopropanol/ ammonium hydroxide (78:20:2 (v/v/v). The samples were then evaporated and dissolved in mobile phase (50 µL). Liquid chromatography was performed in gradient mode employing a 50 x 2.0 mm C18 analytical column and a mobile phase consisting of acetontitrile and 0.1% aqueous formic acid at a flowrate of 0.5 mL/ minute. The gradient was programmed to run from 5% to 90% acetonitrile in 4.0 minutes and then back to 5% for re-injection. The total run time for each analysis was less than 5 minutes. In this presentation, representative chromatograms are shown to illustrate the efficiency of the chromatography and analysis. Tandem mass spectrometry was performed in positive multiple reaction monitoring (MRM) mode using the following transitions: 350.8 to 206.3, 104.1 for phenazepam, and 290.1 to 198.3, 154.3 for diazepam-d5, respectively (details presented). Results: The limits of detection/ quantification for this method were determined to be 0.5 ng/ mL and 1.0 ng/ mL, respectively for phenazepam. The SPE method was found to be linear from 1.0 ng/ mL to 100 ng/ mL (r2>0.999). The recovery of phenazepam was found to be > 90%. Interday and Intraday analysis of phenazepam were found to < 5% and < 8%, respectively. Matrix effects were determined to be < 6%. The case sample was found to contain 9 ng/ mL of phenazepam in whole blood. Conclusion: Phenazepam is a relatively new drug to forensic toxicologists involved in driving cases, and this method and data should add to the body of knowledge relating to the analysis of this drug in such cases. The use of SPE and liquid chromatography-tandem mass spectrometry should permit forensic toxicologists analyze it efficiently. Keywords: Phenazepam, LC-MS/MS, SPE
SOFT 2010 Annual Meeting Richmond, VA
P62 Implementation of the Randox Evidence in Forensic Casework Samantha Beauchamp*, Jacquelyn Beeson and Michele Glinn. Michigan State Police Forensic Laboratory, Lansing, MI The Randox Evidence instrument performs biochip-based chemiluminescent immunoassays. The analyzer is fully automated, with high-throughput capability, able to perform up to 1800 tests on 90 samples/day. Analytical panels per chip include amphetamine, methamphetamine, MDMA, benzodiazepines, oxycodone, opiates, opioids, benzoylecgonine, barbiturates, fentanyl, propoxyphene and others. The Toxicology Unit of the Michigan State Police (MSP) has been using the Evidence as a screening assay for drugs of abuse in blood and urine in forensic casework since June 2009. Prior to that time, the Unit used the Abbott AxSYM as a fluorescent-polarization immunoassay screen. The AxSYM employed panels for amphetamines, barbiturates, benzodiazepines, opiates, cannabinoids, cocaine metabolites and methadone and had a throughput capability of approximately 350 tests on 50 samples/day. Caseload increase over the previous several years, however, had made it imperative that the Unit implement a technique with greater throughput and more versatile detection capabilities. Before discontinuation of the AxSYM, cases were run concurrently on both instruments to validate the Evidence results. Duplicate aliquots of blood or urine were prepared for analysis according to the manufacturer’s protocols, and run in parallel on each instrument. Positive results were confirmed by solid phase extraction utilizing GC/MS. The Randox Evidence compares favorably with the AxSYM in turnaround time, sensitivity and specificity. A total of 3565 tests on the Evidence resulted in 19 false positives (FP) and 1 false negative (FN) as compared with 31 FP and 0 FN in 1666 tests on the AxSym for the same samples. Total FP and FN rates on the Evidence were 0.5% and 0.03% as compared with 1.9% and 0% respectively on the AxSYM. The panel with the highest FP rate was the methadone assay on the AxSYM and MDMA on the Evidence. Those with zero false positives in the samples tested on the Evidence were amphetamines, benzodiazepines 2 (lorazepam), barbiturates, methadone, cocaine metabolites, and opioids. The lowest FP rate for the AxSYM was cocaine metabolites with one. Careful selection of the assay cutoff threshold minimized FN on both instruments. On the Evidence, centrifugation was found to also reduce the amount of FN. Some analytes the Evidence was able to detect that the AxSYM could not were propoxyphene and fentanyl. In addition, a number of prescription drugs that are used in lower levels were better detected by the Evidence than the AxSYM due to the specificity of the Randox opiate, opioid and benzodiazepine assays. Implementation of the Evidence has helped case throughput in the Unit, provided more detailed presumptive information to Unit scientists, and has freed up analyst and technician time to concentrate on other aspects of casework. Keywords: Randox, Immunoassay, Screen
SOFT 2010 Annual Meeting Richmond, VA
P63 Hydroxyzine Used as a Cocaine Adulterant: Street Drugs and Post Mortem Cases Emilirma Vazquez*, Maruiz Marrero, Jeanette Janer, Margarita Melendez and Maria S. Conte. Institute of Forensic Sciences of Puerto Rico, Puerto Rico In the last decade adulterants have been detected in the cocaine powder analysis. It is believed that hydroxyzine, a prescribed medication with sedative properties primarily used to treat anxiety disorders, has been used as part of the final process of converting base cocaine to HCl cocaine. Adverse effects of hydroxyzine may include dizziness, drowsiness, impairment of cognitive functions, anticholinergic effects and central nervous system depression. In the Puerto Rico Controlled Substances Laboratory GC/MS method are commonly found lidocaine, procaine, benzocaine, quinine and xylazine as cocaine adulterants. Over the last years in the Toxicology Laboratory there has been an increase of postmortem cases with a combination of both drugs: hydroxyzine and cocaine. These increase bring us the curiosity to explore cocaine adulterants to confirm our assumption that hydroxyzine was ingested unadvertised with the cocaine consumption. Around 300 samples of street cocaine from the Controlled Substances Laboratory at the Institute of Forensic Sciences of Puerto Rico were analyzed focusing on detecting cocaine and hydroxyzine as an adulterant using an MRM method via UPLC Tandem mass spectrometry. The results from the analyzed samples confirm the emergence of hydroxyzine as an adulterant of cocaine and the relation with the postmortem cases found in the Toxicology Laboratory. Keywords: Cocaine, Hydroxyzine, Adulterant
SOFT 2010 Annual Meeting Richmond, VA
P64 Seized Drug Heroine / Xylazine Quantification and Analytical Toxicology Analysis of Related Deaths
Luz A. Silva-Torres*1,3, Maritza Arrocho1, Jeanette Janer-Figueroa1, Laura Pérez-Cruz1, Margarita Meléndez-Negrón1, Kazandra Ruiz-Colón1, Rebecca Soler-Rodríguez2, José A. Rivera-Nevarez1, María S. Conté-Miller1 and Diógenes Herreño-Sáenz2. 1Puerto Rico Institute of Forensic Science; 2Services Administration of Mental Health and Addiction; 3University of Puerto Rico, Medical Science Campus, Pharmacology and Toxicology Department, Puerto Rico One of the most frequently abused drug in the word is heroine. The illicit production and trafficking of this potent and addictive drug continues to be a great concern to law enforcement agencies and forensic toxicologist’s analysis. Xylazine has been found to be the main adulterant of heroine in Puerto Rico during the last 5 years. Actually the use of Xylazine a α2 agonist, non-narcotic sedative has been observed as recreational drug not only in the addict’s population in Puerto Rico but also in the USA, South America and Europe. Xylazine is mainly used in veterinary medicine and not approved for human’s consumption. The drug abusers use Xylazine alone and also as principal adulterant of the heroine, because Xylazine enhance effects of heroine. The analysis of seized drug brings important information of quantity and composition that street drug abuser was consumed. For this study a total of 80 samples of seized drug were analyzed for Heroine/Xylazine quantification by the Controlled Substance Section at the Puerto Rico Institute of Forensic Science (PRIFS). The analysis was performed using GC/MS. 68% of the samples analyzed contained Heroine with Xylazine, of which 11.11% was only Xylazine without Heroine. Other adulterants identified in the analyzed samples were: quinine and procaine in 71%, caffeine also were detected in 35%. In addition blood, urine and humor vitreous samples of 10 Heroine/ Xylazine related deaths were analyzed using LC/MS at the PRIFS’s Medico Legal and toxicology laboratory. Levels of 6-monoacetylmorphine, Xylazine, morphine, codeine, benzoylecgonine and cocaine were measure in all samples. The results found in this study indicated that Xylazine is used as an abuse drug alone and in combination with others. In addition our results provide useful information to the law enforcement agencies to regulate the Xylazine distribution and a possible inclusion as a controlled substance. Xylazine/heroine-overdose deaths are now more prevalent than in previous years. This fact underscores the need to develop analytical methodologies for detection of xylazine within forensics because currently there are not any assays available for Xylazine. Xylazine is approved by the FDA only for animal use. Our data indicates that it is being used by humans in high-risk situations such as drug abuse. Thus further toxicological study is warranted to assess health risks in this population. Keywords: Xylazine, Poly-Drug, Toxicity

SOFT 2010 Annual Meeting Richmond, VA
P65 The High Prevalence of Cathinone-Derivatives in Suicides - a Comparative Study Emma Durkin*, Simon Elliott and Julie Evans. (ROAR) Forensics Ltd, Malvern, UK Recently, synthetic derivatives of cathinone (from the Catha Edulis plant) have been an increasingly abused drug group. They include beta-keto versions of the amphetamines. Commonly termed “Legal Highs” due to the absence of international control, compounds include; mephedrone (4-methylmethcathinone), methylone (bk-MDMA), butylone (bk-MBDB), methedrone (bk-PMMA), flephedrone (fluoromethcathinone), and methylenedioxypyrovalerone (MDPV). During routine toxicological analysis of a wide range of deaths, cathinones have been observed to be present mostly in suicides in comparison to other manners of death. In order to evaluate the relative significance of this observation, a comparative study of the types and prevalence of other drugs in suicides has been performed. Between 2009-2010 (over 3500 cases), 16.5% of all post mortem cases submitted involved mechanical suicide (hanging, gunshot, asphyxiation and engine fumes). The predominant drugs detected (excluding alcohol) were: paracetamol (13.4% of suicides), citalopram (12.7%), diazepam (8.4%), mirtazapine (8.0%), zopiclone (6.9%) and cocaine (6.5%). Cathinones (mainly mephedrone) only accounted for 0.01% of all suicides but of all cases where cathinones were detected (n=15), 60.0% involved mechanical suicide. Comparatively, in cases where paracetamol was found, 11.5% of these were mechanical suicides, 20.8% for citalopram, 11.3% for diazepam, 27.2% for mirtazapine and 21.1% for zopiclone. Additionally, although not in the top five drugs found in suicides, due to a potential link of suicidal ideation and use of selective serotonin reuptake inhibitor (SSRI) antidepressants, paroxetine, sertraline and fluoxetine were also evaluated. In cases where paroxetine was found, 6.5% of these were mechanical suicides, 22.5% for sertraline and 19.4% for fluoxetine. These comparative data indicate that there is a high degree of prevalence of cathinone-derivatives in cases of mechanical suicide, compared to other drugs found in such case types. It would be expected that anti-depressants (such as citalopram and mirtazapine) feature frequently in suicides due to the likely depressive state of the deceased. Also, stimulant drugs such as cocaine may feature due to a potential low mood or depression as a result of the come down effects. This reason may explain the observed high prevalence of cathinones in suicides and has been supported by anecdotal information from users and suicidal awareness groups. Although this is based on a relatively small number of cases, these have only occurred very recently and represent a small time period compared to the other drugs evaluated. Therefore, comprehensive toxicological analysis to encompass cathinone drugs may benefit the wider investigation of suicides. Keywords: Suicide, Cathinones, Mephedrone
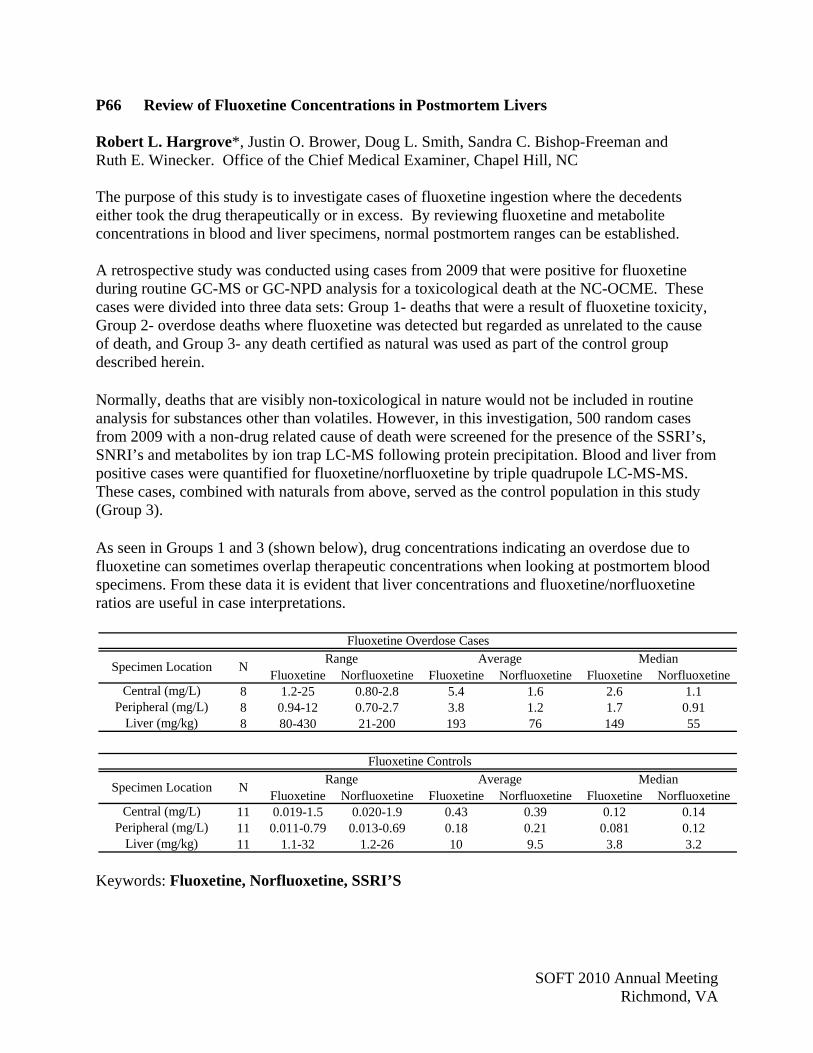
SOFT 2010 Annual Meeting Richmond, VA
P66 Review of Fluoxetine Concentrations in Postmortem Livers Robert L. Hargrove*, Justin O. Brower, Doug L. Smith, Sandra C. Bishop-Freeman and Ruth E. Winecker. Office of the Chief Medical Examiner, Chapel Hill, NC The purpose of this study is to investigate cases of fluoxetine ingestion where the decedents either took the drug therapeutically or in excess. By reviewing fluoxetine and metabolite concentrations in blood and liver specimens, normal postmortem ranges can be established. A retrospective study was conducted using cases from 2009 that were positive for fluoxetine during routine GC-MS or GC-NPD analysis for a toxicological death at the NC-OCME. These cases were divided into three data sets: Group 1- deaths that were a result of fluoxetine toxicity, Group 2- overdose deaths where fluoxetine was detected but regarded as unrelated to the cause of death, and Group 3- any death certified as natural was used as part of the control group described herein. Normally, deaths that are visibly non-toxicological in nature would not be included in routine analysis for substances other than volatiles. However, in this investigation, 500 random cases from 2009 with a non-drug related cause of death were screened for the presence of the SSRI’s, SNRI’s and metabolites by ion trap LC-MS following protein precipitation. Blood and liver from positive cases were quantified for fluoxetine/norfluoxetine by triple quadrupole LC-MS-MS. These cases, combined with naturals from above, served as the control population in this study (Group 3). As seen in Groups 1 and 3 (shown below), drug concentrations indicating an overdose due to fluoxetine can sometimes overlap therapeutic concentrations when looking at postmortem blood specimens. From these data it is evident that liver concentrations and fluoxetine/norfluoxetine ratios are useful in case interpretations.
Keywords: Fluoxetine, Norfluoxetine, SSRI’S
Fluoxetine Norfluoxetine Fluoxetine Norfluoxetine Fluoxetine Norfluoxetine8 1.2-25 0.80-2.8 5.4 1.6 2.6 1.18 0.94-12 0.70-2.7 3.8 1.2 1.7 0.918 80-430 21-200 193 76 149 55
Fluoxetine Overdose Cases
NMedian
Peripheral (mg/L)
Specimen LocationRange Average
Liver (mg/kg)
Central (mg/L)
Fluoxetine Norfluoxetine Fluoxetine Norfluoxetine Fluoxetine Norfluoxetine11 0.019-1.5 0.020-1.9 0.43 0.39 0.12 0.1411 0.011-0.79 0.013-0.69 0.18 0.21 0.081 0.1211 1.1-32 1.2-26 10 9.5 3.8 3.2Liver (mg/kg)
Specimen LocationRange Average
Peripheral (mg/L)Central (mg/L)
NMedian
Fluoxetine Controls
SOFT 2010 Annual Meeting Richmond, VA
P67 Flunarizine Distribution in a Suicidal Hanging Claire Naso, Rebecca A. Jufer, Barry Levine*, Mary G. Ripple and David R. Fowler. Office of the Chief Medical Examiner, Baltimore, MD Flunarizine is a calcium antagonist drug used in various parts of the world as an anticonvulsant and as a prophylactic treatment for migraine headaches. It provides direct action on the brain without affecting calcium channels in the heart and without inducing vasodilatation. A case is presented where flunarizine was detected in the postmortem specimens. Specifically, a 28 year old female from India was found dead at home by her husband. Remarkable findings during the postmortem examination included ligature marks around the neck, petechiae of the face and conjunctivae, hemorrhage in the neck muscles, focal fractures of the hyoid bone and laryngeal cartilage and hesitation cutting wounds on the left wrist. Various antidepressants, pain medications and empty packets of flunarizine were found at the scene. Routine volatile, therapeutic drug and abused drug testing was performed on the heart blood in this case. This included 1) methanol, ethanol, acetone and isopropanol analysis by head space gas chromatography (GC), 2) acid/neutral drug screen by GC-nitrogen-phosphorus detection (NPD), 3) alkaline drug screen by GC-NPD; 4) acetaminophen and salicylate by color test and 5) morphine and benzodiazepines by enzyme-linked immunosorbent assay (ELISA). The acetaminophen color test was positive and the alkaline drug screen was positive for tramadol and flunarizine. Acetaminophen was confirmed by ELISA and GC. Tramadol and flunarizine were confirmed by full scan electron ionization gas chromatography/mass spectrometry. The heart blood contained 2.3 mg/L tramadol, 30 mg/L acetaminophen and 0.26 mg/L flunarizine. The peripheral blood tramadol concentration was 2.1 mg/L and the peripheral blood flunarizine concentration was 0.20 mg/L. Following chronic use, steady state flunarizine concentrations are reported in the 0.1 mg/L range. Flunarizine was also quantitated in the bile (<0.1 mg/L), liver (0.54 mg/kg) and kidney (0.11 mg/kg) Flunarizine was quantitated using the alkaline drug screen routinely employed by this laboratory. This involves an intital alkaline extraction into chlorbutane, back extraction into weak sulfuric acid, re-extraction into dichloromethane after alkalinization of the acid, and solvent evaporation. No derivatization was required. It eluted on a DB-5 column in the range of other calcium channel blockers such as verapamil and diltiazem. The limit of quantitation was 0.1 mg/L; the upper limit of linearity was 2.0 mg/L. Based on the scene investigation and autopsy findings in the case, the medical examiner ruled that the cause of death was hanging. Tramadol and flunarizine intoxication were other significant findings contributing to death. The manner of death was suicide. Keywords: Flunarizine, Postmortem, Hanging

SOFT 2010 Annual Meeting Richmond, VA
P68 Huffing: Two Deaths Involving 1,1-Difluoroethane C. Clinton Frazee III*1, Steven W. Fleming1, Uttam Garg1, Mary H. Dudle2, Daniel C. Lingamfelter2 and Kamal Sabharwal2. 1 Children’s Mercy Hospitals and Clinics, Department of Pathology and Laboratory Medicine, Kansas City, MO; 2Office of the Jackson County Medical Examiner, Kansas City, MO 1,1-Difluoroethane (DFE) has been identified in several huffing cases across the country within recent years. DFE is an inhalant with a potential for abuse and is used as a propellant in many aerosol products, including canned air. Canned air can be purchased for relatively low cost at most computer supply retail stores thereby making DFE easily obtainable. Inhaling DFE results in temporary paralysis followed by a euphoric high. Like huffing in general, inhaling DFE can cause damage to the brain, heart, liver, kidneys and lungs, and even lead to death. DFE is typically not included in a routine toxicology screen and could easily be overlooked without the appropriate case history information and/or anatomical pathology findings. We present two unrelated cases of suspected huffing in which death occurred and 1,1-Difluoroethane was indicated. Toxicology testing was completed for each case in-house using enzyme immunoassay (EIA), gas chromatography (GC), high performance liquid chromatography (HPLC) and gas chromatography/mass spectrometry (GC/MS). Femoral blood specimens from each case were submitted to a reference laboratory for 1,1-Difluoroethane quantitation by gas chromatography/mass spectrometry (GC/MS). In the first case, a 24 year old man reported by a witness to have been drinking a lot was found dead with a can of compressed air next to him. Toxicology testing performed on femoral blood yielded the following results: acetaminophen (not quantitated), ethanol 92 mg/dL and 1,1-Difluoroethane 61 mcg/mL. The cause of death was ruled to be acute 1,1-Difluoroethane and ethanol intoxication. In the second case, a 33 year old man with a history of hypertension, alcohol abuse and huffing inhalants was found dead on the floor with a can labeled “Maxell Blast Away” located on the bed next to him. Toxicology testing on femoral blood yielded the following results: alprazolam 41 ng/mL, sertraline 180 ng/mL and 1,1-Difluoroethane 230 mcg/mL. The cause of death was ruled to be 1,1-Difluoroethane toxicity. Keywords: 1,1-Difluoroethane (DFE), Huffing, Inhalant
SOFT 2010 Annual Meeting Richmond, VA
P69 Relative Distribution of Amitriptyline, Citalopram and Metabolites in Decomposed Skeletal Tissues: A Role for Parent Drug-Metabolite Ratios?
James H. Watterson*1, Nathalie A. Desrosiers1, Dorothy E. Dean2 and John F. Wyman3. 1Forensic Toxicology Research Laboratory, Department of Forensic Science, Laurentian University, Sudbury, Ontario; 2Summit County Medical Examiner's Office, Akron, OH; 3Cuyahoga County Regional Forensic Science Laboratory, Cleveland, OH Selected skeletal tissues of a single pig were analyzed for the relative levels of amitriptyline (AMI), nortriptyline, (NORT), citalopram (CIT) and desmethylcitalopram (DMCIT), following acute oral administration of a cocktail containing 75 mg/kg amitriptyline, 7 mg/kg citalopram 7.5 mg/kg diazepam and 0.8 mg/kg morphine. Following euthanasia by an intracardiac administration of pentobarbital, the pig was allowed to decompose outdoors in rural Ohio for nearly 2 years. Samples (5 g) of rib, vertebrae, pelvis and mandible were ground and incubated in methanol (10 mL) for 72 hours at 50 oC. Drug-free porcine scapula was used as a control tissue. Methanolic extracts and washes were collected and evaporated and residues were reconstituted in phosphate buffer (PB6: 0.1 M, pH 6, 2 mL). Samples were acidified with 100 uL glacial acetic acid, and internal standard (250 ng desipramine) was added to each sample. Lipids and proteins were precipitated through addition of cold acetonitrile:methanol mixture (1:1 v/v, 3 mL), followed by storage at -20 oC for roughly 1 hour. Following centrifugation (3700 rpm, 10 min), supernatants were collected and evaporated to approximately 2 mL at 70 oC under a gentle stream of air. Sample volumes were adjusted to approximately 4 ml with PB6, and extracted by solid phase extraction (SPE) using mixed-mode SPE columns. Extracts were evaporated to dryness and reconstituted in 300 uL 0.1% formic acid in 90:10 (v/v) deionized water:acetonitrile (UHPLC solvent A). Samples were analyzed by UHPLC using isocratic conditions (85:15 A:B; A - 0.1% formic acid in 90:10 (v/v) deionized water:acetonitrile, B - acetonitrile). Quantitative comparisons were made using integrated peak areas measured at 240 nm, with UV spectra and retention time used as compound identifiers. Analysis of variance (ANOVA, 1-way) data showed bone tissue type to be a main effect (p < 0.05) for mass-normalized response ratios (RR/m = (A(240 nm)DRUG/A(240 nm)ISTD/m) and for the ratio of responses of each drug and its respective metabolite. AMI and NORT levels varied by as much as 25-fold and 16-fold, respectively, while CIT and DMCIT levels varied by as much as 17-fold and 13-fold, respectively, between different bone types. However, ratios of AMI/NORT and DIT/DMCT varied by less than 3-fold between the different tissue types. These data suggest that substantial variability may exist in measured drug levels depending on the anatomic site of bone collection. However, since variability in the ratio of assay responses to drug and metabolite was much lower, such measurements should be investigated further to determine if they can provide information about the nature of a given drug administration in cases of extreme decomposition. Keywords: Amitriptyline, Citalopram, Skeletal Tissues

SOFT 2010 Annual Meeting Richmond, VA
P70 Relative Distribution of Ketamine and Norketamine in Skeletal Tissues Following Various Periods of Decomposition
James H. Watterson and Joseph P. Donohue. Forensic Toxicology Research Laboratory, Department of Forensic Science, Laurentian University, Sudbury, Ontario, Canada Selected decomposed skeletal tissues of rats were analyzed for the relative levels of ketamine (KET) and norketamine (NKET) following acute exposure to ketamine (75 mg/kg i.p.) in order to examine if significant site-dependent variation in ketamine and norketamine levels were present, and whether the extent of decomposition was influential. Following euthanasia by decapitation, drug-free (n=4) and drug positive (n=16) animals decomposed in a rural outdoor setting in Ontario for 1 or 2 weeks. Skeletal remains were recovered and selected tissues were used in this analysis. Vertebrae, tibiae and humeri from each animal were ground and samples (0.2-0.3 g) incubated in methanol (3 mL) for 72 hours at 50 oC. Methanolic extracts and washes were collected and evaporated and residues were reconstituted in phosphate buffer (PB6: 0.1 M, pH 6, 2 mL). Samples were acidified with 100 uL glacial acetic acid, and internal standard (200 ng D4-ketamine) was added to each sample. Lipids and proteins were precipitated through addition of cold acetonitrile:methanol mixture (1:1 v/v, 3 mL), followed by storage at -20 oC overnight. Following centrifugation (3700 rpm, 10 min), supernatants were collected and evaporated to approximately 2 mL at 70 oC under a gentle stream of air. Sample volumes were adjusted to approximately 4 ml with PB6, and extracted by solid phase extraction (SPE) using mixed-mode SPE columns. Extracts were evaporated to dryness and reconstituted in 100 uL ethyl acetate. Samples were analyzed by GC/MS (EI-SIM). Ions monitored were m/z 180, 167, 152 (KET); m/z 166, 167, 131 (NKET); and 184, 156 and 213 (D4-KET). Quantitative comparisons were made using ions shown in bold font. Relative drug levels were compared between tissue types and different decomposition periods by comparison of the mass normalized response ratio (RR/m = [Adrug/AISTD)]/msample). Analysis of variance (ANOVA, 1 way) data showed bone tissue type to be a main effect (p < 0.05) for RR/m, and for the RR/m ratio KET/NKET for all decomposition times, except in the case of the KET/NKET ratio measured in fresh tissues. KET and NKET RR/m levels varied by as much as 68-fold and 66-fold, respectively, between the different tissue types, while the RR/m ratio KET/NKET varied only by as much as 7-fold between tissue types. There was no significant effect of decomposition time except for vertebral NKET RR/m values, and the vertebral KET/NKET RR/m ratio (p < 0.01). These data suggest that substantial variability may exist in measured drug levels depending on the anatomic site of bone collection. However, since variability in the ratio of assay responses to drug and metabolite was much lower, such measurements should be investigated further to determine if they can provide information about the nature of a given drug administration in cases of extreme decomposition. Keywords: Ketamine, Norketamine, Skeletal Tissues

SOFT 2010 Annual Meeting Richmond, VA
P71 New Emit® II Plus 6-Acetylmorphine Assay+ on the AU® Clinical Chemistry Systems++
N. Morjana*, J. Warren, D. Clark and G. Siefring. Siemens Healthcare Diagnostics, Newark, DE Background: 6-Acetylmorphine (6-AM) is a heroin metabolite and its presence in urine specifically confirms the illicit use of heroin. A new Emit® II Plus 6-AM Assay for human urine screening is currently being developed on the AU® analyzers (Beckman Coulter Inc.). The assay has a cutoff of 10 ng/mL. It will meet the new Substance Abuse and Mental Health Services Administration (SAMHSA) guidelines for federal workplace testing. The assay consists of two reagents that will provide qualitative and semi-quantitative results. The data, presented in this study, was generated on the AU400® analyzer. Similar performance was obtained on the AU640® and AU2700® analyzers. Methods: Precision was evaluated using the cutoff and ± 25% controls according to CLSI EP5-A2. Recovery was studied by spiking 6-AM into human urine at levels that span the calibration range (0-20 ng/mL). Calibration stability and on-instrument stability were assessed by testing the cutoff and ± 25% controls over a 31-day period. Urine specimens were analyzed and the results compared to those from the GC/MS. Cross-reactivity with structurally related drugs was assessed at different cross-reactant concentrations. The effect of common interferences was assessed by spiking the interferents into human urine in the presence of 6-AM at levels of ± 25% of the cutoff. Results: The qualitative repeatability CV’s for the cutoff and ± 25% controls ranged from 0.73-0.98 % and the within-lab CV’s ranged from 2.46-3.33 %. The semi-quantitative repeatability (ng/mL) CV’s ranged from 3.95-4.76 % and the within-lab CV’s ranged from 7.54-12.03 %. The overlap distribution between the ± 25% 6-AM controls and the cutoff was < 5%. The analytical sensitivity of the assay was found to be ≤ 2.2 ng/mL. Semi-quantitatively, the assay quantified 6-AM-spiked samples between 5-20 ng/mL within ± 20 % of nominal values. At the 10 ng/mL cutoff, the percent agreement of specimens between the new assay and GC/MS was > 95 %. The assay reagents had minimal cross-reactivity (0.03%) with the structurally related drugs, morphine morphine-3-glucuronide, morphine-6-glucuronide, and codeine. Potential interfering substances resulted in no false responses for the spiked ± 25% controls relative to the cutoff. A minimum of 7 days calibration stability was demonstrated. The reagents are stable on-board the analyzer for at least 30 days. Conclusion: The new Emit® II Plus 6-AM Assay will be a suitable screening method for urine specimens in both qualitative and semi-quantitative analyses. + Product under development - Not available for sale ++ AU®, AU400®, AU640® and AU2700® are registered trademarks of Beckman Coulter, Inc. Keywords: Immunoassay, Emit®, Heroin Metabolite
SOFT 2010 Annual Meeting Richmond, VA
P72 An Optimized SPE Protocol for Tandem LCMS or Tandem GCMS Determination of THC and Metabolites in Blood or Urine
Michael S. Young*, John Martin and Diane Diehl. Waters Corporation, Milford, MA THC and its principle metabolites may be determined in blood or urine using either GC or LC based techniques. Until the recent past, GC-MS with selected ion monitoring (GC/MS-SIM) was the most common analytical method for these analytes. This technique is still commonly utilized in forensic laboratories. However, today’s GC-MS analyst can consider tandem mass-spectrometry (GC-MS/MS) as a more selective analytical method. Although very sensitive and quite selective, all GC/MS methods require cumbersome derivatization. Tandem electrospray ionization mass spectrometry coupled with liquid chromatography (LC-MS/MS) gives performance equal or superior to GC/MS with no derivatization required. There were two goals for this presentation. The first goal was to compare tandem LC/MS with tandem GC/MS for the determination of THC and metabolites. The second goal was to develop an optimized sample preparation strategy that is suitable for ether GC-MS or LC-MS and is appropriate for both blood and urine. A straightforward SPE based sample preparation procedure is discussed using a mixed-mode anion-exchange sorbent (Oasis MAX) following simple pre-preparation steps for blood or urine. The procedure is demonstrated for both tandem GC-MS and tandem LC-MS analysis. For GC-MS analysis, the analytes were determined as silyl derivatives. Study Scope: SPE methodology was developed suitable for either LC or GC based analysis. Intraday and interday performance was evaluated for blood and urine and for both LC-MS and GC-MS analysis. Results: For urine using LC-MS/MS, intraday validation (3 curves, n = 18, 5 to 100 ng/mL) gave correlation (r2) of 0.997 and interday correlation (3 curves, n = 18) of 0.993 for COOH-THC with accuracy better than 10% at all levels. Similar results were obtained for OH-THC and THC. Replicate analysis of 0.5 ng/mL spiked samples showed RSD of 6-10 % at that level for all analytes. A very conservative estimate of LOQ is therefore 0.5 ng/mL. Very similar results were obtained for blood samples and for GC-MS/MS analysis of blood and urine. Matrix effects were minimal and SPE recoveries were better than 85% for both blood and urine samples. Method performance was consistent among multiple donor urine samples and blood samples. Conclusions: The results demonstrate the value of a single SPE protocol for preparation of blood or urine samples suitable for either LC-MS or GC-MS analysis. Detection limits, accuracy and precision are similar for both types of analysis and for both urine and blood. The improved SPE protocol is more straightforward for blood samples because no evaporation step is required prior to sample loading. Keywords: THC, Tandem Mass Spectrometry, Mixed-Mode SPE
SOFT 2010 Annual Meeting Richmond, VA
P73 A Streamlined Method for New SAMHSA Drugs of Abuse that Reduces Solvent Consumption and Sample Processing Time
Mathew Trass, Zeshan Aqeel, Michael Rummel*, Ngoc Nguyen, Carl Sanchez, Jeff Layne and Sky Countryman. Phenomenex, Torrance, CA The new SAMHSA guidelines for drugs of abuse testing in urine samples now include additional compounds like MDMA and 6-monoacetylmorphine. In addition, the concentration limits for several drug classes such as benzoylecgonine have been lowered. The combination of these two factors has the potential to increase the number of positive samples that will need confirmation, creating a need for a streamlined procedure for sample clean up and analysis. The current work demonstrates the use of a single SPE sorbent for extraction of all required analytes followed by analysis by GC/MS or LC/MS/MS. To demonstrate performance of the extraction methodology, urine samples were prepared for each drug class and spiked at 50, 100, and 125% of the SAMHSA cut off level. For those samples requiring hydrolysis, 1 mL of urine was incubated with 500 uL of ß-glucuronidase solution and allowed to hydrolyze for 3 hours at 65°C. The samples were then cooled and buffered with 500 uL of 100 mM Phosphate Buffer (pH 6.0). The sample was then centrifuged for 10 minutes at 2000 rpm and the pellet discarded. Extraction was performed using a 60mg/6cc Strata X-C strong cation exchange sorbent. Samples were loaded without conditioning of the SPE sorbent by applying a light vacuum to solvate bed and frits. The vacuum was then turned off and samples were allowed to gravity flow. Samples were washed with different buffer and organic solutions depending on the compound class. The SPE tube were then dried under full vacuum for 10 minutes and eluted with the appropriate organic solution. Samples were then evaporated to dryness and derivatized with the for GC/MS analysis based on the analyte functionality. Sample directed toward LC/MS/MS were not derivatized and simply reconstituted in mobile phase. GC/MS analysis was performed using a Zebron ZB-Drug-1 column with the MS operated in SIM mode. Calibration curves showing linearity based on the averaged response factor for three replicate samples at each calibration level were plotted with correlation figures ranging from 0.9930 to 0.9994. Analysis by LC/MS/MS allowed for simultaneous monitoring of all SAMHSA drugs well below the cut off levels with a total cycle time of 1.9 min. Calibration curves demonstrated acceptable linearity, with benzoylecgonine having an R value of 0.992 from 10 ppb – 125 ppb. Relative Standard Deviation (RSD) at the LLOQ was <15 %. The new methodology significantly decreases solvent usage and processing time, while maintaining high recoveries for all compounds. Two analysis procedures are offered allowing labs the option to use LC/MS/MS to increase sample throughput. Keywords: SAMHSA, Drugs of Abuse, SPE, LC/MS/MS, GC/MS, MDMA, 6-Monoacetylmorphine, Benzoylecgonine