
August 19, 2009 The Emerald Hotel, Bangkok - listed...
36
PTT Aromatics and Refining Public Company Limited August 19, 2009 The Emerald Hotel, Bangkok
Transcript of August 19, 2009 The Emerald Hotel, Bangkok - listed...

PTT Aromatics and Refining
Public Company Limited
August 19, 2009
The Emerald Hotel, Bangkok

2
Presentation Outline
1. Operational Results
2. Market Outlook
3. PTTAR Strategic Position

3
Operational Results
4
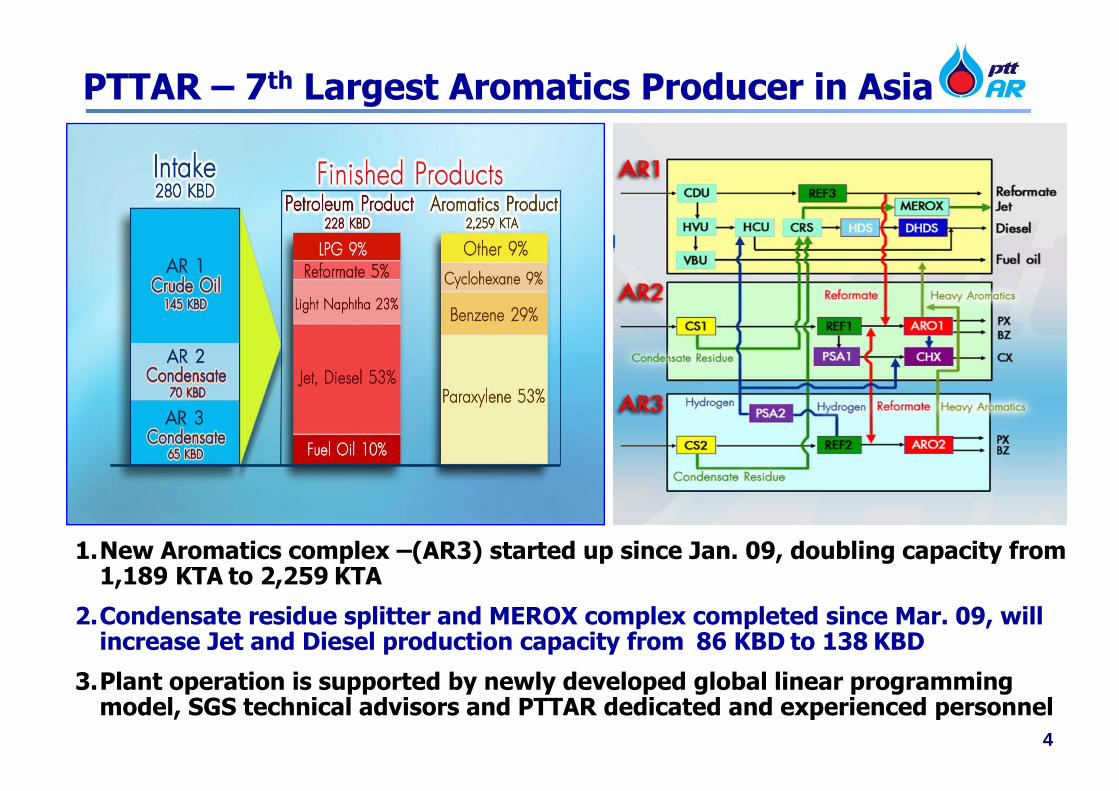
PTTAR – 7th Largest Aromatics Producer in Asia
1.New Aromatics complex –(AR3) started up since Jan. 09, doubling capacity from 1,189 KTA to 2,259 KTA
2.Condensate residue splitter and MEROX complex completed since Mar. 09, will increase Jet and Diesel production capacity from 86 KBD to 138 KBD
3.Plant operation is supported by newly developed global linear programming model, SGS technical advisors and PTTAR dedicated and experienced personnel
5
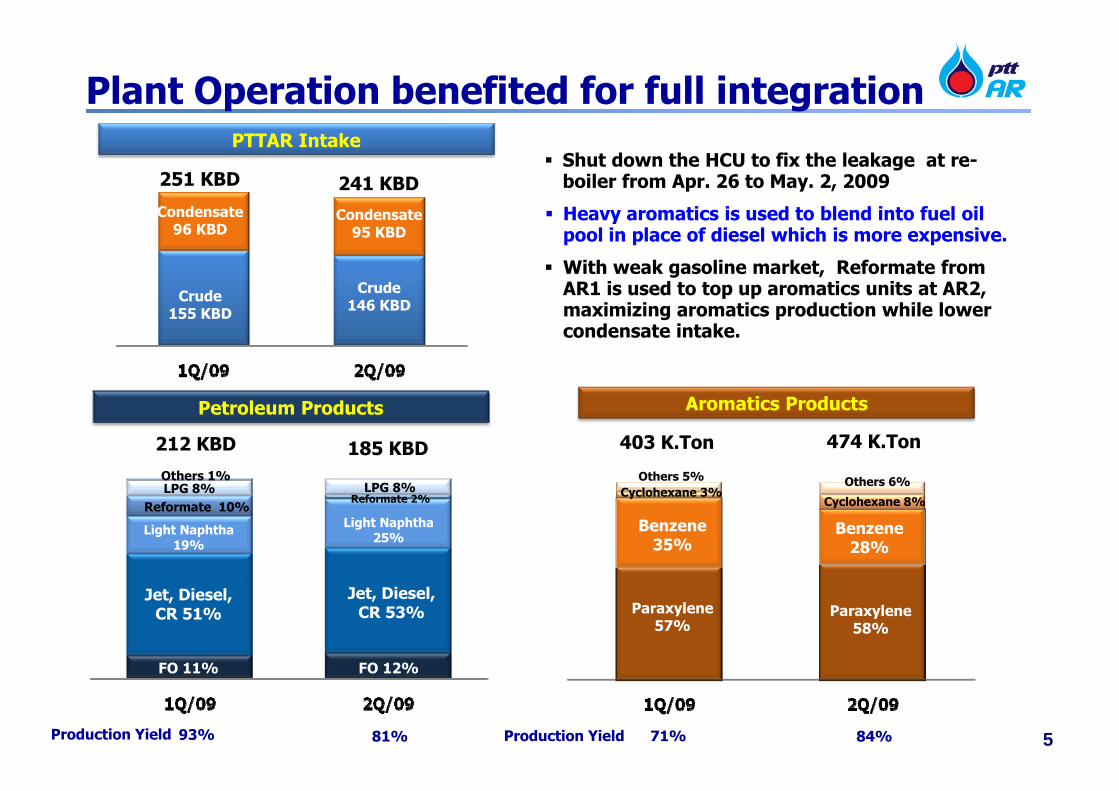
PTTAR Intake
Plant Operation benefited for full integration
Condensate96 KBD
Crude155 KBD
251 KBD
Condensate95 KBD
Crude146 KBD
241 KBD
Petroleum Products
FO 11% FO 12%
Jet, Diesel, CR 51%
Jet, Diesel, CR 53%
Light Naphtha 25%Light Naphtha
19%
Reformate 10%Reformate 2%
LPG 8% LPG 8%Others 1%
Shut down the HCU to fix the leakage at re-boiler from Apr. 26 to May. 2, 2009
Heavy aromatics is used to blend into fuel oil pool in place of diesel which is more expensive.
With weak gasoline market, Reformate from AR1 is used to top up aromatics units at AR2, maximizing aromatics production while lower condensate intake.
Aromatics Products
212 KBD 185 KBD
Paraxylene57%
Benzene35%
Paraxylene58%
Benzene28%
Cyclohexane 3%Cyclohexane 8%
Others 5% Others 6%
Production Yield
403 K.Ton 474 K.Ton
71% 84%Production Yield 93% 81%
6
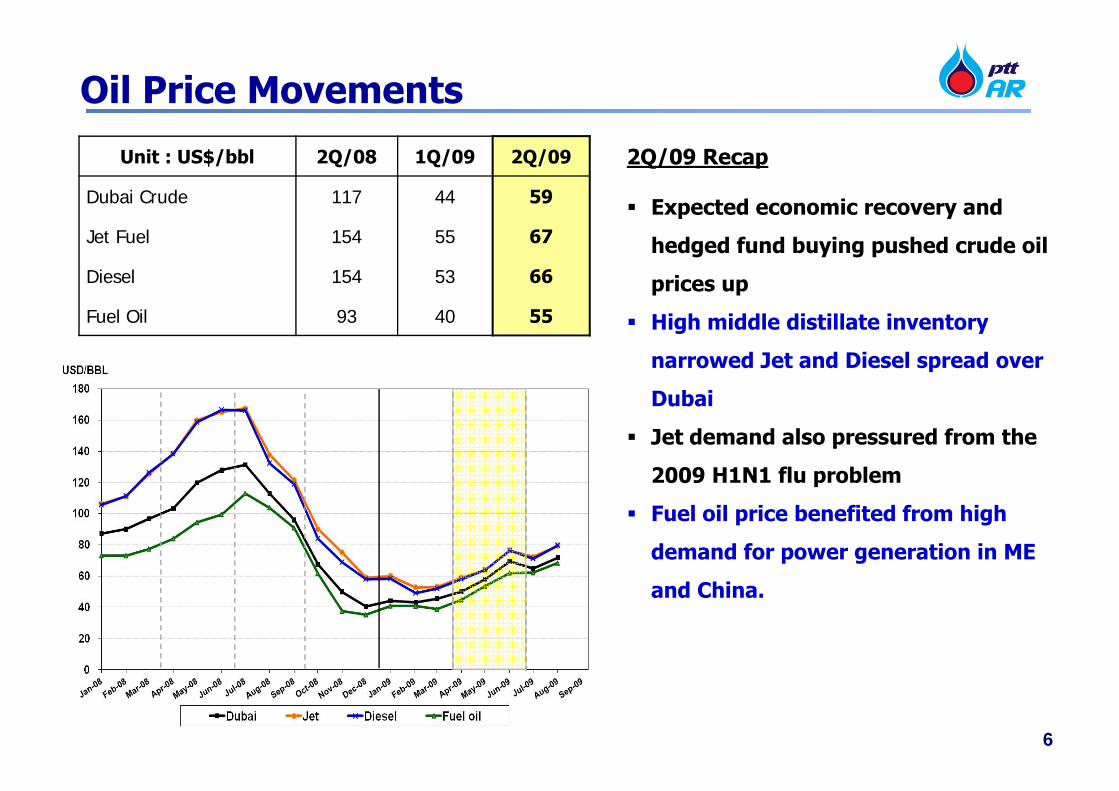
Oil Price Movements
2Q/09 Recap
Expected economic recovery and
hedged fund buying pushed crude oil
prices up
High middle distillate inventory
narrowed Jet and Diesel spread over
Dubai
Jet demand also pressured from the
2009 H1N1 flu problem
Fuel oil price benefited from high
demand for power generation in ME
and China.
Unit : US$/bbl 2Q/08 1Q/09 2Q/09
Dubai Crude 117 44 59
Jet Fuel 154 55 67
Diesel 154 53 66
Fuel Oil 93 40 55

7
Aromatics Price Movements2Q/09 Recap
PX and BZ prices were supported by
strong demand from China
China’s car sales in July grew 71%
YoY
Despite the increase in aromatics
capacities in China, the country
continued to import PX to meet
increasing demand for polyester and
PET resin
Tight supply of PX and BZ supported
strong margins throughout the
quarter
Unit : US$/Ton 2Q/08 1Q/09 2Q/09
Paraxylene 1,427 850 1,059
Benzene 1,219 386 655
Condensate 1,026 397 464
PX – Condensate 401 453 595
BZ – Condensate 193 -11 191
8
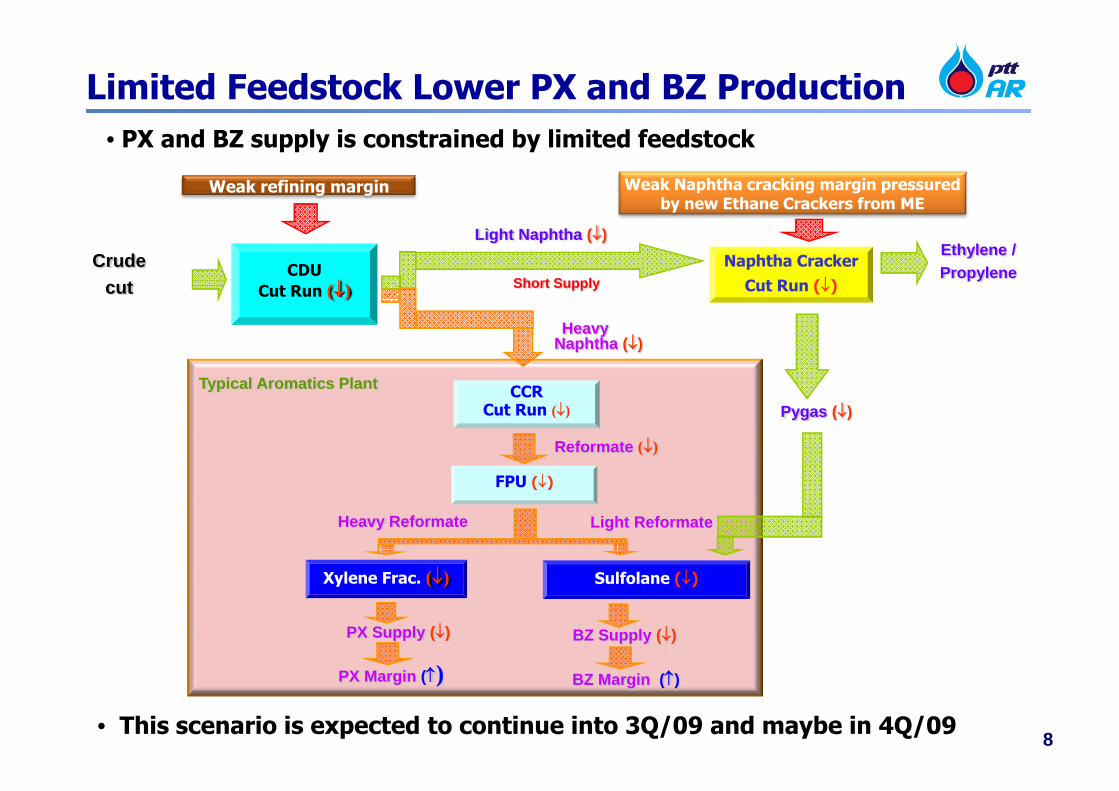
• PX and BZ supply is constrained by limited feedstock
• This scenario is expected to continue into 3Q/09 and maybe in 4Q/09
Weak Naphtha cracking margin pressured by new Ethane Crackers from ME
Weak refining margin
Limited Feedstock Lower PX and BZ Production
Naphtha Cracker Cut Run ()
Light Naphtha ()
Pygas ()
PX Supply () BZ Supply ()
BZ Margin ()PX Margin ()
Heavy Naphtha ()
Short Supply
Ethylene /PropyleneCDU
Cut Run ()
CCR Cut Run ()
Reformate ()
FPU ()
Sulfolane ()Xylene Frac. ()
Typical Aromatics Plant
Heavy Reformate Light Reformate
Crude cut

9
GIMGIM
Unit : $/BBL
7.3
2.295.85 5.23 4.03
(3.32)
3.02
1.22
(1.78)
2.15
10.75
1.78
3.58 6.33 2.66
2Q/08 1Q/09 2Q/09 1H/08 1H/09
Mkt GRM
Hedging
Stock Gain/(Loss) incl LCM
14.73
7.09
10.65 9.78
8.84
Acc. GIM
Improved GIM also resulted from the following initiatives
2Q/09 1H/09
1. Internal Synergy 39.48 54.18
2. Synergy with SPRC and IRPC 1.25 5.28
3. Better Crude Optimization 1.14 2.11
4. PX Yield Improvement 6.73 7.80
Unit: M. US$
Ending Inventory 2Q/09
Volume Cost
Crude 4.39 M.BBL 63.60 $/BBL
Condensate 185 K.Ton 537 $/Ton
10
Risk Management Policy
• To protect downside risk from business plan
• Crack spread hedging approximate 50% of
production
• Hedge PX spread by using crude forward
market in place of condensate
• Explore market mechanism to hedge inventory
risk where possible

11
Realized in 1H/09 gain of 3,344 M.THB,
2Q/09 gain of 928 M.THB
2H/09 current position
Fuel oil Hedged ~2.1 M.bbl
Crack Spread Hedging
Jet Diesel Fuel Oil
Hedging PX – Dubai Spread
Fuel Used Hedging
Risk Management Activities
Feedstock Price Rolling
200
400
600
800
1,000
1,200
29Dec-2Jan
23-27 Feb
16-22 Apr
11-17 Jun
USD/Ton
Dubai Hedging
PX
Rolling prices of feedstock from loading month
to production month
Crude
1Q/09 : 2.2 M.bbl
2Q/09 : 3.0 M.bbl
Condensate
2Q/09: 0.7 M.bbl
Fuel Used in
Production 3%
Minimize cost via
locking Dubai crude
at ~ 50$/bbl
Hedge feedstock
where selling price
are fixed/known
Lock in Dubai price
to secure PX
margin
20
30
40
50
60
70
80 USD/BBL
J F M A M J
J F M A M J
12
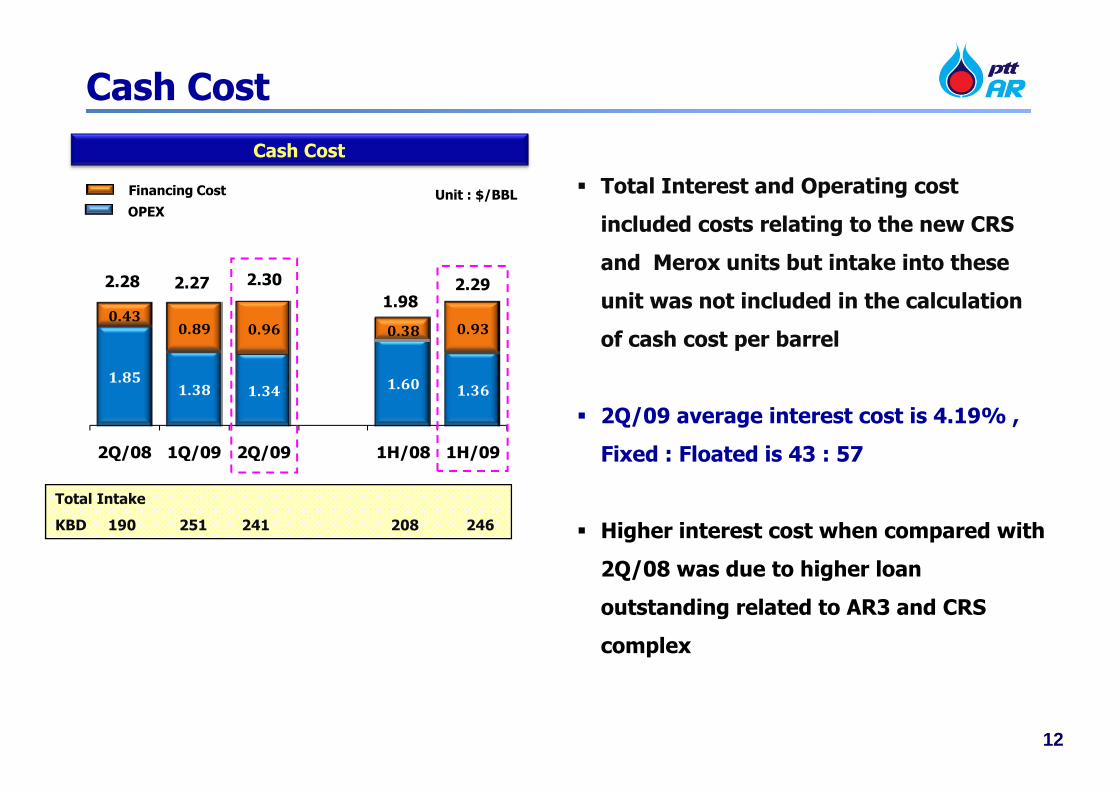
Cash CostCash Cost
OPEX
Financing Cost Total Interest and Operating cost
included costs relating to the new CRS
and Merox units but intake into these
unit was not included in the calculation
of cash cost per barrel
2Q/09 average interest cost is 4.19% ,
Fixed : Floated is 43 : 57
Higher interest cost when compared with
2Q/08 was due to higher loan
outstanding related to AR3 and CRS
complex
1.851.38 1.34 1.60 1.36
0.430.89 0.96 0.38 0.93
2Q/08 1Q/09 2Q/09 1H/08 1H/09
Unit : $/BBL
Total Intake
KBD 190 251 241 208 246
2.28 2.27 2.301.98
2.29

13
EBITDA and Net Income Depreciation amounting to 1,258
M.THB , rose from AR3 and CRS
complex
Net foreign exchange gain from US
dollar loans amounting to 896 M.THB
Income tax expense amounting to
1,820 M.THB
EBITDA
7,264
4,754
7,162
10,023 11,916
2Q/08 1Q/09 2Q/09 1H/08 1H/09
Unit : M.THB
Net Income
4,103
1,742
4,214
5,591 5,956
2Q/08 1Q/09 2Q/09 1H/08 1H/09
Unit : M.THB
2Q/08 2Q/09
Gross Profit Margin 12.2% 9.4%
Net Profit Margin 5.5% 8.3%
Interest Coverage Ratio (Times) 30.0 9.5
Financial Ratio

14
Balance Sheet
30 Jun. 09
152,843137,540
Equities
Current Liabilities
Long Term Loan
Other Liabilities
Higher current assets and current
liabilities were due to the increases in
oil and aromatics price as well as
higher volume from AR3
Issued THB Bond 15,000 M.THB to
refinance LT loans 12,367 M.THB and
partially ST loans.
LT loans used for financing fixed
asset amounted to 39,530 M.THB and
the rest used for financing inventory
and Taxes receivable.
Committed line available for draw
down as of 30 Jun.09 is 18,739
M.THB
Fixed Assets
OtherAssets
CurrentAssets
Unit: M.THB
Balance Sheet
31 Dec. 08
Improved Financial Ratio
31Dec.08 30Jun.09
CA/CL ≥ 1 1.1 1.3
Long Term Liability to Equity ≤ 2 1.1 1.0

15
Capex during 2009 – 2013
Long term Loan repayments scheduled for 2010, 2011 and 2012 are 67 M.US$, 79 M.US$, and 402
M.US$ respectively.
Bond 300 M.US$ which will be due in 2012, will be refinanced or rearranged to extend maturity
prior to due date.
Future Capex is expected to be financed primarily by cash flow from operation.
DHDS (Euro IV) EPC contract was signed in July 31, 2009
Unit: M.US$
2008 2010F 2011F 2012F 2013F 2009
Remaining
to 2013F
1 Reformer and Aromatics II and Unwinding 208 16 - 16 - - - - 0
2 Synergy Project (CRS, PSA) 122 14 11 25 - - - - 11
3 Reliability Improvement - - 8 8 7 - - - 15
4 MRU&Hight TAN Project 6 5 1 6 - - - - 1
5 Efficiency Improvement 7 - 5 5 - - - - 5
6 VRU, GT Nox, Biodiesel 11 4 41 45 17 - - - 58
7 DHDS (Euro IV) 3 16 4 20 45 50 75 36 210
8 Investment in PTT Phenol 22 6 10 16 - - - - 10
9 Annual Maintenance Capex and Others - 13 1 14 9 13 14 7 44
Total 379 74 80 155 78 63 89 43 353
2009
Paid Remaining 2009F

16
Market Outlook
17
-10
-5
0
5
10
Q1/0
8
Q2/0
8
Q3/0
8
Q4/0
8
Q1/0
9
Q2/0
9
Q3/0
9
Q4/0
9
Q1/1
0
Q2/1
0
Q3/1
0
Q4/1
0
% G
DP G
rowt
h (%
QoQ)
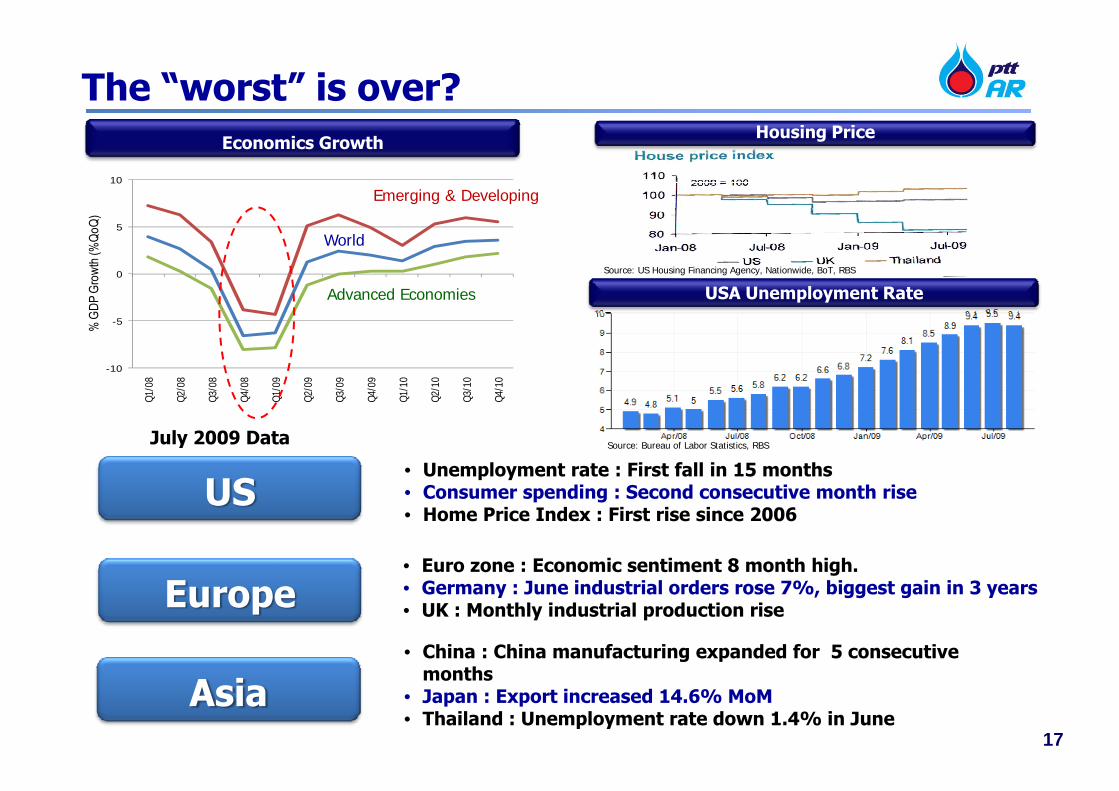
The “worst” is over?Economics Growth
US• Unemployment rate : First fall in 15 months• Consumer spending : Second consecutive month rise• Home Price Index : First rise since 2006
Europe• Euro zone : Economic sentiment 8 month high.• Germany : June industrial orders rose 7%, biggest gain in 3 years• UK : Monthly industrial production rise
Asia• China : China manufacturing expanded for 5 consecutive
months• Japan : Export increased 14.6% MoM• Thailand : Unemployment rate down 1.4% in June
Emerging & Developing
Advanced Economies
World
Housing Price
USA Unemployment RateSource: US Housing Financing Agency, Nationwide, BoT, RBS
Source: Bureau of Labor Statistics, RBSJuly 2009 Data
18
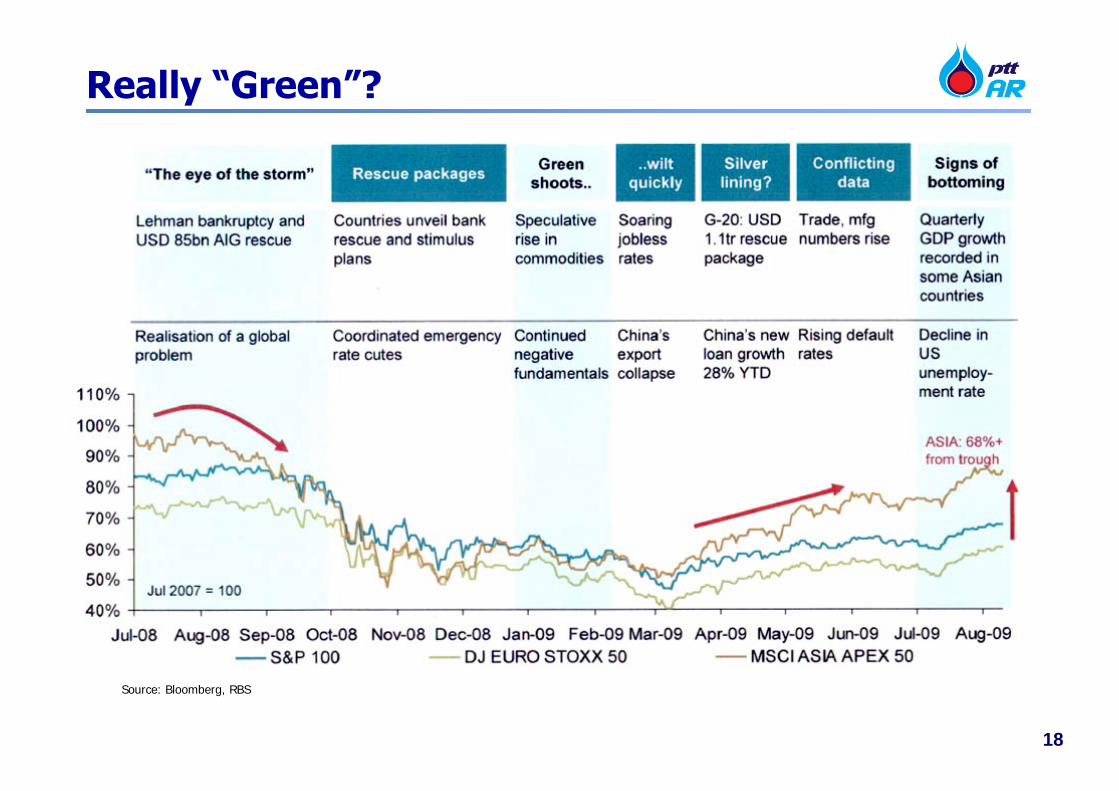
Really “Green”?
Source: Bloomberg, RBS

19
Record Debt and Equity Market Issuance
Source: Dealogic, RBS
Opportunistic capital raising wave
Successful return of convertible markets
Re-emerging of IPO in US and Asia
Abundant local market liquidity
Asian and high yield new issue market re-open
Source: Dealogic, RBS

20
2Q/09 China reported its GDP growth at 7.9%
Policy-driven monetary and credit expansion, has
enabled significant pick-up in domestic investment.
Urban fixed Asset investment growth in June rose
35.3% YoY due to massive government spending
Rmb 1.53 trillion new loans made in June sent money
and loan growth to new record highs of 28.5% YoY
and 34.4% YoY respectively.
Pick-up in domestic demand and restocking have led
value-added industrial output to grow 10.7% YoY in
June. Electricity generation in June, up 3.6% YoY.
China’s car sale in July growth of 71% YoY
• Diesel demand rose by 1.4% in May YoY, while
gasoline demand surge by over 20% YoY.

21
World Oil Forecast for 2010
The Middle Eastern economy will show double growth
compared to 2009, boosting incremental oil demand
to second place behind China.
Most of the growth in oil usage will be in the
transport fuel and petrochemical sectors.
Industrial oil consumption will show only moderate
growth as a result of delayed and slow economic
growth.
The world economic recovery will strengthen in the
second half of the year.
22
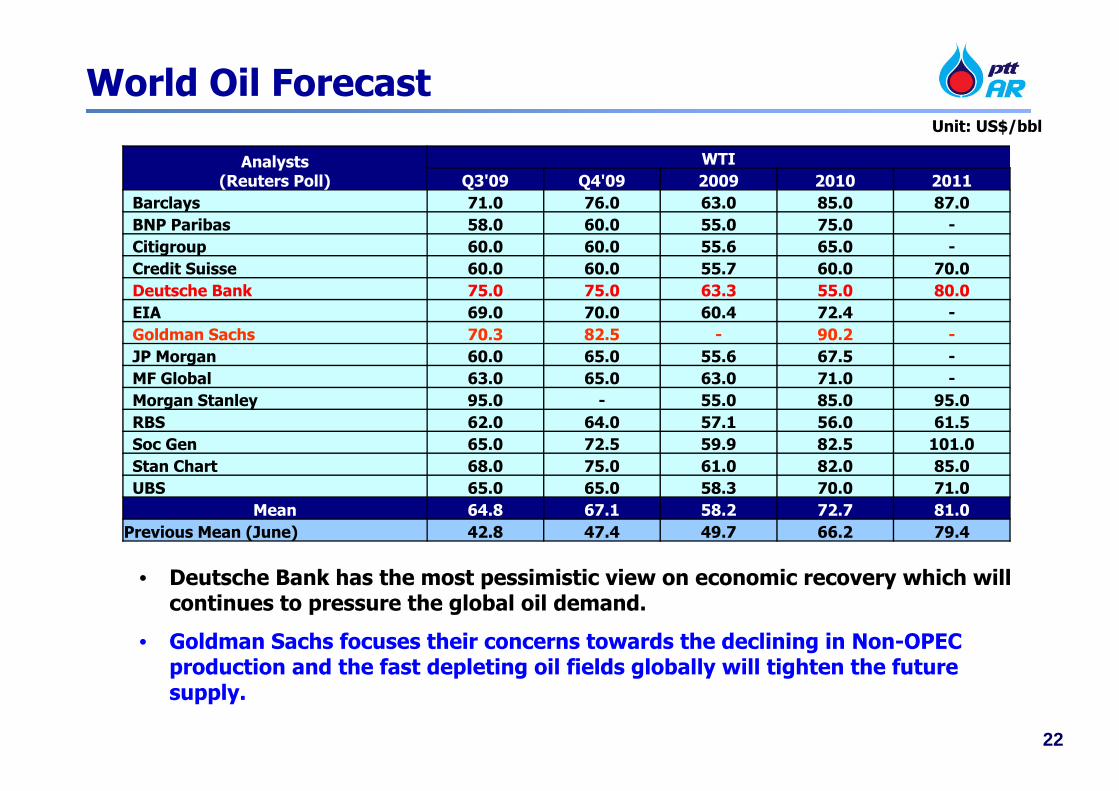
World Oil Forecast
Analysts(Reuters Poll)
WTIQ3'09 Q4'09 2009 2010 2011
Barclays 71.0 76.0 63.0 85.0 87.0BNP Paribas 58.0 60.0 55.0 75.0 -Citigroup 60.0 60.0 55.6 65.0 -Credit Suisse 60.0 60.0 55.7 60.0 70.0Deutsche Bank 75.0 75.0 63.3 55.0 80.0EIA 69.0 70.0 60.4 72.4 -Goldman Sachs 70.3 82.5 - 90.2 -JP Morgan 60.0 65.0 55.6 67.5 -MF Global 63.0 65.0 63.0 71.0 -Morgan Stanley 95.0 - 55.0 85.0 95.0RBS 62.0 64.0 57.1 56.0 61.5Soc Gen 65.0 72.5 59.9 82.5 101.0Stan Chart 68.0 75.0 61.0 82.0 85.0UBS 65.0 65.0 58.3 70.0 71.0
Mean 64.8 67.1 58.2 72.7 81.0Previous Mean (June) 42.8 47.4 49.7 66.2 79.4
• Deutsche Bank has the most pessimistic view on economic recovery which will continues to pressure the global oil demand.
• Goldman Sachs focuses their concerns towards the declining in Non-OPEC production and the fast depleting oil fields globally will tighten the future supply.
Unit: US$/bbl
23
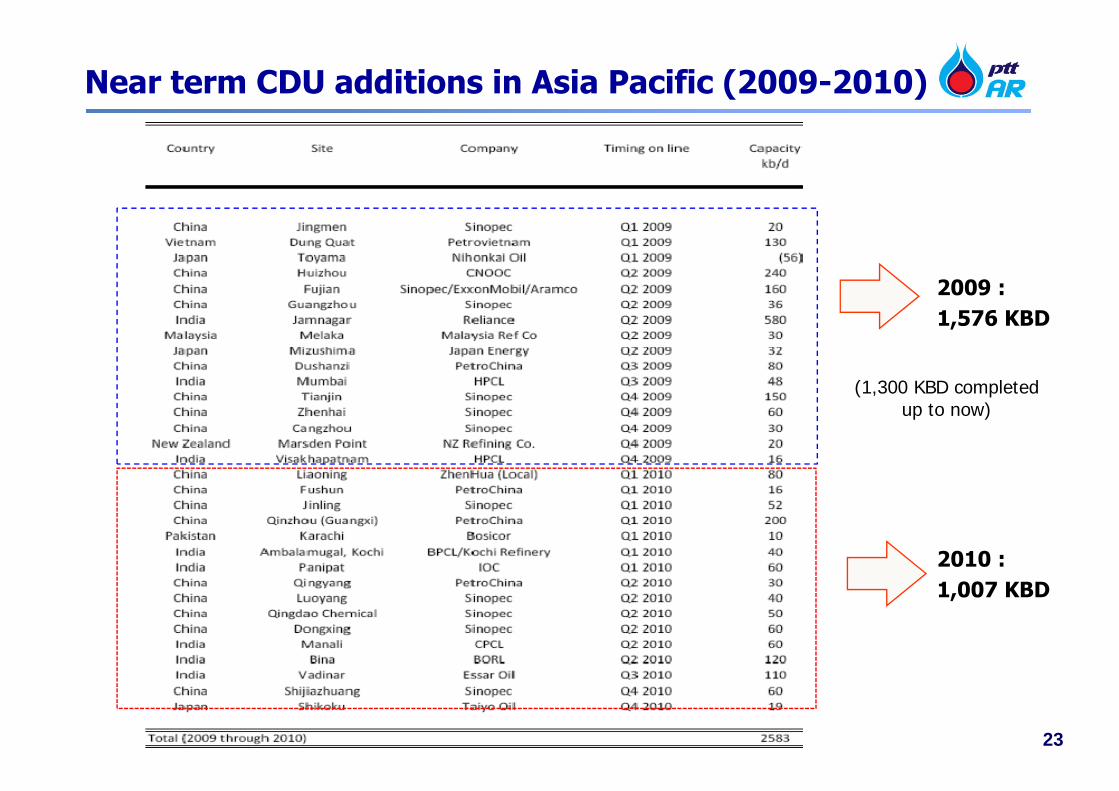
Near term CDU additions in Asia Pacific (2009-2010)
2009 :1,576 KBD
2010 :1,007 KBD
(1,300 KBD completed up to now)
24
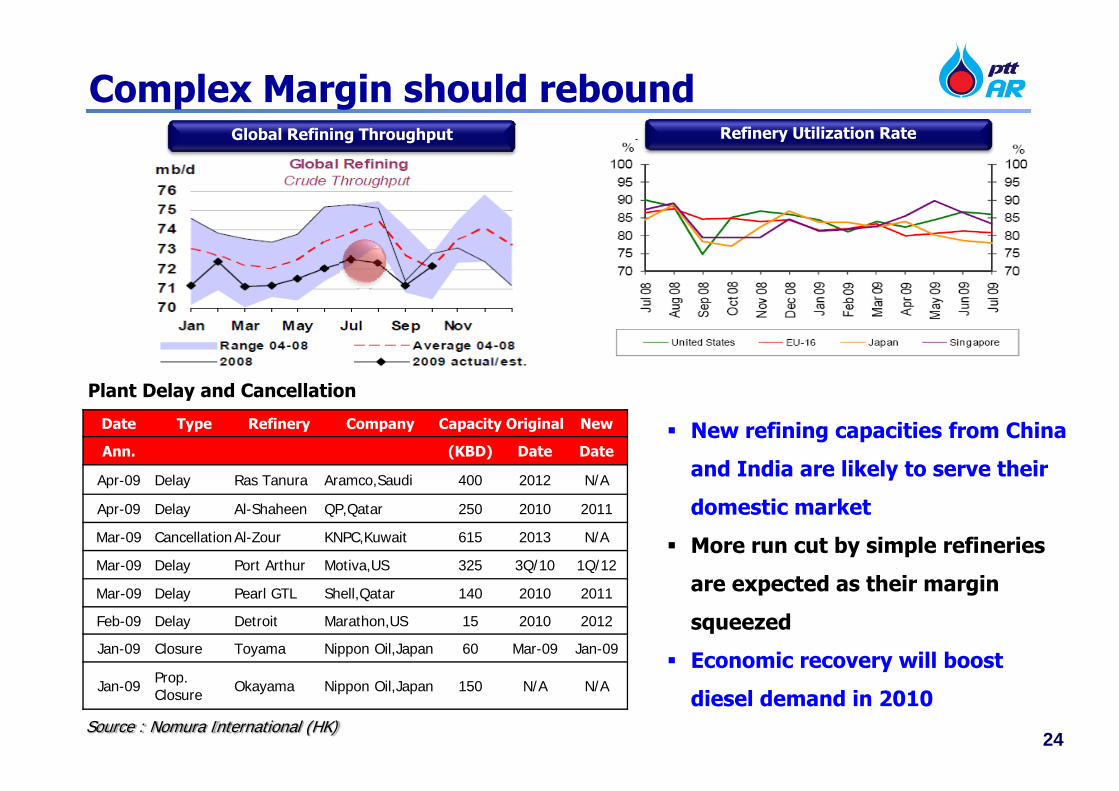
Complex Margin should rebound
New refining capacities from China
and India are likely to serve their
domestic market
More run cut by simple refineries
are expected as their margin
squeezed
Economic recovery will boost
diesel demand in 2010Source : Nomura International (HK)
Plant Delay and Cancellation
Date Type Refinery Company Capacity Original New
Ann. (KBD) Date Date
Apr-09 Delay Ras Tanura Aramco,Saudi 400 2012 N/A
Apr-09 Delay Al-Shaheen QP,Qatar 250 2010 2011
Mar-09 CancellationAl-Zour KNPC,Kuwait 615 2013 N/A
Mar-09 Delay Port Arthur Motiva,US 325 3Q/10 1Q/12
Mar-09 Delay Pearl GTL Shell,Qatar 140 2010 2011
Feb-09 Delay Detroit Marathon,US 15 2010 2012
Jan-09 Closure Toyama Nippon Oil,Japan 60 Mar-09 Jan-09
Jan-09 Prop. Closure Okayama Nippon Oil,Japan 150 N/A N/A
Refinery Utilization RateGlobal Refining Throughput

25
More impress PX situationIncreasing of imported PX to China
- The new PX will remain in tight supply even after new unit startup because of 3.2 M.Ton of 2009 PX will be offset partly by 3.3 M.Ton from 2009 PTA .
- Reduced output from Naphtha crackers- China’s stimulus package boost polyester demand, resulting in more import volume.
PX Plant Expansion in 2008-20132008 2009 2010 2011 2012 2013
China 104 1,791 1,820 1,100 1,050 760 NE Asia (excluded China) 636 103 - - 600 300 India & Pakistan - - - 417 833 - ME 625 479 1,161 - 100 1,060 SE Asia 115 651 - 40 150 800 Others 42 163 305 347 258 -
Total 1,522 3,187 3,286 1,904 2,991 2,920
PTA Plant Expansion in 2008-20132008 2009 2010 2011 2012 2013
China 1,260 2,017 1,800 213 2,050 3,300 NE Asia (excluded China) 517 200 India & Pakistan 20 625 325 - 1,000 ME 100 100 - - 400 400 Others 129 354 225 2,463 657
Total 2,026 3,296 2,350 2,676 4,107 3,700
PX will remain tight supply by offset PTA
Source : PCI, PTTAR update as of July 2009
Unit : K.Ton

26
China will continue to be the Major PX Consumer
Despite new PX plants built, China still needs to import PX about 2 – 4 million ton per year for the next 5 years
Including PX derivatives, China will consume roughly 55% of global PX production
By 2013, China will be the biggest player in PX market, representing 46% of global PX trade
China PX Pull Through
Dom.PX
Imp.PX
Imp.PTA
Source : CMAI’s 2009 world petrochemical conference, 25 – 26 March 2009
China
RoW
Global PXConsumption
Global PXProduction
(Right Axis)
China compare to rest of the world (RoW)

27
BZ vs Toluene Economic
Source : Dewitt APIC -09
Secondary Source of Benzene
Benzene from coal reduced as steel production declined from the recession
Benzene from Toluene Hydrodealkylation (HDA) Process is not efficient due to high production cost
Primary Source of Benzene
Pygas from Naphtha Cracking is limited by weak Olefins business
Reformate is limited from Refinery low utilization rate
Note: Pygas = Pyrolysis gasolineHDA = Toluene HydrodealkylationTDP = Toluene Disproportionation
MSTDP = Mobil Selective Toluene Disproportionation
Secondary process will be first to shutdown when P2F squeezed. Eventually, ~ 27% of BZ supply potentially disappear.
When GRM soften and refineries cut runs, it will lead to Reformate shortage and therefore limit the Aromatics feedstock supplies and eventually widening PX and BZ spreads.
Secondary Process
28
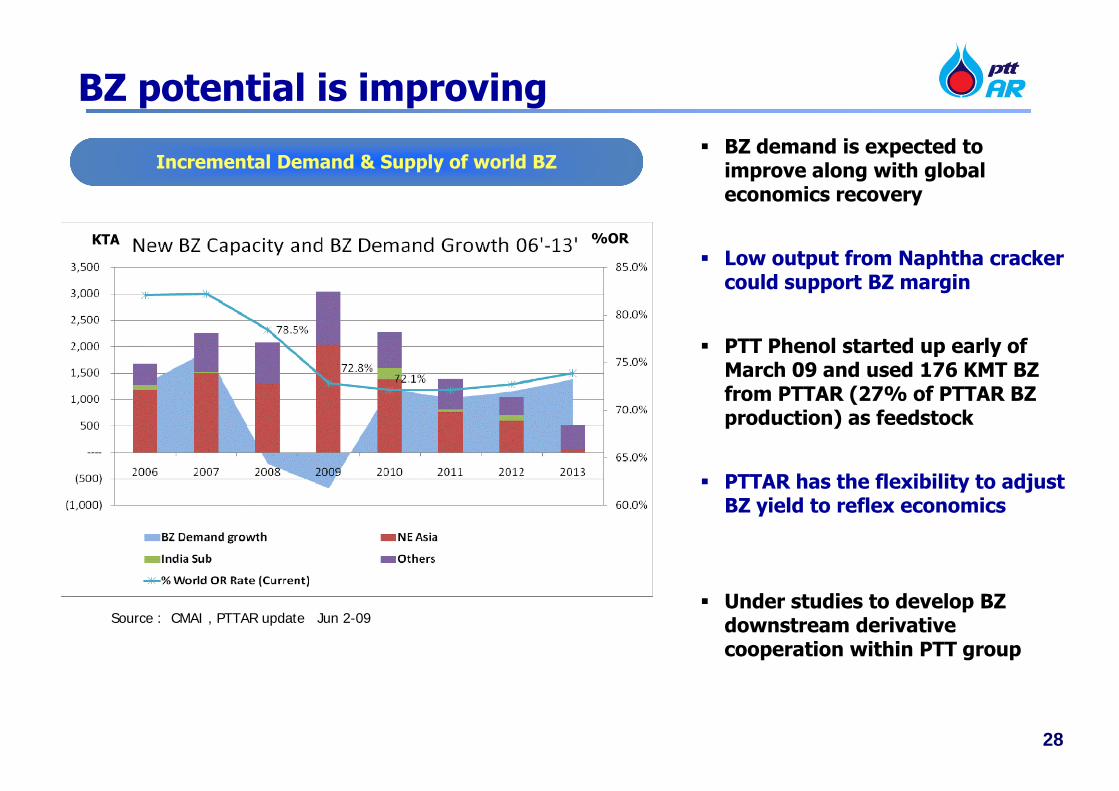
BZ potential is improving
Source : CMAI , PTTAR update Jun 2-09
BZ demand is expected to improve along with global economics recovery
Low output from Naphtha cracker could support BZ margin
PTT Phenol started up early of March 09 and used 176 KMT BZ from PTTAR (27% of PTTAR BZ production) as feedstock
PTTAR has the flexibility to adjust BZ yield to reflex economics
Under studies to develop BZ downstream derivative cooperation within PTT group
%ORKTA
Incremental Demand & Supply of world BZ
29
PTTAR Strategic Position

30
Unit: KBD
Asian AromaticsDistillation Capacity of Asian RefineriesUnit: KTA
Source : Oil & Gas Journal, Asian Ranking 2009
No.1 in ThailandNo.16 in Asia
No.1 in SE AsiaNo.7 in Asia
Leading in South-East Asia with Cost Competitiveness and High Complexity
Laggards
TH Ref 1
PTTAR
Participants
Aspirers
Leaders
US$/bbl
Source : Wood Mackenzie, 2Q/2008
Net Cash Margin
TH Ref 2 TH Ref 3
Asia Refinery Nelson Complexity Index
Source : Phatra Securities, PTTAR estimates
9.214
Remarks : Nelson Complexity Index measures of the secondary conversion capacity relative to the primary distillation capacity
0 5 10 15
S'pore PetroPetron
FormosaNZ Refining
Esso THS-Oil
SinopecCaltex
Thai OilPTTAR
Reliance
Will be 9.9with DHDS
31
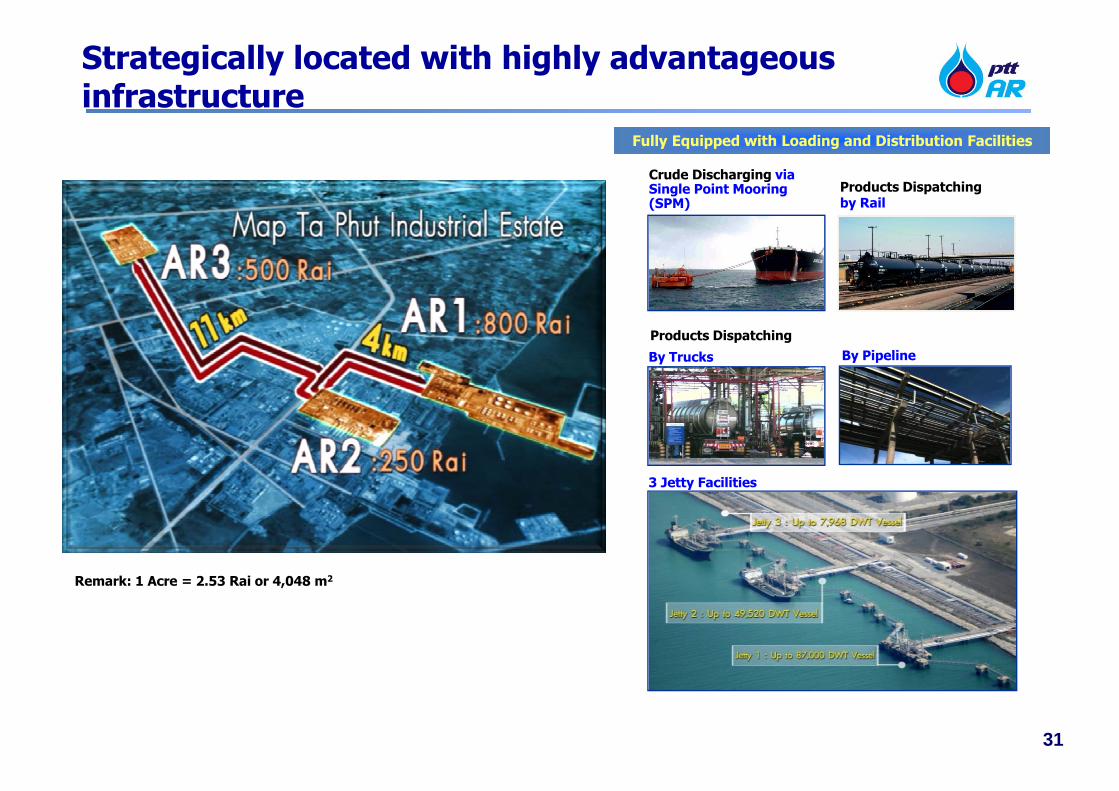
Strategically located with highly advantageous infrastructure
Fully Equipped with Loading and Distribution Facilities
Crude Discharging via Single Point Mooring (SPM)
Products Dispatchingby Rail
Products Dispatching
3 Jetty Facilities
Remark: 1 Acre = 2.53 Rai or 4,048 m2
By Trucks By Pipeline

32
Synergy Projects/OperationCompletion
Date
Benefit
(M.US$/Yr)
1. Oil reserve reduction and Reformate quality control Jan.09 3.4 – 4.2
2. Use Heavy Aromatics in place of Diesel as fuel oil cutter stock Feb.09 13 - 40
3. Adjust process to reduce BZ production from AR2 about 7-15% Feb.09 2.5 - 5
4. Increased Diesel and Jet production approximately 52 KBD via Condensate Residue Upgrading project Mar.09 20-60
5. New condensate tank/Jetty modification project Mar.09 9
6. Mercury Removal project Jul.09 18
7. Chemical Injection for High TAN Crude project Jul.09 0 - 18
8. Hydrogen transfer from AR3 to AR1 & AR2 project Dec.09 18 - 53
Total 83.9 – 207.2
Synergy Benefits

33
Synergy cooperation with PTT group
BZ derivative
Light Naphtha• Swap PTTAR’s Light Naphtha and IRPC’s
Heavy Naphtha to achieve increased yield
for both side ~5 M.US$ per annum
• Co-Load of crude to safe freight
~ 2 – 3 M.US$ per annum
• Jointly review other potential for
intermediate stream exchange including
BZ derivative
• Single Point Mooring (SPM)
• Co-Load of crude
• Intermediate product exchangeSP
Heavy Naphtha
Hydrowax
HVGO

34
Market Summary
1. Dubai is expected to range 65-70 $/bbl in 2H/09.
2. Gasoline will soften in 2H/09 as driving season end while middle distillates
prices will be supported by seasonality and expected economic recovery.
3. Increase in refining capacity will be partly offset by refinery run cuts while
margin remain low.
4. Stimulus package in China is expected to continue to result in strong PX and
BZ demand in 2H/09.
5. Supply of PX & BZ will continue to be limited by lack of feedstock from
refinery and Naphtha Cracker run cuts.
6. PX capacity addition in China will not be sufficient to meet China PX demand
growth
7. Expected economic recovery will further improve overall situation in 2010
onward.

35
PTTAR is well prepared to capture the industry cycle
Strong domestic base customers, connected by pipelines- Strategic Location
Cost Competitiveness
Fully Integrated Refinery/Aromatics Plants- Advantageous size and complexity - Operation Flexibilities - Synergy Benefits
High growth opportunity - Petrochemical downstream derivatives- Further synergy with other company
Strong Management Team with full competence on both Refinery and Aromatics Business