ATTACHMENT 5 RISK BASED CLOSURE DEED...
196
ATTACHMENT 5 RISK BASED CLOSURE DEED RECORDATION DOCUMENTS .
Transcript of ATTACHMENT 5 RISK BASED CLOSURE DEED...
ATTACHMENT 5
RISK BASED CLOSURE DEED RECORDATION DOCUMENTS .
ATTACHMENT 5-1
PARCEL A THE FORMER SKEET AND TRAP RANGE

- i I
I Robert J. Huston, Chairman R. B. "Ralph" Marquez, Commissioner
John M. Baker, Commissioner
Jeffrey A. Saitas, Executive Director
.' '!' •••••
... ~.:
TEXAS NATURAL RESOURCE CONSERVATION COMMISSION Protecting Texas by Reducing and Preventing Pollution
Mr. Charles Pringle Team ChiefIBEC HQ-AFCEEIERB 3207 North Road, B-532 Brook-s AFB, TX 78235-5363
June 8, 2001
Re: ClosurelRemediation - Risk Reduction Standard No.2! Acceptance ofJ?eed Certification and Release From Post-closure Care Responsibilities Bergstrom Air Force Base TNRCC Solid Waste Registration No. 66002 Former Skeet and Trap Range - S\-VMU 122
Dear Mr. Pringle:
The Texas Natural Resource Conservation Commission (TNRCC) received a letter dated March 23, 2001 submitted by the Air Force Base Conversion Agency (AFBCA) containing proof of deed certification for the Former Skeet and Trap Range - SWMU 122. The certification states that contaminants remaining at the site have been remediated to meet non-residential (Le. industrial/commercial) soil criteria under Risk Reduction Standard (RRS) No.2 pursuant to Title 30 Texas Administrative Code (TAC) Chapter 335 Subchapters A and S.
In order to attain RRS No.2, all industrial solid waste and municipal hazardous waste and waste residues must be removed or decontaminated to health based standards and criteria. Contaminants allowed to remain in place in media of concern (i.e., soil, ground water, surface water and air) must not exceed the health based clean up levels as specified in 30 TAC §335.556. A Final Report, documenting that remediation at the facility has attained RRS No.2 such that no pQst-::elosure care or-engineering_control measures are required, was previously accepted by the TNRGCiin our letter dated August 22, 2000. - - .. --"-"'
After review of the proof 0 f deed certification, it appears that the deed certification requirements of 30TAC §335.560(b) and (c) have been completed. TheTNRCC hereby releases AFBCA from postclosure care responsibilities associated with contamination for the Former Skeet and Trap Range -SWMU 122. -
Ifapplicable, please submit a request in writing, to update your Notice of Registration (NOR) to the TNRCC Registration and Reporting Section at Mail Code MC-129 with a copy of this let~er as an attachment.

/ Mr. Charles Pringle Page 2 June 8,2001
~:-'.:
Please be aware that it is the continuing obligation of persons associated with a site to assure that , municipal hazardous waste and industrial solid waste are managed in a manner which does not cause the discharge or imminent threat of discharge of waste into or adj acent to waters in the state, a nuisance, or the endangerment of the public health and welfare as required by 30 TAC §335.4. If the actual remediation fails to comply with these requirements, the burden remains upon (AFBCA) to take any necessary and authorized action to correct such conditions. A TNRCC field inspector may-review your Final Report and conduct a closure inspection of the site.
. Questions concerning this letter should be directed to me at (512) 239-2360. When rlo/sponding by mail, please submit an'original and one copy of all correspondence and reports to the Corrective Action Section at Mail Code MC-I27 with an additional copy submitted to the TNRCC Region II' Office in Austin. The TNRCC Solid Waste Registration Number and Unit Name should be referenced in all submittals.
Sincerely,
Mark A. Weegar, Project Manager Team II, Corrective Action Section Remediation Division Texas Natural Resource Conservation Commission
MW/mw
cc: Mr. Randy Beyer, AFBCAlROL, Austin, TX Ms. Laura Stankosky, U.S. EPA Region VI, Dallas, TX.(6PD-NB) Ms. Tamara Moore, City of Austin, TX ..z: Waste Program Manager, TNRCC Region II - Austin, TX (MC-RII)-...
. . .-..... ~~
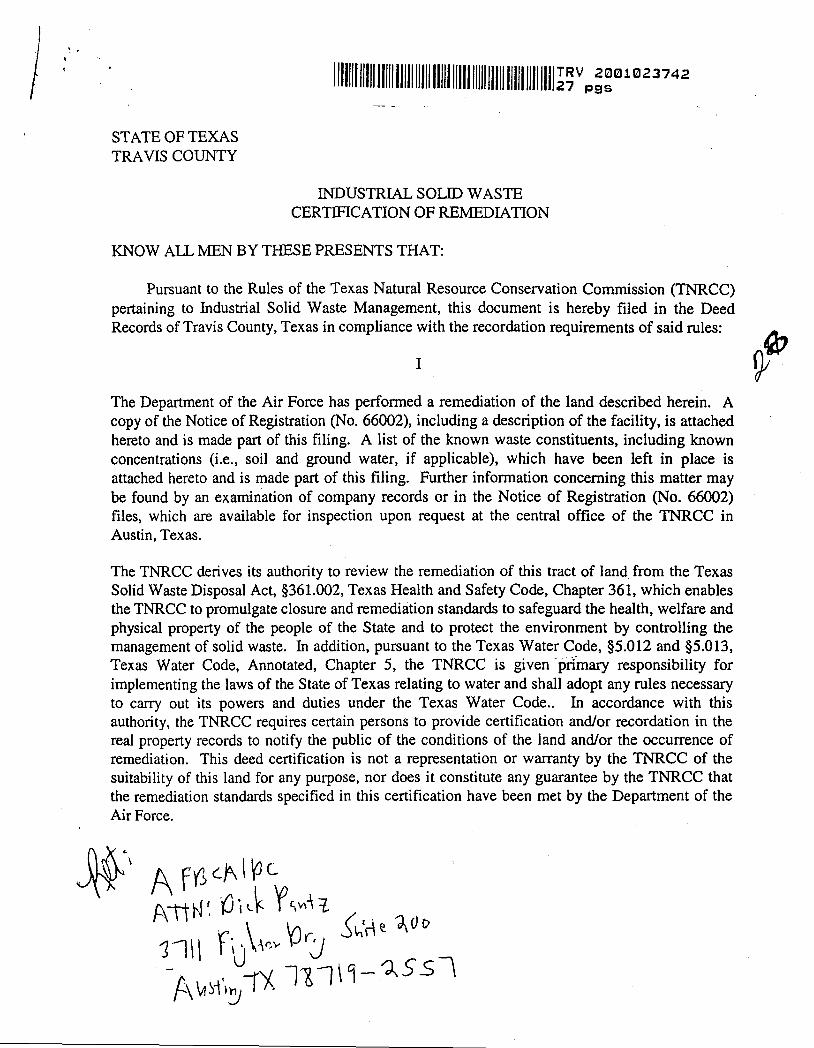
) STATE OF TEXAS TRA VIS COUNTY
111I1II1I11I1II111II111I11I1Il1I1I1II1I1II11I1I111111I1111II~~V p~~m 1 m23742
INDUSTRIAL SOLID WASTE CERTIFICATION OF REMEDIATION
KNOW ALL MEN BY THESE PRESENTS THAT:
Pursuant to the Rules of the Texas Natural Resource Conservation Commission (TNRCC) pertaining to Industrial Solid Waste Management, this document is hereby filed in the Deed Records of Travis County, Texas in compliance with the recordation requirements of said rules:
I
The Department of the Air Force has performed a remediation of the land described herein~ A copy of the Notice of Registration (No. 66002), including a description of the facility, is attached hereto and is made part of this filing. A list of the known waste constituents, including known concentrations (i.e., soil and ground water, if applicable), which have been left in place is attached hereto and is made part of this filing. Further information concerning this matter may be found by an examination of company records or in the Notice of Registration (No. 66002) files, which are available for inspection upon request at the central office of the TNRCC in Austin, Texas.
The TNRCC derives its authority to review the remediation of this tract of land from the Texas Solid Waste Disposal Act, §361.002, Texas Health and Safety Code, Chapter 361, which enables the TNRCC to promulgate closure and remediation standards to safeguard the health, welfare and physical property of the people of the State and to protect the environment by controlling the management of solid waste. In addition, pursuant to the Texas Water Code, §5.012 and §5.013, Texas Water Code, Annotated, Chapter 5, the TNRCC is given ·pri"mary responsibility for implementing the laws of the State of Texas relating to water and shall adopt any rules necessary to carry out its powers and duties under the Texas Water Code.. In accordance with this authority, the TNRCC requires certain persons to provide certification and/or recordation in the real property records to notify the public of the conditions of the land and/or the occurrence of remediation. This deed certification is not a representation or warranty by the TNRCC of the suitability of this land for any purpose, nor does it constitute any guarantee by the TNRCC that the remediation standards specified in this certification have been met by the Department of the Air Force.
~\

/ IT
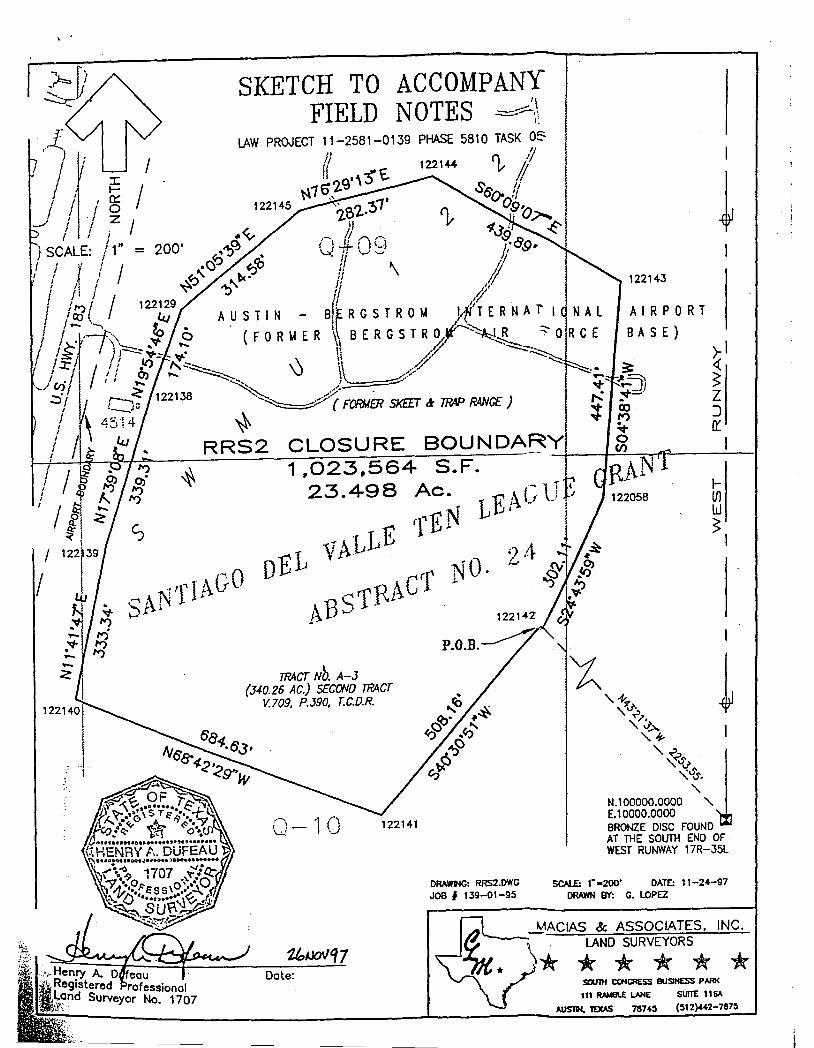
Being a 23.498 acre (1,023,564 square foot) parcel of land out of the Santiago'Del Valle Ten League Grant, Abstract No. 24, Travis County, Texas, and also being out of a 340.26 acre parcel of land known as Second Tract out of Tract No. A-3 described in a deed to the United States of America recorded in volume 709, page 390, deed records of said Travis County. Said 23.498 acre parcel being more particularly described by metes and bounds as follows:
Beginning at a point known as Sample Location No. 122142, for a corner of this parcel, said point bears N43°21'37"W, 2253.55 feet from a bronze disc found at the south end of West Runway 17R-35L in the center line (N. 100,000.0000, E. 10,000.0000); thence, S40030'51"W, a distance of 508.16 feet to a point (122141), for the southernmost corner of this parcel; thence, N68°42'29"W, a distance of 684.63 feet to a point (122140), for the westernmost corner of this parcel; thence, NIl °41 '47 liE, a distance of 333.34 feet to an angle point (122139); thence, N 17°39'08"E, a distance of 339.31 feet to an angle point (122138); thence, N19°54'46"E, a distance of 174.10 feet to an angle point (122129); thence, N51 °05'39"E, a distance of 314.58 feet to an angle point (122145); thence, N76°29'13"E, a distance of 282.37 feet to a point (122144), for the northernmost corner of this parcel; thence, S60009'07"E, a distance of 439.89 feet to a point (122143), for easternmost corner of this parcel; thence, S04°38'41 "W, a distance of 447.41 feet to an angle point (122058); thence, S24°43'59"W, a distance of 302.11 feet to the point of beginning, containing 23.498 acres (1,023,564 square feet) of land.
Lead deposited hereon has been remediated to meet non-residential (i.e., industrial/commercial soil criteria), in accordance with a plan designed to meet the TNRCC's requirements in 31 Texas Administrative Code §335.555), which mandates that the remedy be designed to eliminate substantial present and future risk such that no post-closure care or engineering or institutional control measures are required to protect human health and the environrn.ent. Future land use is considered suitable for non-residential (Le., industrial/commercial) purposes in accordance with risk reduction standards applicable at the time of this filing. Future land use is intended to be nonresidential.
In accordance with the requirements for Standard 2 cleanups where the remedy is based upon non-residential soil criteria, the current owner has undertaken actions as necessary to protect human health or the environment in accordance with the rules of the TNRCC.
ill
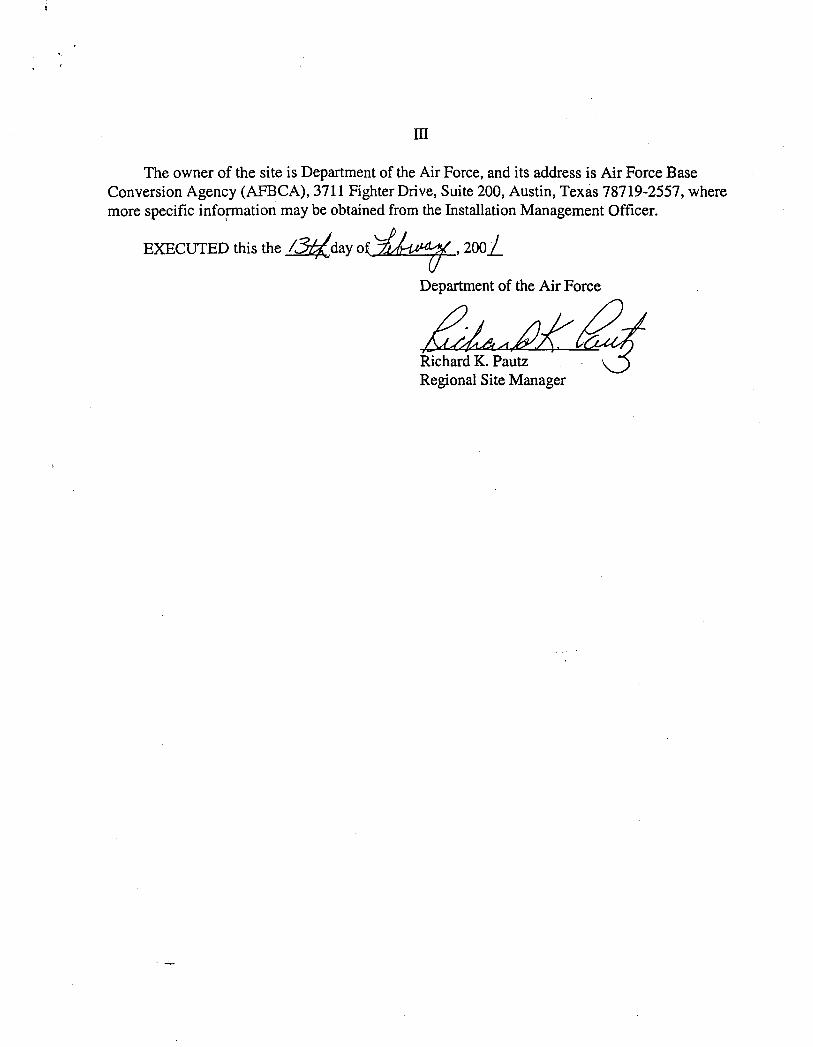
The owner of the site is Department of the Air Force, and its address is Air Force Base Conversion Agency (AFBCA), 3711 Fighter Drive, Suite 200, Austin, Texas 78719-2557, where more specific infopnation may be obtained from the Installation Management Officer.
EXECUTED this the !3tI..day O(~ .200i
Department of the Air Force
titp~tJ:~ Regional Site Manager

STATE OF TEXAS TRAVIS COUNTY
BEFORE ME, on this the &day o~~ , personally appeared Richard K. Pautz, Regional Site Manager of the Air Force Base Co version Agency, Department of the Air Force, Bergstrom Air Force Base, known to me to be the person and agent of said government agency whose name is subscribed to the foregoing instrument, and he acknowledged to me that he executed the same for the purposes and in the capacity therein expressed.
GIVEN UNDER MY HAND AND SEALOF OFFICE, this the );;!~of ~ ,200L.
-Texas, of /,I2.,q VIS County
My Commission Expires

Exlubit "A" RRS2 Closure Boundary
MACIAS & ASSOCIATES, Inc. LAND SURVEYORS
FIELD NOTES
FIELD NOTE DESCRIPTION FOR A 23.498 ACRE (1,023,564 SQUARE FOOT) PARCEL OF LAND OUT OF THE SANTIAGO DEL VALLE TEN LEAGUE GRANT, ABSTRACT NO. 24, TRAVIS COUNTY, TEXAS, AND ALSO BEING OUT OF A 340.26 ACRE PARCEL OF LAND KNOWN AS SECOND TRACT OUT OF TRACT NO. A-3 DESCRIBED IN A DEED TO THE UNITED STATES OF AMERICA RECORDED IN VOLillv1E 709, PAGE 390, DEED RECORDS OF SAID TRAVIS COUNTY. SAID 23.498 ACRE PARCEL BEING MORE PARTICULARLY DESCRIBED BY METES AND BOUNDS AS FOLLOWS:
BEGINNING at a point known as Sample Location No. 122142, for a comer of this parcel, said point bears N43~1 '37"W, 2253.55 feet from a bronze disc found at the south end of West Runway 17R-35L in the center line (N. 100,000.0000, E. 10,000.0000);
THENCE, S40030'51"W, a distance of 508.16 feet to a point (12~14.1), for the southernmost comer of this parcel;
, TIffiNCE, N68°42'29"W, a distance of 684.63 feet to a point (122140), for the westernmost comer of this parcel;
THENCE, NIl °41 '47"E, a distance of333.34 feet to an angle point (122l39);
THENCE, N17°39'08"E, a distance of339.31 feet to an angle point (122138);
THENCE, NI9°54'46"E, a distance of 174.10 feet to an angle point (122129);
THENCE, N51 °05'39"E, a distance of314.58 feet to an angle point (122145);
THENCE, N76°29'13"E, a distance of 282.37 feet to a point (122144), for the northernmost comer of this parcel;
LA WRRS2.FLN outh Congress BUsiness Park· III Ramble Lane. Suite 116-A· Austin. Texas 78745· (512) 442-7875. FAX (512) 442-7876

MACIAS & ASSOCIATES, Inc. LAND SURVEYORS
Exhibit "A" RRS2 Closure Boundary ,
FIELD NOTES
FIELD N01E DESCRIPTION FOR A 23.498 ACRE (1,023,564 SQUARE FOOn PARCEL OF LAND OUT OF THE SANTIAGO DEL VALLE TEN LEAGUE GRANT, ABS1RACT NO. 24, TRAVIS COUNTY, 1EXAS, AND ALSO BEING OUT OF A 340.26 ACRE PARCEL OF LAND KNOWN AS SECOND 1RACT OUT OF TRACT NO. A-3 DESCRIBED IN A DEED TO THE UNITED STATES OF AMERICA RECORDED IN VOLUME 709, PAGE 390, DEED RECORDS OF SAID TRAVIS COUNTY. SAID 23.498 ACRE PARCEL BEING MORE PARTICULARLY DESCRIBED BY :METES AND BOUNDS AS FOLLOWS:
BEGINNING at a point known as Sample Location No. 122142, for a comer of this parcel, said point bears N43OZ1 '37"W, 2253.55 feet from a bronze disc found at the south end of West Runway 17R-35L in the center line (N. 100,000.0000, E. 10,000.0000);
THENCE, S40030'51"W, a distance of 508.16 feet to a point (122141), for the southernmost comer of this parcel;
l
THENCE, N68°42'29"W, a distance of 684.63 feet to a point (122140), for the westernmost comer of this parcel;
THENCE, NIl °41 '47"E, a distance of333.34 feet to an angle point (122139);
THENCE, NI7°39'08"E, a distance of339.31 feet to an angle point (122138);
THENCE, NI9°54'46"E, a distance of 174.10 feet to an angle point (122129);
THENCE, N51 °05'39"E, a distance of314.58 feet to an angle point (122145);
THENCE, N76OZ9'13"E, a distance of 282.37 feet to a point (122144), for the northernmost comer ofthis parcel;
. ~
LAW RRS2.FLN outh Congress BUsiness Park· III Ramble .Lane, Suite 116-A· Austin, Texas 78745· (512) 442-7875. FAX (512) 442-7876

HENCE, S60009'07"E, a distance of 439.89 feet to a point (122143), for easternmost comer of this parcel;
THENCE, S04°38'41 "W, a distance of 447.41 feet to an angle point (122058);
THENCE, S24°43'59"W, a distance of 302.11 feet to the POINT OF BEGINNING, containing 23.498 acres (1,023,564 square feet) ofland.
STATE OF TEXAS §
COUNTY OF TRAVIS §
I hereby certify that this field note description was prepared from the results of an actual survey made on the ground under my supervision and that it is true and correct to the best of my knowledge.
Client: JohNo.: File:
S & ASSOCIATES, INC.
DATE
REFERENCES Bearing Basis: BACS
LAW Environmental, Inc. 139-01-95 RRS2.dwg
/ i!= / ,0::
fO
SKETCH TO ACCOMPANY FIELD NOTES ~.~:
LAW PROJECT 11-2581-0139 PHASE 5810 TASK O~ IJ 1, 11 Ii • '\ :;'" t. II
N1E)'2.9 • S6'£r.O!f
() ~V 11 :;>oo.~
89·
AUSTIN - 8
(FORUER
~ RRS2 CLOSURE BOUNDA
1 ,023,564 S.F.
122143
AIRPORT
8 A S E )
>-1 « ~ z J Ir
1
23.498 Ac. . E :\G lJ (fEN L J'
IUl W
TRACT Nb. A-J (J40.26 AC.) SECOND TRACT
V, 709. P.J90. T.C.D.R.
, ...... ,.\ ('"\ \...,J - . ...1
Date:
122141
24 NO. J'
DfWDjG: RRS2.OWG JOB f 139-01-95
"\. -t-~ ,~
"\.".)..>0-"\.~
~ 1
. "\. ~-2 1 "\t,, ,,'tt-"\.
N.100000.0000 "\. E.10000.0000 BRONZE DISC FOUND AT THE SOUTH END OF· WEST RUNWAY 17R-35L
SCAlE: 1· -200' DATE: 11-24-97 DRAWN BY: C. LOPEZ
MACIAS & ASSOCIATES, INC. LAND SURVEYORS
* * * * * SICt1lH CONGRESS BUSINESS PARK
111 IW8.£ LANE SUITE 116-' AJJS11N. 1DCAS 7874!i (512}442-7875

IHW020 *** TEXAS NATURAL RESOURCE CONSERVATION COMMISSION *** Notice of Registration
Industrial and Hazardous Waste
Page: Date:
1 01/07/00
This registration does not constitute authorization of any waste management activities or facilites listed below. The registration reflects hazardous and/or Industrial waste generation and management activities for which the registrant has provided notification. Requirements for solid waste management are provided by Texas Administrative code section 335 of the rules of the Texas Natural Resource Conservation Commission (TNRCC). Changes or additions to waste management methods referred to In this notice require written notification to the TNRCC.
j Solid Waste Registration Number: 66002 EPA Id: TX0572124188
The Solid Waste Registration Number provides access to computerized and filed information pertaining to your operation. Please refer to that number In any correspondence.
Company Name Site Name
Site Locat ion Contact
AFBCA/Bergstrom Air Force Base Bergstrom Air Force Base State Highway 71, Austin, TX Watlay, Stephen
Mailing Address: 3711 Fighter Drive Suite 200 Austin, TX 78719-2557
Registration Status Inactive HW Permit #: 50244 Registration Type Generator Transporter
Generator Type
Primary SIC Code: Handler Status:
Operator Information Name:
Phone: Address:
Region: 11 Initial Registration Date County: 227 Travis Last Amendment Date
Last Date NOR Computer update Title: Environmental Engineer Phone: 512-386-5425
Site Street Address: State Highway 71
Austin, TX 78743
01/24/1983 04/02/1999 01/05/2000
Reporting Method: STEERS
Hazardous Waste Generation Status: Large Quantity Generator
Owner Information Name:
Phone: Address:
AS of 04/02/1999 - the next unassigned sequence number for WASTES Is 0002 and the next unassigned sequence number for UNITS Is 015.
Section 335, Chapter 31 of the Texas Admlnstrative Code specifies the notification, record keeping, manifesting and reporting requirements for hazardous and Industrial solid wastes.

IHW020
66002 AFBCA/Bergstrom Air Force Base
•• ** WASTE INFORMATION **.* Texas Waste Status Date of Waste Clas~ Status Code! ** No Longer Generated Wastes **
Managed Onsite/ Offsite
*** TEXAS NATURAL RESOURCE CONSERVATION COMMISSION ••• Notice of Registration
Radioactive
Industrial and Hazardous Waste
TNRCC Audit Complete
Page: Date:
2 01/07/00
----------------------------------------------------------------------------------------------------------------------------------------------------_. 00011011" Inactive 09/25/97 NA No
Description from Generator: Wastewater generated from the rinsing of aircraft prior to painting. Waste was first generated in April 1995.
Form Code 101 Aqueous waste with low solvents Current Management Units None
* Origin Codes 3 From non-haz waste mgmt
905910 H Inactive 09/25/97 NA No Description from Generator: FREON CONTAMINATED MATERIAL
Form Code: EPA Hazardous Waste Numbers: F002
Current Management Units: None * Origin Codes:
906790 H Inactive 09/25/97 NA Description from Generator: CARBON REMOVER
Form Code: EPA Hazardous Waste Numbers: 0026 F004
Current Management Units: None
No
* Origin Codes: . ----------------------------------------------------------------------------------------------------------------------------------------------------_. 907190 H Inactive NA No
DescriPtion from Generator RINSEWATER. AGRICULTURAL CHEMICALS Form Code
EPA Hazardous Waste Numbers 0016 Current Management Units None
* Origin Codes -----------------------------------------------------------------------------------------------------------------------------------------------------908500 H Inactive 09/25/97 NA No
Description from Generator: WASTEWATER CONTAINING ORGANICS & METALS Form Code:
EPA Hazardous Waste Numbers: 0007 Current Management Units: None
• Origin Codes: ----------------~---------------------------------------~-~------------------------------------------------------------------------------------------

IHW020
66002 Texas Waste Code
AFBCA/Bergstrom Air Force Base Waste Status Date of Managed Class Status Onslte/
Offslte
*** TEXAS NATURAL RESOURCE CONSERVATION COMMISSION *** Notice of Registration
Radioactive
Industrial and Hazardous Waste
TNRCC Audit Complete
Page: Date:
3 01/07/00
** No Longer 'Generated Wastes •• -----------~r-----------------------------------------------------------------------------------------------------------------------------------------909850 H Inactive 09/25/97 NA No
Description from Generator: PESTICIDE WASTE/PESTICIDE CONTAMINATED WASHWATER Form Code:
EPA Hazardous Waste Numbers: D016 Current Management Units: None
* Origin Codes: ------------------------------------------------------------------------------------------------------------------------------------------------------910120 H Inactive 09/25/97 NA
DescrIption from Generator: PAINT SOLVENTS Form Code:
EPA Hazardous Waste Numbers: FOOS Current Management Units: None
• Origin Codes:
No
------------------------------------------------------------------------------------------------------------------------------------------------------912130 H InactIve 09/25/97 NA
DescriptIon from Generator: OIL. SYNTHETIC MOTOR Form Code:
EPA Hazardous Waste Numbers: F002 Current Management Units: None
• Origin Codes:
No
------------------------------------------------------------------------------------------------------------------------------------------------------912510 H InactIve 09/25/97 NA
Descr-Iptlon from Generator: NAPHTHALENE SOLUTION Form Code:
EPA Hazardous Waste Numbers: 0001 0039 F002 Current Management Units: None
* OrIgIn Codes:
No
----------------------------------------------------------------------------------------------------------------------------------------------------_. 912520 H Inactive 09/25/97 NA No
Descrtptton from Generator: MERCURY. LIQUID Form Code:
EPA Hazardous Waste Numbers: 0009 Current Management Units: None
* Origin Codes: ----------------------------------------------------------------------------------------------------------------------------------------------------_. 913000 H Inactive 09/25/97 NA No
DescriptIon from Generator: MINERAL SPIRITS WASH Form Code:
EPA Hazardous Waste Numbers: F002 Current Management Units: None
* Origin Codes:
IHW020
AFBCA/Bergstrom Air Force Base Waste Status Date of Managed Class Status Onslte/
Offslte
66002 Texas Waste Code ** No Longer Generated Wastes **
*** TEXAS NATURAL RESOURCE CONSERVATION COMMISSION *** Notice of Registration
Radioactive
Industrial and Hazardous Waste
TNRCC AUdit Complete
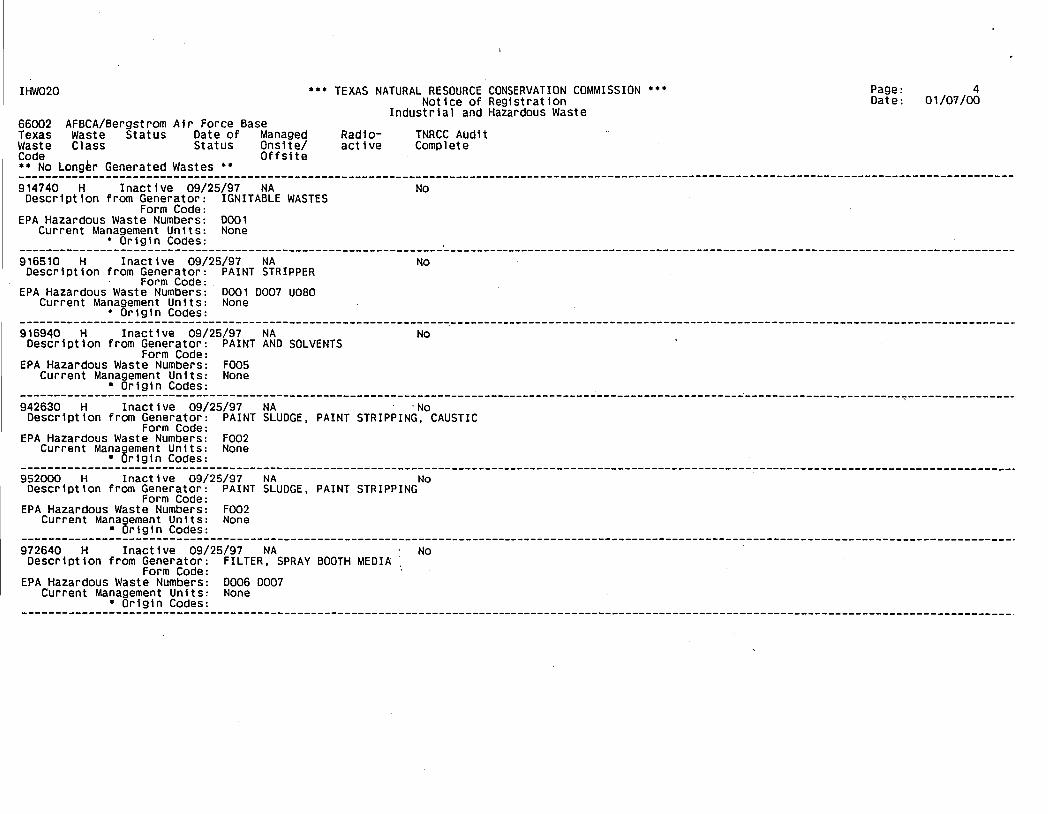
914740 H Inactive 09/25/97 NA No Description from Generator: IGNITABLE WASTES
Form Code: EPA Hazardous Waste Numbers: 0001
Current Management Units: None * Origin Codes:
Page: Date:
4 01/07/00
----------------------------------------------------------------------------------------------------------------------------------------------------916510 H Inactive 09/25/97 NA Description from Generator: PAINT STRIPPER
Form Code: EPA Hazardous Waste Numbers: 0001 0007 U080
Current Management Units: None * Origin Codes:
916940 H Inactive 09/25/97 NA Description from Generator: PAINT AND SOLVENTS
Form Code: EPA Hazardous Waste Numbers: F005
Current Management Units: None * Origin Codes:
No
NO
-----------------------------------------------------------------------------------------------------------~-----------------------~----------------942630 H Inactive 09/25/97 NA "No
Description from Generator: PAINT SLUDGE, PAINT STRIPPING, CAUSTIC Form Code:
EPA Hazardous Waste Numbers: F002 Current Management Units: None
* Origin Codes:
952000 H Inactive 09/25/97 NA No Description from Generator: PAINT SLUDGE, PAINT STRIPPING
Form Code: EPA Hazardous Waste Numbers: F002
Current Management Units: None * Origin Codes:
972640 H Inactive 09/25/97 NA No Description from Generator: FILTER, SPRAY BOOTH MEDIA
Form Code: EPA Hazardous Waste Numbers: 0006 0007
Current Management Units: None * Origin Codes:

IHW020
66002 Texas Waste Code
AfBCA/Bergstrom Air force Base Waste Status Date of Managed Class Status Onsite/
Offsite
*** TEXAS NATURAL RESOURCE CONSERVATION COMMISSION *** Notice of Registration
Radioactive
Industrial and Hazardous Waste
TNRCC Audit Complete
Page: Date:
S 01/07/00
** No Longer ·Generated Wastes ** -----------~T-----------------------------------------------------------------------------------------------------------------------------------------973030 H Inactive 09/25/97 NA No
Description from Generator: BATTERIES, MERCURY CONTAINING form Code:
EPA Hazardous Waste Numbers: D009 Current Management Units: None
* Origin Codes: ------------------------------------------------------------------------------------------------------------------------------------------------------973080 H Inactive 09/25/97 NA No
Description from Generator: SILVER CONTAINING SOLID form Code:
EPA Hazardous Waste Numbers: 0011 Current Management Units: None
* Origin Codes: ------------------------------------------------------------------------------------------------------------------------------------------------------973520 H Inactive 09/25/97 NA No Description from Generator: BATTERIES, DRY CELL
form Code: EPA Hazardous Waste Numbers: D006
Current Management Units: None • Origin Codes: ----------------------------------------------------------------------------------------------------------------------------------------------------_.
979530 H Inactive 09/25/97 NA No Description from Generator: PLASTIC SANDER DUST
Form Code: EPA Hazardous Waste Numbers: 0006 D007
Current Management Units: None • Origin Codes:
----------------------------------------------------------------------------------------------------------------------------------------------------_. 983000 H Inactive 09/25/97 NA No
Description from Generator: PAPER TRASH, CONTAMINATED form Code:
EPA Hazardous Waste Numbers: fOOS Current Management Units: None
• OrigIn Codes: -----------------------------------------------------------------------------------------------------------------------------------------------------983110 H Inactive 09/25/97 NA No
Description from Generator: HYDRAZINE CONTAMINATED MATERIAL Form Code:
EPA Hazardous Waste Numbers: 0001 U133 Current Management Units: None
* Origin Codes: -----------------------------------------------------------------------------------------------------------------------------------------------------

IHW020
66002 Texas Waste Code
AFBCA/Bergstrom Air Force Base Waste Status Date of Managed Class Status Onsite/
Off site
••• TEXAS NATURAL RESOURCE CONSERVATION COMMISSION ••• Notice of Registration
Radioactive
Industrial and Hazardous Waste
TNRCC Audit Complete
Page: Date:
6 01/01/00
•• No Longer' Generated Wastes •• -----------~-----------------------------------------------------------------------------------------------------------------------------------------983480 H Inactive 09/25/97 NA No
Description from Generator: RAGS, CONTAMINATED Form Code:
EPA Hazardous Waste Numbers: 0007 0035 F002 F003 F005 Current Management Units: None
• Origin Codes: -----------------------------------------------------------------------------------------------------------------------------------------------------990001 H Inactive 09/25/97 NA No
Description from Generator: 0001 CHARACTERISTIC OF IGNITABILITY Form Code:
EPA Hazardous Waste Numbers: 0001 Current Management Units: None
• Origin Codes: -----------------------------------------------------------------------------------------------------------------------------------------------------990002 H' I nact i ve 09/25/97 NA No
Description from Generator: 0002 CHARACTERISTIC OF CORROSIVITY Form Code:
EPA Hazardous Waste Numbers: 0002 Current Management Units: None
* Origin Codes:
990003 H Inactive 09/25/97 NA No Description from Generator: 0003 CHARACTERISTIC OF REACTIVITY
Form Code: EPA Hazardous Waste Numbers: 0003
Current Management Units: None • Origin Codes:
-----------------------------------------------------------------------------------------------------------------------------------------------------991003 H Inactive 09/25/97 NA No
Description from Generator: SPENT NON-HALOGENATED SOLVENTS:XYLENE,ACETONE,ETHYL ACETATE, Form Code: '
EPA Hazardous Waste Numbers: F003 Current Management Units: None
• Origin Codes: -----------------------------------------------------------------------------------------------------------------------------------------------------991005 H Inactive 09/25/97 NA No
Description from Generator: THE FOLLOWING SPENT NON-HALOGENATED SOLVENTS: TOLUENE, Form Code: '
EPA Hazardous Waste Numbers: F005 Current Management Units: None
• Orlg1n Codes: ------------------------------------------------------------------------------------------------------------------------------------------------

IHW020
66002 Texas Waste Code
AfBCA/Bergstrom A1r force Base Waste Status Date of Managed Class Status Onsite/
Offslte
••• TEXAS NATURAL RESOURCE CONSERVATION COMMISSION --Not1ce of Reg1strat10n
Radloact1ve
Industrial and Hazardous Waste
TNRCC Aud1t Complete
Page: Date:
7 01/07/00
::_~~_:~~~:SL~:~:~~::~-~~::::-::----------------------______________________________________________________ ------------------------------------------993154 H Inact1ve 09/25/97 NA No
Descr1ption from Generator: U154 METHANOL OR METHYL ALCOHOL Form Code:
EPA Hazardous Waste Numbers: U154 Current Management Units: None
• Origin Codes:
993159 H Inactive 09/25/97 NA No Description from Generator: U159 2-BUTANONE OR METHYL ETHYL KETONE
form Code: EPA Hazardous Waste Numbers: U159
Current Management Units: None • Origin Codes:
993161 Hlnactive 09/25/97 NA No Description from Generator: U161 METHYL ISOBUTYL KETONE OR 4-METHYL-2-PENTANONE
form Code: EPA Hazardous Waste Numbers: U161
Current Management Units: None - Origin Codes:
993220 H Inactive 09/25/97 NA No Description from Generator: U220 BENZENE,METHYL OR TOLUENE
form Code: EPA Hazardous Waste Numbers: U220
Current Management Units: None - Origin Codes:
993239 H Inactive 09/25/97 NA No Description from Generator: U239 BENZENE, DIMETHYL OR XYLENE
form Code: EPA Hazardous Waste Numbers: U239
Current Management Units: None - Origin Codes:
------------------------------------------------------------------------------------------------------------------------------------------------------ The first value is considered the pr1mary value (e.g. prjmary or1gin code). As of 04/02/1999. the next unassigned sequence number for~WASTES is 0002.
Refer to 40 CFR Part 261 for Descriptions of EPA Hazardous'Waste Numbers.

IHW020
66002 AFBCA/Bergstrom Air Force Base
•••• UNITS AT THIS SITE MANAGING WASTE **** Unit unit Unit Number Type' Status
-I-
*** TEXAS NATURAL RESOURCE CONSERVATION COMMISSION ••• Notice of Registration
Industrial and Hazardous Waste
Date of Status
Classes of Waste Managed in Unit Dnstte / Dffsite
Unit Permit Number
Unit # Regulatory on Status Permit
Page: Date:
8 01/07/00
Deed Recording Needed/Date
•• 'Active' & 'Closure Pending' Units •• ----------------------------------------------------------------------------------------------------------------------------------------------------_. 006 Tank (Surface) Active 01/01/87 / NA Description from Company: For emergency use
Capacity: 3000.0000 Capacity Unit of Measure: G System Types: 141 Storage Biennial System Regulatory Status Regulatory status unknown Wastes Currently Managed in Unit
Wastes Previously Managed In Unit 908500
NA NA RCRA Pmt Exempt - Accumulation Time NA /
----------------------------------------------------------------------------------------------------------------------------------------------------_. 007 Mlsc Store Container Active 05/01/88 Description from Company: Storage of waste munitions System Types: 141 Storage Biennial System Regulatory Status Regulatory status unknown Wastes Currently Managed in Unit
Wastes Previously Managed in Unit 990003
/ NA NA NA RCRA Pmt Exempt - Accumulation Time NA /
-----------------------------------------------------------------------------~----------------------------------------------------------------------_.
009 Contain Store Area Active Description from Company: Building 1801 System Types: 141 Storage Biennial System Regulatory Status: Regulatory status unknown Wastes Currently Managed In Unit:
Wastes Previously Managed In Unit: 991003
/ NA NA NA
ala Contain Store Area Active 02/15/93 / NA NA NA Description from Company: Facility No. 4580 (12 CSS/CYSR), Containers System Types: Wastes Currently Managed in Unit:
Wastes Previously Managed In Unit: 916940 972640
NA /
NA /
-----------------------------------------------------------------------------------------------------------------------------------------------------As of 04/02/1999, the next unassigned sequence number for UNITS Is 015 .
•• 'Inactive', 'Closed' & 'Post Closure Care' Units ••
001 Tank (Sub-surface) Inactive 09/25/97 / NA NA NA Description from Company: Located at Building 1608. This tank is no longer used by Bergstrom AFB.
Capacity: 6000.0000 Capacity: Unit of Measure: G System Types: 141 Storage Biennial System Regulatory Status: Wastes Previously Managed in Unit:
Regulatory status unknown 00011011 908500
NA /
-----------------------------------------------------------------------------------------------------------------------------------------------------002 Contain Store Area Inactive 09/25/97 / NA NA NA NA /

IHW020
66002 AFBCA/Bergstrom Air Force Base Unit Unit Unit Number Type Status
*** TEXAS NATURAL RESOURCE CONSERVATION COMMISSION *** Notice of Registration
Industrial and Hazardous waste
Date of Classes of Waste Status Managed In Unit
Onslte / Offslte
Unit Unit # Regulatory Permit on Status Number Permit
.. 'Inactivef, 'Closed' & 'Post Closure Care' Units ** Description from Company: Located at Building 1608. This unit has been relocated to Building 1639. System Types: 141 Storage Biennial System Regulatory Status: Regulatory status unknown Wastes Previously Managed in Unit: 910120 916510 916940 942630 972640 983000 983480
Page: Date:
.•. ,~ .....
9 01/07/00
Deed Recording Needed/Date
------------------------------------------------------------------------------------------------------------------------------------------------------003 Tank (Sub-surface) Closed 08/31/95 / NA NA IN3 RCRA Interim Status Unit NA / Description from Company: Entymology pit; open evaporation pit managed as tank located at Building 722
Capacity: 561.0000 Capacity Unit· of Measure: G System Types: 141 Storage Biennial System Regulatory Status: Regulatory status unknown Wastes Previously Managed in Unit: 907190 ------------------------------------------------------------------------------------------------------------------------------------------------------004 Tank (Sub-surface) Closed 02/21/96 / NA NA IN1 RCRA Interim Status Unit NA / Description from Company: Tank B-7 located at Facility 590
Capacity: 25000.0000 Capacity Unit of Measure: G· System Types: 141 Storage Biennial System Regulatory Status: Regulatory status unknown Wastes PreyioUsly Managed in Unit: 914740 ---------------------------~------------------------------------------------------------------------------------------------------------------------_.
005 Contain Store Area Capacity:
Closed 20000.0000
08/24/95 / NA Capacity Unit of Measure:
System Types: 141 Storage Biennial System Regulatory Status: Wastes Previously Managed in Unit:
Regulatory status unknown 910120 914740 916510 916940 991003 991005
NA IN2 RCRA Interim Status Unit NA / G
942630 972640 973030 983000 983480 990001 990002
----------------------------------------------------------------------------------------------------------------------------------------------------_. 008 Contain Store Area Inactive 01/19/95 / NA NA NA NA / Description from Company: Building 722 System Types: 141 Storage Biennial System Regulatory Status: Regulatory status unknown Wastes Previously Managed in Unit: 909850 --------------------------------------------------~-------------------------------------------------------------------------------------------------_. 011 Tank (Surface) Inactive 02/16/93 / NA NA NA NA / Description from Company: Facility No. 4980
Capacity: 6000.0000 Capacity Unit of Measure: G System Types: 141 Storage Biennial System Regulatory Status: Regulatory status unknown Wastes Previously Managed in Unit: 914740 . -----------------~----------------------------------------~-----------------------------------------------------------------------------------------_. 012 Contain Store Area. Inactive 01/19/95 / NA NA NA NA / Description from Company: Facility No. 1612, Containers System Types: Wastes Previously Managed in Unit: 912510 912520 916510 916940 973030 973080 973520 990001 990002 990003 993154
993159 993161 993220 993239

IHW020
66002 Unit Number
AFBCA/Bergstrom Air Force Base Unit Unit Type Status
*** TEXAS NATURAL RESOURCE CONSERVATION COMMISSION *** Notice of Registration
Industrial and Hazardous waste
Date of Status
Classes of Waste Managed I n Un It Onslte / Offslte
Unit Permit Number
Unit # Regulatory on Status Permit
** 'Inactive'. 'Closed' & 'Post Closure Care' Units **
Page: Date:
10 01/07/00
Deed Recording Needed/Date
-----------~r-----------------------------------------------------------------------------------------------------------------------------------------013 Contain Store Area Inactive 09/25/97 / NA NA NA NA / Description from Company: Facility No. 1639 (67 RW/MARC). Containers. This Is no longer being used as a
container storage area by Bergstrom AFB. System Types: Biennial System Regulatory Status: Regulatory status unknown Wastes Previously Managed in Unit: 910120 942630 972640 979530 983000 983480 ----------------------------------------------------------------------------------------------------------------------------------------------------_. 014 Contain Store Area Inactive 01/19/95 / NA NA NA - NA / Description from Company: Facility No. 4937 - Containers System Types: Wastes Previously Managed In Unit: 912510 912520 916510 916940 973030 973080 973520 990001 990002 990003 993154
993159 993161 993220 993239 ----------------------------------------------------------------------------------------------------------------------------------------------------_.
,

, 09/27/95 15: 24 ~512 369 4746 AFBDA BERGSTROM Ial 0021003
ORDINANCE NO. 940210-~
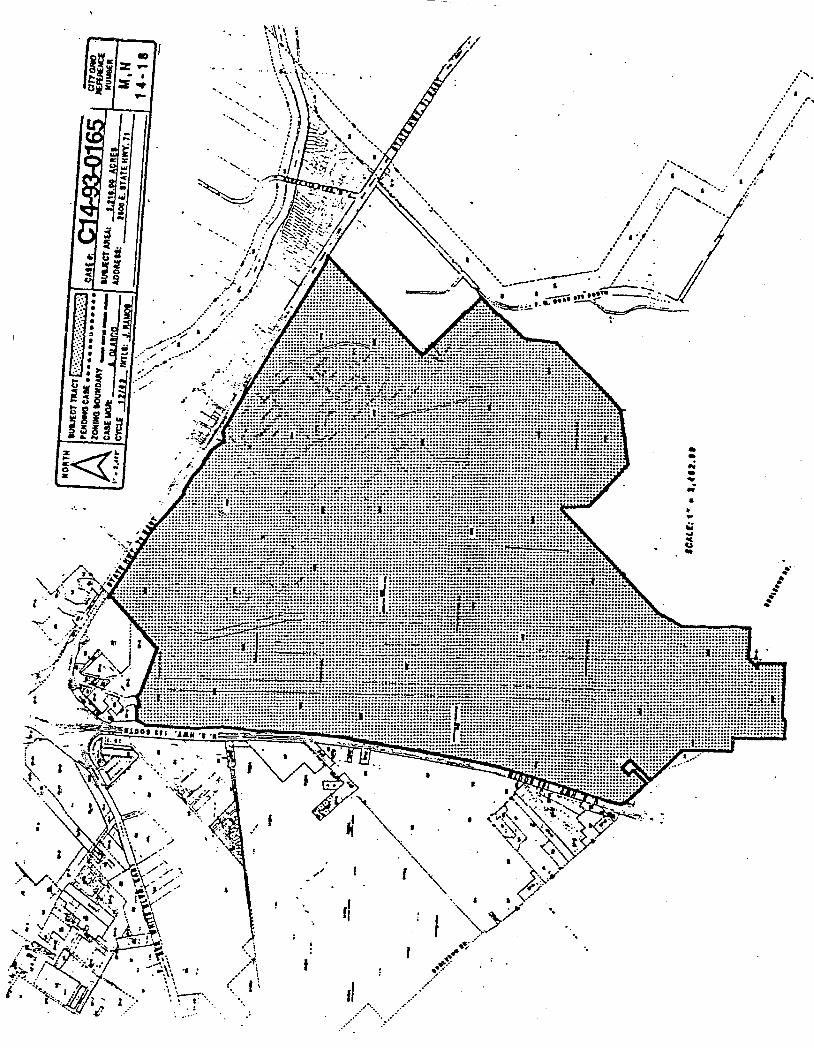
AN .ORDINANCE ESTABUSHING IN1Th\I. PERMANENT ZONING AND CHANGING TIlE' ZONING MAP ACCOMPANYING CHAPTER 13-2 OF !HE AUSTIN 01Y CODE OF 1992 AS FOLLOWS: APPROXIMATELY 3,216 ACRES OF LAND, FROM "UNZ· UNZONED DlSTRIcrTO WAY" AVIATION SERVICES DISTRICT, LOCAllY KNOWN AS 2500 EAST STATE HIGHWAY 11, SAID PROPERlY BEING MORE PARTICUL\Rl.Y IDENTIFIED BY MAP IN THE "'EXHIBIT A" ATTACHED TO nns ORDINANCE. BEING GENERAllY KNOWN AS TIlE NEW AUSTIN AIRPORT AT BERGSTROM. IN THE qTf OF AUSTIN, TRAVIS COUNTY, TIXAS; WAIVING THE REQUIREMENTS OF SECTION ·'2:"2.:-3 OF THE AUSTIN CT1Y CODE OF 1992; AND PROVlDING AN EFFECTIVE DATE.
BE IT ORDAINED BY'I1lE CI1Y COUNQL OF mE CI1Y OF AUSTIN:
PART 1. That Chapta 13-2 of the Austin City Code of 1992 is am~ded to ,1lange the base zoning dfuricr on the Propcnywhich is within the incOIporated city limits of th,.:: City of Austin., Travis County, Tens, included in zonin~ case no. Cl4-93-016S, locally kno', 1\ as 2500 East State Highway 71, and being-more pamcularly identified in the map attach!.i as -E.xlubitA.to this ordiIiance, from ·UNZ· U.nzoned district to -AV" Aviation Servict· .. dinria, being gmc:ra11y knO\\1I1 as the New Austin Airport at Bergstrom. in the City of Austir • Travis County, Tau..
. . -PART 2. That it is ordaed that:rhe Zoning Map established by Sec. 13-2-22 of the: Austin City Code of 1992 and ~de a parr thereof iliall be c:hanged to n:cord the: amendment ~ctc:d by thU ordinance. .
PART 3. That: the requ.irWl~ts impos·~d by Se:ction 2-2-3 of the Austin CitY \:ode of 1994 as amended. regarding the presenration and adoption of ordin2lllces are haeby waived by the affirmative: vote of :at least five me.mbc:n of the City CounciL
PART 4. That: this ordinance shall become e.ff~ctive upon the expiration of tt-.~ days following Uu: dare of its fi.n.al passage. as provid~d by the: Chaner of the CitY of AustUJ
PASSED AND APPROVED:
________ ~F~e~brn~aIT~ __ ~]Q~ ____ ~,1~4
APPRO~ i~~ Dian.n IiGJill&er
City Anomey
~ AITFSf:~ ( "-Y James ) _ Aldridge:
Cit) - Clerk
I
I
.'.
• • .. -• .; • • 1M -' ~ ..
. ~.. .' ..... . .... ";;,,,.,,,,,,,,"''' ."",,. "./
/,'1 : \\ , t'''' • ~ "';;m~,,,,,,,m, .. '· .". , I { '.' . -' I " ;a,'--:::.":;': ~"'" "·,;;'miii'i"'· .
" //,,~, t,/ ~... ,~.,,, .. t,.. -' /"-/"~/t.f.~t:.:»K./:'-' . "', ",~, '"'~ ·';,~./~l!~":~. • 0(: . <c........ ~, ,''/ ," V . ~~" -y • ..J! ... ' .. ~ ,. .' ,,' , .J ,.. r' .
,. " a '. '''.l ,/ t ..... " ,I',·' •. 1:.' : ~"" I • ~.' " . '-. • ,', ..... ,., " ) ....... ,.>.
,...,. • 'f' .1' , " ... . .... ~:t:'. .. : 14.,., ,.. /~> /:~~~'f~'!.: ..... <:.~w,ir\ I'" • Y' .. . ,_, .' .. , . '" I ... ~.", .
ell:." / . '>J".,/ • , ~\ <. , r ,,~/ • •... ".i' ~' , ,_-;,,,.... r" I. '. ,. " "- . ,\. .: .' ,t ., .. -~. "~" 'A' ' ' , ... \ #., ..
r "'" ,,:, ". .; • ... f' .A.<' " ..• ·z·· ............ ' .~., . '.. .~ ... •• t··· . I ",.,
. .£' .. ' .. : • // .. ' I" .. / ..... , ....... > ......... ....

NOTES:
1125810139.E37
TABLE 7
AREA 122-1 CHARACTERIZATION AND CONFIRMATION SAMPLES SWMU 122, Fonner Skeet and Trap Range
Bergstrom AFB, Austin, Texas
Lead Concentration (mglkg) Lead Concentration (mglkg)
Sample Location A Sample B Sample
(0.0 - 0.5 foot) (0.5 - 1.0 foot)
122109R(I) 29.1 22.2 122146 16 NA 122147 512 7.82 122148 24,200 12 122149 61.4 NA 122188 49.1 NA 122189 '43.7 NA 122190 20.2 NA 122191 12.7 NA 122192 16 NA 122193 278 8.24 122194 27.5 NA 122195 50 NA 122196 14.9 NA 122197 86.2 NA 122198 19.2 NA 122199 23.5 NA 122200 68.5 NA 122201 35.6 NA 122202 9.93 NA 122203 9.27 NA 122204 9.84 NA 122205 20.3 ·NA 122206 19.7 NA 122207 58.4 NA 122208 16.4 NA 122209 14.9 NA 122210 9.51 NA 122211 10.4 NA 122212 15.1 NA 122213 11.3 NA 122214 15.5 NA 122215 18.3 NA 122216 82.1 NA 122217 8.04 NA
(1) The 'C' sample (1.0 to 1.5 feet) at location 122009R had a concentration of 13.8 mglkg. NA = Not Analyzed

TABLES
AREA 122-2 CHARACTERIZATION AND CONFIRMATION SAMPLES SWMU 122, Former Skeet and Trap Range
Sample Location
122150 122151 . 122152 122153 122154 122155 122156 122157 122158 122159 122160 122161 122162 122163 122164 122165 122166 122167 122168 122169 122170 122171 122172 122173 122174 122175 122176 122177 122178 122179 122180 122181 122182 122183 122184 122185 122186 122187
Bergstrom AFB, Austin, Texas
Lead Concentration (mg/kg)
A Sample (0.0 - 0.5 foot)
216 88.4 16.7 26
73.4 -90 73 42
4260 98.6 44.4 32.8 32.2 36.4 24.2 73 176 584 27.4
41,800 415 398 367 75.7 100
26,700 119 41.3 108 28
75.7 23.4 44
20.1 15.4 84.6 32.2 269
Lead Concentration (mg/kg)
B Sample (0.5 - 1.0 foot)
16.4 NA NA NA NA NA NA NA 10.6 NA 13.4 NA NA NA NA NA NA 18.8 NA 9.36 24.2 29.9 25 NA NA 34.8 NA NA NA NA NA NA NA NA NA NA NA 17.6
Note: .NA = Not Analyzed
1125810139.E37

_/
.~
\ ----\\ '\ ----- \ \ \
\ '" "-\"'::'~~'~
", \ \ \ , \\\
""--'. " \ \ \
122109R
122109
)
/i / u/ N
~
lli.E!:ill.; () soc BORING lOCA 110H
~l 1$3 I£AII CQlQ)lmAnON IN IIIWCRAIoIS PER KIlOCRAIoI (m9ftg) / . _____ la'OCRAPHIC CQlTOJRS (rT)
• /' ~ EXCAYAI£D AA(A
122017 '
.,' --"'," '\\ , ... ' '._', \ "', 122212
.,/ ~~ \ 122,129 ~ I _ 1'--l:&1t2f4mIZl!§1~ ~ /,_~ '. ~ <15'~ 111 V/
'.<..:.' " '\ ", <'"'' ..... " ......
"L \.
-1:!Q.IE.;,. I) XRF- X-RAY fl.UOREsc[NCE
2) SIlECIED SAIoIPl£S FR~ BORINGS IN BOLD PRINT ANALYlED BY xsr AND LABORATORY
1) INnAL SAIIPt.£ DEPTHS A - 0-0.2~ FUT B - 0.25-0.5 rEET ",
_=:.=-.7 .
(i, )
'\-/ / X ' .
~-'. '. I ~ CI SKEerAND" '1.22 CJ
TRAP AREA 22127
/
."....... 1:::'::~,./ ".
"'1/ r]··· :':::~_._.J { -", I l. -. I. \
I '- ."-__ " \ ....... tE~3 11_\0 --(1221J 122119 ...... ----,,-.
"
() 122040
;;!i25()- C - 0.5-1.0 rEET .) I£AII CONCEHmAnONS ARE FR~ XRf ANAL'YSIS,
EXCEPT UHOE~ED RESULTS lMllCH ARE FR~ WIORA TORY ANAL 'ISIs,
~ BAS( YAP AND TOPOGRAPHIC CONTOURS PROlllDED BY THE OTY Of AUSnH.
k_~O 170 --SCALE IN fEET /~ \-= . ./' . ~I--------------------i ''''''~ /" ••.. /. \ AIR fORCE CfNIER fOR ENIORONMENTAI EXCEl! fNCE ',- ~' . BERGSTROM AIR fORCE BASE ".-/ AUSTIN, TEXAS
,,--- .. _.-' SWMU 122 ------.- fORMER SKEET AND TRAP RANGE
----- .---_______.. SAMPLE LOCATION MAP -- AREA 122-1
0019 ~NllDh
MSB fU .. .., 15.SEPTEMBER.95
~~, oec:a.D -Pi
1<01< -..cr ... 11-2581-0119

,. , "., "
-~ .~. //' ~;:.-.:igiTe~:::Ql~ ~. _. __ ._._---=====--==---. /
:::::::'~"'\
-'~'-- ---- -I
'-............... ~
'~"~~"-... I0337:Bl 'i 'Z
'~~::51 .. ~ ()
122157 () 122040
() 122155 ~2152 ~2215
\ V/fl'i'/j I"'" b \~ 1777 7'"7 /17:1 122045 () A 42
122036 ()
122051 A 104 ~ L ~ C 24 -----() 122052~~ n~
-------~:;:5 g ~:=;;;;;;~?~~ 21
() 122070
122180 ()
AREA 122-2 BOUNDARY/
122184 ()
122181 ()
122185 ()
122182 ()
122186 ().
() 122065
122066 ()
A 1.~4,W. .~nn,. ~
N
J.£ruID; () SOIL BORING LOCA lIONS
245 l£AO CQlCENlRA nON II IllUJ00AliS PER KIlOGRAli (mvt\v)
-----....- TOPOGRAPHIC CQlTOORS (FT.)
~EXCAVATEO
~ I) XRF- X-RAY FLUORESCENCE
2) SELECTED SAIIPlES fROli BORINGS IN BOLD PRINT ANAlYZED BY XRr AND LABORATORY
J) SOIL SAIIPlE OEPlHS: A 0-0.25 rEET B 0.25-0.SO rEET C 0.50-1.0 rEET D 1.0-1.5 rEET
4) l£AO CONCENlRA nONS ARE fllOli XRr ANAlYSIS, EXCEPT UNDERUNED RESUlTS YIHId! ARE fROli LABORATORY ANAlYSIS.
.sQl.!Bre BASE IIAP AND TOPOGRAPHIC CQlTOORS PRO\1DED BY !HE OlY or AUSnN.
k~2,o 'yo --=-SCAlE IN FEET
AIR fORCE CENTER fOR ENVIRONMENTAL EXCft I ENCE BERCSTROII AIR fORCE BASE
AUSTIN. TEXAS
SWMU 122 fORMER SKEET AND TRAP RANCE
SAMPLE LOCATION MAP AREA 122-2
.-/___ ___ 122073 ~;~ ___ ._.::::;::::--------- ....-/'__ ~--;;V .. AMl>iOi.iYr.,----:::-;;~~r-~gg~~~;:-------1
/ ~ ~~ ~ '... ~c, NO. •• _~~K _ •• ~
1~.SlP.95
27.IIAY.98

SWMU 122 Closure Report Bergstrom AFB
6.0 SUMMARY OF SOIL EXCAVATION AND DISPOSAL
September 22, 1998
Excavation of lead contaminated soil in SWMU 122 was performed by Laguna in August and
September 1997. Site preparation, including removal of trees and shrubs in the excavation areas,
was performed on August 21 and 25, 1997. Grids 122147, 122148, and 122193 in Area 122-1
were excavated on August 26,1997. Grids 122150, 122158, 122169, 122170, 122171, 122172,
122175 and 122187 in Area 122-2 were excavated on August 27, 1997 and grid 122167 was
excavated on September 29, 1997. All grids were excavated to a depth of6 inches. A Caterpillar
320 track-hoe excavator was used for the excavation. The soil was loaded directly into trucks for
disposal at an off-site landfill. The excavations were not back-filled because of the shallow
depths.
A total of 830 cubic yards was disposed at Austin Community Landfill in Austin, Texas. The
increase in volume from the original in-situ estimate was primarily a result of expansion due to
excavation and slight over-excavation of the grids. A copy of the approved Class II waste code
and the signed waste manifests are included in Appendix F.
1125810139.E37 6-1

EXHIBITC
INSTITUTIONAL CONTROLS FOR SWMU 216, ALLEGED SOLVENT DISPOSAL AREA
SWMU 216 is located immediately adjacent to an active runway at the Austin Bergstrom International Airport and access to SWMU 216 is currently restricted to airport personnel. No engineering controls are required for SWMU 216. However, due to the contaminants left in place on the Property as identified in Exhibit "B," the following institutional controls will remain with the Property:
1. Conducting surface or subsurface construction activities on the Property, such as, but not limited to, the excavation of soils, installation or repair of utilities, installation of foundation piers, may cause an exposure to the contaminants left in place. Performance of any type of intrusive activity on the surface or in the subsurface of the Property could pose an increased risk to human health or the environment. Therefore, any surface or subsurface intrusive activity on the Property is prohibited unless the following requirements are adhered to.
If the current or future owner of the property must undertake surface or subsurface construction activities, any such owner must comply with all applicable environmental, worker protection and other laws, rules, and regulations. The owner must prepare a Work Plan describing the activities proposed within the Property. The owner of the property must also develop and adhere to a Health and Safety Plan that addresses worker protection and contingencies for possible potential releases of contaminants from the affected soil that may be encountered when conducting the aforementioned activities. The Work Plan and Health and Safety Plan.must be approved by the TNRCC prior to initiating any such activities within the Property.
2. Due to the presence of the contaminants left in place, exposure to the groundwater within the Property may pose an increased risk to human health and the environment and therefore all uses of the groundwater are prohibited.
The above restrictions may be lifted if the current or future owner of the Property can demonstrate, to the satisfaction of the TNRCC, that the contaminant levels no longer present a risk and, therefore, the Property no longer requires restriction. All future remedial investigations or activities on the property by the current or future owner will be coordinated with the TNRCC.
Carpenterk
Text Box
Parcel B

01/30/02 07:40 FAX
~/ RobertJ. Huston. Chairman
R. B. "Ralph" Marquez, Commissioner
John M. Baker, Commission.er
Jeffrey A. Saitas. Executwe Director
TEXAS NATURAL RESOURCE CONSERVATION COMMISSION Protecting Teras. by ReduanglZ'fld Preventing Pollutirm
Mr. Charles Pringle Team ChiefJBEC HQ-AFCEEIERB 3207 North Road. B-532 Brooks AFB, TX 78235-5363
RE: Bergstrom Air Force Base
January 9, 200~
TNRCC Solid Waste Registration No. 66002 EPA ID. No. TX0572124188 Review of Draft Corrective Action EO Achieve SiEe Closure of Soil Under RRS 3 SWMU 216 Alleged Solvent Disposal Site (March 29. 2000); and Corrective Action to Achieve Site Closure of Soil Under RRS 3 SWMU 216 Alleged Solvent Disposal Sile
Dear Mr. Pringle:
The Texas Natural Resource Conservation Commission (TNRCC) has reviewed the Draft Corrective Action to Achieve Site Closure of Soil Under R.RS 3 SWMU 216 Alleged Solvent Disposal Site dated March 29, 2000 and recei ved by the TNRCC on April 12. 2000 and the Corrective Action to Achieve Site Closure of Soil Under RRS 3 SWMU 216 Alleged Solvent Disposal Site dated May 22, 2000 and received by the TNRCC on June 7, 2000. In addition to our review of the referenced reports, the TNRCC also reviewed comments received from EPA Region 6 dated June 6. 2000 concerning the draft corrective action. .
Accord.ing to the referenced documents, S\VMU No. 216 is an alleged solvent disposal site located in the southeast comer of the former Bergstrom AFJ:3. Elevated levels of semi-volatile organic compounds (SVOG's) were detected.in soil. Hexachloroethane was detected at a concentration of 5,900 mglkg and benzo(a)pyrene was detected at 3.35 mg/kg. The referenced reports propose the excavation of contaminated soil from locations 21609 A and 21602 A and B. Following the excavation and off-site disposal of soil, the Air Force Base Conversion Agency (AFBCA) proposes to close SWMU No. 216 under Risk Reduction Standard (RRS) No.3 for soil and RRS No.2 for ground water.
Based upon our review, the TNRCC concurs with the corrective action as proposed. It is the TNRCC Corrective Action Section's understanding that the final site closure report for S-wMUNo. 216 Alleged Solvent Disposal Site will be submitted for TNRCC review and approval in early 2001.
P.o. Box 13087 • Austin. Texas 78711·3087 • 5121239-1000 • lntunet address: www.tnrcc.state..tx.us
~002

01/30/02 07:40 FAX
Mr. Charles Pringle Page.2 January 9, 2001
If you have any questions concerning tliis matter, please contact me at (512).239-2360, Mail Code MC 127, e-mail [email protected].
Sincerely.
m;1-4Jl A ~ tJ~ Mark A Weegar. ProjectManager Team IT, Corrective Action Section Remediation Division Texas NatUral Resource Conservation Commission
MW:mw
cc: Mr. Randy Beyer, AFBCAIROL. Austin, TX Ms. Laura Stankosky, U.S. EPA Region VI, Dallas, TX.(6PD-NB) Ms. Tamara Moore, City of Austin, TX Mr. Barry Kalda, TNRCC Region 11 - Austin. TX (MC-Rll)
~003

UNITED STATES ENVIRONMENTAL PROTECTION AGENCY REGIONS
1445 ROSS AVENUE, SUITE 1200 DALLAS, TX 75202-2733
June 7,2001
Mr. Mark A. Weegar, Project Manager Team II, Corrective Action Section Remediation Division Texas Natural Resource Conservation Commission P.O. Box 13087 Austin, Texas 78711-3087
RE: Bergstrom Air Force Base, Austin, Texas EPA ID. # TX0572124188'
Dear Mr. Weegar:
The Environmental Protection Agency (EPA) has reviewed the document "Site Closure Report for SWMU 216 Alleged Solvent Disposal Site," dated, November2000. This document was submitted to EPA by Mr. Charles Pringle, by letter dated January 25,2001, and received by EPA on January 29, 200l.
SWMU 216, an alleged disposal- site, is located in the southeast comer of the base, west of the south end of the main runway. EPA submitted comments on the site closure report and baseline risk assessment for SWMU 216 on March 31, 1998 and the scoping document on January 5, 2000. EPA also concurred with the proposal to close soil under Risk Reduction Standard (RRS) 3 and with the proposal to close the sites groundwater under RRS 2 on June .6, 2000. Two areas at the site had elevated levels of semi-volatile organic compounds (SVOC) in the soil; 5900 mg/kg hexachloroethane and 3.35 mglkg benzo(a)pyrene. Soil removal actions for these two locations, 21609 A and 21602 A&B, were completed. EPA concurs that the remaining concentrations for the constituents of concern do not exceed the established protective concentration levels. EPA concurs that no further action is required and that site closure can proceed in accordance with RRS3. The document states that deed recordation will be completed upon approval of -closure. Deed recordation must be completed prior to transfer of this parcel to the City of Austin.
Internet Address (URL) • htlp:hwww.epa.gov
RecycledIRecyclable • Printed with Vegetable on Based Inks on Recycled Paper (MInimum 25% Postconsurner)
Should you have any questions or wish to discuss this further please do not hesitate to contact me at (214) 665-7525.
Sincerely,
GP~/~~ Laura Stankosky / Senior Project Manager Base Closure Team
cc: Mf' Charles Pringle, AFCEE Team ChieflBEC ~~: Richard Pautz, AFBCA, Bergstrom AFB
Ms Tamara Moore, City of Austin
Robert J. Huston, Chainnan R. B. "Ralph" Marquez, Commissioner
John M. Baker, Commissioner Jeffrey A. Saitas, Executive Director
TEXAS NATURAL RESOURCE CONSERVATION COMMISSION . Protecting Texas by ReduCing and Preventing Pollution
Mr. Charles Pringle Team ChiefIBEC HQ-AFCEEIERB 3207 North Road, B-532 Brooks AFB, TX 78235-5363
RE: Bergstrom Air Force Base
July 26, 2001
TNRCC Solid Waste Registration No. 66002 EPA ID. No. TX0572124188 Review of Final Amendment - Site Closure Report for SWMU 216 Alleged Solvent Disposal Site Approval - Risk Reduction Standard No~ 3
Dear Mr. Pringle:
The Texas Natural Resource Conservation Commission (TNRCC) has reviewed the Final Amendment To: Site Closure Reportfor SWMU 216 Alleged Solvent Disposal Site (Final Report) dated November 2000 and received by the TNRCC on January 31, 2001. In addition to our review, the TNRCC also evaluated comments received from EPA Region 6 dated June 7, 2001. According to the Final Report, SWMU No. 216 was an alleged solvent disposal site located on the southeast comer of the former Bergstrom AFB. The Final Report indicates that remediation activities have been completed in accordance with the TNRCC Risk Reduction Standard (RRS) No.3, pursuant to Title 30 Texas Administrative Code (TAC) Chapter 335 Subchapters A and S.
According to 30 TAC §335.8(c) and §335.6(g), closure/remediation to RRS No.3 requires preapproval by the TNRCC. .. The closure plan containing the remedial investigation (§335.553(b)(1»), baseline risk assessment (§335.553(b)(2», and corrective measure study (§335.553(b)(3» was approved by the TNRCC on January 9, 2001. According to the Final Report, industrial solid waste and municipal hazardous waste and waste residues were closed in-place without post-closure care requirements. After a review of the Final Report, the executive director has determined that engineering controls and institutional controls are not required to protect human health and the environment; therefore, the Air Force Base Conversion Agency (AFBCA) is released from post-closure care responsibilities, but is required to provide deed recordation of the facility according to 30 TAC §335.566. As noted in Appendix D LAWGIBB Group Letter Dated May 22, 2000, AFBCA has voluntarily developed institutional controls to be placed on this site. A copy of these institutional controls must be included with the required deed recordation document.
._--- -" ." ........... "'0"" ')no., _ C:l?f')~O.l()()() • lntprnpt ;\(lcfress: www.tnrcc.state.l.(.us
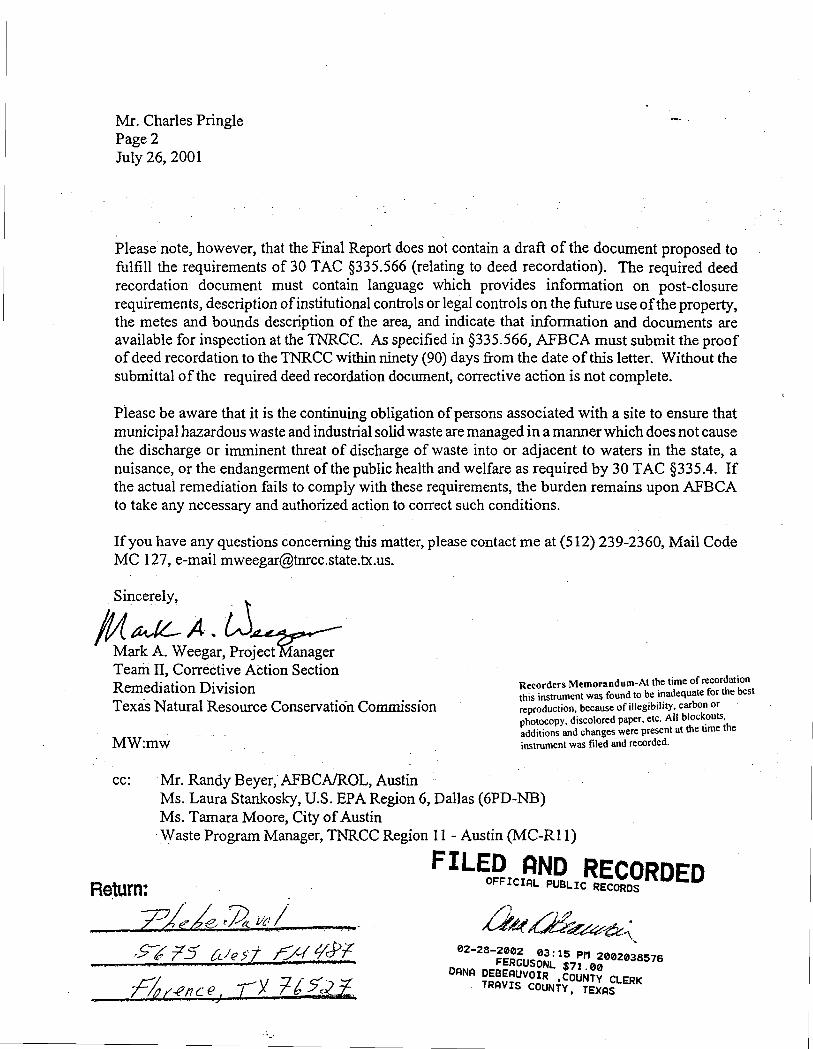
Mr. Charles Pringle Page 2 July 26,2001
Please note, however, that the Final Report does not contain a draft of the document proposed to fulfill the requirements of 30 TAC §335.566 (relating to deed recordation). The required deed recordation document must contain language which provides information on post-closure requirements, description of institutional controls or legal controls on the future use ofthe property, the metes and bounds description of the area, and indicate that information and documents are available for inspection at the TNRCC. As specified in §335.566, AFBCA must submit the proof of deed recordation to the TNRCC within ninety (90) days from the date of this letter. Without the submittal of the required deed recordation document, corrective action is not complete.
please be aware that it is the continuing obligation of persons associated with a site to ensure that municipal hazardous waste and industrial solid waste are managed in a manner which does not cause the discharge or imminent threat of discharge of waste into or adjacent to waters in the state, a nuisance, or the endangerment of the public health and welfare as required by 30 TAC §335.4. If the actual remediation fails to comply with these requirements, the burden remains upon AFBCA to take any necessary and authorized action to correct such conditions.
If you have any questions concerning this matter, please contact me at (512) 239-2360, Mail Code MC 127, e-mail [email protected].
Sincerely, i "
!1;(l;.JL- A . Wu~ Mark A. Weegar, Project anager Team II, CorreetiveAction Section Remediation Division Texis Natural Resource Conservation Commission
Recorders Memorandum-At the time of recordation this instrument was found to be inadequate for the best reproduction. because of illegibility. carbon or photocopy. discolored paper. etc. All block~uts. additions and changes were present at the tIme the instrument was filed and recorded . MW:mw
cc:
Return:
. Mr. Randy Beyer, AFBCAlROL, Austin Ms. Laura Stankosky, U.S. EPA Region 6, Dallas (6PD-NB) Ms. Tamara Moore, City of Austin
. Waste Program Manager, TNRCC Region 11 - Austin (MC-RII)
FILED AND RECORDED OFFICIAL PUBLIC RECORDS
?i;I£~~~(' .- , . ali( W~4'~~,
._.
02-28-2002 03:15 PM 2002038576 FERGUSONL $71 00
DANA DEBEAUVOIR ,COUNTY CLERK TRAVIS COUNTY, TEXAS
ATTACHMENT 5 - 3
PARCEL C THE FORMER SMALL ARMS AND RIFLE RANGE
JUN-28-2002 FRI 09:52 AM TNRCC CORRECTIVE ACTION
Rober~ J. f-/lI:iton, Chairman
R n. "J{alllh" Harquc?. Commissioner 10hn M. Baker, CommissiolU:r
Jeffrey A. Saitas. E),'('C/Jll'llr! Director
'. " " ,.'
FAX NO. 5122392346
TEXAS NATURAL RESOURCE CONSERVATION COMMISSION Protecting Tt!.>:ClS hy Reducing arid frel'en/ill!} Pollutio'rz
Mr. Ch~rlcs Pringle Team Chief/BEC HQ·AFCEEIERB 3207 Norlh Road, 8-532 Brooks AFB. TX 78235-5363
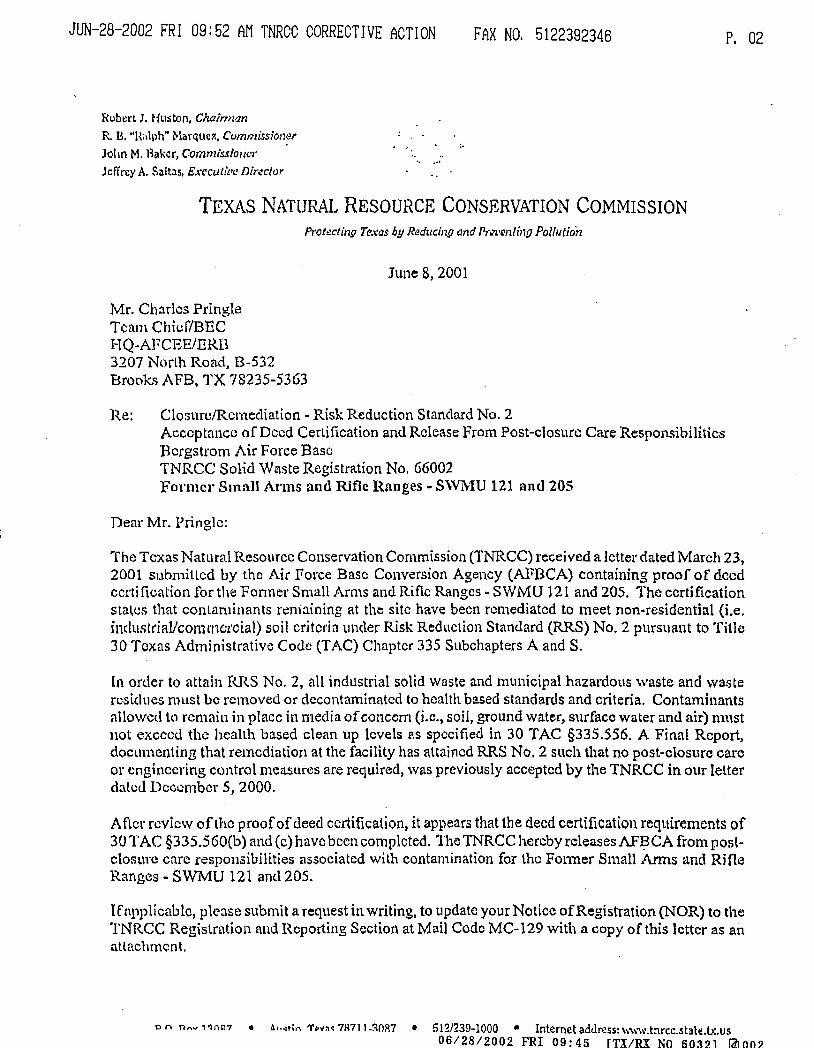
June 8, 2001
Re: Closllre/Rcmediation - Risk Reduction Standard No.2 AcccptonclJ of Deed Cerlification and Release From Post-closure Care Responsibilities 1-3crgstrom Air Force Base TNRCC Solid Waste Registration No. 66002 Former' Small Arms and Rifle Ranges - S\VMU 121 nod 205
Deal' Mr. Pringle:
P. 02
The Texas Natural Resource Conservation Commission (TNRCC) received a letter dated March 23, 2001 sl.lbmitlcd by the Air Porce Base Conversion Agency (AFBCA) containing proof of deed ccrti ficntion for the Former Small Arms and Rifle Ranges w SWMU 121 and 205. The certification stal<.:5 that conlanlinants Tt:!ni::tining at the site have been rcmediatcd to meet non-residential (Le. industrial/commeL'cial) soil criteria under Risk Reduclion Standard (RRS) No.2 pursuant to Title 30 Tex.as Administrative Code (TAC) Chapter 335 Subchapters A and S.
In order to attain RRS No.2, all industrial solid waste and municipal hazardous waste and waste residues must be removed or decontaminated to health based standards and criteria. Contaminants nllowcd tn remain in place in media of concern (i.c., soil, ground water, surface water and air) must not exceed the health based clean up levels ns specified in 30 TAC §335.556. A Final Report, docmnenting that remediation at the facility has attained RRS No.2 such that no post-closure caro or engineering cc.mtrol measures are required, was previously accepted by the TNRCC in our letter datetl. December 5,2000.
A fLcr roview of lhc proof of deed certification, it appears that the deed certification requirements of 30 TAC §335.560(b) and (c) have been completed. TheTNRCC hereby releases AF1?CA fromposlclosure care responsibilities associated with contamination for tho Former Small Arms and Rifle Ranges - SWMU 121 ami 205.
1 f npplicablo, please submit a request in writing, to update your Notice of Registration (NOR) to the TNRCC Registration and Reporting Section at Mail Code MC-129 with a copy of this letter as a.n 1.\Uachmcnt.
0" n~v 1 'l"~7 • dl,~tin 1'p'o/M 7R711-~o,q7 • 512/239-1000 • Internet address: \\ww.tnrcc.state.l.x.us 06/28/2002 FRI 09:45 [TXlRX NO 6!l32] ~002

JUN-28-2002 FRI 09:52 AM TNRCC CORRECTIVE ACTION
Mr. Charles Plinglc Page 2 June 8~ 2001
FAX NO. 5122392346 P. 03
Please be aware that it is the continuing obligation of persons associated with a site to assure that municipal hazardous WMtc and imlustrial solid waste are managed in a manner which does not cause the discharge or imminent threat of discharge of waste into or adjacent to waters in" the sLate, a nuisance, or the end.angerment of the public health and welfare as required by 30 TAe §33S.4. If the netl-Hll remediation fails to comply with these requirements, the burden remains upon (AFBCA) to take any necessary and authorized action to correct such conditions. A TNRCC field inspector m~ly rcview your Final Report and conduct a closure inspection of the site.
Questions concl.":rning this letter should be directed to me at (512) 239-2360. When responding by mail, plcMe submit an original and one copy of all correspondence and reports to the Con'ecLivc Action Seclion at Mail Code MC-127 with an additional copy submitted to the TNRCC Regionll Office in Austin. The TNRCC Solid Waste Registration Number and Unit Name should be: rolcrenccd in all submittals.
Sincerely,
JU.~A,W~ Mnrk A. Weegar, Project Manager TCilm II, Corrective Action Section Rerl.1cdiation Division Texas N"hlr<ll Resource Conservation Commission
MW/l11W
cc: Mr. Rnncly Beyer, AFBCAlROL, Austin, TX Ms. Laura Stankosky, U.S. EPA Region VI, Dallas, TX.(6PD-NB) Ms. Tmnma Moore, City of Austin, TX Wn~te Program Manager, TNRCC Region 11 - Austin, TX (Me-H.1!)
06/28/2002 ERI 09: 45 [TXlRX NO 60321 Id.I 003

It. '. "I (
STATE OF TEXAS TRA VIS COUNTY
1111"1 "111111" 11111 "I" 11"1 "III "111111" 111111I1111II~:v p;~m 1 m2374m
INDUSTRIAL SOLID WASTE CERTIFICATION OF RE:MEDIA TION
KNOW ALL:MEN BY THESE PRESENTS THAT:
Pursuant to the Rules of the Texas Natural Resource Conservation Commission (TNRCC) pertaining to Industrial Solid Waste Management, this document is hereby filed in the Deed f J Records of Travis County, Texas in compliance with the recordation requirements of said rules: ~'l
I
The Department of the Air Force has performed a remediation of the land described herein. A copy of the Notice of Registration (No. 66002), including a description of the facility, is attached hereto and is made part of this filing. A list of the known waste constituents, including known concentrations in soil, which have been left in place is attached hereto and is made part of this filing. Further information concerning this matter may be found by an ·examination of company records or in the Notice of Registration (No. 66002) files, which are available for inspection upon request at the central office of the TNRCC in Austin, Texas.
The TNRCC derives its authority to review the remediation of this tract of land from the Texas Solid Waste Disposal Act, §361.002, Texas Health and Safety Code, Chapter 361, which enables the TNRCC to promulgate closure and remediation standards to safeguard the health, welfare and physical property of the people of the State and tp protect the~nvironment -by controlling the management of solid waste. In addition, pursuant to the Texas Water Code, §5.012 and §5.013, Texas Water Code, Annotated, Chapter 5, the TNRCC is given primary -responsib~lityfor implementing the laws of the State of Texas t:elating to water and shall adopt any rules necessary to carry out its powers and duties under the Texas Water Code.. In accordance with this authority, the TNRCC requires certain persons to provide certification arid/or recordati~n·in the real property records to notify the public of the conditions of the land and/or the occurrence of remediation. This deed certification is not a representation or warranty by the ~_CC of the suitability of this land for any purpose, nor does it constitute any guarantee by the TNRCC that the remediation standards specified in this certification have been met by the Depart~ent of the Air Force.
, "
IT
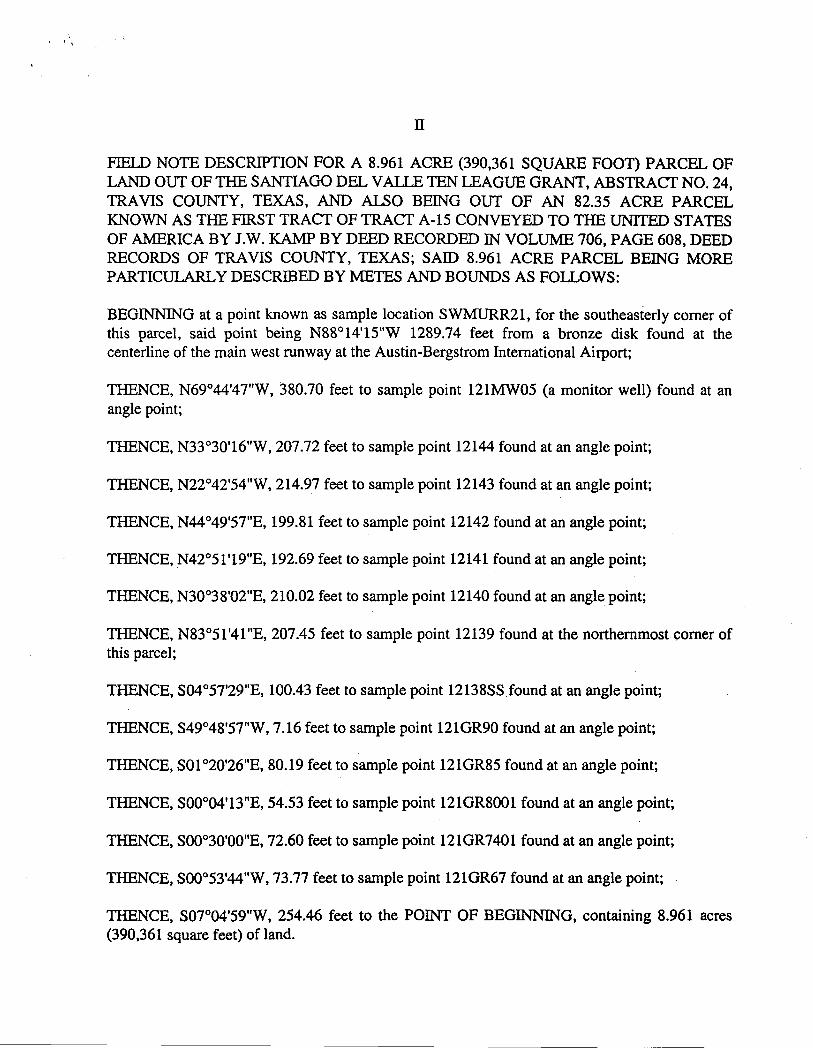
FIELD NOTE DESCRIPTION FOR A 8.961 ACRE (390,361 SQUARE FOOT) PARCEL OF LAND OUT OF THE SANTIAGO DEL VALLE TEN LEAGUE GRANT, ABSTRACT NO. 24, TRAVIS COUNTY, TEXAS, AND ALSO BEING OUT OF AN 82.35 ACRE PARCEL KNOWN AS THE FIRST TRACT OF TRACT A-15 CONVEYED TO THE UNITED STATES OF AMERICA BY J.W. KAMP BY DEED RECORDED IN VOLUME 706, PAGE 608, DEED RECORDS OF TRAVIS COUNTY, TEXAS; SAID 8.961 ACRE PARCEL BEING MORE PARTICULARLY DESCRIBED BY METES AND BOUNDS AS FOLLOWS:
BEGINNING at a point known as sample location SWMURR21, for the southeasterly comer of this parcel, said point being N88°14'15"W 1289.74 feet from a bronze disk found at the centerline of the main west runway at the Austin-Bergstrom International Airport;
THENCE, N69°44'47"W, 380.70 feet to sample point 121MW05 (a monitor well) found at an angle point;
THENCE, N33°30'16"W, 207.72 feet to sample point 12144 found at an angle point;
THENCE, N22°42'54"W, 214.97 feet to sample point 12143 found at an angle point;
THENCE, N44°49'57"E, 199.81 feet to sample point 12142 found at an angle point;
THENCE, N42°51'19"E, 192.69 feet to sample point 12141 found at an angle point;
THENCE, N30038'02"E, 210.02 feet to sample point 12140 found at an angle point;
THENCE, N83°51'41"E, 207.45 feet to sample point 12139 found at the northernmost comer of this parcel;
THENCE, S04°57'29"E, 100.43 feet to sample point 12138SS.found at an angle point;
THENCE, S49°48'57"W, 7.16 feet to sample point 121GR90 found at an angle point;
THENCE, SOl°20'26"E, 80.19 feet to sample point 121GR85 found at an angle point;
THENCE, SOoo04'13"E, 54.53 feet to sample point 121GR8001 found at an angle point;
THENCE, SOoo30'00"E, 72.60 feet to sample point 121GR7401 found at an angle point;
THENCE, SOoo53'44"W, 73.77 feet to sample point 121GR67 found at an angle point;
THENCE, S07°04'59"W, 254.46 feet to the POINT OF BEGINNING, containing 8.961 acres (390,361 square feet) of land.

Lead deposited hereon has been remediated to meet non-residential (i.e., industrial/commercial soil criteria), in accordance with a pl~n designed to meet the TNRCC's requirements in 31 Texas Administrative Code §335.555), which mandates that the remedy be designed to eliminate substantial present and future risk such that no post-closure care or engineering or institutional control measures are required to protect human health and the environment. Future land use is considered suitable for non-residential (i.e., industrial/commercial) purposes in accordance with risk reduction standards applicable at the time of this filing. Future land use is intended to be non-residential.
In accordance with the requirements for. Standard 2 cleanups where the remedy is based upon non-residential soil criteria, the current owner has undertaken actions as necessary to protect human health or the environment in accordance with the rules of the TNRCC.

ill
The owner of the site is Department of the Air Force, and its address is Air Force Base Conversion Agency (AFBCA), 3711 Fighter Drive, Suite 200, Austin, Texas 78719-2557, where more specific information may be obtained from the Installation Management Officer.
EXECU1ED this the / dtI, day of ~ 200.1
Department of the Air Force
~ Regional Site Manager
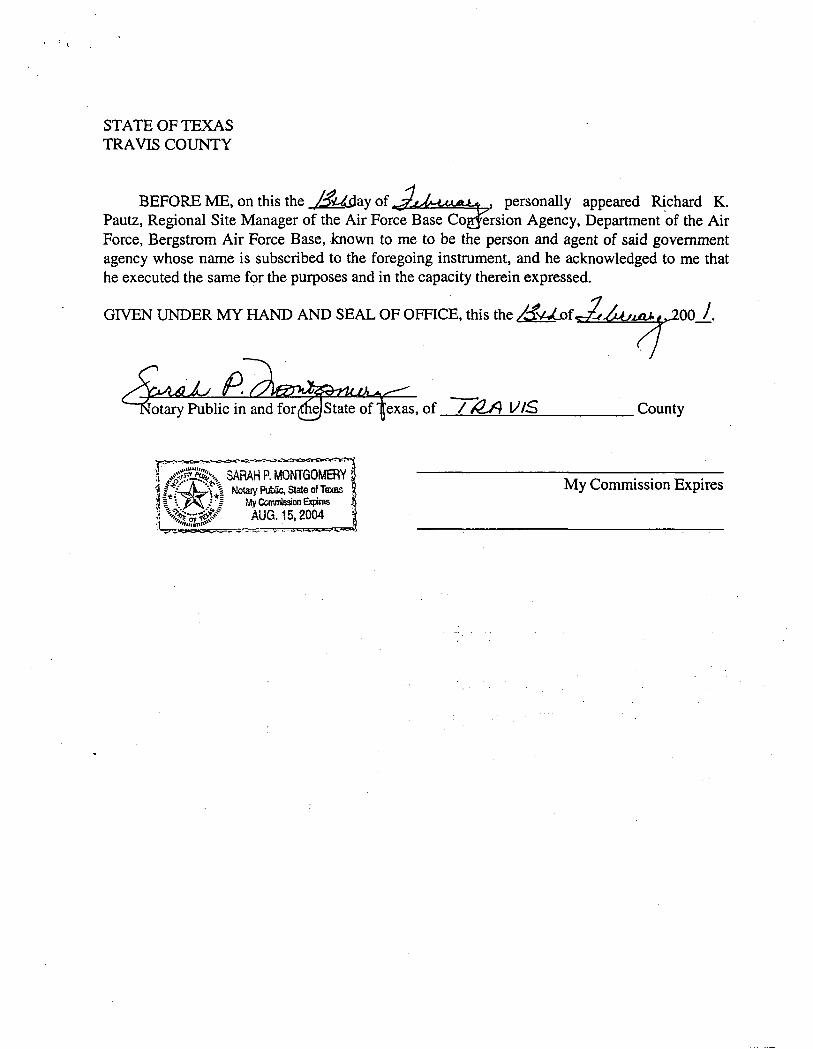
STATE OF TEXAS TRAVIS COUNTY
BEFORE ME, on this the ~ay of personally appeared R~chard K. Pautz, Regional Site Manager of the Air Force Base Co ersion Agency, Department of the Air Force, Bergstrom Air Force Base, .known to me to be the person and agent of said government agency whose name is subscribed to the foregoing instrument, and he acknowledged to me that he executed the same for the purposes and in the capacity therein expressed.
GIVEN UNDER MY HAND AND SEAL OF OFFICE, this the l:!.'hLof ~ool.
_~=..!.-:~=--_____ County
My Commission Expires

MACIAS & ASSOCIATES, Inc. LAND SURVEYORS
EXHIBIT ''B'' RRS2 Boundary SWMU-121
FIELD NOTES
PARCELC
FIELD NOTE DESCRIPTION FOR A 8.961 ACRE (390,361 SQUARE FOOT) PARCEL OF LAND OUT OF THE SANTIAGO DEL VALLE TEN. LEAGUE GRANT, ABSTRACT NO. 24, TRAVIS COUNTY, TEXAS, AND ALSO BEING OUT OF AN 82.35 ACRE PARCEL KNOWN AS THE FIRST TRACT OF TRACT A-15 CONVEYED TO THE UNITED STATES OF AMERICA BY J.W. KAMP BY DEED RECORDED IN VOLUME 706, PAGE 608, DEED RECORDS OF TRAVIS COUNTY, TEXAS; SAID 8.961 ACRE PARCEL BEING MORE PARTICULARLY DESCRIBED BY METES AND BOUNDS AS FOLLOWS:
BEG1NNING at a pomt known as sample location SWMURR21, for the southeasterly comer of this parcel, said point being N88°14'15"W 1289.74 feet from a bronze disk found at the centerline of the main west runway at the Austin-Bergstrom International Airport;
THENCE, N69°44'47"W, 380.70 feet to sample point 121MW05 (a monitor well) found at an angle point;
THENCE, N33°30'16"W, 207.72 feet to sample point 12144 found at an angle point;
THENCE, N22°42'54"W, 214.97 feet to sample point 12143 found at an angle point;
THENCE, N44°49'57''E, 199.81 feet to sample point 12142 found at an angle point; ,
THENCE, N42°51 , 19''E, 192.69 feet to sample point 12141 found alan angle point;
THENCE, N30038'02''E, 210.02 feet to sample point 12140 found at an angle point;
THENCE, N83 °51' 41 "E, 207.45 feet to sample point 12139 found at the northernmost comer of this parcel;
THENCE, S04°57'29''E, 100.43 feet to sample point 12138SS found at an angle point;
THENCE, S49°48'57"W, 7.16 feet to sample point 121GR90 found at an angle point;
5410 South 1st Street· Austin, Texas 78745· (512) 442-7875· Fax (512) 442-7876. e-mail: [email protected]

SWMU 122 Closure Report Bergstrom AFB
7.0 ATTAINMENT OF CLOSURE CRITERIA
September 22,1998
SWMU 122, Fonner Skeet and Trap Range, is considered to meet the requirements for closure
under RRS 2, as specified in TAC 335.555. No further removal or remedial action is considered
necessary. The area to be closed under RRS2 is shown on Figure 3. A document to fulfill the
requirements for Post-Closure Care and Deed Certification (TAC 335.560) is included as
AppendixG.
SWMU 122 will become part of the new commercial airport for Austin following closure
activities at the base. Land within the boundaries of the new airport has been rezoned as "A V",
Aviation Services District, by city ordinance.. It is presumed that operations at the airport will
fall under Standard Industrial Classification number 4512 (Air Transportation, Scheduled), and
therefore the property is defmed as non-residential, in accordance with TAC 335.552.
The applicable clean-up level for soil contamination at SWMU 122 are the MSCs for RRS2
calculated according to TAC 335.558. The applicable MSC for exposure to near-surface soil
(within 2 feet of the ground surface) under non-residential land use is the Soil/Air ingestion
Standard for Industrial use (SAI-Ind). The SAI-Ind is the maximum concentration of a
contaminant in soil considering the soil ingestion and the inhalation pathway (due to cross media
contamination of air). The calculated SAI-Ind values are equivalent to_the example published
under TAC 335.568, Appendix II, 1,000 mglkg for lead.
The MSC for subsurface soil under non-residential land use is the GWP-Ind. This value is the
concentration of a contaminant in soil that is assumed to be protective of groundwater
considering cross-media contamination from soil. The GWP-Ind is either 100 times the USEPA
Maximum Contaminant Level (MCL) for drinking water (USEPA, 1996), or the concentration in
soil that does not produce leachate in excess of the MCL when using SPLP. The MCL for lead is
0.015 mgIL. Using a best-fit to the SPLP data (omitting sample 122109B), the total
concentration for groundwater protection was determined to be 200 mglkg.
The areas of soil exceeding the total concentration threshold of 200 mg/kg were excavated and
disposed ~ an - off-site landfill. Therefore, soil does not exceed the applicable MSCs.
1125810139.E37 7-1

~ .. Robert J. Huston, Chairman
R. B. "Ralph" Marquez, Commissioner
lohn M. Baker, Commissioner leffrey A. Saitas, Executive Director
TEXAS NATURAL RESOURCE CONSERVATION COMMISSION Prot?cting Texas by Reducing and Preventing Pollution
August 22, 2000
Mr. Rafael E. Vazquez Regional BRAC Environmental Coordinator AFBCNROL Bergstrom AFB 3711 Fighter Drive Austin, TX. 78719-2557
RE: Bergstrom Air Force Base TNRCC Solid Waste Registration No. 66002 EPA rD. No. TX0572124188 Review of Closure Report for SWMU 122 Former Skeet and Trap Range Approval - Risk Reduction Standard No.2
Dear Mr. Vazquez
The Texas Natural Resource Conservation Commission (TNRCC) has completed our review ofthe Closure Report for SWMU 122 Former Skeet and Trap Range (Closure Report) dated September 1998 and received by the TNRCC on October 29, 1998. In addition, the TNRCC also reviewed conunents received from EPA Region 6 dated January 29, 1999, as well as, the technical evaluation conducted by the Texas Engineering Experiment Station's Corrective 'Action Technical Support Program (a.k.a., Texas Center for Applied Technology, TCAT) for the above referenced document and dated June 12,2000. ·TCAT conducted the review as part of an interagency agreement between TNRCC and Texas Engineering Experiment Station (TEES). The TNRCC concurs with TCAT's technical evaluation. According to the Closure Report, closure activities have been completed in accordance with the TNRCC Risk Reduction Standard (RRS) No.2, pursuant to Title 30 Texas Administrative Code (TAC) Chapter 335 Subchapters A and S.
SWMU 122 is identified in the Closure Report as two separate ranges. One range was a combined skeet and trap range and the other was a skeet only range. The Closure Report for SWMU 122 contains documentation indicating that the closure activities have attained RRS No.2 such that no post-closure care or institutional control measures are required. Based upon the information contained in the Closure Report and other information available to staff, it appears that the closure/remediation ofSWMU 122 has attained RRS No.2.
As specified in §335.560, the Air Force Base Conversion Agency (AFBCA) must submit proof of deed certification to the TNRCC within ninety (90) days from the date ofthis letter for SWMU 122.
P.O. Box 13087 • Austin, Texas 78711-3087 • 5121239-1000 • Internet address: www.tnrcc.state.tx.us

· .
Mr. Rafael E. Vazquez Page 2 August 22, 2000
Upon acceptance ofthe proof of deed certification, the TNRCC will transmit a final letter releasing AFBCA from post-closure care responsibilities associated with SWMU 122.
Please be aware that it is the continuing obligation of persons associated with a site to assure that municipal hazardous waste and industrial solid waste are managed in a manner which does not cause the discharge or imminent threat of discharge of waste into or· adjacent to waters in the state, a nuisance, or the endangerment of the public health and welfare as required by 30 TAC §335.4. If the actual closure fails to comply with these requirements, the burden remains upon AFBCA to take any necessary and authorized action to correct such conditions. A TNRCC field inspector may review your Closure Report and conduct a closure inspection of the site. .
Questions concerning this letter should be directed to me at (512) 239-2360. When responding by mail, please submit an original and one copy of all correspondence and reports to the Corrective Action Section at Mail Code MC-127 with an additional copy submitted to the TNRCC Region 11 Office in Austin. The TNRCC Solid Waste Registration Number and Unit Name should be referenced in all submittals.
Sincerely,
MJ-A.lJ~ Mark A. Weegar, Project Manager Team II, Corrective Action Section Remediation Division Texas Natural Resource Conservation Commission
MW/mw
cc: Ms. Laura Stankosky, U.S. EPA Region VI, Dallas, TX.(6PD-NB) Ms. Tamara Moore, City of Austin Mr. Barry Kalda, TNRCC Region 11 - Austin (MC-Rl1)
FILED AND RECORDED OFFICIAL PUBLIC RECORDS
a..(,$~~-t.Z"':., 02-15-2001 10:03 AM 2001023742
RYCZEKD $61.00 DANA DEBEAUVOIR ,COUNTY CLERK
TRAVIS COUNTY, TEXAS
RECORDERS MEMORANDUM-At the time of recordation this instrument was found to be inadequate lor the best photographic reproduction, because of illegibility, carbon or photocopy. discolored paper, etc. All blockouts. additions and changes were present at the time the instrument was tiled and recorded.

ATTACHMENT 5 - 2
PARCELB THE FORMER ALLEGED SOL VENT DISPOSAL AREA

STA TE OF TEXAS TRAVIS COUNTY
111I111111111II111I111111111I11I11111111111111111I11111111I1j~v p;:0203SS 76
INDUSTRIAL SOLID WASTE CERTIFICA nON OF REMEDIA nON
(SWMU 216, ALLEGED SOLVENT DISPOSAL AREA ON FORMER BERGSTROM AIR FORCE BASE, TEXAS)
KNOW ALL MEN BY THESE PRESENTS THAT:
Pursuant to the Rules of the Texas. Natural Resource Conservation Commission (TNRCC) pertaining to Industrial Solid Waste Management, this document is hereby filed in the Deed Records of Travis County, Texas in compliance with the recordation requirements of said rules:
The Department of the Air Force, through the Air Force Base Conversion Agency (AFBCA) has performed a remediation of the tract of land (hereinafter, the "Property") described in Exhibit "A" attached hereto and made part of this filing that is located on former Bergstrom Air Force Base, Texas. A list of known waste constituents, including known concentrations (i.e., soil and ground water) which have been left in place, is attached hereto as Exhibit "B" and is made part of this filing. Further information concerning this matter may be found by an examination of Air Force records or in the Notice of Registration (No. 66002) files, which are available for inspection upon request at the central office of the TNRCC in Austin, Texas.
The TNRCC derives its authority to review the remediation of this tract of land from the Texas Solid Waste Disposal Act, §361.002, Texas Health and Safety Code, Chapter 361, which enables the TNRCC to promulgate closure and remediation standards to safeguard the health, welfare and physical property of the people of the State and to protect the environment by controlling the management of solid waste. In addition, pursuant to the Texas Water Code, §5.012 and §5.013, Texas Water Code, Annotated, Chapter 5, the TNRCC is given primary responsibility for implementing the laws of the State of Texas relating to water and shall adopt any rules necessary to carry out its powers and duties"'under the Texas Water Code. In accordance with this authority, the TNRCC requires certain persons to provide certification and/or recordation in the real property records to notify the public of the conditions of the land. This deed certification is not a representation or warranty by the TNRCC of the suitability of this land for any purpose, nor does it constitute any guarantee by the TNRCC that the remediation standards specified in this certification have been met by the Department of the Air Force.

II
The Property: Being a 2.220-acre tract (96,691 square foot) parcel ofland out of the Santiago del Valle Ten League Grant, Abstract No. 24, Travis County, Texas, and being out of a 340.26-acre parcel known as Second Tract out of Tract No. A-3 described in a deed to the United States of America recorded in Volume 709, Page 390, Deed Records of Travis County, said 2.220 acre parcel is more particularly described by metes and bounds in Exhibit "A" attached hereto.
Contaminants deposited thereon have been remediated to meet nonresidential (i.e., industrial/commercial) soil criteria, in accordance with a plan designed to meet the requirements of 30 Texas Administrative Code §335.561 (Risk Reduction Standard Number 3), which mandates that the remedy be designed to eliminate or reduce, to the maximum extent practicable, substantial present and future risk associated with soil contact. The remediation plan does not require engineering control measures for the soil. The ground water under the Property has been found to contain certain identified chemicals as indicated by reports on file with the TNRCC which meet non-residential (i.e., industrial/commercial) ground water criteria in accordance with requirements of 30 Texas Administrative Code §335.555 (Risk Reduction Standard 2), which mandates that the ground water remedy be designed to eliminate substantial present and future risk such that no-post closure care or engineering or institutional control measures are required to protect human health of the environment. Future use of the property is considered appropriate for nonresidential use in accordance with risk reduction standards applicable at the time of this filing. The institutional controls placed on the Property to ensure appropriate future use are described in Exhibit "c" attached hereto and made a part of this filing. The current or future owner must undertake actions as necessary to protect human health and the environment in accordance with the rules ofthe TNRCC.

III
The current owner of the site is the United States of America, Department of the Air Force, Air Force Base Conversion Agency, and its address is 1700 North Moore St, Suite 2300, Arlington, VA 22209-2802. More specific information may be obtained from the AFBCA Base Environmental Coordinator (BEC) whose address is HQ AFCEEIERB, 3207 North Road, Building 532, Brooks AFB,
TX 78235. (i;' EXECUTED this the) j-~y o~ 20qt
UNITED STATES OF AMERICA
By its Secretary of the Air Force
By: ~~~~~~~~<J. ALBERTF. LOWA Director Air Force Base Conversion Agency
COMMONWEALTH OF VIRGINIA
COUNTY OF ARLINGTON
BEFORE ME, on this the j5'rir day of :$..1.bt .. LU:UUr ,personally appeared ALBERT F. LOW AS, JR., Director, Air Force Base Conversion Agency,~own to me to be the person whose name is subscribed to the foregoing instrument, and he acknowledged to me that he executed the same on behalf of the Secretary of the Air Force for the purposes and in the capacity therein expressed.
GIVEN UNDER MY HAND AND SEAL OF OFFICE, this ~ of ~ 2002.
Notary Public in and for the State of Virginia
'. My Commission Expires June 30, 200S •
My Commission Expires ;'':,!'" ;,t:.

Exhibit A
Recorders Memorandum-At the time of recordation this instrument was found to be inadequate for the best reproduction, because of illegibility, carbon or . photocopy, discolored paper, etc. All blockouts, additions and changes were present at the time the instrument was filed and recorded.
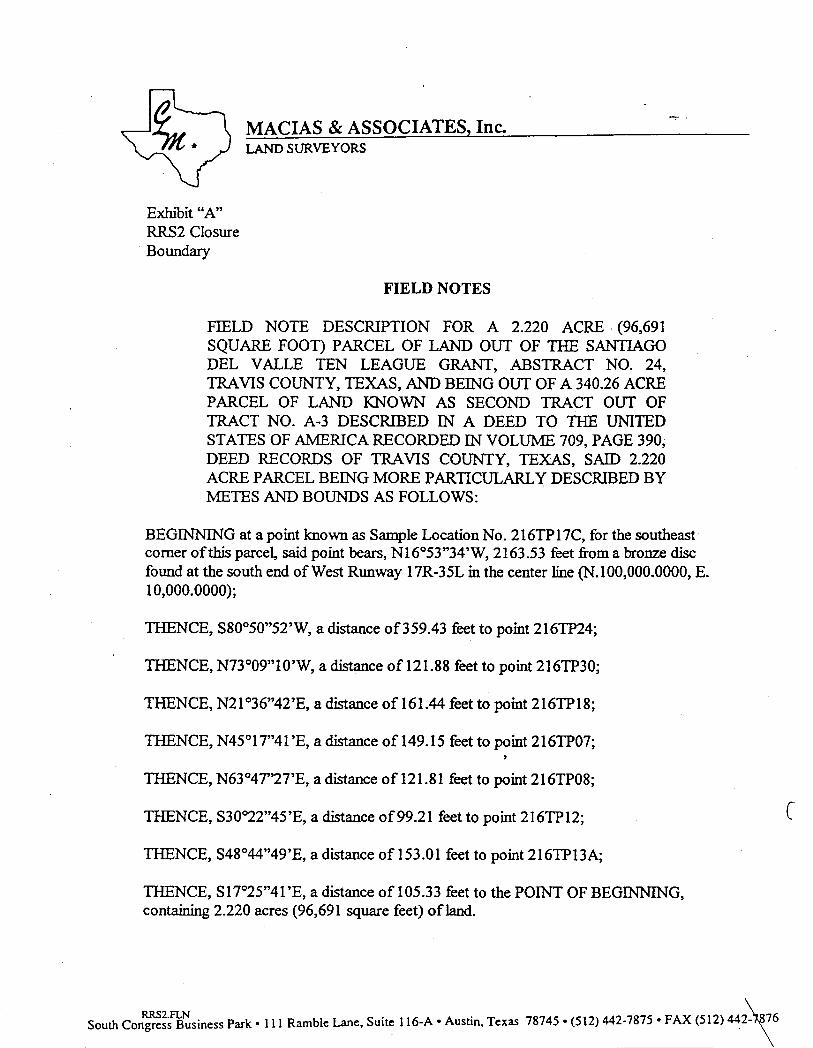
Exlnbit "A" RRS2 Closure Boundary
MACIAS & ASSOCIATES, Inc. LAND SURVEYORS
FIELD NOTES
FIELD NOTE DESCRIPTION FOR A 2.220 ACRE· (96,691 SQUARE FOOT) PARCEL OF LAND OUT OF THE SANTIAGO DEL VALLE TEN LEAGUE GRANT, ABSTRACT NO. 24, TRAVIS COUNTY, TEXAS, AND BEING OUT OF A 340.26 ACRE PARCEL OF LAND KNOWN AS SECOND TRACT OUT OF TRACT NO. A-3 DESCRIBED IN A DEED TO THE UNITED STATES OF AMERICA RECORDED IN VOLUME 709, PAGE 390, DEED RECORDS OF TRAVIS COUNTY, TEXAS, SAID 2.220 ACRE PARCEL BEING MORE P ARTICULARL X DESCRIBED BY METES AND BOUNDS AS FOLLOWS:
BEGINNING at a point known as Sample Location No. 216TP17C, for the southeast comer of this parcel, said point bears, N16°53"34'W, 2163.53 feet from a bronze disc found at the south end of West Runway 17R-35L in the center line (N. 1 00,000.0000, E. 10,000.0000);
THENCE, S80050"52'W, a distance of359.43 feet to point 216TP24;
THENCE, N73°09"10'W, a distance of 121.88 feet to point 216TP30;
THENCE, N21 °36"42'E, a distance of 161.44 feet to point 216TP18;
THENCE, N45°17"41 'E, a distance of 149.15 feet to point 216TP07; ,
THENCE, N63°4T'27'E, a distance of 121.81 feet to point 216TP08;
THENCE, S30~2"45'E, a distance of99.21 feet to point 216TP12;
THENCE, S48°44"49'E, a distance of 153.01 feet to point 216TP13A;
THENCE, SI7°25"41 'E, a distance of 105.33 feet to the POINT OF BEGINNING, containing 2.220 acres (96,691 square feet) of land.
SOUlh Con~X';n'" p"k • 111 Ramble Lane. Suhe 116-A • AU";n. T ox'" 7&745· (512) 442·7&75 • FAX (512) 442~6
c

Page 2 RRS2
STATE OF TEXAS §
COUNTY OF TRAVIS §
I hereby certify that this field note description was prepared from the results of an actual survey made on the ground under my supervision and that it is true and correct to the best of my knowledge.
511)8:lI7 Henry A. D eau . DATE Registered Professional Land Surveyor No.1707
Client: Job No.: File No.:
RRS2.FLN
REFERENCES Bearing Basis: BACS Coordinate System
LAW Environmental, Inc. 139-01-95 139D1 B02.dwg

SCALE:
:r: I-0::: o Z
," = '00'
SKETCH TO ACCOMPANY FIELD NOTES
.~
.~" . " ,,':>
LAW PROJECT 10300-5-3215
~~ ~OJ' l~"\ ~ "- . 1·0
216TP18 L \J .,\L .'
'\
>-1 <{
~ Z J 0:: l~11) DE ~ ;l'.Q .. A C'f . 111A t~ IJS Iv S; AN .'"" A) ~ ( AUEGED SOLVENT DlSPOS4L SITE )
>.' .~.: RRS2 1
tf -' \) 10 ....
~ 216TP30 121• 88 ,
1-1703.0 .to.\ 9'10W ~'\ 216TP24
CLOSURE BOUNDARY 96 • 69 1 S. F.
2. 220 AC.
~59.4~·
580· 50' 52·~ 7\
P.O.B. ~
TRACT NO. A-J (J-I-0.26 AC.) SECOND TRACT
V, 709, P.J90, T.C.D.R. \ ~\ 0'.
er;.\
r U) w ~I
A U S TIN - B ERG S T R 0 U I N T ERN A T ION A L AIRPORT BAS E )
J\ j\
( FOR MER B ERG S T ROM
Henry A. Ouf u Registered Professional Land Surveyor No. 1707
A I R FOR C E
NOTE:
BEARINGS ARE BASED ON THE BACS COORDINATE SYSTEM.
t-J\ -a. \
~\l \ N.l00000.0000 \ E.l0000.0000 BRONZE DISC FOUND AT THE SOUTH END OF WEST RUNWAY 17R-3SL
DRAWING: 139D1B02.DWG SCAlE: 1".100' DATE: 12-31-97 Joe I 139-01-95 DRAWN BY: C. LOPEZ
MACIAS & ASSOCIATES, INC. LAND SURVEYORS
****** SOU'lli CON~ BUSINESS PARK
111 RNoIBL£ lNIE SU I TE 116A
AUSllN. TEXAS 7874~ (512)442-71175

OU27/9S lS: H ~512 j89 .748 AfBDA BERcSTROX IZl 002/00l
ORDINANCE NO. 940210-~
AN ORDINANCE ESfABUSl-flNG INITIAL PEPJ..iANENT ZONING AND CHANGING THE' ZONING MAP ACCOMPANYING CHAPTER 13·2 OF mE AUSTIN 01Y CODE OF 1992 AS FOLLOWS: APPROXIMATELY 3.216 ACRES OF LAND, FROM "UNZ· UNZONlill Dlsnucrm wAY" AVIATION SERVICES DISTRICT, LOCALLY KNOWN AS 2500 FAST STATE HIGHVlAY 71, SAID PROPERlY BEING MORE PARTICUURlY IDENTIFIED BY MAP IN THE ~IBIT A" ATIACHED TO TIllS ORDINANCE, BEING GENERAllY KNOWN AS THE NEW AUSTIN AIRPORT AT BERGSTROM, IN THE qrf OF AUSTIN, TRAVIS COUNTY, TIXAS; WAIVING mE REQU1REM.ENTS OF SECTION "2:"'2~3 OF THE AUSTIN em CODE OF 1992; AND PROVIDING AN EFFECTIVE DATE.
BE IT ORDAINED BY THE 01Y COUNOL OF ruE 01Y OF AUSTIN: - -
PART 1. That Chapter 13·2 of thl: Austin City Codl: of 1992 is aml:I\ded to ·l1:mge the bast: zoning cllinict on th e Propcny w hlch is within the: incorporated ciry limits of th '';; City of Austin, navis Couruy, Tens, included in zonin~ cas~ no. Cl4-93-016S, locally kno', 'll. as 2500 East State Highway 71, and being· more pamcula.rly identified in the: map attach! j as -Exhibit Ato this ord.inance, from ·UNZ" Unzoned district to -AV Aviation Servic('" d..i.mia bdng gmc:.ra1Jy known as the: New Austin Airport at Btrzstrom., in the Ciry of Austir , Travis County, Tcx.u.
- . -PART 2. That it is ordered thatthe Zoning Map established by Sec.. 13·2·22 of the: Austin City Code of 1992 and In.Jde a part thereof shall be: changed to Rcord th~ a..mt:ndm~t mect~d by t.hll ordinanc e. .
PARI 3. That: the requlll:IIlc:nts impos-c:d by Se:ction 2·2·3 of the Austin Ciry \:ode of 1992, as aIDQ1ded, regarding the: prcsc::nr<ltion and adoption. of ordinmces are haeby waived by the: affinnarive vote of :zt least five mmlbc:.n of th~ Ciry Council
PART 1. U:at: this ordinance shall b~come eif<:crlve upon tlu: e.xpirarion of tt"~ days following ~ date of Its fi.n.al passage. as proYld~d by the Chaner of the Ciry of Austill
PASSED AND APPROVED:
__________ Fut~b~ro~a~rrL_ ___ JuQ~ ____ ~,1~4
1 OF tb 9-<
ME.IlJ
§
§1( =r~ ~N' .1, Bruce' ,,<Xi
Mar ,r
~ Amsr:~( .~ iUlles J _ Aldridge:
Cit), Cla1c.
I
I

J

I HW020 • •• TEXAS NATURAL RESOURCE CONSERVATION COMMISSION --Notice of Registration
Industrial and Hazardous Waste
Page: Date:
1 01/07/00
This registration does not constitute authorization of any waste management activities or facilites listed below. The registration reflects hazardous and/or industrial waste generation and management activities for which the registrant has provided notification. Requirements for solid waste management are provided by Texas Administrative code section 335 of the rules of the Texas Natural Resource Conservation Commission (TNRCC). Changes or additions to waste management methods referred to In this notice require written notification to the TNRCC .
. j. Solid Waste Registration Number: 66002 EPA Id: TX0572124188
The Solid Waste Registration Number provides access to computerized and filed information pertaining to your operation. Please refer to that number In any correspondence.
Company Name SHe Name
Site Locat ion Contact
AfBCA/Bergstrom Air force Base Bergstrom Air Force Base State Highway 71, Austin, TX Watlay, Stephen
Mailing Address: 3711 Fighter Drive Suite 200 Austin, TX 78719-2557
Registration Status: Inactive Registration Type: Generator
Generator Type:
Primary SIC Code: Handler Status:
Operator Information Name:
Phone: AddreSs:
HW Permit #: 50244 Transporter
Region: 11 Initial Registration Date County: 227 Travis Last Amendment Date
Last Date NOR Computer update Title: Environmental Engineer Phone: 512-386-5425
Site Street Address: State Highway 71
Austin, TX 78743
01/24/1983 04/02/1999 01/05/2000
Reporting Method: STEERS
Hazardous Waste Generation Status: Large Quantity Generator
~wner Information Name:
Phone: Address:
AS of 04/02/1999 - the next unassigned sequence number for WASTES Is 0002 and the next unassigned sequence number for UNITS Is 015.
Section 335, Chapter 31 of the Texas Admlnstratlve Code specifies the notification, record keeping, manifesting and reporting requirements for hazardous and Industrial solid wastes.
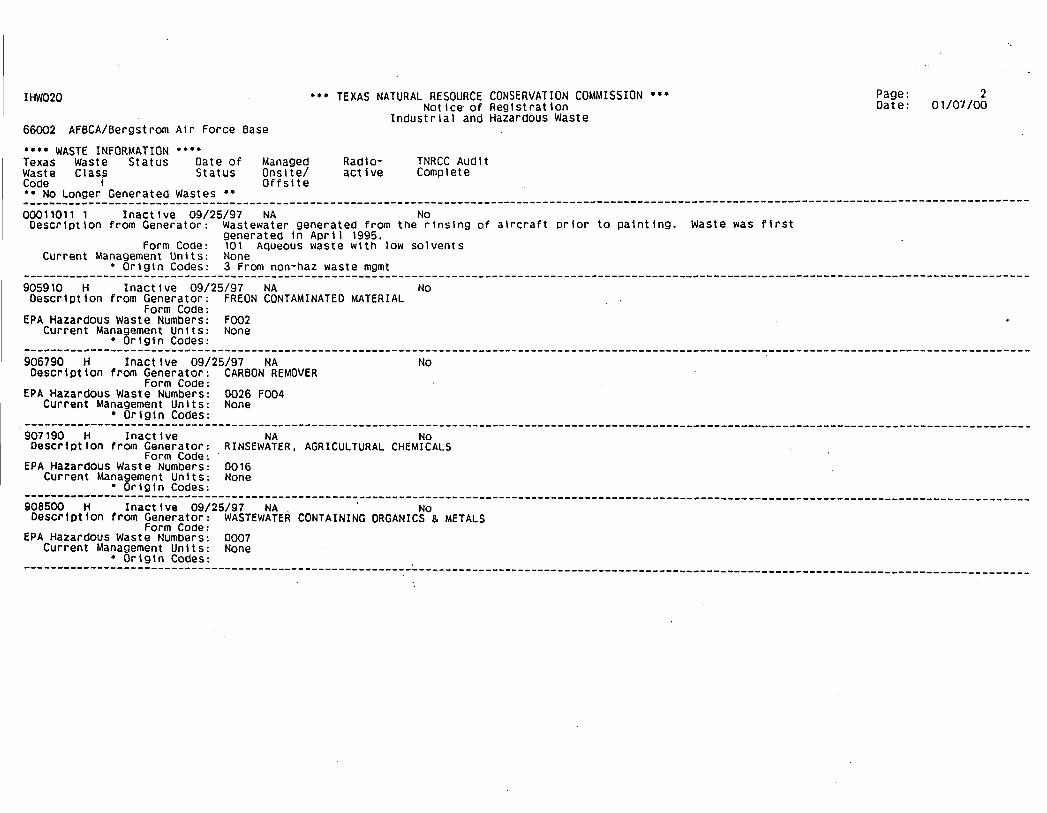
I HW020
66002 AFBCA/Bergstrom Air Force Base
•••• WASTE INFORMATION •••• Texas Waste Status Date of Waste Class Status Code t •• No Longer Generated Wastes ••
Managed OnsHe/ Offsl te
••• TEXAS NATURAL RESOURCE CONSERVATION COMMISSION ••• NotIce of RegIstratIon
RadIoactIve
IndustrIal and Hazardous Waste
TNRCC AudIt Complete
Page: Date:
2 01/07/00
------------------------------------------------------.----------------------------------------------------------------------------------------------00011011 1 InactIve 09/25/97 NA No
DescrIptIon from Generator: Wastewater generated from the rInsIng of aIrcraft prIor to painting. Waste was first generated In AprIl 1995.
Form Code 101 Aqueous waste with low solvents Current Management UnIts None
• OrigIn Codes 3 From non-haz waste mgmt ------------------------------------------------------.-.-----------.-------------------------------------------------------------~------------------905910 H Inactive 09/25/97 NA No DescrIption from Generator: FREON CONTAMINATED MATERIAL
Form Code: EPA Hazardous Waste Numbers: F002
Current Management Units: None • OrIgin Codes:
906790 H InactIve 09/25/97 NA DescrIption from Generator: CARBON REMOVER
Form Code: EPA Hazardous Waste Numbers: 0026 F004
Current Management UnIts: None • OrIgIn Codes:
No
------------------------------------------------------------------------.-.--------------------------------------------------------------------------907190 H InactIve NA No DescrIptIon from Generator: RINSEWATER, AGRICULTURAL CHEMICALS
Form Code: EPA Hazardous Waste Numbers: 0016
Current Management UnIts: None • OrIgin Codes:
-----------------------------------------------------------------------------------------------------------------------------------------------------908500 H InactIve 09/25/97 NA. No DescrIptIon from Generator: WASTEWATER CONTAINING ORGANICS & METALS
Form Code: EPA Hazardous Waste Numbers: 0007
Current Management UnIts: None • OrIgIn Codes:
--------------------------------------------------------~--------------------------------------------------------------------------------------------

I HW020
66002 Texas Waste Code
AFBCA/Bergstrom Air Force Base Waste Status Date of Managed Class Status Onslte/
Offslte
••• TEXAS NATURAL RESOURCE CONSERVATION COMMISSION ••• Notice of Registration
Radioactive
IndustrIal and Hazardous Waste
TNRCC Audl t Complete
Page: Date:
3 01/07/00
•• No Longer 'Generated Wastes •• ------------r-----------------------------------------------------------------------------------------------------------------------------------------909850 H Inactive 09/25/97 NA No
DescrIptIon from Generator; PESTICIDE WASTE/PESTICIDE CONTAMINATED WASHWATER Form Code:
EPA Hazardous Waste Numbers: 0016 Current Management Units: None
• Origin Codes: --------------------------------------------------------------------------------------------------------------------------------------------------~--. 910120 H Inactive 09/25/97 NA
DescriptIon from Generator; PAINT SOLVENTS Form Code:
EPA Hazardous Waste Numbers: F005 Current Management Units: None
• Origin Codes:
No
----------------------------------------------------------------------------------------------------------------------------------------------------_. 912130 H Inactive 09/25/97 NA No
Description from Generator: OIL, SYNTHETIC MOTOR Form Code:
EPA Hazardous Waste Numbers: F002 Current Management Units: None
• Origin Codes: -----------------------------------------------------------------------------------------------------------------------------------------------------912510 H InactIve 09/25/97 NA No
Descr"'ptlon from Generator: NAPHTHALENE SOLUTION Form Code:
EPA Hazardous Waste Numbers: 0001 0039 F002 Current Management Units; None
• OrIgin Codes; -----------------------------------------------------------------------------------------------------------------------------------------------------912520 H Inactive 09/25/97 NA No
Description from Generator: MERCURY, LIQUID Form Code:
EPA Hazardous Waste Numbers: 0009 Current Management Units: None
• OrigIn Codes: -----------------------------------------------------------------------------------------------------------------------------------------------------913000 H Inactive 09/25/97 NA No
Description from Generator: MINERAL SPIRITS WASH Form Code:
EPA Hazardous Waste Numbers: F002 Current Management Units: None
• Origin Codes: -----------------------------------------------------------------------------------------------------------------------------------------------------

IHW020
66002 AFBCA/Bergstrom Texas Waste Status Waste Class Code ,
Air Force Base Date of Managed Status Onslte/
Offslte •• No Longer Generated Wastes ••
••• TEXAS NATURAL RESOURCE CONSERVATION COMMISSION ••• Notice of Registration
Radioactive
Industrial and Hazardous Waste
TNRCC Audit Complete
Page: Date:
4 01/07/00
----------------------------------------------------------------------------------------------------------------------------------------------------914740 H Inactive 09/25/97 NA No
Description from Generator: IGNITABLE WASTES Form Code:
EPA Hazardous Waste Numbers: 0001 Current Management Units: None
• Origin Codes: ----------------------------------------------------------------------------------------------------------------------------------------------------916510 H Inactive 09/25/97 NA
Description from Generator: PAINT STRIPPER Form Code:
EPA Hazardous Waste Numbers: 0001 0007 U080 Current Management UnIts: None
• OrIgin Codes:
916940 H Inactive 09/25/97 NA Description from Generator: PAINT AND SOLVENTS
Form Code: EPA Hazardous Waste Numbers: FOOS
Current Management Units: None • Origin Codes:
No
NO
942630 H Inactive 09/25/97 NA 'No Description from Generator: PAINT SLUDGE. PAINT STRIPPING. CAUSTIC
Form Code: EPA Hazardous Waste Numbers: F002
Current Management Units: None • OrigIn Codes: --------------------------------------------------------------------------------------------------------------------------------------------------_.
952000 H InactIve 09/25/97 NA No Description from Generator: PAINT SLUDGE. PAINT STRIPPING
Form Code: EPA Hazardous Waste Numbers: F002
Current Management Un1ts: None • Origin COdes:
----------------------------------------------------------------------------------------------------------------------------------------------------972640 H Inactive 09/25/97 NA No Description from Generator: FILTER. SPRAY BOOTH MEDIA
Form Code: EPA Hazardous Waste Numbers: 0006 0007
Current Management UnIts: None • Origin Codes:
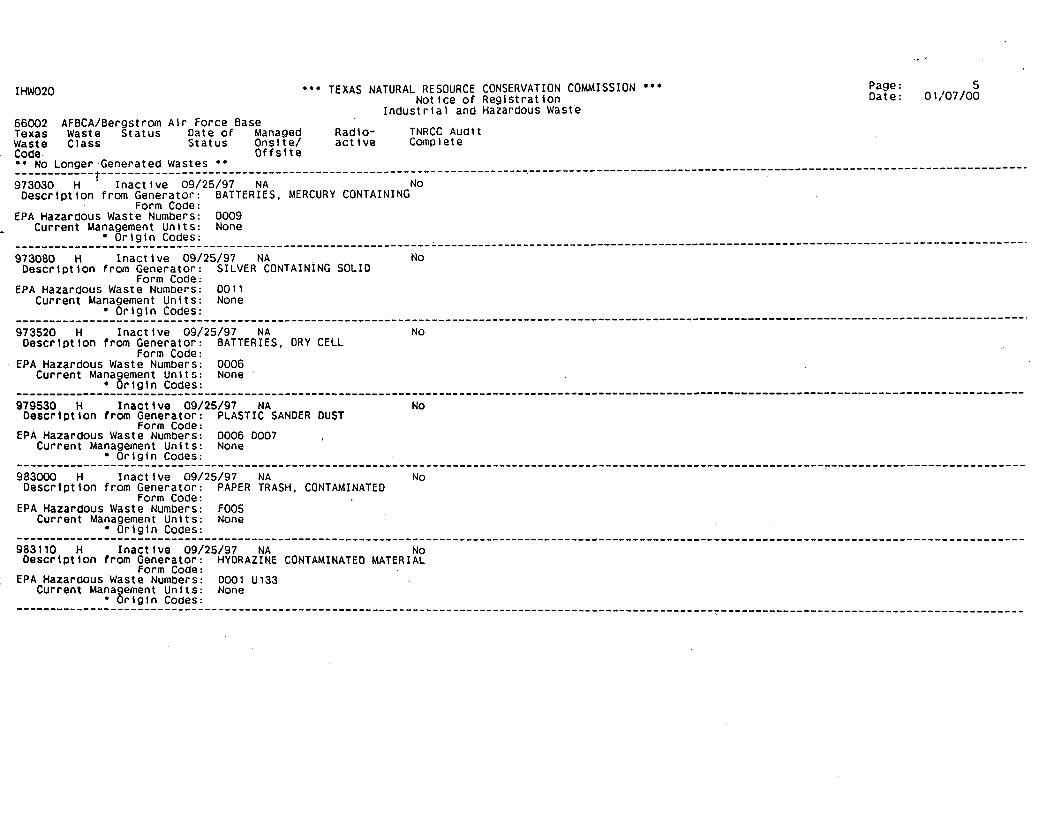
I HW020
66002 Texas Waste Code·
AFBCA/Bergstrom Air Force Base Waste Status Date of Managed Class Status Onslte/
Offslte
••• TEXAS NATURAL RESOURCE CONSERVATION COMMISSION ••• Notice of Registration
Radioactive
Industrial and Hazardous Waste
TNRCC Audl t Complete
Page: Date:
S 01/07/00
•• No Longer Generated Wastes •• ------------r---------------------------------------------------------------~-------------------------------------------------------------------------973030 H Inactive 09/25/97 NA No Description from Generator: BATTERIES, MERCURY CONTAINING
Form Code: EPA HazardOus Waste Numbers: 0009
Current Management Units: None • Origin Codes: ----------------------------------------------------------------------------------------------------------------------------------------------------_.
973080 H Inactive 09/25/97 NA No Description from Generator: SILVER CONTAINING SOLID
Form Code: EPA Hazardous Waste Numbers: 0011
Current Management Units: None • Origin Codes: ----------------------------------------------------------------------------------------------------------------------------------------------------_.
973520 H Inactive 09/25/97 NA Description from Generator: BATTERIES, DRY CELL
Form Code: EPA Hazardous Waste Numbers: 0006
Current Management Units: None • Origin Codes:
979530 H Inactive 09/25/97 NA Description from Generator: PLASTIC SANDER OUST
Form Code: EPA Hazardous Waste Numbers: 0006 0007
Current Management Units: None • Origin Codes:
No
NO
983000 H Inactive 09/25/97 NA No Description from Generator: PAPER TRASH, CONTAMINATED
Form Code: EPA HazardOUS Waste Numbers: FOOS
Current Management Units: None • Origin COdes: -----------------------------------------------------------------------------------------------------------------------------------------------------
983110 H Inactive 09/25/97 NA No DescrIptIon from Generator: HYDRAZINE CONTAMINATED MATERIAL
Form Code: EPA Hazardous Waste Numbers: 0001 U133
Current Management Units: None • Origin Codes:
--------------------------------------------------------------------------------------------------------~--------------------------------------------

I HW020
66002 Texas Waste Code
AFBCA/Bergstrom Air Force Base Waste Status Date of Managed Class Status Onslte/
Offs1te •• No Longer" Generated Wastes ••
••• TEXAS NATURAL RESOURCE CONSERVATION COMMISSION Notice of Registration
Rad1oactive
Industrial and Hazardous Waste
TNRCC Audl t Complete
••• Page: Date:
6 01/07/00
-----------~-----------------------------------------------------------------------------------------------------------------------------------------983480 H Inactive 09/25/97 NA No
Descr1pt1on from Generator: RAGS, CONTAMINATED " Form Code:
EPA Hazardous Waste Numbers: 0007 0035 F002 F003 FOOS Curr~nt Management Units: None
• Origin Codes:
990001 H Inactive 09/25/97 NA No Description from Generator: 0001 CHARACTERISTIC OF IGNITABILITY
Form Code: EPA Hazardous Waste Numbers: 0001
Current Management Units: None • Origin Codes:
990002 H" Inact 1 ve 09/25/97 NA No Descr1ptlon from Generator: 0002 CHARACTERISTIC OF CORROSIVITY
Form Code: EPA Hazardous Waste Numbers: 0002
Current Management Units: None • Orlg1n Codes:
990003 H Inact1ve 09/25/97 NA No " DescrIptIon from Generator: 0003 CHARACTERISTIC Of REACTIVITY
Form Code: EPA Hazardous Waste Numbers: 0003
Current Management Units: None • Origin Codes:
-----------------------------------------------------------------------------------------------------------------------------------------------------991003 H Inactive 09/25/97 NA No
DescrlPt10n from Generator: SPENT NON-HALOGENATED SOLVENTS: XYLENE ,ACETONE ,ETHYL ACETATE, Form Code:
EPA Hazardous Waste Numbers: f003 Current Management Units: None
• Origin Codes: -----------------------------------------------------------------------------------------------------------------------------------------------------991005 H Inactive 09/25/97 NA No
DescrlPt10n from Generator: THE FOLLOWING SPENT NON-HALOGENATED SOLVENTS: TOLUENE, Form Code: "
EPA Hazardous Waste Numbers: F005 Current Management Un1ts: None
• Origin Codes: -----------------------------------------------------------------------------------------------------------------------------------------------------

IHW020 ••• TEXAS NATURAL RESOURCE CONSERVATION COMMISSION ••• Notice of Registration
Industrial and Hazardous Waste 66002 AFBCA/Bergstrom Air Force Base Texas Waste Status Date of Managed Radlo- TNRCC Audit Waste Class Status Qnstte/ active Complete Code Offslte
Page: Date;
7 01/07/00
•• No LongerLGenerated Wastes •• ------------ ---------------------------------------------------------------------------------------------------------------------------------------_. 993154 H Inactive 09/25/97 NA No
Description from Generator: U154 METHANOL OR METHYL ALCOHOL Form Code:
EPA Hazardous Waste Numbers: U154 Current Management Units: None
• Origin Codes: ----------------------------------------------------------------------------------------------------------------------------------------------------_. 993159 H Inact\ve 09/25/97 NA No
Description from Generator: U159 2-BUTANONE OR METHYL ETHYL KETONE Form Code:
EPA Hazardous Waste Numbers; U159 Current Management Units: None
• Origin Codes:
993161 H Inactive 09/25/97 NA No Description from Generator: U161 METHYL ISOBUTYL KETONE OR 4-METHYL-2-PENTANONE
Form Code: EPA Hazardous Waste Numbers: U161
Current Management Units: None • Origin Codes:
--------------------------------------------------------------------------------------------------------~--------------------------------------------993220 H Inactive 09/25/97 NA No
Description from Generator: U220 BENZENE ,METHYL OR TOLUENE Form Code:
EPA Hazardous Waste Numbers: U220 Current Management UnIts: None
• Origin Codes:
993239 H Inactive 09/25/97 NA No DescrIption from Generator: U239 BENZENE, DIMETHYL OR XYLENE
Form Code; EPA Hazardous Waste Numbers: U239
Current Management UnIts: None • Origin Codes:
-----------------------------------------------------------------------------------------------------------------------------------------------------• The first value Is consIdered the primary value (e.g. prjmary orlgtn code). As ot 04/02/1999, the next unassIgned seQuence number for WASTES Is 0002.
Refer to 40 CFR Part 261 for Descriptions of EPA Hazardous Waste Numbers.

I HW020
66002 AFBCA/Bergstrom Air force Base
•••• UNITS AT Unit Unit Number Type'
i
THIS SITE MANAGING WASTE •••• Unit Status
••• TEXAS NATURAL RESOURCE CONSERVATION COMMISSION Notice of Registration
•••
Industrial and Hazardous Waste
Date of Status
Classes of Waste Managed In Unit Onslte / Offslte
Unit Perml t Number
Unit N Regulatory on Status Permit
Page: Date;
8 01/07/00
Deed Recording Needed/Date
•• 'Active' & 'Closure Pending' Units •• ------------------------------------------------------------------------------------------------------------------------------------------------------006 Tank (Surface) Active 01/01/87 / NA NA NA RCRA Pmt Exempt - Accumulation Time NA / Description from Company: For emergency use
Capacity: 3000.0000 Capacity Unit Of Measure: G System Types: 141 Storage Biennial System Regulatory Status Regulatory status unknown Wastes Currently Managed In Unit
Wastes Previously Managed In Unit 908500 ----------------------------------------------------------------------------------------------------------------------------------------------------_. 007 Mlsc Store Container Active 05/01/88 Description from Company: Storage of waste munitions System Types: 141 Storage Biennial System Regulatory Status: Regulatory status unknown Wastes Currently Managed In Unit:
Wastes Previously Managed In Unit: 990003
/ NA NA NA RCRA Pmt Exempt - Accumulation Time NA /
-----------------------------------------------------------------------------------------------------------------------------------------------------009 ContaIn Store Area Active DescrIptIon from Company: Building 1801 System Types: 141 Storage Biennial System Regulatory Status: Regulatory status ,unknown Wastes Currently Managed In Unit:
Wastes PrevIously Managed In Unit: 991003
/ NA
010 Contain Store Area Active 02/15/93 / NA Description from Company: FaCIlity No. 4580 (12 CSS/CYSR), Containers System Types: Wastes Currently Managed In Unit:
Wastes Previously Managed In Unit: 916940 972640
AS of 04/02/1999, the next unassigned sequence number for UNITS Is 015 .
•• 'Inactive', 'Closed' & 'Post Closure Care' Units ••
NA NA NA /
NA NA NA /
-----------------------------------------------------------------------------------------------------------------------------------------------------001 Tank (SUb-surface) Inactive 09/25/97 / NA NA NA NA /' Description from Company: Located at Building 1608. This tank Is no longer used by Bergstrom AFB.
Capacity: 6000.0000 Capacity Unit of Measure: G System Types: 141 Storage Biennial System Regulatory Status: Regulatory status unknown Wastes Previously Managed In Unit: 00011011 908500 -----------------------------------------------------------------------------------------------------------------------------------------------------002 Contain Store Area Inactive 09/25/97 / NA NA NA NA /

I HW020
66002 unit Number
AFBCA/Bergstrom Air Force Base Unit Unit Type Status
••• TEXAS NATURAL RESOURCE CONSERVATION COMMISSION Notice of Registration
•••
Industrial and Hazardous Waste
Date of Status
Classes of Waste Managed In Unit Onslte / Offslte
Unit Perml t Number
Unit # on Perml t
Regulatory Status
•• 'Inactive!, 'Closed' & 'Post Closure Care' Units •• Description from Company: Located at Building 1608. This unit has been relocated to BUilding 1639. System Types: 141 Storage BIennial System Regulatory Status: Regulatory status unknown Wastes Previously Managed In Unit: 910120 916510 916940 942630 972640 983000 983480
Page: Date:
9 01/07/00
Deed Recording Needed/Date
------------------------------------------------------------------------------------------------------------------------------------------------------003 Tank (Sub-surface) Closed 08/31/95 / NA NA IN3 RCRA Interim Status Unit Description from Company: Entymology pit; open evaporation pit managed as tank located at Building 722
Capac It y: 561.0000 Capacity Unit" of Measure: G System Types: 141 Storage Biennial System Regulatory Status: Wastes PreViously Managed In Unit:
004 Tank (Sub-surface)
Regulatory status unknown 907190
Closed 02/21/96 Description from Company: Tank B-7 located at Facility 590
/ NA
Capacity: 25000.0000 Capacity Unit of Measure: System Types: 141 Storage Biennial System Regulatory Status: Regulatory status unknown
GO NA INl RCRA Interim Status Unit
NA /
NA /
~~~!~~_~~~~!~~~~~_~~~~~:~_!~_~~!:: __ ~~~:~~ __________________________________________________________________ -----------------------------------______ 0
005 Contain Store Area Closed 08/24/95 / NA NA IN2 RCRA Interim Status Unit NA / Capacity: 20000.0000 Capacity Unit of Measure: G
System Types: 141 Storage Biennial System Regulatory Status: Regulatory status unknown Wastes Previously Managed In Unit: 910120 914740 916510 916940 942630 972640 973030 983000 983480 990001 990002
991003 991005
008 Contain Store Area Inactive 01/19/95 / NA NA NA NA / Description from Company: Building 722 System Types: 141 Storage Biennial System Regulatory Status: Regulatory status unknown Wastes PreViously Managed In Unit: 909850 --------------------------------------------------~-------------------------------------------------------------------------------------------------_. 011 Tank (Surface) Inactive 02/16/93 / NA NA NA NA / DescrIption from Company: FacIlity No. 4980
Capacity: 6000.0000 CapacIty UnIt of Measure: G System Types: 141 Storage BiennIal System Regulatory Status: Regulatory status unknown Wastes PrevIously Managed In Unit: 914740 -----------------------------------------------------------------------------------------------------------------------------------------------------012 Contain Store Area InactIve 01/19/95 / NA NA NA NA / Description from Company: FacIlity No. 1612, Containers System Types: Wastes Previously Managed In Unit: 912510 912520 916510 916940 973030 973080 973520 990001 990002 990003 993154
993159 993161 993220 993239

IHW020
66002 AFBCA!Bergstrom Air Force Base Unit Unit Unit Number Type Status
••• TEXAS NATURAL RESOURCE CONSERVATION COMMISSION ••• Notice of Registration
Industrial and Hazardous Waste
Date of Classes of Waste Status Managed In Unit
Onsite / Offslte
Unit Permit Number
Unit # Regulatory on Status Perml t
•• 'Inactive', 'Closed' & 'Post Closure Care' Units ••
Page: Date:
10 01/07/00
Deed Recording Needed/Date
------------r--------------------------------------------------------------------------------------------7-------------------------------------------013 Contain Store Area Inactive 09/25/97 ! NA NA NA' NA ! Description from Company: Facility No. 1639 (67 RW!MARC), Containers. This Is no longer being used as a
container storage area by Bergstrom AFB. System Types: BiennIal System Regulatory Status: Regulatory status unknown Wastes PrevIously Managed In Unit: 910120 942630 972640 979530 983000 983480 -----------------------------------------------------------------------------------------------------------------------------------------------------014 Contain Store Area Inactive 01/19/95 / NA NA NA NA / DescriptIon from Company: Facility No. 4937 - Containers System Types: Wastes Previously Managed In Unit: 912510 912520 916510 916940 973030 973080 973520 990001 990002 990003 993154
993159 993161 993220 993239
EXBIBITB
Recorders Memorandum-At the time of recordation this instrument was found to be inadequate for the best reproduction, because of illegibility, carbon or photocopy, discolored paper, etc. All blockouts, additions and changes were present at the time the instrument was filed and recorded.
§ N
or; N
a: w OJ
2 u o
N o o
MONITORING WELL 21602MW (ABANDONED)
EXCAVATION 1 (10 FT. x 10 FT. x 9.5 FT.)
CONl WW (5'-7')
N
o 4 8
SOIL BORING 21609 (FORMER LOCATION)
EXCAVATION 2 (10 FT. x 10 FT. x 3 FT.)
CON2NW (0-2')
,._r_- CON2BT (3'-4'}
12 16
CON2WW (0-2') CON2EW (0-2') .
~+-- CHAR2 (0-2') . CON1NW (5'-7') L--_-< >-_---'
r-+- CON1BT (9'-10') CON2SW (0-2')
CON1EW (5'-7')
'---+-- CHAR1 (5-7')
CONl SW (5'-7')
LEGEND
o PRE -CONFIRMATION SAMPLE
6 PRE -CHARACTERIZATION SAMPLE
S MONITORING WELL 21602MW
1/8"=1'-0" --- - () SOIL BORING 21609 -- -SCALE FEET
LAGUNA SAMPLE LOCATION MAP ~ SWMU 216 aJ
~ CONSTRUCTION BERGSTROM AFB, TEXAS o
a COMPANY NONE 10/25/00 FIGURE 4-2
[~------------------------------------~------~----~-------------
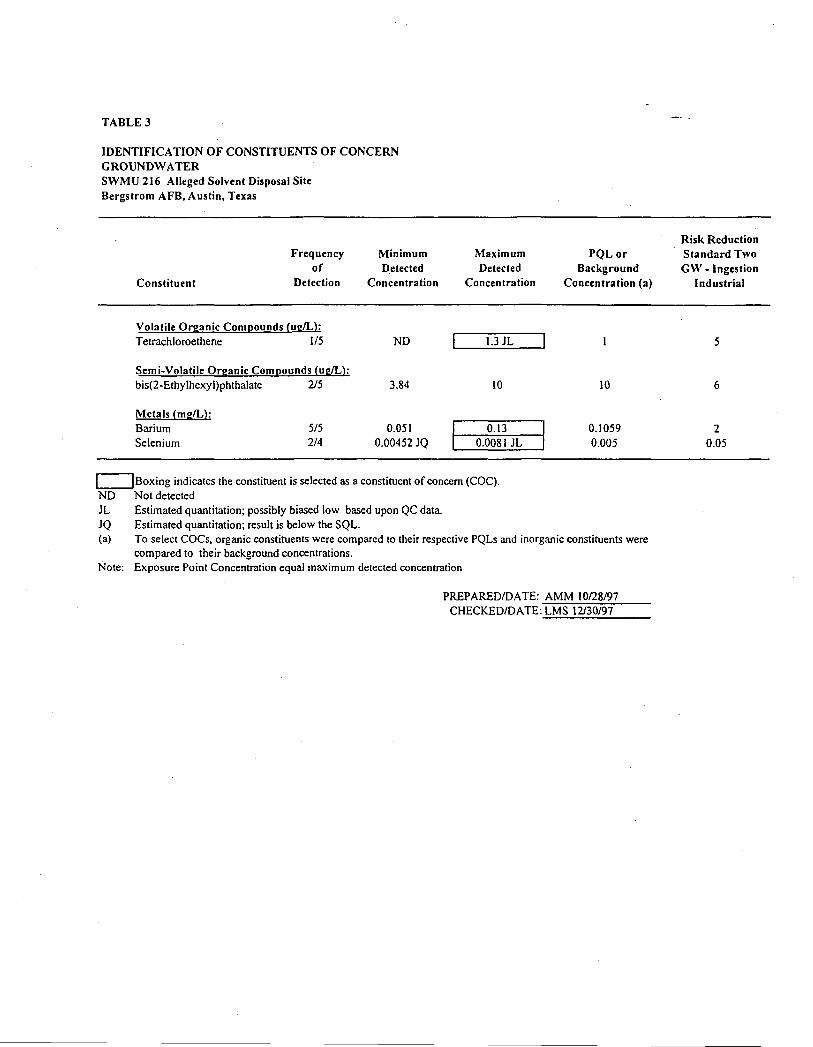
TABLE 3
IDENTIFICATION OF CONSTITUENTS OF CONCERN GROUNDWATER SWMU 216 Alleged Solvent Disposal Site Bergstrom AFB, Austin, Texas
Frequency of
Constituent Detection
Volatile Organic Com[!ounds {ug/L}: Tetrachloroethene 1/5
Semi-Volatile Organic Com[!ounds {ug/L}: bis(2-Ethylhexyl)phthalate 2/5
Metals {mg/L}: Barium 5/5 Selenium 2/4
Minimum Detected
Concentration
ND
3.84
0.051 0.00452 JQ
Maximum PQLor Detected Background
Concentration Concentration (a)
1.3 JL
10 10
0.\3 0.1059 0.0081 JL 0.005
c==JBoxing indicates the constituent is selected as a constituent of concern (COC). ND Not detected JL Estimated quantitation; possibly biased low based upon QC data JQ Estimated quantitation; result is below the SQL. (a) To select COCs, organic constituents were compared to their respective PQLs and inorganic constituents were
compared to their background concentrations. Note: Exposure Point Concentration equal maximum detected concentration
PREPARED/DATE: AMM 10128/97 CHECKEDIDATE: LMS 12/30/97
Risk Reduction Standard Two GW - Ingestion
Industrial
5
6
2 0.05

TABLE 4.1
SUMMARY OF SOIL CHARACfERIZATION SAMPLE ANALYTICAL RESULTS SWMU 216 - ALLEGED SOLVENT DISPOSAL SITE
BERGSTROM AFB, AUSTIN, TEXAS
Sample Id. TCLP S216-CHARI S216-CHAR2 Date Sampled Max. Cone. 02/10/00 02/10/00 Sample Depth 5-7 ft bgs 0-2 ft bgs
Analytes: Reactivity. Cyanide (mg/Kg) NA <10 <10 Reactivity, Sulfide (mg/Kg) NA <10 <40 Corrosivity (pH) NA 7.5 8.7 Ignitability NA Neg Neg
TPH (mg/Kg) NA <50 <50
TCLP Metals Arsenic 5.0 <0.084 <0.083 Barium 100.0 0.152 0.677 Cadmium 1.0 0.0325 <0.011 Chromium 5.0 <0.027 <0.027 Lead 5.0 0.587 <0.037 Selenium 1.0 <0.069 <0.069 Silver 5.0 <0.014 <0.014 Mercwy 0.2 <0.00005 <0.00005
TCLP Semi-Volatile Organics 1,4-Dichlorobenzene 7.5 <0.1 <0.1 2,4-Dinitrotoluene 0.13 <0.1 <0.1 Hexachlorobenzene 0.13 <0.1 <0.1 Hexachlorobutadiene 0.5 <0.1 <0.1 Hexachloroethane 3.0 <0.1 <0.1 Nitrobenzene 2.0 <0.1 <0.1 Pyridine 5.0 <0.1 <0.1 2-Methylphenol (o-Cresol) 200.0 <0.1 <0.1 3 & 4 Methylphenol (m,p-Cresol) 200.0 <0.1 <0.1 Pentachlorophenol 100.0 <0.5 <0.5 2,4,5-T richlorophenol 400.0 <0.1 <0.1 2,4,6-Trichlorophenol 2.0 <0.1 <0.1
TCLP Volatile Organics Benzene 0.5 <0.050 <0.050 Carbon tetrachloride 0.5 <0.050 <0.050 Chlorobenzene 100.0 <0.050 <0.050 Chloroform 6.0 <0.050 <0.050 I A-Dichlorobenzene 7.5 <0.050 <0.050 1,2-Dichloroethane 0.5 <0.050 <0.050 1,I-Dichloroethene 0.7 <0.050 <0.050 Methyl ethyl ketone 200.0 <1.00 <1.00 Tetrachloroethene 0.7 0.01'6J <0.050 T richloroethene 0.5 <0.050 <0.050 Vinyl chloride 0.2 <0.10 <0.10
Note: All analytical results in mgIL unless otherwise noted. NA - Not Applicable 1 = Estimated value See Figure 4-2 for sample locations
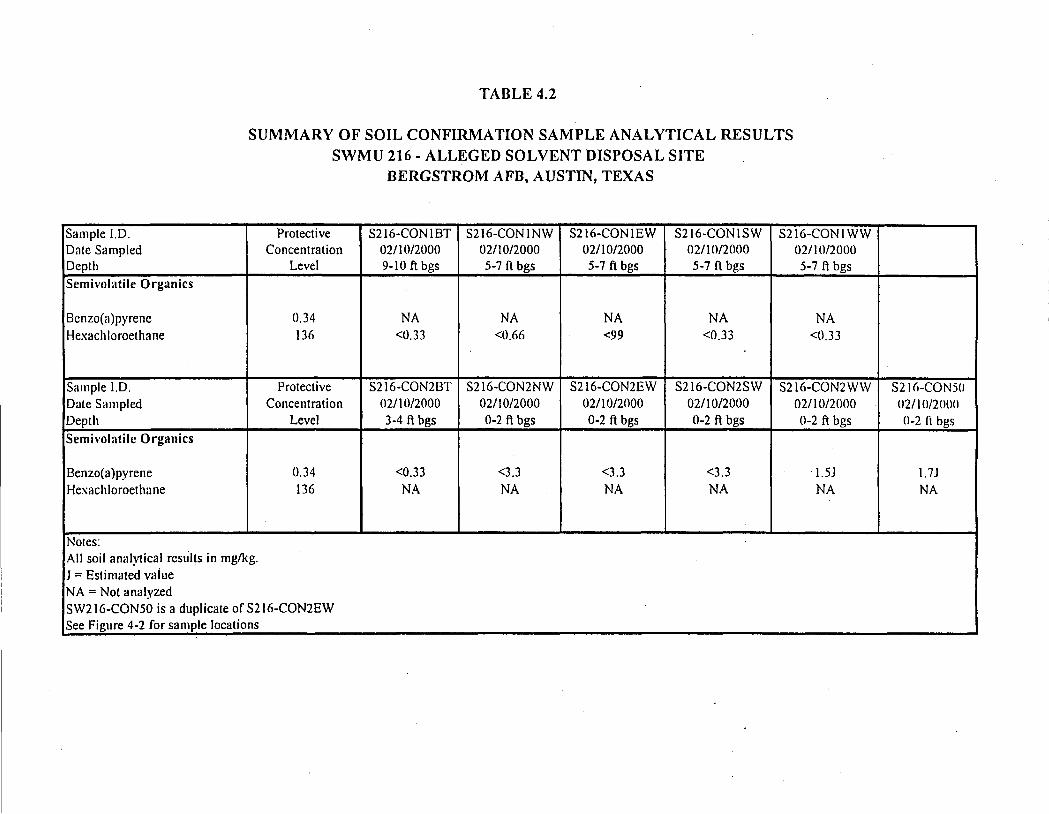
TABLE 4.2
SUMMARY OF SOIL CONFIRMATION SAMPLE ANALYTICAL RESULTS SWMU 216 - ALLEGED SOLVENT DISPOSAL SITE
BERGSTROM AFB, AUSTIN, TEXAS
Sample 1.0. Protective S216-CONIBT S216-CON I NW S216-CONIEW S216-CONISW S216-CON1 WW Date Sampled Concentration 02/1012000 0211012000 0211012000 02/1012000 0211012000 Depth Level 9-10 ft bgs 5-7ftbgs 5-7 ft bgs 5-7ftbgs 5-7ftbgs Semivolatile Organics
Benzo(a)pyrene 0.34 NA NA NA NA NA Hexachloroethane 136 <0.33 <0.66 <99 <0.33 <0.33
Sample 1.0. Protective S216-CON2BT S216-CON2NW S216-CON2EW S216-CON2SW S216-CON2WW Date Sampled Concentration 02/1012000 02/1012000 02/1012000 02110/2000 02/10/2000 Depth Level 3-4 ft bgs 0-2 ft bgs 0-2 ft bgs 0-2 ft bgs 0-2 ft bgs Semivolatile Organics
Benzo(a)pyrene 0.34 <0.33 <3.3 <3.3 <3.3 1.51 Hexachloroethane 136 NA NA NA NA NA
Notes: All soil analytical results in mg/kg. J = Estimated vaiue NA = Not analyzed S W21 (i-CON 50 is a duplicate of S216-CON2EW S(!e Figure 4-2 for sample locations
I
S21 (i-CON SO 02/10/2000 0-2 ft bgs
1.71 NA
I

Exhibit C
Recorders Memorandum-At the time of recordation this instrument was found to be inadequate for the best reproduction, because of illegibility, carbon or photocopy, discolored paper, etc. All blockouts, additions and changes were present at the time the instrument was filed and recorded.
- -- - ---- - -- - -- - -- - -- - --- -- - -- - -- -- - -- - - -- - -- - -- - -- - - - - - ----~- -- -- -- - -- - -- - -__ J
Carpenterk
Text Box
Parcel C

THENCE, SOl ~0'26"E, 80.19 feet to sample point 121GR85 found at an angle point;
THENCE, SOoo04'13''E, 54.53 feet to sample point 121GR8001 found at an angle point;
THENCE, SOo030'00"E, 72.60 feet to sample point 121GR7401 found at an angle point;
THENCE, SOo053'44"W, 73.77 feet to sample point 121GR67 found at an angle point;
THENCE, S02°13'41"E, 72.55 feet to sample point 121GR59 found at an angle point;
THENCE, S17°08'50',£, 44.71 feet to sample point 121GR5104 found at an angle point;
THENCE, S00031 '58"E, 49.36 feet to sample poirit 121GR5103 found at an angle point;
THENCE, S06°09'32"W, 187.38 feet to sample point 12146 found at an angle point;
THENCE, S07°04'59"W, 254.46 feet to the POINT OF BEGINNING, containing 8.961 acres (390,361 square feet) ofland.
STATE OF TEXAS §
COUNTY OF TRAVIS §
I hereby certify that this field note description and sketch were prepared from an actual survey made on the ground under my supervision and represents points set at various periods in October 1996, May 1997 and 1998, July 1997 and June 1998.
MACIAS & ASSOCIATES, INC.
,bWf«--~~
~~}:!:'.J$+ ,,~ •• ·G\ s T c~ ••• I l~~ • (C'c:.~
• .1, .............................. . ~HENRY A. DUFEAU ............... -.............. .
('\A 1707 ,~~':9:. ..,. 0 ·"0 . ''V .•.• ; E: 5 5 \ ~.:"4: D ......... '-lc(,
SU?
DATE Registere~ Professional Land Surveyor No.1707
REFERENCES Bearings are based on the Bergstrom Airport Coordinate System (BACS). Bronze disk found at centerline main West Runway is at N, 100,000.00 and E, 10,000.00.
C:\MSOFFICE\WINWORD\FIEIDNTE\LAW·ABIAdoc:
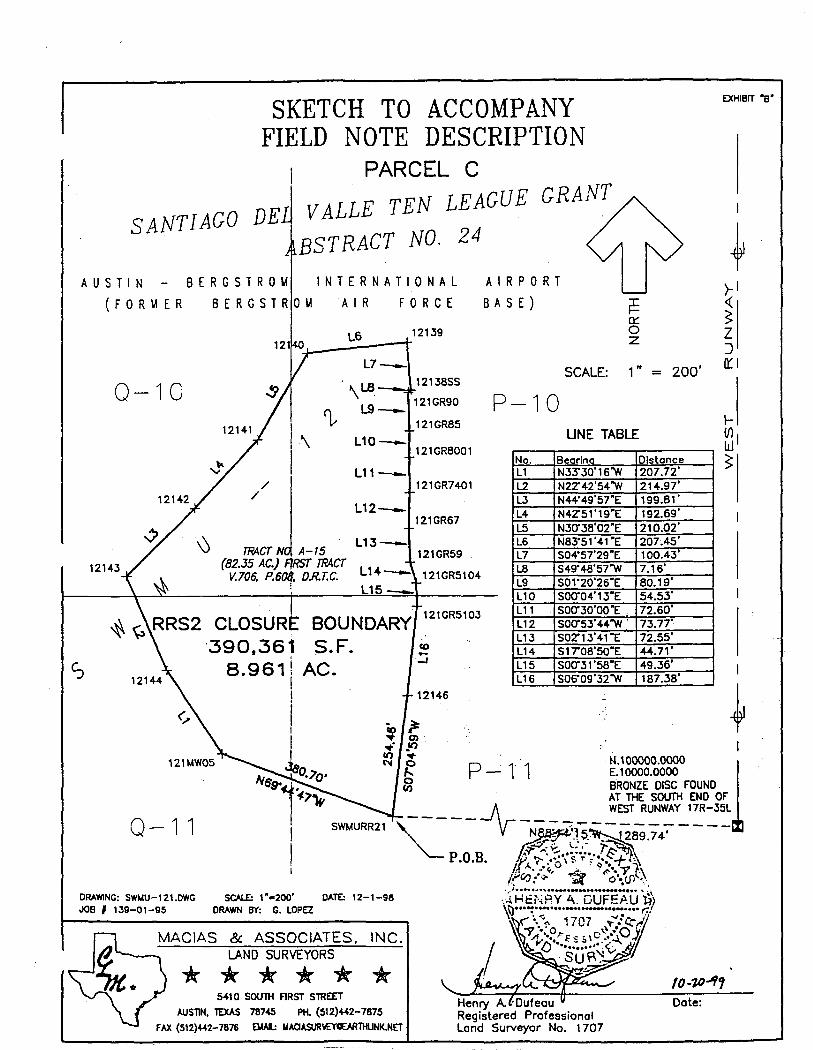
SKETCH TO ACCOMPANY FIELD NOTE DESCRIPTION
PARCEL C VALLE TEN LEAGUE GRANT
BSTRACT NO. 24 SANTIAGO DE
AUSTIN BERGSTROU INTERNATIONAL
(FORI.1ER BERGSTROI.1 AIR FORCE
AIRPORT
BAS E )
L6 12139
FE a::: o z
L7 ___ SCALE: 1" = 200'
Q-10
12143
f)" 1\ I
~~J-'5 (82.35 AC.) F7RSr TRACT V, 706, P.608, D.R.T.e.
!
1213855
\ ~ ___ 121GR90
121GR85
L10---121GR8001
L11---121GR7401
L12---121GR67
L13~ 121GR59 .
L14-- 121GR5104 L15 __
CLOSUR BOUNDARY 121GR5103
'390,361 S.F. ~ 8.961! AC. -J
I I
I I
12146
. ~ ~ (7)
..,.' "Ir)
P-10 UNE TABLE
No. Bearina Distance L1 N3S30'16'W 207.72' L2 N22"42'S4'W 214.97' L3 N44'49'S7"E 199.61' L4 N42"S1'19"E 192.69' L5 N3CT38'02"E 210.02' L6 N83'S1'41"E 207.4S' L7 504'S7'29"E 100.43' L8 549'48'S7'W 7.16' L9 501'20'26"E 80.19' L10 50CT04'l3"E 54.53' L11 50CT30'OO"E, 72.60' L12 50CTS3' 44 'W ~ 73.77' L13 502"13'41"E 72.S5· L14 51708'SO"E 44.71' L15 50CT31'S8"E 49.36' L16 50S09'32'W 187.38'
EXHI8IT "B"
}-I ~ ~ Z J Irl
Q-11
1 N, 0,70' ~ 0"" N.100000.0000
~ BRONZE DISC FOUND AT THE SOUTH END OF' 6s-i'<71t
I 5WMURR21
." " P - 1" 1 E.10000.0000 1 _____ ---'" ___ ~ __ ~EST ~UNWAY_l :-3~
~ -V- N "'1"~ , _ .... : ... ~. ~'289.74
DRAWING: SW!.IU-121.DWG J08 , 139-01-95
I I
SCALE: 1·-200' CATE: 12-1-98 DRAWN BY: G. LOPEZ
MACIAS & ASSOCIATES, INC. LAND SURVEYORS
****** 5410 50UlH ARST StREET
AUSllN, TEXAS 78745 PH. (512)442-7875
FAX (512)4-42-7876 EloIAl.: UAClASIJR'o£YCEAROONK.NET
.~." \... .,. P 0 B .,T ""' ................ S' . ~\ . .. if A '?'- ~·O \ ~. T ~ ~'" + i:.:.., II. ',-'", ~ ~'.'Y 10,\
fi:0: .~ :QIi <>'". <I, ..... '", ... , ......... , .. _ .................. ",'
·AHci·,jAY 4.. GUFEft.U~) \\) ••• -: ........................... r:/
. (' ~':-r- 1707 .~ .... '/~11'1;· ..",-,0 "'0" A.', r. IE.:: • \ C •• ' \. ..-IJ
"()" ~" .. ~ ..... ........... . ~ . SUp.~ ~
Date:

IHW020 -_. TEXAS NATURAL RESOURCE CONSERVATION COMMISSION -_. Notice of Registration
Industrial and Hazardous Waste
Page: Date:
1 01/07/00
his registration does not constitute authorization of any waste management activities or facilites listed below. The registration reflects azardous and/or Industrial waste generation and management activities for which the registrant has provided notification. Requirements for olld waste management are provided by Texas Administrative code section 335 of the rules of the Texas Natural Resource Conservation Commission TNRCC). Changes or additions to waste management methods referred to In this notice require written notification to the TNRCC.
olld Waste Registration Number: 66002 EPA Id: TX0572124188
he Solid Waste Registration Number provides access to computerized and filed Information pertaining to your operation. Please refer to that umber In any correspondence.
Company Name Site Name
Ite Locat ion Contact
AFBCA/Bergstrom Air Force Base Bergstrom Air Force Base State Highway 71, Austin, TX Watlay, Stephen
ailing Address: 3711 Fighter Drive Suite 200 Austin, TX 78719-2557
eglstratlon Status Inactive Registration Type Generator
Generator Type
Primary SIC Code: Handler Status:
perator Information Name:
Phone: ddress:
HW Permit #: 50244 Transporter
I
Region: 11 Initial Registration Date County: 227 Travis Last Amendment Date
Last Date NOR Computer update Title: Environmental Engineer Phone: 512-386-5425
Site Street Address: State Highway 71
Austin, TX 78743
01/24/1983 04/02/1999 01/05/2000
Reporting Method: STEERS
Hazardous 'Waste Generation Staius: Large Quantity Generator .;
Owner Information Name:
Phone: Address:
AS of 04/02/1999 - the next unasslgnedSeQUen,ce number for WASTES Is 0002 and the next unassigned sequence number for UNITS Is 015.
Section 335, Chapter 31 of the Texas Admlns~ratlve Code speclfle~'the notification, record keeping, manifesting and reporting requirements for hazar~ous and Industrial solid wastes.
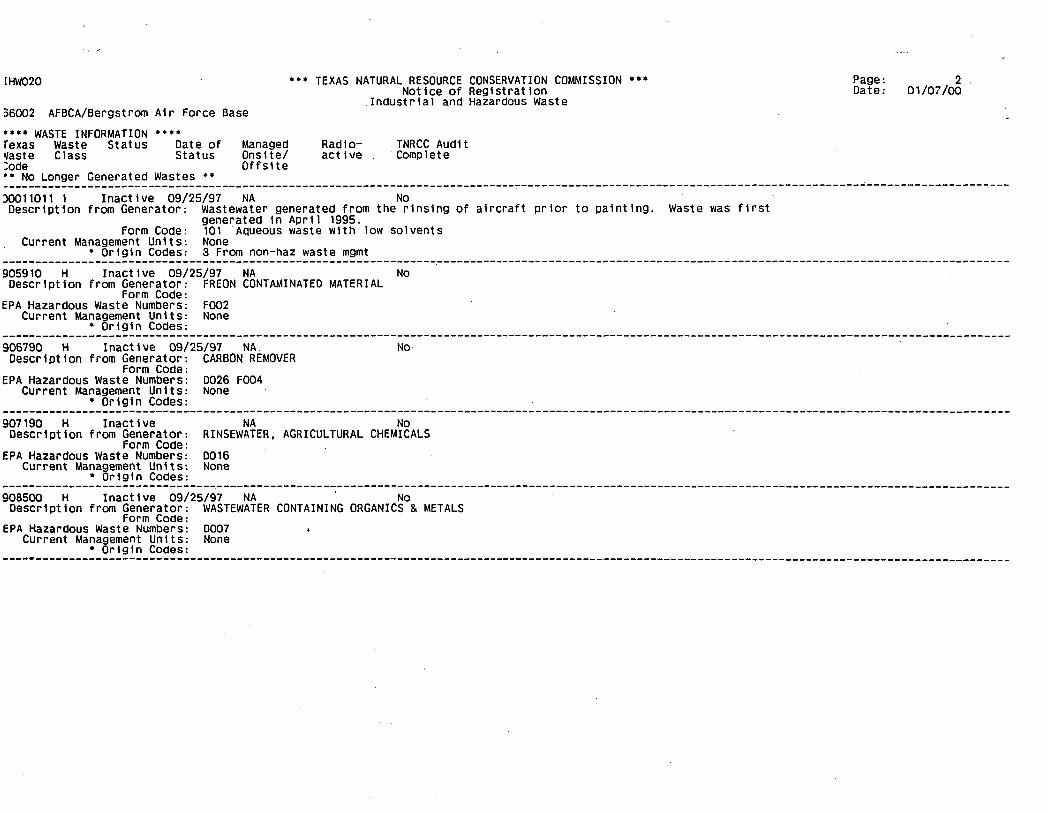
[HW020
36002 AFBCA/Bergstrom Air Force Base
•••• WASTE INFORMATION •••• rexas Waste Status Date of ~aste Class Status :ode •• No Longer Generated Wastes ••
Managed Onslte/ Offslte
••• TEXAS NATURAL RESOURCE CONSERVATION COMMISSION ••• Notice of Registration
Radioactive
Industrial and Hazardous waste
TNRCC Audit Complete
Page: Date:
2 01/07/00
------------------------------------------------------------------------------------------------------------------------------------------------------)0011011 1 Inactive 09/25/97 NA No Description from Generator: Wastewater generated .from the rinsing of aircraft prior to painting. Waste was first
generated In April 1995. Form COde 101 Aqueous waste with low solvents
Current Management Units None • Origin Codes 3 From non-haz waste mgmt
------------------------------------------------------------------------------------------------------------------------------------------------------905910 H Inactive 09/25/97 NA No Description from Generator: FREON CONTAMINATED MATERIAL
Form Code: EPA Hazardous Waste Numbers: F002
Current Management Units: None • Origin Codes:
906790 H Inactive 09/25/97 NA Descr1pt1on from Generator: CARBON REMOVER
Form Code: EPA Hazardous Waste Numbers: 0026 F004
Current Management Units: None • Or1g1n Codes:
NO
907190 H Inact1ve NA No Descr1pt1on from Generator RINSEWATER. AGRICULTURAL CHEMICALS
Form COde EPA Hazardous Waste Numbers 0016
Current Management Units None • Origin Codes
908500 H Inactive 09/25/97 NA No Descr1ptlon from Generator: WASTEWATER CONTAINING ORGANICS & METALS
form Code: EPA Hazardous Waste Numbers: 0007
Current Management Units: None • Origin Codes: ------------------------------------------------------------------------------------------------------------------------------------------------------

iW020
,002 !xas lste )de
AFBCA/Bergstrom Air Force Base waste Status Date of Managed Class Status Onsite/
Off site • No Longer Generated Wastes **
*** TEXAS NATURAL .RESOURCE CONSERVATION COMMISSION Notice of Registration
RadIoactive
Industrial and Hazardous Waste
TNRCC Audit Complete
*** Page: Date:
3 01/07/00
-----------------------------------------------------------------------------------------------------------------------------------------------------)9850 H Inactive 09/25/97 NA )escrlption from Generator: PESTICIDE WASTE/PESTICIDE
Form Code: )A Hazardous Waste Numbers: 0016
Current Management Units: None * Origin Codes:
10120 H Inactive 09/25/97 NA Oescription from Generator: PAINT SOLVENTS
Form Code: PA Hazardous Waste Numbers: F005
Current Management Units: None • Origin Codes:
12130 H Inactive 09/25/97 NA Description from Generator: OIL, SYNTHETIC MOTOR
Form Code: PA Hazardous Waste Numbers: F002
Current Management Units: None * Origin Codes:
112510 H I nact i ve 09/25/97 NA . Description from Generator: NAPHTHALENE SOLUTION
Form Code: PA Hazardous Waste Numbers: 0001 0039 F002
Current Management Units: None • Origin Codes:
112520 H Inactive 09/25/97 NA Description from Generator: MERCURY, LIQUID
Form Code: :PA Hazardous Waste Numbers: 0009
Current Management Units: None • Origin Codes:
No CONTAMINATED WASHWATER
No
No
NO
No
---------------------------------------------------------------------------------------------------------------.---------------------------------------113000 H Inactive 09/25/97 NA No Description from Generator: MINERAL SPIRITS WASH
Form Code: :PA Hazardous Waste Numbers: F002
Current Management Units: None • Origin Codes:
.------------------------------------------------~----------------------------------------------------------------------------------------------------
": i·"

IHW020
66002 Texas Waste Code ** No
AFBCA/Bergstrom Air Force Base Waste Status Date of Managed Class Status Onslte/
Offsite Longer Generated Wastes **
*** TEXAS NATURAL RESOURCE CONSERVATION COMMISSION *** Notice of Registration
Rad10-act1ve
Industrial and Hazardous Waste
TNRCC Audit Complete
914740 H Inact1ve 09/25/97 NA No Descr1ptlon from Generator: IGNITABLE WASTES
Form Code: EPA Hazardous Waste Numbers: 0001
Current Management Units: None * Or1g1n Codes:
Page: Date:
4 01/07/00
------------------------------------------------------------------------------------------------------------------------------------------------------916510 H Inact1ve 09/25/97 NA No Descr1ptlon from Generator: PAINT STRIPPER
Form Code: EPA Hazardous Waste Numbers: 0001 0007 U080
Current Management Units: None * Origin Codes:
------------------------------------------------------------------------------------------------------------------------------------------------------916940 H Inactive 09/25/97 NA No
Description from Generator: PAINT AND SOLVENTS Form Code:
EPA Hazardous Waste Numbers: F005 Current Management Units: None
* Origin Codes: 942630---H-----i~~~ti~~--09i25i97~--NA-------7---~-------~~N~-------~---------------------------------------------------------------------------------
Description from Generator: PAINT SLUDGE, PAINT STRIPPING, CAUSTIC Form Code: .
EPA Hazardous Waste Numbers: F002 Current Management Un 1t s: None ' ':,
* Origin Codes:
952000 H Inactive 09/25/97 NA No Description from Generator: PAINT
Form Code: SLUDGE, PAINT STRIPPING
EPA Hazardous Waste Numbers: -F002 Current Management Units: None
* Origin Codes: i , , . l"
972640 H tnactive 09/25/97 NA Description from Generator: FILTER, SPRAY BOOTH MEDIA
Form Code: .. -EPA Hazardous Waste Numbers: 0006 0007
Current Management Units: None * Origin Codes:
i: .
,.
No

HW020 .*. TEXAS NATURAL RESOURCE CONSERVATION COMMISSION ••• Notice of Registration
Industrial and Hazardous Waste 6002 exas aste ode
AFBCA/Bergstrom Air Force Base Waste Status Date of Managed Class Status Onslte/
Offslte • NO Longer Generated Wastes ••
Radioactive
TNRCC Audit Complete
73030 H Inactive 09/25/97 NA No Description from Generator: BATTERIES, MERCURY CONTAINING
Form Code: PA Hazardous Waste Numbers: 0009
Current Management Units: None • Origin Codes:
73080 H Inactive 09/25/97 NA No Description from Generator: SILVER CONTAINING SOLID
Form Code: PA Hazardous Waste Numbers: 0011
Current Management Units: None • Origin Codes:
73520 H Inactive 09/25/97 NA Description from Generator: BATTERIES, DRY CELL
Form Code: PA Hazardous Waste Numbers: 0006
Current Management Units: None • Origin Codes:
79530 H Inactive 09/25/97 NA Description from Generator: PLASTIC SANDER
Form Code: EPA Hazardous Waste Numbers: 0006 0007
Current Management Units: None • Origin Codes:
:.'
DUST'
No
No ,.
Page: Date.:
5 01/07/00 .
--------------------------------------~--------------------------------------------------------------------------------------------------------------83000 H Inactive 09/25/97 NA No Description from Generator: PAPER TRASH, CONTAMINATED
Form Code: EPA Hazardous Waste Numbers: FOO5
Current Management Units: None • OrigIn Codes:
I----------------------------------------~------------________________________________________________________________________________________________ _ 83110 H Inactive 09/25/97 NA No Description from Generator: HYDRAZINE CONTAMINATED MATERIAL
Form Code: EPA Hazardous Waste Numbers: 0001 U133
Current Management Units: None • OrigIn Codes:
------------------------------------------------------------------------------------------------------------------------------------------------------
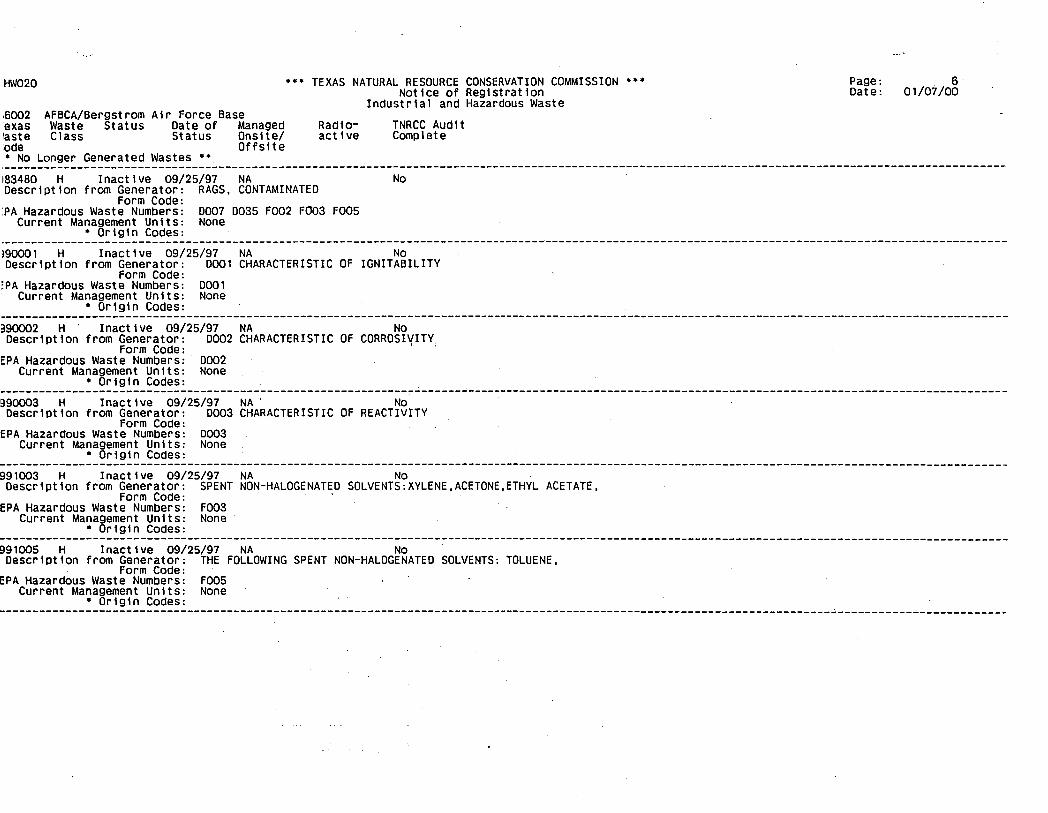
HW020
,6002 'exas laste :ode • No
AFBCA/Bergstrom Air Force Base Waste Status Date of Managed Class Status Onslte/
Offslte Longer Generated Wastes ••
••• TEXAS NATURAL RESOURCE CONSERVATION COMMISSION ••• Notice of Registration
Radioactive
Industrial and Hazardous Waste
TNRCC Audit Complete
Page: Date:
6 01/07/00
._----------------------------------------------------------------------------------------------------------------------------------------------------183480 H Inactive 09/25/97 NA No Description from Generator: RAGS, CONTAMINATED
Form Code: :PA Hazardous Waste Numbers: 0007 0035 F002 F003 F005
Current Management Units: None • Origin Codes:
~---------------------------------------------------------------------------------"--------------------------------------------------------------------190001 H Inactive 09/25/97 NA No Description from Generator: 0001 CHARACTERISTIC OF IGNITABILITY
Form Code: :PA Hazardous Waste Numbers: 0001
Current Management Units: None • Origin Codes:
~9OOO2 H' Inactive 09/25/97 NA No Description from Generator: 0002 CHARACTERISTIC OF CORROSIVITY
Form Code: ' EPA Hazardous Waste Numbers: 0002
Current Management Units: None • Origin Codes: , . ------------------------------------------------------------------------------------------------------------------------------------------------------
990003 H Inactive 09/25/97 NA' No Description from Generator: 0003 CHARACTERISTIC OF REACTIVITY
Form Code: EPA Hazardous Waste Numbers: 0003
Current Management Units: None • Origin Codes:
991003 H Inactive 09/25/97 NA No Description from Generator: SPENT NON-HALOGENATED SOLVENTS: XYLENE ,ACETONE ,ETHYL ACETATE,
Form Code: . EPA Hazardous Waste Numbers: F003
Current Management Units: None • Origin Codes:
991005 H Inactive 09/25/97 NA No Description from Generator: THE FOLLOWING SPENT NON-HALOGENATED SOLVENTS: TOLUENE,
Form Code: EPA Hazardous Waste Numbers: FOOS
Current Management Units: None • Origin Codes:
----------------------------------------------------------------------------------------------------------------------------~-------------------------

HW020
6002 exas aste ode
AFBCA/Bergstrom Air Force Base Waste Status Date of Managed Class Status Onsite/
Offsite • No Longer Generated Wastes ••
••• TEXAS NATURAL RESOURCE CONSERVATION COMMISSION ••• Notl~e of Registration
Radioactive
Industrial and Hazardous Waste
TNRCC Audit Complete
93154 H Inactive 09/25/97 NA No Description from Generator: U154 METHANOL OR METHYL ALCOHOL
Form Code: PA Hazardous Waste Numbers: U154
Current Management Units: None • Origin Codes:
93159 H Inactive 09/25/97 NA No Description from Generator: U159 2-BUTANONE OR METHYL ETHYL KETONE
Form Code: PA Hazardous Waste Numbers: U159
Current Management Units: None • Origin Codes:
93161 H Inactive 09/25/97 NA No Description from Generator: U161 METHYL ISOBUTYL KETONE OR 4-METHYL-2-PENTANONE
Form Code: EPA Hazardous Waste Numbers: U161
Current Management Units: None . • Origin Codes:
Page: Date:
7. 01/07/00
------------------------------------------------------------------------------------------------------------------------------------------------------~93220 H Inactive 09/25/97 NA No
Description from Generator: U220 BENZENE,METHYL OR TOLUENE Form Code:
EPA Hazardous Waste Numbers: U220 Current Management Units: None
• Origin Codes: ----------------------------------------------~.~~~-~---------~----------------------------------------------------------------------------------------993239 H Inactive 09/25/97 NA No Description from Generator: U239 BENZENE, DIMETHYL OR XYLENE
. Form Code: EPA Hazardous Waste Numbers: U239
Current Management Units: None • Origin Codes:
------------------------------------------------------------------------------------------------------------------------------------------------------• The first value is considered the primary value- (e.g. primary origin code). As of 04/02/1999, the next unassigned sequence number for WASTES is 0002.
Refer to 40 CFR Part 261 for Descriptions of EPA Hazardous Waste Numbers. ·,.l'.'·
• J I ..

IHW020 ... TEXAS NATURAL RESOURCE CONSERVATION COMMISSION ... Page: Notice of Registration
Industrial and Hazardous Waste 66002 AFBCA/Bergstrom Air Force Base
•••• UNITS AT THIS SITE MANAGING WASTE •••• Unit Unit Unit Number Type Status
•• 'Active' & 'Closure Pending' Units ••
Date of Classes of Waste Status Managed In Unit
Onslte / Offslte
006 Tank (Surface) Active 01/01/87 / NA Description from Company: For emergency use
Capacity: 3000.0000 Capacity Unit of Measure: G System Types: 141 Storage Biennial syst~m Regulatory Status Regulatory status unknown Wastes Currently Managed In Unit
Wastes Previously Managed In Unit 908500
Unit Perml t Number
NA
Date:
Unit # Regulatory on Status Perml t
NA RCRA Pmt Exempt - Accumulation Time
8 01/01/00
Deed Recording Needed/Date
NA /
------------------------------------------------------------------------------------------------------------------------------------------------------007 Mise Store Container Active 05/01/88 Description from Company: Storage of waste munitions System Types: 141 Storage Biennial System Regulatory Status Regulatory status unknown Wastes Currently Managed In Unit
Wastes Previously Managed In Unit 990003
009 Contain Store Area Active Description from Company: Building 1801 System Types: 141 Storage Biennial System Regulatory Status Regulatory status unknown Wastes Currently Managed In Unit
Wastes Previously Managed In Unit 991003
/ NA NA NA RCRA Pmt Exempt - Accumulation Time NA /
" 'i NA NA NA NA / .'.
, ,. -------------------------------------------------------------~~--~~---~-------------------------------------------------------------------------------ala Contain Store Area Active'·',·· 02/15/93. / NA Description from Company: Facility No. 4580 (12 CSS/CVSR) , Containers System Types: Wastes Currently Managed In Unit:
Wastes Previously Managed In Unit: 916940 ~972640
NA NA NA /
------------------------------------------~~----------------~~-~~---~--------------------------------------------------------------------------------AS of 04/02/1999, the next unassigned sequence number for UNITS Is 015 .
. '." •• 'Inactive', 'Closed' & 'Post Closure Care' Units·· ------------------------------------------------------------------------------------------------------------------------------------------------------001 Tank (Sub-surface) Description from Company:
Capacity: System Types: 141 Storage Biennial System Regulatory Status: Regulatory status unknown
Inactive 09/25/97 / NA . NA NA Located at BuildIng 1608. ThIs tank Is no longer used by Bergstrom AFB.
6000.0000 - . Capacity Unit of Measure: G
NA /
Wastes Previously Managed In Unit: 0001 lOll 908500 ------------------------------------------------------------------------------------------------------------------------------------------------------002 Contain Store Area Inactive 09/25/97 / NA NA NA NA /
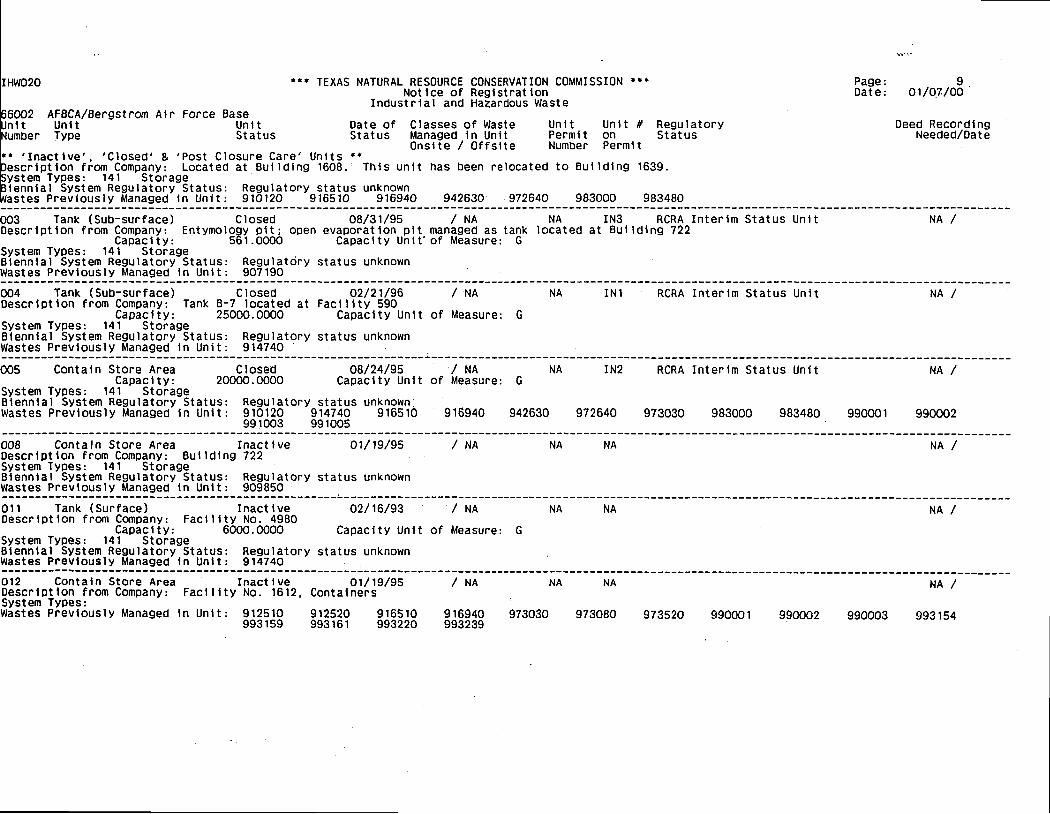
I HW020
AFBCA/Bergstrom Air Force Base Unit Unit Type Status
••• TEXAS NATURAL RESOURCE CONSERVATION COMMISSION ••• Notice of Registration
Industrial and Ha~ardous Waste
Date of Classes of Waste Status Managed in Unit
Onslte / Offslte
Unit Perml t Number
Unit # Regulatory on Status Perml t
•• 'Inactive', 'Closed' & 'Post Closure Care' Units •• escrlptlon from Company: Located at Building 1608.' This unit has been relocated to Building 1639. ystem Types: 141 Storage
Biennial System Regulatory Status: Regulatory status unknown astes Previously Managed in Unit: 910120 916510 916940 942630 972640 983000 983480
Page: Date:
9 01/0.7/00 .
Deed Recording Needed/Date
1------------------------------------------------------------------------------------------------------------------------------------------------------3 Tank (Sub-surface) Closed 08/31/95 / NA NA IN3 RCRA Interim Status Unit NA /
Description from Company: Entymology pit; open evaporation pit managed as tank located at Building 722 Capacity: 561.0000 Capacity Unit· of Measure: G
System Types: 141 Storage Biennial System Regulatory Status: Regulatory status unknown astes Previously Managed In Unit: 907190
004 Tank (Sub-surface) Closed 02/21/96 Description from Company: Tank B-7 located at Facility 590
/NA
Capacity: 25000.0000 Capacity Unit of Measure: G System Types: 141 Storage Biennial System Regulatory Status: Wastes Previously Managed in Unit:
Regulatory status unknown 914740
NA INl RCRA Interim Status Unit NA /
--------------------------------------------------------------_._-------------------------------------------------------------------------------------005 Contain Store Area 08/24/95 / NA
Capacity: Closed
20000.0000 Capacity Unit of Measure: G System Types: 141 Storage Biennial System Regulatory Status: Wastes PreViously Managed In Unit:
Regulatory status unknown 910120 914740 916510 991003 991005
91g940 942630
NA IN2 RCRA Interim Status Unit NA /
972640 973030 983000 983480 990001 990002
008 Contain Store Area Inactive 01/19/95 / NA NA NA NA / Description from Company: Building 722 System Types: 141 Storage Biennial System Regulatory Status: Regulatory status unknown Wastes Previously Managed in Unit: 909850 --------------------------------------------------~---------------------------------------------------------------------------------------------------011 Tank (Surface) Inactl ve 02/16/93 / NA NA NA NA / Description from Company: Facility No. 4980
Capacity: 6000.0000 Capacity Unit of Measure: G System Types: 141 Storage Biennial System Regulatory Status: Regulatory status unknown Wastes Previously Managed in Unit: 914740 ------------------------------------------------------------------------------------------------------------------------------------------------------012 Contain Store Area Inactive Description from Company: Facility No. 1612, System Types: Wastes Previously Managed in Unit: 912510
993159
01/19/95 Containers
912520 993161
916510 993220
/ NA
916940 993239
973030
NA NA NA /
973080 973520 990001 990002 990003 993154
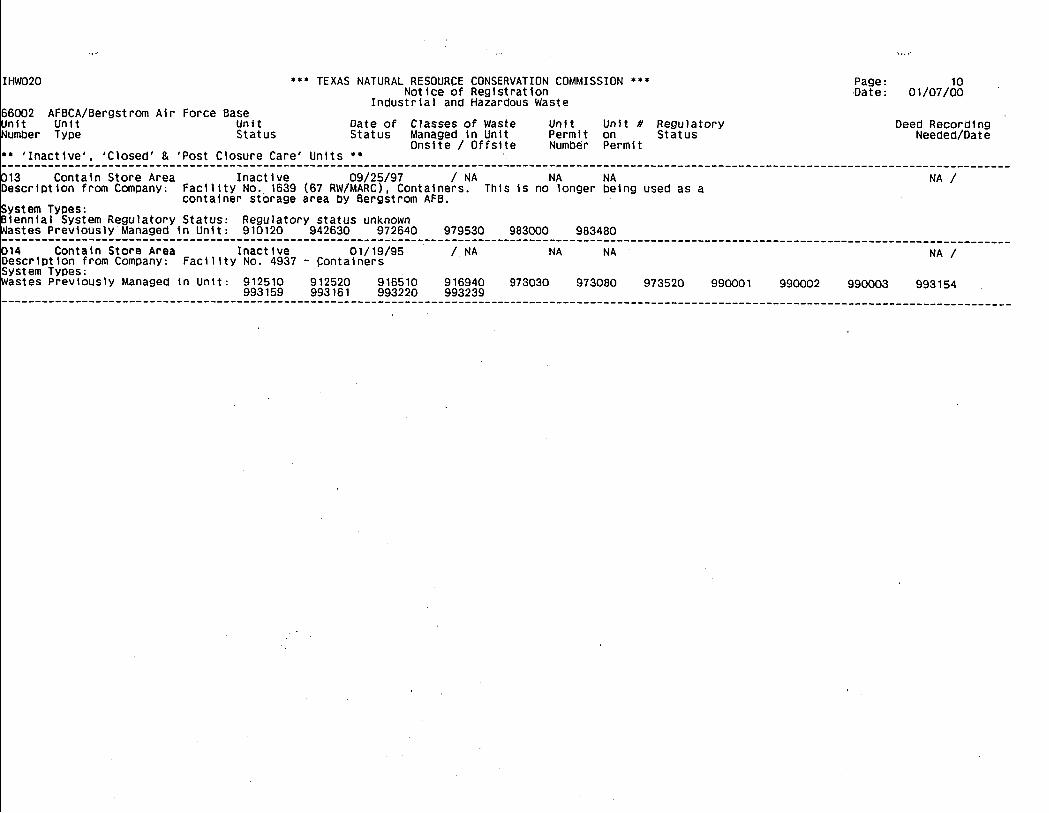
IHW020
AFBCA/Bergstrom Air Force Base Unit Unit Type Status
66002
I
unit Number
*** TEXAS NATURAL RESOURCE CONSERVATION COMMISSION *** Notice of Registration
Industrial and Hazardous Waste
Date of Status
Classes of Waste Managed In Unit Onslte / Offslte
Unit Perml t Number
Unit # on Permit
•• 'Inactive'. 'Closed' & 'Post Closure Care' Units **
13 Contain Store Area Inactive 09/25/97 / NA NA NA
Regulatory Status
IDescrlpt Ion from Company: Facility No .. 1639 (67 RW/MARC). Containers. ThiS Is no longer being used as a
ISystem Types: container storage area by Bergstrom AFB.
lennlal System Regulatory Status: Regulatory status unknown astes Previously Managed In Unit: 910120 942630 972640 979530 983000 983480
Page: Date:
10 01/07/00
Deed Recording Needed/Date
NA /
------------------------------------------------------------------------------------------------------------------------------------------------------14 Contain Store Area Inactive 01/19/95
Description from Company: Facility NO. 4937 - ~ontalners System Types: Wastes Previously Managed In Unit: 912510 912520 916510
993159 993161 993220
INA
916940 993239
NA NA
973030 973080
NA /
973520 990001 990002 990003 993154 ------------------------------------------------------------------------------------------------------------------------------------------------------

•
•
•
.09/27/9S lS: 24 Ial 0021003
I
ORDINANCE NO. 940210-~
AN ORDINANCE ESTABUSHING INITIAl PERMANENT ZONING AND OiANGING 1'HE' ZONING MAP ACCOMPANYING CHAPTER 13·2 OF TIlE AUSTIN CI1Y CODE OF 1992 AS FOLLOWS: APPROXIMATELY 3,216 ACRES OF LAND, FROM ·UNZ· UNZONED DlSTRJcrlO "AV" AVIATION SERVICES DISlRICT, LOCAllY KNOWN AS 2500 EAST STATE HIGHWAY 71, SAID PROPERTI' BEING MORE PARTICULARLY IDENTIFIED BY MAP IN THE "'EXHIBIT A"' ATIACHED TO nus ORDINANCE, BEING GENERAU.Y KNOWN AS THE NEW AUSTIN AIRPORT AT BERGSTROM. IN TIlE q!Y OF AUSTIN. TRAVIS COUNTI'. TIXAS; WAIVING THE REQUIREMENTS OF SECTION "2:"2:-3 OF THE AUSTIN CTIY CODE OF 1992; AND PROVIDING AN EFFECTIVE DATE.
BE IT ORDAINED BY TI-!E crrY COUNOL OF mE 01Y OF AUSTIN:
PART 1. That Chapter 13·2 of the Austin City Code: of 1992 is am~ded to .1lange the: base: zoning cllitricr on the Propcrr:y which is within the: incorporated city limits of th '':: City of Aumn. Travis Couney, Tens, included in zonin~ cas~ no. Cl4-93--D16S, locally kno·: n as 2500 East State Highway 71, and being more parncularly icientificd in the: map attach!.i as W£xluDit A.. to this ordiIiance:, from ·UNZ· Umonc:d district to -AV- Aviation Servic(· .. dinria, being gmc:.ra1ly known as the: New Austin Airport at Bergstrom. in the City of Austir. Travis Counrv T~ ~,
. . . PART 2. That it is ardaed that the Zoning Map established by Sec. 13·2·22 of the: Austin City Code of 1992 and ~de a part thereof s.h.all be: change:d to record the. amendment en..acted by this ordinance. .
PART 3. That the requirWlc:ncs :impos·c:d by Section 2·2·3 of the Austin Cit}' \ :ode of 1992, as amrnded, re:garding the presentation and adoption of ordinances are haeby waived by tlu: affirmative vott of ~t least five membas of the City Council.
PART 4. Th;at this ordinance shall b~come eif(.crivc: upon the expiration of tt·.~ cLays following tlu: dare: of n:s fin.a1 passagc:, as proVld~d by the: Chaner of the: City of Auswl
PASSED AND APPROVED:
____ ---IF...loc.-:..brnUI.!:!JarvL.l.-_--Ll Q~ __ --', 1994
APPRo~t~~ DiannU~ .
1 OF eb 9-4
MEI1l
City Anorney
AITEST:~ C ·~Y kIllcs l _ Aldridge
Cit]· Clerk
I
I

... . ., .. ~<{" o .. . ~
... ..
",
",
• • .. • • .. •
.." .. ! '" .:
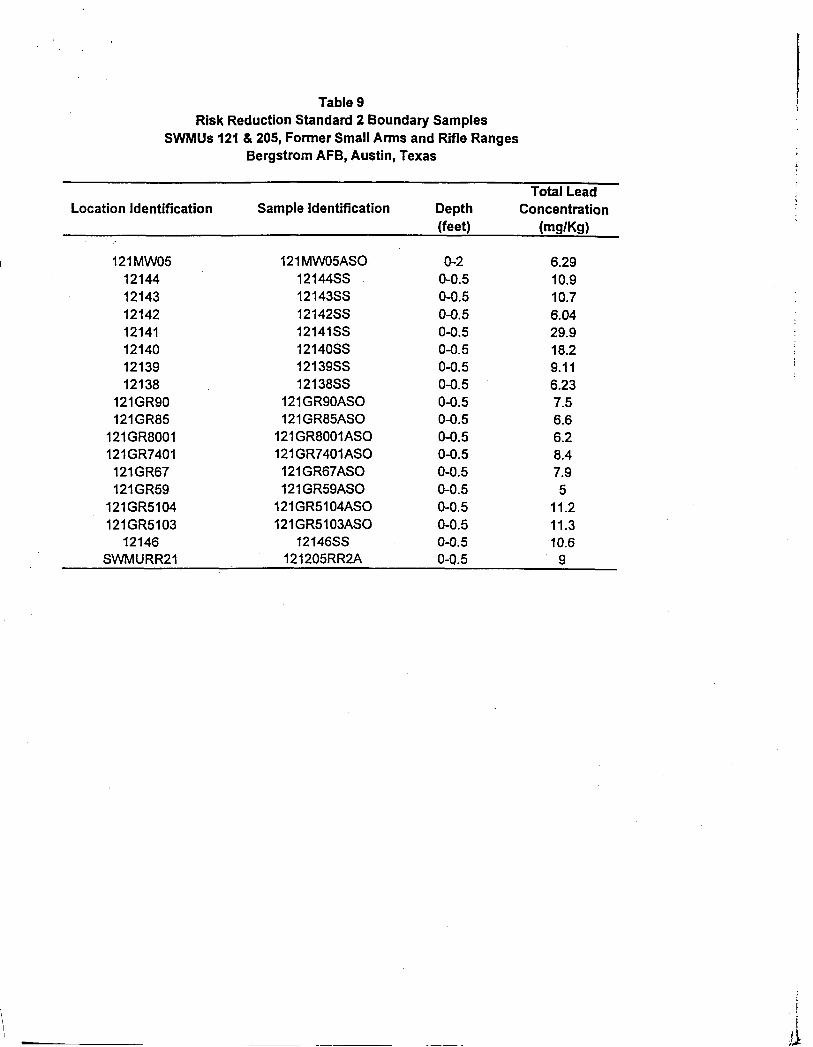
---- --
Table 9 Risk Reduction Standard 2 Boundary Samples
SWMUs 121 & 205, Former Small Arms and Rifle Ranges Bergstrom AFB, Austin, Texas
Total Lead Location Identification Sample Identification Depth Concentration
(feet) (mg/Kg)
121 MWOS 121 MWOSA50, 0-2 6.29 12144 1214455 O-O.S 10.9 12143 1214355 O-O.S 10.7 12142 1214255 o-o.S 6.04 12141 1214155 O-O.S 29.9 12140 1214055 O-O.S 18.2 12139 1213955 O-O.S 9.11 12138 1213855 O-O.S 6.23
121GR90 121GR90A50 O-O.S 7.S 121GR8S 121GR8SA50 O-O.S 6.6
121GR8001 121GR8001A50 O-O.S 6.2 121GR7401 121GR7401A50 O-O.S 8.4 121GR67 121GR67A50 O-O.S 7.9 121GRS9 121GRS9A50 O-O.S S
121GRS104 121GRS104A50 O-O.S 11.2 121GRS103 121GRS103A50 O-O.S 11.3
12146 1214655 0-0.5 10.6 5WMURR21 12120SRR2A O-O.S 9
\ ,I

•
•
•
Lead
Table 12
95 % Upper Confidence Level Calcualation
SWMUs 121 & 205, Former Small Arms and Rifle Range Soil- 0 to 15 feet bgs
Bergstrom AFB, Austin, Texas
Sample ID Background = 18.4 Sample In
121TR0603 643 6.4661
121TR0701 169 5.1299
121TR0703 76.5 4.3373
121TR0501 1340 7.2004
121TR0502 5.5 1.7047
121TR0602 261 5.5645
121GR33 61.4 4.1174
121GR34 42.7 3.7542
121GR38 146 4.9836
121GR39 236 5.4638
121GR40 173 5.1533
121GR41 16.7 2.8154
121GR45 23.1 3.1398
121GR46 6.8 1.9169 121GR47 8.5 2.1401
20510BSO 60.4 4.1010
20511BSO 109 4.6913 I
FD - Frequency of Detection FD 17 / 17
# above Baekg. 13 n= 17
s2y= 2-4429 sy= 1.5630
ybar= 4.2753
H(0.95)= : 3.612
95%UCL= 1000.
mean cone= 198.741
min cone= 5.5
max conc= 1340
Exposure value= 95% UCL nlMI
Page 1 of 1
~ I !I
;
I il ,1
;1
I)
I 1 Ii
: ~I /1
, "\ ! I ;: \ .: '
; ~'
' '
j r .-" "
j .'

•
Iii! /11 ~\ \ ~ \' !,,\,~----- \. \ \~~'" " r! 1\\1\ ! li111r--\-s;li-_-, .. --'""'- \ \\\\>~:. L 1,'1: \, '\t\,\ ! \. I,· \ \ '''''-- '\\ \\\ \~,:----; \ \ I I hi I '\ '( \ \ --..... , -..-.,.\ \ \. \\.:<::: .... III i! 1 \ Ii ill/ r··\,,\--,.. """ '-, \. \."."" ''' .. '' Ii il I \ d~~ /1 ! iI' '\ i", ',"', " ", ',"'" ! ! ". II 1 I \ \ / \ ", ".. "
I \ 1\ \ . I I /I! (\\-\ \ I "<'<> j \ i) I iJlV I ; IiI I \ \\ \ \ ""' .. >~ ! II illllllt I II Ii! I \ ~ \ I \ " I, 1\ 'I I. hu'I!I',1 I' " 11\ j f\ \) I I \ \'; t IIUii i /' III \ I \, \ / / I \ I ·1·,lt' /' I Ii \ ! I ! --'
\ ,.;1 .. I I I /
I \ I I '\ il'''';j / i \ \ \ ,i '!II t"'·r /
~\!,j [' I 11 iii /1/'/ I 'Ii I, ~; 'j./ .-r- 14;1' , 1,1 I;' I, ~_J \ , I II , '1 _j' " ,
"\ i! ill \ I ~ !! l. //: I / \ " i I', \' 1/ ....... I· I I
\ Ii! I I I 1\ I I II ' i \1,' \I \ g I I ,,-_,/ f 1/./'\ "" __ '
I : i II ~ ! I I . ,-f"', / \. \ ii II; ... . !, !, I , \
, 1'1 I '\ \ I I 1 I I if '---.,.\ \\ I (\ 11\' \ ~ 1\ I, 'I·I'I'!. ./ I tl! (-.. \. \\ I ;'\1 1
; "Iv! J \, l" ' I \ '\" ! I II, I v" \ \ i
\ \ l iiI \P't //1 I / \ ,.\ \\ I III i \f ( 'I' ~!I '.j ,! in \ ! J I (I\ II 1\ \ iIi\ I Ilf '--\ '-""-',,\ \:" II
I \ I I I \ II \ '-, I ; I,' \ / I ;' , I, \ \ '\ ' \,.1 , I I : \ hI !', II \ Ii 1t',' \.... \ - .- - . ' , \ \ \ I ! ,', \ !j i \ \., \ ... 1.\ _.''- __ ._<_'~.~ .1f4 I il.l i I I I, ~ ','" /' I "~I - -. ,-
I Ii 'III!! I I Ii! ,1 ! Ii .-) \ \-./ 5~03/f) ItI}111 ) f Ii!) i 1/ ,. \------/ 'II' i/!il,' \ II, I/! i ----.-./-~ I j /' J'II : \ llf j '11 I ,,-I '. I I I I I , I' J ('
1 il·I!', . UI f Ii i'\ II I 111 j' i I I !'I I I) / I / ; ...• ,/'. JI \ I I 11 I' I 1\ '.1-( / I" / I II "\,' 'Ii I)!I I ,I 1\ '-'1' t/"~·· I ./ /
: 'I I I '.' . . \1 /- ,./ i \ I: Ill!,' :li \ ":]"-''''-: r~ \ \----..... ~. 111 III I I.' I i _ .. \ ,."...".. _I 'II i\! II! II I I. --r---;", \.------ .. , .... ---_.
N
LEGEND: ~ SOIL BORING LOCATION-EXCAVATION CONFIRMATION
---'. TOPOGRAPHIC CONTOURS (n)
SOURCE: BASE MAP AND TOPOGRAPHIC CONTOURS PROVIDED BY THE CITY (l:' AUSTIN.
! ! 11111 iI' I I \ I :r-'---" \ '-----__ 3~ --~ // L ", 100
i I \ ,II !111 ! \\>'T-=r--::.~---~::.::::----------.---- !!!!! ICIUIi AU ~ )1 :' \ ! " I: I : '1---/' ---•. -------:--,--.----. .--' ----------------------1 I i II ", .-_. - .. ------:,:0--_ -- ",' 1\ I :lll.i \ \ l -1'--1 -----,.-~_::::-..::.::..._::_------/- AIR fORCE CENTER fOR ENVIRONMENTAL EXCEUENCE
/' • \ I ·11 -'~- ---------- -.--. ---:"-- BERGSTRO" AIR FORCE BASE ~ ,I \ . '----1 --- __ -----.=--_ . ~- 49")- M
I \1, I \ i: -'. ----.-----.-=:-.-~",-- US N TEXAS ' I I \\,,, ___ +-+,. ·'----~---:::=:.7::<::::::.::.:::::---- A T1. I I i ,,~ '-_.--1-. t' "-----. /." ....... - . ~,,-..:::::--:.:::..--- '---------~~.....;..;;.....;..~--------I
I II 11.\ ,... I ~ '. ,..~" ----.--.-.~ -'-'---- SWMUs 121 AND 205 i "'\ \ \,_'~ .. .L.- __ -::::-~/ .. _--.--.• ...- ........ ___ --._-.-_--I \ " " __ _ ___ .. ___ .__ FORMER SMALL ARMS AND RIFLE RANGES
i ;) I ~ \-:::t-.. t:~~=-~~===--=--------~-== CONL~~'tJ11J>~ JWPLE '.,1
1 ill 1 '-'.-.. (J/-~~------ _-------.. ! ~ ,[. t' ------.--
'I \11' < '! 1/ ---I, ' 1\1\1,1 \ \ ~ Vr"" -'--1IU __ . II ! I! I ''-, r"'-r, --"',
PREPARED BY: JMD FlGURE f1lE DA 1[:
~N~ ~~~--~2~3~.A~P~R.~9~7 __ ~ PLOT DAm lET < 27.0CT.99 11 PROo£CT NO. 12001-9 5724
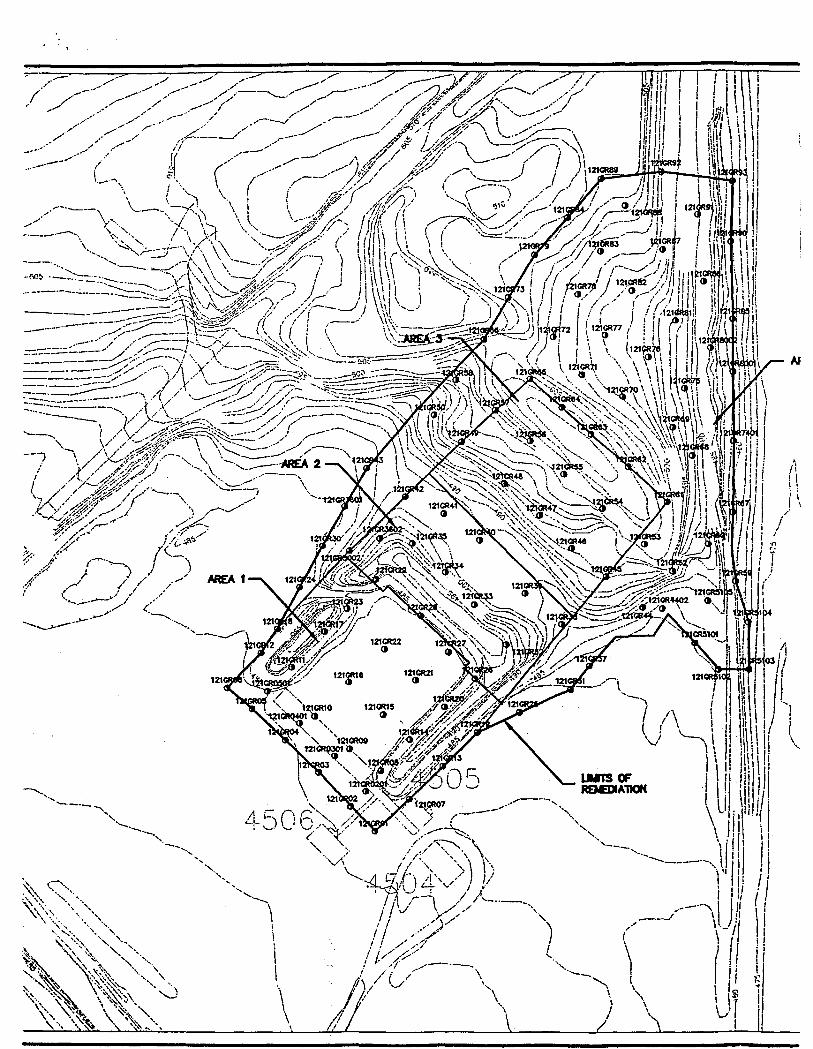
... -.. -----/
121
\ ! ! I \ i
., 'I ( \ i I

• Robert J. Huston, Chainnan R. B. "Ralph" Marquez, Commissioner
John M. Baker, Commissioner Jeffrey A. Saitas, Executive Director
DEC 8 1l(Ij'O
FILE#: AB JB DP PW SW ®
TEXAS NATURAL RESOURCE CONSERVATION COMMISSION Protecting Texas by Reducing and Preventing Pollution
December 5, 2000
Mr. Rafael E. Vazquez Regional BRAC Environmental Coordinator AFBCA/ROL Bergstrom AFB 3711 Fighter Drive Austin, TX. 78719-2557
RE: Bergstrom Air Force Base TNRCC Solid Waste Registration No. 66002 EPA rD. No. TX0572124188 Review of Site Closure Report for Former Small Arms and Rifle Ranges - SWMUs 121 and 205
• Approval - Risk Reduction Standard No.2
•
Dear Mr. Vazquez
The Texas Natural Resource Conservation Commission (TNRCC) has completed our review ofthe Site Closure Report/or Solid Waste Management Units 121 and 205 Former Small Arms and Rifle Ranges (Closure Report) dated December 1999 and received by the TNRCC on February 15,2000. In addition, the TNRCC also reviewed comments received from EPA Region' 6 dated October 16, 2000. According to the closure report, closur~ activities have been completed in accordance with the TNRCC Risk Reduction Standard (RRS) No.2, pursuant to Title 30 Texas Administrative Code (TAC) Chapter 335 Subchapters A and S.
SWMU 121 is identified in the Closure Report as the former small arms range and SWMU 205 is identified as the former rifle range backstop. The ranges were used in one form or fashion from the early 1950s until 1994. The Closure Report for SWMUs 121 and 205 contains documentation indicating that the closure activities have attained RRS No.2 such that no post-closure care or engineering or institutional control measures are required. Based upon the information contained in the Closure Report and other information available to staff, it appears that the closurelremediation ofSWMUs 121 and 205 has attained RRS No.2.
As specified in §335.560, the Air Force Base Conversion Agency (AFBCA) must submit proof of deed certification to the TNRCC within ninety (90) days from the date ofthis letter for SWMUs 121 and 205. Upon acceptance ofthe proof of deed certification, the TNRCC will transmit a final letter releasing AFBCA from post-closure care responsibilities associated with SWMUs 121 and 205.
P.O. Box 13087 • Austin, Texas 78711-3087 • 5121239-1000 • Internet address: ~.tnrcc.state.tx.us
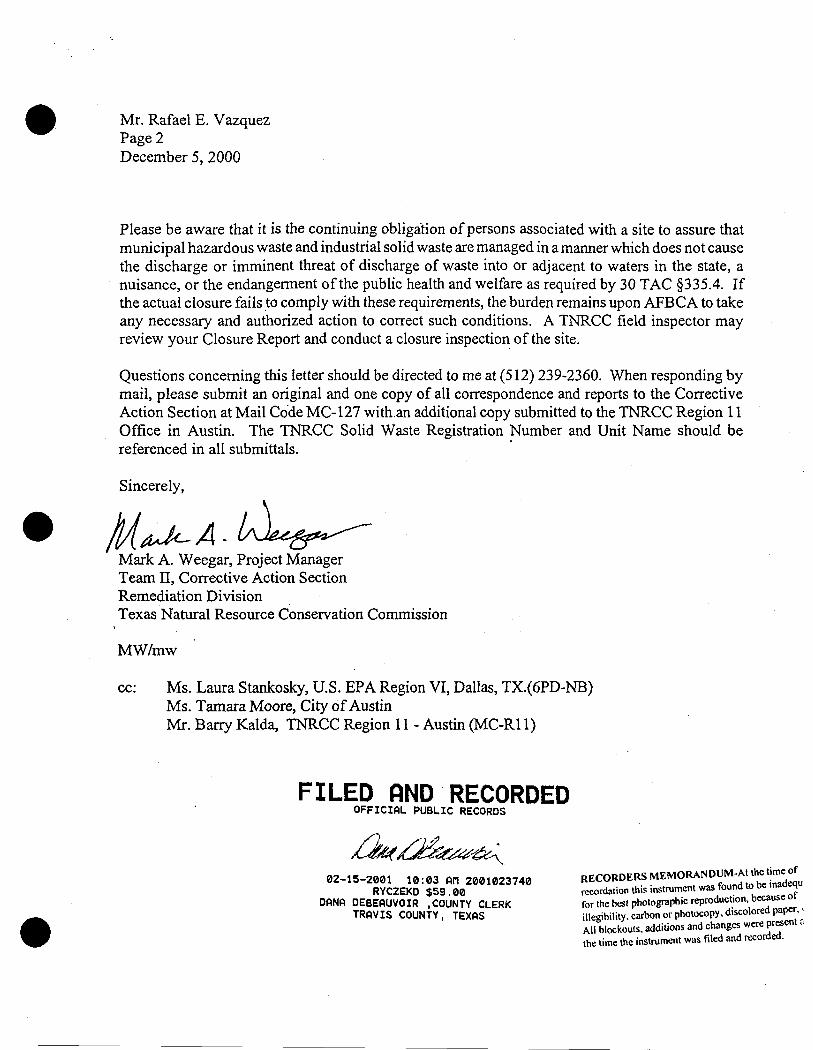
• Mr. Rafael E. Vazquez Page 2 December 5, 2000
Please be aware that it is the continuing obligation of persons associated with a site to assure that municipal hazardous waste and industrial solid waste are managed in a manner which does not cause the discharge or imminent threat of discharge of waste into or adjacent to waters in the state, a nuisance, or the endangennent of the public health and welfare as required by 30 TAC §335.4. If the actual closure fails to comply with these requirements, the burden remains upon AFBCA to take any necessary and authorized action to correct such conditions. A TNRCC field inspector may review your Closure Report and conduct a closure inspection of the site.
Questions concerning this letter should be directed to me at (512) 239-2360. When responding by mail, please submit an original and one copy of all correspondence and reports to the Corrective Action Section at Mail Code MC-127 with an additional copy submitted to the TNRCC Region 11 Office in Austin. The TNRCC Solid Waste Registration Number and Unit Name should be referenced in all submittals. -
Sincerely,
• /lAp,.)LA.
•
Mark A. Weegar, Project Manager Team II, Corrective Action Section Remediation Division Texas Natural Resource Conservation Commission
MW/mw
cc: Ms. Laura Stankosky, U.S. EPA Region VI, Dallas, TX.(6PD-NB) Ms. Tamara Moore, City of Austin Mr. Barry Kalda, TNRCC Region 11 - Austin (MC-Rll)
FILED AND RECORDED OFFICIAL PUBLIC RECORDS
02-15-2001 10:03 AM 2001023740 RYCZEKD $59.00
DANA DEBEAUVOIR ,COUNTY CLERK TRAVIS COUNTY, TEXAS
RECORDERS MEMORANDUM-At the t~me of recordation this instrument was fou~d to be lOadeiu tor the best photographic reproductIOn, because 0
illegibility. carbon or photocopy. discolored paper.~ All blockouts. additions and changes were present ~ the time the instrument was tiled and recorded.


illlillllllllllllllllllllllllllllllllllllllllllllllllllllll l:,.,
DT'EP \ryITHOUT WARI{AN Y
}TORMER. I}IJ,RGSTROIVT AIR. FOITCE BASE
TRAVIS COUNTY. TEXAS
NOTI_CEOqCWIF YOU ARE A NATI]RAL PERSON, YOU MAY REMOVE OR STIUKE,ANY OF THE FOLLOWINGINFORMATION FROM THIS INSTRUMEI{T BtrFORE IT IS F'ILED FOR RECORD IN THE PUBLICITECORDS: YOUR SOCIAL SECURITY NUMBER OR YOUR DRTVER'S LICENSE NUMBER.
]I. PARTIES
This Deed made this / ? day of -1fiar[1] ,2004,by and between the UnitedStates of Ame:rica, acting Uy *dGoreh th;-S;--dry
"f the Air Force whose address is
Washington, D.C., under aud pursuant to the Federal Properlv and Administrative Services Actof L949, approved June 30, t949, (63 Stat. 377),40 U.S.C. $ 101, et seq., as amended, andregulations and orders promulgated thereunder; the Defense Base Closure and Realignment Actof 1990, Pub. L. No. 101-510, as amended, and regulations and orders promulgated thereunder;and a delegation from the Administrator of General Services to the Secretary of Defense, and asubsequeui delegation from the Secretary of Defense to the Secr etary of the Air Force, party o{'the first pafi, as Grantor, and the City of Austin, Texas, a body politic created, operating, andexisting under and by virtue of the laws of the State of Texas, parly of the second part, as
Grantee.
WITNE$SNiTII TIIAI':
WI{ERI'AS, the Grantor is the owner of the real property described herein, located within theformer Bergstrom Air Force Base, situated in Travis County, Texas; and
WHEREAS, the Grantee provided to the l}dted States the money to purchase the real propertydescribed herein, under the condition that the United States retain title until such property was:'rbandoned as a permanent Air Basc, at which tirne the Grantee could elect to require the Grantorto convey such land and the improvements thereon to the Grantee; and
WIIEREAS, the real property described herein was duly declared surplus and available fordisposal pursuaut to the powers and authority contained in the provisions of the Defense BaseClosure and Realigrment Act of 1990, Pub. L. No. 101-510, as amended, and orders andregulations promulgated thereunder; and
WIIEI{EAS, pursuant to the resolution ilassed by tlie City Council of the G:antee datedFebruary 27 ,1947, the Grantee requests full legal title to such real property be conveyed to theGrantee.
20041F'l6749
lJa,l. oo. 1 )
Deed Without Wan'anty Bergstrom 02ParcelD 56.324 acres

II. CONSIDERATtrO}{ AND CONVEYANCIT
NOW, TIIEI{EFORE, in consideration of the surn of ONE DOLLAR ($1.00) and othergood and valuable cotrsideration, the receipt of which is hereby acknowledged, the Grantor doeshereby REMISE, REI,IIASE and FOREVER QUITCLAIM, Without Warranty or representation,express or implied except a..: expressly stated herein, and excludirrg all wananties that might ariseby common law and the warranties under Section 5.023 of the Texas Property Code (or itssuccessor) unto the Grantee, its successors and assigns forever, all such right and title as theGrantor has or ought to have, in and to the real property described in Exhibit "At'and depictedon the survey drawing atlached as Exhibit t'8" of this Deed Without Warranty ("Deed") andsituated in Travis County, Texas.
III. APPURTENANCES AND FIABENDUM
TO IIAVE AND TO HOLD, together with all the buildings and improvements erectedthereon, except for monitoring wells, treatment wells, and treatment facilities and related piping,and all and singular the tenements, hereditaments, appurtenances, and improvements hereuntobelonging, or in any wise appertaining (which, together with the real property described herein,known as Parcel D and cailed the "Property''in this Deed) to the Property to the Grantee.
IV. RESERVA'IIONS
A. RESERVING UNTO THE GRA.NTOII, including the State of Texas (the "State"),and its and their respective officials, agents, ernployees, contractors, and subcontractors, the rightof access to the Property (including the right of access to, and use of, utilities at reasonable costto the Grantor), for the following purposes and for such other purposes as are necessary to ensurethat a response or consctive action found to be necessary, either on the Property or on adjoininglands, after the date of transfer by this Deed will be conducted:
1. To conduct investigations and surveys, including, where necessary drilling, soiland water sampling, testpitting, testing soil borings, and other activities relating to any suchresponse or corrective action.
2. To inspect field activities of the Grantor and its contractors and subcontractors inimplementing any such response or coffective action.
3. f'o conduct any test or survey required by the State relating to any such responseor corrective action, or to verify any data submitted to the EPA or the State by the Grantorrelating to any such actions.
4. To conduct, olrerate, maintain, or undertake any other response, corrective actionas required or rlecessary under applicable law or regulation, or the covenant of the Grantor inSection VI of this Deed, but not limited to, the installation, closing, or removal of monitoringwells, pumping wells, and treatment facilities that will be owned or operated by the Grantor and
its officials, agents, employees, contractors, and subcontractors.
Deed Without Wan'anty Bersstronr 02 Parce'l D 56.324 Acres
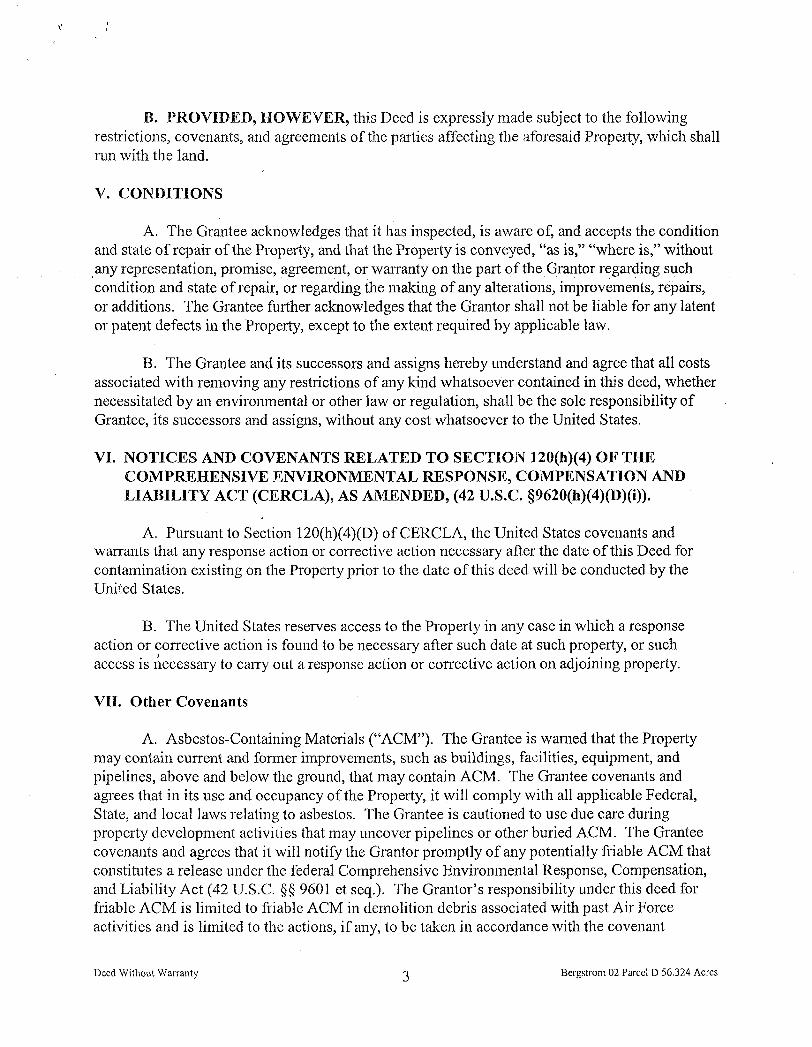
B. PROVIDED, I{OWEVER, this Deed is expressly made subject to the followingrestrictions, covenants, and agreements of the parties affecting the :rforesaid Property, which shallrun with thc land.
V. CONDITIONS
A. The Grantee acknowledges that it has inspected, is aware of, and accepts the conditionand state of repair of the Property, and that the Property is conveysd, "as is," "where is," without
.any representation, promise, agreement, or warranty on the part of the Grantor regarding suchcondition and state of repair, or regarding the making of any alterations, improvements, repairs,or additions. The Grantee fuilher acknowledges that the Grantor shall not be liable for any latentor patent defects in the Property, except to the extent required by applicable law.
B. The Grantee and its successors and assigns hereby understand and agree that all costs
associated with removing any restrictions of any kind whatsoever contained in this deed, whethernecessitated by an envirorLmenlal or other law or regulation, shall be the sole responsibility ofGrantee, its successors and assigns, without any cost whatsoever to the United States.
vI. NOTTCES AND COVENANTS RELATED TO SECTTON 120(h)(4) OF TI{ECOMPREHENSIVE NIWIRONMENTAL RESPONSE, COMPENSATION ANDLTATIILTTY ACT (CERCLA), AS AMENDED, (42 U.S.C. $9620(hX4XDXi)).
A. Pursuant to Section 120(hX4XD) of CERCLA, the Unitecl States covenants andwarrants that any response action or corrective action necessary after the date of this Deed forcontamination existing on the Property prior to the date of this deed u,ill be conducted by theUnited States.
B. The United States reseryes access to the Property in any case in which a responseaction or corrective action is found to be necessary after such date at suclt property, or suchaccess is necessary to cary out a response action or corrective action on adjoining property.
VII. Other Covenants
A. Asbestos-Containing Materials ("ACM"). The Grantee is warned that the Propertymay contain current and former improvements, such as buildings, facilities, equipment, andpipelines, above and below the ground, that may contain ACM. Ihe Grantee covenants andagrees that in its use and occupancy of the Property, it will comply with all applicable Federal,State, and local laws relatirrg to asbestos. The Grantee is cautioned to use due care duringproperty development activities that may uncover pipelines or other buried ACM. The Granteecovenants and agrees that it will notify the Grantor prornptly of any potentially friable ACM thatconstitutes a release under the federal Comprehensive Environrnental Response, Compensation,and Liability Act (42 U.S.C. $$ 9601 et seq.). The Grantor's responsibility under this deed forfriable ACM is limited to friable ACM in dernolition debris associated with past Air Forceactivities and is lirnited to the actions. if anv. to be taken in accordance with the covenant
Deed Without Wananly Bergstronr 02 Parcel D 56.324 Acres
contained in Section VI herein. The Grantee is rvamed that the Grantor will not be responsiblefor removing or responding to ACM in ol on utility pipelines. l'he Grantee acknowledges thatthe Grantor assumes no liability for pr:operly damages or damages for personal injury illness,disability, or death to the Grantee, or tc any othcr person, including rnembers of the generalpublic, arising frotn or incident to the pnrchase, transportation, removal , handling, use,disposition, or other activity causing or leading to contact of any kind rvhatsoever with asbestoson the Property, whether the Grantee has properly warned, or failed to properly warn, the personsinjured.
B. Ng!-Dj$ggginatip4. The Grantee covena.nts not to discriminate upon the basis ofrace, color, religion, national origin, sex, age, orhandicap in the use, occupancy, sale, or lease ofthe Property, or in its emplol'rnent practices conducted thereon. This covenant shall not apply,however, to the lease or rental of a room or roorns within a fbmily dwelling unit, nor shall itapply with respect to religion if the Property is on premises used primarily for religious purposes.The United States of America shall be deemed a beneficiary of this covenant without regard towhether it remains the owner of any land or interest therein in the locality of the Property.
C.@Priortocommencirrganyconstructionon,ora1terationof,the Propeily, the Grantee covenants to comply with 14 C.F.R. Part77 entitled "Objects AffectingNavigable Airspace", under the authority of the Federal Aviation Act of 1958, a.s amended.
I). Ordnance l{a11iUg The Grantee is warne<l ordnance-related activities had occurredon the propelty. llhe Air Force has investigated the propcrty for residual ordnance items and hasdetermined it is unlikely that additional ordnance iterns will be found. However, the Air Forceinforms the recipient that if ordnance items are found during construction activities, they mustcease rvolk and contact the Air Force Real Propefiy Agency or its successor immediately. TheAir Force Real Properly Agency or its successor will provide appropriate support.
VilI. MISCELLANEOUS
Each covenant of this Deed shall be deemed to touch and concern the land and shall runwith the land.
IX. THE FOLLOWII\G trXHIBITS are attached to and made apart of this document:
Exhibit AExhibit R
Legal Description of Property ConveyedSurvey Drawing
Deed Without Warranty Bergstrom 02 Parcel D 56.324 Acres
IN WITNESS WI-IEREOF, the party of the first part has caused this Deed to be executed in itsrame and on its behalf the dav and vear first above written.
LINITED STATES OF AMERICAActing by and through theSecretary of the Air Force
Air Force Real Property Agency
coMMol{wEALTH OF VTRGTNTA)
) SS.:
)COLTNTY OF ARLINGTON
On the fitr auy of$,0t-) ,2004, before me, , theundersigned Notary Public, persondlly appeared Albert F. I-owas, Jr., persodally known to me tobe the person whose narne is subscribed to the foregoing Deed, and personally known to me to bethe Director, Air Force Real Property Agency, and acknowledged that the same was the act and ,
the Air Force.
My commission expires: i
Deed Without Wan'anty Bergstrom 02 Parcel D 56.324 Acres
AECEU'ANCE
'Ilte City of Austin closs here.by accept this Deed and by such acceptance agrees to all theconditions thereof.
By:NamTitl
Certificate of Grantee's Attomev
'2J-t, J)Ar,,r/1. ffieru, acting as Attorney for the City of Austin, herein referred to as the"Grantee" do hereby cerlify: That I have examined the foregoing Deed and the proceedingstakeu by the Grantee relating thereto, and find that the acceptance thereof by the Grantee hasbeen cluly authorized and that the execution thereof is in all respects due and proper and inaccordance with the laws of the State of Texas, and further that, in my opinion, the Deedconstitutes alegal and binding compliance obligation of the Grantee in accordance with the termsthereof.
Datecl ut ,,4u.rl,n _--, Tqnr ,this 22 day of <T Q ,2004.
By:
Executed tbis r43 -day
of (fulrr,
-,2004I
A ^rt
Deed Without Waranty
Title:
Bergstrom 02 Parcel D 56.324 Acres

STATE OF T'EXAS
COLINTY OF TR.A.VIS
)) SS.:
)
on tlre Atu^, .r --{L, 2004,before *",3"1.:::-*:z-&tft!undersigne.d Notary Public+;gnally app"ur"i, t r
' O^ rt n , and known to
me to be the perjion whose name is subscribed to the foregoing Deed, and personally known tome to be the (4e-c*tiue- Vin e.&r<..and acknowledged that the same was the act anddeed of the City of Austin and that he executed the same for the pulposes and considerationstherein expressed and in the capacity stated therein.
C,/q o/,//^shn r'S/,41i,:.:?+ /Vh"ar,)7 Tryy'4,t; n?,,M Fa/7 <-
27/6 t/,r,y' ol 'frxe_f )n n
REBfCCAJAM NAOfi,t{wO,lAiFSPilUilil
l,{cryomber l7,?OOb
After recorded, please return a copy to:
n 757ry
My commission expires: l/- / 7 , 2oo{o
fiqj/,4,
ATTN: Mr;Qfne Aefsky1400 Kgy€lv$.{th FloorArljrrfton, V A 22209 -2802
Deed Without Wananty Bergstrom 02 Parcel D 56.324 Acres

I]XIIIBIT,dI-egal Description of Property ConveS'ed
*,m##*#!ffi:-
I)eed Without Walranty Bergstrom 02 Parcel D 56.324 acres

MACIAS & ASSOCIATES Xnc.LAND SURVEYORS
Exhibit "B" Parcel D
LEGAL DESCRIPTION
LEGAL DESCRIPTTON FOR A 56.324 ACRE (2,453,455 SQUAREFOOT) PARCEL OF LAND OUT OF TF{E SANTIAGO DELVALLE TEN LEAGUE GRANT, ABSTRACT NO. 24, TRAVISCOUNTY, TEXAS, AND BEING OUT OF 4.295.59 ACRE TRACTKNOWN AS "SECOND TRACT" OUT OF TRACT A-2,DESCRIBED IN A DEED TO TT{E {.INITED STATES OFAMERICA RECORDED IN VOLUME 708, PAGE I15, DEEDRECORDS OF TRAVIS COUNTY, TEXAS, ALSO BEING OUT OF4340.26 ACRE TRACT KNOWN AS "SECOND TRACT'' OUT OF-
TRACT A-3, DESCRIBED IN A DEED TO THE UNITED STATESOF AMERICA RECORDED IN VOLUME 709, PAGE 390, DEEDRECOI{DS OF TRAVIS COLTNTY, TEXAS. SA]D 56.324 ACREPARCEL BEING MORE PARTICULARLY DESCRIBED BYMETES AND BOLTNDS AS FOI-LOWS:
BEGINNING at a point at the northeast corner of this parcel, said point being N08o 50'41"W, 4175.24 feet from abronze disc found at the south end of West Runway 17R-35Lin the centerline CN. 100"000.0000 E. 10,000.0000);
THENCE, S16"36'10"W, a distance of 1956.61 feet to an angle point;
THENCE, S33"03'33"W, a distance of 402.95 feet to a point (122058), for thesouthernmost corner of this parcel,
THENCE, N04o38'41"E, a distance of 447 .41 feet to an angle point (I22I43);
TIfENCE, N60"09107"W, a distance of 439.89 feet to an angle point (122144);
THENCE, 576"29' 13"W, a distance of 282.37 feet to an angle point {122145);
TIIENCE, 55lo05'39"W, a distance of 314.58 feet to an angle point (122129);
TIfiNCE, N74"55'10"W, a distance of I43.17 feet to a point on the east right-of-wayline of U.S. Highway No. 183, for the southwest corner of this parcel;
5410 South lst Street . Austin. Texas l8'145 " (512) 442-1875. Fax (5 12) 442-7876 . e-mail: [email protected]

Page2
TIIENCE, Northerly, rvith the east right-olway line of U.S. Flighway No. 183, the
following three (3) courses:
1.) N15o04'51"8, & distance of 490.92 feet to a concrete monument fotrncl for an
angle point,
2) Nl5o07'09"E, a distance of 1330.86 feet to aYz iron rod set for an angle point;
3.) N09o08'42"E, a distance of 391.48 feet to a point for the northwest corner of thisparcel;
THENCE, 573"23'50"E, a distance of 1299.45 feet to the POINT OF BEGINNING,containing 56.324 acres (2,453,455 square feet) of land.
STATE OF TEXAS $
couNTY oF TRAVTS s
I hereby certify that this legatr description and the accornpanying survey plat wereprepared from the results of an actual survey made on the ground under mysupervision and that it is tnte and correct to the best of my knowledge.
MACIAS & ASSOCIATES, INC.
?q7
REFERENCES
Bearings are based on the Bergstrom Airport Coordinate System (BACS). Bronze diskfound at centerline main West Runway is at N, 100,000.00 and E, 10,000.00.
Client: City of AustinProject No.: 15-67-99Filenarnes. Parcel-D.DWG
COA1567PJ).doc
Carmelo L. MaciRegistered Professional I-and Surveyor No.43 33
ffi'ff''mCARMELO L. MACIAS
rt"llil*r.eg's'ii'fiti5

E}iIIXBIT BSurvey l)r"awing
,i,iji',':',' ffi i iri ;xi[#: r;.rffi ',1H.r,
l1;;;rlj H;ii*;,.f,i"t #ii I r,rit:il',, "
I)eed Without Warranty Bersstrom 02 Parcel D 56.324 acr-es

ITCHEGAL
TO ACCOMPANYDESCRIPTIOI{
F-,ARCEL- I)
,*tt"i/i!tti
lpl t
POINT OFBEGINNING
l-lorE\?-.J
_.__. rd_.
IONALFc)RCE nnsr\
AUsitN, tEXAs 78745 pH. (s12)442_782sFAx (s12)442-7876 E]/Alt_t MAC|ASURVEYoEAR1HUNK.Nfl
,T,,,'',,1
|
,9# +
I
I
pl
+i-*zl
alI
I
hl3l
Hq,
I
\c
I
ri,l{'tr19l+-III
-7-t'IA tR Pp R T
01v143.77',
f?
I{-qI,EAG
;qANf iAG0
!ffis'rna
2,4E,3,+b5 S.
- BTRCST
12214r I il p40.26 Hftliir, ,*r, ', I
- | ii v.70e, P.3e0, D.R.TI. I I5 / ril \ ,i L /-: illlb."SO^/rl$ E lf I
YYT.,$- +;Ii \ J,J{6r Fil \Y,g***tti --**_*€) --_*_*#___,2ob' il n-.,u ii \t
ll u.rooooo.$ooo \llj E.10000.0000 r I
ri Fjorzr _dpc rouHo \l1 AT THE sqUTH END 0F ilii wrsr nuNfev rzn_ssl EDRAIYING; PARCEL-D.DWG .SCATT: .|' = +OO' DATE, J-22-99JoB # .15-67-99 DRAWN By: c. LopEZ
MAalaF & ASSOCIATES, tNC.LAND SURVEYORS
Allr6-*.****5410 SOUfi 1ST STREET
'iARMiid i'.1{l9.hl.ffiff.'m
wlT:#Registered ProfessionolLond Surveyor No. 4JJJ
SCALE: 1" = 400'
FTLET} fiIUT} RECORNEDOFFICINL
2oa4 Aus 16 01 :14 Pn 2004156749
BENAVIDESV $38.00DANA DEBEAUVOXR COI.,NTY CLERK
TRAVIS COUNTY TEXAS
,Tililffi '[iilii'll,il",ll ll' titr)c of
'l
('co'| darion
rcpr ocruc r ion. bc..,," "
i], i"rTril,l,f il;ffi,0'., ". o*,
l, l,.?jll:*rr. disco lolcd pul,".,
"r..,q, | | h roc kou is,
i:.113;;ff , :'li:::,,:1:;.ffi il',
u,, r, "
ii, n * i r, "
Chapter 3: Aviation Activity Forecast
AUSTIN-BERGSTROM INTERNATIONAL AIRPORT (ABIA) MASTER PLAN FINAL DRAFT
January 2018 Aviation Activity Forecast Chapter 3 | Page 2
TABLE OF CONTENTS 3 Aviation Activity Forecast ....................................................................................................... 6
Background .................................................................................................................... 6
Historical Aviation Activity ............................................................................................... 7
3.2.1 Passenger Activity ................................................................................................... 7
3.2.2 Cargo Activity ........................................................................................................ 15
3.2.3 Aircraft Operations ................................................................................................ 17
3.2.4 Aircraft Fleet Mix ................................................................................................... 18
Prior Forecast ............................................................................................................... 21
Drivers of Air Traffic ...................................................................................................... 24
3.4.1 Air Service Area .................................................................................................... 24
3.4.2 Economic Base for Air Travel ................................................................................ 26
3.4.3 Population Growth ................................................................................................. 28
3.4.4 Employment .......................................................................................................... 30
3.4.5 Personal Income ................................................................................................... 33
3.4.6 Household Income ................................................................................................ 34
3.4.7 Regional Socio-Economic Comparisons ............................................................... 34
3.4.8 Cost of Living ......................................................................................................... 37
3.4.9 Tourism ................................................................................................................. 38
3.4.10 Price of Air Travel .................................................................................................. 38
3.4.11 Airline Industry Strategy ........................................................................................ 39
3.4.12 Domestic Capacity ................................................................................................ 40
3.4.13 New Scheduled Service ........................................................................................ 40
3.4.14 Price of Fuel .......................................................................................................... 41
3.4.15 Aircraft Trends ....................................................................................................... 42
3.4.16 The Rise in E-Commerce Cargo ........................................................................... 43
3.4.17 General Aviation Industry ...................................................................................... 43
Passenger Activity Forecasts ....................................................................................... 45
3.5.1 2017 Estimate ....................................................................................................... 45
3.5.2 Domestic Passenger Methodology ........................................................................ 46
3.5.3 International Passenger Methodology ................................................................... 48
3.5.4 Forecast Summary ................................................................................................ 49
3.5.5 Forecast Scenarios ............................................................................................... 49

AUSTIN-BERGSTROM INTERNATIONAL AIRPORT (ABIA) MASTER PLAN FINAL DRAFT
January 2018 Aviation Activity Forecast Chapter 3 | Page 3
Air Cargo Throughput Forecasts .................................................................................. 54
3.6.1 Methodology .......................................................................................................... 54
3.6.2 Forecast Summary ................................................................................................ 55
3.6.3 Forecast Scenarios ............................................................................................... 56
Aircraft Operations Forecast ......................................................................................... 59
3.7.1 Passenger Aircraft Operations .............................................................................. 59
3.7.2 All-Cargo Aircraft Operations ................................................................................ 66
3.7.3 Other Aircraft Operations ...................................................................................... 68
3.7.4 Total Aircraft Operations ....................................................................................... 71
3.7.5 Forecast Scenarios ............................................................................................... 73
Peak Period Forecasts ................................................................................................. 76
3.8.1 Monthly Seasonality .............................................................................................. 76
3.8.2 Daily Patterns ........................................................................................................ 77
3.8.3 Design Day Flight Schedules ................................................................................ 78
3.8.4 Hourly Profiles ....................................................................................................... 78
3.8.5 Derivative Forecast ............................................................................................... 80
Comparison to the TAF ................................................................................................ 85
AUSTIN-BERGSTROM INTERNATIONAL AIRPORT (ABIA) MASTER PLAN FINAL DRAFT
January 2018 Aviation Activity Forecast Chapter 3 | Page 4
TABLE OF EXHIBITS Exhibit 3.2-1: Historical Passenger Volumes ............................................................................. 8
Exhibit 3.2-2: Passenger Airline Market Share ........................................................................ 10
Exhibit 3.2-3: Map of Nonstop Domestic Destinations ............................................................. 11
Exhibit 3.2-4: Introduction of International Destinations .......................................................... 12
Exhibit 3.2-5: Map of Nonstop International Destinations ........................................................ 13
Exhibit 3.2-6: Historical Air Cargo Throughput ........................................................................ 15
Exhibit 3.2-7: Belly Cargo/Freighter Split ................................................................................. 16
Exhibit 3.2-8: Scheduled Passenger Aircraft Operations by Aircraft Type ............................... 20
Exhibit 3.3-1: 2003 Master Plan Enplaned Passenger Forecast Comparison ......................... 22
Exhibit 3.3-2: 2003 Master Plan Enplaned Air Cargo Forecast Comparison ........................... 23
Exhibit 3.3-3: 2003 Master Plan Aircraft Operations Forecast Comparison ............................ 23
Exhibit 3.4-1: Air Service Area Map ......................................................................................... 25
Exhibit 3.4-2: United States Aviation System Shocks & Recoveries ....................................... 27
Exhibit 3.4-3: Historical and Forecast Gross Domestic/Regional Product ............................... 28
Exhibit 3.4-4: Net Migration for 50 Largest MSAs .................................................................... 29
Exhibit 3.4-5: Historical and Forecast Employment ................................................................. 32
Exhibit 3.4-6: Historical and Forecast Per Capita Personal Income ........................................ 33
Exhibit 3.4-7: Regional Socio-Economic Comparisons ........................................................... 35
Exhibit 3.4-8: Cost of Living Index ........................................................................................... 37
Exhibit 3.4-9: Crude Oil Prices ................................................................................................. 42
Exhibit 3.5-1: Domestic O&D Enplaned Passenger Regression Model ................................... 47
Exhibit 3.5-2: Comparison of Enplaned Passenger Forecast Scenarios ................................. 52
Exhibit 3.6-1: Comparison of Cargo Throughput Forecast Scenarios ..................................... 57
Exhibit 3.6-2: ............................................................................................................................... 57
Exhibit 3.7-1: Domestic Passengers Per Operation Assumptions ........................................... 62
Exhibit 3.7-2: International Passengers Per Operation Assumptions ...................................... 63
Exhibit 3.7-3: Relationship of GA Operations at ABIA to U.S. Piston Hours Flown ................. 70
Exhibit 3.7-4: Comparison of Aircraft Operations Forecast Scenarios ..................................... 74
Exhibit 3.8-1: Monthly Enplaned Passengers .......................................................................... 76
Exhibit 3.8-2: Monthly Aircraft Operations ............................................................................... 77
Exhibit 3.8-3: Rolling 60-Minute Seating Profile ...................................................................... 79
Exhibit 3.8-4: Rolling 60-Minute Aircraft Operations Profile ..................................................... 80
AUSTIN-BERGSTROM INTERNATIONAL AIRPORT (ABIA) MASTER PLAN FINAL DRAFT
January 2018 Aviation Activity Forecast Chapter 3 | Page 5
TABLE OF TABLES Table 3.2-1: Historical Passenger Volumes ............................................................................. 9
Table 3.2-2: Top 25 O&D Markets ......................................................................................... 14
Table 3.2-3: Historical Aircraft Operations ............................................................................. 19
Table 3.4-1: Austin MSA Population Forecasts ..................................................................... 30
Table 3.4-2: Austin Largest Employers .................................................................................. 31
Table 3.4-3: Airline Bankruptcy Status ................................................................................... 39
Table 3.5-1: Enplaned Passenger Forecast Results ............................................................. 50
Table 3.5-2: Summary of Enplaned Passenger Forecast Scenarios ..................................... 53
Table 3.6-1: Air Cargo Throughput Forecast Results (Millions of Pounds) ............................ 55
Table 3.6-2: Summary of Cargo Throughput Forecast Scenarios ......................................... 58
Passenger Aircraft Operations By Segment ...................................................... 64
Domestic Passenger Fleet Mix .......................................................................... 65
International Passenger Fleet Mix ..................................................................... 66
All-Cargo Fleet Mix ............................................................................................ 68
Air Taxi Fleet Mix ............................................................................................... 69
General Aviation Fleet Mix ................................................................................. 70
Total Aircraft Operations Forecast ..................................................................... 72
Summary of Aircraft Operations Forecast Scenarios ......................................... 75
Table 3.8-1: Peak Period Aircraft Operations Forecast ......................................................... 82
Table 3.8-2: Peak Period Passengers ................................................................................... 84
Table 3.9-1: FAA TAF Forecast Comparison – Appendix B .................................................. 87
Table 3.9-2: FAA TAF Forecast Comparison – Appendix B .................................................. 88

AUSTIN-BERGSTROM INTERNATIONAL AIRPORT (ABIA) MASTER PLAN FINAL DRAFT
January 2018 Aviation Activity Forecast Chapter 3 | Page 6
3 AVIATION ACTIVITY FORECAST
Background This chapter presents comprehensive forecasts of aviation activity (i.e., demand) at the Austin-Bergstrom International Airport (ABIA). The forecasts were developed as part of the Master Plan presented herein as a basis for determining future facility requirements at ABAI. The aviation activity forecast includes annual projections for enplaned passengers, air cargo throughput, and aircraft operations through 2037 with a base year of 2016. Projections for passengers and aircraft operations were also developed on monthly, daily, and peak hour levels. Additional details of the forecasts are presented for the following key future demand years: 2017, 2019, 2021, 2024, and 2037. The forecasts presented herein represent market-driven demand for air services. The forecasts are unconstrained, and as such, do not take facility constraints or other limiting factors into consideration. In other words, for the purposes of estimated future demand, the forecasts assume facilities can be provided to meet demand. All years discussed in the text, tables, and exhibits are expressed in calendar years unless otherwise stated.
AUSTIN-BERGSTROM INTERNATIONAL AIRPORT (ABIA) MASTER PLAN FINAL DRAFT
January 2018 Aviation Activity Forecast Chapter 3 | Page 7
Historical Aviation Activity This section provides a summary of the historical activity levels and the current passenger air service at ABIA. The information in this section provides a context for the forecast. Although the past is not a perfect predictor of the future, an analysis of historical data provides the opportunity to understand factors that have affected traffic and how those factors may influence the forecast in the future.
3.2.1 Passenger Activity
3.2.1.1 Passenger Activity Trends ABIA is classified by the FAA as a medium-hub airport1 based on its percentage of nationwide enplaned passengers2 and is the fifth busiest airport in Texas. Passenger traffic at Austin airports have followed a fairly consistent upward trend with some exceptions as demonstrated in Exhibit 3.2-1. Table 3.2-1 provides the passenger volumes by segment (domestic and international) since 1993. The key factors behind the changes in passenger volumes are discussed below:
1993-1998: Passenger traffic in the City of Austin was handled at the Robert Mueller Municipal Airport (RMMA). During this time, passenger traffic increased at 5.4 percent per annum despite being constrained as a result of its inability to expand due to its centralized location in the City of Austin.
1999-2000: In May 1999, the former Bergstrom Air Force Base3 was reopened for passenger traffic as ABIA to replace RMMA. The shift of passenger traffic to ABIA had a significant impact as passenger volumes increased by 9.9 percent in 1999 and 15.0 percent in 2000.
2001-2003: The September 11, 2001 terrorist attacks combined with an economic slow-down, particularity within the Austin region, resulted in a decrease in passenger traffic for three sequential years.
2004-2008: The economic health of the region improved over this time which aided in increasing passenger volumes at an average annual growth rate (AAGR) of 7.7 percent.
1 Federal Aviation Administration, Report to Congress: National Plan of Integrated Airport Systems
(NPIAS) 2017-2021, September 30, 2016. 2 To be classified as a medium-hub airport, the airport must have at least 0.25 percent but less
than 1 percent of the national annual enplaned passengers. 3 Bergstrom Air Forecast Base was decommissioned in 1993 as part of the military’s Base
Realignment Closure (BRAC) Commission.

AUSTIN-BERGSTROM INTERNATIONAL AIRPORT (ABIA) MASTER PLAN FINAL DRAFT
January 2018 Aviation Activity Forecast Chapter 3 | Page 8
Exhibit 3.2-1: Historical Passenger Volumes
Sources: City of Austin Aviation Department, Austin-Bergstrom International Airport Aviation Activity Reports; City of Austin
Financial Services, Comprehensive Annual Financial Reports; Airports Council International, World Airport Report.
2009: In 2009, the global economic recession combined with rising fuel prices had a
significant impact on operations at most of the airports in the United States. Airlines, determined to retain economic viability, reduced operations on lower performing routes. As a result, passengers at ABIA declined 9.1 percent from 2008 to 2009.
2010-2016: The region was able to recover quickly from the economic recession and has continued to grow in terms of its population and economy. As such, passenger volumes at ABIA have grown at an AAGR of 6.1 percent since 2009. In 2016, ABIA reported a record 12.4 million passengers.
2000Airport reported
7.6 million passengers before declining the
next 2 years
2008Airport reported
9.0 million passengers prior to the start of the
recession
0
2
4
6
8
10
12
14
1993 1995 1997 1999 2001 2003 2005 2007 2009 2011 2013 2015
Calendar Year
Annual Passengers(in millions)
International
Domestic
2016Airport reported a record 12.4 million passengers
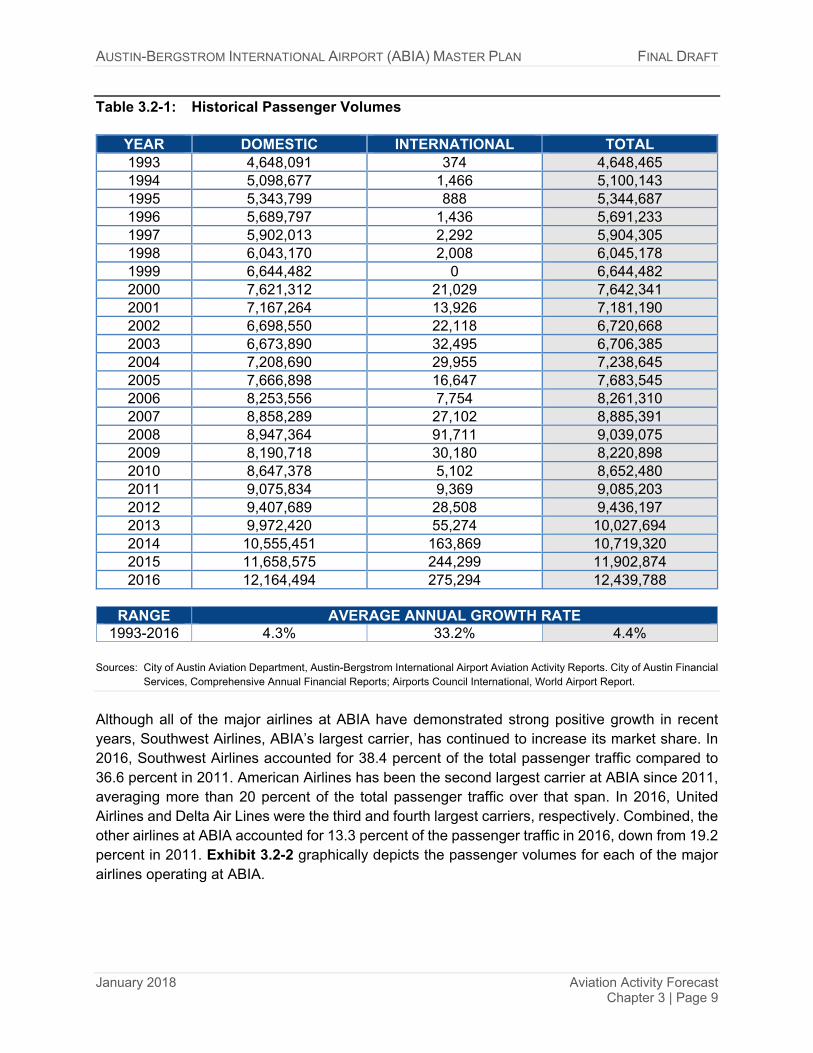
AUSTIN-BERGSTROM INTERNATIONAL AIRPORT (ABIA) MASTER PLAN FINAL DRAFT
January 2018 Aviation Activity Forecast Chapter 3 | Page 9
Table 3.2-1: Historical Passenger Volumes
YEAR DOMESTIC INTERNATIONAL TOTAL 1993 4,648,091 374 4,648,465 1994 5,098,677 1,466 5,100,143 1995 5,343,799 888 5,344,687 1996 5,689,797 1,436 5,691,233 1997 5,902,013 2,292 5,904,305 1998 6,043,170 2,008 6,045,178 1999 6,644,482 0 6,644,482 2000 7,621,312 21,029 7,642,341 2001 7,167,264 13,926 7,181,190 2002 6,698,550 22,118 6,720,668 2003 6,673,890 32,495 6,706,385 2004 7,208,690 29,955 7,238,645 2005 7,666,898 16,647 7,683,545 2006 8,253,556 7,754 8,261,310 2007 8,858,289 27,102 8,885,391 2008 8,947,364 91,711 9,039,075 2009 8,190,718 30,180 8,220,898 2010 8,647,378 5,102 8,652,480 2011 9,075,834 9,369 9,085,203 2012 9,407,689 28,508 9,436,197 2013 9,972,420 55,274 10,027,694 2014 10,555,451 163,869 10,719,320 2015 11,658,575 244,299 11,902,874 2016 12,164,494 275,294 12,439,788
RANGE AVERAGE ANNUAL GROWTH RATE
1993-2016 4.3% 33.2% 4.4% Sources: City of Austin Aviation Department, Austin-Bergstrom International Airport Aviation Activity Reports. City of Austin Financial
Services, Comprehensive Annual Financial Reports; Airports Council International, World Airport Report.
Although all of the major airlines at ABIA have demonstrated strong positive growth in recent years, Southwest Airlines, ABIA’s largest carrier, has continued to increase its market share. In 2016, Southwest Airlines accounted for 38.4 percent of the total passenger traffic compared to 36.6 percent in 2011. American Airlines has been the second largest carrier at ABIA since 2011, averaging more than 20 percent of the total passenger traffic over that span. In 2016, United Airlines and Delta Air Lines were the third and fourth largest carriers, respectively. Combined, the other airlines at ABIA accounted for 13.3 percent of the passenger traffic in 2016, down from 19.2 percent in 2011. Exhibit 3.2-2 graphically depicts the passenger volumes for each of the major airlines operating at ABIA.

AUSTIN-BERGSTROM INTERNATIONAL AIRPORT (ABIA) MASTER PLAN FINAL DRAFT
January 2018 Aviation Activity Forecast Chapter 3 | Page 10
Exhibit 3.2-2: Passenger Airline Market Share
Note: Other airlines include the following: JetBlue Airways, Alaska Airlines, Frontier Airlines, Allegiant Air, and Foreign Flag
carriers. Source: City of Austin Aviation Department, Austin-Bergstrom International Airport Aviation Activity Reports.
3.2.1.2 Passenger Air Service In 2017, airlines have scheduled service to 58 domestic destinations4, including 28 of the 30 large hub airports in the United States. Exhibit 3.2-3 provides a map of the nonstop domestic destinations that have scheduled service in 2017.
4 These destinations include year-round and seasonal service.
Southwest
American
United
DeltaOther
0
1
2
3
4
5
6
2011 2012 2013 2014 2015 2016Calendar Year
Annual Passengers(in millions)
2016Southwest
accounted for 38.4% of Total Traffic.
2011Southwestaccounted for 36.6% of Total Traffic.
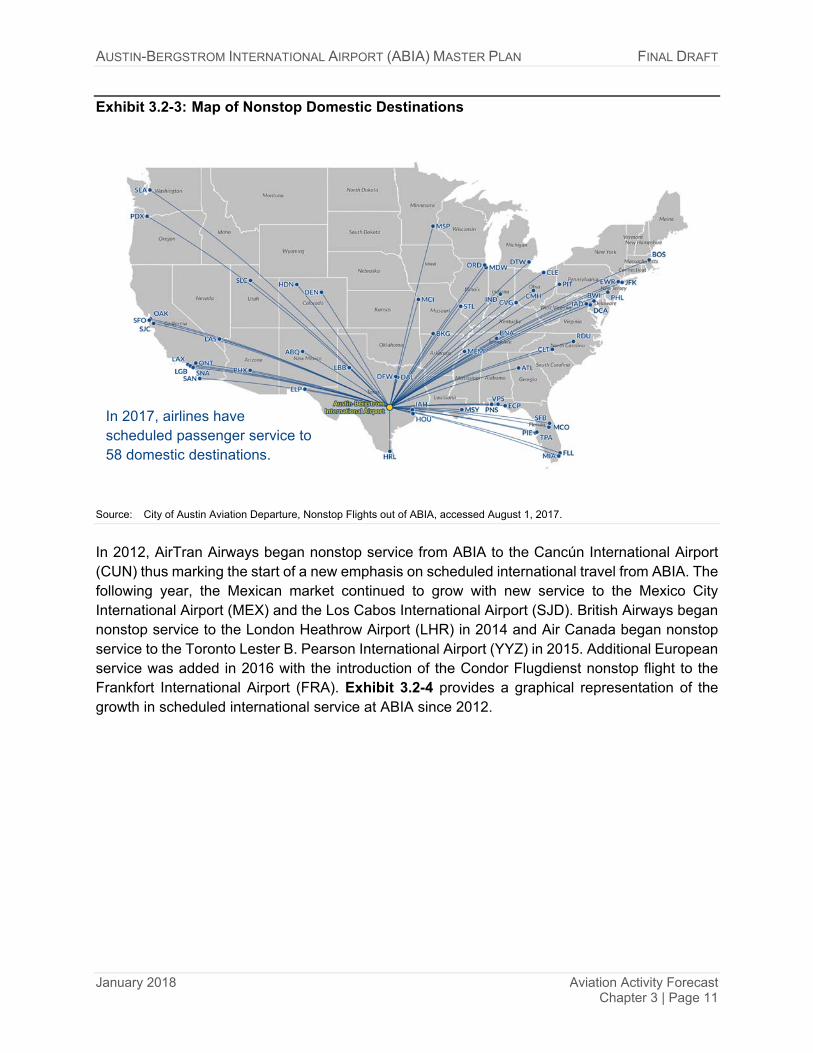
AUSTIN-BERGSTROM INTERNATIONAL AIRPORT (ABIA) MASTER PLAN FINAL DRAFT
January 2018 Aviation Activity Forecast Chapter 3 | Page 11
Exhibit 3.2-3: Map of Nonstop Domestic Destinations
Source: City of Austin Aviation Departure, Nonstop Flights out of ABIA, accessed August 1, 2017.
In 2012, AirTran Airways began nonstop service from ABIA to the Cancún International Airport (CUN) thus marking the start of a new emphasis on scheduled international travel from ABIA. The following year, the Mexican market continued to grow with new service to the Mexico City International Airport (MEX) and the Los Cabos International Airport (SJD). British Airways began nonstop service to the London Heathrow Airport (LHR) in 2014 and Air Canada began nonstop service to the Toronto Lester B. Pearson International Airport (YYZ) in 2015. Additional European service was added in 2016 with the introduction of the Condor Flugdienst nonstop flight to the Frankfort International Airport (FRA). Exhibit 3.2-4 provides a graphical representation of the growth in scheduled international service at ABIA since 2012.
In 2017, airlines have scheduled passenger service to 58 domestic destinations.

AUSTIN-BERGSTROM INTERNATIONAL AIRPORT (ABIA) MASTER PLAN FINAL DRAFT
January 2018 Aviation Activity Forecast Chapter 3 | Page 12
Exhibit 3.2-4: Introduction of International Destinations
Source: OAG Aviation Worldwide Ltd, OAG Schedules Analyser.
In 2017, airlines have scheduled service to six international destinations with an additional three destinations currently announced for 2018.5 Exhibit 3.2-5 provides a map of the nonstop international destinations that are served by scheduled service in 2017 with the additional service currently announced for 2018.
5 Current as of August 3, 2017.
CUN
CUNMEXSJD
CUNMEXSJD
CUNMEXSJD
CUNMEXSJDGDL
CUNMEXSJDGDL
YYZYYZ
YYZ
LHR
LHR
LHRFRA
LHRFRA
0
200
400
600
800
1,000
1,200
1,400
1,600
1,800
2012 2013 2014 2015 2016 2017
Calendar Year
Annual Scheduled Departures
Europe
Canada
Mexico
2012 AirTran
starts service to
CUN
2014 British Airways starts
service to LHR
2015 Air Canada starts
service to YYZ
2016 Condor starts
service to FRA

AUSTIN-BERGSTROM INTERNATIONAL AIRPORT (ABIA) MASTER PLAN FINAL DRAFT
January 2018 Aviation Activity Forecast Chapter 3 | Page 13
Exhibit 3.2-5: Map of Nonstop International Destinations
Note: Asterisk (*) indicates new service announced for 2018. Special service to AMS begins March 8, 2018. Service to LGW begins March 27, 2018. Seasonal service to PUJ begins May 28, 2018. Source: City of Austin Aviation Departure, Nonstop Flights out of ABIA, accessed August 1, 2017.
3.2.1.3 Top Passenger Markets An overwhelming majority of the passenger traffic at ABIA is origin and destination (O&D), or local, passengers versus connecting passengers. Table 3.2-2 shows the share of O&D passengers for the top 25 O&D markets for 2016. The top 25 markets accounted for a combined share of 68.9 percent of the O&D passengers at ABIA. The New York / Newark region is the largest O&D market at ABIA with 7.3 percent of the O&D enplanements. All of the top 25 markets have nonstop service from ABIA to at least one airport in the market.
In 2017, airlines have scheduled passenger service to 6 international destinations with
3 new destinations already announced for 2018.

AUSTIN-BERGSTROM INTERNATIONAL AIRPORT (ABIA) MASTER PLAN FINAL DRAFT
January 2018 Aviation Activity Forecast Chapter 3 | Page 14
Table 3.2-2: Top 25 O&D Markets
MARKET AIRPORTS SHARE OF ABIA
O&D ENPLANEMENTS New York / Newark JFK / EWR / LGA / ISP / HPN 7.3% Los Angeles Basin LAX / BUR / ONT / LGB / SNA 6.5% San Francisco Bay Area SFO / OAK / SJC 6.2% Denver DEN 4.7% Chicago ORD / MDW 4.6% Washington / Baltimore DCA / IAD / BWI 3.9% Las Vegas LAS 3.6% Dallas / Ft. Worth DFW / DAL 3.6% Atlanta ATL 2.9% Orlando / Sanford MCO / SFB 2.8% South Florida FLL / MIA / PBI 2.6% Boston BOS 2.6% Seattle / Tacoma SEA 2.5% Phoenix PHX 2.2% San Diego SAN 1.5% Philadelphia PHL 1.4% Minneapolis MSP 1.3% Portland PDX 1.2% Nashville BNA 1.1% El Paso ELP 1.1% Detroit DTW 1.1% New Orleans MSY 1.1% Salt Lake City SLC 1.0% St. Louis STL 1.0% London LHR 0.9% Top 25 Markets 68.9% Other Markets 31.1% Total 100.0%
Note: Nonstop service is available to at least one airport in all top 25 O&D markets. Source: U.S. Department of Transportation, Air Passenger Origin-Destination Survey.
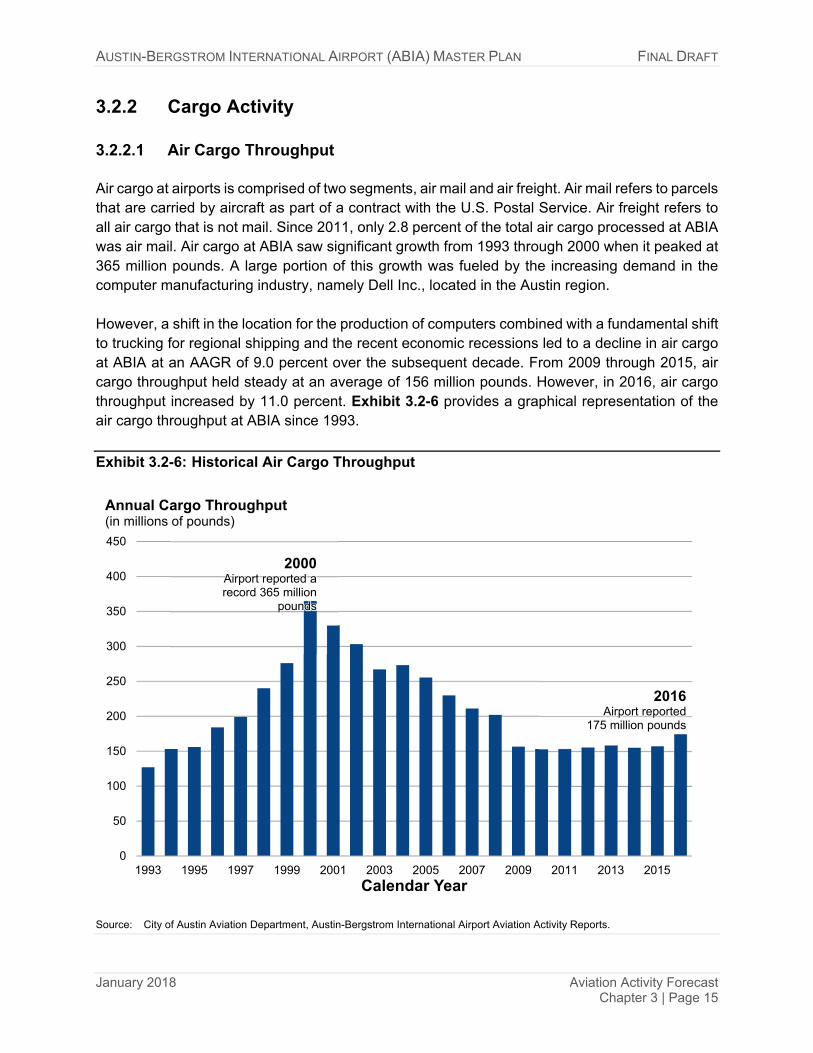
AUSTIN-BERGSTROM INTERNATIONAL AIRPORT (ABIA) MASTER PLAN FINAL DRAFT
January 2018 Aviation Activity Forecast Chapter 3 | Page 15
3.2.2 Cargo Activity
3.2.2.1 Air Cargo Throughput Air cargo at airports is comprised of two segments, air mail and air freight. Air mail refers to parcels that are carried by aircraft as part of a contract with the U.S. Postal Service. Air freight refers to all air cargo that is not mail. Since 2011, only 2.8 percent of the total air cargo processed at ABIA was air mail. Air cargo at ABIA saw significant growth from 1993 through 2000 when it peaked at 365 million pounds. A large portion of this growth was fueled by the increasing demand in the computer manufacturing industry, namely Dell Inc., located in the Austin region. However, a shift in the location for the production of computers combined with a fundamental shift to trucking for regional shipping and the recent economic recessions led to a decline in air cargo at ABIA at an AAGR of 9.0 percent over the subsequent decade. From 2009 through 2015, air cargo throughput held steady at an average of 156 million pounds. However, in 2016, air cargo throughput increased by 11.0 percent. Exhibit 3.2-6 provides a graphical representation of the air cargo throughput at ABIA since 1993.
Exhibit 3.2-6: Historical Air Cargo Throughput
Source: City of Austin Aviation Department, Austin-Bergstrom International Airport Aviation Activity Reports.
0
50
100
150
200
250
300
350
400
450
1993 1995 1997 1999 2001 2003 2005 2007 2009 2011 2013 2015
Calendar Year
Annual Cargo Throughput(in millions of pounds)
2016Airport reported
175 million pounds
2000Airport reported a record 365 million
pounds

AUSTIN-BERGSTROM INTERNATIONAL AIRPORT (ABIA) MASTER PLAN FINAL DRAFT
January 2018 Aviation Activity Forecast Chapter 3 | Page 16
3.2.2.2 Mode of Transportation There are two shipping methods for transporting air cargo: (1) in the cargo compartment (belly) of commercial passenger aircraft or (2) aboard dedicated all-cargo aircraft (freighters). Most passenger airlines accommodate air cargo as a byproduct of their primary activity of carrying passengers. Cargo fills belly space in passenger aircraft that would otherwise be empty. The incremental cost of transporting cargo in passenger aircraft is negligible and includes only ground handling expenses and a modest increase in fuel consumption. A majority of cargo processed at ABIA, 86.5 percent since 2011, has been handled by all-cargo carriers, primarily Federal Express (FedEx). Exhibit 3.2-7 displays the historical belly cargo/freighter split at ABIA. The decrease in freighter share from 2013 to 2014 is the result of increased belly cargo to international destinations coinciding with the start of the new transoceanic international service to LHR. In 2016, FedEx, including Baron Aviation Services6, processed more than two-thirds of all the air cargo handled by all-cargo carriers while the United Postal Service (UPS), the second largest all-cargo carrier at ABIA, processed 18.5 percent.
Exhibit 3.2-7: Belly Cargo/Freighter Split
Source: City of Austin Aviation Department, Austin-Bergstrom International Airport Aviation Activity Reports.
6 Baron Aviation Services operates as a feeder for FedEx at ABIA.
90.1% 90.7%
92.5%
86.1% 85.7%
87.6%
80%
82%
84%
86%
88%
90%
92%
94%
96%
98%
100%
2011 2012 2013 2014 2015 2016
Calendar Year
Share of Cargo Volume Handled by Freighter(in percent)
86.5%Average Percent of Cargo
handled by Freighter Aircraft Since 2011

AUSTIN-BERGSTROM INTERNATIONAL AIRPORT (ABIA) MASTER PLAN FINAL DRAFT
January 2018 Aviation Activity Forecast Chapter 3 | Page 17
3.2.3 Aircraft Operations An aircraft operation consists of either a takeoff or landing. For the purpose of developing the forecasts, aircraft operations were classified into five key categories: (1) passenger; (2) freighter; (3) air taxi; (4) general aviation; and (5) military. Passenger aircraft operations refers to operations handled by airlines with scheduled service, i.e. certified as a scheduled air carrier by the FAA under Part 121.7 Unsurprisingly, passenger aircraft operations have closely reflected the changes in passenger activity. This includes a slight decline from 2000 through 2002, steady growth through 2007 before declining due to the recession, and steady growth since 2009. In 2000, all-cargo, or freighter, activity reached 16,196 aircraft operations. However, freighter aircraft operations declined significantly over the subsequent years and by 2012 freighter aircraft operations were nearly a third of the number of aircraft operations in 2000. Since 2012, freighter aircraft operations have remained relatively steady. Air taxi represents chartered aircraft operated by companies that operate under Part 918 (i.e., not certificated as a scheduled air carrier by the FAA and not covered under Part 121). Business charters at ABIA, such as NetJets, provide ad-hoc service utilizing mostly business jet aircraft. These airlines account for a majority of the air taxi service at ABIA. Air taxi traffic at ABIA steadily increased through 2005, but in 2006 there was a sharp decline in traffic. Air taxi aircraft operations recovered quickly over the next two years before declining 39.1 percent in 2009 as a result of the global recession. ABIA has yet to recover the air taxi activity experienced prior to the recession. General Aviation (GA) aircraft operations represent all civil operations not classified as commercial, i.e. passenger, freighter, or air taxi. GA aircraft operations can be further classified as either local or itinerant.9 From 1993 through 2002, GA averaged nearly 95,000 aircraft operations at ABIA despite a significant decline in 1999 coinciding with the opening of the new airport. GA traffic at ABIA has declined at a steady pace since 2002. The decline is representative of most of the GA traffic at commercial airports throughout the United States.
7 14 Code of Federal Regulations Part 121 8 14 Code of Federal Regulations Part 91 9 Local operations include aircraft operating in the traffic pattern or within sight of the tower, or
aircraft known to be departing or arriving from flight in local practice areas, or aircraft executing practice instrument approaches at the airport. Itinerant operations are those not classified as local, i.e. operations of aircraft going from one airport to another.

AUSTIN-BERGSTROM INTERNATIONAL AIRPORT (ABIA) MASTER PLAN FINAL DRAFT
January 2018 Aviation Activity Forecast Chapter 3 | Page 18
Military aircraft operations represent operations conducted by military or government aircraft. Military operations can be further classified as either local or itinerant. For most of the past decade, military aircraft operations have been relatively steady. However, in each year over the past three years, military aircraft operations have increased at double-digit rates. This growth in military operations was the direct result of the opening of the Armed Forces Reserve Center located on the south side of ABIA. A summary of the aircraft operations by classification is provided in Table 3.2-3.
3.2.4 Aircraft Fleet Mix
3.2.4.1 Passenger Aircraft Operations Airlines providing scheduled passenger air service at ABIA deploy a predominately narrow-body fleet, particularly utilizing variants of the Boeing 737 aircraft. In 2016, 79.2 percent of all scheduled passenger service utilized narrow-body aircraft compared to 20.1 percent regional aircraft and 0.7 percent wide-body aircraft. Exhibit 3.2-8 graphically depicts the number of scheduled passenger aircraft operations by aircraft type for 2016. For domestic flights in 2016, 80.3 percent of the scheduled flights utilized narrow-body aircraft, half of which were variants of the Boeing 737 aircraft. This is unsurprising considering the Boeing 737-700 is the most common aircraft in Southwest Airlines’ fleet, ABIA’s largest airline, and significant portions of American Airlines’ and United Airlines’ fleets include variants of the aircraft. Nearly all of the small regional aircraft have been phased out at ABIA as the major airlines have opted for using the large regional aircraft because these aircraft are more cost-efficient. Texas Sky, a regional charter brand of Public Charters, Inc., utilizes the British Aerospace Jetstream 32 and 41 aircraft for their intrastate service and accounted for three-fourths of the small regional aircraft operations in 2016. Wide-body aircraft, like variants of the Boeing 787 and the Boeing 777 aircraft, are exclusively used for transoceanic international travel which accounted for 31.6 percent of scheduled international flights in 2016. Flights to and from Canada almost exclusively use large regional aircraft such as the Embraer 175. Latin American service, including Mexico, utilizes a mix of large regional and narrow-body aircraft.
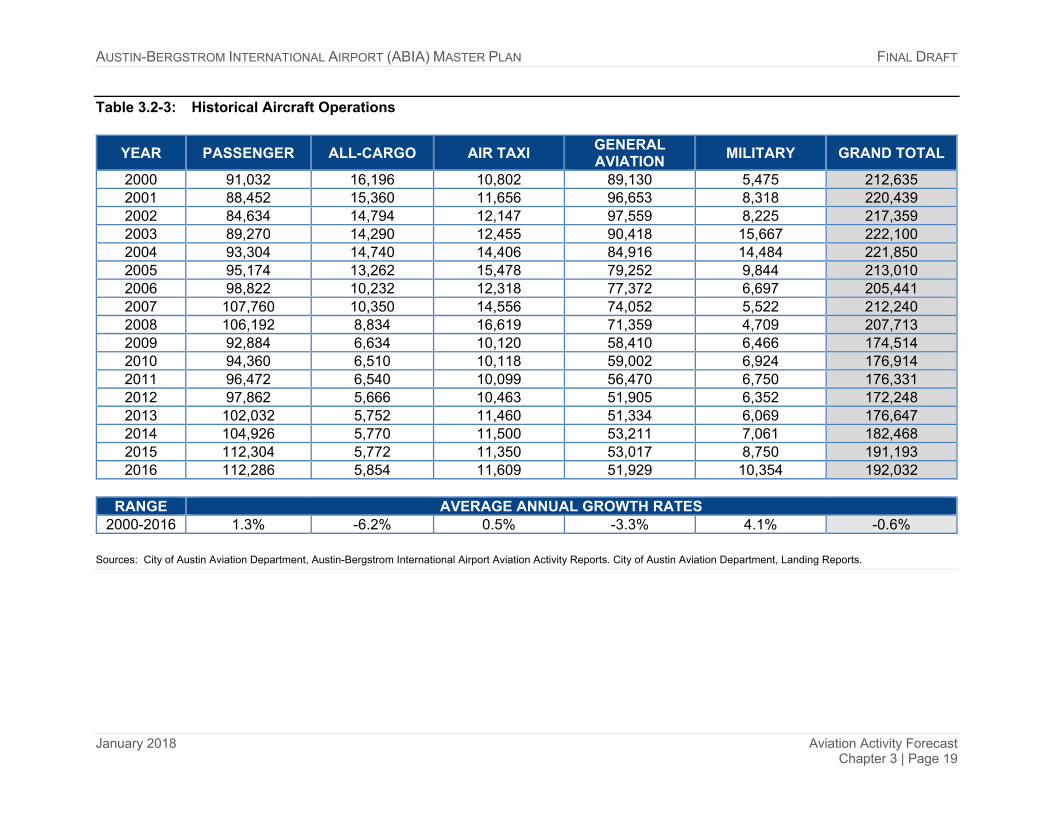
AUSTIN-BERGSTROM INTERNATIONAL AIRPORT (ABIA) MASTER PLAN FINAL DRAFT
January 2018 Aviation Activity Forecast Chapter 3 | Page 19
Table 3.2-3: Historical Aircraft Operations
YEAR PASSENGER ALL-CARGO AIR TAXI GENERAL AVIATION
MILITARY GRAND TOTAL
2000 91,032 16,196 10,802 89,130 5,475 212,635 2001 88,452 15,360 11,656 96,653 8,318 220,439 2002 84,634 14,794 12,147 97,559 8,225 217,359 2003 89,270 14,290 12,455 90,418 15,667 222,100 2004 93,304 14,740 14,406 84,916 14,484 221,850 2005 95,174 13,262 15,478 79,252 9,844 213,010 2006 98,822 10,232 12,318 77,372 6,697 205,441 2007 107,760 10,350 14,556 74,052 5,522 212,240 2008 106,192 8,834 16,619 71,359 4,709 207,713 2009 92,884 6,634 10,120 58,410 6,466 174,514 2010 94,360 6,510 10,118 59,002 6,924 176,914 2011 96,472 6,540 10,099 56,470 6,750 176,331 2012 97,862 5,666 10,463 51,905 6,352 172,248 2013 102,032 5,752 11,460 51,334 6,069 176,647 2014 104,926 5,770 11,500 53,211 7,061 182,468 2015 112,304 5,772 11,350 53,017 8,750 191,193 2016 112,286 5,854 11,609 51,929 10,354 192,032
RANGE AVERAGE ANNUAL GROWTH RATES
2000-2016 1.3% -6.2% 0.5% -3.3% 4.1% -0.6% Sources: City of Austin Aviation Department, Austin-Bergstrom International Airport Aviation Activity Reports. City of Austin Aviation Department, Landing Reports.
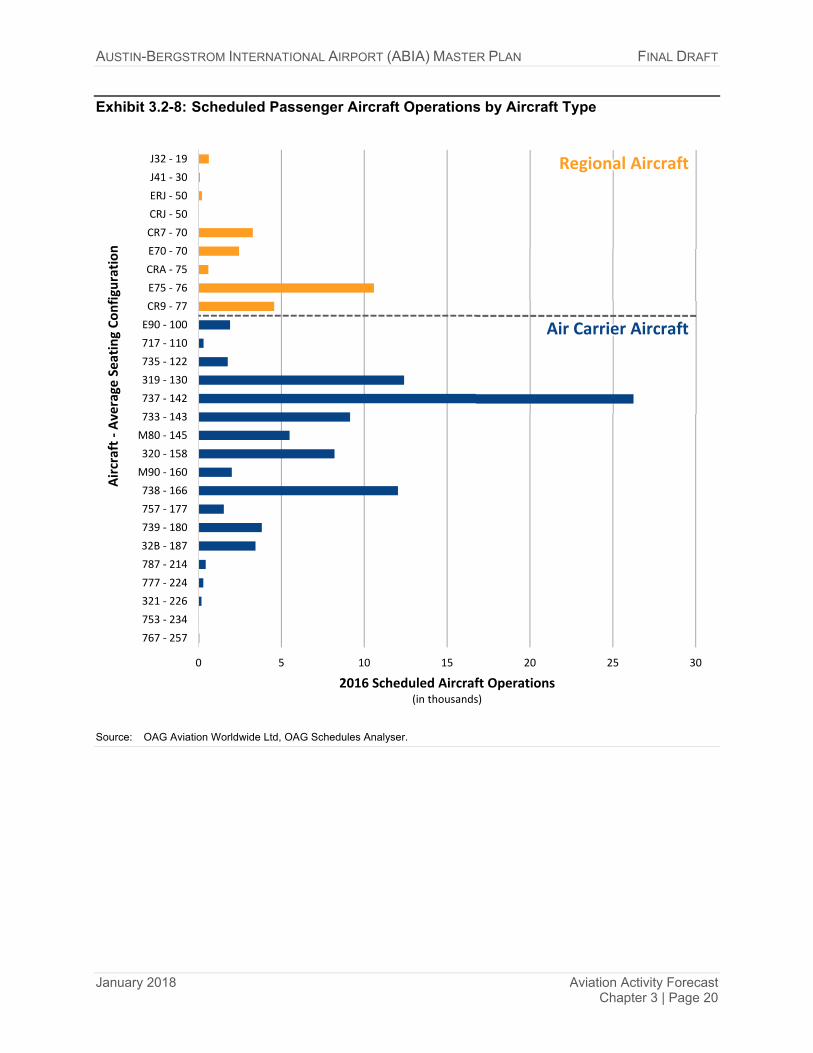
AUSTIN-BERGSTROM INTERNATIONAL AIRPORT (ABIA) MASTER PLAN FINAL DRAFT
January 2018 Aviation Activity Forecast Chapter 3 | Page 20
Exhibit 3.2-8: Scheduled Passenger Aircraft Operations by Aircraft Type
Source: OAG Aviation Worldwide Ltd, OAG Schedules Analyser.
0 5 10 15 20 25 30
767 ‐ 257
753 ‐ 234
321 ‐ 226
777 ‐ 224
787 ‐ 214
32B ‐ 187
739 ‐ 180
757 ‐ 177
738 ‐ 166
M90 ‐ 160
320 ‐ 158
M80 ‐ 145
733 ‐ 143
737 ‐ 142
319 ‐ 130
735 ‐ 122
717 ‐ 110
E90 ‐ 100
CR9 ‐ 77
E75 ‐ 76
CRA ‐ 75
E70 ‐ 70
CR7 ‐ 70
CRJ ‐ 50
ERJ ‐ 50
J41 ‐ 30
J32 ‐ 19
2016 Scheduled Aircraft Operations(in thousands)
Aircraft ‐Average
Seating Configuration
Regional Aircraft
Air Carrier Aircraft

AUSTIN-BERGSTROM INTERNATIONAL AIRPORT (ABIA) MASTER PLAN FINAL DRAFT
January 2018 Aviation Activity Forecast Chapter 3 | Page 21
Prior Forecast In 1993, an Airport Master Plan was completed to guide the process of converting the Bergstrom Air Force Base into a replacement of the RMMA. However, actual traffic levels grew at a rate significantly higher than originally forecasted for the new airport. As a result, an update to the ABIA Master Plan was completed in October 2003 by P&D Aviation. The ABIA Master Plan Update (2003 Master Plan) included an updated forecast of aviation demand. The forecast focused heavily on the demand for air passenger service provided by the passenger airlines and the demand for air cargo service, but also included activity for non-commercial operations. The forecast included annual volumes for passengers, air cargo, based GA aircraft, aircraft operations, and surface transportation. The 2003 Master Plan forecast used 2000 as the base year and projected the demand levels for the years 2005, 2010, and 2020. A range of forecasts was developed to account for the uncertainty associated with a twenty-year planning horizon: High, Medium, and Low Growth forecasts. The High Growth forecast was selected as the basis for determining future facility requirements. As such, comparisons made in this document will reflect the High Growth forecast unless otherwise noted. The enplaned passengers forecast in the 2003 Master Plan was developed utilizing a multivariate linear regression model. The model used the Austin region’s population, per capita personal income (PCPI), and the average cost of air travel as measured in yield (revenue per revenue passenger mile). The forecast estimated that enplaned passengers at ABIA would increase from 3.7 million in 2000 to 9.2 million by 2020, representing an AAGR of 4.6 percent. Using linear interpolation, it was determined that the forecast would have estimated approximately 8.1 million enplaned passengers in 2016. The actual number of enplaned passengers at ABIA in 2016 was 6.2 million, 29.7 percent lower than the forecast. The large reason for this discrepancy was the forecast did not foresee the decline in passenger volume in 2002 resulting from the September 11, 2001 terrorist attacks combined with the economic slow-down. In 2003, a financial feasibility analysis was prepared for the Master Plan. The analysis included an updated enplaned passenger forecast with a base year of fiscal year (FY) 2002 to account for the decline in passengers over the previous two years. The updated forecast applied the growth rates from the High Growth forecast to project the enplaned passengers. The update estimated enplaned passengers would increase from 3.4 million in FY2002 to 6.3 million in FY2016, 1.2 percent more than the actual for calendar year 2016. Exhibit 3.3-1 provides a comparison of actual enplaned passengers to the forecast provided in the 2003 Master Plan and the subsequent financial feasibility analysis.
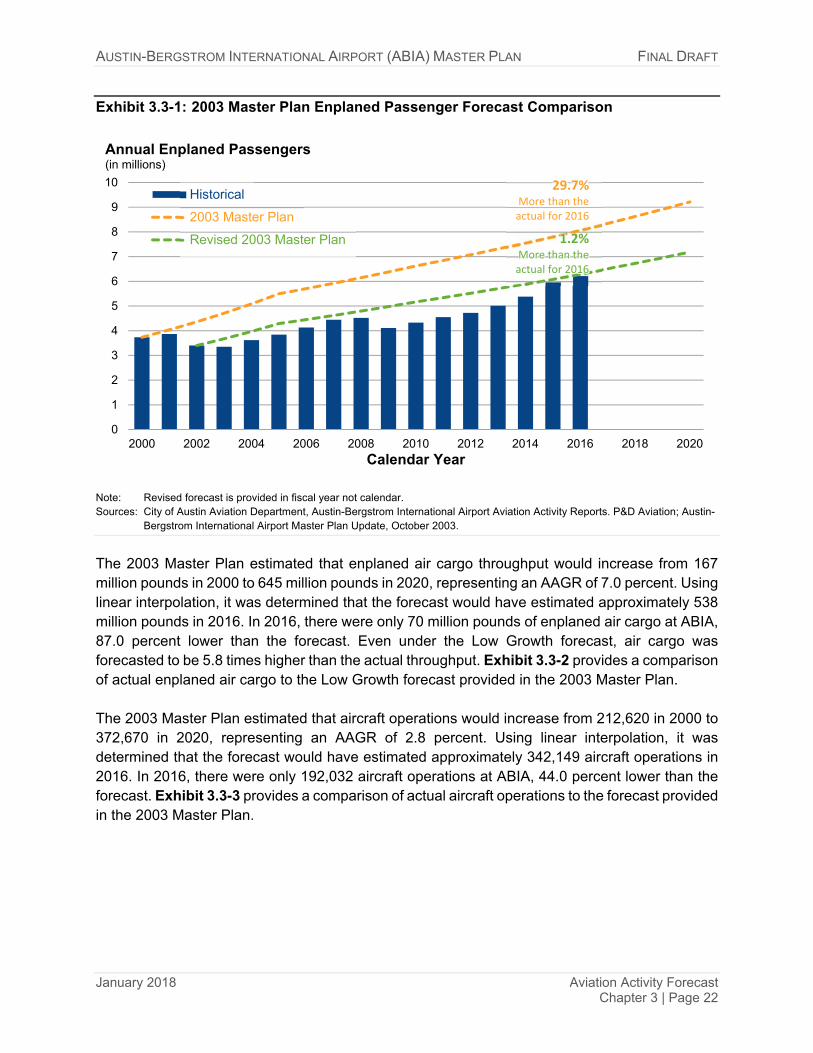
AUSTIN-BERGSTROM INTERNATIONAL AIRPORT (ABIA) MASTER PLAN FINAL DRAFT
January 2018 Aviation Activity Forecast Chapter 3 | Page 22
Exhibit 3.3-1: 2003 Master Plan Enplaned Passenger Forecast Comparison
Note: Revised forecast is provided in fiscal year not calendar. Sources: City of Austin Aviation Department, Austin-Bergstrom International Airport Aviation Activity Reports. P&D Aviation; Austin-
Bergstrom International Airport Master Plan Update, October 2003.
The 2003 Master Plan estimated that enplaned air cargo throughput would increase from 167 million pounds in 2000 to 645 million pounds in 2020, representing an AAGR of 7.0 percent. Using linear interpolation, it was determined that the forecast would have estimated approximately 538 million pounds in 2016. In 2016, there were only 70 million pounds of enplaned air cargo at ABIA, 87.0 percent lower than the forecast. Even under the Low Growth forecast, air cargo was forecasted to be 5.8 times higher than the actual throughput. Exhibit 3.3-2 provides a comparison of actual enplaned air cargo to the Low Growth forecast provided in the 2003 Master Plan. The 2003 Master Plan estimated that aircraft operations would increase from 212,620 in 2000 to 372,670 in 2020, representing an AAGR of 2.8 percent. Using linear interpolation, it was determined that the forecast would have estimated approximately 342,149 aircraft operations in 2016. In 2016, there were only 192,032 aircraft operations at ABIA, 44.0 percent lower than the forecast. Exhibit 3.3-3 provides a comparison of actual aircraft operations to the forecast provided in the 2003 Master Plan.
29.7%More than the actual for 2016
1.2%More than the actual for 2016
0
1
2
3
4
5
6
7
8
9
10
2000 2002 2004 2006 2008 2010 2012 2014 2016 2018 2020Calendar Year
Annual Enplaned Passengers(in millions)
Historical
2003 Master Plan
Revised 2003 Master Plan

AUSTIN-BERGSTROM INTERNATIONAL AIRPORT (ABIA) MASTER PLAN FINAL DRAFT
January 2018 Aviation Activity Forecast Chapter 3 | Page 23
Exhibit 3.3-2: 2003 Master Plan Enplaned Air Cargo Forecast Comparison
Sources: City of Austin Aviation Department, Austin-Bergstrom International Airport Aviation Activity Reports. P&D Aviation; Austin-
Bergstrom International Airport Master Plan Update, October 2003.
Exhibit 3.3-3: 2003 Master Plan Aircraft Operations Forecast Comparison
Sources: City of Austin Aviation Department, Austin-Bergstrom International Airport Aviation Activity Reports. P&D Aviation; Austin-
Bergstrom International Airport Master Plan Update, October 2003.
483.3% More than the actual
for 2016
0
50
100
150
200
250
300
350
400
450
500
2000 2002 2004 2006 2008 2010 2012 2014 2016 2018 2020
Calendar Year
Annual Enplaned Cargo Throughput(in millions of pounds)
Historical
2003 Master Plan (Low Growth)
78.2% More than the actual
for 2016
0
50
100
150
200
250
300
350
400
2000 2002 2004 2006 2008 2010 2012 2014 2016 2018 2020Calendar Year
Annual Aircraft Operations(in thousands)
Historical
2003 Master Plan

AUSTIN-BERGSTROM INTERNATIONAL AIRPORT (ABIA) MASTER PLAN FINAL DRAFT
January 2018 Aviation Activity Forecast Chapter 3 | Page 24
Drivers of Air Traffic The intrinsic link between the level of aviation activity and socio-economic growth are well documented. Simply put, growth in population, employment, income, and tourism activity typically lead to increased demand for air travel both for business and leisure purposes. An individual’s demand for air travel is often referred to as “underlying demand” in that it cannot be realized without the presence of air service at a price that results in the decision to fly. This section discusses the socio-economic factors as well as changes to the strategies of airlines that affect aviation demand at ABIA. All socio-economic data provided in this section were provided by Woods & Poole Economic, Inc. unless indicated otherwise. Woods & Poole is an independent vendor and nationally recognized firm that provides expert economic and demographic analysis.
3.4.1 Air Service Area The City of Austin is located within the Texas Triangle, also referred to as the “Golden Triangle”, which includes the area between Houston, Dallas-Fort Worth, and San Antonio. This area accounts for approximately 80 percent of Texas’ population. In terms of population, Austin is the smallest of the four main cities that comprises the Texas Triangle but according to the U.S. Census Bureau it has been the fastest growing over the past decade. The area served by ABIA includes two defined regions, the primary air service area (ASA) and the secondary ASA. The primary ASA, where most of ABIA’s passenger base is located, is comprised of the Austin-Round Rock, TX Metropolitan Statistical Area (Austin MSA), a five-county region that includes Bastrop, Caldwell, Hay, Travis, and Williamson Counties.10 Additional passenger demand, particularly for international service, is provided by the secondary ASA which includes the following: San Antonio-New Braunfels MSA to the Southwest; the Killeen-Temple-Fort Hood MSA and Waco MSA to the North; and the Bryan-College Station MSA to the East. The four MSAs included in the secondary ASA are comprised of 16 counties. Exhibit 3.4-1 provides a map that includes the primary ASA and secondary ASA.
10 U.S. Office of Management and Budget, Revised Delineations of Metropolitan Statistical Areas,
Micropolitan Statistical Areas, and Combined Statistical Areas, and Guidance on Uses of the Delineations of These Areas.
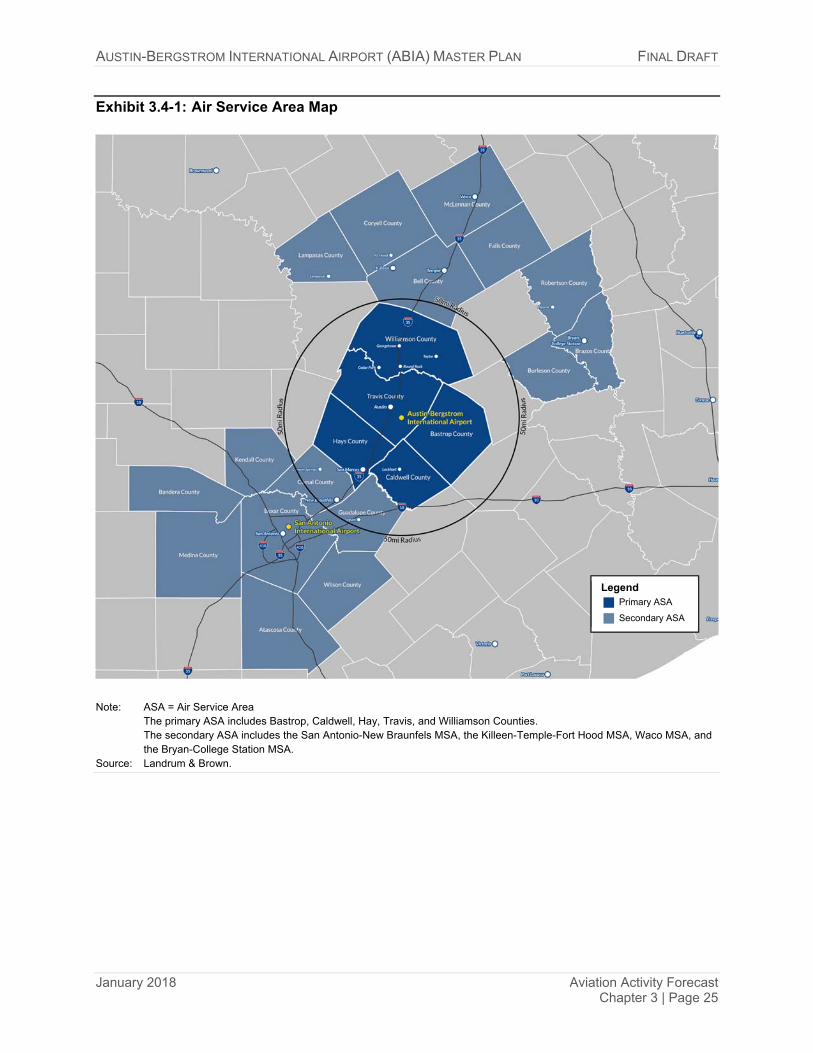
AUSTIN-BERGSTROM INTERNATIONAL AIRPORT (ABIA) MASTER PLAN FINAL DRAFT
January 2018 Aviation Activity Forecast Chapter 3 | Page 25
Exhibit 3.4-1: Air Service Area Map
Note: ASA = Air Service Area
The primary ASA includes Bastrop, Caldwell, Hay, Travis, and Williamson Counties. The secondary ASA includes the San Antonio-New Braunfels MSA, the Killeen-Temple-Fort Hood MSA, Waco MSA, and the Bryan-College Station MSA.
Source: Landrum & Brown.
Legend Primary ASA
Secondary ASA

AUSTIN-BERGSTROM INTERNATIONAL AIRPORT (ABIA) MASTER PLAN FINAL DRAFT
January 2018 Aviation Activity Forecast Chapter 3 | Page 26
3.4.2 Economic Base for Air Travel
3.4.2.1 United States Economy Historically, the United States economy, as measured by Gross Domestic Production (GDP), has grown at a relatively steady rate, averaging 3.1 percent per annum between 1960 and 2016. The rate of growth has been remarkably stable reflecting both the size and maturity of the United States economy. Individual years have fluctuated around the long-term trend for a variety of reasons including pure macro-economic factors, fuel shocks, war, and terrorist attacks. There have been two official economic recessions in the U.S. thus far in the 21st century. The first occurred between March and November of 2001 and was compounded by the September 11, 2001 terrorist attacks. The negative impact of these events on the airline industry is well documented. The recession itself was short-lived by historical standards and the economy returned to positive growth rates quickly, fueled in part by a gradual but prolonged reduction in interest rates. The second recession, often referred to as the ‘Great Recession’, occurred between December 2007 and June 2009.11 This was the worst financial crisis to affect the United States since the Great Depression and it was the longest recession since the airline industry was deregulated12 in 1978. The nation’s unemployment rate rose from 5.0 percent in December of 2007, to a high of 10.0 percent in October 2009.13 Exhibit 3.4-2 shows how strongly passenger traffic in the United States has historically been correlated with the nation’s economy. During economic contractions, there is a notable decline in passenger volumes while during the subsequent economic expansions there is significant growth in passenger volumes. Additionally, it is clear that shocks such as terrorist attacks have a short but significant impact to the passenger volumes.
11 National Bureau of Economic Research, U.S. Business Cycle Expansions and Contractions,
September 20, 2010. 12 Deregulation refers to the Airline Deregulations Act of 1978, which reduced government control
over the commercial aviation industry. 13 National Bureau of Economic Research, U.S. Business Cycle Expansions and Contractions,
September 20, 2010.
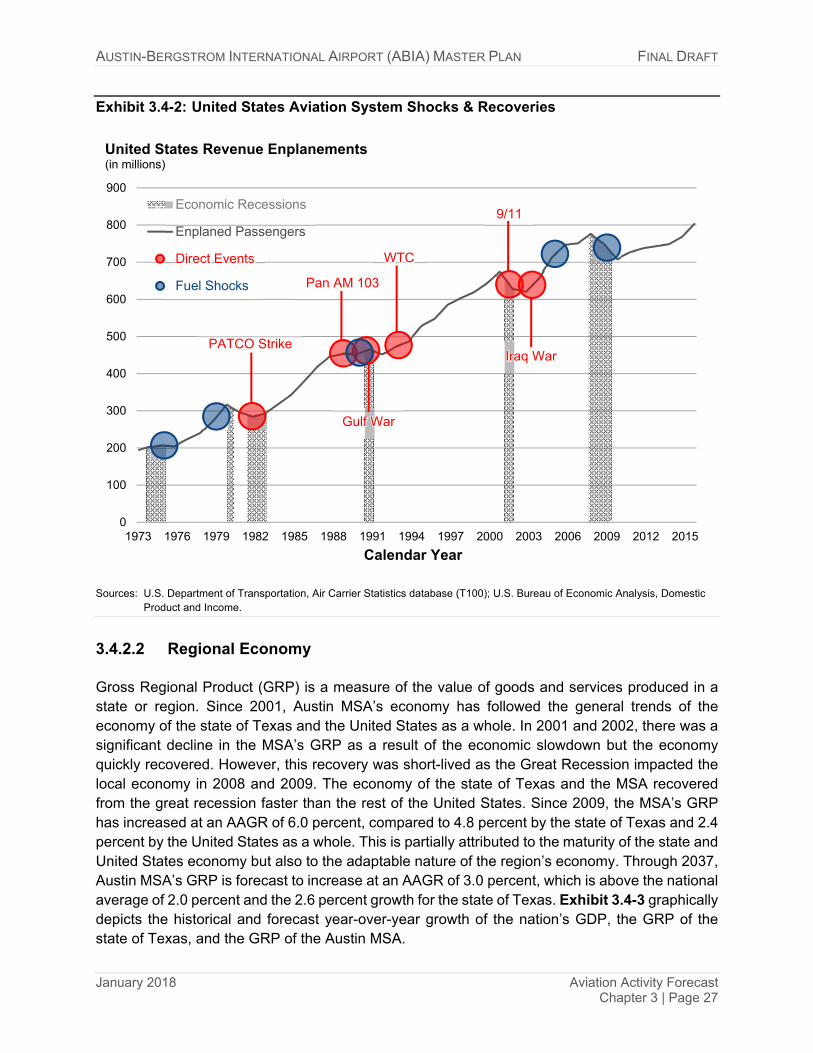
AUSTIN-BERGSTROM INTERNATIONAL AIRPORT (ABIA) MASTER PLAN FINAL DRAFT
January 2018 Aviation Activity Forecast Chapter 3 | Page 27
Exhibit 3.4-2: United States Aviation System Shocks & Recoveries
Sources: U.S. Department of Transportation, Air Carrier Statistics database (T100); U.S. Bureau of Economic Analysis, Domestic
Product and Income.
3.4.2.2 Regional Economy Gross Regional Product (GRP) is a measure of the value of goods and services produced in a state or region. Since 2001, Austin MSA’s economy has followed the general trends of the economy of the state of Texas and the United States as a whole. In 2001 and 2002, there was a significant decline in the MSA’s GRP as a result of the economic slowdown but the economy quickly recovered. However, this recovery was short-lived as the Great Recession impacted the local economy in 2008 and 2009. The economy of the state of Texas and the MSA recovered from the great recession faster than the rest of the United States. Since 2009, the MSA’s GRP has increased at an AAGR of 6.0 percent, compared to 4.8 percent by the state of Texas and 2.4 percent by the United States as a whole. This is partially attributed to the maturity of the state and United States economy but also to the adaptable nature of the region’s economy. Through 2037, Austin MSA’s GRP is forecast to increase at an AAGR of 3.0 percent, which is above the national average of 2.0 percent and the 2.6 percent growth for the state of Texas. Exhibit 3.4-3 graphically depicts the historical and forecast year-over-year growth of the nation’s GDP, the GRP of the state of Texas, and the GRP of the Austin MSA.
PATCO Strike
Pan AM 103
Gulf War
WTC
9/11
Iraq War
0
100
200
300
400
500
600
700
800
900
1973 1976 1979 1982 1985 1988 1991 1994 1997 2000 2003 2006 2009 2012 2015
Calendar Year
United States Revenue Enplanements(in millions)
Economic Recessions
Enplaned Passengers
Direct Events
Fuel Shocks
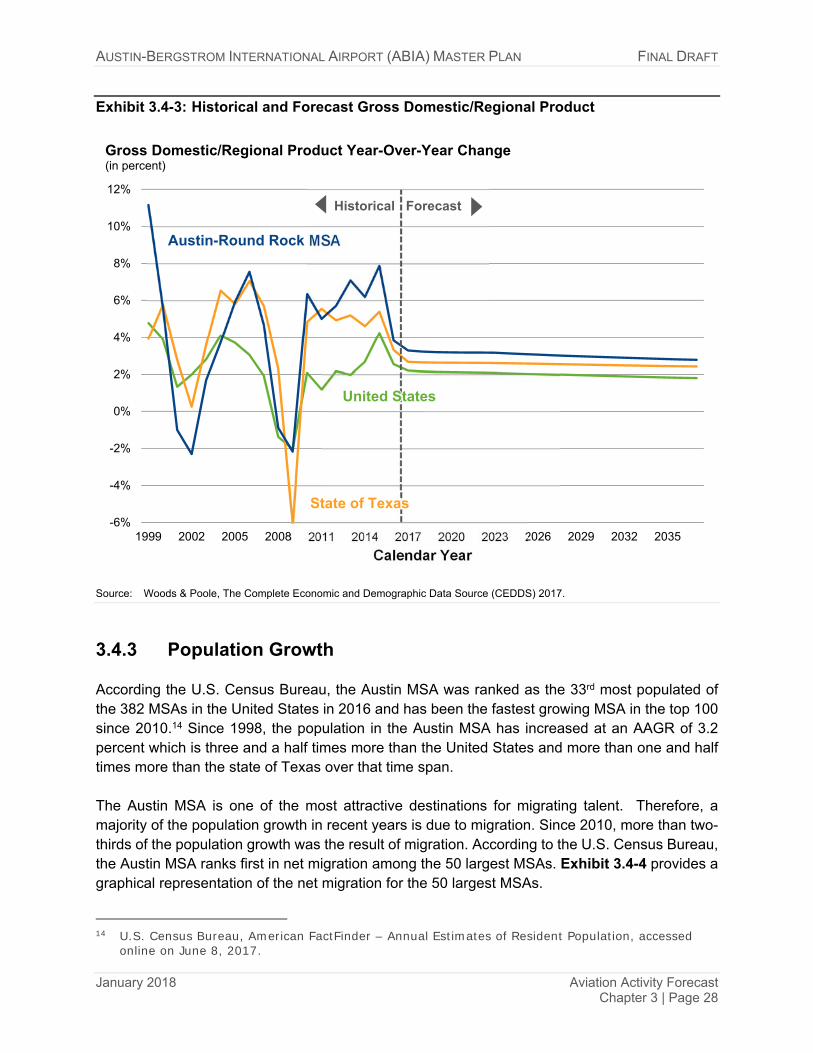
AUSTIN-BERGSTROM INTERNATIONAL AIRPORT (ABIA) MASTER PLAN FINAL DRAFT
January 2018 Aviation Activity Forecast Chapter 3 | Page 28
Exhibit 3.4-3: Historical and Forecast Gross Domestic/Regional Product
Source: Woods & Poole, The Complete Economic and Demographic Data Source (CEDDS) 2017.
3.4.3 Population Growth According the U.S. Census Bureau, the Austin MSA was ranked as the 33rd most populated of the 382 MSAs in the United States in 2016 and has been the fastest growing MSA in the top 100 since 2010.14 Since 1998, the population in the Austin MSA has increased at an AAGR of 3.2 percent which is three and a half times more than the United States and more than one and half times more than the state of Texas over that time span. The Austin MSA is one of the most attractive destinations for migrating talent. Therefore, a majority of the population growth in recent years is due to migration. Since 2010, more than two-thirds of the population growth was the result of migration. According to the U.S. Census Bureau, the Austin MSA ranks first in net migration among the 50 largest MSAs. Exhibit 3.4-4 provides a graphical representation of the net migration for the 50 largest MSAs.
14 U.S. Census Bureau, American FactFinder – Annual Estimates of Resident Population, accessed
online on June 8, 2017.
-6%
-4%
-2%
0%
2%
4%
6%
8%
10%
12%
1999 2002 2005 2008 2011 2014 2017 2020 2023 2026 2029 2032 2035
Calendar Year
Gross Domestic/Regional Product Year-Over-Year Change(in percent)
Austin-Round Rock MSA
Historical Forecast
State of Texas
United States

AUSTIN-BERGSTROM INTERNATIONAL AIRPORT (ABIA) MASTER PLAN FINAL DRAFT
January 2018 Aviation Activity Forecast Chapter 3 | Page 29
Exhibit 3.4-4: Net Migration for 50 Largest MSAs
Sources: U.S. Census Bureau, American FactFinder – Annual Estimates of Resident Population; U.S. Census Bureau, American
FactFinder – Estimates of the Components of Resident Population Change.
The population of the Austin MSA is expected to continue to increase at a rate faster than the nation and the state of Texas through the forecast period, although not quite at the same degree of significance. The Texas Demographic Center (TDC) provides estimates for the future population for each of the counties in the state through 2050. The most recent forecast used 2010 as the base year and included three scenarios: (1) no migration, (2) half migration rate of 2000 through 2010, and (3) migration rate of 2000 through 2010. The TDC’s population estimate for the Austin MSA for 2016 was below the actual for the region. In order to make comparisons between the population forecast provided by the TDC and Woods & Poole, the growth rates for future years from the TDC were applied to the actual population for 2016. Table 3.4-1 provides the population forecast for the MSA as provided by Woods & Poole compared to the forecast based on the growth rates provided by the TDC.
-600
-400
-200
0
200
400
600
800
1,000
1,200
Au
stin
Orla
ndo
Ral
eigh
Ta
mp
aS
an
An
ton
ioC
harl
otte
Ho
usto
nN
ash
ville
De
nver
Jack
son
ville
Mia
mi
Da
llas
Ph
oeni
xL
as V
egas
Se
attle
Okl
ahom
a C
ityP
ort
land
Atla
nta
Sa
n F
ranc
isco
Ne
w O
rlean
sR
ichm
ond
Sa
cra
men
toW
ashi
ngt
onC
olu
mb
usB
ost
on
Sa
n Jo
seIn
dia
nap
olis
Sa
n D
iego
Riv
ersi
deL
ouis
ville
Sa
lt L
ake
City
Min
nea
polis
Ka
nsas
Bal
timor
eP
ittsb
urgh
Pro
vide
nce
Bir
min
gha
mC
inci
nnat
iB
uffa
loP
hila
delp
hia
Ne
w Y
ork
Los
Ang
eles
Virg
inia
St.
Lo
uis
Har
tfor
dD
etr
oit
Milw
auke
eC
leve
land
Mem
phis
Ch
ica
go
Migrated Persons(per 10,000 population)
Domestic
International
Net Migration

AUSTIN-BERGSTROM INTERNATIONAL AIRPORT (ABIA) MASTER PLAN FINAL DRAFT
January 2018 Aviation Activity Forecast Chapter 3 | Page 30
Table 3.4-1: Austin MSA Population Forecasts
YEAR WOODS &
POOLE
TEXAS DEMOGRAPHIC CENTER HALF MIGRATION
RATE FULL MIGRATION
RATE 2016 2,040,566 2,040,566 2,040,566 2020 2,213,546 2,196,560 2,295,436 2025 2,449,012 2,387,568 2,640,477 2030 2,705,004 2,580,874 3,020,518 2035 2,975,702 2,780,986 3,449,109 2040 3,259,004 2,991,421 3,940,710
RANGE AVERAGE ANNUAL GROWTH RATE
2016-2040 1.6% 2.0% 2.8% Note: Migration rate refers to the rate of migration experienced in the Austin MSA from 2000 through 2010. Sources: Woods & Poole, The Complete Economic and Demographic Data Source (CEDDS) 2017. Texas Demographic Center,
2014 Texas Population Projections by Migration Scenario.
3.4.4 Employment Growth in employment is an important indicator of the overall health of the local economy. Changes in population and employment tend to be closely correlated as people migrate in and out of areas largely depending on their ability to find work.
3.4.4.1 Major Employers Austin includes one of the most educated talent pools in the country. According to the U.S. Census Bureau, 42.6 percent of the population in the Austin MSA have a bachelor’s degree or higher, compared to 30.6 percent nationally, and 14.8 percent of the population have a graduate degree, compared to 11.6 percent nationally. This young and highly educated workforce has been a catalyst for attracting large corporations to the region, particularly in the tech industry. Table 3.4-2 provides a list of the largest companies in the region.

AUSTIN-BERGSTROM INTERNATIONAL AIRPORT (ABIA) MASTER PLAN FINAL DRAFT
January 2018 Aviation Activity Forecast Chapter 3 | Page 31
Table 3.4-2: Austin Largest Employers
COMPANY DESCRIPTION Employing 6,000 & Over Apple Computer chip engineering and support center Austin Independent School District Public education City of Austin Government Dell Technologies * Computer technology solutions Federal Government Government IBM Corp. Computer systems Samsung Austin Semiconductor * Semiconductor chip manufacturing Seton Healthcare Family * Healthcare St. David's Healthcare Partnership * Healthcare State of Texas Government University of Texas at Austin Higher education, public Employing 2,000 - 5,999 Accenture Management consulting & software development Amazon Retailer’s digital product development Applied Materials Semiconductor production equipment AT&T Telecommunications Austin Community College Higher education, public Flextronics Contract electronics Hays Consolidated School District Public education Keller Williams Realty * Residential real estate Kindred Healthcare Healthcare Leander Independent School District Public education National Instruments * Virtual instrumentation software NXP Semiconductors * Semiconductor chip design Pflugerville Independent School District Public education Round Rock Independent School District Public education Texas State University-San Marcos* Higher education, public Travis County Government U.S. Internal Revenue Service Government Whole Foods Market * Grocery retailer
Note: Asterisk (*) indicates the company is headquartered in Austin region. Source: The Austin Chamber, 2017 Greater Austin Economic Development Guide.

AUSTIN-BERGSTROM INTERNATIONAL AIRPORT (ABIA) MASTER PLAN FINAL DRAFT
January 2018 Aviation Activity Forecast Chapter 3 | Page 32
3.4.4.2 Employment Growth Since 1999, employment in the Austin MSA has increased at a faster rate than the state of Texas and the United States as a whole. Although there were declines in employment in the Austin MSA in 2002 and 2009, the region has experienced a 3.2 percent AAGR in employment since 1999. In comparison, employment in the state of Texas increased 2.1 percent per year and the nation as a whole increased 1.1 percent per year over that time span. Growth in employment within the Austin MSA is expected to continue to outpace the state and the national average in the future. Through 2037, employment is forecast to increase at an AAGR of 2.2 percent compared to 1.7 percent for the state and 1.3 percent for the United States. Exhibit 3.4-15 graphically depicts the historical and forecast year-over-year growth in employment of the nation, the state of Texas, and the Austin MSA.
Exhibit 3.4-5: Historical and Forecast Employment
Source: Woods & Poole, The Complete Economic and Demographic Data Source (CEDDS) 2017.
-4%
-2%
0%
2%
4%
6%
8%
1999 2002 2005 2008 2011 2014 2017 2020 2023 2026 2029 2032 2035
Calendar Year
Employment Year-Over-Year Change(in percent)
Austin-Round Rock MSA
Historical Forecast
State of Texas
United States

AUSTIN-BERGSTROM INTERNATIONAL AIRPORT (ABIA) MASTER PLAN FINAL DRAFT
January 2018 Aviation Activity Forecast Chapter 3 | Page 33
3.4.5 Personal Income Income statistics are broad indicators of the relative earning power and wealth of an area and inferences can be made relative to an individual’s or community’s ability to purchase air travel. PCPI corresponds to the income per inhabitant (total income divided by total population). In 2000, the Austin MSA had a PCPI of $41,167 which ranked 28th in the country among all MSAs. However, the economic downturn in the region that occurred in the early 2000s had a significant impact to the average income. PCPI in the Austin region declined to a low of $37,175 in 2004 which was lower than the national average, $38,255, at the time. Over the next seven years, PCPI in the Austin MSA maintained a value nearly identical to the national average, which was well above the state as a whole. However, over the past five years PCPI in the Austin MSA has averaged over $2,000 more than the United States average. According to Woods & Poole, PCPI for Austin is expected to continue to be well above the national and state average. Exhibit 3.4-6 graphically depicts the historical and forecast PCPI of the nation, the state of Texas, and the Austin MSA.
Exhibit 3.4-6: Historical and Forecast Per Capita Personal Income
Source: Woods & Poole, The Complete Economic and Demographic Data Source (CEDDS) 2017.
30,000
35,000
40,000
45,000
50,000
55,000
60,000
65,000
1998 2001 2004 2007 2010 2013 2016 2019 2022 2025 2028 2031 2034 2037
Calendar Year
Per Capita Personal Income(in 2009$)
Austin‐Round Rock MSA
Historical Forecast
State of Texas
United States
AUSTIN-BERGSTROM INTERNATIONAL AIRPORT (ABIA) MASTER PLAN FINAL DRAFT
January 2018 Aviation Activity Forecast Chapter 3 | Page 34
3.4.6 Household Income To better understand the economic landscape of the region, households within the Austin MSA were segmented into two categories: (1) Higher-income households (those earning $100,000 or more per year); and (2) Lower-income households (those earning less than $100,000 per year). There were approximately 766,200 households in Austin in 2016, of which 24.8 percent were higher-income and the remaining 75.2 percent were lower-income. From 2016 through 2037, the number of higher-income households is expected to increase at a rate of 3.6 percent per annum, while lower-income households will increase at a rate of 1.1 percent per annum. Based on these growth rates, it is expected that by 2037 the percentage of higher-income households in Austin will be 35.5 percent, while 64.5 percent will be lower-income.
3.4.7 Regional Socio-Economic Comparisons The data presented thus far has focused on the primary ASA, the Austin MSA. However, comparisons to the MSAs located in the secondary ASA can be made in order to determine the effect these areas may have on aviation demand at ABIA. In 2016, the Austin MSA had the highest GRP of any of the MSAs in the region followed closely by the San Antonio-New Braunfels MSA. The other three MSAs (College Station-Bryan, Killeen-Temple, and Waco) had a combined GRP that was less than a third of the Austin MSA. Since 2007, the Austin MSA has had the fastest growing economy in terms of GRP of the region and this trend is forecast to continue through the forecast period. The San Antonio-New Braunfels MSA is the most populated MSA in the region with 2.4 million people compared to the 2.0 million people in the Austin MSA. However, the population in the Austin MSA has been the fastest growing since 2007, a trend expected to continue in the future. The remaining MSAs have a combined population of less than 1.0 million people. In 2016, the PCPI within the Austin MSA was more than $7,000 more than the PCPI within the San Antonio-New Braunfels MSA and more than $10,000 more than the PCPI within each of the other MSAs in the region. The PCPI within the Bryan-College Station MSA has been the fastest growing since 2007 but the PCPI within the San Antonio-New Braunfels MSA is forecasted to increase at a faster rate than any of the MSAs in the region in the future. Employment is closely related to population. Therefore, it is unsurprising that the employment for the Austin MSA is higher than the other MSAs in the region and that it is expected to increase at a faster rate than any of the other MSAs. Exhibit 3.4-7 provides the AAGR for each of the socio-economic categories detailed above for the individual MSAs in the region as well as that of the state of Texas and the United States as a whole.

AUSTIN-BERGSTROM INTERNATIONAL AIRPORT (ABIA) MASTER PLAN FINAL DRAFT
January 2018 Aviation Activity Forecast Chapter 3 | Page 35
Exhibit 3.4-7: Regional Socio-Economic Comparisons
United States2.0%
United States1.5%
Texas2.6%
Texas3.3%
Waco MSA1.7%
Waco MSA2.2%
San Antonio-New Braunfels MSA2.8%
San Antonio-New Braunfels MSA3.3%
Killeen-Temple MSA2.2%
Killeen-Temple MSA1.2%
Bryan-College Station MSA2.5%
Bryan-College Station MSA3.6%
Austin-Round Rock MSA3.0%
Austin-Round Rock MSA4.3%
0.0% 2.0% 4.0% 6.0% 8.0%
Forecast2016-2037
Historical2007-2016
Gross Domestic/Regional Product AAGR(in percent)
United States0.9%
United States0.8%
Texas1.6%
Texas1.8%
Waco MSA0.7%
Waco MSA0.9%
San Antonio-New Braunfels MSA1.7%
San Antonio-New Braunfels MSA2.1%
Killeen-Temple MSA1.2%
Killeen-Temple MSA1.5%
Bryan-College Station MSA1.2%
Bryan-College Station MSA1.9%
Austin-Round Rock MSA2.0%
Austin-Round Rock MSA2.9%
0.0% 2.0% 4.0% 6.0%
Forecast2016-2037
Historical2007-2016
Population AAGR(in percent)

AUSTIN-BERGSTROM INTERNATIONAL AIRPORT (ABIA) MASTER PLAN FINAL DRAFT
January 2018 Aviation Activity Forecast Chapter 3 | Page 36
Exhibit 3.4-7: Regional Socio-Economic Comparisons (continued)
Note: AAGR is average annual growth rate. Source: Woods & Poole, The Complete Economic and Demographic Data Source (CEDDS) 2017.
United States1.3%
United States0.9%
Texas1.4%
Texas1.6%
Waco MSA1.2%
Waco MSA1.5%
San Antonio-New Braunfels MSA1.5%
San Antonio-New Braunfels MSA1.3%
Killeen-Temple MSA1.2%
Killeen-Temple MSA0.5%
Bryan-College Station MSA1.4%
Bryan-College Station MSA2.1%
Austin-Round Rock MSA1.3%
Austin-Round Rock MSA1.6%
0.0% 1.0% 2.0% 3.0% 4.0% 5.0%
Forecast2016-2037
Historical2007-2016
Per Capita Personal Income AAGR(in percent)
United States1.3%
United States0.8%
Texas1.7%
Texas1.9%
Waco MSA0.9%
Waco MSA0.9%
San Antonio-New Braunfels MSA1.9%
San Antonio-New Braunfels MSA2.0%
Killeen-Temple MSA1.5%
Killeen-Temple MSA0.7%
Bryan-College Station MSA1.5%
Bryan-College Station MSA2.4%
Austin-Round Rock MSA2.2%
Austin-Round Rock MSA2.9%
0.0% 2.0% 4.0% 6.0%
Forecast2016-2037
Historical2007-2016
Employment AAGR(in percent)

AUSTIN-BERGSTROM INTERNATIONAL AIRPORT (ABIA) MASTER PLAN FINAL DRAFT
January 2018 Aviation Activity Forecast Chapter 3 | Page 37
3.4.8 Cost of Living Although personal income is a vital statistic, it is only a portion of determining whether a passenger has the means to afford to travel by air. If the cost of living is too high, then the passenger will not have the disposable income necessary to purchase a ticket. The Council for Community and Economic Research (C2ER) provides indices which reflect the average cost of living in a particular city or region in relation to the rest of the country. A cost of living index measures regional differences in the cost of consumer goods and service, excluding taxes and non-consumer expenditures. A composite index is given to a region based on six components: housing, utilities, grocery items, transportation, health care, and miscellaneous goods and services. The index can be used in determining how much personal income will be dedicated to these components compared the rest of the United States. For example, a composite score of 100 would indicate that, on average, the cost for goods in the region is equal to the average of the rest of the nation. In 2016, the City of Austin had a composite index of 96.7 which indicates that the average cost of living in the City of Austin is approximately 3.3 percent less than the rest of the nation. This index is lower than many of major business centers in the United States. Exhibit 3.4-8 provides the index for some comparable cites and how they have changed since 2007.
Exhibit 3.4-8: Cost of Living Index
Source: The Council for Community & Economic Research, Cost of Living Index.
20162007
0 50 100 150 200 250
Phoenix, AZ
Los Angeles, CA
San Francisco, CA
Denver, CO
Chicago, IL
Boston, MA
New York, NY (Manhattan)
Raleigh, NC
Nashville, TN
Austin, TX
Index(U.S. = 100)

AUSTIN-BERGSTROM INTERNATIONAL AIRPORT (ABIA) MASTER PLAN FINAL DRAFT
January 2018 Aviation Activity Forecast Chapter 3 | Page 38
3.4.9 Tourism Tourism is a major industry in the Austin region. In 2016, there were 24.1 million visitors to the region generating over seven billion dollars in revenue. Austin has a number of attractions that bring visitors to the City. However, the main draw for visitors to the region are the conferences and festivals combined with unique sporting events. Held in February, the Austin Marathon draws 20,000 people from around the world to participate. South By Southwest (SXSW), which is held in March, combines film, music, and tech industries into one experience. In 2016, SXSW had an economic impact of $325.5 million to the City of Austin. On July 17, 2017 Delta Air Lines announced special service to Amsterdam Schiphol Airport (AMS) utilizing the 225-seat Boeing 767-300 to coincide with SXSW. The Circuit of the Americas is a world-class racing facility purposely built for Formula 1 racing. The Circuit is the home of the Formula 1 United States Grand Prix. The Grand Prix is a large international event held in October which drew 269,889 people in 2016. In the fall, there are a number of music and movie festivals including Fun Fun Fun, the Sound On Sound Fest, Fantastic Fest, the Austin Film Festival, and most notably the Austin City Limits Music Festival which is held in October and welcomes 70,000 fans per day.
3.4.10 Price of Air Travel The demand for air travel is inversely proportional to the price. As airfares increase, fewer people can afford to travel for leisure. Alternatively, as airfares decrease, more people are able to afford to travel and do so more frequently. Prior to the Great Recession, airfares did not typically have a significant impact on the air travel demand for business passengers. However, the economic climate prompted businesses to seek measures in order to save cost, part of which included shrinking travel budgets. Now many companies are substituting air travel with telecommunications, such as video calls, when the cost of travel becomes too great. Yield is the aviation industry’s measure for average ticket prices. Yield is the average fare paid by customers to fly one mile, i.e. passenger revenue divided by revenue passenger miles. From 2011 through 2014 yields at ABIA remained steady at an average of 14.22 cents, after adjusting for inflation. However, over the past two years, there has been a notable decline in yields which is fairly consistent with the trend of yields in the airline industry as a whole. In 2016, yields at ABIA were only 13.09 cents.

AUSTIN-BERGSTROM INTERNATIONAL AIRPORT (ABIA) MASTER PLAN FINAL DRAFT
January 2018 Aviation Activity Forecast Chapter 3 | Page 39
3.4.11 Airline Industry Strategy The financial health of the airlines will play a major role in the determination of future forecasts for ABIA. The section contains a summary of the airline industry factors that were considered in developing the ABIA forecast.
3.4.11.1 Airline Bankruptcies There have been dramatic changes to the financial health of the airline industry in the 21st century. Numerous airlines have declared Chapter 11 bankruptcy at least once. There was a rash of bankruptcies between 2001 and 2005, and another round in 2008 as a result of the recent economic recession. The most recent airline to declare bankruptcy was American Airlines, which entered bankruptcy protection in November 2011. As shown in Table 3.4-3, nine airlines that have operated at ABIA have declared bankruptcy this century. Southwest Airlines, the largest carrier at ABIA, has never declared bankruptcy.
Table 3.4-3: Airline Bankruptcy Status
AIRLINE BANKRUPTCY STATUS
Trans World Airways Filed Chapter 11 in January 2001 as part of acquisition by American.
US Airways Filed Chapter 11 in August 2002 and again in September 2004; emerged in September 2005 in conjunction with acquisition by America West. Acquired by American Airlines in 2013.
United Airlines Filed Chapter 11 in December 2002; emerged in February 2006.
Northwest Airlines Filed Chapter 11 in September 2005; emerged in May 2007. Acquired by Delta in 2008.
Delta Air Lines Filed Chapter 11 in September 2005; emerged in April 2007. Wholly owned subsidiary Comair Airlines taken into bankruptcy with Delta Airlines
Frontier Airlines Filed Chapter 11 in April 2008; emerged in October 2009.
American Airlines Filed Chapter 11 in November 2011. Wholly owned subsidiary American Eagle Airlines taken into bankruptcy with American Airlines. Emerged in December 2013.
Sources: Airlines for American, U.S. Airline Bankruptcies.
Trans World AirwaysJan-01
US AirwaysAug-02
United AirlinesDec-02
US AirwaysSep-04
Northwest AirlinesSep-05
Delta Air LinesSep-05
Frontier AirlinesApr-08
American AirlinesNov-11
2001 2003 2005 2007 2009 2011 2013 2015 2017

AUSTIN-BERGSTROM INTERNATIONAL AIRPORT (ABIA) MASTER PLAN FINAL DRAFT
January 2018 Aviation Activity Forecast Chapter 3 | Page 40
3.4.11.2 Airline Mergers Many airlines have merged or been acquired since the turn of the 21st century, including American/TWA in 2001, US Airways/America West in 2005, Delta/Northwest in 2008, Southwest/AirTran in 2010, United/Continental in 2010-2012, American/US Airways in 2013, and most recently Alaska/Virgin in 2016. These mergers have resulted in significant consolidation and economic control of passenger ridership. In 2000, 12 domestic airlines accounted for 93.4 percent of the domestic passengers in the United States. In 2016, the five combined airlines resulting from these mergers accounted for 87.1 percent of the domestic passengers.
3.4.12 Domestic Capacity After five years of negative earnings, the United States airline industry collectively returned to profitability in 2006 after savings from labor cuts, salary concessions, and removal of many flight perquisites were realized. The success of restructuring has produced an industry that is already relatively streamlined with very little fat left to trim. The surge in oil prices in 2008 and the ensuing economic crisis pushed airlines to start raising fares and cutting capacity. To survive and be profitable, the airlines have had to reduce domestic capacity (the number of scheduled seats that are offered) to avoid losing money on unprofitable routes and excessive frequencies that were not supported with sufficient demand. This capacity cut was evident at ABIA in 2009 when airlines cut 8.9 percent of their seating capacity. However, all of the airlines were quick to return the loss in capacity at ABIA and have added new capacity despite reductions at other airports within the United States.
3.4.13 New Scheduled Service International traffic at ABIA has historically been virtually nonexistent throughout ABIA’s history. In 2012, AirTran Airways began scheduled service to CUN and in 2016 there were a total of six international markets at ABIA. While a majority of the growth in domestic traffic will be the result of natural or organic growth, the demand in the international segment is currently underserved. Therefore, new international markets have the potential to stimulate passenger traffic at ABIA. Within the next few years, it is anticipated that there could be new service to five new markets with two in Europe and one each in Canada, Latin American, and Asia-Pacific.
AUSTIN-BERGSTROM INTERNATIONAL AIRPORT (ABIA) MASTER PLAN FINAL DRAFT
January 2018 Aviation Activity Forecast Chapter 3 | Page 41
3.4.14 Price of Fuel The price of oil and the associated cost of jet fuel is the largest single cost affecting the airline industry. The price of West Texas Intermediate (WTI) crude oil increased dramatically, posting a 290 percent increase in June 2008 when compared to January 2004. After averaging between $20 to $30 per barrel between 2000 and 2003, spot crude oil prices surged to about $140 per barrel in June and July of 2008. Several factors drove the increase such as strong global demand, particularly in China and India, a weak United States dollar, commodity speculation, political unrest, and a reluctance to materially increase supply. The price of oil subsequently declined sharply to $61 per barrel in 2009 due to reduced demand resulting from the global financial crisis and resulting economic recession. However, as the economic climate improved and political unrest continued in the Middle East, oil prices increased in the subsequent three years. In 2012, oil prices averaged $94 per barrel. The increase in the price of jet fuel put upward pressure on airlines’ operating costs. As a result, airlines were faced with cutting capacity or increasing fares, and sometimes both. An additional impact of higher fuel prices has been a sharp increase in load factors as airlines look to make better use of their aircraft assets by constraining capacity. The average price of oil dropped significantly in 2015 to $49 per barrel, the lowest since 2004 and dropped again in 2016 to $43 per barrel. The drop alleviated the pressure on airlines’ operating costs however the airlines are slow to make changes as fuel prices are expected to increase in the future. The U.S. Energy Information Administration (EIA) provides forecasts of the price of crude oil in a report entitled the Annual Energy Outlook (EIO). In the 2017 EIO, the EIA projects that the price of oil will increase at 3.7 percent per annum through 2040, reaching $103 per barrel in 2040. Exhibit 3.4-9 provides the historical price for crude oil and EIA’s forecast of those prices.

AUSTIN-BERGSTROM INTERNATIONAL AIRPORT (ABIA) MASTER PLAN FINAL DRAFT
January 2018 Aviation Activity Forecast Chapter 3 | Page 42
Exhibit 3.4-9: Crude Oil Prices
Note: WTI stands for West Texas Intermediate. Source: U.S. Energy Information Administration, Annual Energy Outlook 2017.
3.4.15 Aircraft Trends Variable fuel costs, aircraft type, and aircraft age have an impact on which aircraft the airlines choose to fly. The next-generation Boeing 737s and Airbus 320/321s have among the best fuel economy in the industry. The airlines have designated certain aircraft for retirement that have poor fuel economy compared to newer models. Many of the MD-80/90, DC-9, and B737-300,-400,-500s have all been marked for reduction of use or retirement by many domestic airlines. The MD-80 series, MD-90 series, and DC-9 aircraft are expected to be retired by the end of 2017 while the older variants of the B737 are expected to be retired by 2020. These aircraft are expected to be replaced with the B737-700, B737-800 and B737 MAX aircraft with similar or higher seat capacities. Small regional jets like the EMB-135/140 and the CRJ-100/200 are also under much scrutiny and going through reductions. At ABIA, a majority of the small regional aircraft have already been eliminated from routes.
2008$101
2040$103
$0
$20
$40
$60
$80
$100
$120
$140
$160
1998 2001 2004 2007 2010 2013 2016 2019 2022 2025 2028 2031 2034 2037 2040
Calendar Year
WTI Crude Oil Price(in 2016$/barrel)
Historical Forecast
AUSTIN-BERGSTROM INTERNATIONAL AIRPORT (ABIA) MASTER PLAN FINAL DRAFT
January 2018 Aviation Activity Forecast Chapter 3 | Page 43
3.4.16 The Rise in E-Commerce Cargo There is a fundamental shift ongoing in the air cargo industry. Historically, air cargo has been used as a supply chain for time-sensitive or high value product. Manufacturing has been a significant driver in air cargo and companies, such as Dell Inc., has provided the demand for air cargo. These companies have relocated a number of their manufacturing facilities to other parts of the world which has led to a shift to other modes of transportation such as cargo ships. Additionally, rising fuel costs, resulting in higher shipping costs, combined with the Global Recession led companies to reevaluate the necessity of shipping their products by air. As such, companies began to rely on an increased use of trucks and ships to deliver their product. The result is that traditional air cargo has been stagnant at many airports across the United States, including ABIA. The increased use of e-commerce is expected to result in changes in the air cargo industry. The U.S. Census Bureau has projected that 8.5 percent of retail sales were e-commerce in the first quarter of 2017 compared to 7.8 percent in 2016.15 Most of the current forecasts for e-commerce indicate double-digit growth in the market over the next five years. In e-commerce, venders are required to ship orders to their costumers fast, such as two-day shipping, which may require the use of air cargo despite the increased cost. Therefore, the growth in e-commerce is expected to have a significant impact on air cargo throughput. It is believed that air cargo for e-commerce is expected to follow a similar spoke and hub model to the mainline passenger airlines. Centralized distribution centers, or hubs, will store a majority of the product then distribute the product to other airports, or spokes, on an as needed basis. As such, air cargo throughput at distribution hubs will be dependent on the needs at the spokes. The air cargo throughput at the spoke airports will be dependent on the needs of the population within ABIA’s catchment area.
3.4.17 General Aviation Industry
3.4.17.1 National Activity The civil aviation industry in the United States has experienced major changes over the past several decades. GA activity levels were at its highest in the late 1970s through 1981. GA activity levels and new aircraft production reached all-time lows in the early 1990s due to a number of factors including increasing fuel prices, increased product liability stemming from litigation concerns, and the resulting higher cost of new aircraft. The passage of the 1994 General Aviation Revitalization Act (GARA) combined with reduced new aircraft prices, lower fuel prices, resumed production of single-engine aircraft, continued strength in the production and sale of business jets, and a recovering economy led to growth in the GA industry in the latter half of the 1990s.
15 U.S. Census Bureau, Quarterly Retail E-Commerce Sales 1st Quarter 2017, May 16, 2017.

AUSTIN-BERGSTROM INTERNATIONAL AIRPORT (ABIA) MASTER PLAN FINAL DRAFT
January 2018 Aviation Activity Forecast Chapter 3 | Page 44
The rebound in the United States GA industry that began with GARA started to subside by 2000. GA traffic at airports with air traffic control service slowed considerably in 2001 due largely to the United States economic recession, and to some extent, the terrorist attacks of September 11, 2001. GA traffic at airports with air traffic control service continued to decline through 2006 as spikes in fuel costs occurred and the economy grew at a relatively even pace. For the first time since 1999, GA traffic at airports with air traffic control service increased in 2007, but just slightly. In the following year however, GA aircraft operations declined by 4.7 percent. The decline in GA traffic continued due to the recent economic downturn and increased fuel prices. GA aircraft operations decreased 11.3 percent in 2009 and have continued to decline in the subsequent years.
3.4.17.2 Business Aviation Companies and individuals use aircraft as a tool to improve their business’s efficiency and productivity. The terms business and corporate aircraft are often used interchangeably, as they both refer to aircraft used to support a business enterprise. The FAA defines corporate transportation as “any use of an aircraft by a corporation, company or other organization (not for compensation or hire) for the purposes of transporting its employees and/or property, and employing professional pilots for the operation of the aircraft.” After growing rapidly for most of the past decade, the demand for business jet aircraft has decelerated over the past few years. While new products, including very light jets, and increasing foreign demand helped to spur this growth in the early 2000s, the past few years have seen the dramatic impact of the recession on the business jet market. Issues such as reduced corporate profits, bankruptcies, mergers, and an intense scrutiny on business aviation as a result of corporate collapses have resulted in a slow-down in the growth of business aviation. Increased personnel productivity has been stated as one of the most important benefits of using business aircraft. Companies flying business jets have more control of their travel. Itineraries can be changed as needed, and the aircraft can fly into destinations not served by scheduled airlines. Business aircraft usage provides:
Employee time savings
Increased en route productivity
Minimized time away from home
Enhanced industrial security
Enhanced personal safety
Management control over scheduling Business aviation aircraft ranges from small, single-engine aircraft rentals to multiple aircraft corporate fleets supported by dedicated flight crews and mechanics. These aircraft allow employers to transport personnel and air cargo efficiently. Businesses often use the aircraft to link multiple office locations and reach existing and potential customers. Business aircraft used by

AUSTIN-BERGSTROM INTERNATIONAL AIRPORT (ABIA) MASTER PLAN FINAL DRAFT
January 2018 Aviation Activity Forecast Chapter 3 | Page 45
smaller companies has escalated as various chartering, leasing, time-sharing, interchange agreements, partnerships, and management contracts have emerged. Businesses and corporations have increasingly employed business aircraft in their operations.
3.4.17.3 FAA Aerospace Forecast The FAA develops a set of assumptions and forecasts based on the current tends of the U.S. aviation industry. These forecasts, entitled the FAA Aerospace Forecast, are published annually and are considered to be one the most complete forecasts available for aviation activity in the U.S. The FAA Aerospace Forecast provides forecasts for passenger, cargo, and general aviation activity on a national level. The FAA Aerospace Forecasts16 project the following trends in the United States GA and air taxi industry from 2016 to 2037:
The number of active GA aircraft is forecast to increase by 0.1 percent annually.
Piston hours flown are forecast to decline at 0.8 percent per annum.
Turbo prop hours flown are forecast to increase at 1.6 percent per annum.
Turbo jet hours flown are forecast to increase at 3.0 percent per annum.
Passenger Activity Forecasts This section presents the forecast of enplaned passengers for ABIA through the forecast period as well as a discussion of the methodology used to develop this forecast. The enplaned passenger forecast reflects the historical airline activity trends, the economic base for air travel demand, and other factors that may affect the demand for air travel over the forecast period.
3.5.1 2017 Estimate Through June of 2017, passenger enplanements have increased significantly when compared to the same time period from 2016. Domestic enplaned passengers have increased 9.6 percent over the six-month span coinciding with an increase in the scheduled seating capacity of 11.1 percent. According to OAG, domestic seating capacity is scheduled to increase 12.5 percent for the entire year of 2017. This increase is partially attributed to a 6.5 percent increase in the frequency in scheduled aircraft operations. Additionally, many of the airlines at ABIA are increasing the average number of seats per aircraft operation. In particular, United Airlines and Delta Air Lines are scheduled to use narrow-body aircraft for flights that have historically utilized regional aircraft with fewer seats per aircraft operation. It is assumed that the dramatic increase in seating capacity will likely have a small
16 Federal Aviation Administration, FAA Aerospace Forecast, Fiscal Years 2017-2037.
AUSTIN-BERGSTROM INTERNATIONAL AIRPORT (ABIA) MASTER PLAN FINAL DRAFT
January 2018 Aviation Activity Forecast Chapter 3 | Page 46
negative impact on load factors in the short-term. Therefore, it was assumed that domestic enplaned passengers will increase 10.1 percent over the course of the entire year. International enplaned passengers have increased 29.2 percent through June of 2017. This increase has coincided with an increase of 31.2 percent in scheduled international seats. According to OAG, international seating capacity is scheduled to increase 23.5 percent in 2017 mostly attributed to an entire year of Aeroméxico’s service to MEX and Condor Flugdienst’s service to FRA. It was assumed that international enplaned passengers will increase 22.0 percent over the course of the entire year.
3.5.2 Domestic Passenger Methodology In an effort to develop the domestic enplaned passenger forecast at ABIA, historical traffic was divided into two segments: (1) O&D passengers and (2) connecting passengers. A forecast for each segment was created and the results were aggregated to provide a total domestic enplaned passenger forecast. A number of standard industry forecasting techniques were considered in order to forecast domestic O&D enplaned passengers such as econometric regression modeling, trend analysis, market share, and time series. It was determined that an econometric regression model was most appropriate to forecast domestic O&D enplaned passengers at ABIA. Econometric regression modeling quantifies the relationship between enplaned passengers and socio-economic variables. This methodology recognizes that the key independent variables will change over time but assumes that their fundamental relationships to the dependent variables will remain. The first step in developing the appropriate model was to test the independent, or explanatory, variables against the dependent variable, pure domestic O&D enplaned passengers. In order for an econometric model to be considered appropriate, the following has to be true:
Adequate test statistics (i.e. high coefficient of determination (R2) values and low p-value statistics), which indicate that the independent variables are good predictors of ABIA traffic.
Doesn’t result in theoretical contradictions (e.g., the model indicates that GDP growth is negatively correlated with traffic growth).
The results are not overly aggressive or conservative that are incompatible with historical averages.
Through the testing of multiple sets of independent variables, a multivariate linear model using the MSA’s GDP and PCPI was selected to forecast domestic O&D enplaned passengers. The model exhibits strong regression statistics when compared to models with other combinations of independent variables. The model formula and relevant test statistics are provided below:

AUSTIN-BERGSTROM INTERNATIONAL AIRPORT (ABIA) MASTER PLAN FINAL DRAFT
January 2018 Aviation Activity Forecast Chapter 3 | Page 47
Model: Enplaned Passengers = 35.67*GRPMSA+37.45*PCPIMSA-774,128 Where: GRPMSA = Austin MSA GRP PCPIMSA = Austin MSA PCPI Test Statistics: R2 = 98.3 percent DF = 18 P-Value = 0.00
Independent Variables P-Values: Intercept = 0.20 GRPMSA = 0.00 PCPIMSA = 0.06
The R2 indicates that 98.3 percent of the variation in the domestic O&D enplaned passengers at ABIA can be explained by the model. Exhibit 3.5-1 illustrates the model fit when plotted against the actual domestic O&D enplaned passengers.
Exhibit 3.5-1: Domestic O&D Enplaned Passenger Regression Model
Sources: Woods & Poole, The Complete Economic and Demographic Data Source (CEDDS) 2017. U.S. Department of
Transportation, Air Passenger Origin-Destination Survey. Landrum & Brown, 2017.
0
1
2
3
4
5
6
1998 2000 2002 2004 2006 2008 2010 2012 2014 2016
Calendar Year
Annual Domestic O&D Enplaned Passengers(in millions)
Actual
Model Estimate

AUSTIN-BERGSTROM INTERNATIONAL AIRPORT (ABIA) MASTER PLAN FINAL DRAFT
January 2018 Aviation Activity Forecast Chapter 3 | Page 48
The domestic connecting enplaned passenger forecast was derived in part from the domestic O&D enplaned passenger forecast. Since 1998, only five percent of the domestic enplaned passengers at ABIA were connecting. It was assumed that as additional domestic markets are added at ABIA, the percent of connecting passengers will increase accordingly. As such, it was assumed that the share of domestic connecting enplaned passengers will increase from 4.5 percent in 2016 to 6.0 percent in 2037.
3.5.3 International Passenger Methodology Typically, passenger activity forecasts are developed using a demand-side approach, such as the approach used for domestic O&D enplaned passengers. This approach forecasts the underlying demand, the number of passengers, and then derives the number of operations based on the forecasted number of passengers. However, given the short existence of consistent international service at ABIA, it is not possible to accurately estimate the future demand based on historical trends. Therefore, a supply-side, or bottom-up, approach was utilized to determine the international enplaned passenger forecast in the near-term. This approach examines potential new service based on empirical knowledge of the markets served and current demand as indicated by information provided by the Marketing Information Data Tapes (MIDT). MIDT includes booking transactions generated by travel agents. These bookings provide insight as what international demand is not being met by the current nonstop service. Based on the information gathered, the following flights were assumed to begin service within the next five years17:
Norwegian Destination: London Gatwick Airport (LGW) Aircraft: Boeing 787-900 Seating Configuration: 344 Weekly Departures: 3 Starting Date: Early 2018
Air Canada Destination: Vancouver International Airport (YVR) Aircraft: Embraer 175 Seating Configuration: 73 Weekly Departures: 7 Starting Date: Late 2018
Air France Destination: Charles de Gaulle Airport (CDG) Aircraft: Boeing 787-900 Seating Configuration: 294 Weekly Departures: 1 Starting Date: Late 2019
17 Norwegian service to LGW has already been announced to begin in March 2018.
Korean Air Destination: Incheon International Airport (ICN) Aircraft: Boeing 777-300 Seating Configuration: 277 Weekly Departures: 1 Starting Date: Early 2020
United Airlines Destination: Juan Santamaría International Airport (SJO) Aircraft: Boeing 737-800 Seating Configuration: 166 Weekly Departures: 4 Starting Date: Late 2020
AUSTIN-BERGSTROM INTERNATIONAL AIRPORT (ABIA) MASTER PLAN FINAL DRAFT
January 2018 Aviation Activity Forecast Chapter 3 | Page 49
Load factors for the assumed flights were applied to the seating configuration for these assumed flights and then annualized to determine the forecasted international enplaned passengers through 2021. Growth in international enplaned passengers after 2021 was assumed to occur naturally. As such, the growth is likely to occur at a rate similar to that at other airports in the United States over that time. The FAA Aerospace Forecast18 estimates that international revenue passenger miles will increase at an average of 3.2 percent per annum from 2021 through 2037. This rate was applied to the results of the short-term international enplaned passenger forecast to determine the long-term forecast.
3.5.4 Forecast Summary Based on the model used, domestic O&D enplaned passengers at ABIA are forecast to increase from a 5.8 million in 2016 to 12.1 million in 2037, representing an AAGR of 3.5 percent. The domestic connecting enplaned passenger forecast was derived from the domestic O&D enplaned passenger forecast. Based on the assumptions used, domestic connecting enplaned passengers will increase from 261,812 in 2016 to 769,000 in 2037, representing an AAGR of 5.3 percent. The result of the bottom-up approach combined with the application of the FAA Aerospace Forecast growth rates is that international passenger enplanements are forecast to increase from 133,829 in 2016 to 512,600 in 2037, representing an AAGR of 6.6 percent. The aggregation of the domestic O&D, domestic connecting, and the international enplaned passenger forecast results in the total enplaned passenger forecast. Overall, total enplaned passengers at ABIA are forecast to increase from 6.2 million in 2016 to 13.3 million in 2037, representing an AAGR of 3.7 percent. Table 3.5-1 provides a summary of the enplaned passenger forecast by segment.
3.5.5 Forecast Scenarios In addition to the baseline enplaned passenger forecast presented thus far, high and low scenarios were developed to account for the uncertainty associated with a long-term forecast. The alternative scenarios are described in the following sections.
3.5.5.1 High Case Scenario Under the baseline forecast, the MSA’s GRP is forecast to increase at an AAGR of 3.0 percent through 2037. However, in recent years the GRP for the region has increased at a rate twice the forecasted growth. Therefore, the high case scenario assumes higher economic growth for the Austin region. Under the high case scenario, the MSA’s GRP is assumed to increase at an AAGR
18 Federal Aviation Administration, FAA Aerospace Forecast, Fiscal Years 2017-2037.

AUSTIN-BERGSTROM INTERNATIONAL AIRPORT (ABIA) MASTER PLAN FINAL DRAFT
January 2018 Aviation Activity Forecast Chapter 3 | Page 50
of 4.0 through 2037. The higher economic growth results in an increase in domestic enplaned passengers of 2.2 million by 2037 when compared to the baseline.
Table 3.5-1: Enplaned Passenger Forecast Results
YEAR DOMESTIC
INTERNATIONAL TOTAL O&D CONNECTING
Historical
1998 2,937,884 88,216 1,054 3,027,154 1999 3,218,722 131,218 0 3,349,940 2000 3,757,224 162,110 11,148 3,930,482 2001 3,493,188 181,261 7,333 3,681,782 2002 3,259,799 168,191 11,312 3,439,302 2003 3,250,158 170,098 16,311 3,436,567 2004 3,522,545 170,441 14,878 3,707,864 2005 3,759,971 154,297 7,935 3,922,203 2006 4,034,880 172,367 4,062 4,211,309 2007 4,369,839 169,248 13,394 4,552,481 2008 4,399,494 174,409 45,727 4,619,630 2009 3,911,388 187,525 14,631 4,113,544 2010 4,129,383 202,290 2,527 4,334,200 2011 4,313,562 235,395 4,580 4,553,537 2012 4,443,704 267,758 14,049 4,725,511 2013 4,701,107 292,924 26,370 5,020,401 2014 5,000,536 295,025 81,943 5,377,504 2015 5,565,977 283,715 121,320 5,971,012 2016 5,833,300 261,812 133,829 6,228,941
Estimate 2017 6,508,841 289,300 169,400 6,967,541
Forecast
2019 7,263,030 334,970 261,100 7,859,100 2021 7,717,000 369,000 307,800 8,393,800 2024 8,443,000 426,000 342,200 9,211,200 2037 12,047,000 769,000 512,600 13,328,600
RANGE AVERAGE ANNUAL GROWTH RATE
1998-2008 4.1% 7.1% 45.8% 4.3% 2008-2016 3.6% 5.2% 14.4% 3.8% 1998-2016 3.9% 6.2% 30.9% 4.1% 2016-2024 4.7% 6.3% 12.5% 5.0% 2024-2037 2.8% 4.6% 3.2% 2.9% 2016-2037 3.5% 5.3% 6.6% 3.7%
Sources: City of Austin Aviation Department, Austin-Bergstrom International Airport Aviation Activity Reports; Woods & Poole, The
Complete Economic and Demographic Data Source (CEDDS) 2017. U.S. Department of Transportation, Air Passenger Origin-Destination Survey. Landrum & Brown 2017.
The high case also assumes that the international service at ABIA is more successful than estimated. The baseline forecast assumed that after 2021 enplaned international passengers would increase at the same rate as the national average. However, under the high case it is

AUSTIN-BERGSTROM INTERNATIONAL AIRPORT (ABIA) MASTER PLAN FINAL DRAFT
January 2018 Aviation Activity Forecast Chapter 3 | Page 51
assumed that international enplaned passengers at ABIA would increase at a rate that is on average 1.5 percentage points higher than the year-over-year national average. The result is an increase in international enplaned passengers of 132,600 by 2037 when compared to the baseline.
3.5.5.2 Low Case Scenario The low case scenario assumes the Austin region will not meet the current GRP forecast. Under the low case scenario, the MSA’s GRP is assumed to increase at an AAGR of 2.5 percent through 2037. The lower economic growth results in a decrease in domestic enplaned passengers of 1.0 million by 2037 when compared to the baseline. The low case assumes that the roll-out of the new international service proposed in this document will be prolonged and the flights will occur over the next seven years rather than five. Additionally, the low case also assumes that the international service at ABIA is less successful than estimated. Under the low case, it is assumed that international enplaned passengers at ABIA would increase at a rate that is on average 0.25 percent lower than the year-over-year national average. The result is a decrease in international enplaned passengers of 46,000 by 2037 when compared to the baseline.
3.5.5.3 Summary of Scenario Forecasts The enplaned passenger forecast scenarios provide a range of 12.3 million to 15.7 million. Exhibit 3.5-2 provides a comparison of the forecast scenarios and a more detailed overview of the scenarios is provided in Table 3.5-2.

AUSTIN-BERGSTROM INTERNATIONAL AIRPORT (ABIA) MASTER PLAN FINAL DRAFT
January 2018 Aviation Activity Forecast Chapter 3 | Page 52
Exhibit 3.5-2: Comparison of Enplaned Passenger Forecast Scenarios
Sources: Woods & Poole, The Complete Economic and Demographic Data Source (CEDDS) 2017. U.S. Department of
Transportation, Air Passenger Origin-Destination Survey. Landrum & Brown, 2017.
0
2
4
6
8
10
12
14
16
18
20
2016 2019 2022 2025 2028 2031 2034 2037
Calendar Year
Annual Enplaned Passengers(in millions)
2024 Range (High - Low)729,800 Passengers
2037 Range (High - Low)3,403,000 Passengers

AUSTIN-BERGSTROM INTERNATIONAL AIRPORT (ABIA) MASTER PLAN FINAL DRAFT
January 2018 Aviation Activity Forecast Chapter 3 | Page 53
Table 3.5-2: Summary of Enplaned Passenger Forecast Scenarios
YEAR DOMESTIC INTERNATIONAL TOTAL
LOW BASE HIGH LOW BASE HIGH LOW BASE HIGH Historical 2016 6,095,112 6,095,112 6,095,112 133,829 133,829 133,829 6,228,941 6,228,941 6,228,941
Estimate 2017 6,798,141 6,798,141 6,798,141 169,400 169,400 169,400 6,967,541 6,967,541 6,967,541
Forecast
2019 7,556,000 7,598,000 7,682,000 234,000 261,100 261,100 7,790,000 7,859,100 7,943,100
2021 7,977,000 8,086,000 8,308,000 283,800 307,800 307,800 8,260,800 8,393,800 8,615,800
2024 8,644,000 8,869,000 9,338,000 321,400 342,200 357,200 8,965,400 9,211,200 9,695,200
2037 11,836,000 12,816,000 15,060,000 466,200 512,600 645,200 12,302,200 13,328,600 15,705,200
RANGE AVERAGE ANNUAL GROWTH RATE 2016-2024 4.5% 4.8% 5.5% 11.6% 12.5% 13.1% 4.7% 5.0% 5.7%
2024-2037 2.4% 2.9% 3.7% 2.9% 3.2% 4.7% 2.5% 2.9% 3.8%
2016-2037 3.2% 3.6% 4.4% 6.1% 6.6% 7.8% 3.3% 3.7% 4.5%
Sources: Woods & Poole, The Complete Economic and Demographic Data Source (CEDDS) 2017. U.S. Department of Transportation, Air Passenger Origin-Destination Survey.
Landrum & Brown, 2017.
AUSTIN-BERGSTROM INTERNATIONAL AIRPORT (ABIA) MASTER PLAN FINAL DRAFT
January 2018 Aviation Activity Forecast Chapter 3 | Page 54
Air Cargo Throughput Forecasts This section presents the forecast of air cargo throughput for ABIA through the forecast period as well as a discussion of the methodology used to develop this forecast. In a similar fashion to the enplaned passenger forecast, the air cargo throughput forecast provides the basis for the all-cargo, or freighter, aircraft operations forecast.
3.6.1 Methodology A variety of methods were explored to forecast air cargo throughput at ABIA including econometric modeling. However, none of the potential socio-economic indicators explored produced reasonable test results or realistic forecasts nor did they accurately depict the changes anticipated due to e-commerce. It is assumed that growth in air cargo at ABIA will be heavily dependent on the growth of e-commerce. Amazon.com, the largest online retailer in the U.S., is expected to be at the forefront of the growth in e-commerce. Studies have shown that a majority of the members of Amazon Prime, a paid subscription service which provides free two-day delivery, shop at Amazon.com at least two to three times a month. Currently, 70 percent of higher-income households, those that earn $100,000 or more annually, have an Amazon Prime membership compared to 50 percent of lower-income households. In the Austin MSA, higher-income households are expected to increase 3.6 percent per annum through 2037. During the same timeframe, it is assumed that the adoption rate of Prime membership for these households will increase to 80 percent. Lower-income households are expected to increase only 1.1 percent per annum through 2037. Walmart, Target, and other retailers are expected to provide services similar to Prime in the near-term which is expected to increase adoption rate of e-commerce in lower-income households. As such, with using Prime membership as a proxy, adoption rates for lower-income households are expected to increase from 50 percent in 2016 to 65 percent in 2037. Total e-commerce adoption in the Austin MSA was determined by multiplying each household segment by their respective adoption rates and aggregating the results. Based on this analysis, it was determined that household e-commerce adoption will increase in the Austin MSA by 3.1 percent per annum through the forecast period. The year-over-year growth rates for e-commerce adoption was applied to the historical cargo throughput ABIA.
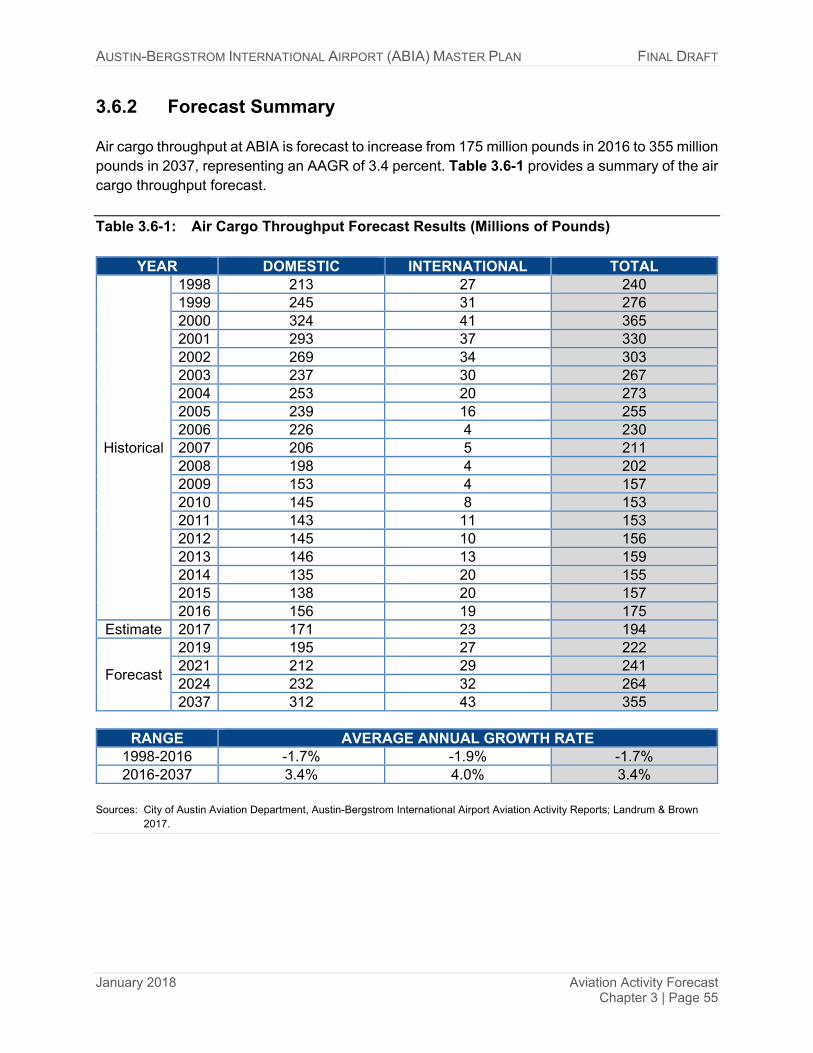
AUSTIN-BERGSTROM INTERNATIONAL AIRPORT (ABIA) MASTER PLAN FINAL DRAFT
January 2018 Aviation Activity Forecast Chapter 3 | Page 55
3.6.2 Forecast Summary Air cargo throughput at ABIA is forecast to increase from 175 million pounds in 2016 to 355 million pounds in 2037, representing an AAGR of 3.4 percent. Table 3.6-1 provides a summary of the air cargo throughput forecast.
Table 3.6-1: Air Cargo Throughput Forecast Results (Millions of Pounds)
YEAR DOMESTIC INTERNATIONAL TOTAL
Historical
1998 213 27 240 1999 245 31 276 2000 324 41 365 2001 293 37 330 2002 269 34 303 2003 237 30 267 2004 253 20 273 2005 239 16 255 2006 226 4 230 2007 206 5 211 2008 198 4 202 2009 153 4 157 2010 145 8 153 2011 143 11 153 2012 145 10 156 2013 146 13 159 2014 135 20 155 2015 138 20 157 2016 156 19 175
Estimate 2017 171 23 194
Forecast
2019 195 27 222 2021 212 29 241 2024 232 32 264 2037 312 43 355
RANGE AVERAGE ANNUAL GROWTH RATE
1998-2016 -1.7% -1.9% -1.7% 2016-2037 3.4% 4.0% 3.4%
Sources: City of Austin Aviation Department, Austin-Bergstrom International Airport Aviation Activity Reports; Landrum & Brown
2017.

AUSTIN-BERGSTROM INTERNATIONAL AIRPORT (ABIA) MASTER PLAN FINAL DRAFT
January 2018 Aviation Activity Forecast Chapter 3 | Page 56
3.6.3 Forecast Scenarios In addition to the baseline cargo throughput forecast presented thus far, high and low scenarios were developed to account for the uncertainty associated with a long-term forecast. The alternative scenarios are described in the following sections.
3.6.3.1 High Case Scenario The high case scenario assumes that an e-commerce distribution center will be developed at ABIA. Assumptions regarding this scenario were made based on empirical knowledge of the industry. It was assumed that the distribution hub will begin service in 2027 with more than 25,500 annual operations primarily utilizing the Boeing 767-300 aircraft. Within the first five years, aircraft operations are expected to nearly triple adding a number of narrow-body aircraft for short-haul flights. In 2037, 91,250 aircraft operations are forecast to occur as a result of the e-commerce distribution center. The max payload for the fleet was multiplied by an assumed occupancy factor of 35.0 percent. The development of the distribution center results in an increase in cargo throughput of 3,060 million pounds by 2037 when compared to the baseline.
3.6.3.2 Low Case Scenario The low case scenario assumes adoption rates for e-commerce will remain at 2016 level through the forecast period. The lower adoption rates for e-commerce results in a decrease in cargo throughput of 67 million pounds by 2037 when compared to the baseline.
3.6.3.3 Summary of Scenario Forecasts The cargo throughput forecast scenarios provide a range of 288 million to 3,415 million pounds. Exhibit 3.6-1 provides a comparison of the forecast scenarios and a more detailed overview of the scenarios is provided in Table 3.6-2.

AUSTIN-BERGSTROM INTERNATIONAL AIRPORT (ABIA) MASTER PLAN FINAL DRAFT
January 2018 Aviation Activity Forecast Chapter 3 | Page 57
Exhibit 3.6-1: Comparison of Cargo Throughput Forecast Scenarios Exhibit 3.6-2:
Sources: City of Austin Aviation Department, Austin-Bergstrom International Airport Aviation Activity Reports; Landrum & Brown,
2017.
0
500
1,000
1,500
2,000
2,500
3,000
3,500
4,000
2016 2019 2022 2025 2028 2031 2034 2037
Calendar Year
Annual Cargo Volume(in millions of pounds)
2024 Range (High - Low)38 Million Pounds
2037 Range (High - Low)3,127 Million Pounds

AUSTIN-BERGSTROM INTERNATIONAL AIRPORT (ABIA) MASTER PLAN FINAL DRAFT
January 2018 Aviation Activity Forecast Chapter 3 | Page 58
Table 3.6-2: Summary of Cargo Throughput Forecast Scenarios
YEAR DOMESTIC INTERNATIONAL TOTAL
LOW BASE HIGH LOW BASE HIGH LOW BASE HIGH Historical 2016 156 156 156 19 19 19 175 175 175 Estimate 2017 171 171 171 23 23 23 194 194 194
Forecast
2019 178 195 195 25 27 27 203 222 222 2021 187 212 212 26 29 29 213 241 241 2024 200 232 232 27 32 32 227 264 264 2037 253 312 3,003 35 43 412 288 355 3,415
RANGE AVERAGE ANNUAL GROWTH RATE 2016-2024 3.1% 5.1% 5.1% 4.5% 6.8% 6.8% 3.3% 5.3% 5.3% 2024-2037 1.8% 2.3% 21.8% 2.0% 2.3% 21.7% 1.9% 2.3% 21.7% 2016-2037 2.3% 3.4% 15.1% 3.0% 4.0% 15.8% 2.4% 3.4% 15.2%
Sources: City of Austin Aviation Department, Austin-Bergstrom International Airport Aviation Activity Reports; Landrum & Brown, 2017.

AUSTIN-BERGSTROM INTERNATIONAL AIRPORT (ABIA) MASTER PLAN FINAL DRAFT
January 2018 Aviation Activity Forecast Chapter 3 | Page 59
Aircraft Operations Forecast This section describes the methodology and the results of the aircraft operations forecast at ABIA. Aircraft operations, defined as aircraft arrivals plus departures, were forecast separately for five major categories: (1) passenger; (2) all-cargo; (3) air taxi; (4) general aviation; and (5) military. These components are then aggregated to derive a total aircraft operations forecast for ABIA.
3.7.1 Passenger Aircraft Operations
3.7.1.1 Methodology The number of passenger aircraft operations at an airport depends on three factors: (1) total passengers; (2) average aircraft size; and (3) average load factor (percent of seats occupied). The relationship is shown in the equation below:
Passenger Aircraft Operations= Total Passengers
Average Load Factor * Average Aircraft Size
This relationship permits an infinite set of load factors, average aircraft size, and operations to accommodate a given number of passengers. The domestic enplaned passenger forecast was used to derive the domestic passenger aircraft operations. The enplaned passenger forecast was used as the numerator in the formula above with assumed values for the load factors and average aircraft size to determine passenger aircraft departures. To calculate total operations, the total number of departures was multiplied by a factor of two. Through 2021, the international passenger aircraft operations forecast was developed by including the assumed flights to be added as part of the international enplaned passenger forecast. Beyond 2021, the international passenger aircraft operations forecast used the same methodology as the domestic passenger aircraft operations forecast. In order to develop reasonable load factor and average number of seats per aircraft assumptions, enplaned passengers and passenger aircraft departures were disaggregated into categories of activity (i.e. air carrier and regional activity for both domestic and international service). Load factors and the average aircraft size, or average seats per departure (ASPD), at every airport is inherently different due to differences in how airlines choose to serve the demand for air travel to, from, and over each airport. These differences may result from a strategic focus on unit revenue versus unit costs or an emphasis on a hub and spoke system versus a point-to-point operation.

AUSTIN-BERGSTROM INTERNATIONAL AIRPORT (ABIA) MASTER PLAN FINAL DRAFT
January 2018 Aviation Activity Forecast Chapter 3 | Page 60
A number of sources were used to develop the historical passenger aircraft operations, load factors, and the ASPD for ABIA. The Official Airline Guide (OAG); FAA, Operations Network (OPSNET); and U.S. Department of Transportation (U.S. DOT), Air Carrier Statistics database (T-100) were used to develop total departures and seats for each segment. ASPD for each of the major groups of passenger activity was calculated from total departures and total departing seats. Aircraft load factors were calculated for each group of passenger aircraft operations by dividing total enplaned passengers by total departing seats.
3.7.1.2 Passengers Per Operation The average number of seats per aircraft for each category of activity is directly related to the type of aircraft being utilized at ABIA. A majority of the domestic passenger traffic at ABIA is handled by four mainline carriers. Therefore, in order to estimate the future average number of seats per aircraft, the fleet plans for these carriers were examined. The following is a description of the current fleet plans for each of the mainline carriers with a focus on potential changes at ABIA:
Southwest Airlines: The Southwest Airlines’ Boeing 737-700 aircraft is the most used aircraft at ABIA. The aircraft accounted for almost a third of the total scheduled passenger operations in 2016. The Boeing 737-300 in Southwest Airlines’ fleet are to be retired by the end of 2017. It is expected that the airline will fill the demand with their current fleet of Boeing 737-800 and Boeing 737-700 aircraft. Currently, Southwest Airlines has a number of Boeing 737 Max8 and Boeing 737 Max7 aircraft on order. It is expected these aircraft will handle some of the service at ABIA as soon as deliveries are made which are expected to begin in 2017 for the Boeing 737 Max8 and 2019 for the Boeing 737 Max7.
American Airlines: Currently, American Airlines utilizes a mix of the Boeing MD-80, Boeing 737-800, Airbus A319, and Airbus A321 aircraft at ABIA. The Boeing MD-80 aircraft are expected to be retired by the end of 2018. These aircraft will initially be replaced with American Airlines’ existing Boeing 737-800 and Airbus A319 aircraft. American Airlines has 100 orders for the Boeing 737 Max8 aircraft with deliveries set to begin in 2017. The aircraft will likely be utilized interchangeably with the Boeing 737-800 aircraft.
United Airlines: United Airlines deploys an even mix of the Airbus A319, Airbus A320, Boeing 737-800, and Boeing 737-900 aircraft at ABIA. United Airlines has orders for the Boeing 737 Max9 aircraft which will be utilized at ABIA as the aircraft are delivered. It is anticipated that as demand on particular routes, such as Newark Liberty International Airport and San Francisco International Airport, approach the upper limits of capacity afforded by narrow-body aircraft, United Airlines will begin to deploy wide-body aircraft, such as the Boeing 777-200ER.
Delta Air Lines: Delta Air Lines uses a mix of the Airbus A319, Boeing 757, and Boeing MD-90 at ABIA. The Boeing MD-90 is expected to be replaced beginning in the summer of 2017. The older Boeing 757 aircraft are expected to be retired during the forecast period and the Airbus A321-200 will act as its replacement. The airline will also begin utilizing the Bombardier CS100 where applicable.

AUSTIN-BERGSTROM INTERNATIONAL AIRPORT (ABIA) MASTER PLAN FINAL DRAFT
January 2018 Aviation Activity Forecast Chapter 3 | Page 61
Small regional jets are being retired at an accelerated rate as the airlines believe these aircraft are too expensive to fly. A majority of the small regional aircraft have already been eliminated from routes at ABIA. It is expected that all of the regional partners of the mainline carriers will completely replace all remaining small regional aircraft at ABIA within the next five years. However, Texas Sky, a regional charter brand of Public Charters, Inc., utilizes the British Aerospace Jetstream 32 and 41 aircraft for their intrastate service and ViaAir, which provides service to the Branson Airport, utilizes the Embraer ERJ145 aircraft. These airlines will continue utilize the small regional jets for operations at ABIA for the foreseeable future. In 2016, domestic air carrier aircraft operations had an ASPD of 148.8 and an average load factor of 82.4 percent. Based on the fleet plans for the airlines providing domestic service at ABIA, the ASPD for domestic air carrier flights is projected to increase to 158.5 in 2037. Meanwhile, load factors for domestic air carrier flights are expected to increase to an average of 85.0 percent by 2037. Considering that the domestic commuter fleet operating at ABIA is already primarily comprised of large regional aircraft, the ASPD for domestic commuter aircraft operations is not expected to change materially over the forecast period. It is assumed that ASPD for domestic commuter aircraft operations will increase from 72.6 in 2016 to 74.3 in 2037. Domestic commuter aircraft operating at ABIA had an annual load factor of 87.6 percent in 2016. This is a load factor that is difficult to maintain over the course of an entire year given seasonality. Therefore, it is unlikely that the load factors will change materially over the course of the forecast period. It was assumed that load factors will increase to 88.0 percent by 2037. Exhibit 3.7-1 provides ASPD and load factors used to calculate domestic aircraft operations by air carrier and commuter airlines.

AUSTIN-BERGSTROM INTERNATIONAL AIRPORT (ABIA) MASTER PLAN FINAL DRAFT
January 2018 Aviation Activity Forecast Chapter 3 | Page 62
Exhibit 3.7-1: Domestic Passengers Per Operation Assumptions
Sources: U.S. Department of Transportation, Air Carrier Statistics database (T-100). OAG Aviation Worldwide Ltd, OAG Schedules
Analyser. Landrum & Brown, 2017.
Internationally, the wide-body aircraft such as variants of the Boeing 787 and the Boeing 777 aircraft will continue to be used exclusively for transoceanic international travel. Flights to and from Canada will almost exclusively use large regional aircraft like the Embraer 175. Latin American service, including Mexico, will continue to utilize a mix of large regional and narrow-body aircraft. Based on the assumed new flights over the next five years, particularly with the new transoceanic flights, the ASPD for international air carrier aircraft operations is expected to increase significantly from 183.7 in 2016 to 219.4 in 2021 and remain at this average configuration through the remainder of the forecast period. In 2016, international air carrier aircraft operations had an average load factor of 73.4 percent. This is assumed to increase to 85.0 percent by 2037. It is assumed that ASPD for international commuter aircraft operations will decrease from 74.7 in 2016 to 74.0 in 2037. This decline is the result of Air Canada opting to use the 73-seat Embraer 175 over the 75-seat Canadair CRJ Series 705 for their operations at ABIA, including their assumed service to Vancouver. International commuter aircraft operating at ABIA had an annual load factor of 70.9 percent in 2016. This load factor is expected to increase significantly as the current service and projected new service is given time to mature. Therefore, it is assumed that the load factors will increase to 85.0 percent by 2037.
82.4%83.1%
83.5%
85.0%87.6%
88.0% 88.0% 88.0%
79%
80%
81%
82%
83%
84%
85%
86%
87%
88%
89%
2016 2021 2024 2037
Calendar Year
Average Load Factor(in percent)
148.8 153.2 153.6 158.7
72.6 74.1 74.1 74.3
0
20
40
60
80
100
120
140
160
180
2016 2021 2024 2037Calendar Year
Average Seating Configuration(in seats per operations)
Air Carrier
Commuter
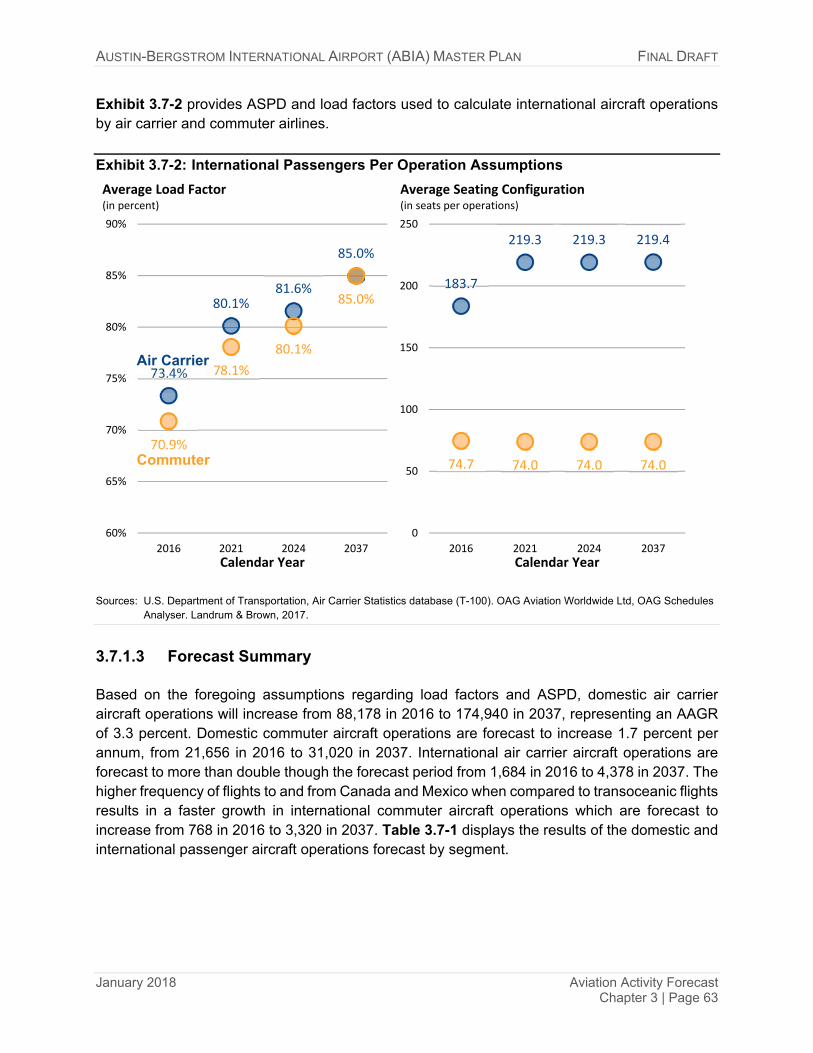
AUSTIN-BERGSTROM INTERNATIONAL AIRPORT (ABIA) MASTER PLAN FINAL DRAFT
January 2018 Aviation Activity Forecast Chapter 3 | Page 63
Exhibit 3.7-2 provides ASPD and load factors used to calculate international aircraft operations by air carrier and commuter airlines.
Exhibit 3.7-2: International Passengers Per Operation Assumptions
Sources: U.S. Department of Transportation, Air Carrier Statistics database (T-100). OAG Aviation Worldwide Ltd, OAG Schedules
Analyser. Landrum & Brown, 2017.
3.7.1.3 Forecast Summary Based on the foregoing assumptions regarding load factors and ASPD, domestic air carrier aircraft operations will increase from 88,178 in 2016 to 174,940 in 2037, representing an AAGR of 3.3 percent. Domestic commuter aircraft operations are forecast to increase 1.7 percent per annum, from 21,656 in 2016 to 31,020 in 2037. International air carrier aircraft operations are forecast to more than double though the forecast period from 1,684 in 2016 to 4,378 in 2037. The higher frequency of flights to and from Canada and Mexico when compared to transoceanic flights results in a faster growth in international commuter aircraft operations which are forecast to increase from 768 in 2016 to 3,320 in 2037. Table 3.7-1 displays the results of the domestic and international passenger aircraft operations forecast by segment.
73.4%
80.1%81.6%
85.0%
70.9%
78.1%
80.1%
85.0%
60%
65%
70%
75%
80%
85%
90%
2016 2021 2024 2037Calendar Year
Average Load Factor(in percent)
Air Carrier
Commuter
183.7
219.3 219.3 219.4
74.7 74.0 74.0 74.0
0
50
100
150
200
250
2016 2021 2024 2037Calendar Year
Average Seating Configuration(in seats per operations)

AUSTIN-BERGSTROM INTERNATIONAL AIRPORT (ABIA) MASTER PLAN FINAL DRAFT
January 2018 Aviation Activity Forecast Chapter 3 | Page 64
Passenger Aircraft Operations By Segment
YEAR DOMESTIC INTERNATIONAL
Grand Total
AIR CARRIER
COMMUTER TOTAL AIR
CARRIER COMMUTER TOTAL
Historical 2016 88,178 21,656 109,834 1,684 768 2,452 112,286 Estimate 2017 100,256 16,264 116,520 1,702 1,436 3,138 119,658
Forecast
2019 111,000 18,320 129,320 2,244 2,170 4,414 133,734 2021 117,040 19,640 136,680 2,790 2,170 4,960 141,640 2024 127,440 21,520 148,960 3,046 2,350 5,396 154,356 2037 174,940 31,020 205,960 4,378 3,320 7,698 213,658
RANGE Average Annual Growth Rates
2016-2037 3.3% 1.7% 3.0% 4.7% 7.2% 5.6% 3.1% Sources: City of Austin Aviation Department, Austin-Bergstrom International Airport Aviation Activity Reports. City of Austin Aviation Department, Landing Reports.
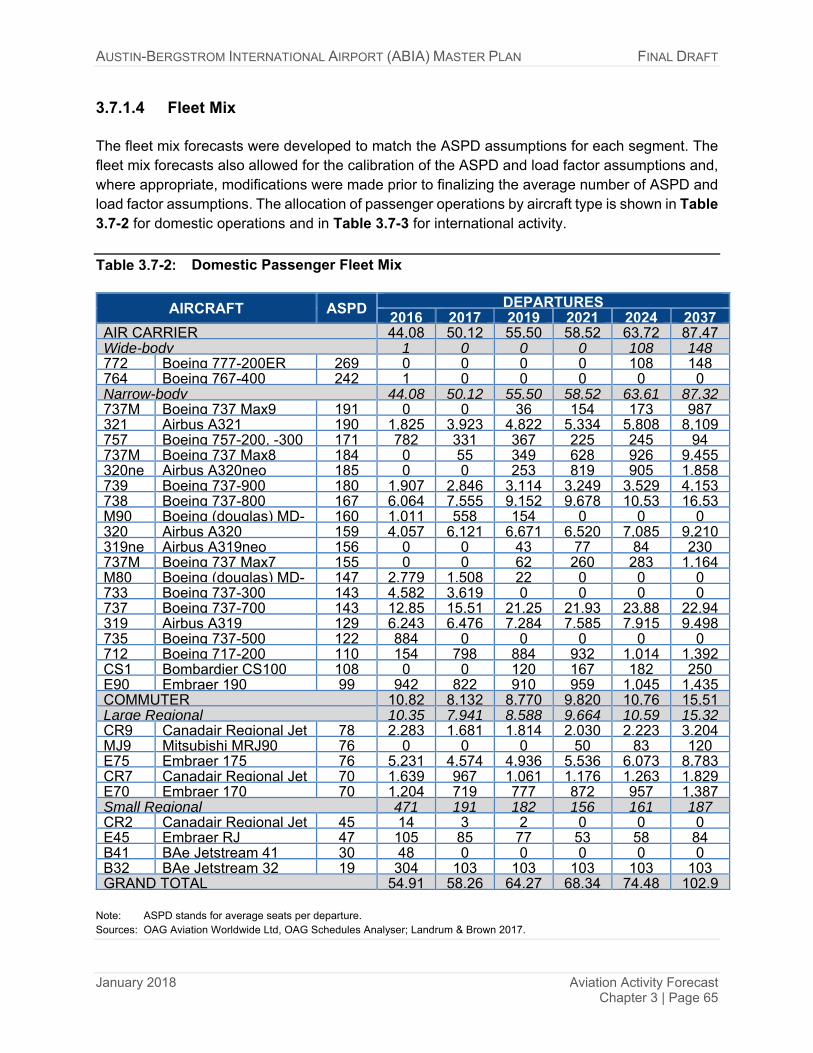
AUSTIN-BERGSTROM INTERNATIONAL AIRPORT (ABIA) MASTER PLAN FINAL DRAFT
January 2018 Aviation Activity Forecast Chapter 3 | Page 65
3.7.1.4 Fleet Mix The fleet mix forecasts were developed to match the ASPD assumptions for each segment. The fleet mix forecasts also allowed for the calibration of the ASPD and load factor assumptions and, where appropriate, modifications were made prior to finalizing the average number of ASPD and load factor assumptions. The allocation of passenger operations by aircraft type is shown in Table 3.7-2 for domestic operations and in Table 3.7-3 for international activity.
Domestic Passenger Fleet Mix
AIRCRAFT ASPD DEPARTURES 2016 2017 2019 2021 2024 2037
AIR CARRIER 44,08 50,12 55,50 58,52 63,72 87,47Wide-body 1 0 0 0 108 148772 Boeing 777-200ER 269 0 0 0 0 108 148764 Boeing 767-400 242 1 0 0 0 0 0Narrow-body 44,08 50,12 55,50 58,52 63,61 87,32737M Boeing 737 Max9 191 0 0 36 154 173 987321 Airbus A321 190 1,825 3,923 4,822 5,334 5,808 8,109757 Boeing 757-200, -300 171 782 331 367 225 245 94737M Boeing 737 Max8 184 0 55 349 628 926 9,455320ne Airbus A320neo 185 0 0 253 819 905 1,858739 Boeing 737-900 180 1,907 2,846 3,114 3,249 3,529 4,153738 Boeing 737-800 167 6,064 7,555 9,152 9,678 10,53 16,53M90 Boeing (douglas) MD- 160 1,011 558 154 0 0 0320 Airbus A320 159 4,057 6,121 6,671 6,520 7,085 9,210319ne Airbus A319neo 156 0 0 43 77 84 230737M Boeing 737 Max7 155 0 0 62 260 283 1,164M80 Boeing (douglas) MD- 147 2,779 1,508 22 0 0 0733 Boeing 737-300 143 4,582 3,619 0 0 0 0737 Boeing 737-700 143 12,85 15,51 21,25 21,93 23,88 22,94319 Airbus A319 129 6,243 6,476 7,284 7,585 7,915 9,498735 Boeing 737-500 122 884 0 0 0 0 0712 Boeing 717-200 110 154 798 884 932 1,014 1,392CS1 Bombardier CS100 108 0 0 120 167 182 250E90 Embraer 190 99 942 822 910 959 1,045 1,435COMMUTER 10,82 8,132 8,770 9,820 10,76 15,51Large Regional 10,35 7,941 8,588 9,664 10,59 15,32CR9 Canadair Regional Jet 78 2,283 1,681 1,814 2,030 2,223 3,204MJ9 Mitsubishi MRJ90 76 0 0 0 50 83 120E75 Embraer 175 76 5,231 4,574 4,936 5,536 6,073 8,783CR7 Canadair Regional Jet 70 1,639 967 1,061 1,176 1,263 1,829E70 Embraer 170 70 1,204 719 777 872 957 1,387Small Regional 471 191 182 156 161 187CR2 Canadair Regional Jet 45 14 3 2 0 0 0E45 Embraer RJ 47 105 85 77 53 58 84B41 BAe Jetstream 41 30 48 0 0 0 0 0B32 BAe Jetstream 32 19 304 103 103 103 103 103GRAND TOTAL 54,91 58,26 64,27 68,34 74,48 102,9
Note: ASPD stands for average seats per departure. Sources: OAG Aviation Worldwide Ltd, OAG Schedules Analyser; Landrum & Brown 2017.

AUSTIN-BERGSTROM INTERNATIONAL AIRPORT (ABIA) MASTER PLAN FINAL DRAFT
January 2018 Aviation Activity Forecast Chapter 3 | Page 66
International Passenger Fleet Mix
AIRCRAFT ASPD DEPARTURES 2016 2017 2019 2021 2024 2037
AIR CARRIER 842 851 1,122 1,395 1,523 2,189 Wide-body 388 415 688 779 851 1,219763 Boeing 767-300ER 259 18 46 46 46 50 74777 Boeing 777 256 152 7 7 59 64 90789 Boeing 787-900 255 218 362 635 674 737 1,055Narrow-body 454 436 434 616 672 970320 Airbus A320 179 61 107 107 107 116 166321 Airbus A321 187 3 3 3 3 3 3737 Boeing 737-700 153 292 293 293 293 321 466738 Boeing 737-800 166 39 14 14 196 213 303739 Boeing 737-900 179 45 17 17 17 19 32E90 Embraer 190 99 14 2 0 0 0 0COMMUTER 384 718 1,085 1,085 1,175 1,660 Large Regional 384 718 1,085 1,085 1,175 1,660CR7 Canadair Regional Jet 75 300 0 0 0 0 0E70 Embraer 170 76 21 351 353 353 382 540E75 Embraer 175 73 63 367 732 732 793 1,120GRAND TOTAL 1,226 1,569 2,207 2,480 2,698 3,849
Note: ASPD stands for average seats per departure. Sources: OAG Aviation Worldwide Ltd, OAG Schedules Analyser; Landrum & Brown 2017.
3.7.2 All-Cargo Aircraft Operations
3.7.2.1 Methodology The all-cargo aircraft operations forecast was derived from the air cargo throughput forecast in a similar fashion as passenger aircraft operations are derived from the passenger forecast. The all-cargo aircraft operations are a product of the all-cargo throughput forecast and assumed average air cargo tons per operation. The air cargo throughput forecast must be segmented by mode of transportation in order to develop the all-cargo operations forecast. A majority of cargo processed at ABIA, 86.5 percent since 2011, has been handled by all-cargo carriers, primarily FedEx. The remaining share of air cargo throughput is handled by passenger airlines. This split of air cargo throughput between belly and all-cargo is expected to remain constant through the forecast period.

AUSTIN-BERGSTROM INTERNATIONAL AIRPORT (ABIA) MASTER PLAN FINAL DRAFT
January 2018 Aviation Activity Forecast Chapter 3 | Page 67
3.7.2.2 Tons Per Operation Half of the all-cargo aircraft operations, 50.2 percent in 2016, were conducted by Baron Aviation Services. Baron Aviation Services, which operates as a feeder for FedEx at ABIA, utilizes a fleet of Cessna 208 aircraft which has an available payload just over 3,000 pounds. The size of the aircraft limits the airline’s capacity. Baron Aviation Services is not expected to change their fleet over the forecast period. FedEx, the largest air cargo operator at ABIA, only conducted 20.7 percent of the all-cargo aircraft operations despite handling 65.0 percent of the air cargo throughput in 2016. FedEx utilizes a fleet predominately comprised of variants of the McDonnel Douglas MD-10 and the McDonnel Douglas MD-11 aircraft, both offering available payloads in excess of 120,000 pounds. FedEx has 69 Boeing 767-300F aircraft on order which is slated to replace their McDonnel Douglas MD-10 and the McDonnel Douglas MD-11 aircraft. The Boeing 767-300F has a maximum payload of 116,200 pounds. A majority of the remaining all-cargo aircraft operations are conducted by UPS and Kalitta Air. UPS almost exclusively utilizes the Airbus A300-600 aircraft at ABIA and currently does not have a suitable replacement on order for the aircraft. Kalitta Air utilizes the Boeing 737-400 aircraft for their flights at ABIA. Currently, the commuter aircraft are averaging 1,200 pounds per operation or slightly less than half of the total payload capacity of the Cessna 208 aircraft. It is not expected that commuter aircraft will be able to average more than 1,200 for an entire year. However, air carrier aircraft are handling less than half of their maximum payload, averaging 51,585 pounds in 2016. Therefore, is expected that the average pounds per operation will increase slightly over the forecast period.
3.7.2.3 Forecast Summary All-cargo aircraft operations are forecast to increase from 5,854 in 2016 to 11,440 in 2037 representing an AAGR of 3.2 percent.
3.7.2.4 Fleet Mix As mentioned above, FedEx is expected to replace their current fleet of McDonnel MD-10 and MD-11 aircraft with the Boeing 767-300F. However, the fleet of aircraft for the other all-cargo airlines at ABIA are not expected to change materially over the forecast period. The allocation of all-cargo aircraft operations by aircraft type is shown in Table 3.7-4.
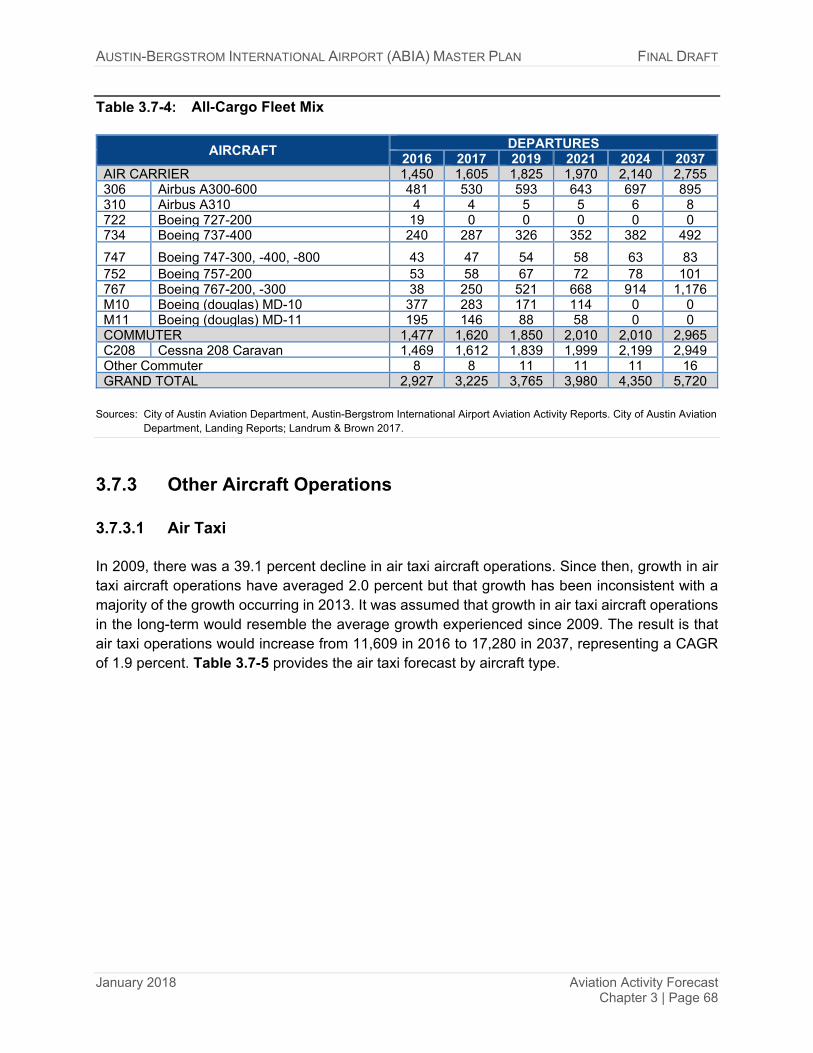
AUSTIN-BERGSTROM INTERNATIONAL AIRPORT (ABIA) MASTER PLAN FINAL DRAFT
January 2018 Aviation Activity Forecast Chapter 3 | Page 68
All-Cargo Fleet Mix
AIRCRAFT DEPARTURES 2016 2017 2019 2021 2024 2037
AIR CARRIER 1,450 1,605 1,825 1,970 2,140 2,755306 Airbus A300-600 481 530 593 643 697 895310 Airbus A310 4 4 5 5 6 8722 Boeing 727-200 19 0 0 0 0 0734 Boeing 737-400 240 287 326 352 382 492
747 Boeing 747-300, -400, -800 43 47 54 58 63 83 752 Boeing 757-200 53 58 67 72 78 101767 Boeing 767-200, -300 38 250 521 668 914 1,176M10 Boeing (douglas) MD-10 377 283 171 114 0 0M11 Boeing (douglas) MD-11 195 146 88 58 0 0COMMUTER 1,477 1,620 1,850 2,010 2,010 2,965C208 Cessna 208 Caravan 1,469 1,612 1,839 1,999 2,199 2,949Other Commuter 8 8 11 11 11 16GRAND TOTAL 2,927 3,225 3,765 3,980 4,350 5,720
Sources: City of Austin Aviation Department, Austin-Bergstrom International Airport Aviation Activity Reports. City of Austin Aviation
Department, Landing Reports; Landrum & Brown 2017.
3.7.3 Other Aircraft Operations
3.7.3.1 Air Taxi In 2009, there was a 39.1 percent decline in air taxi aircraft operations. Since then, growth in air taxi aircraft operations have averaged 2.0 percent but that growth has been inconsistent with a majority of the growth occurring in 2013. It was assumed that growth in air taxi aircraft operations in the long-term would resemble the average growth experienced since 2009. The result is that air taxi operations would increase from 11,609 in 2016 to 17,280 in 2037, representing a CAGR of 1.9 percent. Table 3.7-5 provides the air taxi forecast by aircraft type.

AUSTIN-BERGSTROM INTERNATIONAL AIRPORT (ABIA) MASTER PLAN FINAL DRAFT
January 2018 Aviation Activity Forecast Chapter 3 | Page 69
Air Taxi Fleet Mix
AIRCRAFT DEPARTURES 2016 2017 2019 2021 2024 2037
C56X Cessna 560X Citation Excel 767 785 821 856 910 1,142C750 Cessna 750 Citation X 452 463 484 505 536 673CL30 Bombardier Challenger 300 432 442 462 482 512 643E55P Embraer Phenom 300 429 439 459 479 509 639CL60 Canadair Challenger 600 292 299 312 326 346 435H25B Hawker 800 286 293 306 319 339 426LJ45 Learjet 45 251 257 269 280 298 374F2TH Dassault Falcon 2000 235 240 251 262 279 350C680 Cessna Citation Sovereign 228 233 244 255 270 339E50P Embraer Phenom 100 217 222 232 242 257 323BE40 Beechcraft 40 Beechjet 213 218 228 238 253 317C560 Cessna 560 Citation V 192 196 205 214 228 286Other Air Taxi Aircraft 1,811 1,853 1,937 2,021 2,148 2,695GRAND TOTAL 5,805 5,940 6,210 6,480 6,885 8,640
Sources: Federal Aviation Administration, Flight Track Data for 2016; Landrum & Brown 2017.
3.7.3.2 General Aviation There are a number of approaches to developing GA operations forecasts ranging from econometric, trend or time series, and market share forecasts. During the forecast development, no reasonable fit of the GA aircraft operations to time or socio-economic variables was found. Since ABIA opened, the number of GA aircraft operations has been closely correlated with the piston hours flown nationally. Exhibit 26 illustrates the relationship of GA aircraft operations at ABIA with the United States GA piston hours flown. Due to the relationship, the year-over-year growth rates provided in the FAA Aerospace Forecast were applied to the historical number of GA aircraft operations at ABIA. The result is that GA aircraft operations are forecast to decrease from 51,929 in 2016 to 43,650 in 2037, representing a 0.8 percent rate of decline per annum. However, this rate of decline is not constant among aircraft types. It is anticipated that piston aircraft are expected to decline as fewer people purchase aircraft for private use and more based piston aircraft relocate from ABIA to the Austin Executive Airport.19 Meanwhile, jets, turboprops, and helicopters for GA use are expected to remain relatively steady through the forecast period. Table 3.7-6 and Exhibit 3.7-3 provides the GA forecast by aircraft type.
19 The Austin Executive Airport is a privately owned, public-use airport located 12 miles northeast of
Austin which opened in 2011. It was designed to act as a reliever airport which has not been available in the area since 1999 when the Austin Executive Airpark closed.

AUSTIN-BERGSTROM INTERNATIONAL AIRPORT (ABIA) MASTER PLAN FINAL DRAFT
January 2018 Aviation Activity Forecast Chapter 3 | Page 70
Exhibit 3.7-3: Relationship of GA Operations at ABIA to U.S. Piston Hours Flown
Note: Correlation coefficient excludes 1999. Sources: City of Austin Aviation Department, Austin-Bergstrom International Airport Aviation Activity Reports; Federal Aviation
Administration, FAA Aerospace Forecast, Fiscal Years 2017-2037. Landrum & Brown, 2017.
General Aviation Fleet Mix
AIRCRAFT DEPARTURES 2016 2017 2019 2021 2024 2037
JETS 9,265 9,274 9,292 9,310 9,337 9,454C560 Cessna 560 Citation V 679 680 682 684 687 700C525 Cessna 525 CitationJet 577 578 580 582 585 598C56X Cessna 560X Citation Excel 572 573 575 577 580 593H25B Hawker 800 517 518 520 522 525 538Other Jets 6,920 6,925 6,935 6,945 6,960 7,025TURBOPROPS 5,333 5,335 5,339 5,343 5,349 5,375B350 Beech 350 Super King Air 1,454 1,455 1,457 1,459 1,462 1,475BE20 Beech 200 Super King Air 1,310 1,310 1,310 1,310 1,310 1,310PC12 Pilatus PC-12 742 742 742 742 742 742BE9L Beech 90 King Air 443 443 443 443 443 443Other Turboprops 1,384 1,385 1,387 1,389 1,392 1,405PISTON 8,428 8,031 7,104 6,487 5,397 4,056C172 Cessna 172 Skyhawk 2,819 2,686 2,376 2,169 1,946 1,357SR22 Cirrus SR22 774 738 653 596 535 371BE36 Beechcraft 36 Bonanza 454 433 383 349 313 217C421 Cessna 421 Golden Eagle 432 412 364 332 297 208PA28 Piper PA-28 Cherokee 414 394 348 318 286 200Other Pistons 3,535 3,368 2,980 2,723 2,442 1,703HELICOPTERS 2,939 2,940 2,940 2,940 2,940 2,940GRAND TOTAL 25,965 25,580 24,675 24,080 23,445 21,825
Sources: Federal Aviation Administration, Flight Track Data for 2016; Landrum & Brown 2017.
40
50
60
70
80
90
100
110
10 12 14 16 18 20 22 24
U.S. GA Piston Hours Flown(in thousands)
ABIA GA Aircraft Operations(in thousands)
95.1%Correlation Coefficient 1999
Austin‐BergstromInternational Airport
Opened

AUSTIN-BERGSTROM INTERNATIONAL AIRPORT (ABIA) MASTER PLAN FINAL DRAFT
January 2018 Aviation Activity Forecast Chapter 3 | Page 71
3.7.3.3 Military Military operations are aircraft operations performed by military and other governmental units. In 2014, the Armed Forces Reserve Center was opened as part of the 2005 realignment and closure process. The Reserve Center includes an apron area to park a number of Boeing CH-47 Chinook and Sikorsky UH-60 Black Hawk helicopters. The new facility spurred growth in military aircraft operations over the subsequent years after maintaining years of steady traffic. Military operations were held flat over the forecast period, equal to the 2016 aircraft operations.
3.7.4 Total Aircraft Operations The total aircraft operations forecast is the aggregation of the passenger, all-cargo, air taxi, GA, and military aircraft operations forecasts. Total aircraft operations are forecast to increase from 192,032 in 2016 to 296,428 in 2037, representing an AAGR of 2.1 percent. Table 3.7-7 provides the aircraft operations by segment through the forecast period.

AUSTIN-BERGSTROM INTERNATIONAL AIRPORT (ABIA) MASTER PLAN FINAL DRAFT
January 2018 Aviation Activity Forecast Chapter 3 | Page 72
Total Aircraft Operations Forecast
YEAR PASSENGER
CARGO AIR TAXI GENERAL AVIATION MILITARY
GRAND TOTAL DOMESTIC INTERNATIONAL
Historical
2009 92,220 664 6,634 10,120 58,410 6,466 174,514 2010 94,314 46 6,510 10,118 59,002 6,924 176,914 2011 96,352 120 6,540 10,099 56,470 6,750 176,331 2012 97,482 380 5,666 10,463 51,905 6,352 172,248 2013 101,304 728 5,752 11,460 51,334 6,069 176,647 2014 103,236 1,690 5,770 11,500 53,211 7,061 182,468 2015 110,174 2,130 5,772 11,350 53,017 8,750 191,193 2016 109,834 2,452 5,854 11,609 51,929 10,354 192,032
Estimate 2017 116,520 3,138 6,450 11,880 51,160 10,400 199,548
Forecast
2019 129,320 4,414 7,350 12,420 49,350 10,400 213,254 2021 136,680 4,960 7,960 12,960 48,160 10,400 221,120 2024 148,960 5,396 8,700 13,770 46,890 10,400 234,116 2037 205,960 7,698 11,440 17,280 43,650 10,400 296,428
RANGE AVERAGE ANNUAL GROWTH RATES
2009-2016 2.5% 20.5% -1.8% 2.0% -1.7% 7.0% 1.4% 2016-2037 3.0% 5.6% 3.2% 1.9% -0.8% 0.0% 2.1%
Sources: City of Austin Aviation Department, Austin-Bergstrom International Airport Aviation Activity Reports. City of Austin Aviation Department, Landing Reports.

AUSTIN-BERGSTROM INTERNATIONAL AIRPORT (ABIA) MASTER PLAN FINAL DRAFT
January 2018 Aviation Activity Forecast Chapter 3 | Page 73
3.7.5 Forecast Scenarios The results of the enplaned passenger and cargo throughput scenarios were used to develop high and low scenarios for the aircraft operations forecast. The alternative scenarios are described in the following sections.
3.7.5.1 High Case Scenario The high case scenarios for the enplaned passenger and cargo throughput forecasts were used to develop the high case aircraft operations forecast. No changes were made to the assumptions regarding ASPD or load factor. The cargo operations assumed in the high case cargo forecast based on the development of the e-commerce distribution center were added to the baseline cargo aircraft operations forecast. The result is that there will be an additional 129,844 aircraft operations by 2037 when compared to the baseline.
3.7.5.2 Low Case Scenario The low case scenarios for the enplaned passenger and cargo throughput forecasts were used to develop the low case aircraft operations forecast. No changes were made to the assumptions regarding ASPD, load factor, or cargo per operations. The result is that there will be a 15,446 fewer aircraft operations by 2037 when compared to the baseline.
3.7.5.3 Summary of Scenario Forecasts The aircraft operations forecast scenarios provide a range of 281,262 to 426,552. Exhibit 3.7-4 provides a comparison of the forecast scenarios and a more detailed overview of the scenarios is provided in Table 3.7-8.

AUSTIN-BERGSTROM INTERNATIONAL AIRPORT (ABIA) MASTER PLAN FINAL DRAFT
January 2018 Aviation Activity Forecast Chapter 3 | Page 74
Exhibit 3.7-4: Comparison of Aircraft Operations Forecast Scenarios
Sources: City of Austin Aviation Department, Austin-Bergstrom International Airport Aviation Activity Reports. City of Austin Aviation
Department, Landing Reports; Landrum & Brown, 2017.
0
50
100
150
200
250
300
350
400
450
500
2016 2019 2022 2025 2028 2031 2034 2037
Calendar Year
Annual Aircraft Operations(in thouands)
2024 Range (High - Low)12,900 Operations
2037 Range (High ‐ Low)
145,290 Operations

AUSTIN-BERGSTROM INTERNATIONAL AIRPORT (ABIA) MASTER PLAN FINAL DRAFT
January 2018 Aviation Activity Forecast Chapter 3 | Page 75
Summary of Aircraft Operations Forecast Scenarios
YEAR
PASSENGER CARGO OTHER TOTAL
LOW BASE HIGH LOW BASE HIGH LOW BASE HIGH LOW BASE HIGH
Historical 2016 112,286 112,286 112,286 5,854 5,854 5,854 73,892 73,892 73,892 192,032 192,032 192,032
Estimate 2017 119,658 119,658 119,658 6,450 6,450 6,450 73,440 73,440 73,440 199,548 199,548 199,548
Forecast
2019 133,034 133,734 135,174 6,740 7,350 7,350 72,170 72,170 72,170 211,944 213,254 214,694
2021 139,800 141,640 145,380 7,040 7,960 7,960 71,520 71,520 71,520 218,360 221,120 224,860
2024 151,184 154,556 162,844 7,460 8,700 8,700 71,060 71,060 71,060 229,704 234,316 242,604
2037 200,652 213,938 252,532 9,280 11,440 102,960 71,330 71,330 71,330 281,262 296,708 426,552
RANGE AVERAGE ANNUAL GROWTH RATE
2016-2024 3.8% 4.1% 4.8% 3.1% 5.1% 5.1% -0.5% -0.5% -0.5% 2.3% 2.5% 3.0%
2024-2037 2.2% 2.5% 3.4% 1.7% 2.1% 20.9% 0.0% 0.0% 0.0% 1.6% 1.8% 4.4%
2016-2037 2.8% 3.1% 3.9% 2.2% 3.2% 14.6% -0.2% -0.2% -0.2% 1.8% 2.1% 3.9%
Sources: City of Austin Aviation Department, Austin-Bergstrom International Airport Aviation Activity Reports. City of Austin Aviation Department, Landing Reports; Landrum & Brown,
2017.
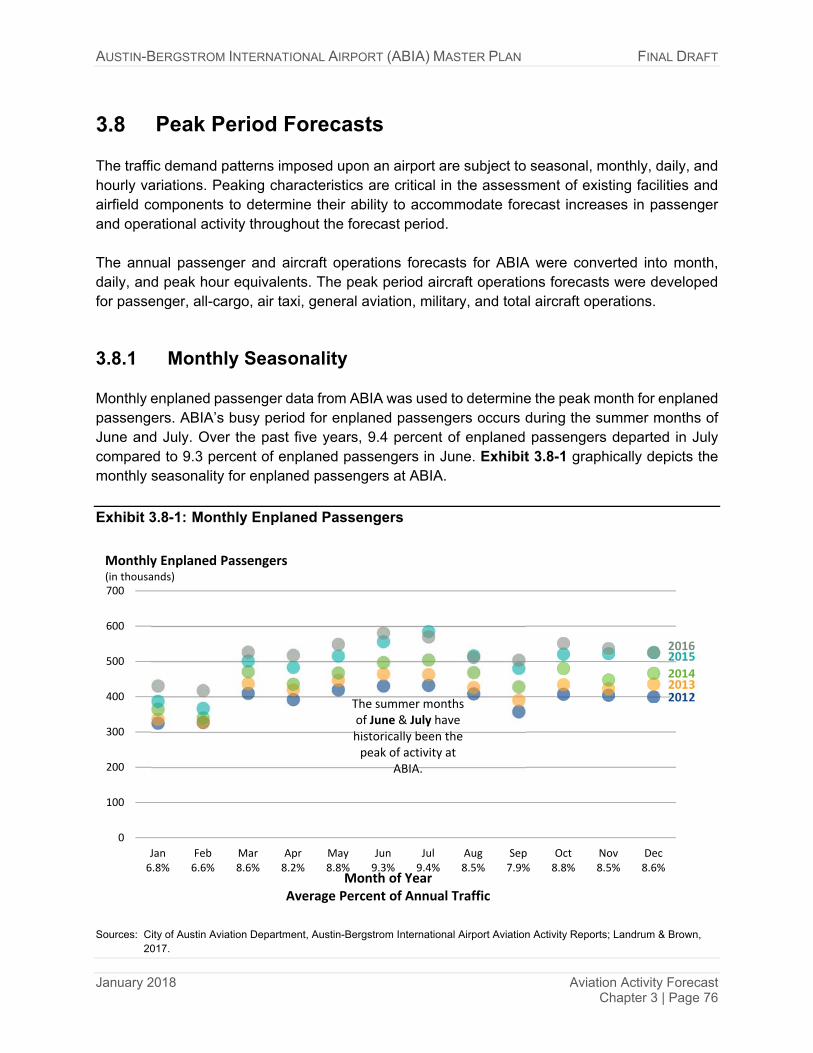
AUSTIN-BERGSTROM INTERNATIONAL AIRPORT (ABIA) MASTER PLAN FINAL DRAFT
January 2018 Aviation Activity Forecast Chapter 3 | Page 76
Peak Period Forecasts The traffic demand patterns imposed upon an airport are subject to seasonal, monthly, daily, and hourly variations. Peaking characteristics are critical in the assessment of existing facilities and airfield components to determine their ability to accommodate forecast increases in passenger and operational activity throughout the forecast period. The annual passenger and aircraft operations forecasts for ABIA were converted into month, daily, and peak hour equivalents. The peak period aircraft operations forecasts were developed for passenger, all-cargo, air taxi, general aviation, military, and total aircraft operations.
3.8.1 Monthly Seasonality Monthly enplaned passenger data from ABIA was used to determine the peak month for enplaned passengers. ABIA’s busy period for enplaned passengers occurs during the summer months of June and July. Over the past five years, 9.4 percent of enplaned passengers departed in July compared to 9.3 percent of enplaned passengers in June. Exhibit 3.8-1 graphically depicts the monthly seasonality for enplaned passengers at ABIA.
Exhibit 3.8-1: Monthly Enplaned Passengers
Sources: City of Austin Aviation Department, Austin-Bergstrom International Airport Aviation Activity Reports; Landrum & Brown,
2017.
The summer months of June & July have historically been the peak of activity at
ABIA.
201220132014
20152016
0
100
200
300
400
500
600
700
Jan6.8%
Feb6.6%
Mar8.6%
Apr8.2%
May8.8%
Jun9.3%
Jul9.4%
Aug8.5%
Sep7.9%
Oct8.8%
Nov8.5%
Dec8.6%
Month of YearAverage Percent of Annual Traffic
Monthly Enplaned Passengers(in thousands)

AUSTIN-BERGSTROM INTERNATIONAL AIRPORT (ABIA) MASTER PLAN FINAL DRAFT
January 2018 Aviation Activity Forecast Chapter 3 | Page 77
Although June and July are the peak months for enplaned passengers, October and March have been the peak months for aircraft operations. In March, Austin is the host of SXSW which caters to a number of affluent people capable of utilizing GA aircraft and air taxi services. The Formula 1 U.S. Grand Prix, and to a lesser extent the Austin City Limits Music Festival, attracts a number of similar clientele to the region in the month of October. Over the past five years, July has been the peak month for scheduled passenger aircraft operations. Exhibit 3.8-2 graphically depicts the monthly seasonality for aircraft operations at ABIA.
Exhibit 3.8-2: Monthly Aircraft Operations
Sources: City of Austin Aviation Department, Austin-Bergstrom International Airport Aviation Activity Reports; Landrum & Brown,
2017.
3.8.2 Daily Patterns The FAA recommends the use of the average day of the peak month, typically referred to as the peak month average day (PMAD), for purposes of physical planning. The PMAD is the day that most closely represents the average day in the peak month. As an alternative, the peak month average weekday (PMAWD) can be used at airports that have domestic service as the predominant activity and at airports where weekend activity is consistently less than weekday activity as is the case at ABIA.
20122013
20142015
2016
0
2
4
6
8
10
12
14
16
18
20
Jan7.7%
Feb7.4%
Mar8.7%
Apr8.5%
May8.5%
Jun8.6%
Jul8.5%
Aug8.5%
Sep8.3%
Oct8.9%
Nov8.5%
Dec8.0%
Month of YearAverage Percent of Annual Traffic
Monthly Aircraft Operations(in thousands)
SXSWHeld in March whichattracts GA and Air Taxi service at ABIA.
F1 U.S.Grand PrixHeld in October which attracts GA and AirTaxi service at ABIA.
JulyPeak month for passenger operations.
AUSTIN-BERGSTROM INTERNATIONAL AIRPORT (ABIA) MASTER PLAN FINAL DRAFT
January 2018 Aviation Activity Forecast Chapter 3 | Page 78
As demonstrated above, the peak month for enplaned passengers is July and it is also the peak month for scheduled passenger aircraft operations. Therefore, although total aircraft operations peak in October, July was selected as the peak month for ABIA. Seating data from OAG was used as a proxy to determine the PMAWD as passenger data was not available at the daily level. Additionally, operations at ABIA were significantly lower on the 4th of July holiday than the rest of the month and was removed from the analysis for determining the PMAWD. In 2016, July 22nd was selected as the design day because it most closely resembled the average weekday of the month. However, to account for changes in the schedule that may impact the peak hour, a design day for 2017 was also selected. July 19th was selected because it most closest resembles the average weekday for the month.
3.8.3 Design Day Flight Schedules Design Day Flight Schedules (DDFS) for 2016 and 2017 were developed to determine the hourly profile of the traffic at ABIA. In order to develop DDFSs that are representative of the traffic at ABIA, a combination of OAG schedules and historical radar data was used. OAG schedules for the design days provided the passenger aircraft operations. The passenger flight schedule for July 22, 2016 was used for the 2016 DDFS. The passenger aircraft operations from OAG were supplemented with information from the radar data for cargo, air taxi, and GA aircraft operations. Accurate military data was not available in the radar data so additional flights were added to the DDFS to account for an average day (monthly military aircraft operations divided by 31). The passenger flight schedule for July 19, 2017 was used for the 2017 DDFS and was supplemented with the radar data used for the 2016 DDFS since historical data was not available at the time of constructing the 2017 DDFS.
3.8.4 Hourly Profiles The DDFS for 2016 and 2017 were analyzed to determine the hourly profile at ABIA to identify the periods of time that traffic is most concentrated. Using a clock hour as the basis for peak periods does not allow for peak periods of traffic that occur across clock hours to be identified, i.e. traffic occurring late in the first hour combined with the traffic at the beginning of the next hour. Therefore, a rolling 60-minute hour approach was used to determine the design day profile. In this case, aircraft operations were categorized into one of the 288 five-minute buckets, or bins, that occur during the given day. The sum of twelve sequential buckets represents a rolling 60-minute hour. In 2016 and 2017, the peak for departing seats occurs in the morning during the early morning departure push. In 2016, the peak for arriving seats occurred at the end of the day during the last bank of arrivals. While there is still a substantial peak at the end of the day in 2017, added flights combined with an increase in the average seating configuration during the midday shifted the peak in arriving seats. Exhibit 3.8-3 provides a comparison of the scheduled passenger seats for the rolling 60-minute hours for the 2016 DDFS and 2017 DDFS.

AUSTIN-BERGSTROM INTERNATIONAL AIRPORT (ABIA) MASTER PLAN FINAL DRAFT
January 2018 Aviation Activity Forecast Chapter 3 | Page 79
Exhibit 3.8-3: Rolling 60-Minute Seating Profile
Sources: OAG Aviation Worldwide Ltd, OAG Schedules Analyser; Federal Aviation Administration, Flight Track Data for 2016;
Landrum & Brown, 2017.
Exhibit 3.8-4 provides a comparison of the total aircraft operations (including scheduled passenger, cargo, air taxi, GA, and military) for the rolling 60-minute hours for the 2016 DDFS and 2017 DDFS. The 2017 DDFS has 24 additional scheduled passenger flights. However, the total aircraft operation profiles between the two schedules are relatively consistent despite the increased frequency of scheduled passenger aircraft operations.
4,000
3,000
2,000
1,000
0
1,000
2,000
3,000
4,000
0:00 1:30 3:00 4:30 6:00 7:30 9:00 10:30 12:00 13:30 15:00 16:30 18:00 19:30 21:00 22:30
Hourly Seats
2016
2017
Arriving
Departing
AUSTIN-BERGSTROM INTERNATIONAL AIRPORT (ABIA) MASTER PLAN FINAL DRAFT
January 2018 Aviation Activity Forecast Chapter 3 | Page 80
Exhibit 3.8-4: Rolling 60-Minute Aircraft Operations Profile
Sources: OAG Aviation Worldwide Ltd, OAG Schedules Analyser; Federal Aviation Administration, Flight Track Data for 2016;
Landrum & Brown, 2017.
3.8.5 Derivative Forecast Information regarding the peak month, average day, and peak hour were used to formulate metrics to determine the peak period forecast. These metrics include the peak month as a percent of the annual, the design day as a percent of the peak month, and the peak hour as a percent of the design day. It should be noted that peak hour metrics are specific to ABIA’s design day. As airlines begin to add future flights, more flights will likely be added outside of the peaks thereby reducing the peak month, design day, and peak hour metrics.
3.8.5.1 Aircraft Operations Forecast Annual aircraft operations were divided by the peak month aircraft operations, peak month aircraft operations were divided by the design day aircraft operations, and the design day aircraft operations were divided by peak hour aircraft operations to determine the peak period factors.
40
30
20
10
0
10
20
30
40
0:00 1:30 3:00 4:30 6:00 7:30 9:00 10:30 12:00 13:30 15:00 16:30 18:00 19:30 21:00 22:30
Hourly Aircraft Operations
2016
2017
Arriving
Departing
AUSTIN-BERGSTROM INTERNATIONAL AIRPORT (ABIA) MASTER PLAN FINAL DRAFT
January 2018 Aviation Activity Forecast Chapter 3 | Page 81
Peak period factors were expressed for each of the segments (scheduled passenger, cargo, air taxi, GA, and military). It was assumed that the peak month and design day factors would remain relatively unchanged through the forecast period. Although there are some distinct peaks in the schedule, the scheduled passenger aircraft operations are relatively spread evenly throughout the active hours at ABIA. Therefore, the peak hour aircraft operations factors will also remain relatively unchanged through the forecast period. The annual, monthly, daily, and hourly peak aircraft operations forecasts are presented in Table X-20. The total of annual, monthly, and design day aircraft operations is the aggregation of the individual segments. However, each of the individual segments peak at different periods of the day. For example, during the 2017 design day passenger aircraft operations peak at 11:10 and again at 17:30 while all-cargo aircraft operations peak at 06:00. As a result, peak hour total aircraft operations are not equal to the sum of the categories. The total peak hour aircraft operations are expected to increase from 56 in 2016 to 71 in 2037.
3.8.5.2 Passenger Forecast Peak hour passengers were calculated using a similar methodology as peak hour aircraft operations. The annual and monthly passengers were determined from ABIA’s records. The design day passengers are based on the scheduled seats for the design day as a share of the scheduled seats for the month. Peak hour passengers were calculated from the peak hour aircraft operations and the average passengers per aircraft operation for the month. Peak hour passengers as a percent of the design day are expected to remain relatively consistent through the forecast period. Table 3.8-1 and Table 3.8-2 provide the peak hour passenger forecasts for ABIA.
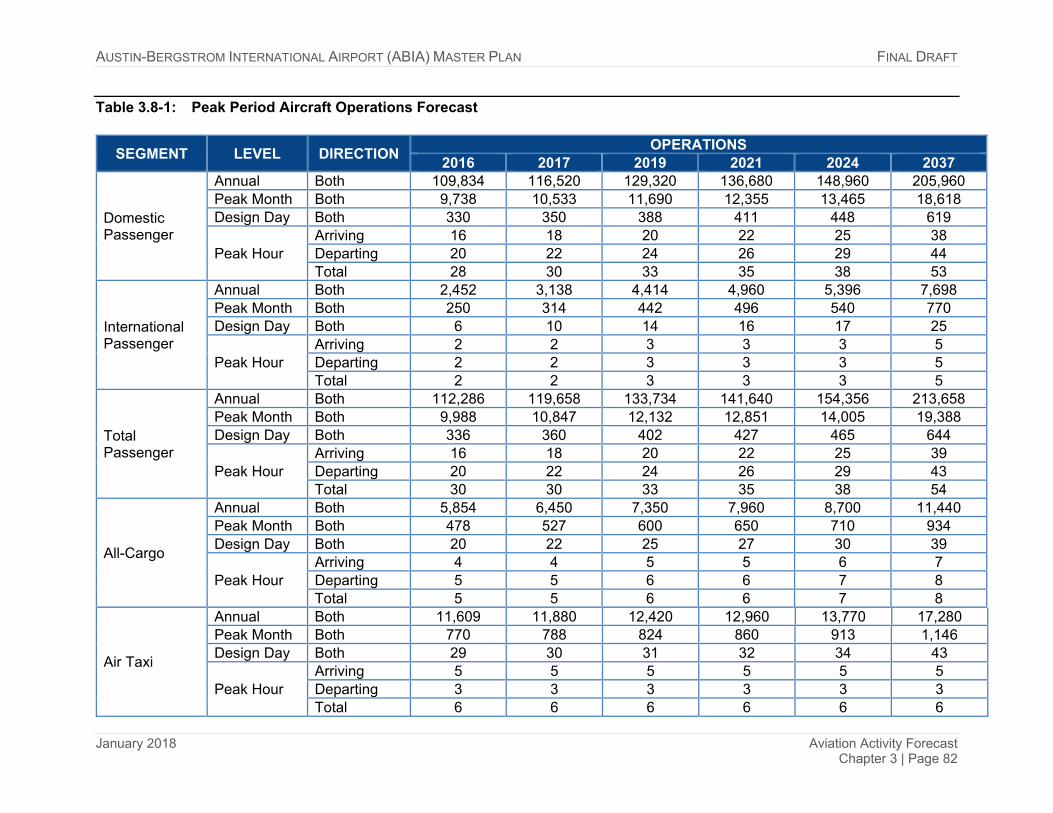
AUSTIN-BERGSTROM INTERNATIONAL AIRPORT (ABIA) MASTER PLAN FINAL DRAFT
January 2018 Aviation Activity Forecast Chapter 3 | Page 82
Table 3.8-1: Peak Period Aircraft Operations Forecast
SEGMENT LEVEL DIRECTION OPERATIONS
2016 2017 2019 2021 2024 2037
Domestic Passenger
Annual Both 109,834 116,520 129,320 136,680 148,960 205,960 Peak Month Both 9,738 10,533 11,690 12,355 13,465 18,618 Design Day Both 330 350 388 411 448 619
Peak Hour Arriving 16 18 20 22 25 38 Departing 20 22 24 26 29 44 Total 28 30 33 35 38 53
International Passenger
Annual Both 2,452 3,138 4,414 4,960 5,396 7,698 Peak Month Both 250 314 442 496 540 770 Design Day Both 6 10 14 16 17 25
Peak Hour Arriving 2 2 3 3 3 5 Departing 2 2 3 3 3 5 Total 2 2 3 3 3 5
Total Passenger
Annual Both 112,286 119,658 133,734 141,640 154,356 213,658 Peak Month Both 9,988 10,847 12,132 12,851 14,005 19,388 Design Day Both 336 360 402 427 465 644
Peak Hour Arriving 16 18 20 22 25 39 Departing 20 22 24 26 29 43 Total 30 30 33 35 38 54
All-Cargo
Annual Both 5,854 6,450 7,350 7,960 8,700 11,440 Peak Month Both 478 527 600 650 710 934 Design Day Both 20 22 25 27 30 39
Peak Hour Arriving 4 4 5 5 6 7 Departing 5 5 6 6 7 8 Total 5 5 6 6 7 8
Air Taxi
Annual Both 11,609 11,880 12,420 12,960 13,770 17,280 Peak Month Both 770 788 824 860 913 1,146 Design Day Both 29 30 31 32 34 43
Peak Hour Arriving 5 5 5 5 5 5 Departing 3 3 3 3 3 3 Total 6 6 6 6 6 6
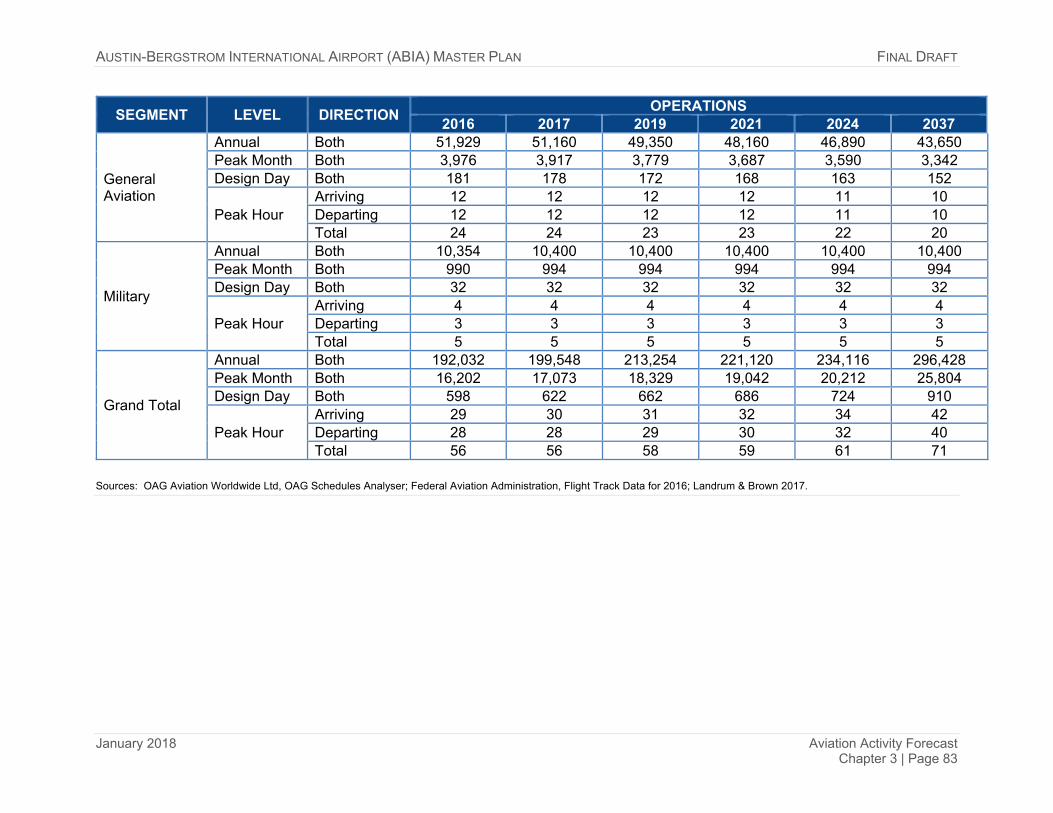
AUSTIN-BERGSTROM INTERNATIONAL AIRPORT (ABIA) MASTER PLAN FINAL DRAFT
January 2018 Aviation Activity Forecast Chapter 3 | Page 83
SEGMENT LEVEL DIRECTION OPERATIONS
2016 2017 2019 2021 2024 2037
General Aviation
Annual Both 51,929 51,160 49,350 48,160 46,890 43,650 Peak Month Both 3,976 3,917 3,779 3,687 3,590 3,342 Design Day Both 181 178 172 168 163 152
Peak Hour Arriving 12 12 12 12 11 10 Departing 12 12 12 12 11 10 Total 24 24 23 23 22 20
Military
Annual Both 10,354 10,400 10,400 10,400 10,400 10,400 Peak Month Both 990 994 994 994 994 994 Design Day Both 32 32 32 32 32 32
Peak Hour Arriving 4 4 4 4 4 4 Departing 3 3 3 3 3 3 Total 5 5 5 5 5 5
Grand Total
Annual Both 192,032 199,548 213,254 221,120 234,116 296,428 Peak Month Both 16,202 17,073 18,329 19,042 20,212 25,804 Design Day Both 598 622 662 686 724 910
Peak Hour Arriving 29 30 31 32 34 42 Departing 28 28 29 30 32 40 Total 56 56 58 59 61 71
Sources: OAG Aviation Worldwide Ltd, OAG Schedules Analyser; Federal Aviation Administration, Flight Track Data for 2016; Landrum & Brown 2017.

AUSTIN-BERGSTROM INTERNATIONAL AIRPORT (ABIA) MASTER PLAN FINAL DRAFT
January 2018 Aviation Activity Forecast Chapter 3 | Page 84
Table 3.8-2: Peak Period Passengers
SEGMENT LEVEL DIRECTIONPASSENGERS
2016 2017 2019 2021 2024 2037
Domestic Passenger
Annual Both 12,190,224 13,596,282 15,196,000 16,172,000 17,738,000 25,632,000 Peak Month Both 1,100,993 1,274,775 1,424,750 1,516,220 1,663,040 2,403,220 Design Day Both 37,285 42,779 47,760 50,940 55,880 80,690
Peak Hour Arriving 2,054 2,222 2,488 2,755 3,152 5,006 Departing 2,353 2,807 3,084 3,364 3,776 5,988 Total 3,138 3,757 4,163 4,447 4,859 7,082
International Passenger
Annual Both 267,658 338,800 522,200 615,600 684,400 1,025,200 Peak Month Both 32,648 42,526 65,210 76,180 83,110 119,010 Design Day Both 801 1,319 2,010 2,390 2,550 3,760
Peak Hour Arriving 333 358 585 609 610 1,021 Departing 271 264 431 449 450 753 Total 333 358 585 609 610 1,021
Total Passenger
Annual Both 12,457,882 13,935,082 15,718,200 16,787,600 18,422,400 26,657,200 Peak Month Both 1,133,641 1,317,301 1,489,960 1,592,400 1,746,150 2,522,230 Design Day Both 38,086 44,098 49,770 53,330 58,430 84,450
Peak Hour Arriving 2,054 2,222 2,488 2,755 3,152 5,006 Departing 2,353 2,807 3,084 3,364 3,776 5,988 Total 3,409 3,954 4,563 4,859 5,257 7,789
Sources: OAG Aviation Worldwide Ltd, OAG Schedules Analyser; Federal Aviation Administration, Flight Track Data for 2016; Landrum & Brown 2017.

AUSTIN-BERGSTROM INTERNATIONAL AIRPORT (ABIA) MASTER PLAN FINAL DRAFT
January 2018 Aviation Activity Forecast Chapter 3 | Page 85
Comparison to the TAF The FAA publishes its own forecast annually for each U.S. airport, including ABIA. The Terminal Area Forecast (TAF) is “prepared to assist the FAA in meeting its planning, budgeting, and staffing requirements. In addition, state aviation authorities and other aviation planners use the TAF as a basis for planning airport improvements.”20 The most recent release is the Draft 2017 TAF which was issued in July 2017. If the Sponsor forecast is used for FAA decision-making, such as key environmental issues, noise capability planning, airport layout plan, and initial financial decisions, the FAA requires that the Sponsor forecast is compared to the most recent TAF to determine if they are consistent. For all classes of airports, forecasts for total passenger enplanements, based aircraft, and total aircraft operations are considered consistent with the TAF if they meet the following criterion:21
Forecasts differ by less than 10 percent in the 5-year forecast period.
Forecasts differ by less than 15 percent in the 10-year forecast period. If the Sponsor forecast is not consistent with the TAF, differences must be resolved before proceeding. The TAF is prepared on a U.S. Government Fiscal Year (FY) basis (October through September) rather than calendar year. The forecast presented herein was developed on a calendar year basis. When an airport’s traffic is growing rapidly, a timing difference between the FY base year and the calendar base year can be significant. This timing difference distorts a straight future year comparison between the two forecasts. The true comparison that needs to be made is between the projected growth rate of the TAF and the projected growth rate of the Sponsor forecast. The Draft 2017 TAF includes historical information on aircraft operations from FY1990 through FY2016 and forecasts for FY201722 to FY2045. At airports with FAA towers like ABIA, historical aircraft operations data is provided by FAA air traffic controllers, which count landings and takeoffs. These aircraft operations are recorded as either air carrier, commuter & air taxi, GA, or military. Air carrier is defined as an aircraft with seating capacity of more than 60 seats or a maximum payload capacity of more than 18,000 pounds carrying passengers or cargo for hire or compensation. Commuter & air taxi aircraft are designed to have a maximum seating capacity of 60 seats or a maximum payload capacity of 18,000 pounds carrying passengers or cargo for hire or compensation. According to the Draft 2017 TAF, aircraft operations at ABIA have increased from 177,124 in FY2009 to 197,382 in FY2017, representing an AAGR of 1.4 percent. The Draft 2017 TAF
20 Federal Aviation Administration, Terminal Area Forecast Summary: Fiscal Years 2016-2045, July
2017. 21 Federal Aviation Administration, Review and Approval of Aviation Forecasts, June 2008. 22 Operations data for FAA towers and Federal contract towers for 2016 are actual.

AUSTIN-BERGSTROM INTERNATIONAL AIRPORT (ABIA) MASTER PLAN FINAL DRAFT
January 2018 Aviation Activity Forecast Chapter 3 | Page 86
projects that aircraft operations at ABIA will increase from 197,382 in FY2017 to 235,340 in 2026, representing an AAGR of 2.0 percent. The enplaned passenger information in the Draft 2017 TAF includes historical values from FY1976 through FY2016, estimated enplaned passenger figures for FY2017, and forecasts from FY2018 to FY2040. Historical enplaned passenger data is obtained through the U.S. Department of Transportation T-100 Reports. According to the Draft 2017 TAF, enplaned passengers at ABIA have increased from 4.0 million in FY2009 to an estimated 6.7 million in FY2017, representing a AAGR of 6.5 percent. During this span, enplaned passengers provided in the Draft 2017 TAF have on average been within 4.2 percent of ABIA’s records. There are two reason for this difference. The data provided in the TAF is on a fiscal year basis. Additionally, the enplaned passengers provided in the TAF exclude non-revenue passengers and military charter passengers. In 2016, ABIA reported 6.2 million enplaned passengers, which is 3.5 percent higher than the 6.0 million for FY2016 in the Draft 2017 TAF. The Draft 2017 TAF projects that enplaned passengers will increase from an estimated 6.7 million in FY2017 to 8.7 million in FY2026, representing a CAGR of 3.0 percent. In order to compare the forecast presented herein to the Draft 2017 TAF, Appendix B and C templates from the FAA Office of Aviation Policy and Plans (APO) document, Forecasting Aviation Activity by Airport, have been completed and are provided in the Table 3.9-1 and Table 3.9-2, respectively.

AUSTIN-BERGSTROM INTERNATIONAL AIRPORT (ABIA) MASTER PLAN FINAL DRAFT
January 2018 Aviation Activity Forecast Chapter 3 | Page 87
Table 3.9-1: FAA TAF Forecast Comparison – Appendix B
Sources: Federal Aviation Administration, Draft 2017 Terminal Area Forecast; Landrum & Brown 2017.
Base YearBase Year
+ 1 yearBase Year
+ 5 yearsBase Year + 10 years
Base Year + 15 years
Base Year to + 1 year
Base Year to+ 5 years
Base Year to+ 10 years
Base Year to+ 15 years
2016 2017 2021 2026 2031 2016-2017 2016-2021 2016-2026 2016-2031Passenger Enplanements
Air carrier 5,520,103 6,388,235 7,691,226 8,963,116 10,355,888 15.7% 6.9% 5.0% 4.3%Commuter 708,838 579,306 702,574 819,684 947,912 -18.3% -0.2% 1.5%
TOTAL ENPLANEMENTS 6,228,941 6,967,541 8,393,800 9,782,800 11,303,800 11.9% 6.1% 4.6% 4.1%
OperationsItinerant
Air carrier 92,762 105,168 123,770 142,608 161,092 13.4% 5.9% 4.4% 3.7%Commuter/air taxi 36,987 32,820 38,790 44,280 50,100 -11.3% 1.0% 1.8% 2.0%
Total Commercial Operations 129,749 137,988 162,560 186,888 211,192 6.3% 4.6% 3.7% 3.3%General aviation 51,929 51,160 48,160 46,090 44,580 -1.5% -1.5% -1.2% -1.0%Military 10,354 10,400 10,400 10,400 10,400 0.4% 0.1% 0.0% 0.0%
LocalGeneral aviation 0 0 0 0 0 0.0% 0.0% 0.0% 0.0%Military 0 0 0 0 0 0.0% 0.0% 0.0% 0.0%
TOTAL OPERATIONS 192,032 199,548 221,120 243,378 266,172 3.9% 2.9% 2.4% 2.2%
Instrument OperationsPeak Hour Operations 56 56 59 63 66 0.0% 1.0% 1.2% 1.1%
Cargo/Mail(Enplaned + Deplaned Tons) 87 97 120 139 157 10.8% 6.6% 4.8% 4.0%
Based AircraftSingle Engine (Nonjet) 84Multi Engine (Nonjet) 17Jet Engine 46Helicopter 9Other -
TOTAL BASED AIRCRAFT 156
Base YearBase Year
+ 1 yearBase Year
+ 5 yearsBase Year + 10 years
Base Year + 15 years
2016 2017 2021 2026 2031Average aircraft size (seats)
Air carrier 149.4 152.7 154.7 155.1 157.4Commuter 72.7 73.9 74.1 74.1 74.2
Average enplaning load factorAir carrier 82.2% 82.1% 83.0% 83.7% 84.3%Commuter 87.0% 88.6% 87.0% 87.4% 87.5%
GA operations per based aircraft 333
B. Operational Factors
A. Forecast Levels and Growth Rates

AUSTIN-BERGSTROM INTERNATIONAL AIRPORT (ABIA) MASTER PLAN FINAL DRAFT
January 2018 Aviation Activity Forecast Chapter 3 | Page 88
Table 3.9-2: FAA TAF Forecast Comparison – Appendix B
FORECAST
YEAR SPONSOR FORECAST
DRAFT 2017 FAA TAF
% VARIANCE SPONSOR VS DRAFT 2017 TAF
PASSENGER ENPLANEMENTS Base Year 2016 6,228,941 6,020,961 3.5%Base Year +5 Years 2021 8,393,800 7,586,718 10.6%Base Year +10 Years 2026 9,782,800 8,675,109 12.8%Base Year +15 Years 2031 11,303,800 9,927,630 13.9%COMMERCIAL OPERATIONS Base Year 2016 129,749 130,344 -0.5%Base Year +5 Years 2021 162,560 152,009 6.9%Base Year +10 Years 2026 186,888 171,999 8.7% Base Year +15 Years 2031 211,192 194,827 8.4% TOTAL OPERATIONS Base Year 2016 192,032 192,010 0.0%Base Year +5 Years 2021 221,120 214,802 2.9%Base Year +10 Years 2026 243,378 235,340 3.4%Base Year +15 Years 2031 266,172 258,722 2.9%
Sources: Federal Aviation Administration, Draft 2017 Terminal Area Forecast; Landrum & Brown 2017.