ASX RELEASE - Incitec Pivot Limited
23
Incitec Pivot Limited ABN 42 004 080 264 Level 8, 28 Freshwater Place, Southbank, Victoria 3006, Australia www.incitecpivot.com.au ASX RELEASE First half impacted by manufacturing performance with solid underlying explosives and fertilisers businesses backed by resilient resources and agricultural sectors. 17 May 2021 Incitec Pivot Limited (ASX: IPL) today announced results for the half year ended 31 March 2021. 1H FY21 Key safety and financial metrics • Zero Harm: Total Recordable Injury Frequency Rate (TRIFR) of 0.72, slightly above IPL’s 0.70 target. • Earnings Before Interest and Tax (EBIT): A$110m, down from A$159m in HY20, after $59m impact from planned turnarounds and $14m impact from unplanned outages. • Statutory NPAT: A$36m, down 44% from A$65m in HY20. • Earnings Per Share (EPS): 1.9 cents per share, down from 4.0 cents per share in HY20. • Operating Cash Flow: (A$103m), down from a cash inflow of A$152m in HY20. • Net Debt of A$1.33bn, Net Debt / EBITDA ratio of 2.1x at 31 March 2021, down from 2.8x at 31 March 2020 • Interim Dividend of 1 cent per share, fully franked. This represents a 53 % payout ratio of NPAT. 2H FY21 Outlook • Stronger than normal weighting to 2H earnings and cash flow expected: - Unsold Manufactured Ammonium Phosphate product on hand, to realise in excess of $25m in profit in the 2H, at current market prices. - One planned turnaround in 2H21 compared with 3 turnarounds completed in 1H21 (+$44m). - Plant reliability improvement. - Favourable prevailing fertiliser market conditions relative to pcp. COVID-19 Response • Our primary focus continues to be on the safety of our people, customers and the communities. • COVID safe practices continue to be implemented in line with country and state requirements, with control measures implemented to support continuity of operations. • COVID-19 Response Plan delivered A$20m in HY21 and on track to deliver the FY21 target of $30m through cost discipline initiatives. Dyno Nobel Americas • EBIT of A$31m down from A$113m, primarily due to the Waggaman turnaround and unplanned manufacturing outages. • Explosives performance remained strong in 1H21, maintaining earnings and margins despite a softer US Coal market. • Base & Precious Metals volumes increased 17% reflecting contract wins, volumes in Quarry and Construction were down 5% vs pcp, with COVID-19 logistics and weather-related impacts including sub-arctic temperatures in North America in February, impacting customer demand in the first half. • Premium technology continues to underpin strong performance in the attractive Base & Precious Metals and Quarry and Construction sectors which represent 80% of Dyno Nobel Americas revenue. Dyno Nobel Asia Pacific • EBIT was broadly flat at A$70m, with continued growth in technology offsetting the impact from the previous re-contracting of Moranbah volumes. • Strong momentum in premium technology with 30% growth in electronic initiating systems across Asia Pacific customers in the last 12 months. • Moranbah performed well, increasing production by 4% to 183k mt of ammonium nitrate. Fertilisers Asia Pacific • EBIT of A$20m, a significant improvement from a loss of (A$10m) in HY20, reflecting solid operating performance in a competitive market, strong manufacturing performance and benefits from commodity price upswing. • Agronomic conditions have been generally favourable with La Nina rain events increasing soil moisture and water storage levels across eastern Australia.
Transcript of ASX RELEASE - Incitec Pivot Limited
Incitec Pivot Limited ABN 42 004 080 264
Level 8, 28 Freshwater Place, Southbank, Victoria 3006, Australia
www.incitecpivot.com.au
ASX RELEASE
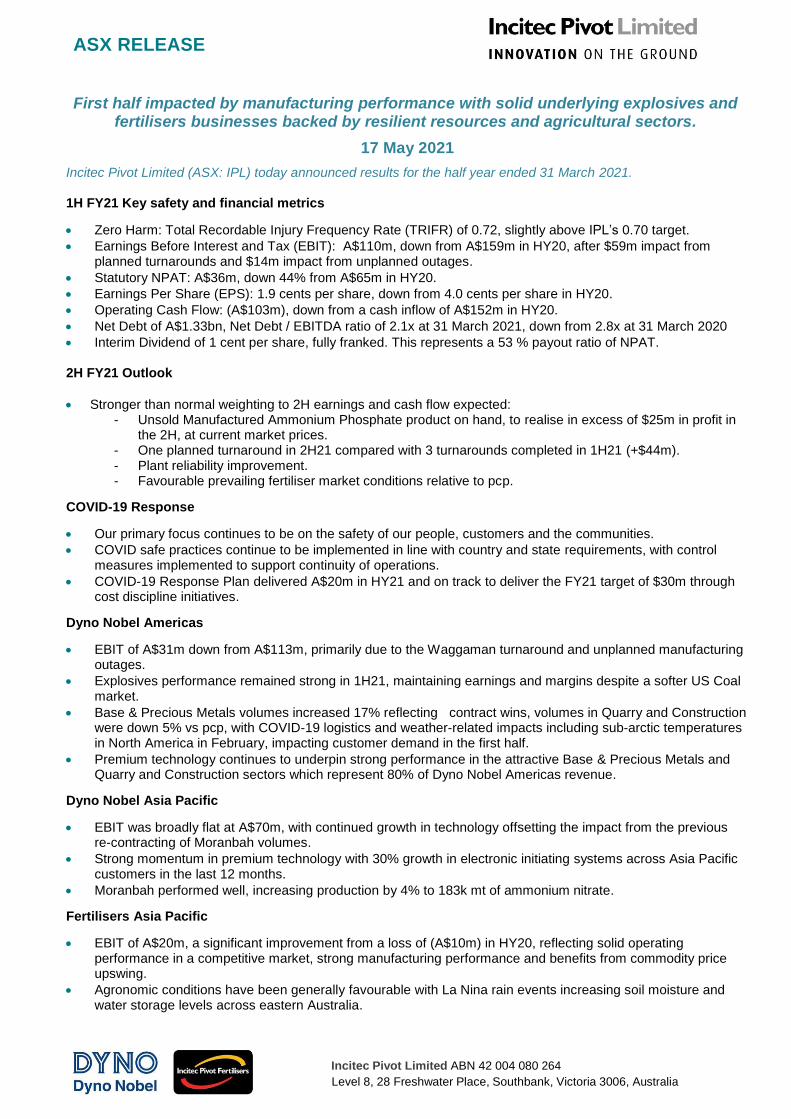
First half impacted by manufacturing performance with solid underlying explosives and fertilisers businesses backed by resilient resources and agricultural sectors.
17 May 2021
Incitec Pivot Limited (ASX: IPL) today announced results for the half year ended 31 March 2021.
1H FY21 Key safety and financial metrics
• Zero Harm: Total Recordable Injury Frequency Rate (TRIFR) of 0.72, slightly above IPL’s 0.70 target.
• Earnings Before Interest and Tax (EBIT): A$110m, down from A$159m in HY20, after $59m impact from planned turnarounds and $14m impact from unplanned outages.
• Statutory NPAT: A$36m, down 44% from A$65m in HY20.
• Earnings Per Share (EPS): 1.9 cents per share, down from 4.0 cents per share in HY20.
• Operating Cash Flow: (A$103m), down from a cash inflow of A$152m in HY20.
• Net Debt of A$1.33bn, Net Debt / EBITDA ratio of 2.1x at 31 March 2021, down from 2.8x at 31 March 2020
• Interim Dividend of 1 cent per share, fully franked. This represents a 53 % payout ratio of NPAT.
2H FY21 Outlook
• Stronger than normal weighting to 2H earnings and cash flow expected: - Unsold Manufactured Ammonium Phosphate product on hand, to realise in excess of $25m in profit in
the 2H, at current market prices. - One planned turnaround in 2H21 compared with 3 turnarounds completed in 1H21 (+$44m). - Plant reliability improvement. - Favourable prevailing fertiliser market conditions relative to pcp.
COVID-19 Response
• Our primary focus continues to be on the safety of our people, customers and the communities.
• COVID safe practices continue to be implemented in line with country and state requirements, with control measures implemented to support continuity of operations.
• COVID-19 Response Plan delivered A$20m in HY21 and on track to deliver the FY21 target of $30m through cost discipline initiatives.
Dyno Nobel Americas
• EBIT of A$31m down from A$113m, primarily due to the Waggaman turnaround and unplanned manufacturing outages.
• Explosives performance remained strong in 1H21, maintaining earnings and margins despite a softer US Coal market.
• Base & Precious Metals volumes increased 17% reflecting contract wins, volumes in Quarry and Construction were down 5% vs pcp, with COVID-19 logistics and weather-related impacts including sub-arctic temperatures in North America in February, impacting customer demand in the first half.
• Premium technology continues to underpin strong performance in the attractive Base & Precious Metals and Quarry and Construction sectors which represent 80% of Dyno Nobel Americas revenue.
Dyno Nobel Asia Pacific
• EBIT was broadly flat at A$70m, with continued growth in technology offsetting the impact from the previous re-contracting of Moranbah volumes.
• Strong momentum in premium technology with 30% growth in electronic initiating systems across Asia Pacific customers in the last 12 months.
• Moranbah performed well, increasing production by 4% to 183k mt of ammonium nitrate.
Fertilisers Asia Pacific
• EBIT of A$20m, a significant improvement from a loss of (A$10m) in HY20, reflecting solid operating performance in a competitive market, strong manufacturing performance and benefits from commodity price upswing.
• Agronomic conditions have been generally favourable with La Nina rain events increasing soil moisture and water storage levels across eastern Australia.
Incitec Pivot Limited ABN 42 004 080 264
Level 8, 28 Freshwater Place, Southbank, Victoria 3006, Australia
www.incitecpivot.com.au
ASX RELEASE
• Good progress on soil health strategy, with soil test revenue up 22% and liquid fertilisers volumes increasing 39% over the last 12 months, setting the business up for future growth.
Premium Technology
• Premium Emulsion volume across our explosives businesses increased by 24% and Electronic Detonator Systems (EDS) volumes increased by 15%.
• Customer demand for Delta E technology, our premium offering in the mining sector, continued through HY21 with an additional six Mobile Processing Units in operation.
• Technology trials underway in Chile delivering superior blasting outcomes following emulsion plant commissioning.
Manufacturing Excellence
• Production rates in Australia largely in line with expectations, performance in the US at Waggaman, LA, Cheyenne, WO and Louisiana, MO, impacted by unplanned outages. These issues have been resolved with exception of Waggaman. IPL’s top priority is to ensure the Waggaman plant returns to full operations and an expert taskforce with internal and external resources is in place.
• Manufacturing Excellence remains on target to deliver A$40-A$50m earnings upside across portfolio, with
timeframe for delivery moved back 12 months to FY23 to reflect COVID delayed turnaround schedule and
resourcing plans.
Incitec Pivot Limited Managing Director and CEO, Jeanne Johns, said: “Our first half result was impacted by the COVID delayed scheduled turnarounds as well as some unplanned manufacturing outages. Our underlying explosives and fertilisers business performance was strong, reflecting the continued uptake of our premium technology offering as well as the resilience of our end markets. While the Waggaman plant has demonstrated it’s capable of very good production runs, the recent issues at our plant are clearly disappointing and our expert taskforce is working hard to get the plant back up and running at nameplate. “During the first half of the year, our Americas and Asia Pacific explosives businesses performed well on the back of growing momentum from customers for our premium technology. We are expecting technology growth pull though in our key markets of Australia and the US, along with other markets as they recover from the pandemic. “Pleasingly, our fertiliser business returned to profit during the half as we responded to stronger seasonal outlook for rain and commodities. As we progress our strategy to become a soil health company, good rainfall events across eastern Australia position us well to deliver for the agricultural sector in the second half. “Importantly, our Australian manufacturing plants have ensured fertiliser supply to Australian farmers during COVID times, demonstrating the vital role of Australian manufacturing in domestic supply chain security. “We continue to focus on our response to climate change and our long-term aspiration to net zero. As part of our aspiration to achieve net zero as soon as practicable, we have evaluated our emission sources and identified emission reduction technologies. We will continue to identify new technologies, such as solar hydrogen and carbon capture and storage, for technical and commercial readiness. “We are well positioned to deliver a stronger second half, with reduced turnaround activity and favourable
commodity pricing and conditions in our key agricultural and resources markets.”
For more information:
Investors Media
Geoff McMurray
General Manager Investor Relations & Insurance
Tel: +61 3 8695 4553
Mobile: +61 418 312 773
Matthew Flugge
Vice President `Group Corporate Affairs
Tel: +61 3 8695 4617
Mobile: +61 409 705 176
This document has been authorised for release to ASX by Richa Puri, Company Secretary
PROFIT REPORT HALF YEAR 2021

2 Incitec Pivot Limited Profit Report Half Year 2021
Incitec Pivot Limited
ABN 42 004 080 264
Level 8, 28 Freshwater Place
Southbank, Victoria, Australia, 3006
Telephone: +61 3 8695 4400
www.incitecpivot.com.au

3Incitec Pivot Limited Profit Report Half Year 2021
CONTENTS
Group Summary
1H21 Business Review
Income Statement
Balance Sheet
Cash Flow
Dyno Nobel Americas
Dyno Nobel Asia Pacific
Fertilisers
Outlook and Sensitivities
Sustainability
Managing Climate Change
Definitions
Appendix
3
4
4
5
7
8
10
11
12
13
14
15
16
3 Incitec Pivot Limited Profit Report Half Year 2021
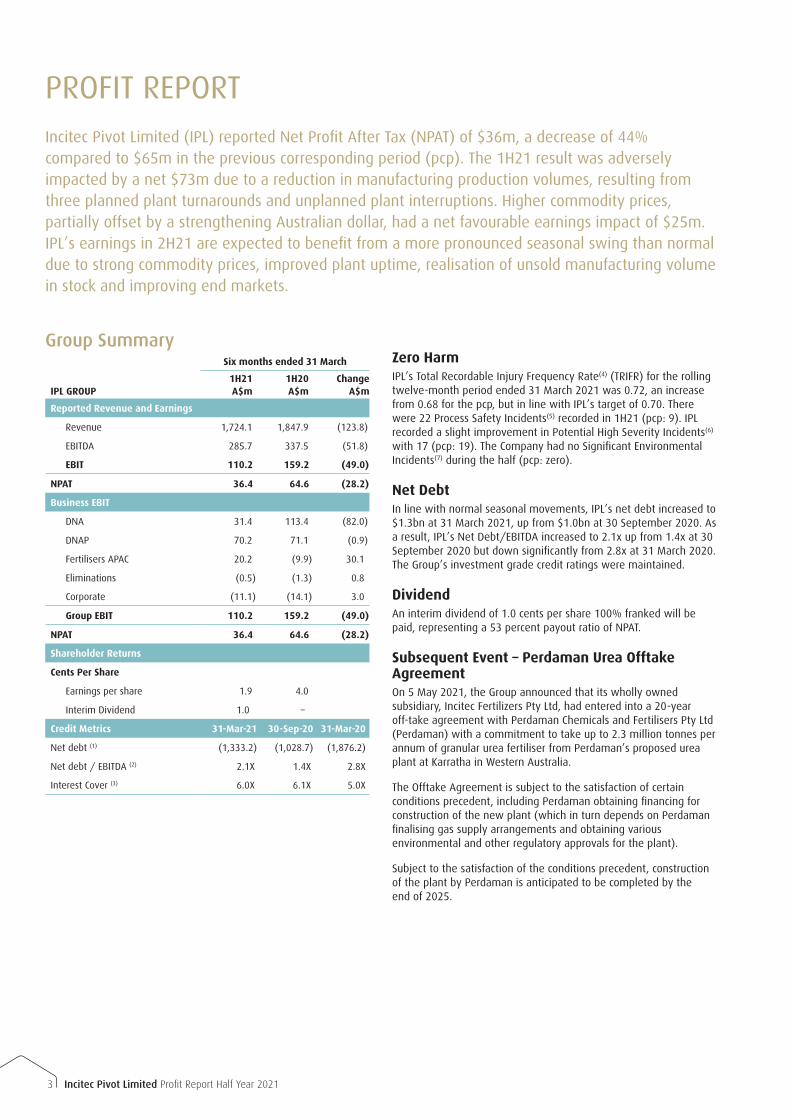
PROFIT REPORTIncitec Pivot Limited (IPL) reported Net Profit After Tax (NPAT) of $36m, a decrease of 44% compared to $65m in the previous corresponding period (pcp). The 1H21 result was adversely impacted by a net $73m due to a reduction in manufacturing production volumes, resulting from three planned plant turnarounds and unplanned plant interruptions. Higher commodity prices, partially offset by a strengthening Australian dollar, had a net favourable earnings impact of $25m. IPL’s earnings in 2H21 are expected to benefit from a more pronounced seasonal swing than normal due to strong commodity prices, improved plant uptime, realisation of unsold manufacturing volume in stock and improving end markets.
Group SummarySix months ended 31 March
IPL GROUP1H21 A$m
1H20 A$m
Change A$m
Reported Revenue and Earnings
Revenue 1,724.1 1,847.9 (123.8)
EBITDA 285.7 337.5 (51.8)
EBIT 110.2 159.2 (49.0)
NPAT 36.4 64.6 (28.2)
Business EBIT
DNA 31.4 113.4 (82.0)
DNAP 70.2 71.1 (0.9)
Fertilisers APAC 20.2 (9.9) 30.1
Eliminations (0.5) (1.3) 0.8
Corporate (11.1) (14.1) 3.0
Group EBIT 110.2 159.2 (49.0)
NPAT 36.4 64.6 (28.2)
Shareholder Returns
Cents Per Share
Earnings per share 1.9 4.0
Interim Dividend 1.0 –
Credit Metrics 31-Mar-21 30-Sep-20 31-Mar-20
Net debt (1) (1,333.2) (1,028.7) (1,876.2)
Net debt / EBITDA (2) 2.1X 1.4X 2.8X
Interest Cover (3) 6.0X 6.1X 5.0X
Zero HarmIPL’s Total Recordable Injury Frequency Rate(4) (TRIFR) for the rolling twelve-month period ended 31 March 2021 was 0.72, an increase from 0.68 for the pcp, but in line with IPL’s target of 0.70. There were 22 Process Safety Incidents(5) recorded in 1H21 (pcp: 9). IPL recorded a slight improvement in Potential High Severity Incidents(6) with 17 (pcp: 19). The Company had no Significant Environmental Incidents(7) during the half (pcp: zero).
Net Debt In line with normal seasonal movements, IPL’s net debt increased to $1.3bn at 31 March 2021, up from $1.0bn at 30 September 2020. As a result, IPL’s Net Debt/EBITDA increased to 2.1x up from 1.4x at 30 September 2020 but down significantly from 2.8x at 31 March 2020. The Group’s investment grade credit ratings were maintained.
DividendAn interim dividend of 1.0 cents per share 100% franked will be paid, representing a 53 percent payout ratio of NPAT.
Subsequent Event – Perdaman Urea Offtake AgreementOn 5 May 2021, the Group announced that its wholly owned subsidiary, Incitec Fertilizers Pty Ltd, had entered into a 20-year off-take agreement with Perdaman Chemicals and Fertilisers Pty Ltd (Perdaman) with a commitment to take up to 2.3 million tonnes per annum of granular urea fertiliser from Perdaman’s proposed urea plant at Karratha in Western Australia.
The Offtake Agreement is subject to the satisfaction of certain conditions precedent, including Perdaman obtaining financing for construction of the new plant (which in turn depends on Perdaman finalising gas supply arrangements and obtaining various environmental and other regulatory approvals for the plant).
Subject to the satisfaction of the conditions precedent, construction of the plant by Perdaman is anticipated to be completed by the end of 2025.
4Incitec Pivot Limited Profit Report Half Year 2021
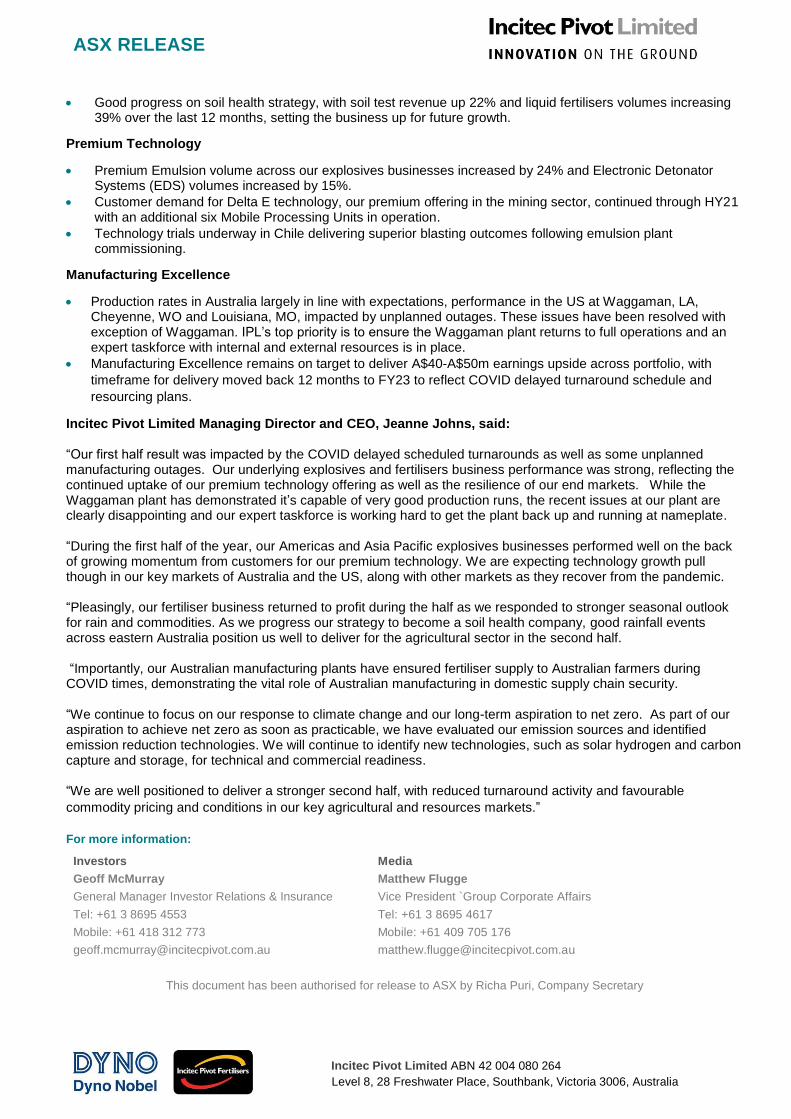
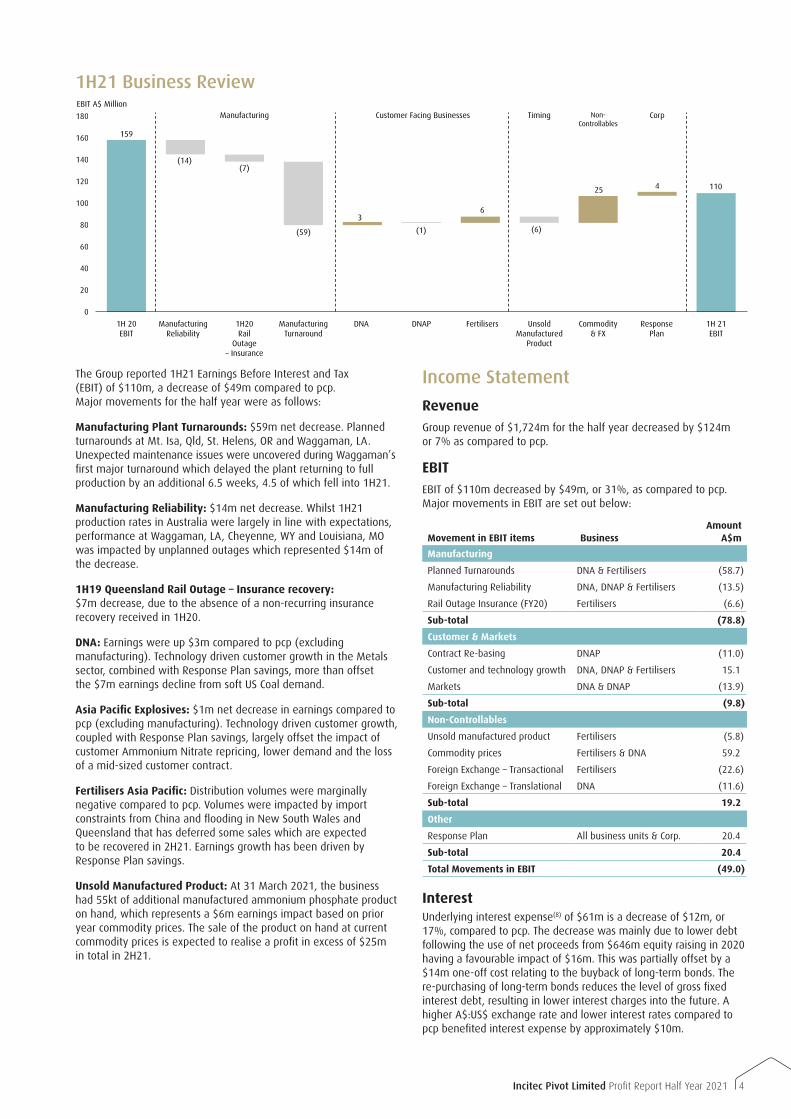
The Group reported 1H21 Earnings Before Interest and Tax (EBIT) of $110m, a decrease of $49m compared to pcp. Major movements for the half year were as follows:
Manufacturing Plant Turnarounds: $59m net decrease. Planned turnarounds at Mt. Isa, Qld, St. Helens, OR and Waggaman, LA. Unexpected maintenance issues were uncovered during Waggaman’s first major turnaround which delayed the plant returning to full production by an additional 6.5 weeks, 4.5 of which fell into 1H21.
Manufacturing Reliability: $14m net decrease. Whilst 1H21 production rates in Australia were largely in line with expectations, performance at Waggaman, LA, Cheyenne, WY and Louisiana, MO was impacted by unplanned outages which represented $14m of the decrease.
1H19 Queensland Rail Outage – Insurance recovery: $7m decrease, due to the absence of a non-recurring insurance recovery received in 1H20.
DNA: Earnings were up $3m compared to pcp (excluding manufacturing). Technology driven customer growth in the Metals sector, combined with Response Plan savings, more than offset the $7m earnings decline from soft US Coal demand.
Asia Pacific Explosives: $1m net decrease in earnings compared to pcp (excluding manufacturing). Technology driven customer growth, coupled with Response Plan savings, largely offset the impact of customer Ammonium Nitrate repricing, lower demand and the loss of a mid-sized customer contract.
Fertilisers Asia Pacific: Distribution volumes were marginally negative compared to pcp. Volumes were impacted by import constraints from China and flooding in New South Wales and Queensland that has deferred some sales which are expected to be recovered in 2H21. Earnings growth has been driven by Response Plan savings.
Unsold Manufactured Product: At 31 March 2021, the business had 55kt of additional manufactured ammonium phosphate product on hand, which represents a $6m earnings impact based on prior year commodity prices. The sale of the product on hand at current commodity prices is expected to realise a profit in excess of $25m in total in 2H21.
Income Statement
RevenueGroup revenue of $1,724m for the half year decreased by $124m or 7% as compared to pcp.
EBITEBIT of $110m decreased by $49m, or 31%, as compared to pcp. Major movements in EBIT are set out below:
Movement in EBIT items BusinessAmount
A$m
Manufacturing
Planned Turnarounds DNA & Fertilisers (58.7)
Manufacturing Reliability DNA, DNAP & Fertilisers (13.5)
Rail Outage Insurance (FY20) Fertilisers (6.6)
Sub-total (78.8)
Customer & Markets
Contract Re-basing DNAP (11.0)
Customer and technology growth DNA, DNAP & Fertilisers 15.1
Markets DNA & DNAP (13.9)
Sub-total (9.8)
Non-Controllables
Unsold manufactured product Fertilisers (5.8)
Commodity prices Fertilisers & DNA 59.2
Foreign Exchange – Transactional Fertilisers (22.6)
Foreign Exchange – Translational DNA (11.6)
Sub-total 19.2
Other
Response Plan All business units & Corp. 20.4
Sub-total 20.4
Total Movements in EBIT (49.0)
InterestUnderlying interest expense(8) of $61m is a decrease of $12m, or 17%, compared to pcp. The decrease was mainly due to lower debt following the use of net proceeds from $646m equity raising in 2020 having a favourable impact of $16m. This was partially offset by a $14m one-off cost relating to the buyback of long-term bonds. The re-purchasing of long-term bonds reduces the level of gross fixed interest debt, resulting in lower interest charges into the future. A higher A$:US$ exchange rate and lower interest rates compared to pcp benefited interest expense by approximately $10m.
159
(14)(7)
(59)
3
(1)
6
25
(6)
4 110
0
20
40
60
80
100
120
140
160
180
EBIT A$ Million
1H 21EBIT
1H 20EBIT
Response Plan
DNAPDNAManufacturing Turnaround
1H20Rail
Outage – Insurance
Manufacturing Reliability
Fertilisers Unsold Manufactured
Product
Commodity & FX
Manufacturing Customer Facing Businesses CorpTiming Non-Controllables
1H21 Business Review
5 Incitec Pivot Limited Profit Report Half Year 2021
TaxThe Group’s effective tax rate on operating profit of 22% is in line with the 23% in the pcp. Tax expense of $10m was $9m lower than the pcp, consistent with lower earnings.
NPATNPAT of $36m decreased by $28m, or 44%, compared to pcp.
Six months ended 31 March
INCOME STATEMENT1H21 A$m
1H20 A$m
Change %
Change A$m
Revenue
Business Revenue
DNA 671.1 768.8 (13%) (97.7)
DNAP 455.8 491.9 (7%) (36.1)
Fertilisers APAC 628.3 616.5 2% 11.8
Eliminations (31.1) (29.3) (6%) (1.8)
Group Revenue 1,724.1 1,847.9 (7%) (123.8)
EBIT
Business EBIT
DNA 31.4 113.4 (72%) (82.0)
DNAP 70.2 71.1 (1%) (0.9)
Fertilisers APAC 20.2 (9.9) 304% 30.1
Eliminations (0.5) (1.3) 62% 0.8
Corporate (11.1) (14.1) 21% 3.0
Group EBIT 110.2 159.2 (31%) (49.0)
EBIT margin 6.4 % 8.6 %
NPAT
Underlying interest expense (8) (60.8) (72.9) 17% 12.1
Non-cash unwinding liabilities (2.7) (2.4) 13% (0.3)
Net borrowing costs (63.5) (75.3) 16% 11.8
Tax expense (10.3) (19.3) 47% 9.0
Group NPAT 36.4 64.6 (44%) (28.2)
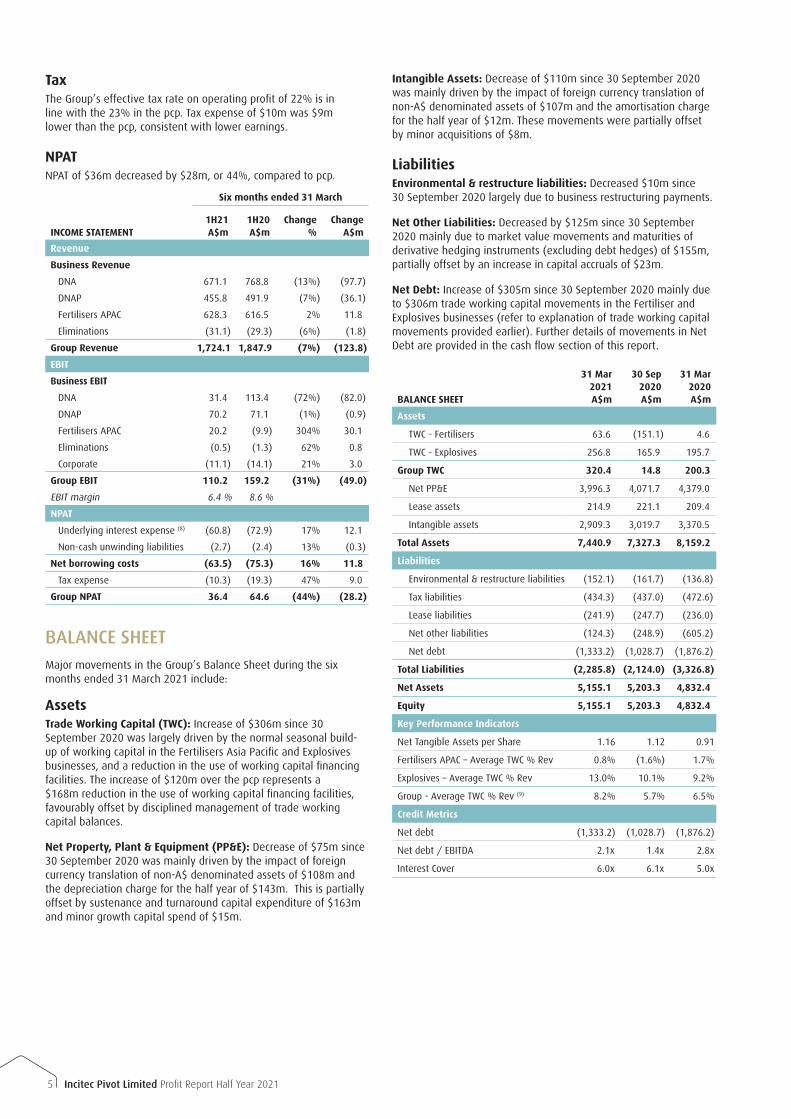
BALANCE SHEETMajor movements in the Group’s Balance Sheet during the six months ended 31 March 2021 include:
AssetsTrade Working Capital (TWC): Increase of $306m since 30 September 2020 was largely driven by the normal seasonal build-up of working capital in the Fertilisers Asia Pacific and Explosives businesses, and a reduction in the use of working capital financing facilities. The increase of $120m over the pcp represents a $168m reduction in the use of working capital financing facilities, favourably offset by disciplined management of trade working capital balances.
Net Property, Plant & Equipment (PP&E): Decrease of $75m since 30 September 2020 was mainly driven by the impact of foreign currency translation of non-A$ denominated assets of $108m and the depreciation charge for the half year of $143m. This is partially offset by sustenance and turnaround capital expenditure of $163m and minor growth capital spend of $15m.
Intangible Assets: Decrease of $110m since 30 September 2020 was mainly driven by the impact of foreign currency translation of non-A$ denominated assets of $107m and the amortisation charge for the half year of $12m. These movements were partially offset by minor acquisitions of $8m.
LiabilitiesEnvironmental & restructure liabilities: Decreased $10m since 30 September 2020 largely due to business restructuring payments.
Net Other Liabilities: Decreased by $125m since 30 September 2020 mainly due to market value movements and maturities of derivative hedging instruments (excluding debt hedges) of $155m, partially offset by an increase in capital accruals of $23m.
Net Debt: Increase of $305m since 30 September 2020 mainly due to $306m trade working capital movements in the Fertiliser and Explosives businesses (refer to explanation of trade working capital movements provided earlier). Further details of movements in Net Debt are provided in the cash flow section of this report.
BALANCE SHEET
31 Mar 2021 A$m
30 Sep 2020 A$m
31 Mar 2020 A$m
Assets
TWC - Fertilisers 63.6 (151.1) 4.6
TWC - Explosives 256.8 165.9 195.7
Group TWC 320.4 14.8 200.3
Net PP&E 3,996.3 4,071.7 4,379.0
Lease assets 214.9 221.1 209.4
Intangible assets 2,909.3 3,019.7 3,370.5
Total Assets 7,440.9 7,327.3 8,159.2
Liabilities
Environmental & restructure liabilities (152.1) (161.7) (136.8)
Tax liabilities (434.3) (437.0) (472.6)
Lease liabilities (241.9) (247.7) (236.0)
Net other liabilities (124.3) (248.9) (605.2)
Net debt (1,333.2) (1,028.7) (1,876.2)
Total Liabilities (2,285.8) (2,124.0) (3,326.8)
Net Assets 5,155.1 5,203.3 4,832.4
Equity 5,155.1 5,203.3 4,832.4
Key Performance Indicators
Net Tangible Assets per Share 1.16 1.12 0.91
Fertilisers APAC – Average TWC % Rev 0.8% (1.6%) 1.7%
Explosives – Average TWC % Rev 13.0% 10.1% 9.2%
Group - Average TWC % Rev (9) 8.2% 5.7% 6.5%
Credit Metrics
Net debt (1,333.2) (1,028.7) (1,876.2)
Net debt / EBITDA 2.1x 1.4x 2.8x
Interest Cover 6.0x 6.1x 5.0x
6Incitec Pivot Limited Profit Report Half Year 2021
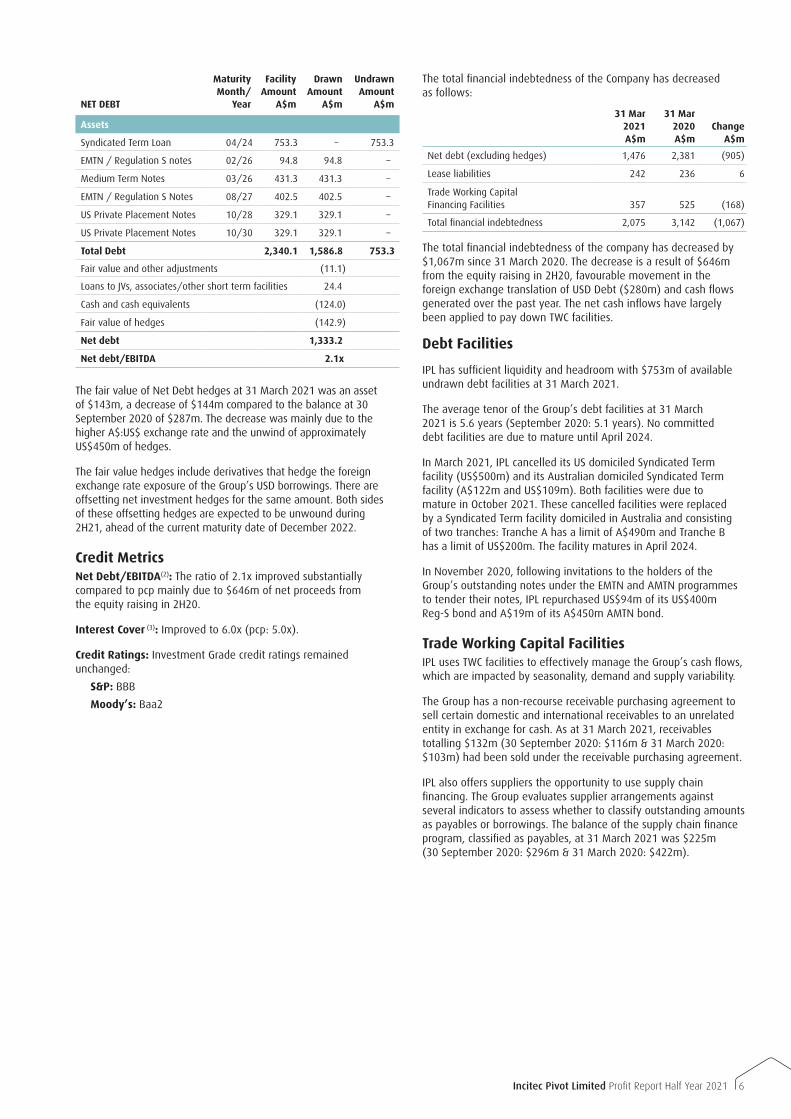
NET DEBT
Maturity Month/
Year
Facility Amount
A$m
Drawn Amount
A$m
Undrawn Amount
A$m
Assets
Syndicated Term Loan 04/24 753.3 – 753.3
EMTN / Regulation S notes 02/26 94.8 94.8 –
Medium Term Notes 03/26 431.3 431.3 –
EMTN / Regulation S Notes 08/27 402.5 402.5 –
US Private Placement Notes 10/28 329.1 329.1 –
US Private Placement Notes 10/30 329.1 329.1 –
Total Debt 2,340.1 1,586.8 753.3
Fair value and other adjustments (11.1)
Loans to JVs, associates/other short term facilities 24.4
Cash and cash equivalents (124.0)
Fair value of hedges (142.9)
Net debt 1,333.2
Net debt/EBITDA 2.1x
The fair value of Net Debt hedges at 31 March 2021 was an asset of $143m, a decrease of $144m compared to the balance at 30 September 2020 of $287m. The decrease was mainly due to the higher A$:US$ exchange rate and the unwind of approximately US$450m of hedges.
The fair value hedges include derivatives that hedge the foreign exchange rate exposure of the Group’s USD borrowings. There are offsetting net investment hedges for the same amount. Both sides of these offsetting hedges are expected to be unwound during 2H21, ahead of the current maturity date of December 2022.
Credit MetricsNet Debt/EBITDA(2): The ratio of 2.1x improved substantially compared to pcp mainly due to $646m of net proceeds from the equity raising in 2H20.
Interest Cover (3): Improved to 6.0x (pcp: 5.0x).
Credit Ratings: Investment Grade credit ratings remained unchanged:
S&P: BBB
Moody’s: Baa2
The total financial indebtedness of the Company has decreased as follows:
31 Mar 2021 A$m
31 Mar 2020 A$m
Change A$m
Net debt (excluding hedges) 1,476 2,381 (905)
Lease liabilities 242 236 6
Trade Working Capital Financing Facilities 357 525 (168)
Total financial indebtedness 2,075 3,142 (1,067)
The total financial indebtedness of the company has decreased by $1,067m since 31 March 2020. The decrease is a result of $646m from the equity raising in 2H20, favourable movement in the foreign exchange translation of USD Debt ($280m) and cash flows generated over the past year. The net cash inflows have largely been applied to pay down TWC facilities.
Debt Facilities
IPL has sufficient liquidity and headroom with $753m of available undrawn debt facilities at 31 March 2021.
The average tenor of the Group’s debt facilities at 31 March 2021 is 5.6 years (September 2020: 5.1 years). No committed debt facilities are due to mature until April 2024.
In March 2021, IPL cancelled its US domiciled Syndicated Term facility (US$500m) and its Australian domiciled Syndicated Term facility (A$122m and US$109m). Both facilities were due to mature in October 2021. These cancelled facilities were replaced by a Syndicated Term facility domiciled in Australia and consisting of two tranches: Tranche A has a limit of A$490m and Tranche B has a limit of US$200m. The facility matures in April 2024.
In November 2020, following invitations to the holders of the Group’s outstanding notes under the EMTN and AMTN programmes to tender their notes, IPL repurchased US$94m of its US$400m Reg-S bond and A$19m of its A$450m AMTN bond.
Trade Working Capital FacilitiesIPL uses TWC facilities to effectively manage the Group’s cash flows, which are impacted by seasonality, demand and supply variability.
The Group has a non-recourse receivable purchasing agreement to sell certain domestic and international receivables to an unrelated entity in exchange for cash. As at 31 March 2021, receivables totalling $132m (30 September 2020: $116m & 31 March 2020: $103m) had been sold under the receivable purchasing agreement.
IPL also offers suppliers the opportunity to use supply chain financing. The Group evaluates supplier arrangements against several indicators to assess whether to classify outstanding amounts as payables or borrowings. The balance of the supply chain finance program, classified as payables, at 31 March 2021 was $225m (30 September 2020: $296m & 31 March 2020: $422m).

7 Incitec Pivot Limited Profit Report Half Year 2021
CASH FLOW
Operating Cash FlowOperating cash flows of ($103m) decreased by $255m compared to the pcp. Significant movements included:
EBITDA: Decreased by $52m driven by reduced manufacturing volumes ($73m) resulting from three planned turnarounds and unplanned plant outages. This was partially offset by a net $25m favourable movement from realised commodity price movements ($59m) and unfavourable movements in the A$:US$ exchange rate ($34m).
Net Interest Paid: Decreased by $14m, principally as a result of lower average drawn debt levels following the Group’s $646m equity raising in 2020 and lower interest rates. This was partially offset by one-off interest payments relating to bond repurchases.
TWC Movement: $145m unfavourable movement compared to the pcp largely as a result of an unusually low movement in 1H20. The 1H20 movement was impacted by an unusually high September 2019 inventory balance resulting from severe drought conditions at that time.
Dividends received from JV’s: Increased by $12m as a result of timing of payments.
Other Non-TWC: $77m unfavourable movement compared to the pcp largely as a result of timing of payments to, and receipts from, trade working capital facility providers and reflects an overall reduction in the use of these facilities.
Investing Cash FlowNet investing cash outflows of $161m decreased $60m as compared to the pcp. Significant movements included:
Capital spend: Higher spend on turnarounds was largely offset by lower growth capital spend.
Payments for settlement of derivatives: The reduced outflow of $46m is mainly due to the absence of cash outflows on the maturity of hedges of US$ assets which occurred in the prior period.
Financing Cash FlowNet financing cash outflow of $40m decreased $75m as compared to pcp. Significant movements included:
Dividends: In light of ongoing uncertainty due to COVID-19 and IPL’s May 2020 equity raising, IPL did not pay a dividend in 1H21.
Foreign Exchange on Net Debt: Decrease of non-cash impact from movements in foreign exchange rates and interest rates on the Group’s debt balances.
Six months ended 31 March
CASH FLOW1H21 A$m
1H20 A$m
Change A$m
Operating Cash Flow
EBITDA 285.7 337.5 (51.8)
Net Interest paid (62.4) (76.8) 14.4
Net income tax paid (14.9) (11.7) (3.2)
TWC movement (excl FX movements) (323.0) (177.7) (145.3)
Profit from JVs and associates (15.0) (14.2) (0.8)
Dividends received from JVs 27.7 15.8 11.9
Environmental and site clean-up (2.3) (4.9) 2.6
Restructuring costs (7.9) (2.4) (5.5)
Other Non-TWC 9.0 86.4 (77.4)
Operating Cash Flow (103.1) 152.0 (255.1)
Investing Cash Flow
Minor growth capital (17.1) (35.5) 18.4
Sustenance (141.0) (118.6) (22.4)
Payments - Central Petroleum Joint operation
(0.8) (9.2) 8.4
Proceeds from asset sales 2.5 1.9 0.6
Repayments from JV 4.0 – 4.0
Acquisition of subsidiaries & non-controlling interests
(8.5) (13.6) 5.1
Payments for settlements of derivatives
(0.1) (46.2) 46.1
Investing Cash Flow (161.0) (221.2) 60.2
Financing Cash Flow
Dividends paid – (30.7) 30.7
Lease liability payments (19.9) (20.2) 0.3
Purchase of IPL shares for employees (1.0) (1.3) 0.3
Realised market value gain on derivatives
9.7 10.3 (0.6)
Non-cash loss on translation of US$ Net Debt
(26.3) (71.2) 44.9
Non-cash movement in Net Debt (2.9) (2.5) (0.4)
Financing Cash Flow (40.4) (115.6) 75.2
Change to Net debt (304.5) (184.8) (119.7)
Opening balance Net debt (1,028.7) (1,691.4) 662.7
Closing balance Net debt (1,333.2) (1,876.2) 543.0
Capital Spend
IPL’s capital allocation process is centralised and overseen by the Group’s Corporate Finance function. Capital is invested on a prioritised basis and all submissions are assessed against risk factors including HSE, operational, financial and strategic risks. Capital is broadly categorised into major growth capital, minor growth capital and sustenance capital.
There were no major growth capital spend items in 1H21. Minor growth spend of $17m in 1H21 included plant efficiency projects and other projects supporting volume growth and technology investment.
Sustenance capital spend in 1H21 of $141m was $22m higher than pcp, largely due to turnaround activity. Turnaround spend across the Group for 1H21 was $87m. The remaining sustenance spend was made up of various projects, with values being less than $5m each.
Subject to currency fluctuations, sustenance capital spend for the full year is expected to be approximately $320m. The increase in the capital forecast is largely as a result of an increase in scope for the Waggaman and Moranbah plant turnarounds to support the business objectives of increased reliability.
8Incitec Pivot Limited Profit Report Half Year 2021
Six months ended 31 March
Dyno Nobel Americas1H21 US$m
1H20 US$m
Change %
Explosives 405.2 392.1 3
Waggaman 46.5 64.1 (27)
Ag & IC 51.8 57.5 (10)
Total Revenue 503.5 513.7 (2)
Explosives 43.8 55.6 (21)
Waggaman (18.2) 17.9 (202)
Ag & IC (2.5) 1.4 (279)
EBIT 23.1 74.9 (69)
EBIT margin
Explosives 10.8 % 14.2 %
Waggaman (39.1)% 27.9 %
Ag & IC (4.8)% 2.4 %
Total EBIT Margin 4.6% 14.6%
A$m
Revenue 671.1 768.8 (13)
EBIT 31.4 113.4 (72)
Notes
Average realised A$/US$ exchange rate 0.74 0.66
Urea (FOB NOLA) Index Price (US$/mt) 315 250
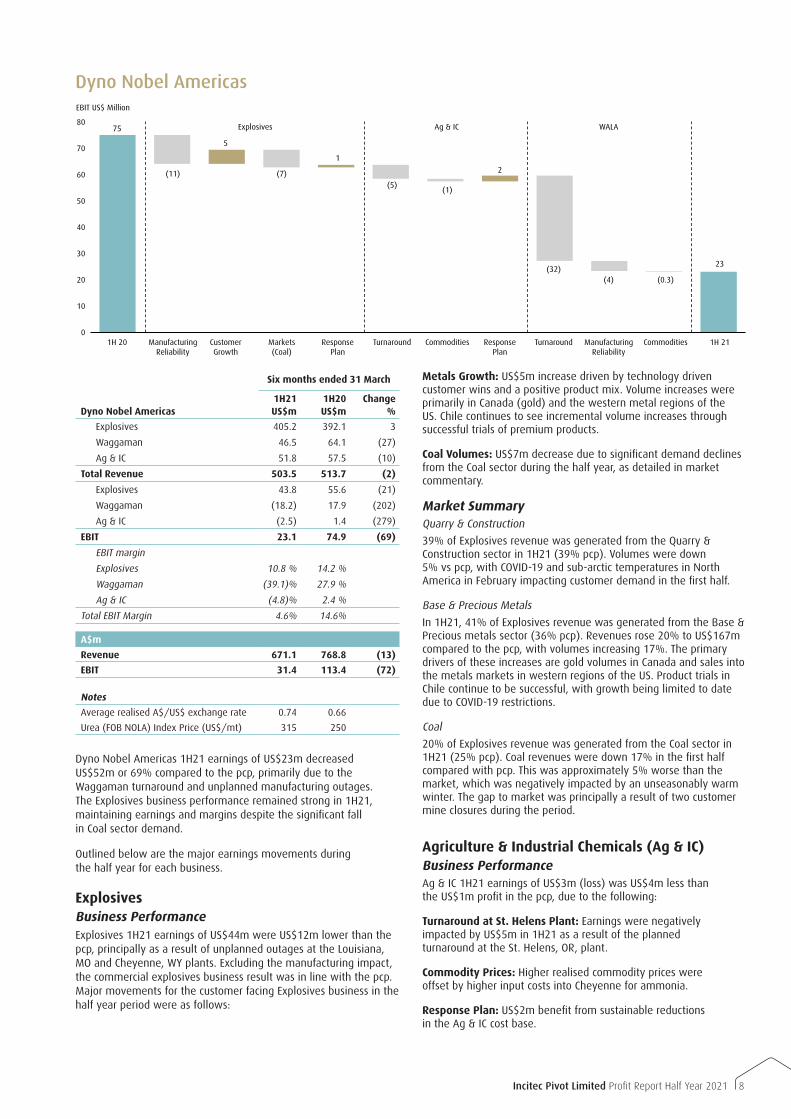
Dyno Nobel Americas 1H21 earnings of US$23m decreased US$52m or 69% compared to the pcp, primarily due to the Waggaman turnaround and unplanned manufacturing outages. The Explosives business performance remained strong in 1H21, maintaining earnings and margins despite the significant fall in Coal sector demand.
Outlined below are the major earnings movements during the half year for each business.
ExplosivesBusiness PerformanceExplosives 1H21 earnings of US$44m were US$12m lower than the pcp, principally as a result of unplanned outages at the Louisiana, MO and Cheyenne, WY plants. Excluding the manufacturing impact, the commercial explosives business result was in line with the pcp. Major movements for the customer facing Explosives business in the half year period were as follows:
Metals Growth: US$5m increase driven by technology driven customer wins and a positive product mix. Volume increases were primarily in Canada (gold) and the western metal regions of the US. Chile continues to see incremental volume increases through successful trials of premium products.
Coal Volumes: US$7m decrease due to significant demand declines from the Coal sector during the half year, as detailed in market commentary.
Market SummaryQuarry & Construction
39% of Explosives revenue was generated from the Quarry & Construction sector in 1H21 (39% pcp). Volumes were down 5% vs pcp, with COVID-19 and sub-arctic temperatures in North America in February impacting customer demand in the first half.
Base & Precious Metals
In 1H21, 41% of Explosives revenue was generated from the Base & Precious metals sector (36% pcp). Revenues rose 20% to US$167m compared to the pcp, with volumes increasing 17%. The primary drivers of these increases are gold volumes in Canada and sales into the metals markets in western regions of the US. Product trials in Chile continue to be successful, with growth being limited to date due to COVID-19 restrictions.
Coal
20% of Explosives revenue was generated from the Coal sector in 1H21 (25% pcp). Coal revenues were down 17% in the first half compared with pcp. This was approximately 5% worse than the market, which was negatively impacted by an unseasonably warm winter. The gap to market was principally a result of two customer mine closures during the period.
Agriculture & Industrial Chemicals (Ag & IC)Business PerformanceAg & IC 1H21 earnings of US$3m (loss) was US$4m less than the US$1m profit in the pcp, due to the following:
Turnaround at St. Helens Plant: Earnings were negatively impacted by US$5m in 1H21 as a result of the planned turnaround at the St. Helens, OR, plant.
Commodity Prices: Higher realised commodity prices were offset by higher input costs into Cheyenne for ammonia.
Response Plan: US$2m benefit from sustainable reductions in the Ag & IC cost base.
80
70
60
50
40
30
20
10
01H 211H 20 Response
PlanResponse
PlanTurnaround CommoditiesMarkets
(Coal)Customer Growth
Manufacturing Reliability
Turnaround CommoditiesManufacturing Reliability
23
75
2
1
(5)(1)
(7)
5
(11)
(32)(0.3)(4)
Explosives
EBIT US$ Million
Ag & IC WALA
Dyno Nobel Americas
9 Incitec Pivot Limited Profit Report Half Year 2021
Waggaman OperationsSix months ended 31 March
WAGGAMAN 1H21 1H20Change
%
Thousand metric tonne
Ammonia manufactured at Waggaman 166.9 363.1 (54)
Ammonia sold 238.8 357.6 (33)
US$m
External Revenue 46.5 64.1 (27)
Internal Revenue 14.7 22.1 (33)
Total Revenue 61.2 86.2 (29)
EBIT (18.2) 17.9 (202)
EBIT margin (39.1)% 27.9 %
Notes
Ammonia Realised Price (US$/mt) (10) 256 241
Realised Gas Cost (US$/mmbtu) (delivered)
2.79 2.35
Ammonia Tampa Index Price (US$/mt) (10) 294 252
Index Gas Cost (US$/mmbtu) (11) 2.68 2.22
Gas efficiency (mmbtu/mt) 41 35
Business PerformanceWaggaman earnings of US$18m (loss), decreased US$36m compared to the pcp due to the plant being offline for a total of 14.5 weeks in the first half. The downtime resulted from a combination of planned major turnaround activity and other unplanned outages as described in the Manufacturing section on this page.
In total, the Waggaman plant produced 167k metric tonnes of Ammonia which was 54% lower than the pcp. Ammonia sales were above production levels of the plant, as the business procured product during the plant downtime in order to ensure continuity of supply to its customers.
Gas efficiency was adversely impacted by the plant downtime mentioned above, with gas usage per metric tonne of ammonia produced increasing 17% compared with the pcp.
Discount to Tampa indexAs previously disclosed, the business realises a discount to the Tampa index which ranges from 5% to 10%, depending on market pricing (lower discount for lower prices and higher when prices rise). In 1H21, the simple calculation of the discount to Tampa equates to 13%. The discount is higher due to low product sales in February and March 2021, due to the extended turnaround at a time when the ammonia price index rose steeply.
ManufacturingManufacturing performance in the Explosives and Ag & IC businesses during 1H21 was as follows:
Cheyenne, Wyoming: Cheyenne operations were impacted by an unplanned outage caused by a bearing failure on the reciprocal compressor. As a result, Nitric Acid production was down 6% compared to pcp and Ammonia production decreased 7% compared to pcp.
Louisiana, Missouri: Louisiana operations were impacted by an unplanned outage caused by blade failure on the axial compressor. As a result, Nitric Acid production decreased by 37% compared with pcp.
St Helens, Oregon: Urea and ammonia production from the St Helens plant decreased 33% and 32%, respectively, compared to pcp mainly due to the planned turnaround.
Waggaman, Louisiana: The plant went through its first major turnaround during 1H21. The plant entered the planned turnaround with several known maintenance issues, all of which were addressed as part of the turnaround activities. During the discovery phase and subsequent re-start process, a number of unexpected issues emerged. The delay to full production by an additional 6.5 weeks, 4.5 of which fell in 2H21, was caused by issues with the ammonia cooler, dry gas seals and the induced draft fan.
While the ammonia cooler (heat exchanger) was repaired during the turnaround, initial fabrication issues are likely to prevent the repair from lasting until the next scheduled turnaround, requiring a replacement of the cooler in the next 12-24 months. An outage of up to 3 weeks is expected during FY22 or FY23 to allow installation.
Following a successful re-start in mid-April 2021, the plant operated at nameplate capacity for two weeks, when the plant unexpectedly tripped upon failure of a vibration probe. Following repairs, the subsequent re-start process was stopped on 8 May due to a coupling failure on the refrigeration compressor, upon which the plant was safely shutdown. Based on current information, repairs and re-start are expected to take three weeks.
Pre-turnaround, the plant had interruptions to production that resulted in 4 weeks of total downtime, the most consequential of which was caused by the failure of the regional power grid in the New Orleans area from a late season hurricane.
10Incitec Pivot Limited Profit Report Half Year 2021
Six months ended 31 March
DYNO NOBEL ASIA PACIFIC 1H21 1H20Change
%
Thousand metric tonne
Ammonium Nitrate – manufactured at Moranbah 183.0 175.8 4
Ammonium Nitrate sold 319.9 377.3 (15)
A$m
Australian Coal 232.0 228.9 1
Base & Precious Metals 181.9 203.1 (10)
International 41.9 59.9 (30)
Total Revenue 455.8 491.9 (7)
EBIT 70.2 71.1 (1)
EBIT margin 15.4% 14.5%
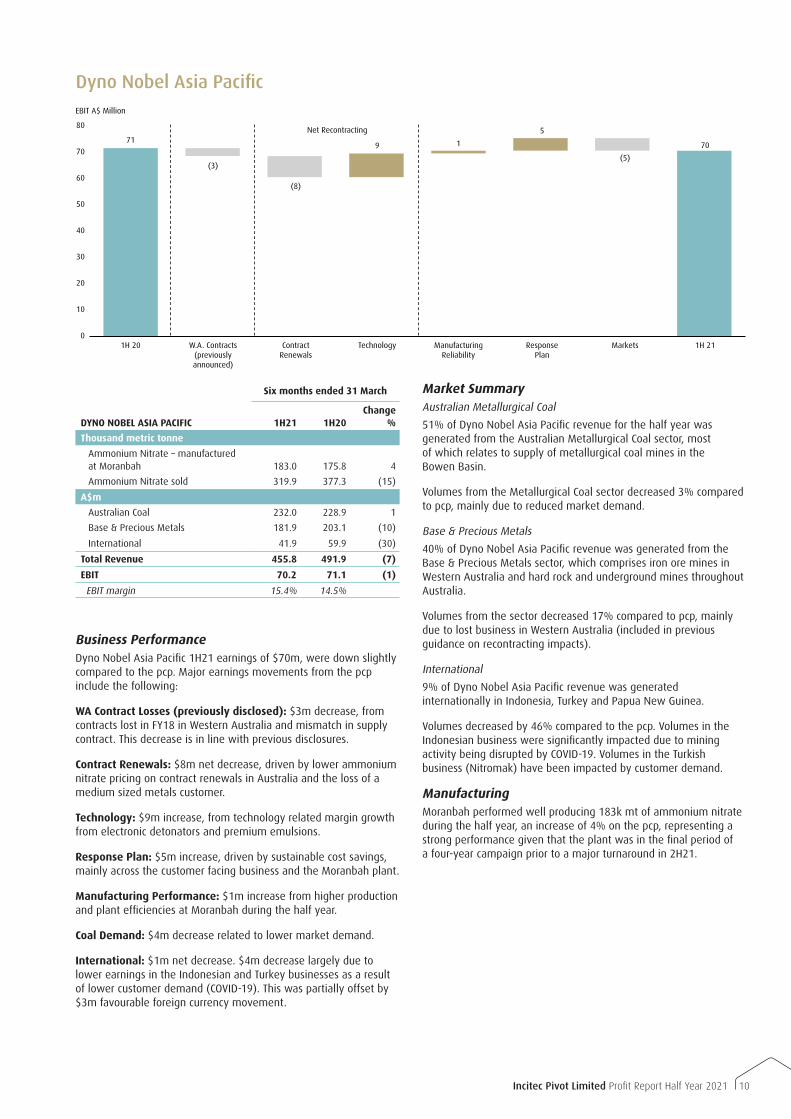
Business PerformanceDyno Nobel Asia Pacific 1H21 earnings of $70m, were down slightly compared to the pcp. Major earnings movements from the pcp include the following:
WA Contract Losses (previously disclosed): $3m decrease, from contracts lost in FY18 in Western Australia and mismatch in supply contract. This decrease is in line with previous disclosures.
Contract Renewals: $8m net decrease, driven by lower ammonium nitrate pricing on contract renewals in Australia and the loss of a medium sized metals customer.
Technology: $9m increase, from technology related margin growth from electronic detonators and premium emulsions.
Response Plan: $5m increase, driven by sustainable cost savings, mainly across the customer facing business and the Moranbah plant.
Manufacturing Performance: $1m increase from higher production and plant efficiencies at Moranbah during the half year.
Coal Demand: $4m decrease related to lower market demand.
International: $1m net decrease. $4m decrease largely due to lower earnings in the Indonesian and Turkey businesses as a result of lower customer demand (COVID-19). This was partially offset by $3m favourable foreign currency movement.
Market SummaryAustralian Metallurgical Coal
51% of Dyno Nobel Asia Pacific revenue for the half year was generated from the Australian Metallurgical Coal sector, most of which relates to supply of metallurgical coal mines in the Bowen Basin.
Volumes from the Metallurgical Coal sector decreased 3% compared to pcp, mainly due to reduced market demand.
Base & Precious Metals
40% of Dyno Nobel Asia Pacific revenue was generated from the Base & Precious Metals sector, which comprises iron ore mines in Western Australia and hard rock and underground mines throughout Australia.
Volumes from the sector decreased 17% compared to pcp, mainly due to lost business in Western Australia (included in previous guidance on recontracting impacts).
International
9% of Dyno Nobel Asia Pacific revenue was generated internationally in Indonesia, Turkey and Papua New Guinea.
Volumes decreased by 46% compared to the pcp. Volumes in the Indonesian business were significantly impacted due to mining activity being disrupted by COVID-19. Volumes in the Turkish business (Nitromak) have been impacted by customer demand.
ManufacturingMoranbah performed well producing 183k mt of ammonium nitrate during the half year, an increase of 4% on the pcp, representing a strong performance given that the plant was in the final period of a four-year campaign prior to a major turnaround in 2H21.
80
70
60
50
40
30
20
10
0
EBIT A$ Million
1H 211H 20 Response Plan
TechnologyContract Renewals
W.A. Contracts (previously announced)
MarketsManufacturing Reliability
7071
5
9
(8)
(3)(5)
1
Net Recontracting
Dyno Nobel Asia Pacific
11 Incitec Pivot Limited Profit Report Half Year 2021
Six months ended 31 March
FERTILISERS ASIA PACIFIC 1H21 1H20Change
%
Thousand metric tonne
Phosphate Hill production (ammonium phosphates) 428.5 457.1 (6)
Gibson Island production (urea equivalent) 241.8 156.9 54
A$m
Manufacturing 242.8 213.1 14
Distribution 385.5 403.4 (4)
Total Revenue 628.3 616.5 2
Manufacturing 2.0 (30.1) 107
Distribution 18.2 20.2 (10)
Total EBIT 20.2 (9.9) 304
EBIT margin 3.2 % (1.6%)
EBIT margin
Manufacturing 0.8% (14.1%)
Distribution 4.7% 5.0%
Notes
Fertilisers Asia Pacific
Realised A$/US$ Exchange Rate 0.75 0.67
Total Fertilisers APAC volumes sold (k mt) 1,256.9 1,261.9
Domestic Fertilisers APAC volumes sold (k mt) 906.3 920.5
Phosphate Hill
Realised DAP Price (US$/mt) 426 289
Phosphate Hill production sold (k mt) 413 448
Realised DAP Freight Margin (US$/mt) 6.3 5.1
Realised Cost per Tonne of DAP (A$/mt) 472 452
Gibson Island
Realised Urea Price (US$/mt) 296 247
Gibson Island production sold subject to urea price movement (k mt) 126 110
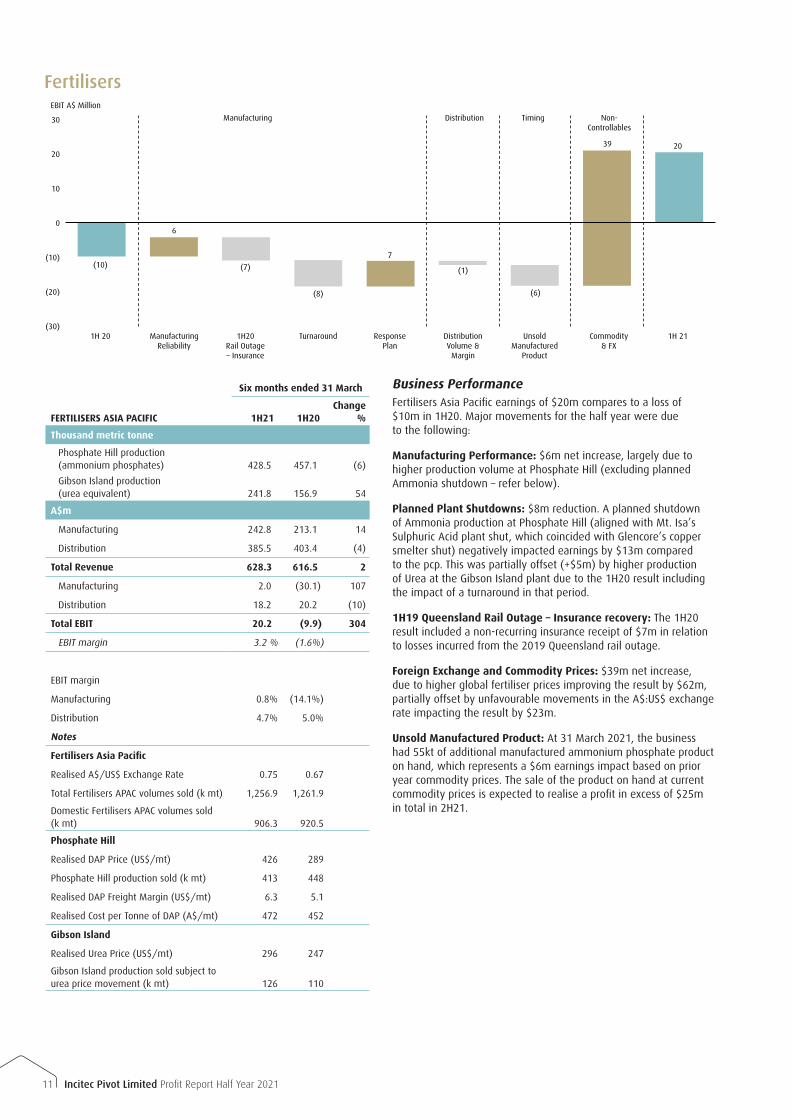
Business PerformanceFertilisers Asia Pacific earnings of $20m compares to a loss of $10m in 1H20. Major movements for the half year were due to the following:
Manufacturing Performance: $6m net increase, largely due to higher production volume at Phosphate Hill (excluding planned Ammonia shutdown – refer below).
Planned Plant Shutdowns: $8m reduction. A planned shutdown of Ammonia production at Phosphate Hill (aligned with Mt. Isa’s Sulphuric Acid plant shut, which coincided with Glencore’s copper smelter shut) negatively impacted earnings by $13m compared to the pcp. This was partially offset (+$5m) by higher production of Urea at the Gibson Island plant due to the 1H20 result including the impact of a turnaround in that period.
1H19 Queensland Rail Outage – Insurance recovery: The 1H20 result included a non-recurring insurance receipt of $7m in relation to losses incurred from the 2019 Queensland rail outage.
Foreign Exchange and Commodity Prices: $39m net increase, due to higher global fertiliser prices improving the result by $62m, partially offset by unfavourable movements in the A$:US$ exchange rate impacting the result by $23m.
Unsold Manufactured Product: At 31 March 2021, the business had 55kt of additional manufactured ammonium phosphate product on hand, which represents a $6m earnings impact based on prior year commodity prices. The sale of the product on hand at current commodity prices is expected to realise a profit in excess of $25m in total in 2H21.
30
20
10
0
(10)
(20)
(30)
EBIT A$ Million
1H 211H 20 Commodity & FX
Response Plan
Turnaround1H20Rail Outage – Insurance
Manufacturing Reliability
Unsold Manufactured
Product
Distribution Volume &
Margin
20
(10)
39
7
(8)
(7)
6
(1)
Manufacturing Distribution
(6)
Timing Non-Controllables
Fertilisers

12Incitec Pivot Limited Profit Report Half Year 2021
Market SummaryOverall, Fertilisers Asia Pacific sales volumes were down slightly compared with 1H20 at 1,257k mt (pcp: 1,262k mt). Agronomic conditions have been generally favourable with La Nina rain events increasing soil moisture and water storage levels, however 1H21 distribution volumes were negatively impacted by product supply constraints out of China, while flooding in Queensland and New South Wales delayed some sales that would normally have occurred in March. Global fertilisers prices traded significantly higher in 1H21 with realised Ammonium Phosphate prices improving by more than 45% compared with the pcp.
Manufacturing
Manufacturing performance in the Fertilisers Asia Pacific business in 1H21 was as follows:
Phosphate Hill
Ammonium phosphates production decreased to 429k mt, down 6% on pcp mainly due to a planned shutdown. Excluding the temporary cost inefficiencies caused by the planned shutdown, production cost per tonne at Phosphate Hill remained flat. Increased freight, gas (CPI) and depreciation costs were offset by Response Plan savings as well as improvements in gas efficiency.
Gibson Island
The plant produced 242k mt of urea equivalent product, up 54% on pcp. The majority of this improvement is due to 1H20 being negatively impacted by a planned turnaround. Cost per tonne remained flat with the increased depreciation charge resulting from the turnaround being offset by operational efficiencies.
Outlook and SensitivitiesIPL generally does not provide profit guidance, primarily due to the variability of commodity prices and foreign exchange movements. Instead, IPL provides an outlook for business performance expectations and sensitivities to key earnings drivers based on management’s current view at the time of this report.
OutlookCOVID-19
To date, IPL’s operations have not been materially impacted by COVID-19. The extent of the future impact of COVID-19 on the Group’s operational and financial performance depends on certain developments, including the duration and spread of the outbreak, regulations imposed by governments with respect to the outbreak response, and the impact of the pandemic on the global economy, including commodity prices and customer demand.
Response Plan
IPL’s financial Response Plan remains on target to deliver sustainable cost savings of $60m* per annum by FY22. $20m of the target $30m FY21 target savings were delivered in 1H21.
Dyno Nobel Americas
The Waggaman plant has produced 205kMt year to date. While we are not aware of anything specific that would result in plant downtime in the last four months of the year, our team is focused on reducing risks that could cause a plant trip and downtime. The Taskforce’s stretch objective is to return the plant to reliable nameplate production for FY22.
As previously announced, an outage of up to 3 weeks is expected during FY22 or FY23 to allow for the installation of a new ammonia cooler. The operational earnings of Waggaman remain subject to movements in ammonia and natural gas prices and will be impacted by an increased annual depreciation charge of US$16m starting from 1 April 2021 as a result of total turnaround costs.
» Agriculture & Industrial Chemicals earnings remain subject to movements in global fertilisers prices, particularly Urea and Urea Ammonium Nitrate.
» Quarry & Construction is expected to return to growth in 2H21 and for the full year, driven by a recovery in residential and infrastructure investment. 2H21 DNA sales to this sector are expected to grow by approximately mid-single digits compared with pcp.
» Base & Precious Metals volume growth is expected to continue in the second half.
» The market outlook for Coal predicts that coal volumes will rebound in the second half with volumes expected to grow year on year. However, the mine closures that impacted the DNA business experienced in the first half are also expected to impact the second half, resulting in second half coal sales being flat to low single digit growth.
Dyno Nobel Asia Pacific
» Moranbah FY21 production is expected to be below FY20 as a result of the planned turnaround which commenced in early May 2021. Nitric acid and ammonium nitrate production is due to recommence in the first half of June with ammonia production to return to full rates during the second half of that month. As previously disclosed, the earnings impact is expected to be approximately $15m.
» The negative earnings impact (compared to prior periods) resulting from contract re-basing is expected to continue to be offset by increased technology sales and other mitigations, in line with previous market guidance.
Fertilisers Asia Pacific
» Weather conditions across Eastern Australia have improved, with many cropping and pasture districts receiving above average rainfall. Increased soil moisture levels in most districts on the East Coast, coupled with an outlook from the Bureau of Meteorology for average levels of rainfall is expected to drive demand for fertiliser through the winter cropping season.
» Water allocations to cotton growers are supportive of increased demand for liquid fertilisers and BigN.
» Based on current commodity prices, the unsold manufactured product on hand at 31 March 2021 is expected to realise a profit in excess of $25m in 2H21 as the product is sold into the Australian market.
» Fertilisers Asia Pacific earnings will continue to be dependent on global fertilisers prices, the A$:US$ exchange rate and weather conditions.
» Phosphate Hill production of Ammonium Phosphates for 2H21 is expected to be in line with 2H20.
13 Incitec Pivot Limited Profit Report Half Year 2021
Group
Corporate: Corporate costs are expected to be approximately $30m in FY21.
Borrowing Costs: Net borrowing costs for FY21 are expected to be approximately $120m.
Taxation: IPL’s effective tax rate for FY21 is expected to be between 22% and 24%.
Hedging Program: 2H21 – 100% of estimated 2H21 US$ linked fertilisers sales are hedged at a rate of $0.76 with 60% having unlimited participation to a favourable depreciation of the A$/US$ exchange rate. FY22 – 80% of estimated US$ linked fertilisers sales are hedged at a rate of $0.795 with 65% participation down to an effective average rate of $0.74 and 35% participation below $0.74.
Sensitivities
The table provides sensitivities to key earnings drivers and should be read in conjunction with the footnotes found on page 15 of this report.
Commodity Proxy Index EBIT Sensitivities
Americas
Ammonia (13) CFR Tampa +/-US$10/mt = +/-US$3.7m
Natural Gas (14) Henry Hub +/-US$0.10/mmbtu = -/+US$1.3m
Urea (15) FOB NOLA +/-US$10/mt = +/-US$1.3m
FX EBIT Translation (16) +/-A$/US$0.01 = -/+A$2.8m
Asia Pacific
DAP (17) FOB Tampa +/-US$10/mt = +/-A$12.7m
Urea (18) FOB Middle East +/-US$10/mt = +/-A$4.5m
FX EBIT Transactional (17,18) +/-A$/US$0.01 = -/+A$8.8m
Note: Proxy Index prices are available on Bloomberg.
SustainabilityIPL’s commitment to operating sustainably is driven by the Company’s values which are core to the way it does business. IPL’s strategy is to deliver sustainable growth and shareholder returns while proactively managing those issues most material to the long-term sustainability of its business, the broader environment and the communities in which IPL operates.
Issues considered material to the sustainability of the Company are included in its FY20 Annual Report, FY20 Corporate Governance Statement, and online FY20 Sustainability Report which was released in March 2021.
This year marks the 10th year in which the Company has produced a stand-alone, GRI-aligned, Sustainability Report as part of its commitment to transparency and to effectively and efficiently inform and meet the needs of its diverse stakeholder group. The 2020 report is the first which reports actions and targets aligned to the UN Sustainable Development Goals.
In 1H21, the Sustainability Steering Committee was formed. Chaired by IPL’s CEO, the committee provides executive oversight of the sustainability strategy and the direction on the management of non-financial (ESG) issues material to the long-term sustainability of the IPL Group.
IPL secured a sustainability-linked Syndicated 3-year Term facility in 1H21. The facility demonstrates IPL’s commitment to sustainable outcomes by linking its cost of finance to achieving set KPIs with respect to greenhouse gas reductions, municipal water reductions and increases in soils and plant testing rates, which result in more sustainable fertiliser application practices.
Zero Harm (Safety and Environment)IPL’s Zero Harm company value is prioritised above all others. To reflect this, the Zero Harm ambition is one of IPL’s six Strategic Drivers, upon which the success of the Company is built. The Zero Harm ambition is supported by an integrated Health, Safety and Environment (HSE) management system that provides the foundation for effective identification and management of HSE risks.
During 2019, IPL refreshed its approach to deliver its Zero Harm ambition. The refreshed strategy created a stronger connection to the Zero Harm Strategic Driver and integrated all HSEC elements under one framework. IPL’s strategic themes of Simplify, Get the Fundamentals Right, Lead and Engage and Strengthen our Learning Culture, provide a common language and basic principles which will guide IPL’s effort, reflect the voice of internal customers and improve performance.
TRIFR for 1H21 of 0.72 was up from 0.68 in 1H20, but in line with our target of 0.70.
Process Safety incidents increased by 13 from the pcp. Of the 22 reported incidents, 12 occurred in Manufacturing (8 pcp) and 10 in customer facing businesses (1 pcp). The higher incident rate in customer facing businesses primarily reflects improvements in reporting.
The Company’s environmental performance is in line with Company targets in 1H21 with no significant environmental incidents being recorded during the period.
The following Zero Harm targets remain a focus for the Group:
» 30% improvement in TRIFR by FY21 (against the mid-2018 TRIFR of 1.02);
» Year-on-year reduction in Tier 1 and Tier 2 Process Safety Incidents;
» Year-on-year reduction in Potential High Severity Incidents; and
» Zero Significant Environmental Incidents.
The Group’s 1H21 performance against key HSE metrics is included in the table below:
Safety
ZERO HARM 1H21 FY20 1H20
Key Metrics
TRIFR 0.72 0.58 0.68
Potential High Severity Incidents 17 34 19
Process Safety Incidents 22 24 9
Significant Environmental Incidents 0 1 0
14Incitec Pivot Limited Profit Report Half Year 2021
Managing Climate ChangeThe Company is also a member of the FTSE4Good Index and ECPI Indices, completes the CDP Climate Change and Water Security reports each year, and is rated by CAER, EcoVadis, MSCI, Sustainalytics, Vigeo EIRIS and CGI Glass Lewis.
IPL’s Climate Change Policy outlines its commitment to managing the impacts of climate change and describes how the management of the risks, opportunities and impacts associated with climate change is integrated into its six strategic drivers, on which the success of the Company is built.
IPL reports in line with the recommendations of the Taskforce on Climate-related Financial Disclosures (TCFD) in its annual Sustainability Reports.
Governance, Strategy and Risk Management
In 1H21 the Decarbonisation and Energy Transition (DET) Steering Committee was formed with the aims of evaluating new market opportunities relating to key decarbonisation mega-trends and achieving Net Zero emissions as soon as practicable. The committee is chaired by IPL’s CEO and provides executive oversight of strategy development, and the evaluation and prioritisation of opportunities relating to decarbonisation and energy transition that are consistent with IPL’s core skills and capabilities.
Pathway to Net Zero Emissions
IPL is committed to the development of a Net Zero pathway and to achieving it as soon as practicable. Since 2015, IPL has reduced its greenhouse gas emissions intensity per tonne of ammonia produced by 10%. In 2020, the Company set its first absolute greenhouse gas (GHG) reduction target of 5% by 2026 against a 2020 baseline (20). To support the identification of projects to reach this target, improved measurement equipment for process GHG emissions was installed at IPL’s Louisiana, Missouri, nitric acid manufacturing facility in 1H21.
IPL is focussed on mapping its pathway to Net Zero and working with partners and research bodies to develop the breakthroughs required. The Company’s GHG emissions profile is dominated by the use of natural gas to make hydrogen for ammonia manufacture with a smaller percentage of emissions arising from nitric acid manufacture as nitrous oxide (N2O). A third source, emissions from electricity use, make up less than 12 percent of IPL’s total Scope 1 and 2 emissions. Creating a pathway to Net Zero for the majority of our emissions therefore currently requires the investigation of new and emerging technologies.
During 1H21, key technologies for Net Zero were identified and an expert third party was engaged to identify the time horizons by which each of these is expected to be economically feasible. Solar hydrogen at industrial scale, which was investigated in IPL’s 2020 Solar Hydrogen Feasibility Study, is expected to be commercially viable by 2040. Carbon Capture and Storage (CCS) presents decarbonisation opportunities for several of our ammonia manufacturing sites in the US which already capture carbon dioxide for sale and use, and which are located close to promising geological basins. Other alternative feedstocks and N
2O abatement
technologies are also being investigated.
Existing options such as renewable power purchase agreements (PPAs), the construction of renewable power generation assets and the use of offsets for a small amount of remaining emissions relating to power supply are also currently being considered in achieving Net Zero.
Climate Change Risk Process
IPL’s risk management processes include a requirement for high consequence and strategically important risks to be regularly reviewed, assessed and managed. Climate change-related financial risks are included amongst this select group of risks.
In 1H21, an expert third party was engaged to update IPL’s existing 2 and 4 degree future climate-related scenarios and to construct two additional scenarios: a 1.5 degree and an ‘Inevitable Policy Response’ scenario. This scenario describes the physical and transitional (market based) impacts associated with delayed action on climate change that is followed by a rapid and steep decarbonisation process and is developed to enable organisations to assess their resilience to a situation where policy makers and settings react dramatically to climate change. In 2H21, an assessment of the risks and opportunities against these new and updated scenarios will be conducted. The results will be reviewed by the DET Steering Committee and reported to the Board’s Audit and Risk Management Committee.
Sustainability Performance Benchmarking
IPL has been a member of the Dow Jones Sustainability Index (DJSI) for the last decade. Selection for the index is made after a review of IPL’s sustainability reporting as well as a comprehensive Corporate Sustainability Assessment questionnaire via a strategic partnership between S&P Dow Jones Indices and RobecoSAM. IPL’s performance is benchmarked against peers in the global Chemicals sector.
S&P Global DJSI Corporate Sustainability Assessment
Calendar Year 2020 2019 2018 2017 2016 2015
Dimension
Economic 78 72 71 73 74 67
Environmental 71 73 64 61 60 51
Social 58 60 57 68 65 63
IPL 69 69 65 68 67 60
Chemicals sector average 36 47 44 53 56 58
Gender DiversityThe Company remains committed to expanding the diversity of its workforce and has a stretch target to increase gender diversity by 10% year-on-year to reach 25% by FY22.
IPL’s representation of women across the organisation at 31 March is reflected in the table below:
GENDER DIVERSITY 1H21 FY20 FY19 FY18
% % % %
Board (19) 33 50 50 43
Executive Team (19) 33 20 30 22
Senior Management 20 20 22 17
Professional/Management 18 20 19 19
Global Workforce 18 18 17 16
During the half year, the Company was again selected for inclusion in the 2020 Bloomberg Gender-Equality Index (GEI). The GEI standardised reporting framework offers public companies the opportunity to disclose information on how they promote gender equality. Reporting companies that score above a globally established threshold, based on the extent of disclosures and the achievement of best-in-class statistics and policies, are included in the GEI.
15 Incitec Pivot Limited Profit Report Half Year 2021
Definitions and Notes1. Net Debt comprises the net of interest-bearing liabilities,
cash and cash equivalents, and the fair value of derivative instruments economically hedging the Group’s interest-bearing liabilities and excludes lease liabilities.
2. Net Debt/EBITDA ratio (for debt covenant purposes). EBITDA is calculated using 12 month rolling EBITDA ex IMIs, minus lease depreciation. Net Debt is translated at the 12 month average AUD:USD FX rate.
3. Interest Cover = 12 month rolling EBITDA (minus lease depreciation) ex IMIs/net interest expense before accounting adjustments.
4. TRIFR is calculated as the number of recordable incidents per 200,000 hours worked and includes contractors. TRIFR results are subject to finalisation of the classification of any pending incidents. Prior year end number was restated due to finalisation of classification of incidents pending at the time of previous publication date.
5. Tier 1 and Tier 2 Process Safety Incidents as defined by the Center for Chemical Process Safety.
6. Potential High Severity Incidents (excluding near misses and hazards) with potential safety consequences of 5 or higher on a 6-level scale. Prior year numbers were restated due to finalisation of classification of incidents pending at the time of previous publication date.
7. Significant Environmental Incidents as assessed against IPL’s internal risk matrix with actual consequences of 5 or higher on a 6-level scale.
8. Underlying interest expense represents total borrowing costs less non-cash interest unwind, representing the discount unwind on the Group’s long-term liabilities.
9. Average TWC as % of revenue = 13-month average trade working capital/12 months rolling revenue.
10. Waggaman’s ammonia sales prices are based on a combination of index Ammonia Tampa prices and 1-month lagged index Ammonia Tampa prices.
11. Average closing price of Nymex Henry Hub 1-month futures.
12. 800k mt per annum Waggaman plant capacity.
13. Based on Waggaman nameplate plant production(12) adjusted for planned and unplanned outages in FY21 YTD, less annualised internal sales volumes (124k mt).
14. Based on Waggaman nameplate plant production(12) adjusted for planned and unplanned outages in FY21 YTD, less annualised internal sales volumes (124k mt) and 1H20 gas efficiency of 35 mmbtu/tonne of ammonia.
15. Based on St Helens plant capacity of 175k mt of urea equivalent product adjusted for the planned turnaround in 1H21.
16. Based on FY20 Dyno Nobel Americas EBIT and an average foreign exchange rate of A$/U$ 0.74.
17. Based on 1H21 plant production and 2H20 plant production; average realised 1H21 DAP price of US$426; and an average foreign exchange rate of A$/U$ 0.75.
18. Based on FY18 Gibson Island manufactured urea equivalent production annualised of 335k mt; average realised 1H21 urea price of US$296; and an average foreign exchange rate of A$/U$ 0.75.
19. The Board and Executive Team each includes the Managing Director & CEO.
20. IPL’s total global 2020 emissions were 3,616,740 tCO2e. The 2020 GHG baseline is subject to adjustment due to unforeseen future expansions and acquisitions or divestments which may occur before the end of the 2026 IPL financial year.
16Incitec Pivot Limited Profit Report Half Year 2021
Appendix
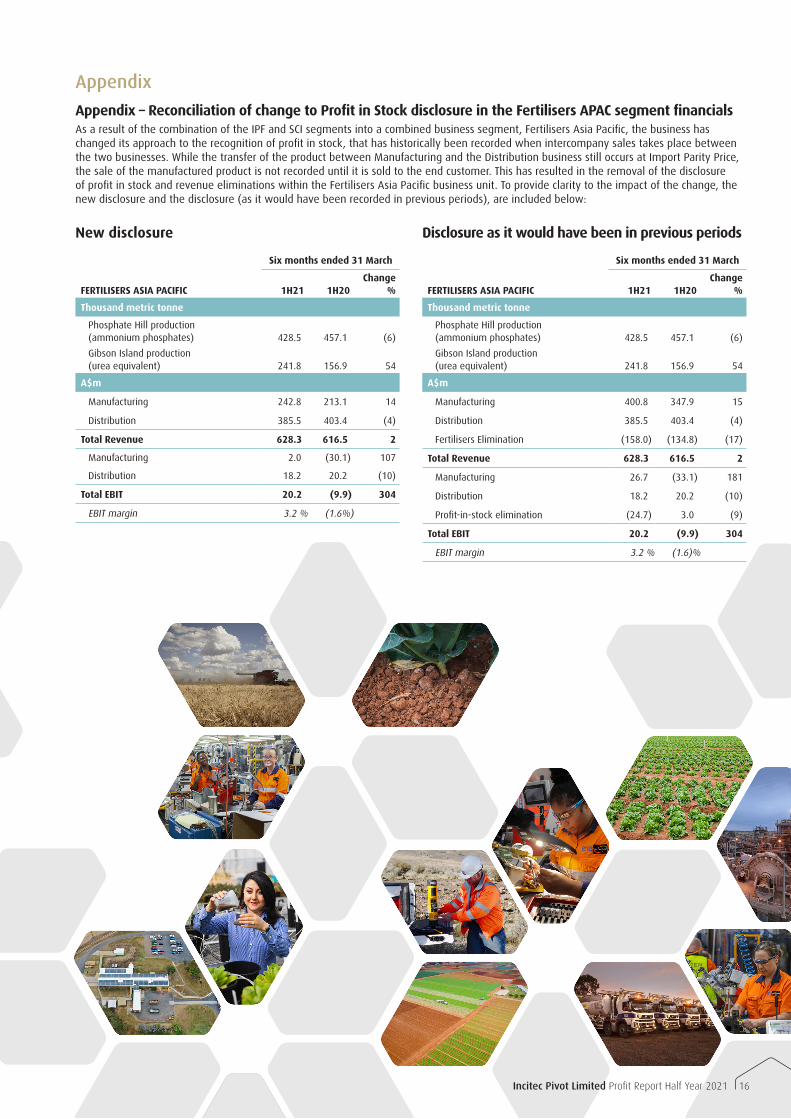
Appendix – Reconciliation of change to Profit in Stock disclosure in the Fertilisers APAC segment financialsAs a result of the combination of the IPF and SCI segments into a combined business segment, Fertilisers Asia Pacific, the business has changed its approach to the recognition of profit in stock, that has historically been recorded when intercompany sales takes place between the two businesses. While the transfer of the product between Manufacturing and the Distribution business still occurs at Import Parity Price, the sale of the manufactured product is not recorded until it is sold to the end customer. This has resulted in the removal of the disclosure of profit in stock and revenue eliminations within the Fertilisers Asia Pacific business unit. To provide clarity to the impact of the change, the new disclosure and the disclosure (as it would have been recorded in previous periods), are included below:
New disclosure
Six months ended 31 March
FERTILISERS ASIA PACIFIC 1H21 1H20Change
%
Thousand metric tonne
Phosphate Hill production (ammonium phosphates) 428.5 457.1 (6)
Gibson Island production (urea equivalent) 241.8 156.9 54
A$m
Manufacturing 242.8 213.1 14
Distribution 385.5 403.4 (4)
Total Revenue 628.3 616.5 2
Manufacturing 2.0 (30.1) 107
Distribution 18.2 20.2 (10)
Total EBIT 20.2 (9.9) 304
EBIT margin 3.2 % (1.6%)
Disclosure as it would have been in previous periods
Six months ended 31 March
FERTILISERS ASIA PACIFIC 1H21 1H20Change
%
Thousand metric tonne
Phosphate Hill production (ammonium phosphates) 428.5 457.1 (6)
Gibson Island production (urea equivalent) 241.8 156.9 54
A$m
Manufacturing 400.8 347.9 15
Distribution 385.5 403.4 (4)
Fertilisers Elimination (158.0) (134.8) (17)
Total Revenue 628.3 616.5 2
Manufacturing 26.7 (33.1) 181
Distribution 18.2 20.2 (10)
Profit-in-stock elimination (24.7) 3.0 (9)
Total EBIT 20.2 (9.9) 304
EBIT margin 3.2 % (1.6)%
Incitec Pivot Limited
www.incitecpivot.com.au
INCITEC PIVOT LIMITED March September September March September September March September September March September September March
FINANCIAL PERFORMANCE 2021 2020 2020 2020 2019 2019 2019 2018 2018 2018 2017 2017 2017
HY FY HY HY FY HY HY FY HY HY FY HY HY
VOLUMES SOLD ('000 tonnes)
FERTILISERS ASIA PACIFIC
Distribution
- Domestic Ag 696.3 1,844.4 1,099.5 744.9 1,596.6 1,036.4 560.2 1,707.0 1,058.5 648.5 1,740.3 1,092.7 647.6
- Industrial and Trading 109.6 217.1 111.3 105.8 239.7 144.0 95.7 191.5 104.9 86.6 176.6 90.6 86.0
Manufacturing
- Phosphate Hill 412.9 982.7 534.2 448.5 667.4 357.6 309.8 860.7 418.6 442.1 938.1 529.1 409.0
- Gibson Island 86.7 192.4 110.8 81.6 166.7 114.7 52.0 222.6 123.8 98.8 256.7 131.7 125.0
- Geelong 194.7 332.6 166.6 166.0 315.8 162.7 153.1 417.5 178.5 239.0 403.3 202.3 201.0
Intercompany Eliminations (243.3) (433.3) (148.4) (284.9) (233.8) (83.8) (150.0) (386.9) (66.5) (320.4) (432.8) (174.8) (258.0)
1,256.9 3,135.9 1,874.0 1,261.9 2,752.4 1,731.6 1,020.8 3,012.4 1,817.8 1,194.6 3,082.2 1,871.6 1,210.6
Quantum (third party sales) 79.2 439.6 363.6 76.0 625.6 360.2 265.4 1,315.0 759.0 556.0 1,404.0 928.4 475.6
AU$ mill AU$ mill AU$ mill AU$ mill AU$ mill AU$ mill AU$ mill AU$ mill AU$ mill AU$ mill AU$ mill AU$ mill AU$ mill
BUSINESS SEG SALES
Manufacturing 400.8 766.1 418.2 347.9 653.8 355.3 298.5 811.8 412.2 399.6 769.2 427.1 342.1
Distribution 385.5 947.6 544.2 403.4 908.9 559.9 349.0 881.6 544.6 337.0 794.4 486.2 308.2
Fertlisers eliminations (158.0) (211.7) (76.9) (134.8) (143.3) (48.8) (94.5) (221.7) (42.2) (179.5) (213.8) (92.9) (120.9)
Total Fertilisers 628.3 1,502.0 885.5 616.5 1,419.4 866.4 553.0 1,471.7 914.6 557.1 1,349.8 820.4 529.4
DNAP 455.8 999.2 507.3 491.9 990.7 520.2 470.5 978.6 499.5 479.1 933.2 488.3 444.9
Elimination (9.2) (18.5) (11.4) (7.1) (13.4) (10.4) (3.0) (12.1) (5.4) (6.7) (19.2) (11.6) (7.6)
Total Asia Pacific 1,074.9 2,482.7 1,381.4 1,101.3 2,396.7 1,376.2 1,020.5 2,438.2 1,408.7 1,029.5 2,263.8 1,297.1 966.7
Americas - DNA 671.1 1,506.5 737.7 768.8 1,569.0 824.1 744.9 1,462.3 784.5 677.8 1,251.4 660.4 591.0
Group Eliminations (21.9) (47.0) (24.8) (22.2) (47.5) (24.4) (23.1) (44.2) (20.1) (24.1) (41.8) (19.8) (22.0)
Total Sales - IPL Group 1,724.1 3,942.2 2,094.3 1,847.9 3,918.2 2,175.9 1,742.3 3,856.3 2,173.1 1,683.2 3,473.4 1,937.7 1,535.7
GEOGRAPHIC SEG SALES
Australia 1,043.0 2,399.0 1,342.5 1,056.5 2,304.8 1,329.1 975.7 2,322.0 1,353.9 968.1 2,155.2 1,239.8 915.4
North Americas 659.4 1,487.3 731.2 756.1 1,538.2 807.9 730.3 1,438.7 770.8 667.9 1,220.2 667.5 552.7
Turkey 18.9 50.5 23.9 26.6 50.3 26.8 23.5 66.5 31.7 34.8 61.6 32.4 29.2
Other 2.8 5.4 (3.3) 8.7 24.9 12.1 12.8 29.1 16.7 12.4 36.4 (2.0) 38.4
Total - IPL Group 1,724.1 3,942.2 2,094.3 1,847.9 3,918.2 2,175.9 1,742.3 3,856.3 2,173.1 1,683.2 3,473.4 1,937.7 1,535.7
BUSINESS SEG EBITDA (excluding IMIs)
Manufacturing 72.9 60.0 51.9 8.1 (48.6) (35.1) (13.5) 131.1 68.0 63.1 79.4 55.0 24.4
Distribution 27.5 71.3 43.1 28.2 47.0 29.3 17.7 53.3 33.6 19.7 90.5 55.2 35.3
Fertilisers Eliminations (24.7) (2.3) (5.3) 3.0 2.0 1.7 0.3 (2.2) 20.7 (22.9) 1.2 2.0 (0.8)
Total Fertilisers 75.7 129.0 89.7 39.3 0.4 (4.1) 4.5 182.2 122.3 59.9 171.1 112.2 58.9
DNAP 110.1 230.7 119.4 111.3 255.4 140.0 115.4 288.8 145.8 143.0 273.3 141.4 131.9
Total Asia Pacific 185.8 359.7 209.1 150.6 255.8 135.9 119.9 471.0 268.1 202.9 444.4 253.6 190.8
Americas - DNA 109.0 396.3 196.6 199.7 376.6 220.0 156.6 410.3 215.9 194.4 348.7 157.6 191.1
Group Elimination (0.5) (0.3) 1.0 (1.3) (1.7) (0.5) (1.2) (0.6) (0.7) 0.1 0.3 0.9 (0.6)
Corporate (8.6) (25.2) (13.7) (11.5) (25.4) (14.3) (11.1) (29.7) (16.3) (13.4) (18.9) (10.9) (8.0)
Total EBITDA (excluding IMIs) - IPL Group 285.7 730.5 393.0 337.5 605.3 341.1 264.2 851.0 467.0 384.0 774.5 401.2 373.3
BUSINESS SEG Depreciation and Amortisation
Manufacturing (46.2) (86.1) (44.9) (41.2) (73.0) (39.1) (33.9) (70.5) (37.4) (33.1) (60.0) (30.9) (29.1)
Distribution (9.3) (16.7) (8.7) (8.0) (7.1) (4.0) (3.1) (7.1) (3.6) (3.5) (7.2) (3.8) (3.4)
Fertilisers Eliminations - - - - - - - - - - - - -
Total Fertilisers (55.5) (102.8) (53.6) (49.2) (80.1) (43.1) (37.0) (77.6) (41.0) (36.6) (67.2) (34.7) (32.5)
DNAP (39.9) (81.4) (41.2) (40.2) (76.2) (37.4) (38.8) (83.4) (40.5) (42.9) (84.3) (44.0) (40.3)
Total Asia Pacific (95.4) (184.2) (94.8) (89.4) (156.3) (80.5) (75.8) (161.0) (81.5) (79.5) (151.5) (78.7) (72.8)
Americas - DNA (77.6) (165.5) (79.2) (86.3) (142.6) (73.9) (68.7) (131.7) (68.2) (63.5) (120.3) (63.2) (57.1)
Corporate (2.5) (6.3) (3.7) (2.6) (2.7) (1.7) (1.0) (1.6) (0.9) (0.7) (1.5) (0.9) (0.6)
Total Depreciation and Amortisation - IPL Group (175.5) (356.0) (177.7) (178.3) (301.6) (156.1) (145.5) (294.3) (150.6) (143.7) (273.3) (142.8) (130.5)
BUSINESS SEG EBIT (excluding IMIs)
Manufacturing 26.7 (26.1) 7.0 (33.1) (121.6) (74.2) (47.4) 60.6 30.6 30.0 19.4 24.1 (4.7)
Distribution 18.2 54.6 34.4 20.2 39.9 25.3 14.6 46.2 30.0 16.2 83.3 51.4 31.9
Fertilisers Eliminations (24.7) (2.3) (5.3) 3.0 2.0 1.7 0.3 (2.2) 20.7 (22.9) 1.2 2.0 (0.8)
Total Fertilisers 20.2 26.2 36.1 (9.9) (79.7) (47.2) (32.5) 104.6 81.3 23.3 103.9 77.5 26.4
DNAP 70.2 149.3 78.2 71.1 179.2 102.6 76.6 205.4 105.3 100.1 189.0 97.4 91.6
Total Asia Pacific 90.4 175.5 114.3 61.2 99.5 55.4 44.1 310.0 186.6 123.4 292.9 174.9 118.0
Americas - DNA 31.4 230.8 117.4 113.4 234.0 146.1 87.9 278.6 147.7 130.9 228.4 94.4 134.0
Group Elimination (0.5) (0.1) 1.2 (1.3) (1.7) (0.5) (1.2) (0.6) (0.7) 0.1 0.3 0.9 (0.6)
Corporate (11.1) (31.7) (17.6) (14.1) (28.1) (16.0) (12.1) (31.3) (17.2) (14.1) (20.4) (11.8) (8.6)
Total EBIT (excluding IMIs) - IPL Group 110.2 374.5 215.3 159.2 303.7 185.0 118.7 556.7 316.4 240.3 501.2 258.4 242.8
GEOGRAPHIC SEG NON-CURRENT ASSETS OTHER THAN
FINANCIAL INSTRUMENTS AND DEFERRED TAX ASSETS
Australia 3,504.3 3,549.2 3,549.2 3,589.3 3,412.8 3,412.8 3,350.9 3,310.6 3,310.6 3,278.3 3,513.5 3,513.5 3,536.3
North Americas 3,852.6 4,022.8 4,022.8 4,672.3 4,254.4 4,254.4 4,004.8 3,959.6 3,959.6 3,744.0 3,690.4 3,690.4 3,754.1
Turkey 2.2 2.0 2.0 2.7 1.6 1.6 1.5 1.3 1.3 1.5 1.4 1.4 1.2
Other 122.5 117.5 117.5 142.8 127.4 127.4 180.1 164.4 164.4 153.2 123.2 123.2 138.1
Total - IPL Group 7,481.6 7,691.5 7,691.5 8,407.1 7,796.2 7,796.2 7,537.3 7,435.9 7,435.9 7,177.0 7,328.5 7,328.5 7,429.7
FINANCIAL PERFORMANCE
EBIT 110.2 374.5 215.3 159.2 303.7 185.0 118.7 556.7 316.4 240.3 501.2 258.4 242.8
Net Interest (63.5) (135.7) (60.4) (75.3) (144.1) (76.5) (67.6) (128.0) (68.3) (59.7) (108.7) (58.8) (49.9)
Operating Profit Before Tax and Minorities 46.7 238.8 154.9 83.9 159.6 108.5 51.1 428.7 248.1 180.6 392.5 199.6 192.9
Income Tax (Expense)/ Benefit (10.3) (50.6) (31.3) (19.3) (7.5) 2.0 (9.5) (78.4) (47.0) (31.4) (70.9) (31.2) (39.7)
NPAT pre Individually Material Items 36.4 188.2 123.6 64.6 152.1 110.5 41.6 350.3 201.1 149.2 321.6 168.4 153.2
Individually Material Items Before Tax - 87.9 87.9 - - - - (236.0) - (236.0) - - -
Tax Expense - Individually Material Items - (23.1) (23.1) - - - - 96.5 - 96.5 - - -
NPAT & Individually Material Items 36.4 123.4 58.8 64.6 152.1 110.5 41.6 210.8 201.1 9.7 321.6 168.4 153.2
NPAT attributable to shareholders of IPL 36.4 123.4 58.8 64.6 152.4 110.5 41.9 207.9 200.3 7.6 318.7 166.6 152.1
NPAT attributable to minority interest - - - - (0.3) - (0.3) 2.9 0.8 2.1 2.9 1.8 1.1
US$ mill US$ mill US$ mill US$ mill US$ mill US$ mill US$ mill US$ mill US$ mill US$ mill US$ mill US$ mill US$ mill
Americas - DNA US$ EBITDA (excluding IMIs)
Explosives 82.5 195.4 101.8 93.6 197.6 111.8 85.8 192.3 107.5 84.8 174.0 94.8 79.2
Waggaman (3.8) 61.1 28.9 32.2 47.5 23.8 23.7 103.8 42.3 61.5 75.3 18.3 57.0
Ag & IC 3.1 10.4 3.5 6.9 10.8 8.5 2.3 15.6 10.9 4.7 15.5 7.9 7.6
Other - - - - 8.0 8.0 - - - - - - -
Total US$ EBITDA (excluding IMIs) - Americas - DNA 81.8 267.0 134.3 132.7 263.9 152.1 111.8 311.7 160.7 151.0 264.8 121.0 143.8
Americas - DNA US$ Depreciation & Amortisation
Explosives (38.7) (74.3) (36.3) (38.0) (61.5) (31.1) (30.4) (62.1) (31.3) (30.8) (56.2) (29.6) (26.6)
Waggaman (14.4) (28.7) (14.4) (14.3) (28.3) (14.6) (13.7) (27.6) (14.1) (13.5) (24.8) (13.7) (11.1)
Ag & IC (5.6) (9.1) (3.6) (5.5) (10.6) (5.6) (5.0) (10.4) (5.4) (5.0) (10.7) (5.4) (5.3)
Total US$ Depreciation and Amortisation - Americas - DNA (58.7) (112.2) (54.4) (57.8) (100.4) (51.3) (49.1) (100.1) (50.8) (49.3) (91.7) (48.7) (43.0)
Americas - DNA US$ EBIT (excluding IMIs)
Explosives 43.8 121.1 65.5 55.6 136.1 80.7 55.4 130.2 76.2 54.0 117.8 65.2 52.6
Waggaman (18.2) 32.4 14.5 17.9 19.2 9.2 10.0 76.2 28.2 48.0 50.5 4.6 45.9
Ag & IC (2.5) 1.3 (0.1) 1.4 0.2 2.9 (2.7) 5.2 5.5 (0.3) 4.8 2.5 2.3
Other - - - - 8.0 8.0 - - - - - - -
Total US$ EBIT (excluding IMIs) - Americas - DNA 23.1 154.8 79.9 74.9 163.5 100.8 62.7 211.6 109.9 101.7 173.1 72.3 100.8
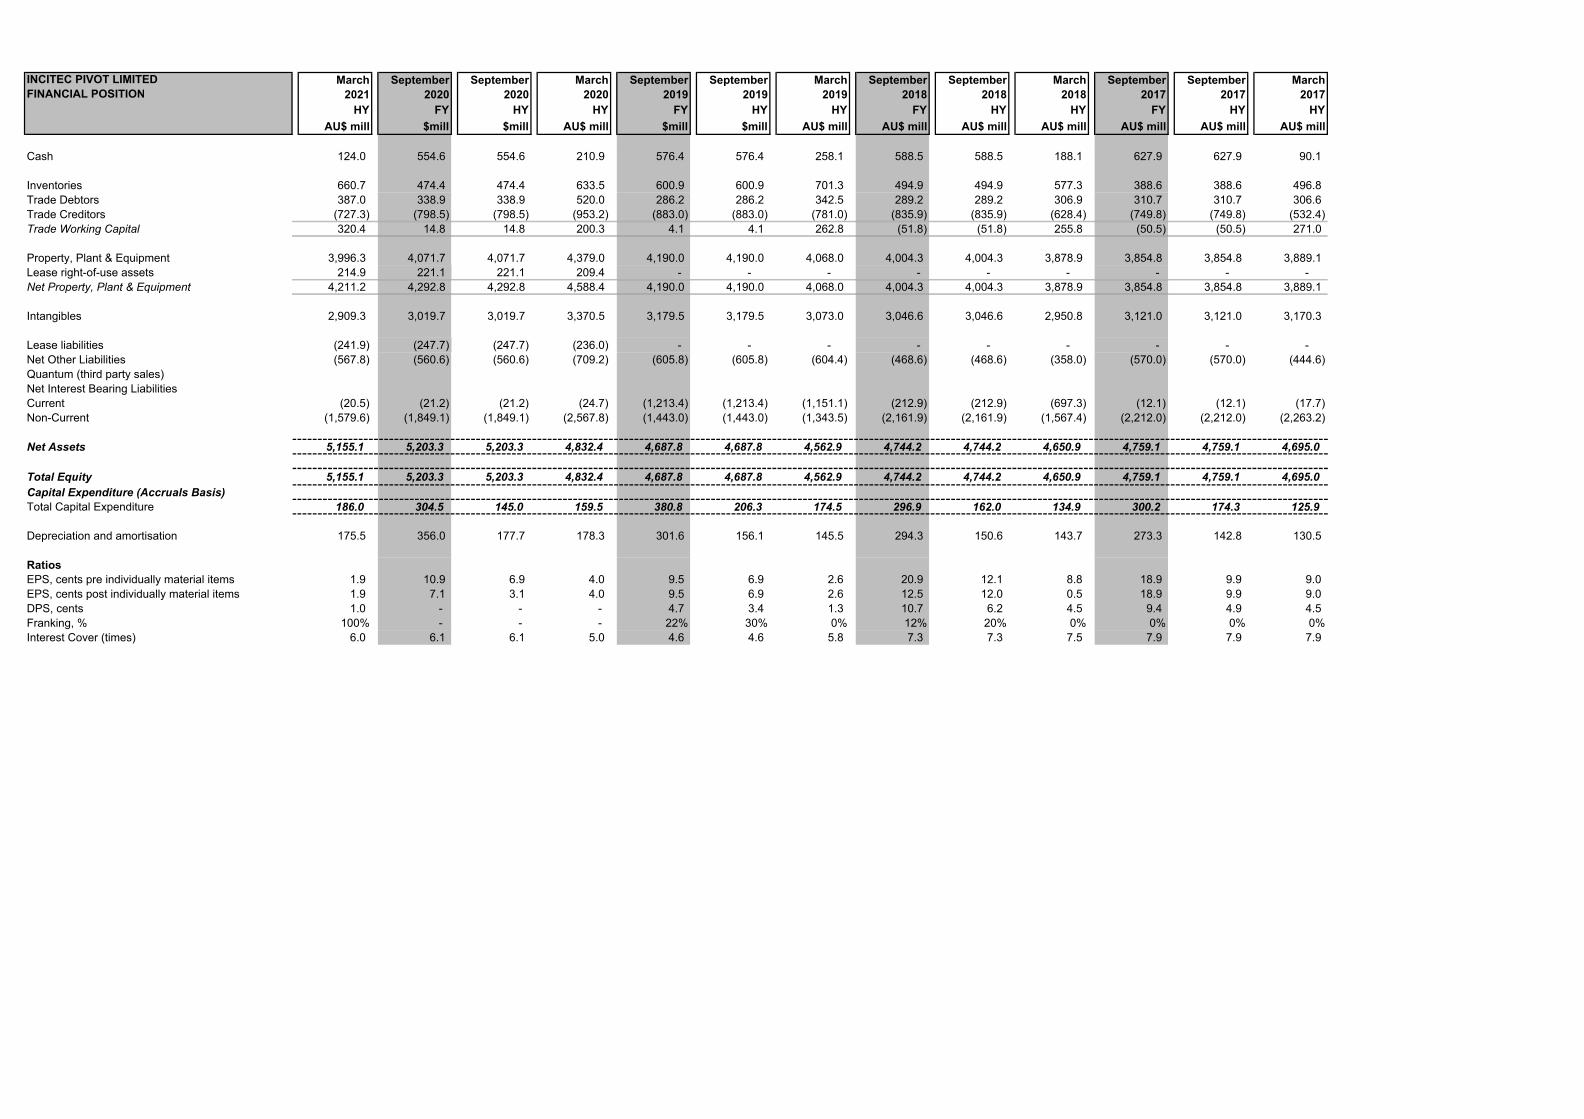
INCITEC PIVOT LIMITED March September September March September September March September September March September September MarchFINANCIAL POSITION 2021 2020 2020 2020 2019 2019 2019 2018 2018 2018 2017 2017 2017
HY FY HY HY FY HY HY FY HY HY FY HY HY
AU$ mill $mill $mill AU$ mill $mill $mill AU$ mill AU$ mill AU$ mill AU$ mill AU$ mill AU$ mill AU$ mill
Cash 124.0 554.6 554.6 210.9 576.4 576.4 258.1 588.5 588.5 188.1 627.9 627.9 90.1
Inventories 660.7 474.4 474.4 633.5 600.9 600.9 701.3 494.9 494.9 577.3 388.6 388.6 496.8
Trade Debtors 387.0 338.9 338.9 520.0 286.2 286.2 342.5 289.2 289.2 306.9 310.7 310.7 306.6
Trade Creditors (727.3) (798.5) (798.5) (953.2) (883.0) (883.0) (781.0) (835.9) (835.9) (628.4) (749.8) (749.8) (532.4)
Trade Working Capital 320.4 14.8 14.8 200.3 4.1 4.1 262.8 (51.8) (51.8) 255.8 (50.5) (50.5) 271.0
Property, Plant & Equipment 3,996.3 4,071.7 4,071.7 4,379.0 4,190.0 4,190.0 4,068.0 4,004.3 4,004.3 3,878.9 3,854.8 3,854.8 3,889.1
Lease right-of-use assets 214.9 221.1 221.1 209.4 - - - - - - - - -
Net Property, Plant & Equipment 4,211.2 4,292.8 4,292.8 4,588.4 4,190.0 4,190.0 4,068.0 4,004.3 4,004.3 3,878.9 3,854.8 3,854.8 3,889.1
Intangibles 2,909.3 3,019.7 3,019.7 3,370.5 3,179.5 3,179.5 3,073.0 3,046.6 3,046.6 2,950.8 3,121.0 3,121.0 3,170.3
Lease liabilities (241.9) (247.7) (247.7) (236.0) - - - - - - - - -
Net Other Liabilities (567.8) (560.6) (560.6) (709.2) (605.8) (605.8) (604.4) (468.6) (468.6) (358.0) (570.0) (570.0) (444.6)
Quantum (third party sales)
Net Interest Bearing Liabilities
Current (20.5) (21.2) (21.2) (24.7) (1,213.4) (1,213.4) (1,151.1) (212.9) (212.9) (697.3) (12.1) (12.1) (17.7)
Non-Current (1,579.6) (1,849.1) (1,849.1) (2,567.8) (1,443.0) (1,443.0) (1,343.5) (2,161.9) (2,161.9) (1,567.4) (2,212.0) (2,212.0) (2,263.2)
Net Assets 5,155.1 5,203.3 5,203.3 4,832.4 4,687.8 4,687.8 4,562.9 4,744.2 4,744.2 4,650.9 4,759.1 4,759.1 4,695.0
Total Equity 5,155.1 5,203.3 5,203.3 4,832.4 4,687.8 4,687.8 4,562.9 4,744.2 4,744.2 4,650.9 4,759.1 4,759.1 4,695.0
Capital Expenditure (Accruals Basis)
Total Capital Expenditure 186.0 304.5 145.0 159.5 380.8 206.3 174.5 296.9 162.0 134.9 300.2 174.3 125.9
Depreciation and amortisation 175.5 356.0 177.7 178.3 301.6 156.1 145.5 294.3 150.6 143.7 273.3 142.8 130.5
Ratios
EPS, cents pre individually material items 1.9 10.9 6.9 4.0 9.5 6.9 2.6 20.9 12.1 8.8 18.9 9.9 9.0
EPS, cents post individually material items 1.9 7.1 3.1 4.0 9.5 6.9 2.6 12.5 12.0 0.5 18.9 9.9 9.0
DPS, cents 1.0 - - - 4.7 3.4 1.3 10.7 6.2 4.5 9.4 4.9 4.5
Franking, % 100% - - - 22% 30% 0% 12% 20% 0% 0% 0% 0%
Interest Cover (times) 6.0 6.1 6.1 5.0 4.6 4.6 5.8 7.3 7.3 7.5 7.9 7.9 7.9
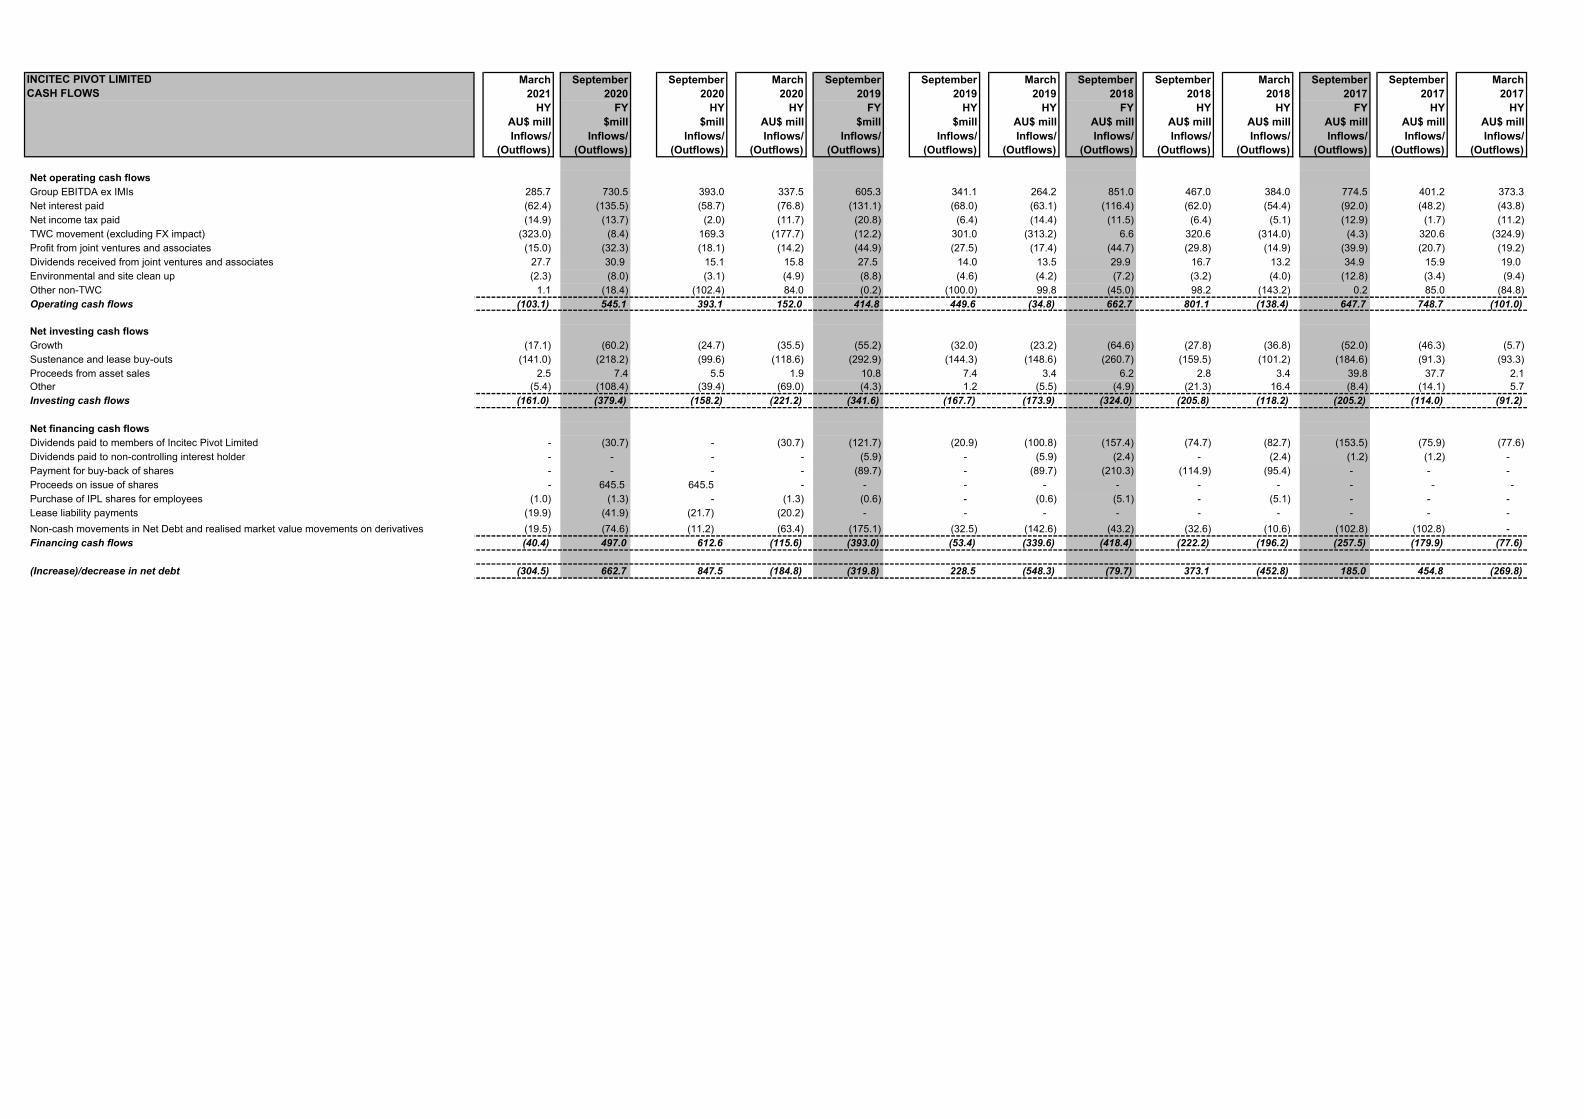
INCITEC PIVOT LIMITED March September September March September September March September September March September September March
CASH FLOWS 2021 2020 2020 2020 2019 2019 2019 2018 2018 2018 2017 2017 2017
HY FY HY HY FY HY HY FY HY HY FY HY HY
AU$ mill $mill $mill AU$ mill $mill $mill AU$ mill AU$ mill AU$ mill AU$ mill AU$ mill AU$ mill AU$ mill
Inflows/ Inflows/ Inflows/ Inflows/ Inflows/ Inflows/ Inflows/ Inflows/ Inflows/ Inflows/ Inflows/ Inflows/ Inflows/
(Outflows) (Outflows) (Outflows) (Outflows) (Outflows) (Outflows) (Outflows) (Outflows) (Outflows) (Outflows) (Outflows) (Outflows) (Outflows)
Net operating cash flows
Group EBITDA ex IMIs 285.7 730.5 393.0 337.5 605.3 341.1 264.2 851.0 467.0 384.0 774.5 401.2 373.3
Net interest paid (62.4) (135.5) (58.7) (76.8) (131.1) (68.0) (63.1) (116.4) (62.0) (54.4) (92.0) (48.2) (43.8)
Net income tax paid (14.9) (13.7) (2.0) (11.7) (20.8) (6.4) (14.4) (11.5) (6.4) (5.1) (12.9) (1.7) (11.2)
TWC movement (excluding FX impact) (323.0) (8.4) 169.3 (177.7) (12.2) 301.0 (313.2) 6.6 320.6 (314.0) (4.3) 320.6 (324.9)
Profit from joint ventures and associates (15.0) (32.3) (18.1) (14.2) (44.9) (27.5) (17.4) (44.7) (29.8) (14.9) (39.9) (20.7) (19.2)
Dividends received from joint ventures and associates 27.7 30.9 15.1 15.8 27.5 14.0 13.5 29.9 16.7 13.2 34.9 15.9 19.0
Environmental and site clean up (2.3) (8.0) (3.1) (4.9) (8.8) (4.6) (4.2) (7.2) (3.2) (4.0) (12.8) (3.4) (9.4)
Other non-TWC 1.1 (18.4) (102.4) 84.0 (0.2) (100.0) 99.8 (45.0) 98.2 (143.2) 0.2 85.0 (84.8)
Operating cash flows (103.1) 545.1 393.1 152.0 414.8 449.6 (34.8) 662.7 801.1 (138.4) 647.7 748.7 (101.0)
Net investing cash flows
Growth (17.1) (60.2) (24.7) (35.5) (55.2) (32.0) (23.2) (64.6) (27.8) (36.8) (52.0) (46.3) (5.7)
Sustenance and lease buy-outs (141.0) (218.2) (99.6) (118.6) (292.9) (144.3) (148.6) (260.7) (159.5) (101.2) (184.6) (91.3) (93.3)
Proceeds from asset sales 2.5 7.4 5.5 1.9 10.8 7.4 3.4 6.2 2.8 3.4 39.8 37.7 2.1
Other (5.4) (108.4) (39.4) (69.0) (4.3) 1.2 (5.5) (4.9) (21.3) 16.4 (8.4) (14.1) 5.7
Investing cash flows (161.0) (379.4) (158.2) (221.2) (341.6) (167.7) (173.9) (324.0) (205.8) (118.2) (205.2) (114.0) (91.2)
Net financing cash flows
Dividends paid to members of Incitec Pivot Limited - (30.7) - (30.7) (121.7) (20.9) (100.8) (157.4) (74.7) (82.7) (153.5) (75.9) (77.6)
Dividends paid to non-controlling interest holder - - - - (5.9) - (5.9) (2.4) - (2.4) (1.2) (1.2) -
Payment for buy-back of shares - - - - (89.7) - (89.7) (210.3) (114.9) (95.4) - - -
Proceeds on issue of shares - 645.5 645.5 - - - - - - - - - -
Purchase of IPL shares for employees (1.0) (1.3) - (1.3) (0.6) - (0.6) (5.1) - (5.1) - - -
Lease liability payments (19.9) (41.9) (21.7) (20.2) - - - - - - - - -
Non-cash movements in Net Debt and realised market value movements on derivatives (19.5) (74.6) (11.2) (63.4) (175.1) (32.5) (142.6) (43.2) (32.6) (10.6) (102.8) (102.8) -
Financing cash flows (40.4) 497.0 612.6 (115.6) (393.0) (53.4) (339.6) (418.4) (222.2) (196.2) (257.5) (179.9) (77.6)
(Increase)/decrease in net debt (304.5) 662.7 847.5 (184.8) (319.8) 228.5 (548.3) (79.7) 373.1 (452.8) 185.0 454.8 (269.8)