For personal use only - Australian Securities Exchange* IPL Incitec Pivot 2,045 2,275 6,479 MIR...
43
DJERRIWARRH INVESTMENTS LIMITED ABN 38 006 862 693 APPENDIX 4E STATEMENT FOR THE YEAR ENDING 30 JUNE 2013 CONTENTS • Results for announcement to the market • Media Release • Appendix 4E Accounts • Independent Audit Report These documents comprise the preliminary final report given to ASX under listing rule 4.3A 1 For personal use only
Transcript of For personal use only - Australian Securities Exchange* IPL Incitec Pivot 2,045 2,275 6,479 MIR...

DJERRIWARRH INVESTMENTS
LIMITED ABN 38 006 862 693
APPENDIX 4E STATEMENT FOR THE YEAR ENDING 30 JUNE 2013
CONTENTS
• Results for announcement to the market
• Media Release
• Appendix 4E Accounts • Independent Audit Report These documents comprise the preliminary final report given to ASX under listing rule 4.3A
1
For
per
sona
l use
onl
y

RESULTS FOR ANNOUNCEMENT TO THE MARKET
The reporting period is the year ended 30 June 2013 with the previous corresponding period being the year ended 30 June 2012.
This report is based on audited financial statements. A copy of the audit report can be found on page 42.
Results for announcement to the market
• The final dividend of 16 cents per share fully franked, the same as last year, will be paid on 23 August 2013 to ordinary shareholders on the register on 12 August 2013. 10 cents of the final dividend is sourced from capital gains, on which the Company has paid or will pay tax. The amount of the pre-tax attributable gain, known as an “LIC capital gain”, is therefore 14.3 cents. This enables some shareholders to claim a tax deduction in their tax return. Further details will be on the dividend statements.
• Net Operating Result after tax was $35.1 million, 7.5% down from the previous corresponding period.
• Net Operating Result per share was 16.1 cents per share, down from 17.5 cents last year.
• Net Profit attributable to members was $37.7 million, 14.7% down from $44.1 million in the previous corresponding period.
• Revenue from operating activities was $37.6 million, 11.4% down from the previous corresponding period.
• The interim dividend for the 2013 financial year was 10 cents per share (the same as last year), fully franked, and it was paid to shareholders on 19 February 2013.
• The Dividend Reinvestment Plan remains suspended.
• Net tangible assets per share before any provision for deferred tax on the unrealised taxable gains on the long-term investment portfolio as at 30 June 2013 were $3.50 (before allowing for the final dividend), up from from $3.17 (before allowing for the final dividend) at the end of the previous corresponding period.
• The 2013 AGM will be held at the RACV City Club, Melbourne, at 10.00 AM on Monday 7 October 2013.
2
For
per
sona
l use
onl
y

MEDIA RELEASE – FULL YEAR RESULT TO 30 JUNE 2013
MARKET CONDITIONS PROVIDING OPPORTUNITIES
Profit for the year to 30 June 2013 was $37.7 million, down 14.7% from $44.1 million over the corresponding period last year. The Net Operating Result, which is a better measure of the on-going investment, trading and option income from the Company’s portfolios, was down 7.5% to $35.1 million for the year compared with the corresponding figure of $37.9 million last year.
The generally strong rise in the market over the year produced a number of call option exercises in the major banks and other high yielding stocks. This outcome along with the sale of Hastings Diversified Utilities Fund and Australian Infrastructure Fund meant a fall in Djerriwarrh’s dividend income for the year. However these sales have produced significant realised gains and franking credits.
Djerriwarrh’s final dividend has been maintained at 16 cents per share fully franked, bringing total dividends for the year to 26 cents per share.
In a market that for the most part experienced strong gains over the year, Djerriwarrh’s portfolio return was 19.0% whereas the S&P/ASX 200 Accumulation Index rose 22.8%. In very strong years like the market has had, Djerriwarrh’s relative portfolio return can be impacted by the tax paid on realised gains and the writing of call options over part of the portfolio. Importantly the generation of the franking from Djerriwarrh’s investment activities add to returns and relative performance, particularly over the long term. For those investors who can take full advantage of the franking credits, this has added 0.7% per annum to investor returns above the overall market over a 10 year period (refer to the attached performance table). The larger purchases, including acquisitions in Commonwealth Bank, Westpac, ANZ and National Australia Bank, were in part the replacement of holdings sold through option exercises. New companies added to the portfolio included Suncorp and APA Group (as a result of its takeover of Hastings Diversified Utilities Fund). Djerriwarrh enters the new financial year with a good level of option coverage and sound cash position. This provides the Company with significant flexibility in a market that is expected to remain somewhat uncertain given global and domestic conditions. A greater level of volatility also allows the Company to continue to deploy funds into attractive buy and write opportunities as a way of enhancing fully franked income and adding to long term portfolio holdings. Please direct any enquiries to: Ross Barker Geoff Driver Managing Director General Manager (03) 9225 2101 (03) 9225 2102 15 July 2013
3
For
per
sona
l use
onl
y
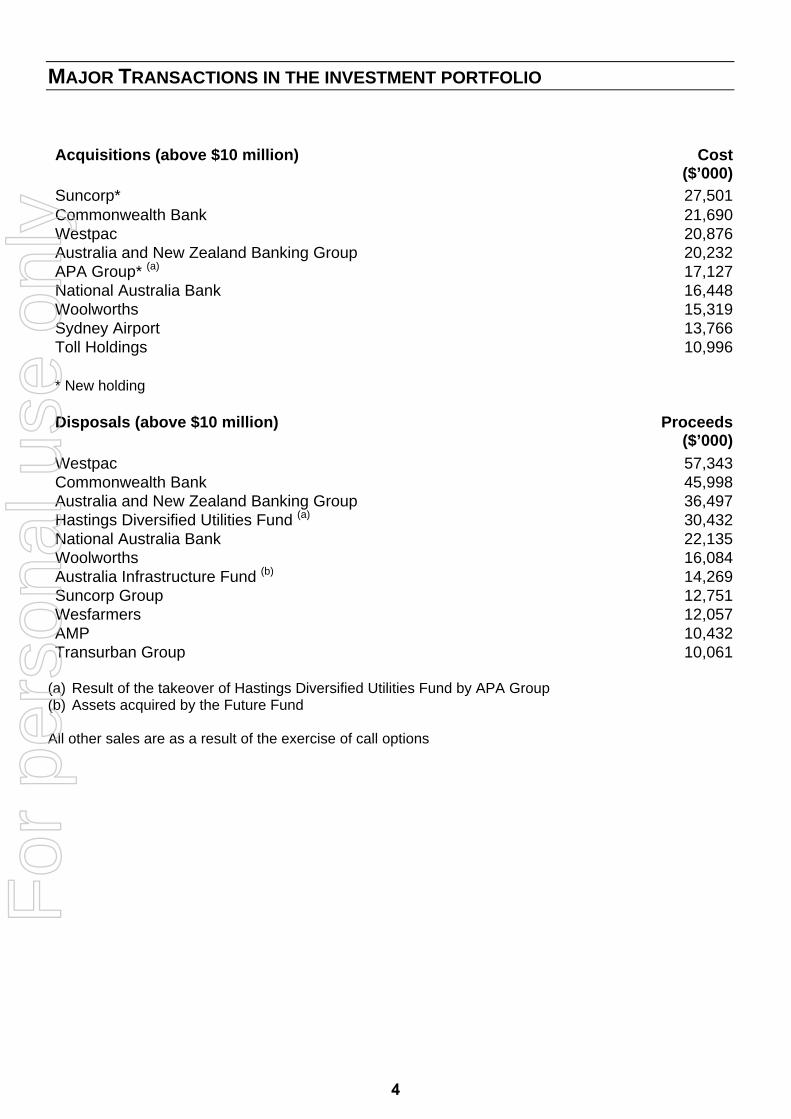
MAJOR TRANSACTIONS IN THE INVESTMENT PORTFOLIO Acquisitions (above $10 million) Cost
($’000)Suncorp* 27,501Commonwealth Bank 21,690Westpac 20,876Australia and New Zealand Banking Group 20,232APA Group* (a) 17,127National Australia Bank 16,448Woolworths 15,319Sydney Airport 13,766Toll Holdings 10,996 * New holding Disposals (above $10 million) Proceeds
($’000)
Westpac 57,343Commonwealth Bank 45,998Australia and New Zealand Banking Group 36,497Hastings Diversified Utilities Fund (a) 30,432National Australia Bank 22,135Woolworths 16,084Australia Infrastructure Fund (b) 14,269Suncorp Group 12,751Wesfarmers 12,057AMP 10,432Transurban Group 10,061
(a) Result of the takeover of Hastings Diversified Utilities Fund by APA Group (b) Assets acquired by the Future Fund All other sales are as a result of the exercise of call options
4
For
per
sona
l use
onl
y

TOP INVESTMENTS AS AT 30 JUNE 2013
Includes investments held in both the Investment and Trading Portfolios
Valued at closing prices at 28 June 2013
Total Value $ million
1 * BHP Billiton 79.12 * Commonwealth Bank of Australia 52.33 * Telstra Corporation 51.94 * National Australia Bank 48.85 * Westpac Banking Corporation 43.56 * Australia & New Zealand Banking Group 43.47 * Oil Search 38.28 * Woodside Petroleum 35.69 * Rio Tinto 24.410 * Brambles 23.311 * Santos 22.512 * QBE Insurance Group 22.213 * Wesfarmers (a) 20.914 * AMP 20.115 * APA Group 17.116 * Transurban Group 16.417 * Coca-Cola Amatil 15.518 * Woolworths 15.019 * Suncorp Group 14.920 * Origin Energy 13.9 619.0
As % of Total Portfolio Value 80.9% (excludes Cash)
(a) Includes $5.3 WESN partially protected securities
*Indicates that options were outstanding against all or part of the holding
5
For
per
sona
l use
onl
y

PORTFOLIO PERFORMANCE TO 30 JUNE 2013
ANNUALISED RETURNS
PERFORMANCE MEASURES 1 YEAR 3 YEARS 5 YEARS 10 YEARS
PORTFOLIO RETURN - NET ASSET BACKING INCLUDING
DIVIDENDS REINVESTED 19.0% 8.1% 3.5% 8.8%
S&P/ASX 200 ACCUMULATION INDEX 22.8% 8.6% 2.9% 9.4%
NET ASSET BACKING GROSS RETURN INCLUDING DIVIDENDS
REINVESTED* 22.5% 11.3% 6.6% 11.6%
S&P/ASX 200 GROSS ACCUMULATION INDEX* 24.6% 10.2% 4.5% 10.9%
*Incorporates the benefit of franking credits for those who can fully utilise them
6
For
per
sona
l use
onl
y

Djerriwarrh Share Price Yield vs. Market Yield
0%
1%
2%
3%
4%
5%
6%
7%
8%
9%
Yield - Share Price Yield - S&P/ASX 200 Index
The chart above highlights the relative dividend yield on Djerriwarrh shares (which is fully franked) in comparison to the dividend yield on the S&P/ASX 200 Index (which is currently only 80% franked) since the Company was listed.
7
For
per
sona
l use
onl
y

HOLDINGS OF SECURITIES AS AT 30 JUNE 2013 Details of the Company’s portfolios are given below. The list should not be used to evaluate portfolio performance or to determine the net asset backing per share (which is advised to the Australian Securities Exchange each month and recorded on the toll-free telephone service at 1800 780 784). Individual holdings in the portfolios may change significantly during the course of the year. In addition, holdings may be subject to call options or sale commitments by which they may be sold at a price significantly different from the market price prevailing at the time of the exercise or sale. Unless otherwise stated, the securities in this list are fully paid ordinary shares, trust units, stapled securities or convertible notes. Code Company Name Number of
Shares held 2012 ’000
Number of Shares held
2013’000
Market Value 2013
$’000* AGK AGL Energy 572 941 13,604* ALQ ALS Limited 0 102 967* AMC Amcor 1,705 1,220 12,017 AMH AMCIL 10,599 10,599 9,115* AMP AMP 5,968 4,747 20,093* ANZ Australia and New Zealand Banking Group 2,309 1,538 43,430* APA APA Group 0 2,865 17,087* ASX ASX Limited 86 194 6,426 AWC Alumina 3,718 3,718 3,662* BHP BHP Billiton 2,381 2,521 79,067* BLD Boral 1,153 1,153 4,851* BXB Brambles 2,715 2,610 23,333* CBA Commonwealth Bank of Australia 1,227 770 52,285* CCL Coca-Cola Amatil 672 1,220 15,482* CPU Computershare 762 1,047 10,241 EQT Equity Trustees 66 67 1,006* FBU Fletcher Building 0 620 4,296 # Hexima 280 280 48* IAG Insurance Australia Group 2,060 985 5,304* ILU Iluka Resources 130 410 4,040* IPL Incitec Pivot 2,045 2,275 6,479 MIR Mirrabooka Investments 4,616 4,616 10,849* NAB National Australia Bank 2,117 1,660 48,779* ORG Origin Energy 1,169 1,119 13,852* ORI Orica 443 607 12,504* OSH Oil Search 5,001 4,977 38,176 PNA PanAust 729 729 1,331 PPCG Peet 9.5% Convertible notes 26 26 2,626 PPT Perpetual 94 54 1,920* QBE QBE Insurance Group 1,508 1,487 22,174* RIO Rio Tinto 359 471 24,443* SHL Sonic Healthcare 0 400 5,769* STO Santos 1,793 1,819 22,540* SUN Suncorp Group 0 1,288 14,870* SYD Sydney Airport 409 4,226 13,544* TCL Transurban Group 3,693 2,431 16,369
8
For
per
sona
l use
onl
y

Ordinary shares and trust units Number of Shares held
2012 ’000
Number of Shares held
2013’000
Market Value 2013
$’000* TLS Telstra Corporation 13,264 10,914 51,917* TOL Toll Holdings 769 1,694 8,936 TRU Trust Company 370 370 2,031 TWE Treasury Wine Estates 414 189 1,098* WBC Westpac Banking Corporation 3,232 1,521 43,524* WES Wesfarmers 591 399 15,657 WESN Wesfarmers Partially Protected Shares 131 131 5,267* WOR WorleyParsons 0 170 3,311* WOW Woolworths 525 460 15,043* WPL Woodside Petroleum 948 1,023 35,605 TOTAL 764,969
*Indicates that options were outstanding against part or all of the holding
#Unlisted stock
9
For
per
sona
l use
onl
y

FINANCIAL REPORT
10
For
per
sona
l use
onl
y

INCOME STATEMENT FOR THE YEAR ENDED 30 JUNE 2013
Note
2013
2012 $’000 $’000 Dividends and distributions 34,541 40,312
Revenue from deposits and bank bills 3,061 2,116
Other revenue - 26
Total revenue 37,602 42,454
Net gains/(losses) on trading portfolio 2,518 (3,192)Income from options written portfolio 7,147 11,287
Income from operating activities 47,267 50,549
Finance costs (6,612) (6,964)Administration expenses (3,486) (3,412)
Share of net profit from Associate 166 153
Operating result before income tax expense 4 37,335 40,326
Income tax expense* 5 (2,264) (2,419)
Net operating result for the year 35,071 37,907
Net gains/(losses) on investments Net losses on open options positions (566) (447)Deferred tax on net losses on open options positions* 5 170 134Net gains on puttable instruments and non-equity investments 4,279 9,356Tax expense on net gains on puttable instruments and 5 non-equity investments*
(1,284) (2,807)
2,599 6,236
Profit for the year 37,670 44,143
Cents Cents
Basic earnings per share 22 17.25 20.41
2013 2012 $’000 $’000 * Total Tax Expense 5 3,378 5,092
This Income Statement should be read in conjunction with the accompanying notes.
11
For
per
sona
l use
onl
y
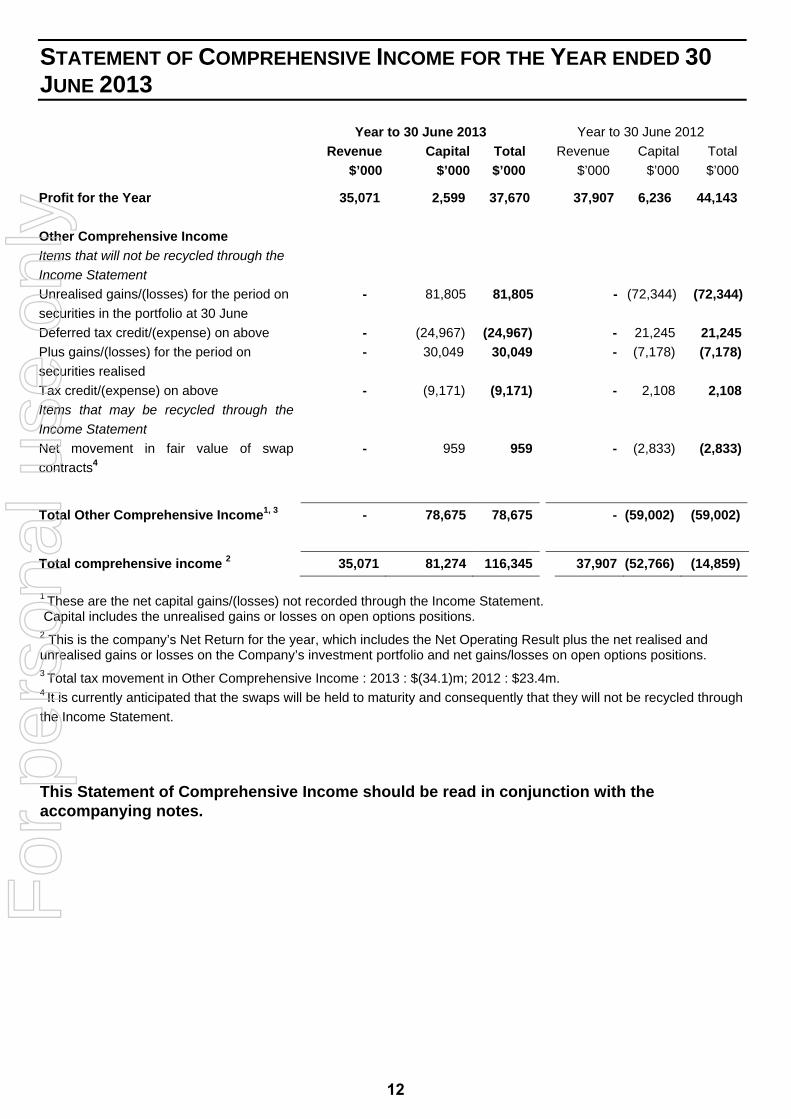
STATEMENT OF COMPREHENSIVE INCOME FOR THE YEAR ENDED 30
JUNE 2013
Year to 30 June 2013
Year to 30 June 2012
Revenue Capital Total Revenue Capital Total
$’000 $’000 $’000 $’000 $’000 $’000
Profit for the Year 35,071 2,599 37,670 37,907 6,236 44,143
Other Comprehensive Income
Items that will not be recycled through the
Income Statement
Unrealised gains/(losses) for the period on
securities in the portfolio at 30 June
- 81,805 81,805 - (72,344) (72,344)
Deferred tax credit/(expense) on above - (24,967) (24,967) - 21,245 21,245
Plus gains/(losses) for the period on
securities realised
- 30,049 30,049 - (7,178) (7,178)
Tax credit/(expense) on above - (9,171) (9,171) - 2,108 2,108
Items that may be recycled through the
Income Statement
Net movement in fair value of swap
contracts4
- 959 959 - (2,833) (2,833)
Total Other Comprehensive Income1, 3 - 78,675 78,675 - (59,002) (59,002)
Total comprehensive income 2 35,071 81,274 116,345 37,907 (52,766) (14,859)
1 These are the net capital gains/(losses) not recorded through the Income Statement. Capital includes the unrealised gains or losses on open options positions. 2 This is the company’s Net Return for the year, which includes the Net Operating Result plus the net realised and unrealised gains or losses on the Company’s investment portfolio and net gains/losses on open options positions. 3 Total tax movement in Other Comprehensive Income : 2013 : $(34.1)m; 2012 : $23.4m. 4 It is currently anticipated that the swaps will be held to maturity and consequently that they will not be recycled through
the Income Statement. This Statement of Comprehensive Income should be read in conjunction with the accompanying notes.
12
For
per
sona
l use
onl
y

BALANCE SHEET AS AT 30 JUNE 2013 2013 2012Note $’000 $’000
Current assets Cash 6 91,386 34,170Receivables 7 11,191 30,304Trading portfolio 8 6,366 16,405Total current assets 108,943 80,879 Non-current assets Investment portfolio 9 766,843 714,814Shares in associate 784 671Deferred tax assets 10 - 247Deferred tax assets – investment portfolio 14 - 2,375Total non-current assets 767,627 718,107
Total assets 876,570 798,986 Current liabilities Payables 11 955 1,938Tax payable 25,209 544Borrowings – bank debt 75,000 100,000Interest-rate hedging contracts 12 2,367 3,326Options written portfolio 13 8,240 2,179Total current liabilities 111,771 107,987 Non-current liabilities Deferred tax liabilities 10 335 -Deferred tax liabilities - investment portfolio 14 8,287 -Total non-current liabilities 8,622 - Total liabilities 120,393 107,987 Net Assets 756,177 690,999 Shareholders' equity
Share Capital 15 634,225 628,797Revaluation Reserve 17 53,656 (17,359)Realised Capital Gains Reserve 18 28,227 19,259Interest-rate Hedging Reserve 12 (2,367) (3,326)Retained Profits 19 42,436 63,628Total shareholders' equity 756,177 690,999 This Balance Sheet should be read in conjunction with the accompanying notes.
13
For
per
sona
l use
onl
y

STATEMENT OF CHANGES IN EQUITY FOR THE YEAR ENDED 30 JUNE 2013
Year Ended 30 June 2013
NoteShare
Capital$’000
Revaluation Reserve
$’000
Realised Capital
Gains$’000
Interest-Rate
Hedging $’000
Retained Profits
$’000
Total $’000
Total equity at the beginning of the year 628,797 (17,359) 19,259 (3,326) 63,628 690,999
Dividends paid 21 - - - - (56,595) (56,595) Shares issued - Dividend Reinvestment Plan 15 5,441 - - - - 5,441 Other Share Capital Adjustments 15 (13) - - - - (13) Total transactions with share-holders 5,428 - - - (56,595) (51,167)
Profit for the year - 2,995 - - 34,675 37,670
Other Comprehensive Income (net of tax) Net unrealised gains for the period for stocks held at 30 June - 56,838 - - - 56,838
Net gains for the period on securities realised - 20,878 - - - 20,878 Transfer to Realisation Reserve of cumulative gains on investments realised
18 - (8,968) 8,968 - - -
Tax charge recognised in prior years on scrip-for-scrip takeovers - (728) - - 728 - Net movement in fair value of swap contracts - - - 959 - 959 Other Comprehensive Income for the year - 68,020 8,968 959 728 78,675
Total equity at the end of the year 634,225 53,656 28,227 (2,367) 42,436 756,177
This Statement of Changes in Equity should be read in conjunction with the accompanying notes.
14
For
per
sona
l use
onl
y

STATEMENT OF CHANGES IN EQUITY FOR THE YEAR ENDED 30 JUNE 2013 (2012 COMPARATIVES)
Year Ended 30 June 2012
NoteShare
Capital$’000
Revaluation Reserve
$’000
Realised Capital
Gains$’000
Interest-Rate
Hedging $’000
Retained Profits
$’000Total$’000
Total equity at the beginning of the year 619,986 20,153 44,242 (493) 69,108 752,996
Dividends paid 21 - - (12,875) - (43,074) (55,949)Shares issued - Dividend Reinvestment Plan 15 8,835 - - - - 8,835Other Share Capital Adjustments 15 (24) - - - - (24)Total transactions with share-holders 8,811 - (12,875) - (43,074) (47,138)
Profit for the year - 6,549 - - 37,594 44,143
Other Comprehensive Income (net of tax)
Net unrealised losses for the period for stocks held at 30 June
- (51,099) - - - (51,099)
Net losses for the period on securities realised - (5,070) (5,070)
Transfer to Realisation Reserve of cumulative losses on investments realised
18 - 12,108 (12,108) - - -
Net movement in fair value of swap contracts - - - (2,833) - (2,833)Other Comprehensive Income for the year - (44,061) (12,108) (2,833) - (59,002)
Total equity at the end of the year 628,797 (17,359) 19,259 (3,326) 63,628 690,999
This Statement of Changes in Equity should be read in conjunction with the accompanying notes.
15
For
per
sona
l use
onl
y

CASH FLOW STATEMENT FOR THE YEAR ENDED 30 JUNE 2013
2013
2012$’000 $’000
INFLOWS/ INFLOWS/ Note (OUTFLOWS) (OUTFLOWS)Cash flows from operating activities Sales from trading portfolio 20,322 12,988Purchases for trading portfolio (692) (3,513)Interest received 2,988 2,091Proceeds from entering into options in options written portfolio
26,975 13,533
Payment to close out options in options written portfolio
(14,333) (2,559)
Dividends and distributions received 29,885 27,140 65,145 49,680 Other receipts - 26Administration expenses (3,490) (3,408)Finance costs paid (6,531) (7,002)Income taxes paid (1,588) (1,075)Net cash inflow/(outflow) from operating activities 26 53,536 38,221
Cash flows from investing activities Sales from investment portfolio 353,029 33,281Purchases for investment portfolio (273,182) (41,586)Tax paid on capital gains - (3,521)Net cash inflow/(outflow) from investing activities 79,847 (11,826)
Cash flows from financing activities Proceeds from borrowings 20,000 25,500Repayment of borrowings (45,000) (25,500)Share issue transaction costs (13) (24)Share buy-backs - -Dividends paid (51,154) (47,114)Net cash inflow/(outflow) from financing activities (76,167) (47,138)
Net increase/(decrease) in cash held 57,216 (20,743)Cash at the beginning of the year 34,170 54,913Cash at the end of the year 6 91,386 34,170
This Cash Flow Statement should be read in conjunction with the accompanying notes.
16
For
per
sona
l use
onl
y

NOTES TO THE FINANCIAL STATEMENTS
1. Summary of significant accounting policies
This general purpose financial report has been prepared in accordance with Australian Accounting Standards, interpretations issued by the Australian Accounting Standards Board and the Corporations Act 2001. This financial report has been authorised for issue as per the Directors Declaration and is presented in the Australian currency. The Company has the power to amend and reissue the financial report.
The Company has attempted to improve the transparency of its reporting by adopting ‘plain English’ where possible. Key ‘plain English’ phrases and their equivalent AASB terminology are as follows:
Phrase AASB Terminology
Market Value Fair Value for Actively Traded Securities
Cash Cash & Cash Equivalents
Share Capital Contributed Equity
Hybrids Equity instruments that are not ordinary securities
Options Derivatives written over equity instruments that are valued at fair value through Profit & Loss
Australian Accounting Standards include Australian equivalents to International Financial Reporting Standards (“AIFRS”). Compliance with AIFRS ensures that the financial statements and notes of the Company comply with International Financial Reporting Standards (IFRS). The Company is a ‘for profit’ entity. The Company has not applied any Australian Accounting Standards or AASB interpretations that have been issued as at balance date but are not yet operative for the year ended 30 June 2013. The impact of the inoperative standards has been assessed and the impact has been identified as not being material. The Company only intends to adopt inoperative standards at the date at which their adoption becomes mandatory.
a) Basis of accounting
The financial statements are prepared using the valuation methods described below for holdings of securities, including options. All other items have been treated in accordance with the historical cost convention.
b) Associate Accounting Policy
Associates are entities over which the Company has significant influence but not control, generally accompanied by a shareholding of between 20% and 50% of the voting rights. Investments in associates are accounted for using the equity method of accounting, after initially being recognised at cost, in the Company’s financial statements.
The Company has one Associate – Australian Investment Company Services (“AICS”) in which it has a 25% shareholding. AICS provides investment and administrative services to the Company and to other Listed Investment Companies, including its Parent, Australian Foundation Investment Company (“AFIC”) which holds the other 75%.
The Company’s share of its associate’s post-acquisition profits or losses is recognised in the Income Statement, and its share of post-acquisition movements in reserves is recognised in
17
For
per
sona
l use
onl
y

Net Income. The cumulative post-acquisition movements are adjusted against the carrying amount of the investment.
c) Holdings of securities
(i) Balance sheet classification
The Company has three discrete portfolios of securities : the investment portfolio, the options written portfolio and the trading portfolio. The purchase and the sale of securities are accounted for at the date of trade.
The investment portfolio relates to holdings of securities which the Directors intend to retain on a long-term basis.
The options written portfolio contains predominantly exchange traded options contracts that are entered into as described in Note 13.
The trading portfolio comprises securities held for short term trading purposes, including exchange traded options contracts that are entered into as described in Note 8.
Securities within the investment portfolio (with the exception of puttable instruments and convertible notes that are classified as debt) are classified as ‘financial assets measured at fair value through other comprehensive income’, and are designated as such upon initial recognition, whereas securities held within the trading portfolio are classified as ‘mandatorily measured at fair value through profit or loss in accordance with AASB 9’.
The designation of securities within the investment portfolio as ‘financial assets measured at fair value through other comprehensive income’ is consistent with the Directors’ view of these assets as being held for the long-term for both capital growth and for the provision to the Company of dividends and distribution income rather than to make a profit from the sale of such securities, which is the purpose of securities held within the trading portfolio. Puttable instruments and convertible notes classified as debt are required to be classified at “fair value through profit or loss” although the Directors also view these assets as being held for the long-term for both capital growth and for the provision to the Company of distribution income and their being managed as part of the investment portfolio.
(ii) Valuation of investment portfolio
Securities, including listed securities and hybrids, are initially brought to account at market value, which is the cost of acquisition, and are revalued to market values (or fair value using a variety of relevant methodologies if there is no active market) continuously. Increments and decrements on equity instruments are recognised as Other Comprehensive Income and taken to the Revaluation Reserve.
Gains and losses on puttable instruments and convertible notes that are classified as debt are recognised in profit or loss. However, they are subsequently transferred from Retained Earnings to the Revaluation Reserve.
Where disposal of an investment occurs any revaluation increment or decrement relating to it is transferred from the Revaluation Reserve to the Realisation Reserve. The amounts of such transfers are noted in the Statement of Changes in Equity, and are done primarily to isolate the realised gains out of which the Company can pay a ‘Listed Investment Company’ or ‘LIC’ gain as part of its dividend, which conveys certain taxation benefits to many of the Company’s shareholders.
(iii) Valuation of trading portfolio
Securities, including listed and unlisted shares and options, are initially brought to account at market value, which is the cost of acquisition, or proceeds in the case of options written, and are revalued to market values continuously.
18
For
per
sona
l use
onl
y

Increments and decrements on the value of securities in the trading portfolio are taken to Profit or Loss through the Income Statement.
(iv) Valuation of options written portfolio
Options written are initially brought to account at the amount received upfront for entering into the contract (the premium) and subsequently revalued to current market value.
(v) Income from holdings of securities
Distributions relating to listed securities are recognised as income when those securities are quoted in the market on an ex-distribution basis unless the dividend clearly represents a recovery of part of the cost of the investment, in which case the relevant portion is treated as proceeds from a sale. If the distributions are capital returns on ordinary shares the amount of the distribution is treated as an adjustment to the carrying value of the shares. The realised gain or loss on options written is not recognised until the option expires, is exercised or is closed out. All unrealised gains or losses which represent movements in the Market Value of the options are recognised through the Income Statement.
d) Taxation
The income tax expense or credit for the period is the tax payable on the current period’s taxable income adjusted by any unused tax losses and changes in deferred tax assets and liabilities attributable to temporary differences between the tax bases of assets and liabilities and their carrying amounts in the financial statements. Deferred tax assets and liabilities (excluding those related to the unrealised gains or losses in the investment portfolio) are offset as all current and deferred taxes relate to the Australian Taxation Office and can legally be settled on a net basis. Deferred taxes are recognised for the unrealised gain or loss on securities valued at fair value through the Income Statement – i.e. the trading portfolio, puttable instruments and convertible notes classified as debt and the options written portfolio. A deferred tax asset or liability has to be made for any taxes that could arise on disposal of securities in the investment portfolio, even though there is no intention to dispose of them. Where the Company disposes of such securities, tax is calculated according to the particular parcels allocated to the sale for tax purposes offset against any capital losses carried forward.
e) Cash flows
For the purpose of the cash flow statement, ‘cash’ includes cash, deposits held at call, investment grade promissory notes and discounted bills of exchange.
f) Fair value of financial assets and liabilities
The fair value of cash and cash equivalents, bank borrowings and non-interest bearing monetary financial assets and liabilities of the Company approximates their carrying value.
The fair value for assets that are actively traded on market is defined by AIFRS as ‘last bid price’.
g) Directors’ retirement allowances
The Company recognises as ‘amounts payable’ Directors’ retirement allowances that have been crystallised. No further amounts will be expensed as retirement allowances.
19
For
per
sona
l use
onl
y

h) Interest-rate swaps
The Company has hedged a proportion of its short term borrowings against changes in interest rates by entering into interest rate swap agreements. Interest-rate swaps are shown at ‘fair value’ on the Balance Sheet representing the cost of unwinding the swap. For that portion of the Company’s swap agreements that are effective hedges (which is 100%), the fair value of the unused portion of the swap agreement is recognised in equity. Otherwise the fair value is recognised in Net Profit. A portion of the accumulated amounts in equity are recycled in the income statement as the interest on the borrowings becomes due and payable and the hedge is used. The amount recognised is accounted for as finance costs during the period along with the interest on the borrowings. The net amount receivable or payable under interest rate swap agreements is also recognised at this time and is included in ‘other receivables’ or ‘other payables’ at each balance date.
i) Rounding of amounts
The Company is of the kind referred to in Class Order 98/0100, issued by the Australian Securities and Investments Commission, relating to the ‘rounding off’ of amounts in the financial report. Amounts in the financial report have been rounded off in accordance with that Class Order, to the nearest thousand dollars, or in certain cases, to the nearest dollar.
j) Split between Revenue and Capital in Other Comprehensive Income
‘Capital’ relates to realised or unrealised gains or losses (and the tax thereon) on securities within the Investment Portfolio and excludes income in the form of distributions and dividends which are recorded as ‘Revenue’. ‘Capital’ also includes movements in the fair value of the Company’s swap contracts. All other items, including expenses, are recorded as Net Operating Result, which is categorised under ‘Revenue’.
k) Segment Reporting
Operating segments are reported in a manner consistent with the internal reporting used by the chief operating decision-maker. The Board, through its sub-committees, has been identified as the chief operating decision-maker, as it is responsible for allocating resources and assessing performance of the operating segments.
2. Critical Accounting Estimates and Judgements
The preparation of financial reports in conformity with AIFRS requires the use of certain critical accounting estimates. This requires the Board and management to exercise their judgement in the process of applying the Company’s accounting policies.
The carrying amounts of certain assets and liabilities are often determined based on estimates and assumptions of future events. In accordance with AASB112 Income Taxes deferred tax liabilities have been recognised for Capital Gains Tax (CGT) on the unrealised gain in the Investment Portfolio at current tax rates.
As the Directors do not intend to dispose of the portfolio, this tax liability may not be crystallised at the amount disclosed in Note 14. In addition, the tax liability that arises on disposal of these securities may be impacted by changes in tax legislation relating to treatment of capital gains and the rate of taxation applicable to such gains at the time of disposal and the availability of future gains against which to set off the losses.
Apart from this, there are no key assumptions or sources of estimation uncertainty that have a risk of causing a material adjustment to the carrying amounts of certain assets and liabilities within the next annual reporting period.
20
For
per
sona
l use
onl
y

3. Financial Reporting by segments
(a) Description of segments The Board makes the strategic resource allocations for the Company. The Company has therefore determined the operating segments based on the reports reviewed by the Board, which are used to make strategic decisions. The Board is responsible for the Company’s entire portfolio of investments and considers the business to have a single operating segment. The Board’s asset allocation decisions are based on a single, integrated investment strategy, and the Company’s performance is evaluated on an overall basis. The Company invests in equity securities and other instruments to provide shareholders with attractive investment returns through access to a steady stream of fully franked dividends, option premiums and trading income and enhancement of capital invested. (b) Segment information provided to the Board The internal reporting provided to the Board for the Company’s assets, liabilities and performance is prepared on a consistent basis with the measurement and recognition principles of Australian Accounting Standards, except that net assets are reviewed both before and after the effects of capital gains tax on investments (as reported in the Company’s Net Tangible Asset announcements to the ASX).
The Board considers the Company’s operating result after tax to be a key measure of the Company’s performance. This amount excludes the impact of unrealised gains/losses on options and any gains or losses on the Company’s investment portfolio and reconciles to the Company’s profit before tax as follows:
2013
$’000 2012
$’000
Net Operating Result after income tax expense 35,071 37,907
Add back income tax expense 2,264 2,419
Net gains on puttable instruments and non-equity investments 4,279 9,356
Net losses on open options positions (566) (447)
Profit for the year before tax 41,048 49,235
In addition, the Investment Committee regularly reviews the net asset backing per share, as calculated in accordance with ASX listing rules, both before and after provision for deferred tax on the unrealised gains in the Company’s long-term investment portfolio. Deferred tax is calculated as set out in notes 1(d) and 2. The relevant amounts as at 30 June 2013 and 30 June 2012 were as follows:
21
For
per
sona
l use
onl
y

2013 2012Net tangible asset backing per share $ $
Before Tax 3.50 3.17
After Tax 3.46 3.18
(c) Other segment information Revenues from external parties are derived from the receipt of dividend, distribution and interest income, and income arising on the trading portfolio and realised income from the options portfolio. The Company is domiciled in Australia and all of the Company’s income is derived from Australian entities or entities that have a listing on the Australian Securities Exchange. The Company has a diversified portfolio of investments, with no investment comprising more than 10% of the Company’s income, including realised income from the options written portfolio (2012 : One investment - Westpac (11.9%)) 4. Operating result before income tax expense
2013 $’000
2012$’000
Dividends and distributions • securities held in investment portfolio 34,144 38,680• securities held in trading portfolio 397 1,632 34,541 40,312Interest income • income from cash investments 3,061 2,116 3,061 2,116Net gains/(losses) and write downs • net realised gains/(losses) from trading portfolio 1,649 (2,853)• realised gains on options written portfolio 7,147 11,287• unrealised losses from trading portfolio 869 (339)
9,665 8,095 Other income - 26
- 26
Income from operating activities 47,267 50,549
Finance costs (6,612) (6,964)
Administration fees paid to AICS (2,221) (2,180)
Share of net profit from Associate 166 153
Other administration expenses (1,265) (1,232)
Operating result before income tax expense 37,335 40,326
Further information relating to remuneration of auditors is set out in Note 25, Directors and Executives in Note 23.
22
For
per
sona
l use
onl
y

5. Tax expense
(a) Reconciliation of income tax expense to prima facie tax payable 2013
$’000 2012
$’000
Operating result before income tax expense 37,335 40,326Tax at the Australian tax rate of 30% (2012 – 30%) 11,200 12,098Tax offset for franked dividends (9,269) (9,961)Tax effect of sundry items not taxable in calculating taxable income
730 (89)
2,661 2,048(Over)/under provision in prior years (397) 371Income tax expense on operating result before net gains on investments
2,264 2,419
Net gains/(losses) on investments 3,713 8,909
Tax at the Australian tax rate of 30% (2012 – 30%) 1,114 2,673
Tax expense on net gains on investments 1,114 2,673
Total tax expense 3,378 5,092 (b) Tax expense composition Charge for tax payable relating to the current year 1,909 1,274Under (over) provision in prior years (397) 371Increase in tax – puttable instruments & non-equity investments 1,284 2,807Decrease in deferred tax assets – other 582 640 3,378 5,092(c) Amounts recognised directly through Other Comprehensive Income
Increase (decrease) in deferred tax liabilities relating to capital gains tax on the movement in unrealised gains or losses in the investment portfolio 34,138
(23,353) 34,138 (23,353)
23
For
per
sona
l use
onl
y

6. Current assets and liabilities – cash
2013 $’000
2012$’000
Cash at bank and in hand 14,386 170Fixed Term Deposits 77,000 34,000 91,386 34,170
Cash holdings yielded an average floating interest rate of 4.3% (2012: 5.5%).
(a) Credit risk exposure
All cash investments not held in a transactional account are invested in short-term deposits with Australia’s “Big 4” commercial banks or their wholly-owned subsidiaries, all rated ‘AA-’ by S&P.
(b) Standby arrangements and credit facilities
The Company was party to agreements under which Commonwealth Bank of Australia and Westpac Bank would extend cash advance facilities. $50 million of the facility with Commonwealth Bank is a 5 year facility (expires 30 June 2016). Another $50 million of the Commonwealth Bank facility is a 3 year facility (expires 30 October 2014). The remainder are twelve month facilities at different expiry dates.
2013 $’000
2012$’000
Commonwealth Bank of Australia –cash advance facility 125,000 130,000Amount drawn down at 30 June 70,000 75,000Undrawn facilities at 30 June 55,000 55,000
National Australia Bank- cash advance facility - 20,000Amount drawn down at 30 June - -Undrawn facilities at 30 June - 20,000
Westpac Bank- cash advance facility 25,000 25,000Amount drawn down at 30 June 5,000 25,000Undrawn facilities at 30 June 20,000 -
Total short-term loan facilities 150,000 175,000Total drawn down at 30 June 75,000 100,000Total undrawn facilities at 30 June 75,000 75,000
The above borrowings are unsecured. Repayment of facilities is done either through the use of cash received from distributions or the sale of securities, or by rolling existing facilities into new ones. Facilities are usually drawn down for no more than three months. The current debt facilities are as follows :
Facility Provider Amount Expiry Date Commonwealth Bank $15 million 31 December 2013 Westpac Bank $25 million 31 December 2013 Commonwealth Bank $10 million 30 June 2014 Commonwealth Bank $50 million 30 October 2014 Commonwealth Bank $50 million 30 June 2016
Total Facilities $150 million
24
For
per
sona
l use
onl
y

7. Current assets – receivables
2013 $’000
2012$’000
Dividends and distributions receivable 5,418 7,418Outstanding settlements – Investment & options written portfolio 4,244 19,790Outstanding settlements – Trading portfolio 1,118 2,727Other receivables/pre-payments 411 369 11,191 30,304
Receivables are non-interest bearing and unsecured. Outstanding settlements are on the terms operating in the securities industry, which usually require settlement within three days of the date of a transaction.
8. Current assets – trading portfolio
Listed securities at market value :
- shares and trust units 6,366 16,426- Options sold by the Company
• Calls - (21) 6,366 16,405
(a) Options sold
The Company enters into option contracts in the trading portfolio as part of its trading activities to generate profits on dealing in securities. Where the Company sells a call option it is obligated to deliver securities at an agreed price if the taker exercises the option. Whereas if the Company sells a put option it is obligated to buy the underlying shares at an agreed price if the taker exercises the option. Exchange Traded Options are valued using observable market data which is obtained from an independent third-party data provider.
As at balance date there were no call options outstanding held by the Company in its trading portfolio (2012 : $2.1 million potential exercise value). At 30 June 2012, all of these contracts were exchange-traded options and were entered into within the constraints and controls imposed by the Australian Securities Exchange. Dealing and administrative (including settlement) functions are separated. The total exposure position is determined daily. The Investment Committee meets regularly (normally weekly) to consider, review and approve the investment, trading and sub-underwriting transactions of the Company and related matters.
9. Non-current assets – investment portfolio
2013 $’000
2012$’000
Equity instruments - shares/trust and stapled securities market value 764,169 685,985- unlisted securities at fair value 48 50Puttable instruments and convertible notes classified as debt 2,626 28,779
766,843 714,814 For a detailed list of the fair value of the securities in the investment portfolio measured at fair value through Other Comprehensive Income, see Note 28.
25
For
per
sona
l use
onl
y

10. Deferred tax assets & liabilities
The Company’s net deferred tax assets/(liabilities) arise from temporary differences in the recognition of items for taxation and accounting purposes, as described in Note 1 d). The key components are:
2013 $’000
2012$’000
(a) Trading portfolio (198) 59(b) Tax on unrealised (gains)/losses in the options written
portfolio (281)
(452)(c) Provisions and expenses charged to the accounting profit
which are not yet tax deductible 198
205(d) Interest and dividend income receivable which is not
assessable for tax until receipt (54)
(40)
(e) Capital Gains losses incurred carried forward - 475
(335) 247
Movements: Opening asset balance at 1 July 247 412Credited/(charged) to Income Statement (582) (640)Credited/(charged) through OCI - 475
(335) 247
Any deferred tax asset arising from provisions and expenses charged but not yet tax deductible will be obtained when the relevant items become tax deductible, provided that the Company derives sufficient assessable income to enable the benefit from the deductions to be taken in that year and there are no intervening changes in tax legislation adversely affecting the Company’s ability to claim the tax deduction.
The portion of deferred tax liability likely to be reversed within the next 12 months is $533,000 (2012: $42,000 asset). This relates primarily to items described in items (a), (b), (d) and (e) above. 11. Current liabilities – payables
2013 $’000
2012$’000
Outstanding settlements – Investment portfolio - 998Directors’ retirement benefits 661 661Other payables 294 279
955 1,938 Payables are non-interest bearing and unsecured. Outstanding settlements are on the terms operating in the securities industry, which usually require settlement within three days of the date of a transaction.
26
For
per
sona
l use
onl
y

12. Interest-rate swaps
2013 $’000
2012$’000
Opening Balance at 1 July (3,326) (493)
Movement for year (net of tax) 959 (2,833)
Fair value of interest-rate swap agreements (2,367) (3,326) The Company has entered into two interest-rate hedging contracts at a rate of 5.520% and 3.3225% with the Commonwealth Bank of Australia and Westpac, under which the Company will pay a fixed interest rate on $75 million worth of short-term borrowings which have a floating interest rate. These have been designated as effective hedges and any movements in their fair value will be shown as an adjustment against equity. These swaps commenced in March 2011 and February 2013. Both have five-year effective lives. The reserve and the corresponding asset/liability are measured as the fair value of the interest-rate swaps net of associated tax. It is currently anticipated that the swaps will be held to maturity and consequently that they will have no impact, under current Accounting Standards, on the Income Statement. 13. Options written portfolio
The Company enters into option contracts in the options written portfolio for the purpose of enhancing returns via the premiums that it earns from the writing of these contracts. It is separate from both the trading portfolio and the investment portfolio, and the options are held as “liabilities measured at fair value through profit or loss”. Where the Company sells a call option it is obligated to deliver securities at an agreed price if the taker exercises the option. Whereas if the Company sells a put option it is obligated to buy the underlying shares at an agreed price if the taker exercises the option. Exchange Traded Options are valued using observable market data which is obtained via an independent third-party data provider.
As at balance date there were put options outstanding which potentially required the Company if they were exercised to purchase $9.6 million of securities (2012 : None). At balance date there were call options outstanding which potentially required the Company if they were exercised to deliver securities to the value of $260.6 million (2012: $164.2 million). The total income for the year of $7.1 million (2012 : $11.3 million) plus the unrealised loss on the open options position of $0.6 million (2012 : $0.4 million), both before tax, resulted in a net pre-tax ‘profit’ of $6.6 million (2012 : $10.8 million).
As at balance date these contracts were predominantly exchange-traded options and were entered into within the constraints and controls imposed by the Australian Securities Exchange Limited. Dealing and administrative (including settlement) functions are separated. The total exposure position is determined daily. The Investment Committee meets regularly (normally weekly) to consider, review and approve the option transactions of the Company and related matters. $110.3 million of shares are lodged with ASX Clear Pty Ltd as collateral for sold option positions written by the Company (2012: $84.8 million). These shares are lodged with ASX Clear under the terms of ASX Clear Pty Ltd which require participants in the Exchange Traded Option market to lodge collateral, and are recorded as part of the Company’s investment portfolio.
27
For
per
sona
l use
onl
y

14. Deferred tax – investment portfolio
2013 $’000
2012$’000
Deferred tax assets/(liabilities) on unrealised gains in the investment portfolio (8,287)
2,375
Refer Note 2 for further detail on the nature of the deferred tax assets and liabilities on the investment portfolio.
Opening balance at 1 July 2,375 (17,696) Charged to income statement for tax on fair value movement of puttable instruments & non-equity investments (1,284)
(2,807)
Tax on Realised Gains or Losses 24,760 (475)Credited/(charged) to OCI for ordinary securities (34,138) 23,353Closing balance at 30 June (8,287) 2,375
15. Shareholders’ equity – share capital
Movements in share capital of the Company during the past two years were as follows:
Date Details Notes Number of shares
’000
Issue price
$
Paid-upCapital
$’0001/07/2011 Balance 214,590 619,986
24/08/2011 Dividend Reinvestment Plan i 1,561 3.47 5,417 17/02/2012 Dividend Reinvestment Plan i 952 3.59 3,418
Various Costs of issue - (24)
30/06/2012 Balance 217,103 628,797 24/08/2012 Dividend Reinvestment Plan i 1,487 3.66 5,441
Various Costs of issue - (13)
30/06/2013 Balance 218,590 634,225
i. The Company has a Dividend Reinvestment Plan (DRP) under which shareholders elect to have all or part of their dividend payment reinvested in new ordinary shares. Pricing of the new DRP shares was based on the average selling price of shares traded on the Australian Securities Exchange in the five days after the shares begin trading on an ex-dividend basis. The DRP is currently suspended.
ii. The Company introduced an on-market Buy-Back Program in December 2000. During the 2013 financial year the Company bought back no shares (2012: Nil). The facility remains open.
16. Capital Management
The Company’s objectives in managing capital is to continue to provide shareholders with attractive investment returns through access to a steady stream of fully-franked dividends and enhancement of capital invested, with goals of paying an enhanced level of dividends and providing attractive total returns over the medium to long term.
The Company recognises that its capital will fluctuate in accordance with market conditions, and may adjust the amount of dividends paid, issue new shares from time to time or buy-back its own shares or sell assets to reduce debt.
28
For
per
sona
l use
onl
y

The Company’s capital consists of its shareholders equity less the fair value of the interest-rate swaps, plus any net borrowings. The change in this capital is as noted in notes 6 b), 15, 17, 18 and 19.
17. Revaluation Reserve
2013 $’000
2012$’000
Opening balance at 1 July (17,359)
20,153Gains/(losses) on investment portfolio – equity instruments 111,854
(79,522)
– puttable instruments & non-equity investments (transferred from retained earnings )
4,279 9,356
Transfer of taxation charge previously accounted for on scrip-for-scrip takeovers
(728) -
Provision for tax on unrealised gains (35,422) 20,546Cumulative taxable realised (gains)/losses (net of tax) (8,968) 12,108
53,656 (17,359) This reserve is used to record increments and decrements on the revaluation of the investment portfolio as described in accounting policy note 1 c)(ii). 18. Realised Capital Gains Reserve
2013 $’000
2012 $’000
Taxable realised
gains (net of tax
Difference between tax
and accounting
costs Total
Taxable realised
gains (net of tax
Difference between tax
and accounting
costs TotalOpening balance at 1 July
1,874 17,385 19,259 15,857 28,385 44,242
Dividends paid - - - (12,875) - (12,875)Cumulative taxable realised (losses)/gains for period
81,673 (47,945) 33,728 (1,583) (11,000) (12,583)
Tax on realised gains/(losses)
(24,760) - (24,760) 475 - 475
58,787 (30,560) 28,227 1,874 17,385 19,259
This reserve records gains or losses after applicable taxation arising from disposal of securities in the investment portfolio as described in accounting policy note 1 c)(ii). The difference between tax and accounting costs is a result of realised gains or losses being accounted for on an average cost basis, whilst taxable gains or losses are made based on the specific cost of the actual stock sold – i.e. on a parcel selection basis.
29
For
per
sona
l use
onl
y

19. Retained Profits
2013 $’000
2012$’000
Opening balance at 1 July 63,628 69,108Dividends paid (56,595) (43,074)Statutory Profit for the year 37,670 44,143Transfer from revaluation reserve re. charge for previous scrip-for-scrip takeovers 728
-
Transfer to revaluation reserve (net of tax) (2,995) (6,549)
42,436 63,628
This reserve relates to past profits. 20. Financial Instruments
(a) Financial Risk Management
Accounting Standards identify three types of risk associated with financial instruments (i.e. the Company’s investments, receivables, payables and borrowings): Credit risk
The standard defines this as the risk that one party to a financial instrument will cause a financial loss for the other party by failing to discharge an obligation. Credit risk is managed as set out below with respect to cash, receivables, securities in the trading portfolio and securities in the investment portfolio respectively. None of these assets are over-due. Cash & Cash Equivalents
All cash investments not held in a transactional account are invested in short-term deposits with Australia’s “Big 4” commercial banks or their wholly-owned subsidiaries. The credit risk exposure of the Company in relation to cash and deposits is the carrying amount and any accrued unpaid interest.
Receivables Receivables are non-interest bearing and unsecured. Outstanding settlements are on the terms operating in the securities industry, which usually require settlement within three days of the date of a transaction.
The credit risk exposure of the Company in relation to receivables is the carrying amount.
Trading & Investment Portfolios
Credit risk exposures of the Company arise in relation to converting and convertible notes and other interest-bearing securities that are not equity securities to the extent of their carrying values, in the event of a shortfall on winding-up of the issuing companies.
Credit risk exposure also arises in relation to options bought by the Company, if any, to the extent of their carrying value.
Liquidity risk
The standard defines this as the risk that an entity will encounter difficulty in meeting obligations associated with financial liabilities.
30
For
per
sona
l use
onl
y

The Company monitors its cash-flow requirements daily. Furthermore, the Investment Committee monitors the level of contingent payments on a (normally) weekly basis by reference to known sales and purchases of securities, dividends and distributions to be paid or received, put options that may require the Company to purchase securities and facilities that need to be repaid. The Company ensures that it has either cash or access to short-term borrowing facilities sufficient to meet these contingent payments. The level of gearing that the Company has ensures that covenant levels associated with facilities are unlikely to be breached. In the unlikely event that a fall in the value of the stock market is such that a breach would appear possible, the Company would amend its cash-flows through the sale of securities and the cessation of purchases to ensure that any short-term debt is extinguished. The Company’s inward operating cash-flows depend upon the level of distributions received. Should these drop by a material amount, the Company would amend its outward cash-flows accordingly. As the Company’s major cash outflows are the purchase of securities and dividends paid to shareholders, the level of both of these is manageable by the Board and management. Furthermore, the assets of the Company are largely in the form of readily tradeable securities which can be sold on-market if necessary. The current financial liabilities are shown in Notes 6 b) & 11. The table below analyses the Company’s financial liabilities into relevant maturity groupings. The amounts disclosed in the table are the contractual undiscounted cash flows. Balances due within 12 months equal their carrying amounts as the impact of discounting is not significant.
30 June 2013 Less than 6 months
6-12 months
Greater than 1
year
Total contractual cash flows
Carrying Amount
(assets) / liabilities
$’000 $’000 $’000 $’000 $’000 Non-derivatives Payables 955 - - 955 955Borrowings 75,000 - - 75,000 75,000 75,955 - - 75,955 75,955 Derivatives Options written * 9,585 - - 9,585 8,240Interest rate swaps 742 742 2,784 4,268 2,367 10,327 742 2,784 13,853 10,607 30 June 2012
$’000 $’000 $’000 $’000 $’000 Non-derivatives Payables 1,938 - - 1,938 1,938Borrowings 100,000 - - 100,000 100,000 101,938 - - 101,938 101,938
31
For
per
sona
l use
onl
y

Less than 6 months
6-12 months
Greater than 1
year
Total contractual cash flows
Carrying Amount
(assets) / liabilities
$’000 $’000 $’000 $’000 $’000Options written * - - - - 2,179Interest rate swaps 928 739 1,667 3,334 3,326 928 739 1,667 3,334 5,505 * In the case of call options written there are no contractual cash flows, as if the option is exercised the contract will be settled in the securities over which the option is written. The contractual cash flows for put options written are the cash sums the Company will pay to acquire securities over which the options have been written, and it is assumed for purpose of the above disclosure that all options will be exercised (i.e. maximum cash outflow). Market risk
The standard defines this as the risk that the fair value or future cash flows of a financial instrument will fluctuate because of changes in market prices. By its nature as a Listed Investment Company that invests in tradeable securities, the Company can never be free of market risk as it invests its capital in securities which are not risk free – the market price of these securities will fluctuate. A general fall in market prices of 5% and 10%, if spread equally over all assets in the investment portfolio would lead to a reduction in the Company’s other comprehensive income of $26.7 million and $53.5 million respectively, at a tax rate of 30% (2012 : $24.0 million & $48.0 million) and a reduction in profit after tax of $92,000 and $184,000 respectively, at a tax rate of 30% (2012 : $1.0 million and $2.0 million respectively). A market fall of 5% and 10% across the Trading Portfolio & Options Written Portfolio would lead to an increase in profit after-tax of $66,000 and $131,000 respectively (2012 : $0.5 million and $1.0 million reduction). The Revaluation Reserve at 30 June 2013 was $53.7 million (2012 : $17.4 million deficit). It would require a fall in the value of the Investment Portfolio of 10% after tax to fully deplete this. The Company seeks to reduce market risk at the investment portfolio level by ensuring that it is not, in the opinion of the Investment Committee, overly exposed to one company or one particular sector of the market. The relative weightings of the individual securities and the relevant market sectors are reviewed by the Investment Committee, normally weekly, and risk can be managed by reducing exposure where necessary. The Company does not have set parameters as to a minimum or maximum amount of the portfolio that can be invested in a single company or sector. The Company’s investment by sector is as below:
2013 2012
Energy 13.25% 12.51%Materials 17.84% 17.49%Industrials 7.37%5 6.93%Consumer Staples 6.14% 6.09%Banks 21.96% 30.56%Other Financials (incl Property Trusts) 10.95% 9.91%Telecommunications 6.06% 6.41%
32
For
per
sona
l use
onl
y

2013 2012
Other - Health Care, Info Technology, Utilities 5.76% 5.62%Cash 10.67% 4.48%
Securities representing over 5% of the combined investment and trading portfolio (including options) at 30 June were : 2013
BHP Billiton 10.3%Commonwealth Bank 6.8%Telstra 6.8%National Australia Bank 6.4%Westpac 5.7%ANZ Bank 5.7%
2012BHP Billiton 10.3%Westpac 9.3%Commonwealth Bank 8.9%ANZ Bank 7.0%National Australia Bank 6.8%Telstra 6.7%
No other security represents over 5% of the Company’s investment and trading portfolios. Interest Rate risk The Company is not currently materially exposed to interest rate risk as all its cash investments and borrowings are short-term for a fixed interest rate and it has entered into interest-rate hedging contracts with the Commonwealth Bank of Australia and Westpac Bank, under which the Company will pay a fixed interest rate on $75 million worth of short-term borrowings, which commenced in March 2011 & February 2013. This locks in a longer-term fixed rate for a substantial proportion of the Company’s debt. Should interest-rates move to the extent that the Board feel that the swaps are uneconomical, they will be unwound and the cost of unwinding them would be reflected through the Income Statement. Interest rate risk on any hybrid securities held by the Company is reflected in their market value. The hedges were fully effective for the year. The Company is also not directly exposed to currency risk as all its investments are quoted in Australian dollars. The writing of call options provides some protection against a fall in market prices as it generates income to partially compensate for a fall in capital values. Options are only written against securities that are held in the trading or investment portfolio. Under Accounting Standards, movements in the market value of the trading portfolio are reflected directly through the Income Statement. However, the trading portfolio is only a minor proportion of the Company’s investments. As at 30 June 2013, it was 0.7% of the total invested including cash (2012: 2.1%). This reduces the risk to the Company’s earnings of a short-term fall in the value of securities held in the trading portfolio. (b) Fair Value measurements The Company has adopted the amendment to AASB 7 Financial Instruments: Disclosures which requires disclosure of fair value measurements by level of the following fair value measurement hierarchy:
33
For
per
sona
l use
onl
y

(a) quoted prices (unadjusted) in active markets for identical assets or liabilities (level 1); (b) inputs other than quoted prices included within level 1 that are observable for the asset or
liability, either directly (as prices) or indirectly (derived from prices) (level 2); and (c) inputs for the asset or liabilities that are not based on observable market data (unobservable
inputs) (level 3). 30 June 2013 Level 1 Level 2 Level 3 Total $’000 $’000 $’000 $’000 Financial assets at fair value through other comprehensive income
Investment Portfolio (Equity) 764,169 48 - 764,217 Financial assets at fair value through profit or loss
Trading Portfolio 6,366 - - 6,366 Investment Portfolio (Puttables & convertible
notes classified as debt) 2,626 - - 2,626
Financial liabilities at fair value through profit or loss
Options written - (8,240) - (8,240) Derivatives used for hedging - (2,367) - (2,367)Total 773,161 (10,559) - 762,602 30 June 2012 Financial assets at fair value through other comprehensive income
Investment Portfolio (Equity) 685,985 50 - 686,035 Financial assets at fair value through profit or loss
Trading Portfolio 16,405 - - 16,405 Investment Portfolio (Puttables & convertible notes classified as debt)
28,779 - - 28,779
Financial liabilities at fair value through profit or loss
Options written - (2,179) - (2,179) Derivatives used for hedging - (3,326) - (3,326) Total 731,169 (5,455) - 725,714 The fair value of financial instruments traded in active markets is based on quoted market prices at the end of the reporting period. These instruments are included in level 1. The fair value of financial instruments that are not traded in an active market (e.g. over the counter derivatives) is determined using valuation techniques. The Company uses a variety of valuation
34
For
per
sona
l use
onl
y
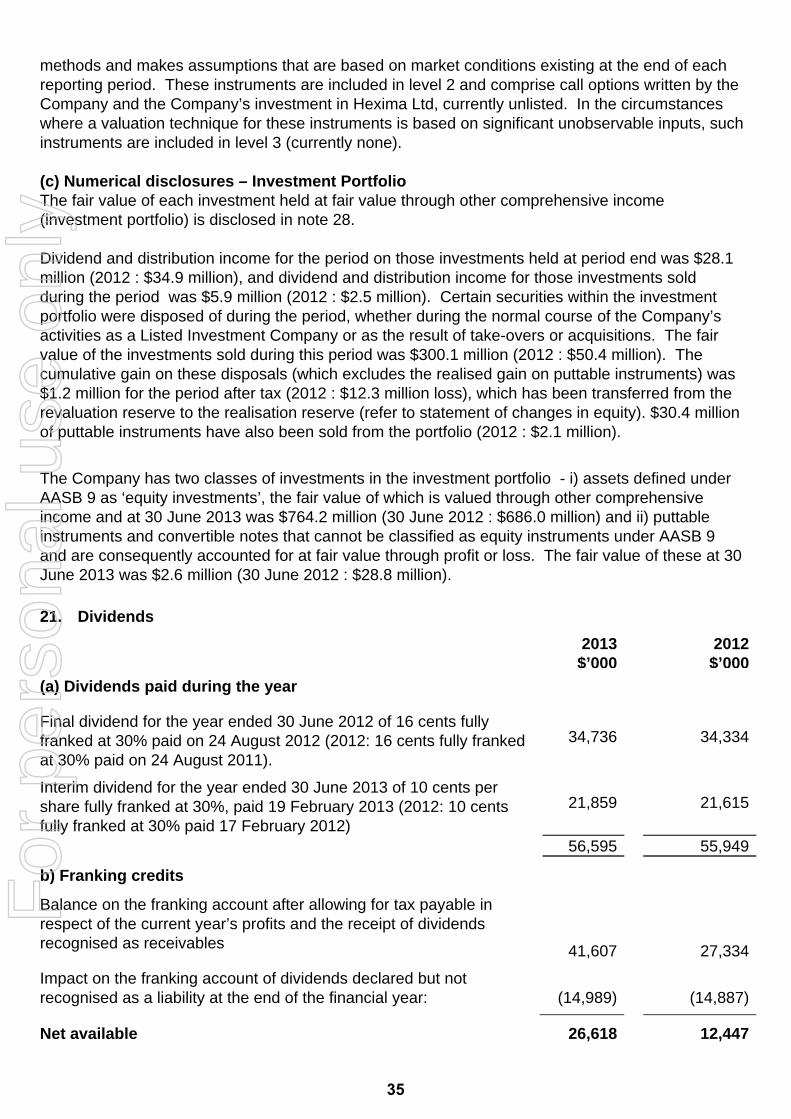
methods and makes assumptions that are based on market conditions existing at the end of each reporting period. These instruments are included in level 2 and comprise call options written by the Company and the Company’s investment in Hexima Ltd, currently unlisted. In the circumstances where a valuation technique for these instruments is based on significant unobservable inputs, such instruments are included in level 3 (currently none). (c) Numerical disclosures – Investment Portfolio The fair value of each investment held at fair value through other comprehensive income (investment portfolio) is disclosed in note 28. Dividend and distribution income for the period on those investments held at period end was $28.1 million (2012 : $34.9 million), and dividend and distribution income for those investments sold during the period was $5.9 million (2012 : $2.5 million). Certain securities within the investment portfolio were disposed of during the period, whether during the normal course of the Company’s activities as a Listed Investment Company or as the result of take-overs or acquisitions. The fair value of the investments sold during this period was $300.1 million (2012 : $50.4 million). The cumulative gain on these disposals (which excludes the realised gain on puttable instruments) was $1.2 million for the period after tax (2012 : $12.3 million loss), which has been transferred from the revaluation reserve to the realisation reserve (refer to statement of changes in equity). $30.4 million of puttable instruments have also been sold from the portfolio (2012 : $2.1 million).
The Company has two classes of investments in the investment portfolio - i) assets defined under AASB 9 as ‘equity investments’, the fair value of which is valued through other comprehensive income and at 30 June 2013 was $764.2 million (30 June 2012 : $686.0 million) and ii) puttable instruments and convertible notes that cannot be classified as equity instruments under AASB 9 and are consequently accounted for at fair value through profit or loss. The fair value of these at 30 June 2013 was $2.6 million (30 June 2012 : $28.8 million).
21. Dividends
2013 $’000
2012$’000
(a) Dividends paid during the year
Final dividend for the year ended 30 June 2012 of 16 cents fully franked at 30% paid on 24 August 2012 (2012: 16 cents fully franked at 30% paid on 24 August 2011).
34,736 34,334
Interim dividend for the year ended 30 June 2013 of 10 cents per share fully franked at 30%, paid 19 February 2013 (2012: 10 cents fully franked at 30% paid 17 February 2012)
21,859 21,615
56,595 55,949
b) Franking credits
Balance on the franking account after allowing for tax payable in respect of the current year’s profits and the receipt of dividends recognised as receivables 41,607 27,334
Impact on the franking account of dividends declared but not recognised as a liability at the end of the financial year: (14,989) (14,887)
Net available 26,618 12,447
35
For
per
sona
l use
onl
y

2013 $’000
2012$’000
These franking account balances would allow the Company to frank additional dividend payments up to an amount of: 62,109 29,043
The Company’s ability to continue to pay franked dividends is dependent upon the balance of the Company’s franking account. This is replenished by the receipt of franked dividends from the trading and investment portfolios and the Company paying tax on income and realised capital gains (if any).
(c) Dividends declared after balance date
Since the end of the year Directors have declared a final dividend of 16 cents per share fully franked at 30%. The aggregate amount of the final dividend for the year to 30 June 2013 to be paid on 23 August 2013, but not recognised as a liability at the end of the financial year 34,974
(d) Listed Investment Company capital gain account
Balance of the Listed Investment Company (LIC) capital gain account 56,311 1,874
This would equate to an attributable amount of 80,445 2,677
Distributed LIC capital gains may entitle certain shareholders to a special deduction in their taxation return, as set out in the dividend statement. LIC capital gains available for distribution are dependent upon the disposal of investment portfolio holdings which qualify for LIC capital gains or the receipt of LIC distributions from LIC securities held in the portfolios. 22. Earnings per share
Basic Earnings per Share 2013 2012 Number NumberWeighted average number of ordinary shares used as the denominator 218,365,695 216,264,907
$’000 $’000
Profit for the year 37,670 44,143
Cents Cents
Basic earnings per share 17.25 20.41
Basic net operating result per Share
$’000 $’000
Net operating result 35,071 37,907
Cents Cents
Basic net operating result per share 16.06 17.53
36
For
per
sona
l use
onl
y

23. Directors and Executives
The Remuneration for the Directors was as follows :
Short Term Benefits $
Post-Employment
Benefits $
Total $
2013 Directors 599,427 58,351 657,778 2012 Directors 579,750 95,250 675,000
Shareholdings : At balance date, shares issued by the Company and held directly, indirectly or beneficially by non-executive directors and executives of the Company, or by entities to which they were related were:
2013
Opening
balanceNet changes Closing balance
BB Teele 1,957,019 (101,219) 1,855,800RE Barker 365,200 6,295 371,495PC Barnett 40,000 - 40,000TA Campbell 466,201 20,381 486,582GB Goldsmith n/a 20,000 20,000AF Guy 211,217 9,233 220,450GJ Kraehe 36,909 1,614 38,523J Paterson 234,076 10,234 244,310AJM Williams 8,531 373 8,904GN Driver 20,000 1,635 21,635RM Freeman 41,065 - 41,065SM Pordage - 1,168 1,168AJB Porter - 2,017 2,017 2012 BB Teele 1,820,061 136,958 1,957,019RE Barker 363,705 1,495 365,200PC Barnett 40,000 - 40,000TA Campbell 433,576 32,625 466,201AF Guy 196,436 14,781 211,217GJ Kraehe 35,910 999 36,909J Paterson 217,696 16,380 234,076AJM Williams 7,361 1,170 8,531GN Driver 18,000 2,000 20,000RM Freeman 41,065 - 41,065
37
For
per
sona
l use
onl
y

24. Related parties
All transactions with deemed related parties were made on normal commercial terms and conditions and approved by independent Directors. 2013
$’000 2012$’000
The Company has paid administrative fees to its associated entity, AICS, in which it has a 25% shareholding
Administration expenses paid during the year
2,221 2,180
25. Remuneration of auditors
2013 $
2012$
During the year the auditor earned the following remuneration: PricewaterhouseCoopers Audit or review of financial reports 104,863 102,300 Non-Audit Services Taxation compliance services 40,535 26,950
Total remuneration 145,398 129,250 The Company's Audit Committee oversees the relationship with the Company’s External Auditors. The Audit Committee reviews the scope of the audit and the proposed fee. It also reviews the cost and scope of other audit related tax compliance services provided by the audit firm to ensure they do not compromise independence. Other non-audit services would not normally be provided by the external audit firm. However, if for special reasons such services were to be proposed, the Audit Committee would review the proposal to also ensure they did not affect the independence of the external audit function. The Company also conforms to legal requirements regarding audit partner rotation every 5 years.
38
For
per
sona
l use
onl
y

26. Reconciliation of net cash flows from operating activities to profit
2013
$’000
2012
$’000
Profit for the year 37,670 44,143- Fair value movement in puttable instruments (2,995) (6,549)- Net (increase)/decrease in trading portfolio 10,039 6,912- Net profit from Associate (113) (105)- Increase/(decrease) in options written portfolio 6,061 135- Dividends received as securities under DRP
investments (1,195) (4,893)
- Decrease/(Increase) in current receivables 19,113 (21,154)- Less increase/(decrease) in receivables for
investment portfolio (15,546) 19,790
- (Decrease)/increase in deferred tax liabilities 11,244 (19,906) - Less decrease/(increase) in deferred tax liability on investment portfolio
(10,662) 20,071
- Increase/(decrease) in current payables (983) (227)- Less (increase)/decrease in payables for
investment portfolio 998 (998)
- Increase/(decrease) in provision for tax payable 24,665 (2,994) - Add taxes paid on capital gains - 3,521 - Add/(Less) capital gains tax through OCI (24,760) 475Net cash flows from operating activities 53,536 38,221
27. Contingencies
At balance date Directors are not aware of any other material contingent liabilities or contingent assets other than those already disclosed elsewhere in the financial report.
39
For
per
sona
l use
onl
y

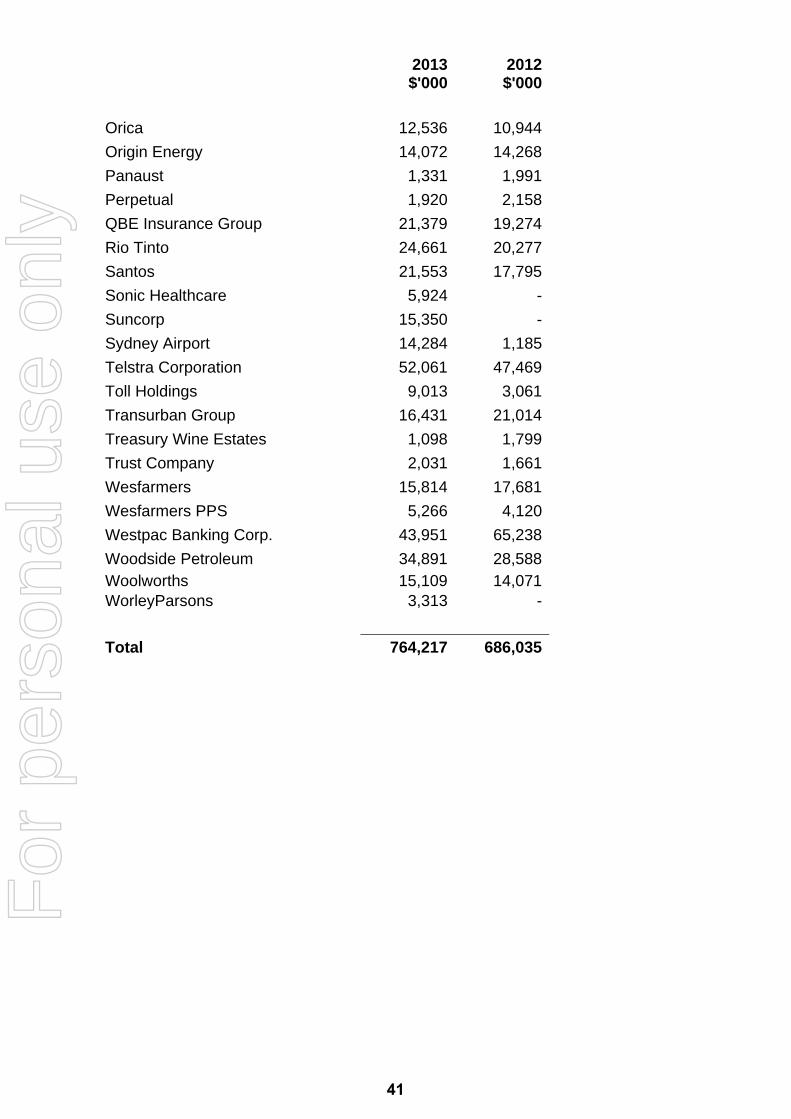
28. Securities at Fair Value through other Comprehensive Income at 30 June 2013
The below list are those of securities held in the investment portfolio that are valued at fair value through Other Comprehensive Income. They do not include securities in the trading portfolio, puttable instruments or convertible notes classified as debt in the investment portfolio (which are held at ‘fair value through profit or loss’) or the options written portfolio.
Individual holdings in the portfolio may change during the course of the year. In addition, holdings may be subject to call options or sale commitments by which they may be sold at a price significantly different from the market price prevailing at the time of the exercise or sale.
2013$'000
2012$'000
AGL Energy 13,630 8,450
Alumina 3,662 2,937
ALS 980 -
AMCIL 9,115 7,631
Amcor 12,367 12,086
AMP 20,175 22,977
ANZ Banking Group 43,958 48,622
APA Group 17,161 -
Australian Infrastructure Fund - 11,158
ASX 6,433 2,565
BHP Billiton 79,086 74,895
Boral 4,852 3,400
Brambles 24,380 16,726
Coca-Cola Amatil 15,502 8,992
Commonwealth Bank 53,266 65,152
Computershare 10,751 5,645
CSL - 2,484
Equity Trustees 1,006 729
Fletcher Building 4,427 -
Hexima 48 50
Iluka 4,096 1,472
Incitec Pivot 6,505 5,827
Insurance Australia Group 5,357 7,168
Mirrabooka Investments 10,849 8,356
National Australia Bank 49,282 46,193
Oil Search 35,341 29,926
40
For
per
sona
l use
onl
y
2013$'000
2012$'000
Orica 12,536 10,944
Origin Energy 14,072 14,268
Panaust 1,331 1,991
Perpetual 1,920 2,158
QBE Insurance Group 21,379 19,274
Rio Tinto 24,661 20,277
Santos 21,553 17,795
Sonic Healthcare 5,924 -
Suncorp 15,350 -
Sydney Airport 14,284 1,185
Telstra Corporation 52,061 47,469
Toll Holdings 9,013 3,061
Transurban Group 16,431 21,014
Treasury Wine Estates 1,098 1,799
Trust Company 2,031 1,661
Wesfarmers 15,814 17,681
Wesfarmers PPS 5,266 4,120
Westpac Banking Corp. 43,951 65,238
Woodside Petroleum 34,891 28,588Woolworths 15,109 14,071WorleyParsons 3,313 -
Total 764,217 686,035
41
For
per
sona
l use
onl
y

42
For
per
sona
l use
onl
y

43
For
per
sona
l use
onl
y