ASTROSAT&:&India’s&first&mul5wavelength& …archis/media/icts-nr/sreekumar.pdf · CZT-imager 10...
99
ASTROSAT : India’s first mul5wavelength astronomy satellite P. Sreekumar Indian Ins5tute of Astrophysics
Transcript of ASTROSAT&:&India’s&first&mul5wavelength& …archis/media/icts-nr/sreekumar.pdf · CZT-imager 10...

ASTROSAT&:&India’s&first&mul5wavelength&astronomy&satellite&
P.&Sreekumar&
Indian&Ins5tute&of&Astrophysics&

Looking&back&…&
• ISRO&satellite&program&is&nearly&40&yrs&old&– Space&science&experiments&have&been&part&of&satellites&star5ng&from&Aryabhata&
– Recent&experiments&• Solar&XJray&Spectrometer&(2003)&
• RTJ2&experiment&on&PhotonJCoronas&satellite&
• ChandrayaanJ1&

Upcoming near-term programs
ASTROSAT
multiwavelength mission (opt, UV, soft and hard X-ray)
Indo-UK collaboration on SXT Indo-Canadian collaboration on UVIT
launch 2014

The next step “a multwavelength observatory””
X-ray: 0.75 keV
X-ray: 0.25 keV
Gamma rays
Images courtesy HEASARC

• Plasma&blobs&ejec5on&(seen&in&VLA&images;&1&week&apart).&
• XJray&dips&when&inner&AD&disappears;&ejected&plasma&cloud&emits&in&IR.&20&min&later&it&expands;&becomes&transparent&to&radio&emission.&
Peak brightness appear at different times at different wavelengths
Radio images Mar 18 ‘94
Mar 27 ‘94
Apr 3 ‘94
Apr 9 ‘94
Apr 16 ‘94
10,000 AU
GRS1915+105)(Black)Hole)candidate)&
towards away

ASTROSAT : India’s first dedicated astronomy satellite
Planning started 1996 (after launch of IRS-P3) Project report submitted 2000 Project Director identified 2002 ��������� �������

The international scene
• UV – GALEX – FUSE - terminated
• X-ray – CXO – XMM-NEWTON – SWIFT – SUZAKU

Payloads on ASTROSAT

Parameters important for astronomy experiments
• Detection efficiency • Geometric area of detector • Spectral resolution • Angular resolution (2 arc sec to 1 deg)
• Sensitivity: faintest source that can be detected
– S/N ∝ geometric area 1 / background sqrt (integration time) field of view

ASTROSAT INSTRUMENTS
Large Area Xenon Proportional Counter
Scanning Sky Monitor (SSM)
UV Imaging Telescope
Soft X-ray telescope (SXT)
Cadmium Zinc Telluride Imager

Ultra-violet Imaging Telescope (UVIT)
(optical, NUV, FUV)

UVIT summary
• simultaneous large field ( ~ 30’) images in:
– FUV ( 130-180 nm ) – NUV ( 200- 300 nm ) – VIS ( 350-550 nm )
• resolution < 1.8” • sensitivity in FUV mag. 20 in 1000 s exp.

UVIT-Mechanical System

OPTICAL LAYOUT -- FUV CHANNEL

OPTICAL LAYOUT – NUV & VIS

Imaging area : ~ 40 mm φ#QE :> ~5% in band centre Pos. res. < 100 µm Exposure : 10-1000 mSec Frame rate : > 20 Hz Gain : 2000 – 20,000 e-/γ#Safety : electronic gating
Components in each Detector
High Voltage supplies
Fiber Optic Taper
(HVU)
Photocathode
MCP Front
Anode
Fibre Optic Taper
Static Drain
CCD
300 V (nom) and -50V, switched
1000V (max)
1700V (max)
5000V (nom)
MCP Intermediate
MCP Output
Output Window
Rear Gap
Front Gap
Input Window

!
! ! !GALEX!!!!! !!UVIT!
FoV!(Circular!dia)!!!!!! !1.24!degrees!!!!!! !!27!arc?min!
No.!of!bands!!!!!!!!!!!! ! !2!(NUV,!FUV)!!!!! !!2!channels!(NUV,!FUV)!+!Vis!
Filters!in!NUV!!!!!!!!!!!!!! !NIL!!!!!!!!!!!!!! !5!filters!
Filters!in!FUV!!!!!!!!!!!!!! !NIL!!!!!!!!!!!!!! !5!filters!
Spectroscopy!!!!! ! !Grism!!!!!!!!!!!! !!Grating!
Resolution!!!!!!!!!!!!! ! !R!~!100?120!!!!!! !!R!~!100!
No.!of!grism/grating!!!! !1!per!band!!!!!!! !!2!per!band!!
Angular!resolution!! !4.5?6.0!arcsec!!!! !!1.8!arc?sec!!(FWHM)!
Saturation!!!!!!!!!!!!!!! ! !<!10!mag!!!!!!!!!! !!<!8.0!mag!(neutral!density!filter) !
! ! ! ![can!image!fields!with!bright!objects]!
Time!resolution!!!!!!!! !~!10!milli?sec!!!!!! !!!~!5.0!milli?sec!(window!mode)!
! ! !!!!!!!!!!!!!!!!!!! !! !~!30!milli?sec!full!field!

Soft X-ray Telescope (UVIT)
(0.3 – 8 keV)

i
Soft X-ray telescope: Some challenges
grazing angle
Total Internal Reflection
δ = N e2/2*ε0 m (ω02-ω2)
N =electron density in medium ω0
= freq of local oscillators (electrons)
ω = freq of incident radiation
• Reflectivity = -------- is very small
• However, with n <1 reflection of x-rays can happen via total internal reflection above the critical angle θ.
• At x-ray wavelengths critical angle ≈ 90 degree. Typical grazing angle <0.5 deg)
Refractive index n is:
n = 1 + N e2/2*ε0 m (ω02-ω2) = 1 + δ
Below UV energies (ω < ω0) n >1 At X-ray energies (ω > ω0) n <1
(vacuum)
(metal)
Critical angle = √2*δ
(n - 1)2
(n + 1)2

Principle of X-ray focussing
Wolter-I
Parabola
Hyperbola
Double reflection needed to limit coma conical approx to Wolter-I geometry

X-ray Reflectivity
0.0 0.2 0.4 0.6 0.8 1.0 1.2 1.4 1.6 1.8 2.01E-6
1E-5
1E-4
1E-3
0.01
0.1
1 Expt data Using Cu Kα Radiation Fitted Data
Ref
lect
ivit
y (A
.U)
Grazing Angle (Deg)
Smoothness!of!!
8!–!10!Angstroms!

CONFIGURATION of SXT
Mirrors: Nested & Segmented conical surfaces in Wolter type I geometry working at Grazing incidence

Foil mirrors in mirror assembly

• Four Fe-55 calibration (corner) sources • One Fe 55 calibration door source • Optical Blocking Filter • CCD Assy. including TEC

CODED MASK IMAGING
• Beyond 10 - 50 keV focussing of X-rays is difficult
• Casts a
shadow pattern on the detector plane; combines good sensitivity and position resolution.
2-D mask
1-D mask

Coded-mask Imaging

Scanning Sky Monitor(SSM)
(2 – 10 keV)

Scanning Sky Monitor (SSM) Goals:
· to alert other experiments on ASTROSAT about x-ray transients
· to routinely monitor bright x-ray sources on the sky (many times a day)

View of the SSM detector

Rotating platform
SSM2 SSM3 or boom camera
Detector
Scanning Sky Monitor SSM)
Amplifiers Front end logic
SSM1
Rotation axis
3
2
1

SSM (one unit) with front-end electronics (CSPA units)
One SSM unit consists of:
1. Detector
2. Electronics
3. Coded Mask for Imaging
There are 3 such units mounted on a platform with rotation mechanism
Detector: Position Sensitive Proportional Counter
Electronics : CSPAs + FE + PE
Coded Mask: 1D

Pre-and-post vibration results (QM)
Total o/p of all the anodes pre (red points) and post vibration (green points)

Results of Imaging
The above are the contour and surface plots of the source plane image showing a single peak at the center of the FOV. This is from one of the FM detectors (now, FM spare)
FM

Major&scien5fic&inves5ga5ons&planned&• Correlated&intensity&varia5on&studies&across&visible,&UV,&soY&and&hard&
XJray&bands&to&address&the&origin&of&radia5on&
• Study&magne5c&fields&of&neutron&stars&(NS)&
• Search&for&black&hole&(BH)&sources&
&
• Probe&immediate&environments&of&BH&(including&supermassive&ones)&&&NS&
• Discover&new&XJray&sources&
• Probe&the&farthest®ions&of&the&UV&Universe&

Cadmium Zinc Telluride Imager (CZTI)
(10 – 100 keV)

CZT Imager on ASTROSAT - ve 600 volts
To Pre-amplifier
Incidental Photon
Hole current Electron current
16 X 16 CZT PIXEL ARRAY

CZT Detector 4 cm X 4 cm
CZT crystal
Connectors HV Connector
Thermal conductor
Thermal conductor
ASIC

CAM assem bly
C olimator)hs g.)as s embly
Calibration hsg. assem bly
Mother board assembly
Details of a Quadrant
Detector Box Assembly
Size - 484 x 484 x 600 mm Weight - 50 K gm Collimators - 6 x 6 Degree, 17 x 17 Degree Graded Shield Material – Tantalum + Aluminum (For Passive shielding)
Power- 50 Watts
Four Independent Quadrants of Detector

Assembled CZT-Imager (Qualification Model)
39&

Energy Resolution: • Proposal: 5%@ 60 keV (attempt for 3%)
• PDR: 5%@60 keV (tests ~7%)
• RT-2/Exe. Sum.: 5%@100 keV (~9%@60 keV)
• QM: 10 – 11%@60 keV; 6-7% @122 keV (room temperature) • 9.0+/-0.5 %@ 60 keV; 5+/-0.5% @122 keV (operating temp : 0 – 15 C)

Implications AGN: Faint Source
No Impact (~90% of obs)
Pulsars Critical observations
(Some Impact)

Large Area X-ray Proportional Counter
(LAXPC)
(3 – 80 keV)

LAXPC on ASTROSAT
• Large Area gas filled proportional counters • Multiwire, multi layer counter
Window
50 micron mylar
X-ray
Inert gas
Anode wire Charge cloud
Single anode chamber Multiple anode chamber
HV
O/P

R. K. Manchanda
The X-ray detection volume consists of 60 anode cells of 3.0 cm x 3.0 cm cross-section arranged in 5 layers and surrounded on 3 sides with veto layers
LAXPC : brief description
Weight 395 kg

R. K. Manchanda
LAXPC on ASTROSAT

Energy range
Description Angular resolution
sensitivity
SXT 0.3 – 8 keV
Focussing X-ray mirror + CCD (39 shells) FOV=42’
3 – 4 arcmin
~0.01milliCrab (10,000 sec)
LAXPC 3 – 80 keV
Large proportional counters (3)
~5arcmin (scan mode)
0.1 milliCrab (1000 sec)
CZT-imager
10 – 100 keV
CZT array (hard X-ray imager)
8 arcmin 0.5 milliCrab (1000 sec)
SSM 2 – 10 keV
All sky monitor (3) on a boom
5 – 10 arcmin
30 milliCrab (300 sec)
UVIT 1300 – 3000 Ang
Twin RC telescopes – 40 cm each (NUV, FUV)
1 arc sec 20 magnitude (1000 sec)
Payload specifications

ASTROSAT: specific capabilities
• Simultaneous multi-wavelength observations using single satellite covering optical, UV, low and high energy x-rays
• Highest angular resolution UV imager to date.

LAXPC UVIT
SXT
CZT
SSM

CZTI 4.6 deg
LAXPC 1 deg
Instrument FOVs
SXT
42’ UVIT 29 ‘
SSM
10 deg
90 deg

Angular resolution
SXT 3’
UVIT 1.8 “
12’ SSM
8’ CZTI
LAXPC
1 deg

UVIT filters

Effec5ve&area&of&UVIT&channels&
NUV FUV

Rotation axis

ASTROSAT&Mission&
! Al5tude&& &:&650&km&
! Inclina5on& &:&8°.&
! Mass& & &:&1500&kg.&(780&kg.&Payloads)&
! Power& & &:&940&waes&
! PSLV&launch&! Opera5onal&life&of&minimum&5&years&

Inertial pointing with nearly equatorial orbit
Earth occultation , SAA passage

• Platform!pointing!accuracy!
• Contamination!control!
• Re?orient!to!any!part!of!the!sky!• Soft?x?ray!telescope!mirror!fabrication!
• Boom?mounted!rotation!of!SSM!
• UVIT!optics,!structure,!calibration&• Total!ASTROSAT!science!data!management!
ASTROSAT&:&&challenges&

Science from ASTROSAT

Processes producing optical, UV and X-ray photons
• Black body radiation • Atomic transitions- Lines (Absorption/Emission) • Fluorescence • Bremsstrahlung • Synchrotron • Cyclotron features • Inverse Compton

ASTROSAT observational capabilities
• Timing – High resolution (ms to microsec) timing studies- long observations
• Temporal variability across bands – correlation / anti-correlation • Detection of new Accreting ms Binaries. • Quasi periodic oscillations • X-ray transient detection
• Imaging – High resolution imaging (~2 arc sec) in UV and moderate (few arcmin) imaging
in soft X-rays • emission nebulae and supernova remnants • Hot stars in nearby galaxies; UV Morphology of galaxies; • Deep surveys of specific regions down to 20th mag in UV (sp. bands)
• Spectral – Broadband spectral and timing studies
• Continuum emission from all classes of UV and X-ray sources. • Thermal and non-thermal emission; • Detection and profiles of Cyclotron Features

M51 seen in three bands
UVIT on ASTROSAT will produce the highest angular resolution images in UV. It has an angular resolution 3-4 times better than GALEX

Study of Star-formation rates & Galaxy Luminosity function
• SFR declines rapidly from about z~1 by nearly a factor of 5 (Madau et al 1996, Schiminovich et al 2005) – maybe linked with the strong decline in UV-luminous galaxies with time.
• SFR shifts from high stellar mass systems at high z to low stellar mass systems at low z (downsizing)
• Combined studies on clustering properties of UV-luminous galaxies using ASTROSAT & SDSS/2dFGRS data – can address spatial distribution of star formation in the Universe from high z to low z.(Heinis et al astroph 7Jun 2007)
• Study dependence of UV luminosity on other galaxy characteristics – Color – surface brightness – Environment – Metallicity – stellar mass
SFR (M• yr−1) = 1.4 × 10⁻²⁸ LFUV(ergs s−1 Hz−1) (Kennicutt 1998)

Galaxy luminosity function
observational determination of the galaxy UV luminosity function
– Number counts of galaxies in two bands (FUV and NUV)
provides unique, homogeneously calibrated values covering a very wide range in UV magnitude.
– GALEX data shows both the FUV and NUV counts are consistent with an evolution model (essentially luminosity evolution).
– Derive contribution to UV background (GALEX reports - 0.68 ± 0.10 nW m-2 sr-1 at 1530 Å and 0.99 ± 0.15 nW m-2 sr-1 at 2310 Å. )

UV emission X-rays
Study of Galactic binary systems
inner-edge of disk ~ 10 MK or larger " intense emission at X-rays outer-edge is cooler (10,000K) " emission peaks at UV energies
ASTROSAT has unique ability to simultaneously study these two emission
Centaurus X-3 – high mass XRB

Time profiles of emission from GRS1915+105 – IXAE data Paul et al

UV emission from outer disk
X-ray emission from inner disk
Study of Galactic binary systems :
inner-edge of disk ~ 10 MK or larger " intense emission at X-rays outer-edge is cooler (10,000K) " emission peaks at UV energies
ASTROSAT has unique ability to simultaneously study these two emission

Temporal data
• Intensity vs. time • Used to measure variability;
– Rotation period; – Pulse arrival times; – Binary periods; – Flares Outbursts
XTE J1946+271

X-rays produced in jet
UV produced in disk
ASTROSAT has unique ability to simultaneously study these two emission
Study of extragalactic systems: Active galactic nulei

PKS 2155-304
X-ray
Extreme UV
UV
The x-ray outburst is delayed by hours (EUV) to days (UV) at lower frequencies
Simultaneous multiwavelength coverage: Timing

Simultaneous&mul5wavelength&coverage:)))Broad:band)Spectral)studies)
3C279)
Synchrotron)
Inverse)Compton)
ASTROSAT)

Special observations
Very Long – duration observations – weeks on a target
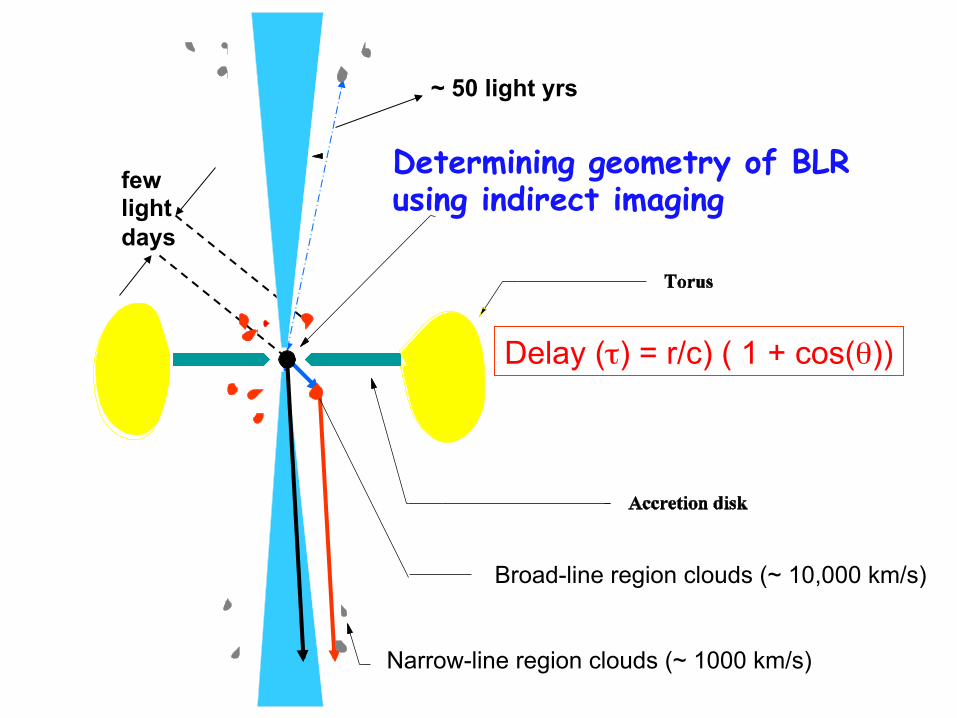
few light days
~ 50 light yrs
Broad-line region clouds (~ 10,000 km/s)
Narrow-line region clouds (~ 1000 km/s)
Determining geometry of BLR using indirect imaging
Delay (τ) = r/c) ( 1 + cos(θ))

Complementary data coming from current missions
• SWIFT – GRBs in FOV of ASTROSAT , simultaneous observations of hard X-ray sources
• AGILE / FERMI- SED of AGNs, Unidentified γ-sources
• GALEX – high-res survey of crowded fields
• How to maximise quality of data – Coordination of observations

ASTROSAT&Collaboration& 1. Tata Institute of Fundamental Research, Mumbai 2. Indian Institute of Astrophysics, Bangalore 3. Inter-University Centre for Astronomy &
Astrophysics, Pune. 4. Raman Research Institute, Bangalore 5. Various ISRO Centers 6. Physical Research Laboratory, Ahmedabad 7. Bhabha Atomic Research Centre, Mumbai 8. Canadian Space Agency, Canada 9. University of Leicester, U.K.

Data pipeline

Compiled by - Swarna K Ghosh
Inputs from : UVIT team, SAC-ISRO team, ISAC-ISRO team, ...
UVIT Data Analysis Pipeline UVIT Data Analysis Pipeline
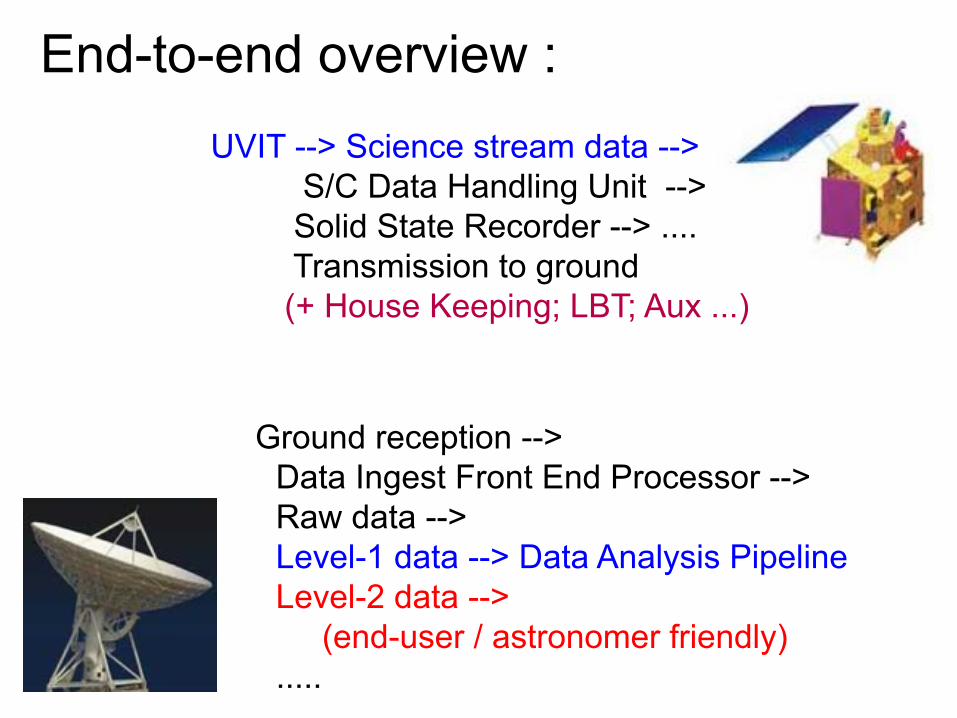
End-to-end overview : UVIT --> Science stream data --> S/C Data Handling Unit --> Solid State Recorder --> .... Transmission to ground (+ House Keeping; LBT; Aux ...)
Ground reception --> Data Ingest Front End Processor --> Raw data --> Level-1 data --> Data Analysis Pipeline Level-2 data --> (end-user / astronomer friendly) .....
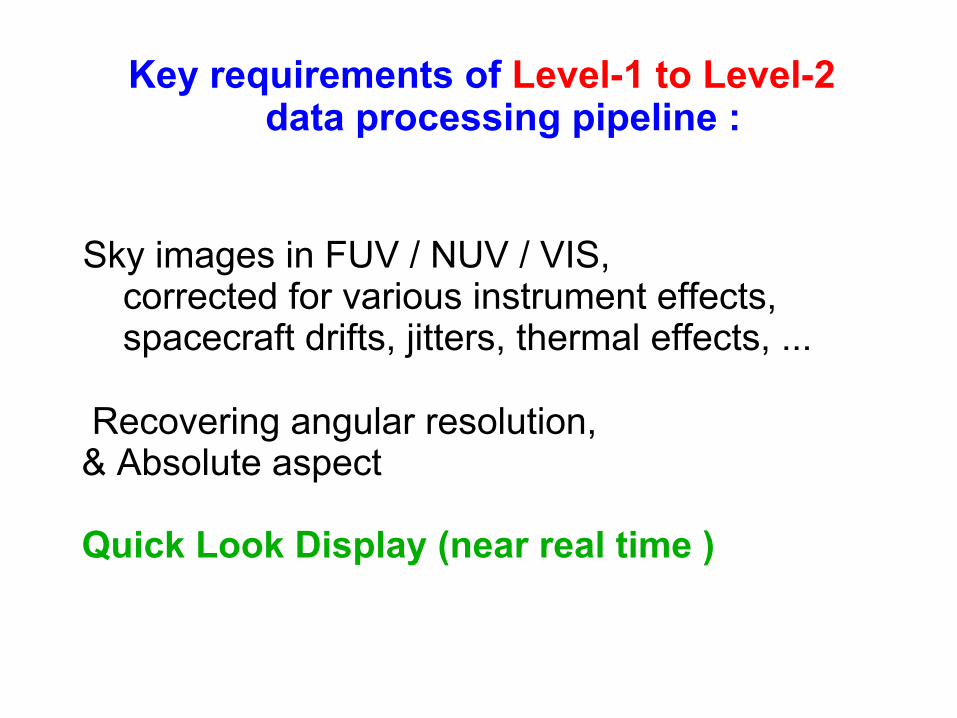
Key requirements of Level-1 to Level-2 data processing pipeline :
Sky images in FUV / NUV / VIS, corrected for various instrument effects, spacecraft drifts, jitters, thermal effects, ... Recovering angular resolution, & Absolute aspect Quick Look Display (near real time )

For Photon Counting (PC : FUV, NUV) & Integration (IM : VIS) Modes - reject affected data : drop-outs, parity error, cosmic rays, ... Instrumental effects corrected for : - response variation over FoV; bad pixels - temperature dependence of QE - temperature dependence of MCP gain (IM only) - distortion introduced by Detector assembly - distortion introduced by Optic assembly - systematic effects in extraction of photon location from event centroid (PC only) – dark, bias, - thermal effects on inter-channel mis-alignment;

Areas needing attention

Areas where new collaborators can get involved
• Instrument calibration – UVIT (excellent experience for students and researchers who plan to analyse
the data from UVIT)
• Calibration data " Instrument response – X-ray cal data
• Generation of response matrix, data analysis pipeline development – UVIT cal data
• Flat fields (with wavelength/filter) • QE and resolution with position/wavelength • Geometrical distortion • Noisy and dead areas • Dynamic range and non-linearity • All above with temperature range • Small window fast read; integrate mode

• Data interpretation – Some examples:
• SED of AGNs (eg: blazars) • Modeling transfer function to derive
source geometry
• Complementary observations – ground (optical / IR / radio / TeV) – space (correlated observations – IR/ X-
ray/ γ-ray)
Areas where new collaborators can get involved (contd)
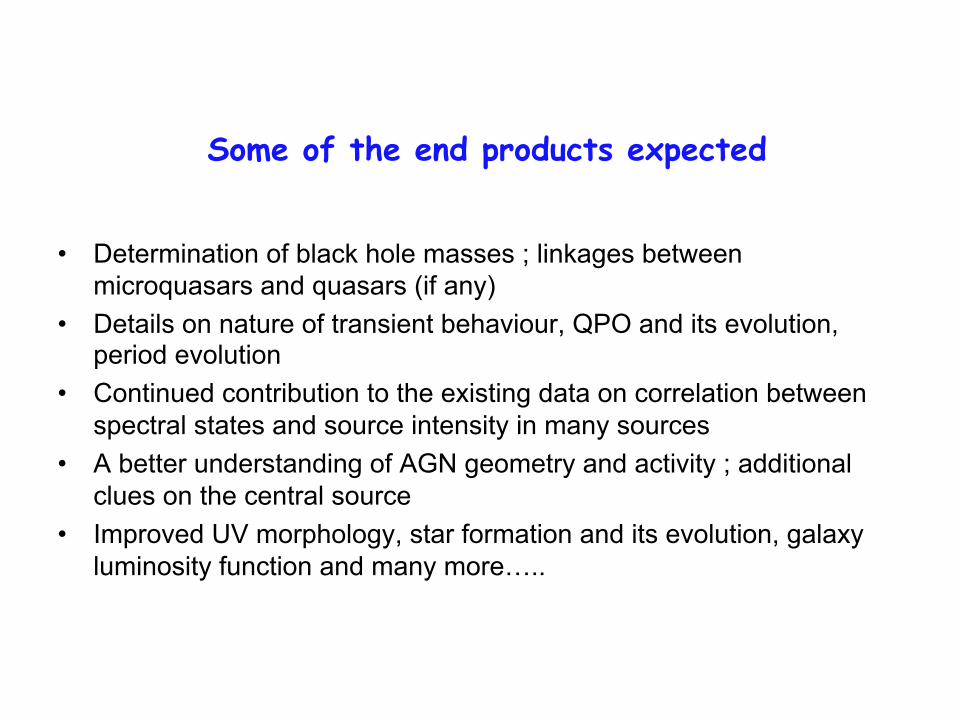
Some of the end products expected
• Determination of black hole masses ; linkages between microquasars and quasars (if any)
• Details on nature of transient behaviour, QPO and its evolution, period evolution
• Continued contribution to the existing data on correlation between spectral states and source intensity in many sources
• A better understanding of AGN geometry and activity ; additional clues on the central source
• Improved UV morphology, star formation and its evolution, galaxy luminosity function and many more…..

UVIT&–EM&–&single&telescope&

Actual FM units
FUV&telescope&&&&&&&&&&&&&&&&&&&&&&&&&&&&&&&&&&&&NUV/vis&telescope&

Scanning&Sky&Monitor& SoY&XJray&Telescope&

SXT&Engineering&and&Flight&Models&–&XJray&mirror&

Large&Area&XJrayJProp&Counter&&
Assembly&of&FOV&collimator&

Detector&FrontJEnd&Electronics&&
30JMayJ13& 88&

Second&LAXPC&Flight&Detector&being&shipped&to&ISAC.&Jan&2013&
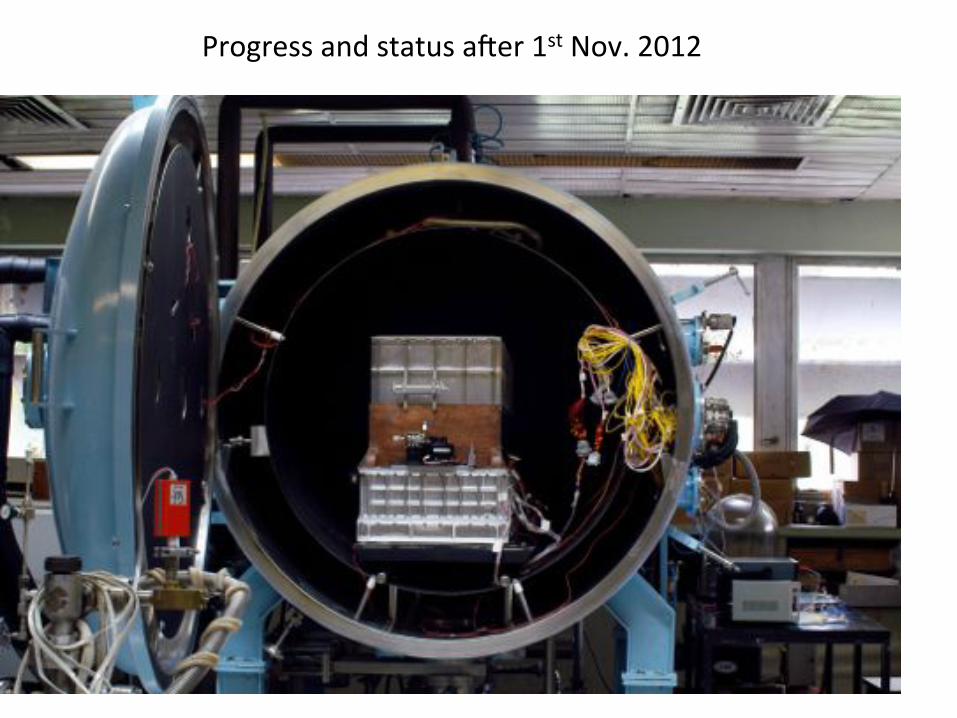
Progress&and&status&aYer&1st&Nov.&2012&

Full&Chain&EMIJEMC&
30JMayJ13& 91&

First&LAXPC&Flight&Detector&being&shipped&to&ISAC.&March&2012&

LAXPC&Detector&OnJboard&Purifica5on&
# OnJBoard& Purifica5on& for& Flight&Detectors&&
30JMayJ13& 93&

$ MATERIALS USED. INVAR: Metering structure: (E: 148Gpa, Yield: 240 Mpa, CTE: ~3 ppm, Density: 8050 kg/m^3 ) AL6061T6: Baffles, brackets, thermal cover. (E: 69 Gpa, Yield: 320 Mpa, CTE: ~23 ppm. Density: 2700kg/m^3 ) Ti6AL4V: Spacecraft adapter. (E: 115 Gpa, Yield: 880 Mpa, CTE: ~8.6 ppm, density:4300 kg/m^3 )
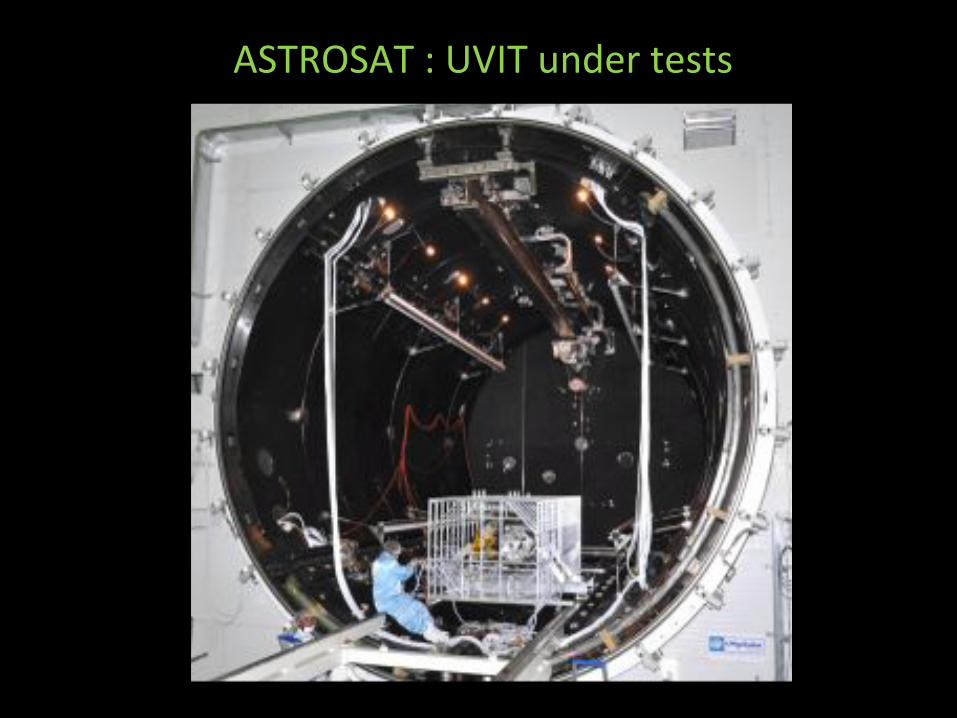
ASTROSAT&:&UVIT&under&tests&

Investigation+on+VIS.CPU+contd...+! CSA!representative!came!to!IIA!and!opened!it.!
! Visibly,!there!was!no!damage!observed.!
! The!unit!is!being!sent!to!CSA!for!the!rectification!of!problem.!
APMC_2013_May29-30 96

Some&lessons&learned&...&
• Too&small&a&team&to&build&such&a&large&observatory&
• Too&few&graduate&students&involved&in&the&project&• Inadequate&amount&of&internal&discussions&/&mee5ngs&–&could¬&evolve&a&peerJdriven&schedule&and&system&performance&
• Lost&some&enthusiasm&due&to&long&delay&in&the&program&

Awai5ng&a&launch&next&year&…..&&&&&
Thankyou&

Reverberation mapping
L(v,t) = -∞ ∫ +∞
ψ(v,τ) C(t�τ) dτ##L(v,t) = line intensity C(t) = continuum intensity
ψ(v,τ) = transfer function, which depends on BLR geometry, kinematics and reprocessing physics
plot of ψ(v,τ) from Debbijoy Bhattacharya
Keplarian disk – 90 deg inclination