
Assure - Raw Material ScreeningThe Assure-Raw Material Screening (Assure-RMS) software package is an...
68
Version Innovation with Integrity Assure 1.2 Screening and System Suitability Test User Manual NMR
Transcript of Assure - Raw Material ScreeningThe Assure-Raw Material Screening (Assure-RMS) software package is an...
Version
Innovation with Integrity
Assure
1.2
Screening and System Suitability Test
User Manual
NMR
Copyright © by Bruker Corporation
All rights reserved. No part of this publication may be reproduced, stored in a retrieval system, or transmitted, in any form, or by any means without the prior consent of the publisher. Product names
used are trademarks or registered trademarks of their respective holders.
©2011 Bruker Corporation Printed in Federal Republic of Germany 01-Dec-2011 Document Part No: B7150
Summary of Contents
5
1 Introduction .................................................................................................. 9
2 Quick Start.................................................................................................. 15
3 AMIX: SBASE ............................................................................................. 19
4 Assure - Raw Material Analysis Software ................................................ 25
5 TOPSPIN, IconNMR, and Assure-RMS in Automation ............................ 39
6 Example Log Files and Reports................................................................ 56
7 Definitions .................................................................................................. 63
8 Contact........................................................................................................ 65
Appendix ............................................................................................................. 67

Contents
6
Contents
7
1 Introduction .................................................................................................. 9 1.1 Raw Material Screening Software Overview ..........................................................9 1.2 Requirements .......................................................................................................12 1.3 Installation.............................................................................................................14 1.4 Default Home Directories .....................................................................................14 1.5 Support .................................................................................................................14
2 Quick Start.................................................................................................. 15 2.1 IconNMR Submission Interface............................................................................15 2.2 Quantification and Identification of Spectral Components ...................................16 2.3 Access to Final Reports........................................................................................17
3 AMIX: SBASE ............................................................................................. 19 3.1 SBASE Registering and Requirements................................................................19 3.2 Assigning Peaks ...................................................................................................21 3.3 Annotating Peaks..................................................................................................21 3.4 Assigning Multiplicity ............................................................................................22 3.5 SBASE..................................................................................................................24
4 Assure - Raw Material Analysis Software ................................................ 25 4.1 General Features..................................................................................................25 4.2 Quantification and Identification of Spectral Components ...................................27 4.3 Quantify: Knowledgebase.....................................................................................29 4.4 Quantify: Method ..................................................................................................31 4.5 Quantification: Run Quantification........................................................................37 4.6 Details of Integration: Quantification and Detection .............................................38
5 TOPSPIN, IconNMR, and Assure-RMS in Automation ............................ 39 5.1 Starting TOPSPIN.................................................................................................39 5.2 GLP Requirement.................................................................................................40 5.3 IconNMR Configuration ........................................................................................40 5.3.1 ‘Assure System’ ....................................................................................................40 5.3.1.1 1H Lineshape........................................................................................................43 5.3.1.2 1H Sensitivity ........................................................................................................44 5.3.1.3 13C Sensitivity ......................................................................................................45 5.3.1.4 Temperature Test with Automatic Adjustment .....................................................45 5.3.2 Additional IconNMR Configuration Elements .......................................................46 5.4 Running IconNMR: Access-Limited User .............................................................52 5.5 Running IconNMR: Supervisor Options ...............................................................54
Contents
8
6 Example Log Files and Reports.................................................................56 6.1 Example log file from System Suitability Tests.................................................... 56 6.2 Reports ................................................................................................................ 57 6.3 User Defined Integration Routine ........................................................................ 60 6.4 Example csv File for Batch Submission .............................................................. 61 6.5 Computer Security ............................................................................................... 62
7 Definitions ...................................................................................................63
8 Contact.........................................................................................................65
Appendix ..............................................................................................................67 A.1 Figures ................................................................................................................. 67 A.2 Tables .................................................................................................................. 69
9
1 Introduction The Assure-Raw Material Screening (Assure-RMS) software package is an automated software package designed to assist in the quality control of raw materials, ingredients and components used in a wide range of products. Reference NMR spectral libraries are used by the software to identify the target material and known possible impurities. Addi-tionally, the percent of unknown impurities relative to the target material are measured and reported. A reference spectral library and knowledgebase of common chemicals is included with the software. Users may add an unlimited number of compounds to user generated spectral libraries and knowledgebases. Reports designed for both the non-technical and advanced users are automatically generated to allow quick assessment of the results and to provide a permanent record of the material testing. To assure that the spectrometer is performing to user defined specifications a series of System Suitability Tests are run as part of the raw material screening software. The raw material screening software may be used for pharmaceuticals, chemicals, polymers, food products, petro-leum and many other materials. This software package allows for the testing and detec-tion of any compounds having NMR active nuclei using standard NMR techniques and runs within the TopSpin software package.
Assure-RMS was designed to be used in a production facility. As a result, many of the features incorporated allow use of this software by non-NMR spectroscopists and on NMR spectrometers in GLP environments.
1.1 Raw Material Screening Software Overview
Summary of Features
• Automated data acquisition using IconNMR using user defined parameter sets
• Automated analysis of spectra using a user generated NMR spectral database
• Automated report generation including a summary QCReport which reports a ‘pass’ or ‘fail’ report (or numerical) and a detailed ExpertReport which outlines the total analysis
• Automated System Suitability Test including acquisition and analysis of NMR stan-dards 1H lineshape, 1H sensitivity and 13C sensitivity, and temperature calibration.
• To reduce routine maintenance of the spectrometer shims settings from successful 1H lineshape experiments are stored and recalled as starting shim set for queued raw material samples.
Introduction
10
Software Design
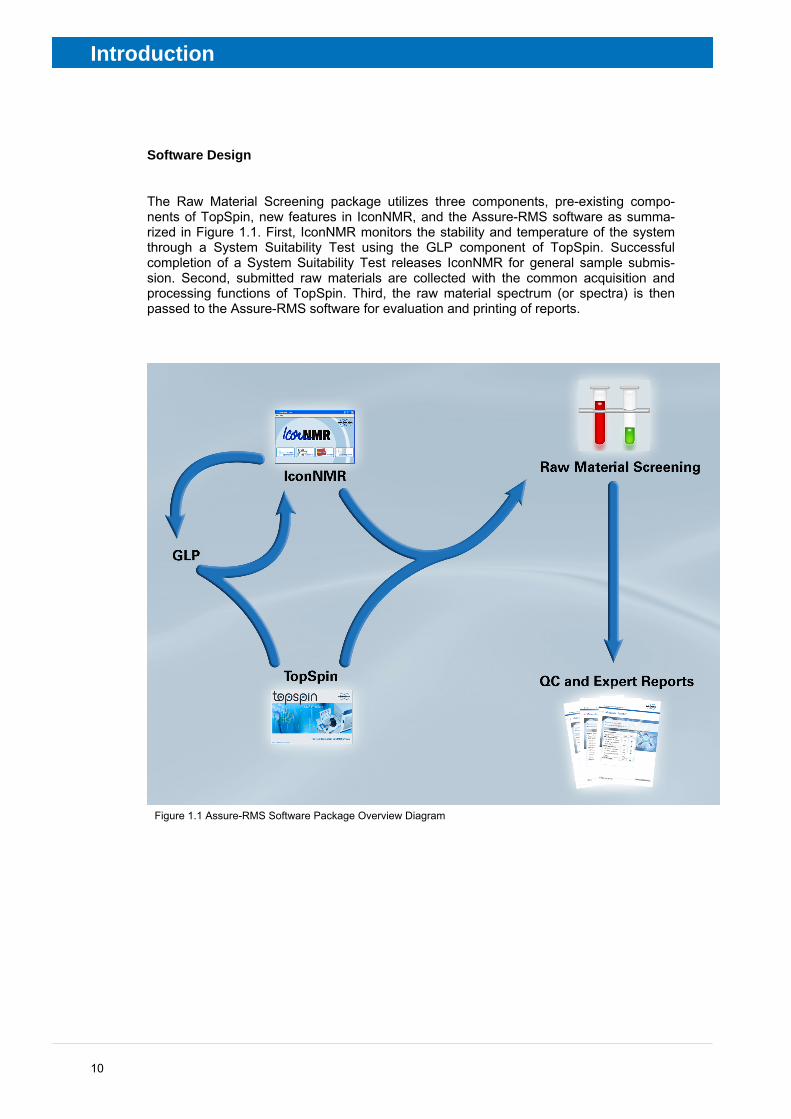
The Raw Material Screening package utilizes three components, pre-existing compo-nents of TopSpin, new features in IconNMR, and the Assure-RMS software as summa-rized in Figure 1.1. First, IconNMR monitors the stability and temperature of the system through a System Suitability Test using the GLP component of TopSpin. Successful completion of a System Suitability Test releases IconNMR for general sample submis-sion. Second, submitted raw materials are collected with the common acquisition and processing functions of TopSpin. Third, the raw material spectrum (or spectra) is then passed to the Assure-RMS software for evaluation and printing of reports.
Figure 1.1 Assure-RMS Software Package Overview Diagram

Introduction
11
Work Flow
The system is designed for sample submission by a novice user. The user should be able to prepare a sample and submit it via the Assure-RMS IconNMR interface. Figure 1.2 shows the progression of sample.
Figure 1.2 Workflow of Assure-RMS Software Diagram
Introduction
12
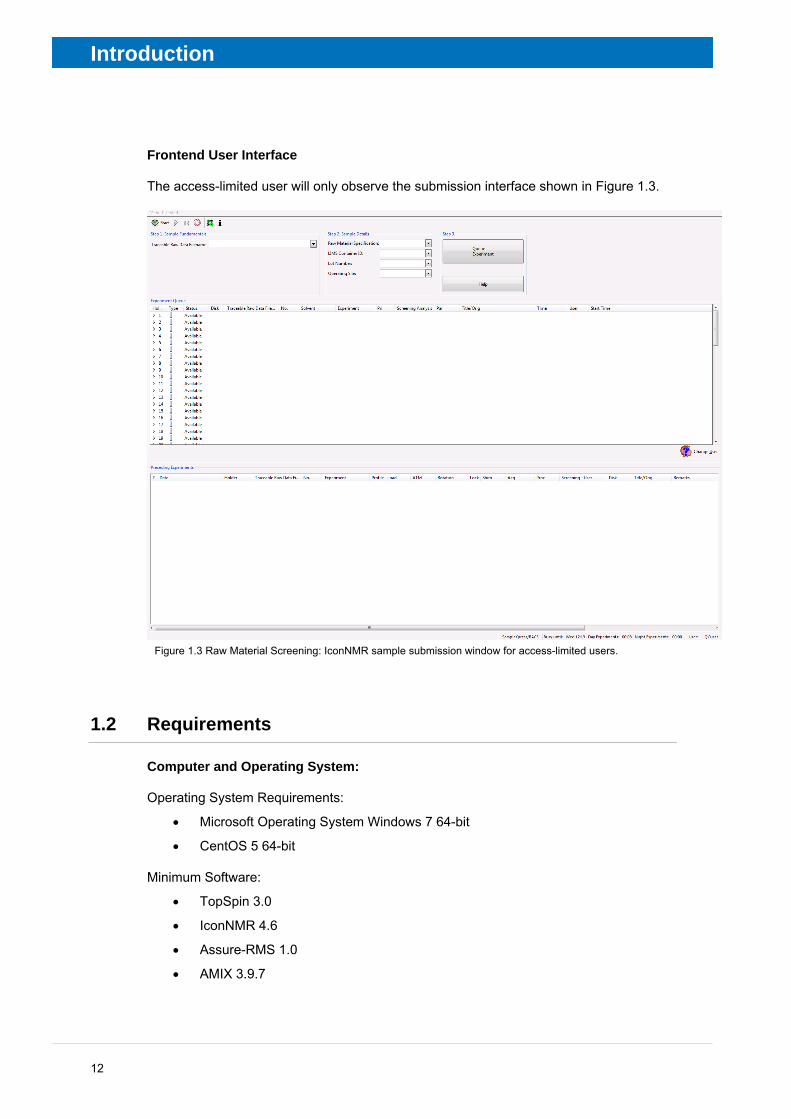
Frontend User Interface
The access-limited user will only observe the submission interface shown in Figure 1.3.
Figure 1.3 Raw Material Screening: IconNMR sample submission window for access-limited users.
1.2 Requirements
Computer and Operating System:
Operating System Requirements:
• Microsoft Operating System Windows 7 64-bit
• CentOS 5 64-bit
Minimum Software:
• TopSpin 3.0
• IconNMR 4.6
• Assure-RMS 1.0
• AMIX 3.9.7
Introduction
13
Software Licenses Required: Licenses may be obtained by contacting [email protected]
• TopSpin 3.0 - acquisition and processing
• Assure - Raw Material Screening
• GLP
Hardware Requirement:
• Spectrometer: Avance II console or later
• B(S)VT and B(S)CU-05 is required.
• High resolution probe equipped with ATMA
• Sample changer with position recognition (BACS-60, BACS-120 SampleJet, or SampleXpress)
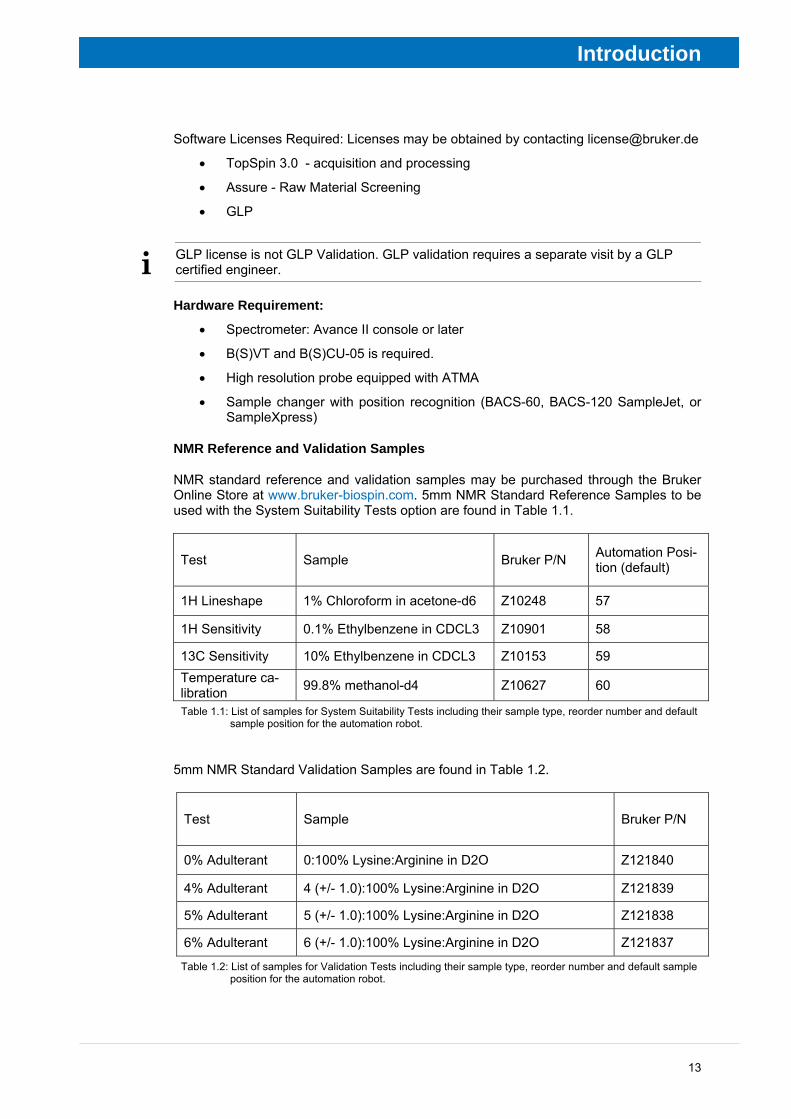
NMR Reference and Validation Samples
NMR standard reference and validation samples may be purchased through the Bruker Online Store at www.bruker-biospin.com. 5mm NMR Standard Reference Samples to be used with the System Suitability Tests option are found in Table 1.1.
Test Sample Bruker P/N Automation Posi-tion (default)
1H Lineshape 1% Chloroform in acetone-d6 Z10248 57
1H Sensitivity 0.1% Ethylbenzene in CDCL3 Z10901 58
13C Sensitivity 10% Ethylbenzene in CDCL3 Z10153 59 Temperature ca-libration 99.8% methanol-d4 Z10627 60
Table 1.1: List of samples for System Suitability Tests including their sample type, reorder number and default sample position for the automation robot.
5mm NMR Standard Validation Samples are found in Table 1.2.
Test Sample Bruker P/N
0% Adulterant 0:100% Lysine:Arginine in D2O Z121840
4% Adulterant 4 (+/- 1.0):100% Lysine:Arginine in D2O Z121839
5% Adulterant 5 (+/- 1.0):100% Lysine:Arginine in D2O Z121838
6% Adulterant 6 (+/- 1.0):100% Lysine:Arginine in D2O Z121837
Table 1.2: List of samples for Validation Tests including their sample type, reorder number and default sample position for the automation robot.
i GLP license is not GLP Validation. GLP validation requires a separate visit by a GLP certified engineer.
Introduction
14
1.3 Installation
TOPSPIN, IconNMR, and AMIX
Proceed as described in the TopSpin 3.0 Installation Guide. IconNMR and AMIX can be separately selected as a customized installation item from the TopSpin installation dialog window.
Assure - Raw Material Screening and Raw Material Screening SBASE
Assure - Raw Material Screening software and spectral database can be found on the Assure - RMS installation disk.
1.4 Default Home Directories
There are two Assure-specific programs used in screening, Assure-RMS and IconNMR. The following directories are used for the noted information in accordance with Windows 7 and CentOS 5.
Windows 7 User Directory %APPDATA% c:\Users\<name>\AppData\Roaming Shared Directory %ALLUSERSPROFILE% c:\ProgramData
CentOS User Directory /usr/Bruker Shared Directory /etc/opt/Bruker
Assure-RMS Default settings (%APPDATA% or <user home dir>/.Bruker) \RawMaterialScreeningQuant Methods (%APPDATA% or /usr/Bruker) \Raw Material Screening
Assure-RMS and IconNMR Logfiles (%APPDATA% or <user home dir>/.Bruker)
\rawMaterialScreening.log Released Quant Method
(%ALLUSERSPROFILE% or /opt/etc/) \Bruker\Raw Material Screening
1.5 Support
Software support is available from your local Bruker office or via E-mail from the following address:
The Bruker www servers www.bruker-biospin.de and www.bruker-biospin.com provide additional information such as downloadable upgrades for your Assure-RMS, TopSpin and IconNMR installation.
15
2 Quick Start This quick start will guide you through an example of screening of raw material utilizing the screening methods supplied with the software. Specifically covered items are data submission, spectrum quantification and identification, and the generated PDF reports.
Included in this quick start are broad comments that give basic understandings of what is performed in the automation. More details of each component of the process to build a successful screening method are described in detail in the subsequent chapters.
2.1 IconNMR Submission Interface
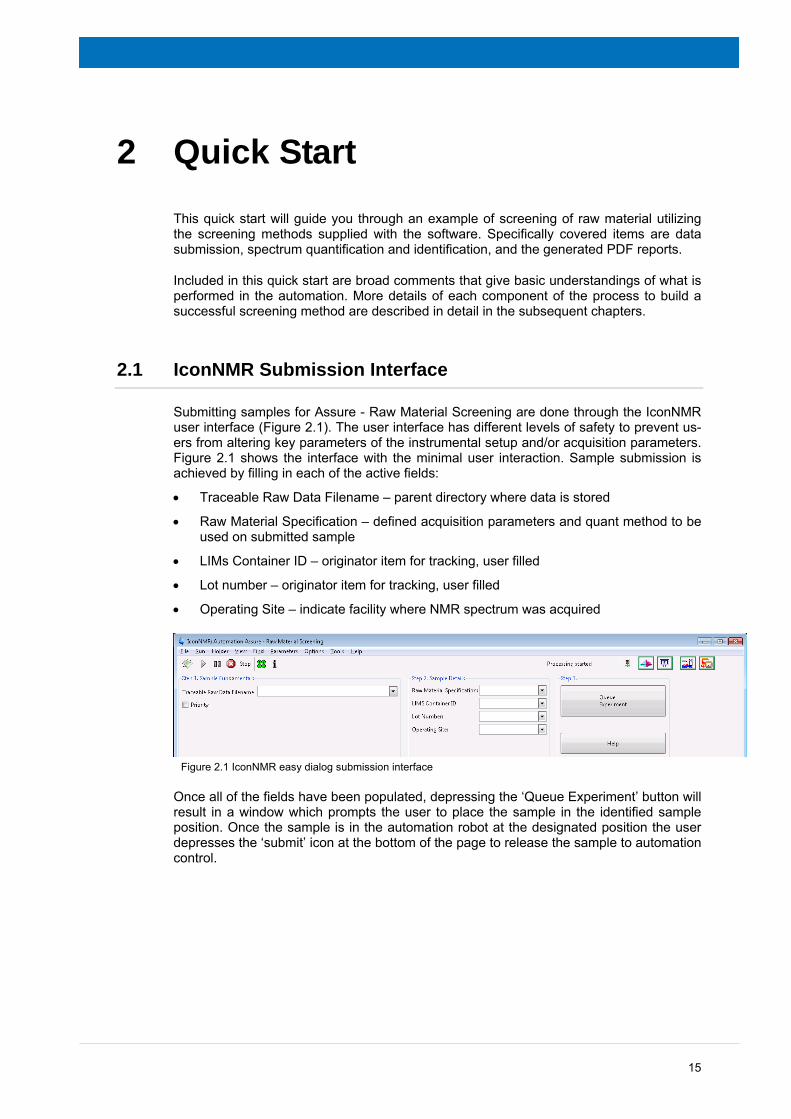
Submitting samples for Assure - Raw Material Screening are done through the IconNMR user interface (Figure 2.1). The user interface has different levels of safety to prevent us-ers from altering key parameters of the instrumental setup and/or acquisition parameters. Figure 2.1 shows the interface with the minimal user interaction. Sample submission is achieved by filling in each of the active fields:
• Traceable Raw Data Filename – parent directory where data is stored
• Raw Material Specification – defined acquisition parameters and quant method to be used on submitted sample
• LIMs Container ID – originator item for tracking, user filled
• Lot number – originator item for tracking, user filled
• Operating Site – indicate facility where NMR spectrum was acquired
Figure 2.1 IconNMR easy dialog submission interface
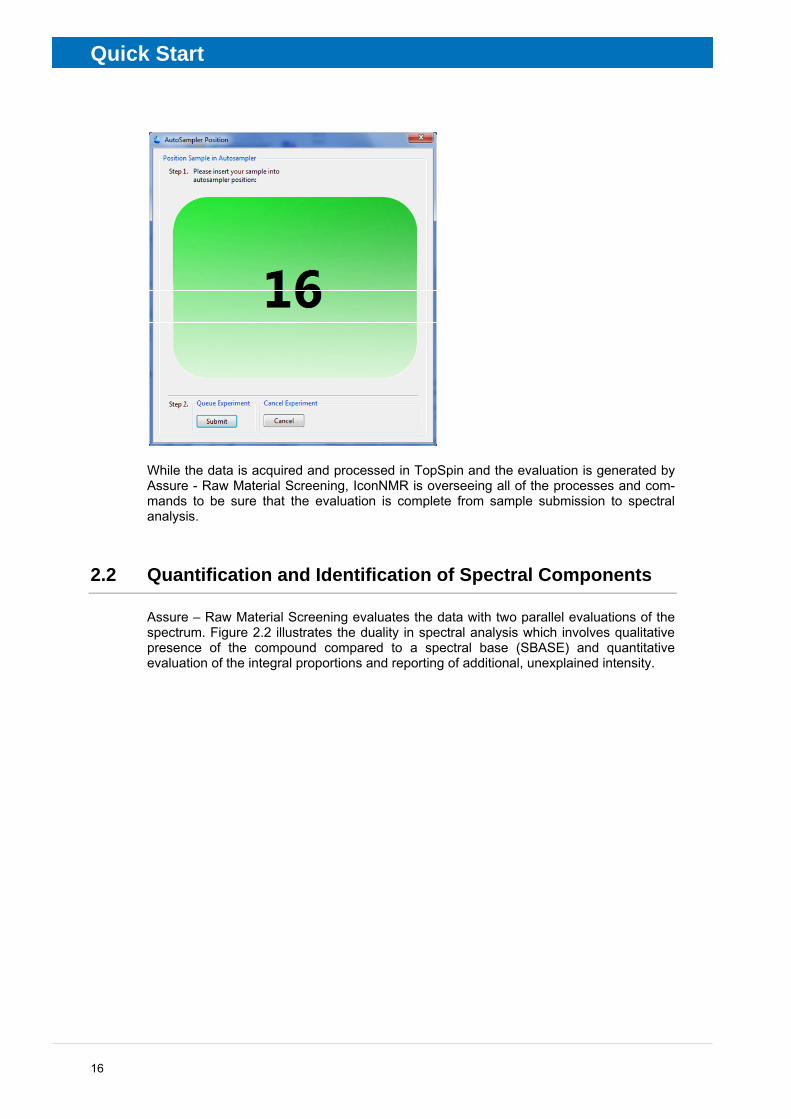
Once all of the fields have been populated, depressing the ‘Queue Experiment’ button will result in a window which prompts the user to place the sample in the identified sample position. Once the sample is in the automation robot at the designated position the user depresses the ‘submit’ icon at the bottom of the page to release the sample to automation control.
Quick Start
16
While the data is acquired and processed in TopSpin and the evaluation is generated by Assure - Raw Material Screening, IconNMR is overseeing all of the processes and com-mands to be sure that the evaluation is complete from sample submission to spectral analysis.
2.2 Quantification and Identification of Spectral Components
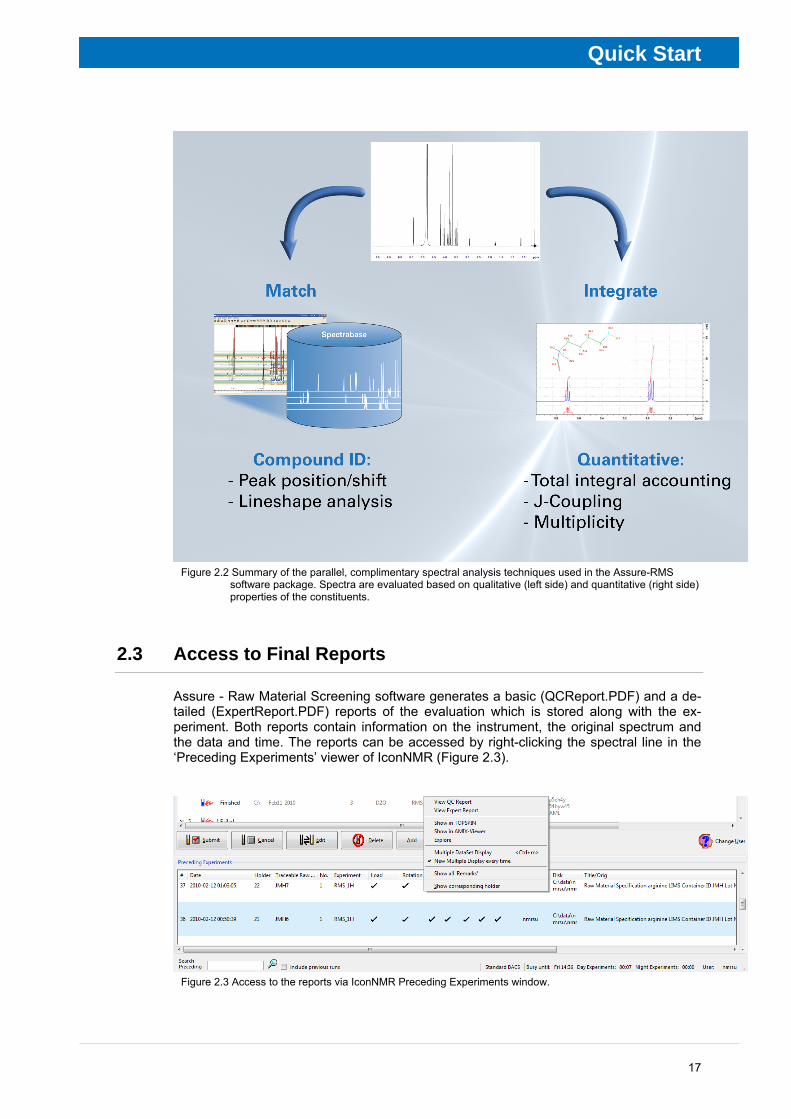
Assure – Raw Material Screening evaluates the data with two parallel evaluations of the spectrum. Figure 2.2 illustrates the duality in spectral analysis which involves qualitative presence of the compound compared to a spectral base (SBASE) and quantitative evaluation of the integral proportions and reporting of additional, unexplained intensity.
Quick Start
17
Figure 2.2 Summary of the parallel, complimentary spectral analysis techniques used in the Assure-RMS
software package. Spectra are evaluated based on qualitative (left side) and quantitative (right side) properties of the constituents.
2.3 Access to Final Reports
Assure - Raw Material Screening software generates a basic (QCReport.PDF) and a de-tailed (ExpertReport.PDF) reports of the evaluation which is stored along with the ex-periment. Both reports contain information on the instrument, the original spectrum and the data and time. The reports can be accessed by right-clicking the spectral line in the ‘Preceding Experiments’ viewer of IconNMR (Figure 2.3).
Figure 2.3 Access to the reports via IconNMR Preceding Experiments window.

Quick Start
18
The basic QC report shows a simple pass or fail of the spectrum based on the criteria de-fined in the quant method. The more detailed Expert report contains information on all of the steps of the analysis. A sample of each of these can be found in chapter 6.2.
19
3 AMIX: SBASE Assure-RMS software utilizes an SBASE and KBASE for the identification of main com-ponents and known impurities. SBASE and KBASE contain the spectrum and quantita-tive information on each individual compound, respectively.
Each facility screening different materials than those provided with the software will need to establish an SBASE and knowledgebase appropriate to their facility. Bruker Analytical Services is available to provide this service if needed.
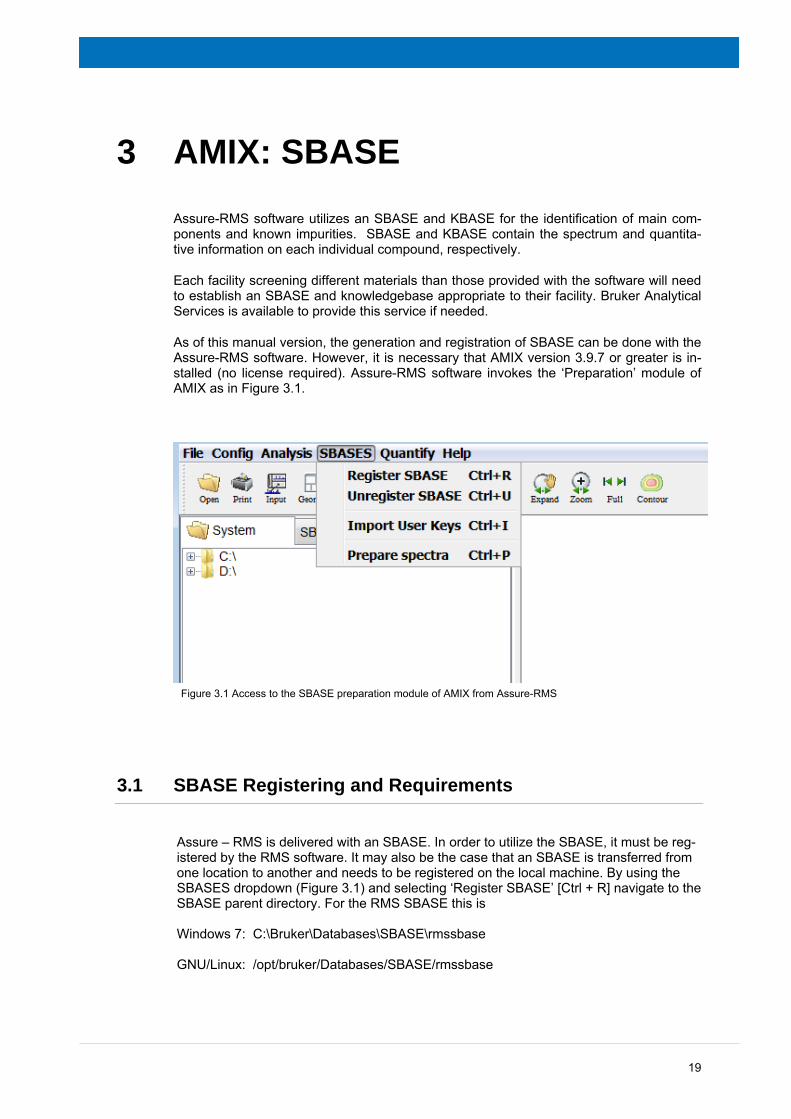
As of this manual version, the generation and registration of SBASE can be done with the Assure-RMS software. However, it is necessary that AMIX version 3.9.7 or greater is in-stalled (no license required). Assure-RMS software invokes the ‘Preparation’ module of AMIX as in Figure 3.1.
Figure 3.1 Access to the SBASE preparation module of AMIX from Assure-RMS
3.1 SBASE Registering and Requirements
Assure – RMS is delivered with an SBASE. In order to utilize the SBASE, it must be reg-istered by the RMS software. It may also be the case that an SBASE is transferred from one location to another and needs to be registered on the local machine. By using the SBASES dropdown (Figure 3.1) and selecting ‘Register SBASE’ [Ctrl + R] navigate to the SBASE parent directory. For the RMS SBASE this is Windows 7: C:\Bruker\Databases\SBASE\rmssbase GNU/Linux: /opt/bruker/Databases/SBASE/rmssbase
AMIX: SBASE
20
In the event that an SBASE is updated in the same directory as the existing SBASE(more compounds, more data, changes in ‘keys’, or changes in nomenclature), it is necessary to unregister the previous SBASE from within the RMS window before proceeding to regis-ter the updates.
The first step in generating an SBASE is to make assignments and correlate them to the chemical structure of the compound. Once the assignments are made, AMIX stores the information with the spectrum allowing the information to be transferred to the know-ledgebase.
There three necessary spectral notation are covered in section 3.2, 3.3, and 3.4.
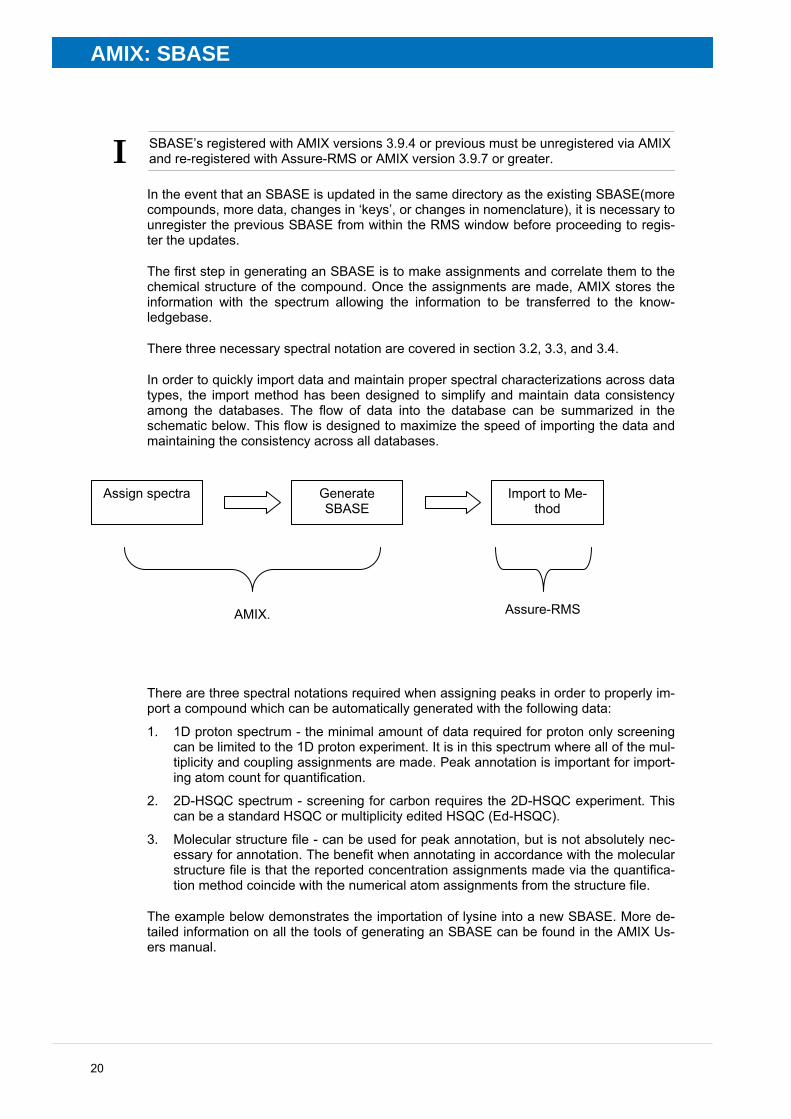
In order to quickly import data and maintain proper spectral characterizations across data types, the import method has been designed to simplify and maintain data consistency among the databases. The flow of data into the database can be summarized in the schematic below. This flow is designed to maximize the speed of importing the data and maintaining the consistency across all databases.
There are three spectral notations required when assigning peaks in order to properly im-port a compound which can be automatically generated with the following data:
1. 1D proton spectrum - the minimal amount of data required for proton only screening can be limited to the 1D proton experiment. It is in this spectrum where all of the mul-tiplicity and coupling assignments are made. Peak annotation is important for import-ing atom count for quantification.
2. 2D-HSQC spectrum - screening for carbon requires the 2D-HSQC experiment. This can be a standard HSQC or multiplicity edited HSQC (Ed-HSQC).
3. Molecular structure file - can be used for peak annotation, but is not absolutely nec-essary for annotation. The benefit when annotating in accordance with the molecular structure file is that the reported concentration assignments made via the quantifica-tion method coincide with the numerical atom assignments from the structure file.
The example below demonstrates the importation of lysine into a new SBASE. More de-tailed information on all the tools of generating an SBASE can be found in the AMIX Us-ers manual.
I SBASE’s registered with AMIX versions 3.9.4 or previous must be unregistered via AMIX and re-registered with Assure-RMS or AMIX version 3.9.7 or greater.
Assign spectra Generate SBASE
Import to Me-thod
AMIX. Assure-RMS

AMIX: SBASE
21
3.2 Assigning Peaks
The tools for assigning peaks within a spectrum is found in the ‘Analysis’ menu. Peaks can be quickly picked with the drop down function ‘Auto Peak Pick’ as shown in Figure 3.2. The resulting picked peaks will be identified with tick marks above the peaks.
Figure 3.2 Action and window arguments for automated picking peaks in AMIX. The resulting peaks which
have been picked are shown with tick marks on the Hα (ca. 3.75 ppm) and Hε (ca. 3.05 ppm) resonances.
3.3 Annotating Peaks
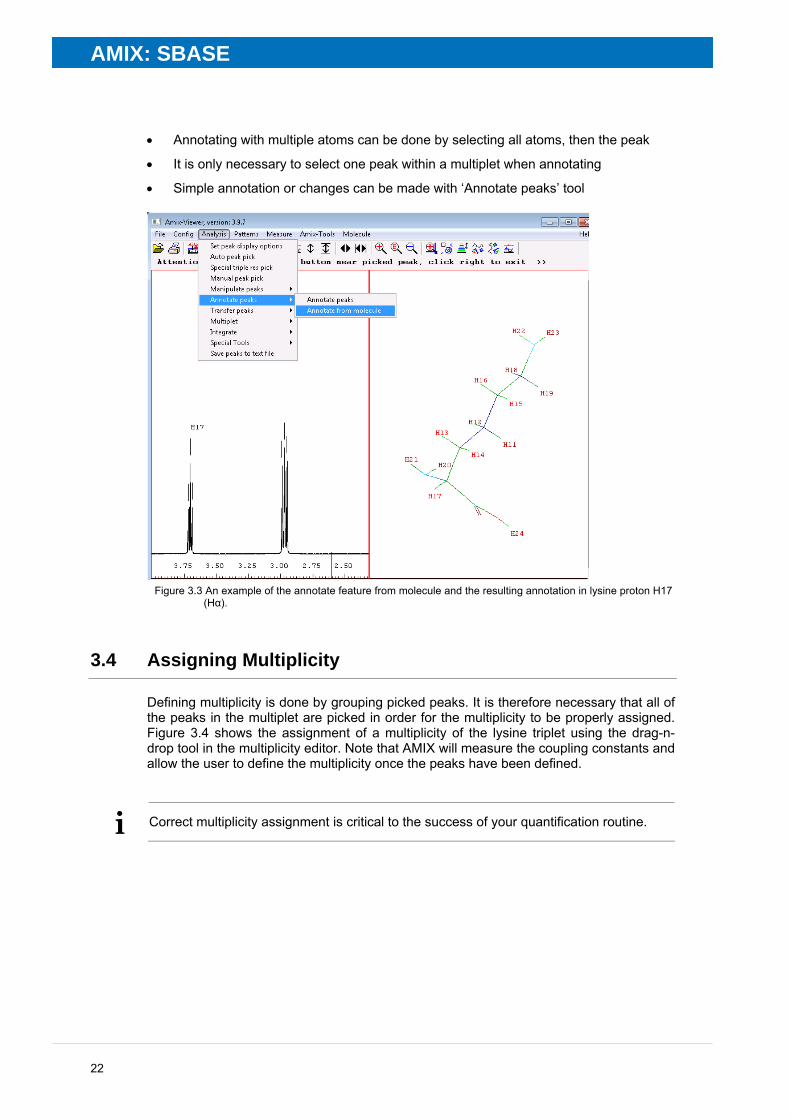
Peaks can be quickly annotated from the molecular structure. This is with both the mo-lecular structure and the spectrum opened in AMIX, and then selecting an atom from the molecular structure and selecting the corresponding signal on the spectrum as seen in Figure 3.3. When using the annotate feature from the molecular structure tool, it is impor-tant to remember these key points:
i It is not necessary to annotate the peaks from the molecule. It is absolutely necessary to annotate the correct number of atoms for quantification of two protons by filling the field with: H, H
AMIX: SBASE
22
• Annotating with multiple atoms can be done by selecting all atoms, then the peak
• It is only necessary to select one peak within a multiplet when annotating
• Simple annotation or changes can be made with ‘Annotate peaks’ tool
Figure 3.3 An example of the annotate feature from molecule and the resulting annotation in lysine proton H17
(Hα).
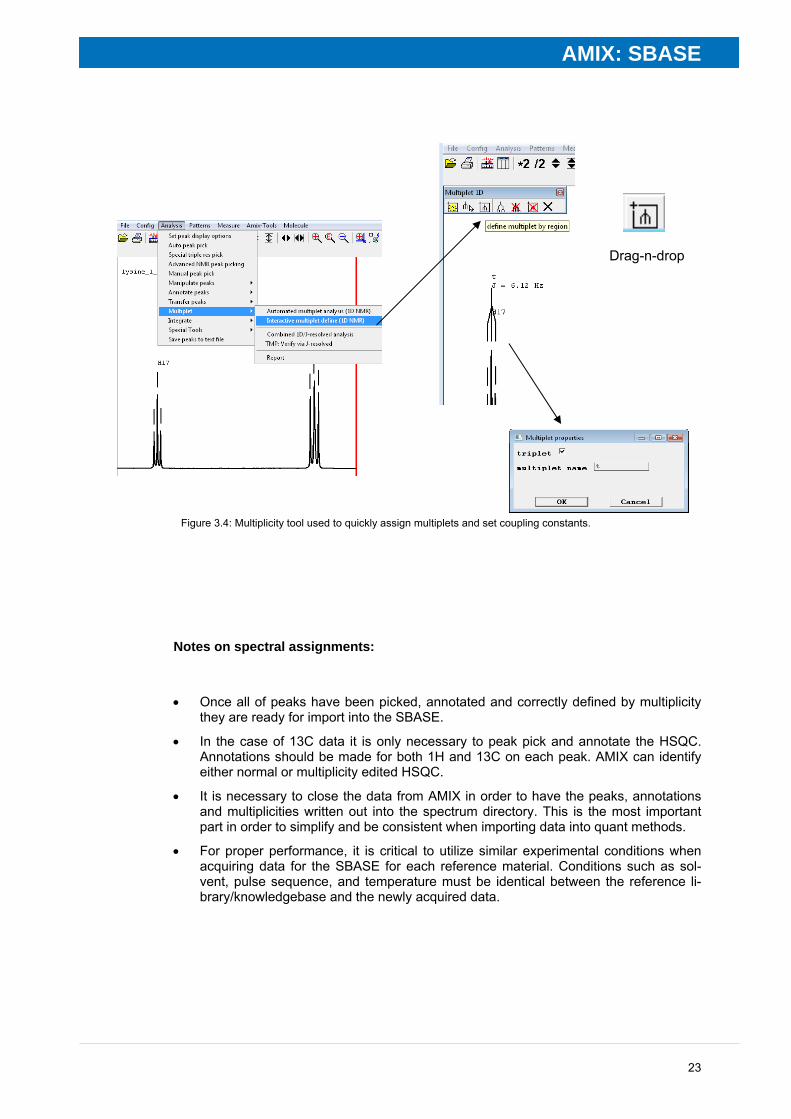
3.4 Assigning Multiplicity
Defining multiplicity is done by grouping picked peaks. It is therefore necessary that all of the peaks in the multiplet are picked in order for the multiplicity to be properly assigned. Figure 3.4 shows the assignment of a multiplicity of the lysine triplet using the drag-n-drop tool in the multiplicity editor. Note that AMIX will measure the coupling constants and allow the user to define the multiplicity once the peaks have been defined.
i Correct multiplicity assignment is critical to the success of your quantification routine.
AMIX: SBASE
23
Figure 3.4: Multiplicity tool used to quickly assign multiplets and set coupling constants.
Notes on spectral assignments:
• Once all of peaks have been picked, annotated and correctly defined by multiplicity they are ready for import into the SBASE.
• In the case of 13C data it is only necessary to peak pick and annotate the HSQC. Annotations should be made for both 1H and 13C on each peak. AMIX can identify either normal or multiplicity edited HSQC.
• It is necessary to close the data from AMIX in order to have the peaks, annotations and multiplicities written out into the spectrum directory. This is the most important part in order to simplify and be consistent when importing data into quant methods.
• For proper performance, it is critical to utilize similar experimental conditions when acquiring data for the SBASE for each reference material. Conditions such as sol-vent, pulse sequence, and temperature must be identical between the reference li-brary/knowledgebase and the newly acquired data.
Drag-n-drop

AMIX: SBASE
24
3.5 SBASE
Data preparation from transformed NMR spectra is done to reduce the SBASE file size and to eliminate any signals that are not part of the target molecule. Data preparation for SBASE is done under the ‘Prepare data’ module which can be opened from within the drop-down ‘Amix-Tools’. All of the data carried from the previous spectral assignment sections is carried into the SBASE.
1. Create new/Register/Delete SBASE
• Create new – define a new SBASE directory
• Register – allows the user to register SBASEs that already exist so that it can be used (such as the RawMaterial_demo SBASE provided with the Assure-RMS instal-lation disk)
• Remove – used to remove SBASE from the registry
Figure 3.5: Tools of the Preparation module. The Preparation dropdown has all of the tools necessary to im-
port a spectrum into an SBASE.
2. Import spectrum to SBASE – a large number of tools exist within the import option. The minimal steps to import a spectrum to an SBASE is as follows:
• Open assigned spectrum into AMIX viewer, then under the ‘Preparation’ dropdown:
• Define noise level – sets threshold for level at which peaks are kept or removed from the SBASE spectrum
• Line shape analysis – removes everything below noise level
• Delete area – drag and drop tool which allows removal of peaks not associated with the constituent (e.g. water, TSP, etc.)
• Save to spectral base
25
4 Assure - Raw Material Analysis Software
4.1 General Features
The Raw Material analysis software is called Assure-RMS which is the implementation of Java platform using many of the tools and features of AMIX. Specifically, the screening module uses the matching algorithms and knowledgebase for identification and quantifi-cation of constituents, respectively. For further information refer to the AMIX manual.
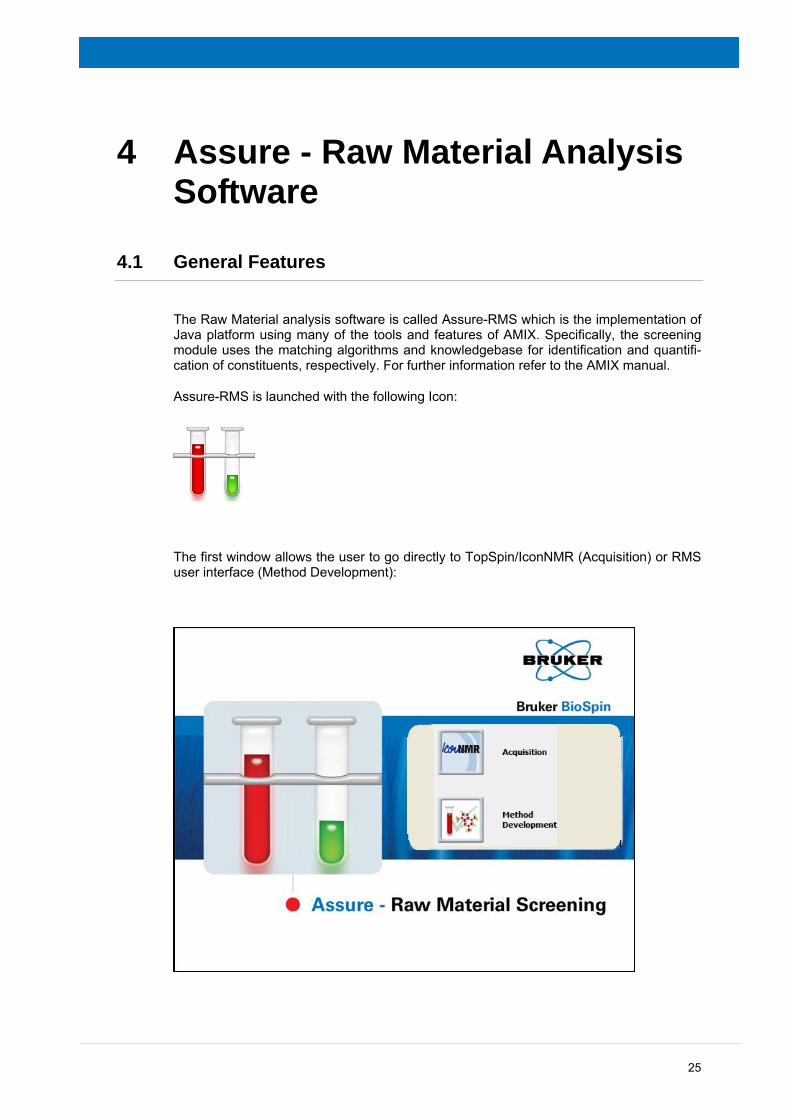
Assure-RMS is launched with the following Icon:
The first window allows the user to go directly to TopSpin/IconNMR (Acquisition) or RMS user interface (Method Development):
Assure – Raw Material Analysis Software
26
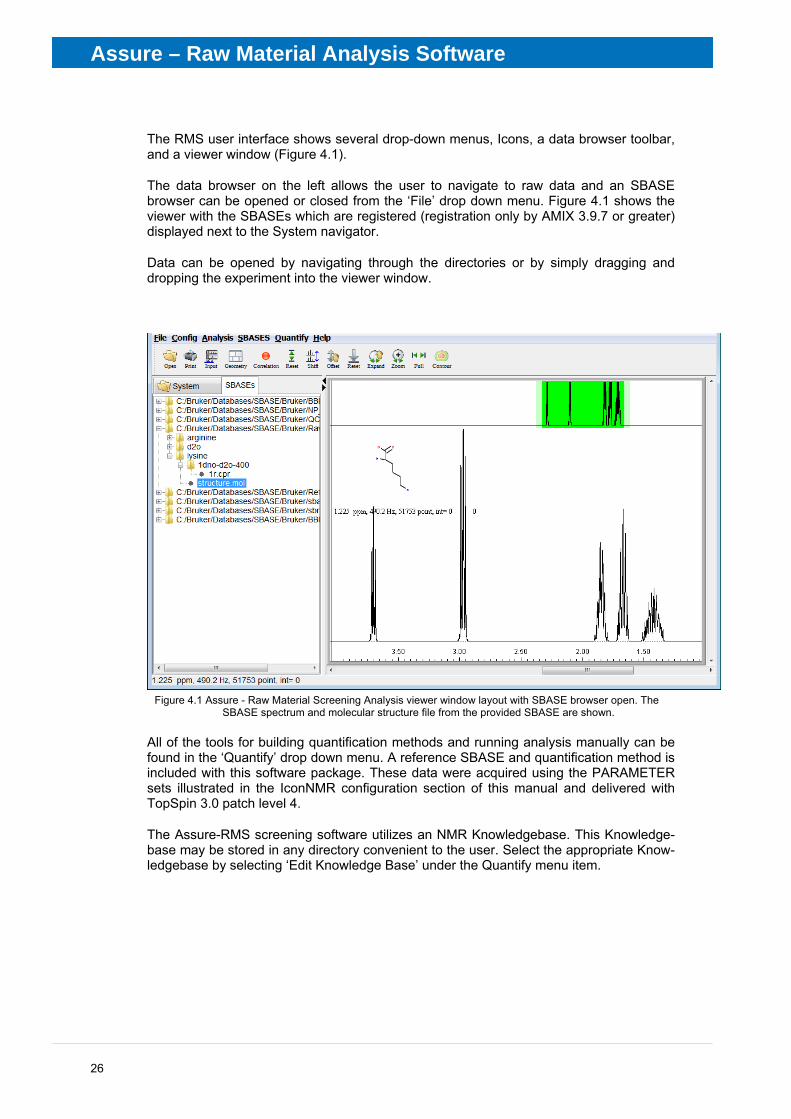
The RMS user interface shows several drop-down menus, Icons, a data browser toolbar, and a viewer window (Figure 4.1).
The data browser on the left allows the user to navigate to raw data and an SBASE browser can be opened or closed from the ‘File’ drop down menu. Figure 4.1 shows the viewer with the SBASEs which are registered (registration only by AMIX 3.9.7 or greater) displayed next to the System navigator.
Data can be opened by navigating through the directories or by simply dragging and dropping the experiment into the viewer window.
Figure 4.1 Assure - Raw Material Screening Analysis viewer window layout with SBASE browser open. The
SBASE spectrum and molecular structure file from the provided SBASE are shown.
All of the tools for building quantification methods and running analysis manually can be found in the ‘Quantify’ drop down menu. A reference SBASE and quantification method is included with this software package. These data were acquired using the PARAMETER sets illustrated in the IconNMR configuration section of this manual and delivered with TopSpin 3.0 patch level 4.
The Assure-RMS screening software utilizes an NMR Knowledgebase. This Knowledge-base may be stored in any directory convenient to the user. Select the appropriate Know-ledgebase by selecting ‘Edit Knowledge Base’ under the Quantify menu item.

Assure – Raw Material Analysis Software
27
4.2 Quantification and Identification of Spectral Components
Processed data from TopSpin is passed to the Assure - Raw Material Screening software that utilizes a spectralbase and knowledgebase for identification and quantification of in-dividual components of the sample. Evaluation is based on two criteria: quantification and spectral matching. Positive identification from both of these methods gives confidence in the identification of a constituent and is compiled into a quant method. The quant method also sets the level of a contaminant allowed in a passing sample or thresholds which re-sults in a failed sample.
Matching
Spectral matching is done by projecting the raw material spectra onto a previously ac-quired spectrum of a known, pure sample. The criteria for spectral matching are that the mixture and the pure reference must both have intensity at the same location. Subrou-tines to determine the same multiplicity and lineshape are then used to ensure that the signals observed in the raw material spectrum are consistent with the structural properties reflected in the purified, reference spectrum. The search region is defined as +/- 0.02 ppm.
Quantification
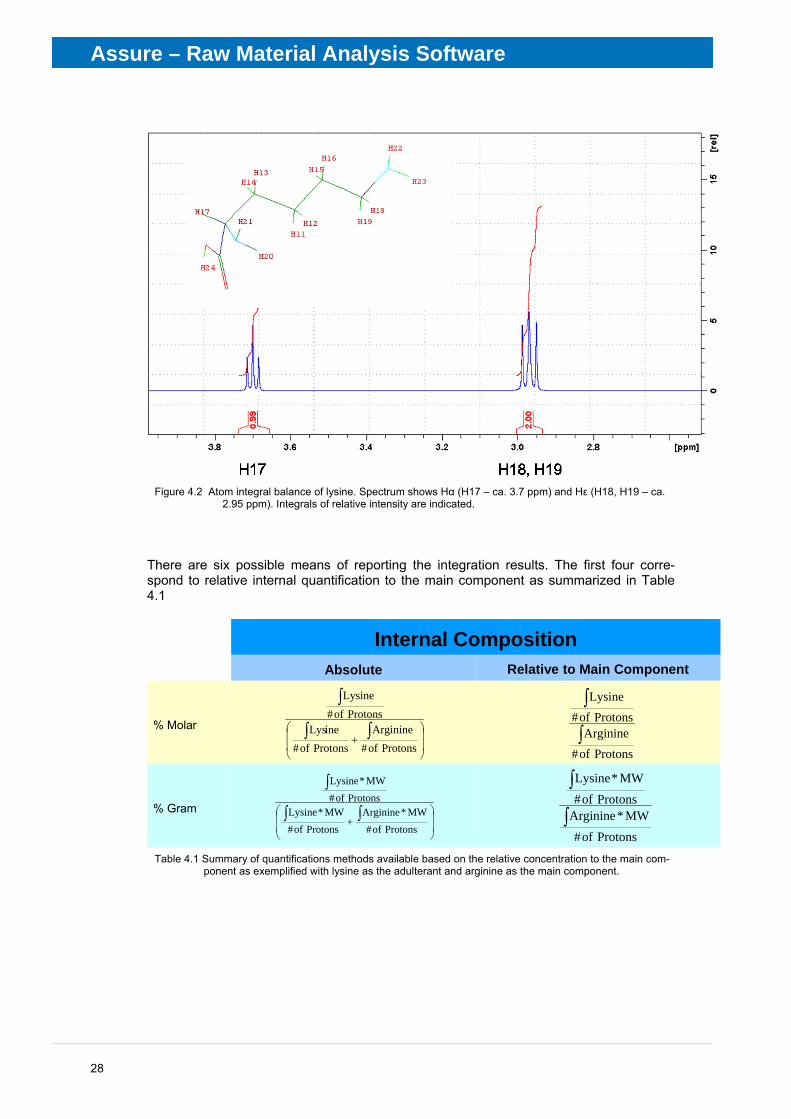
Quantification of each component observed in a spectrum requires a compiled list of spe-cific chemical shifts detailing the atom count at each of these signal regions. The pres-ence of a compound will be confirmed when the all of the signal regions posses integrals and the integrals are in proportion to their respective atom count. Figure 4.2 illustrates in lysine how the areas of non-exchangeable peaks maintain a relative atom integral bal-ance. All intensity is accounted for and there is no +/- threshold for expected integral.
Assure – Raw Material Analysis Software
28
Figure 4.2 Atom integral balance of lysine. Spectrum shows Hα (H17 – ca. 3.7 ppm) and Hε (H18, H19 – ca.
2.95 ppm). Integrals of relative intensity are indicated.
There are six possible means of reporting the integration results. The first four corre-spond to relative internal quantification to the main component as summarized in Table 4.1
Internal CompositionAbsolute Relative to Main Component
% Molar
% Gram
Internal CompositionAbsolute Relative to Main Component
% Molar
% Gram⎟⎟
⎠
⎞
⎜⎜
⎝
⎛+ ∫∫
∫
Protons of#MW * Arginine
Protons of#
MW * LysineProtons of#
MW * Lysine
⎟⎟
⎠
⎞
⎜⎜
⎝
⎛+ ∫∫
∫
Protons of#Arginine
Protons of#
ineLysProtons of#
Lysine
Protons of#Arginine
Protons of#Lysine
∫
∫
Protons of#MW * Arginine
Protons of#MW * Lysine
∫
∫
Table 4.1 Summary of quantifications methods available based on the relative concentration to the main com-
ponent as exemplified with lysine as the adulterant and arginine as the main component.

Assure – Raw Material Analysis Software
29
The methods of absolute quantification available are seen below in Table 4.2. These can use either an inserted known standard such as TSP, DSS, or an inserted reference such as ERETIC II.
Absolute CompositionInternal Reference External Reference
e.g. Formulatione.g. ERETIC
*not currently available
Absolute CompositionInternal Reference External Reference
e.g. Formulatione.g. ERETIC
*not currently available
Table 4.2 Summary of absolute quantification methods
4.3 Quantify: Knowledgebase
Knowledgebase is a collection of all the definitions of the spectral properties of all of the compounds that are to be screened. It is different from a quantification method in that the definitions of which specific compounds and their adulterant thresholds are not neces-sary. The purpose of the Knowledgebase is to create a comprehensive table of all com-pounds from which identification and quantification methods could be easily generated.
The relevant fields in a Knowledgebase include the following details and rules to ensure a successful screening method:
• Name – the same name must be used in the knowledgebase as is used in the SBASE for match results
• Molecular weight – used in the calculation of concentration
• Compound region – area where signal is expected in the NMR spectrum and the number of atoms at the peak is defined for both 1H and 13C spectra
• 1H and 13C Quant – define the expected multiplicity, J-coupling, and define which signal(s) are used for integration.
• Multiplet identification – set the plus/minus tolerance of J-coupling and point at which peaks are no longer picked.
Using the example SBASE provided, a knowledgebase can be made as follows:
1. New/Edit Knowledgebase – opens the screen below to import a new compound from an SBASE or an alternative knowledgebase.
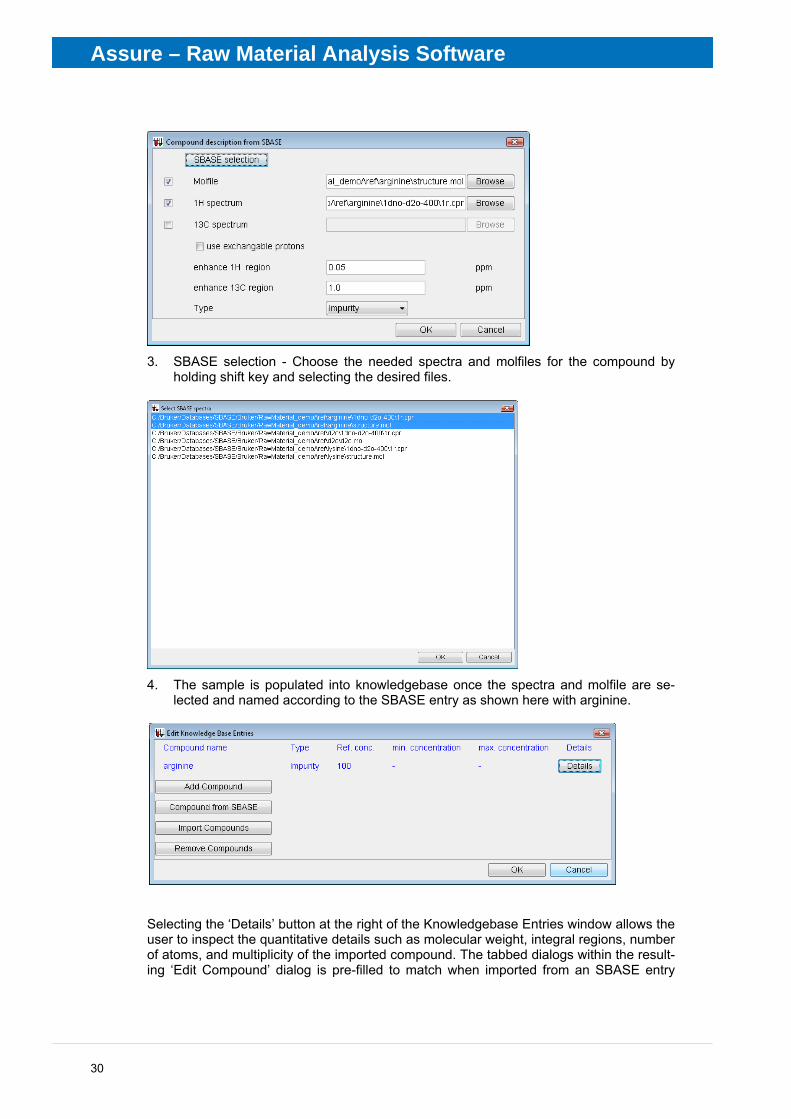
2. Select ‘Compound from SBASE’ to identify the molecular structure file (molfile) and
spectra to associate with this compound and to assign the compound to a main com-ponent, adulterant, impurity, solvent or NMR reference signal.
Assure – Raw Material Analysis Software
30
3. SBASE selection - Choose the needed spectra and molfiles for the compound by
holding shift key and selecting the desired files.
4. The sample is populated into knowledgebase once the spectra and molfile are se-
lected and named according to the SBASE entry as shown here with arginine.
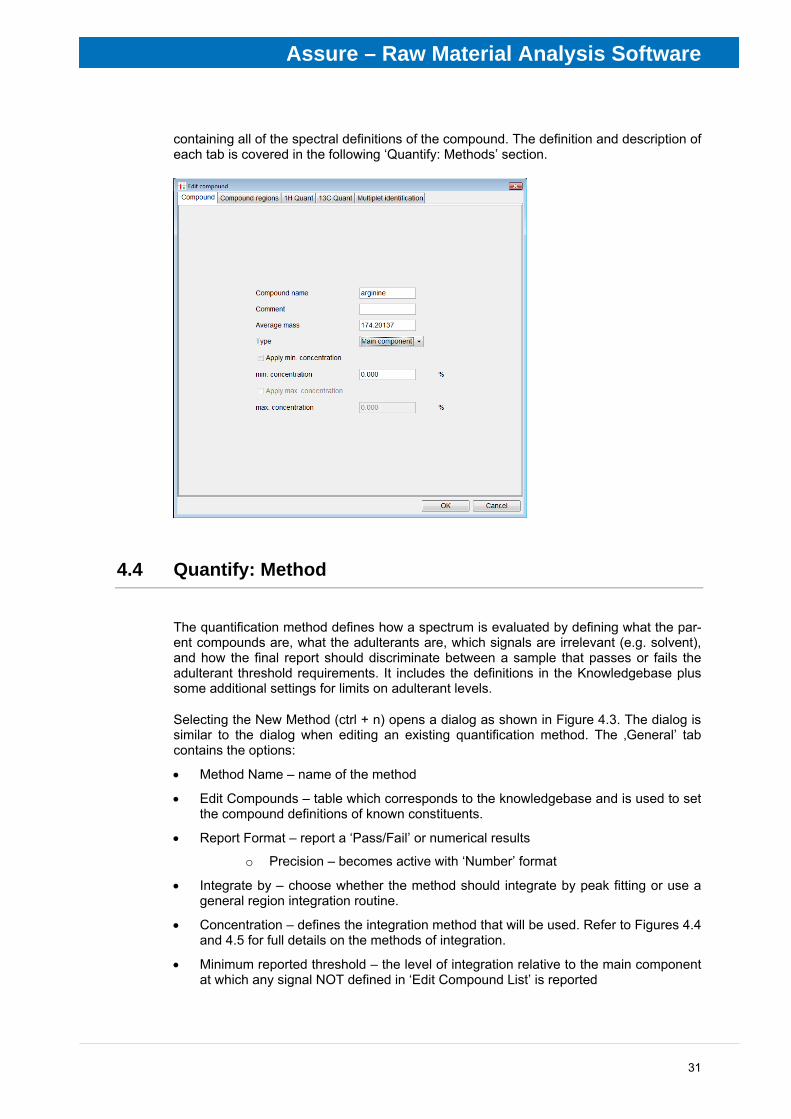
Selecting the ‘Details’ button at the right of the Knowledgebase Entries window allows the user to inspect the quantitative details such as molecular weight, integral regions, number of atoms, and multiplicity of the imported compound. The tabbed dialogs within the result-ing ‘Edit Compound’ dialog is pre-filled to match when imported from an SBASE entry
Assure – Raw Material Analysis Software
31
containing all of the spectral definitions of the compound. The definition and description of each tab is covered in the following ‘Quantify: Methods’ section.
4.4 Quantify: Method
The quantification method defines how a spectrum is evaluated by defining what the par-ent compounds are, what the adulterants are, which signals are irrelevant (e.g. solvent), and how the final report should discriminate between a sample that passes or fails the adulterant threshold requirements. It includes the definitions in the Knowledgebase plus some additional settings for limits on adulterant levels.
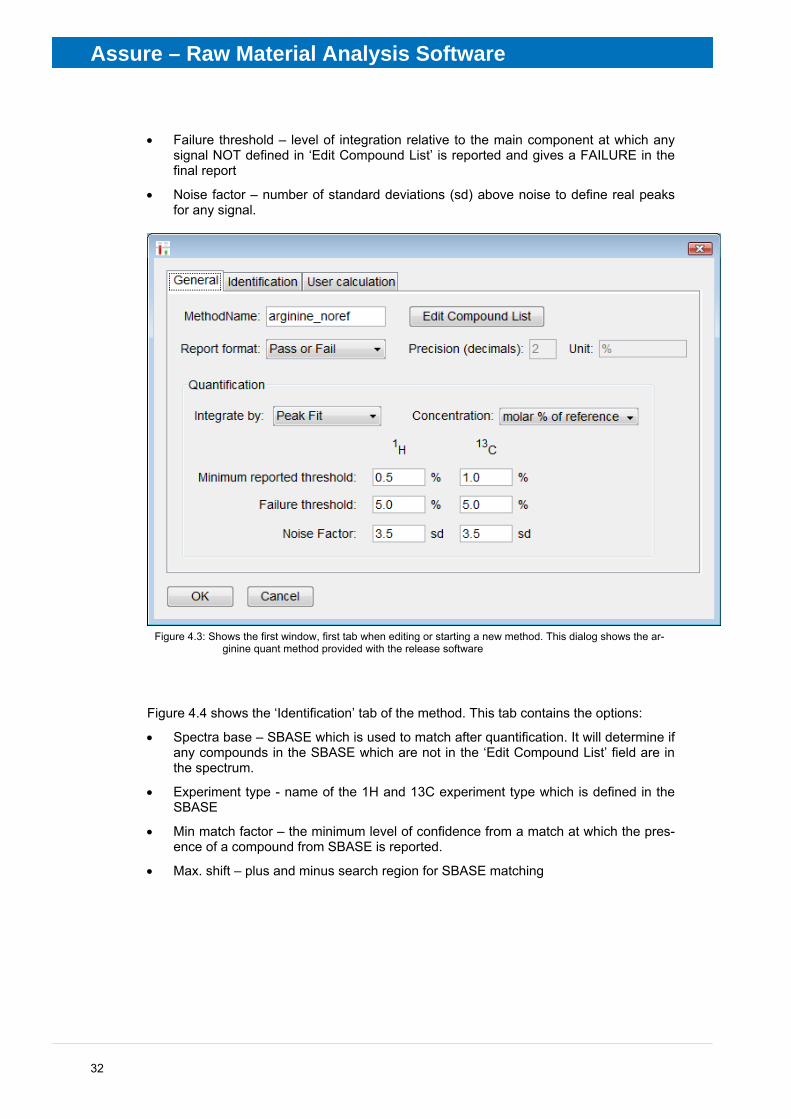
Selecting the New Method (ctrl + n) opens a dialog as shown in Figure 4.3. The dialog is similar to the dialog when editing an existing quantification method. The ‚General’ tab contains the options:
• Method Name – name of the method
• Edit Compounds – table which corresponds to the knowledgebase and is used to set the compound definitions of known constituents.
• Report Format – report a ‘Pass/Fail’ or numerical results
o Precision – becomes active with ‘Number’ format
• Integrate by – choose whether the method should integrate by peak fitting or use a general region integration routine.
• Concentration – defines the integration method that will be used. Refer to Figures 4.4 and 4.5 for full details on the methods of integration.
• Minimum reported threshold – the level of integration relative to the main component at which any signal NOT defined in ‘Edit Compound List’ is reported
Assure – Raw Material Analysis Software
32
• Failure threshold – level of integration relative to the main component at which any signal NOT defined in ‘Edit Compound List’ is reported and gives a FAILURE in the final report
• Noise factor – number of standard deviations (sd) above noise to define real peaks for any signal.
Figure 4.3: Shows the first window, first tab when editing or starting a new method. This dialog shows the ar-
ginine quant method provided with the release software
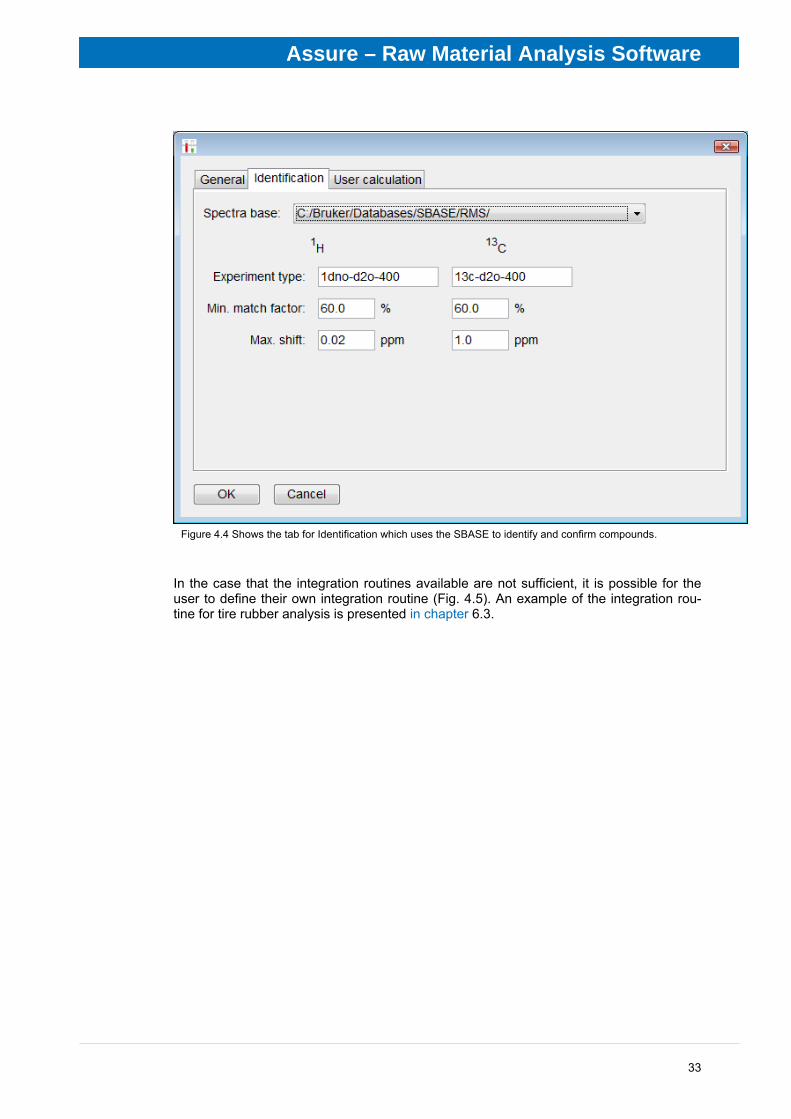
Figure 4.4 shows the ‘Identification’ tab of the method. This tab contains the options:
• Spectra base – SBASE which is used to match after quantification. It will determine if any compounds in the SBASE which are not in the ‘Edit Compound List’ field are in the spectrum.
• Experiment type - name of the 1H and 13C experiment type which is defined in the SBASE
• Min match factor – the minimum level of confidence from a match at which the pres-ence of a compound from SBASE is reported.
• Max. shift – plus and minus search region for SBASE matching
Assure – Raw Material Analysis Software
33
Figure 4.4 Shows the tab for Identification which uses the SBASE to identify and confirm compounds.
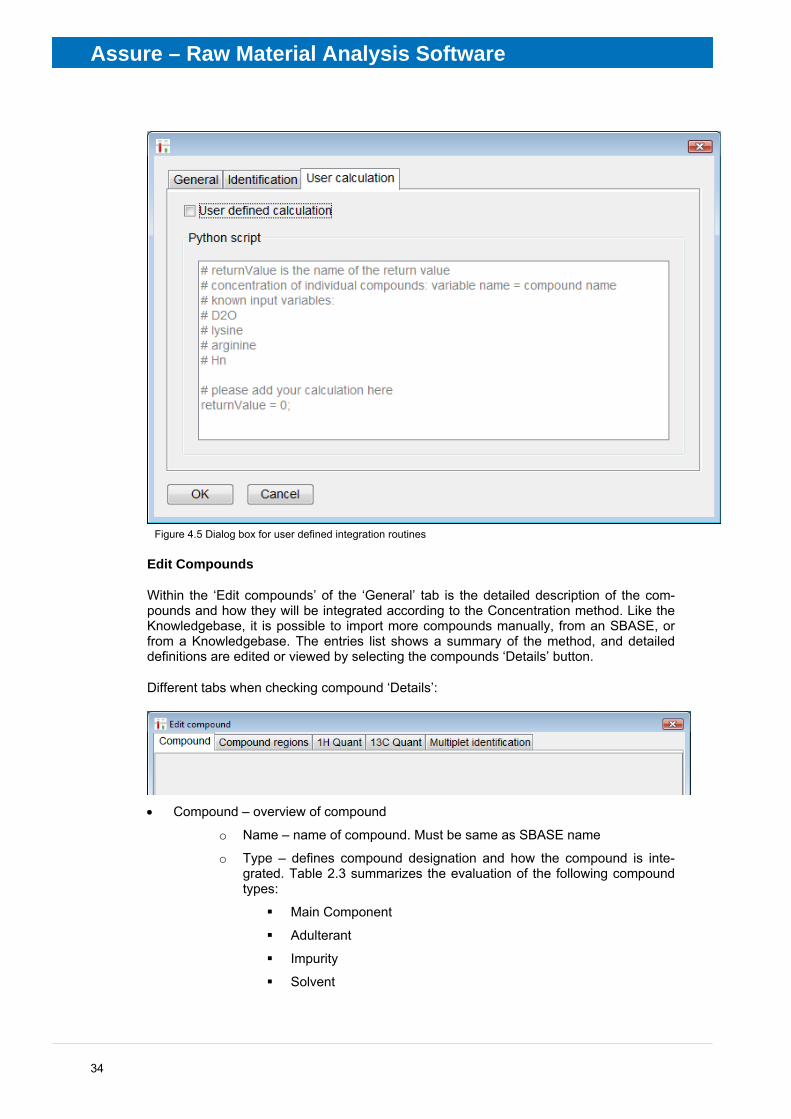
In the case that the integration routines available are not sufficient, it is possible for the user to define their own integration routine (Fig. 4.5). An example of the integration rou-tine for tire rubber analysis is presented in chapter 6.3.
Assure – Raw Material Analysis Software
34
Figure 4.5 Dialog box for user defined integration routines
Edit Compounds
Within the ‘Edit compounds’ of the ‘General’ tab is the detailed description of the com-pounds and how they will be integrated according to the Concentration method. Like the Knowledgebase, it is possible to import more compounds manually, from an SBASE, or from a Knowledgebase. The entries list shows a summary of the method, and detailed definitions are edited or viewed by selecting the compounds ‘Details’ button.
Different tabs when checking compound ‘Details’:
• Compound – overview of compound
o Name – name of compound. Must be same as SBASE name
o Type – defines compound designation and how the compound is inte-grated. Table 2.3 summarizes the evaluation of the following compound types:
Main Component
Adulterant
Impurity
Solvent
Assure – Raw Material Analysis Software
35
NMR Reference
o Apply ‘min. concentration’ – use if screening by a minimum detectable level is desired.
o Apply ‘max. concentration’ – use if screening by a maximum detectable level is desired.
• Compound region
o Define expected signal regions for 1H and13C
o Set the number of atoms within each defined region
o Set the annotation on how the region is labeled in the final report
• 1H Quant
o Define the type of shape of the peak within the defined region. NOTE: It is particularly important to accurately define the peak shape.
Defined Coupling Patterns:
S – singlet
D – doublet
T – triplet
Q – quartet
Quin – quintet
Sept – septet
DD – doublet of doublets
DT – doublet of triplets
DQ – doublet of quartets
AB
ABX (AB)
Special Patterns:
Artificial – allows for the users to define coupling patterns explic-itly such as those in lysine in the example SBASE which are not true triplets, but exhibit strong coupling.
M – multiplet – defines any set of peaks that can’t be described as a defined coupling pattern or by ‘Artificial’. In the case that another pattern from another compound exists in the same re-gion, the defined multiplet will be extracted first and the remain-ing signal will be integrated.
R – region – integrates a region. It is only to be used when there is never any signals other than the one defined in the know-ledgebase.
o Coupling – measured coupling of line splitting
o Quant – whether or not the peak should be used for quantification
Assure – Raw Material Analysis Software
36
o Keep ratios – quantitation via deconvolution is done by maintaining the peak ratio within the splitting pattern. Ratio is defined from the spectrum of the purified compound.
o Details – active for artificial lineshape only. Allows definition of ratios
• 13C Quant
o Define peak properties as in 1H Quant
• Multiplet Identification
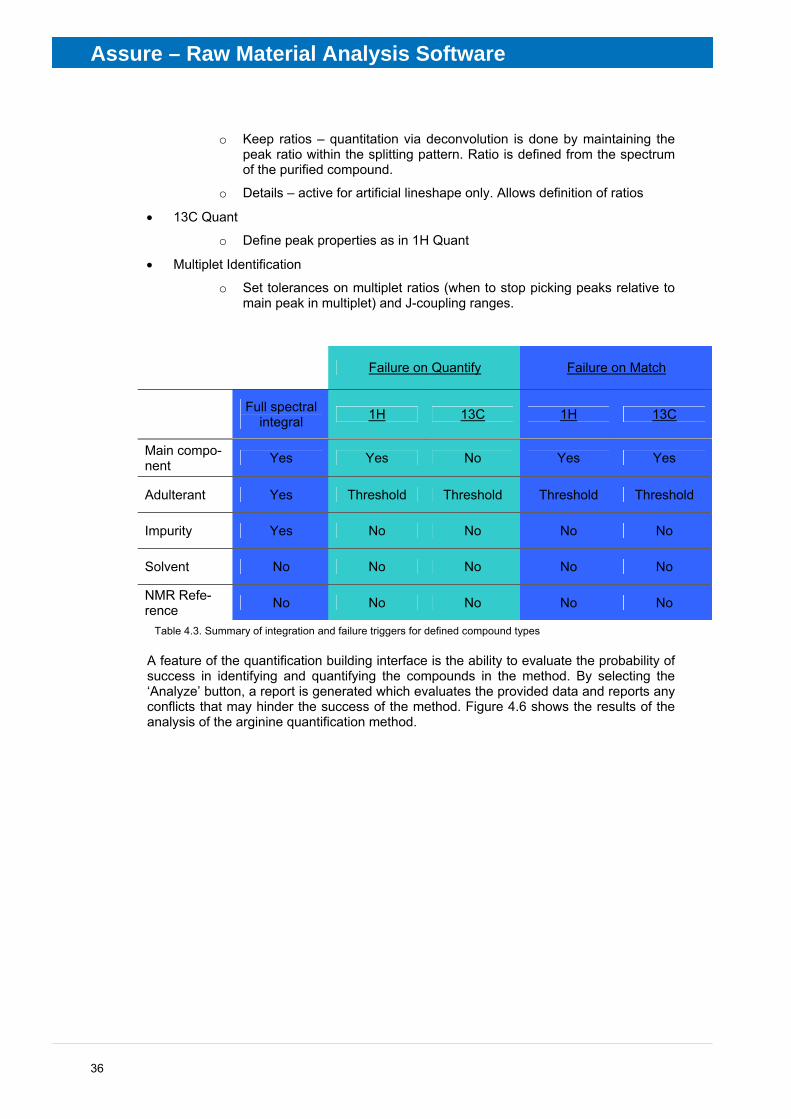
o Set tolerances on multiplet ratios (when to stop picking peaks relative to main peak in multiplet) and J-coupling ranges.
Failure on Quantify Failure on Match
Full spectral
integral 1H 13C 1H 13C
Main compo-nent Yes Yes No Yes Yes
Adulterant Yes Threshold Threshold Threshold Threshold
Impurity Yes No No No No
Solvent No No No No No
NMR Refe-rence No No No No No
Table 4.3. Summary of integration and failure triggers for defined compound types
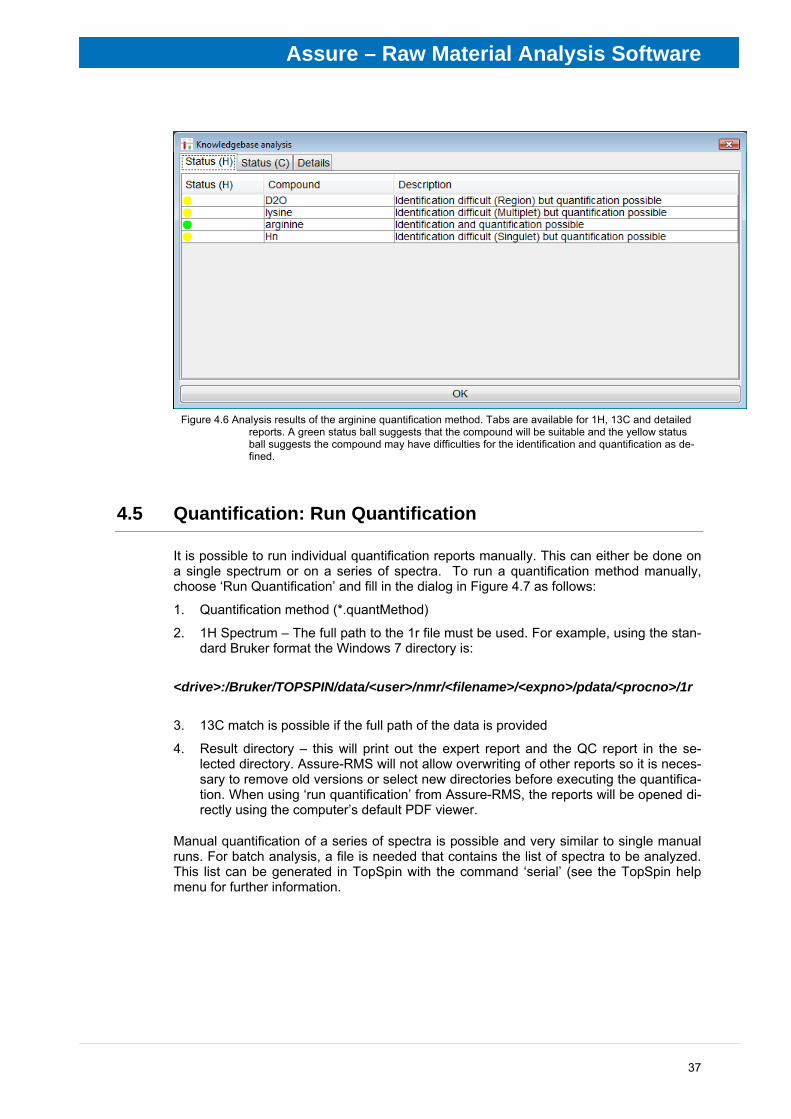
A feature of the quantification building interface is the ability to evaluate the probability of success in identifying and quantifying the compounds in the method. By selecting the ‘Analyze’ button, a report is generated which evaluates the provided data and reports any conflicts that may hinder the success of the method. Figure 4.6 shows the results of the analysis of the arginine quantification method.
Assure – Raw Material Analysis Software
37
Figure 4.6 Analysis results of the arginine quantification method. Tabs are available for 1H, 13C and detailed
reports. A green status ball suggests that the compound will be suitable and the yellow status ball suggests the compound may have difficulties for the identification and quantification as de-fined.
4.5 Quantification: Run Quantification
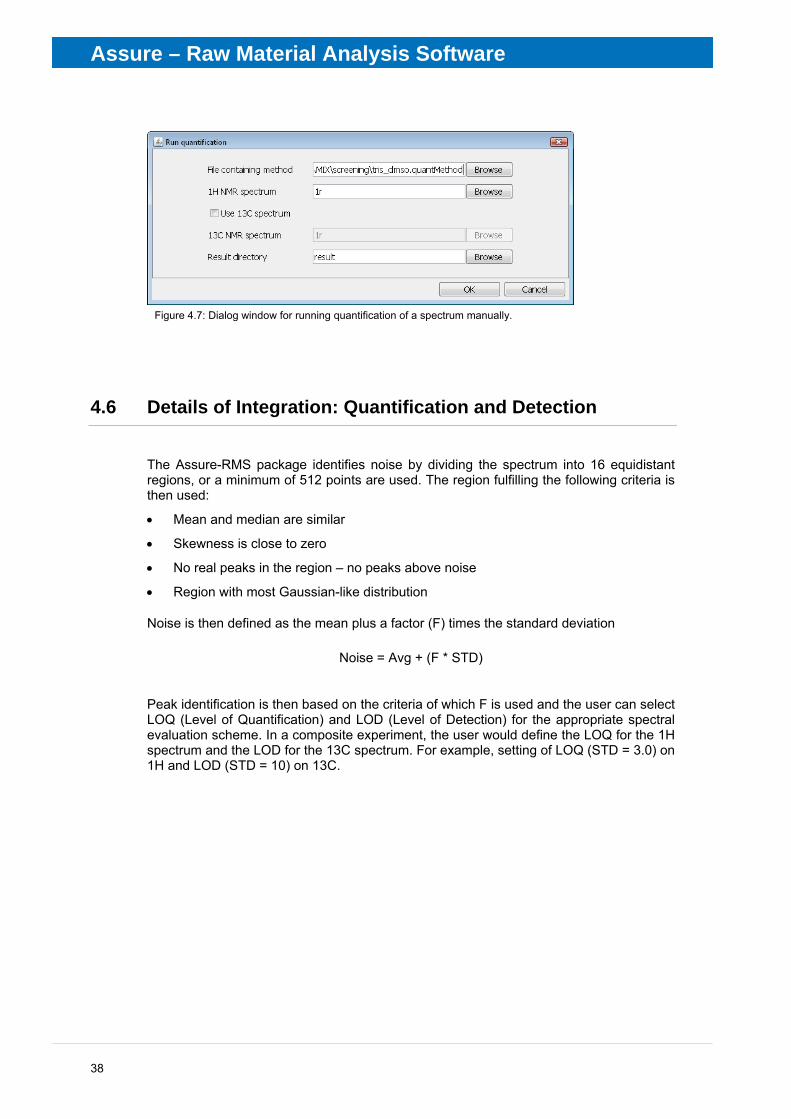
It is possible to run individual quantification reports manually. This can either be done on a single spectrum or on a series of spectra. To run a quantification method manually, choose ‘Run Quantification’ and fill in the dialog in Figure 4.7 as follows:
1. Quantification method (*.quantMethod)
2. 1H Spectrum – The full path to the 1r file must be used. For example, using the stan-dard Bruker format the Windows 7 directory is:
<drive>:/Bruker/TOPSPIN/data/<user>/nmr/<filename>/<expno>/pdata/<procno>/1r
3. 13C match is possible if the full path of the data is provided
4. Result directory – this will print out the expert report and the QC report in the se-lected directory. Assure-RMS will not allow overwriting of other reports so it is neces-sary to remove old versions or select new directories before executing the quantifica-tion. When using ‘run quantification’ from Assure-RMS, the reports will be opened di-rectly using the computer’s default PDF viewer.
Manual quantification of a series of spectra is possible and very similar to single manual runs. For batch analysis, a file is needed that contains the list of spectra to be analyzed. This list can be generated in TopSpin with the command ‘serial’ (see the TopSpin help menu for further information.
Assure – Raw Material Analysis Software
38
Figure 4.7: Dialog window for running quantification of a spectrum manually.
4.6 Details of Integration: Quantification and Detection
The Assure-RMS package identifies noise by dividing the spectrum into 16 equidistant regions, or a minimum of 512 points are used. The region fulfilling the following criteria is then used:
• Mean and median are similar
• Skewness is close to zero
• No real peaks in the region – no peaks above noise
• Region with most Gaussian-like distribution
Noise is then defined as the mean plus a factor (F) times the standard deviation
Noise = Avg + (F * STD)
Peak identification is then based on the criteria of which F is used and the user can select LOQ (Level of Quantification) and LOD (Level of Detection) for the appropriate spectral evaluation scheme. In a composite experiment, the user would define the LOQ for the 1H spectrum and the LOD for the 13C spectrum. For example, setting of LOQ (STD = 3.0) on 1H and LOD (STD = 10) on 13C.
39
5 TOPSPIN, IconNMR, and As-sure-RMS in Automation There are three levels of user interface to TopSpin configuration and commands: NMR Superuser, NMR User, and access-restricted accounts. The first two users and groups are set at the TopSpin install. In order to activate the access-limited user, a default user should be created on the computer. The examples illustrated here use the user ‘QCuser’ as the access-limited user.
The Assure-RMS software is designed to be used in a production facility with primary op-erators who are unfamiliar with the operation of a NMR spectrometer. For this reason, the software is designed to utilize two levels of users (1) QCUser and (2) NMR Superuser and/or NMR User. The QCuser may be configured to have minimal access to software functions while the NMR Superuser has broad access to NMR software functions. Details on additional files and directories where the QCuser should not have access are found in chapter 6.
5.1 Starting TOPSPIN
TopSpin configuration must be done as NMR Superuser. TopSpin is started using the desktop IconNMR.
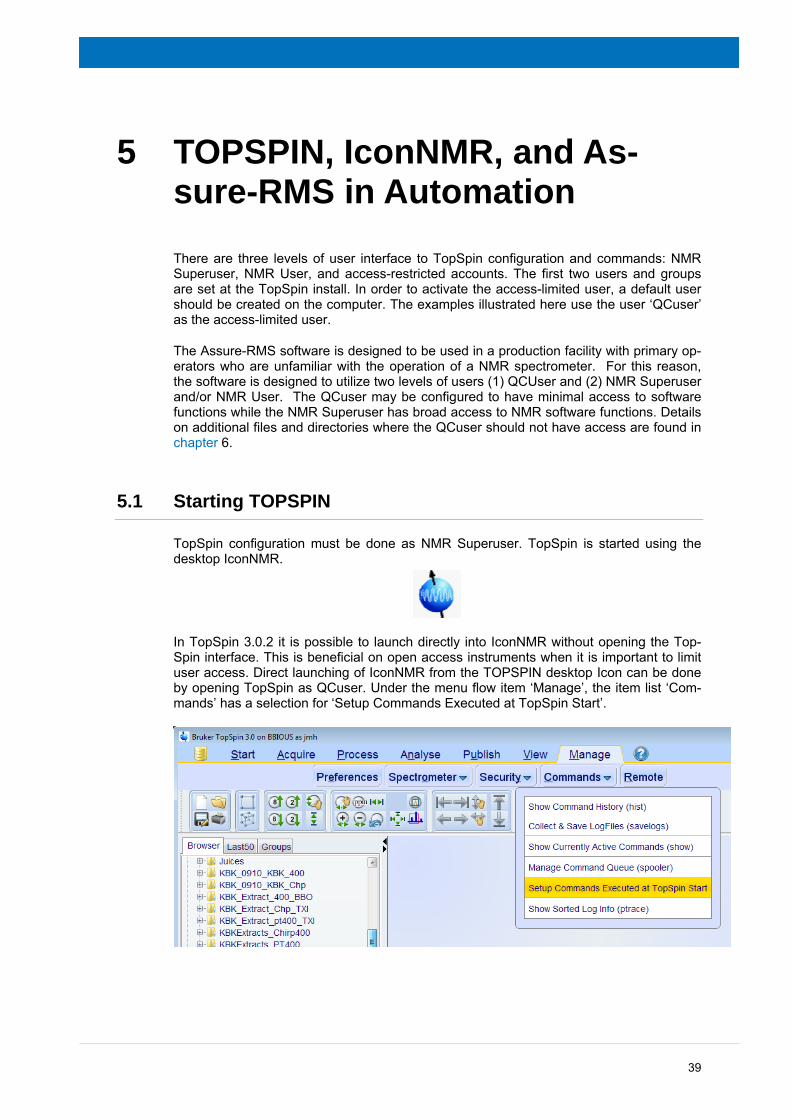
In TopSpin 3.0.2 it is possible to launch directly into IconNMR without opening the Top-Spin interface. This is beneficial on open access instruments when it is important to limit user access. Direct launching of IconNMR from the TOPSPIN desktop Icon can be done by opening TopSpin as QCuser. Under the menu flow item ‘Manage’, the item list ‘Com-mands’ has a selection for ‘Setup Commands Executed at TopSpin Start’.

Example Log Files and Reports
40
This will open a text file where the line ‘icona’ can be added. Upon closing TopSpin and then double-clicking the TopSpin Icon, TopSpin will open in the background and IconNMR will open in the foreground.
5.2 GLP Requirement
GLP software package is not required to be installed for the Assure-RMS software. Addi-tional GLP configuration of the report layout can be done. Instructions can be found in the GLP manual or by typing ‘help glp’ in the TopSpin command line.
Although components of the GLP package are used, the default installation and a suc-cessful System Suitability Test is not a de facto GLP validation. In order for the instru-ment to be brought to full GLP compliance, contact Bruker to arrange for instrument vali-dation by a certified GLP engineer.
5.3 IconNMR Configuration
The purpose of this section is to cover only Assure-RMS relevant settings within IconNMR. More detailed instructions on all of the tools within IconNMR are covered in the automation Setup or Reference Manuals and can be found in the IconNMR help menu.
IconNMR configuration can only be accessed with the NMR Superuser’s password. This is a security feature which prevents users from altering instrument functions. The configu-ration window can be accessed by typing ‘iconc’ into the TopSpin command prompt line.
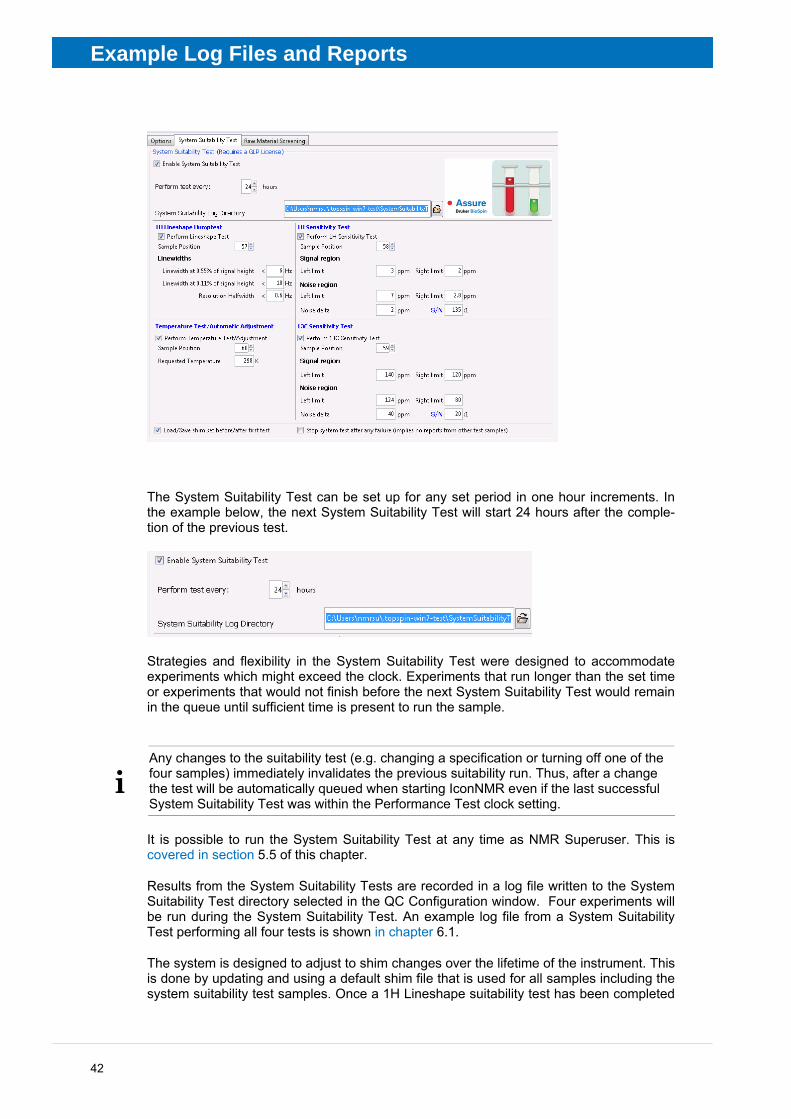
5.3.1 ‘Assure System’
After the Assure-RMS software is installed, the IconNMR Configuration window contains an additional setting for ‘Assure System’. The ‘Assure System’ allows the system admin-istrator to define (1) options, (2) the system suitability tests, and (3) screening method.
Example Log Files and Reports
41
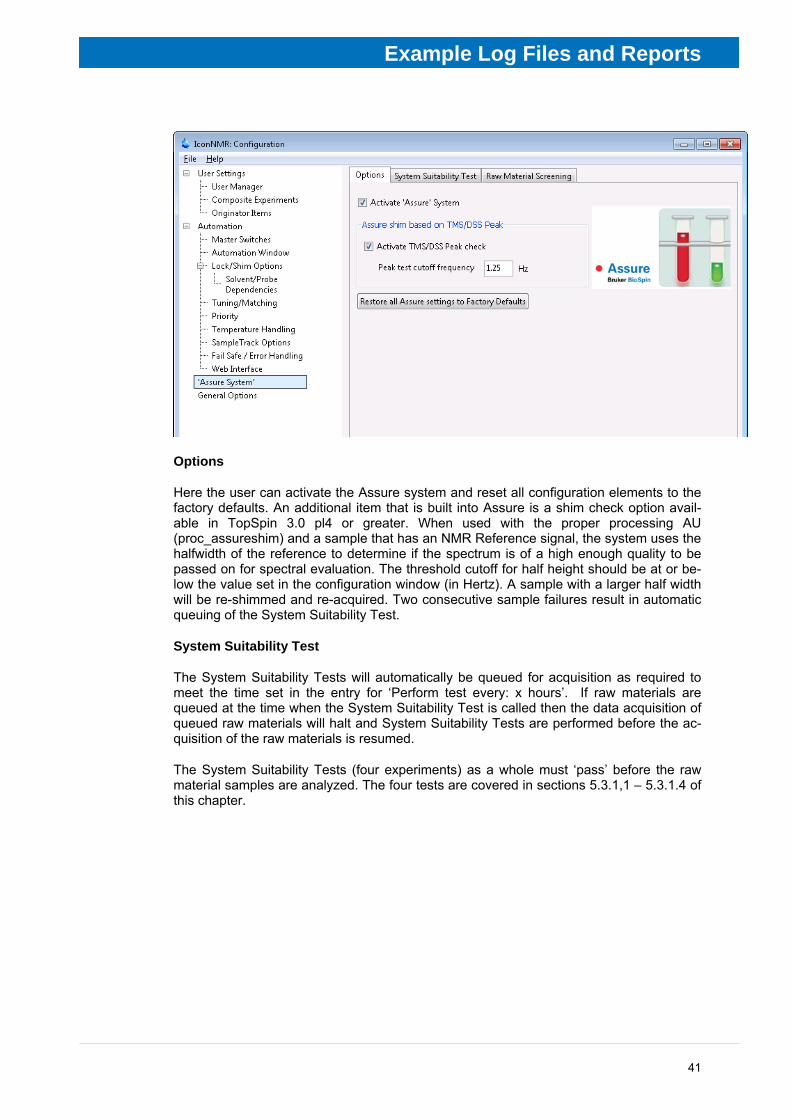
Options
Here the user can activate the Assure system and reset all configuration elements to the factory defaults. An additional item that is built into Assure is a shim check option avail-able in TopSpin 3.0 pl4 or greater. When used with the proper processing AU (proc_assureshim) and a sample that has an NMR Reference signal, the system uses the halfwidth of the reference to determine if the spectrum is of a high enough quality to be passed on for spectral evaluation. The threshold cutoff for half height should be at or be-low the value set in the configuration window (in Hertz). A sample with a larger half width will be re-shimmed and re-acquired. Two consecutive sample failures result in automatic queuing of the System Suitability Test.
System Suitability Test
The System Suitability Tests will automatically be queued for acquisition as required to meet the time set in the entry for ‘Perform test every: x hours’. If raw materials are queued at the time when the System Suitability Test is called then the data acquisition of queued raw materials will halt and System Suitability Tests are performed before the ac-quisition of the raw materials is resumed.
The System Suitability Tests (four experiments) as a whole must ‘pass’ before the raw material samples are analyzed. The four tests are covered in sections 5.3.1,1 – 5.3.1.4 of this chapter.
Example Log Files and Reports
42
The System Suitability Test can be set up for any set period in one hour increments. In the example below, the next System Suitability Test will start 24 hours after the comple-tion of the previous test.
Strategies and flexibility in the System Suitability Test were designed to accommodate experiments which might exceed the clock. Experiments that run longer than the set time or experiments that would not finish before the next System Suitability Test would remain in the queue until sufficient time is present to run the sample.
It is possible to run the System Suitability Test at any time as NMR Superuser. This is covered in section 5.5 of this chapter.
Results from the System Suitability Tests are recorded in a log file written to the System Suitability Test directory selected in the QC Configuration window. Four experiments will be run during the System Suitability Test. An example log file from a System Suitability Test performing all four tests is shown in chapter 6.1.
The system is designed to adjust to shim changes over the lifetime of the instrument. This is done by updating and using a default shim file that is used for all samples including the system suitability test samples. Once a 1H Lineshape suitability test has been completed
i Any changes to the suitability test (e.g. changing a specification or turning off one of the four samples) immediately invalidates the previous suitability run. Thus, after a change the test will be automatically queued when starting IconNMR even if the last successful System Suitability Test was within the Performance Test clock setting.
Example Log Files and Reports
43
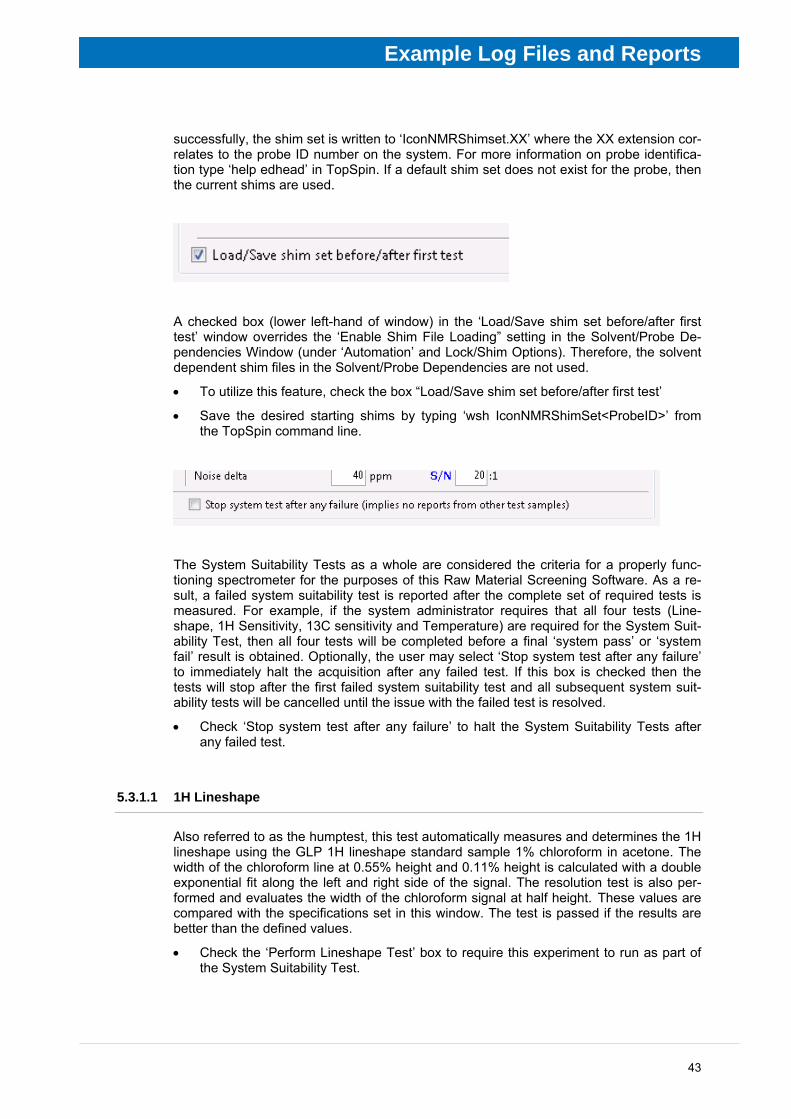
successfully, the shim set is written to ‘IconNMRShimset.XX’ where the XX extension cor-relates to the probe ID number on the system. For more information on probe identifica-tion type ‘help edhead’ in TopSpin. If a default shim set does not exist for the probe, then the current shims are used.
A checked box (lower left-hand of window) in the ‘Load/Save shim set before/after first test’ window overrides the ‘Enable Shim File Loading” setting in the Solvent/Probe De-pendencies Window (under ‘Automation’ and Lock/Shim Options). Therefore, the solvent dependent shim files in the Solvent/Probe Dependencies are not used.
• To utilize this feature, check the box “Load/Save shim set before/after first test’
• Save the desired starting shims by typing ‘wsh IconNMRShimSet<ProbeID>’ from the TopSpin command line.
The System Suitability Tests as a whole are considered the criteria for a properly func-tioning spectrometer for the purposes of this Raw Material Screening Software. As a re-sult, a failed system suitability test is reported after the complete set of required tests is measured. For example, if the system administrator requires that all four tests (Line-shape, 1H Sensitivity, 13C sensitivity and Temperature) are required for the System Suit-ability Test, then all four tests will be completed before a final ‘system pass’ or ‘system fail’ result is obtained. Optionally, the user may select ‘Stop system test after any failure’ to immediately halt the acquisition after any failed test. If this box is checked then the tests will stop after the first failed system suitability test and all subsequent system suit-ability tests will be cancelled until the issue with the failed test is resolved.
• Check ‘Stop system test after any failure’ to halt the System Suitability Tests after any failed test.
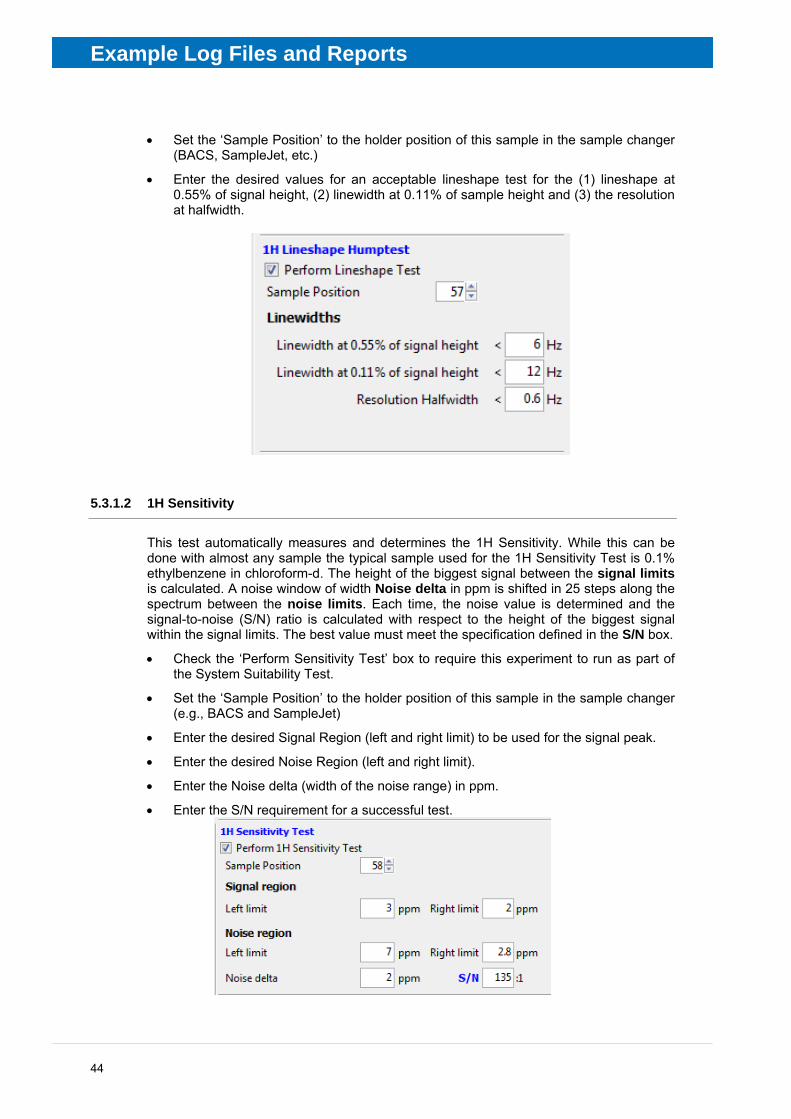
5.3.1.1 1H Lineshape
Also referred to as the humptest, this test automatically measures and determines the 1H lineshape using the GLP 1H lineshape standard sample 1% chloroform in acetone. The width of the chloroform line at 0.55% height and 0.11% height is calculated with a double exponential fit along the left and right side of the signal. The resolution test is also per-formed and evaluates the width of the chloroform signal at half height. These values are compared with the specifications set in this window. The test is passed if the results are better than the defined values.
• Check the ‘Perform Lineshape Test’ box to require this experiment to run as part of the System Suitability Test.
Example Log Files and Reports
44
• Set the ‘Sample Position’ to the holder position of this sample in the sample changer (BACS, SampleJet, etc.)
• Enter the desired values for an acceptable lineshape test for the (1) lineshape at 0.55% of signal height, (2) linewidth at 0.11% of sample height and (3) the resolution at halfwidth.
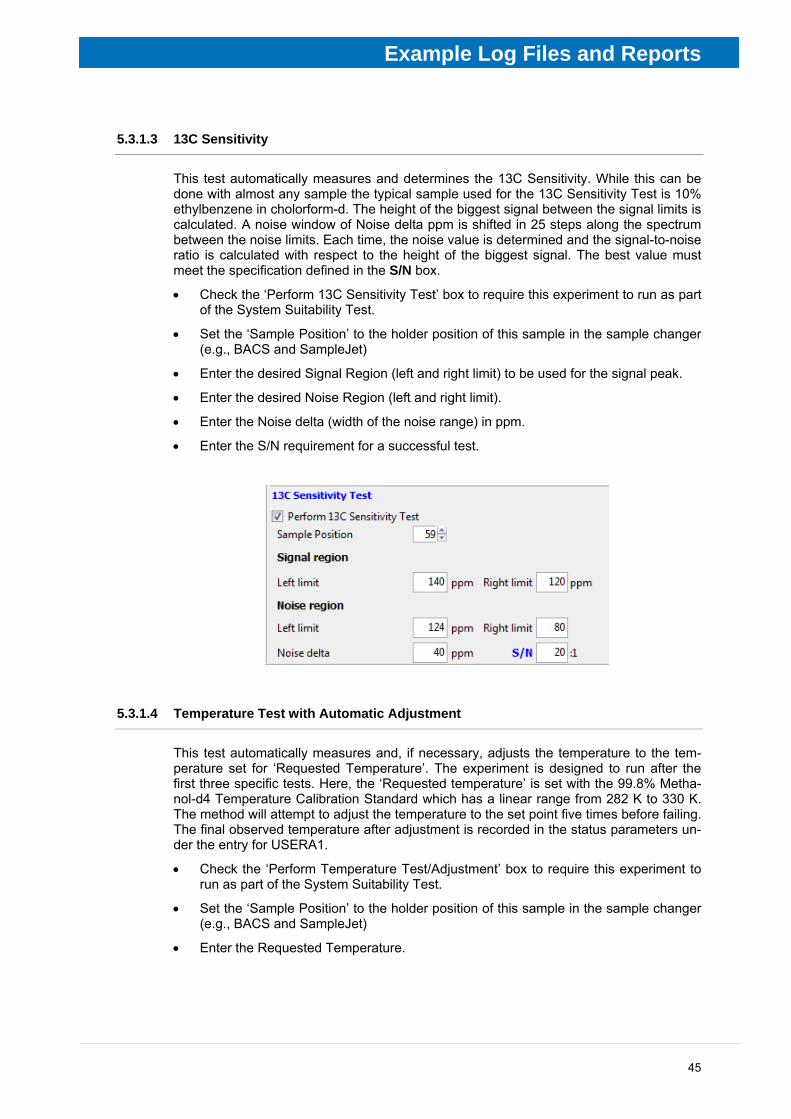
5.3.1.2 1H Sensitivity
This test automatically measures and determines the 1H Sensitivity. While this can be done with almost any sample the typical sample used for the 1H Sensitivity Test is 0.1% ethylbenzene in chloroform-d. The height of the biggest signal between the signal limits is calculated. A noise window of width Noise delta in ppm is shifted in 25 steps along the spectrum between the noise limits. Each time, the noise value is determined and the signal-to-noise (S/N) ratio is calculated with respect to the height of the biggest signal within the signal limits. The best value must meet the specification defined in the S/N box.
• Check the ‘Perform Sensitivity Test’ box to require this experiment to run as part of the System Suitability Test.
• Set the ‘Sample Position’ to the holder position of this sample in the sample changer (e.g., BACS and SampleJet)
• Enter the desired Signal Region (left and right limit) to be used for the signal peak.
• Enter the desired Noise Region (left and right limit).
• Enter the Noise delta (width of the noise range) in ppm.
• Enter the S/N requirement for a successful test.
Example Log Files and Reports
45
5.3.1.3 13C Sensitivity
This test automatically measures and determines the 13C Sensitivity. While this can be done with almost any sample the typical sample used for the 13C Sensitivity Test is 10% ethylbenzene in cholorform-d. The height of the biggest signal between the signal limits is calculated. A noise window of Noise delta ppm is shifted in 25 steps along the spectrum between the noise limits. Each time, the noise value is determined and the signal-to-noise ratio is calculated with respect to the height of the biggest signal. The best value must meet the specification defined in the S/N box.
• Check the ‘Perform 13C Sensitivity Test’ box to require this experiment to run as part of the System Suitability Test.
• Set the ‘Sample Position’ to the holder position of this sample in the sample changer (e.g., BACS and SampleJet)
• Enter the desired Signal Region (left and right limit) to be used for the signal peak.
• Enter the desired Noise Region (left and right limit).
• Enter the Noise delta (width of the noise range) in ppm.
• Enter the S/N requirement for a successful test.
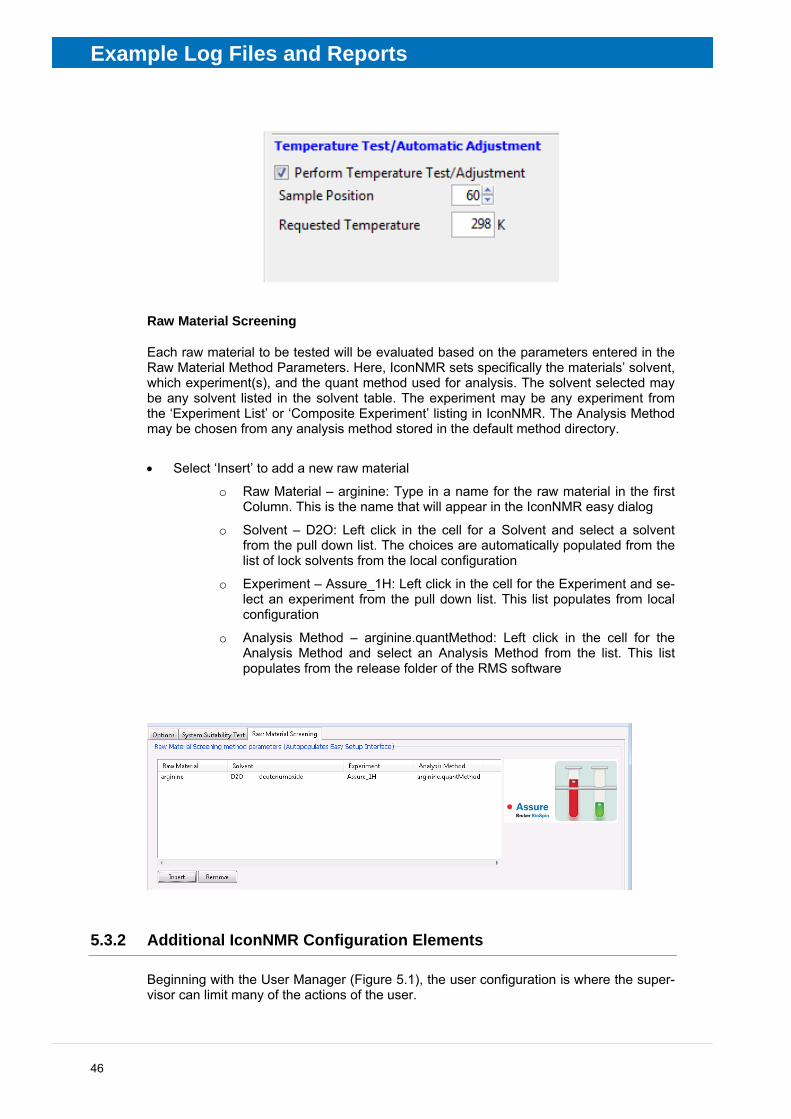
5.3.1.4 Temperature Test with Automatic Adjustment
This test automatically measures and, if necessary, adjusts the temperature to the tem-perature set for ‘Requested Temperature’. The experiment is designed to run after the first three specific tests. Here, the ‘Requested temperature’ is set with the 99.8% Metha-nol-d4 Temperature Calibration Standard which has a linear range from 282 K to 330 K. The method will attempt to adjust the temperature to the set point five times before failing. The final observed temperature after adjustment is recorded in the status parameters un-der the entry for USERA1.
• Check the ‘Perform Temperature Test/Adjustment’ box to require this experiment to run as part of the System Suitability Test.
• Set the ‘Sample Position’ to the holder position of this sample in the sample changer (e.g., BACS and SampleJet)
• Enter the Requested Temperature.
Example Log Files and Reports
46
Raw Material Screening
Each raw material to be tested will be evaluated based on the parameters entered in the Raw Material Method Parameters. Here, IconNMR sets specifically the materials’ solvent, which experiment(s), and the quant method used for analysis. The solvent selected may be any solvent listed in the solvent table. The experiment may be any experiment from the ‘Experiment List’ or ‘Composite Experiment’ listing in IconNMR. The Analysis Method may be chosen from any analysis method stored in the default method directory.
• Select ‘Insert’ to add a new raw material
o Raw Material – arginine: Type in a name for the raw material in the first Column. This is the name that will appear in the IconNMR easy dialog
o Solvent – D2O: Left click in the cell for a Solvent and select a solvent from the pull down list. The choices are automatically populated from the list of lock solvents from the local configuration
o Experiment – Assure_1H: Left click in the cell for the Experiment and se-lect an experiment from the pull down list. This list populates from local configuration
o Analysis Method – arginine.quantMethod: Left click in the cell for the Analysis Method and select an Analysis Method from the list. This list populates from the release folder of the RMS software
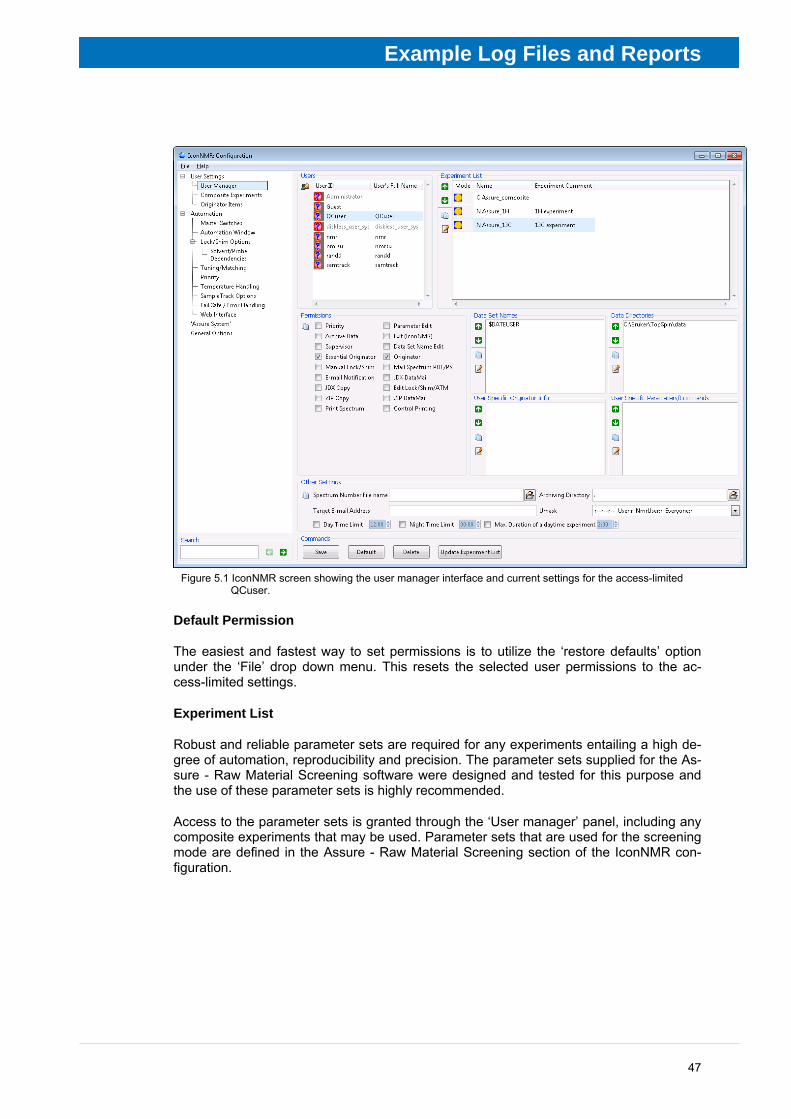
5.3.2 Additional IconNMR Configuration Elements
Beginning with the User Manager (Figure 5.1), the user configuration is where the super-visor can limit many of the actions of the user.
Example Log Files and Reports
47
Figure 5.1 IconNMR screen showing the user manager interface and current settings for the access-limited
QCuser.
Default Permission
The easiest and fastest way to set permissions is to utilize the ‘restore defaults’ option under the ‘File’ drop down menu. This resets the selected user permissions to the ac-cess-limited settings.
Experiment List
Robust and reliable parameter sets are required for any experiments entailing a high de-gree of automation, reproducibility and precision. The parameter sets supplied for the As-sure - Raw Material Screening software were designed and tested for this purpose and the use of these parameter sets is highly recommended.
Access to the parameter sets is granted through the ‘User manager’ panel, including any composite experiments that may be used. Parameter sets that are used for the screening mode are defined in the Assure - Raw Material Screening section of the IconNMR con-figuration.
Example Log Files and Reports
48
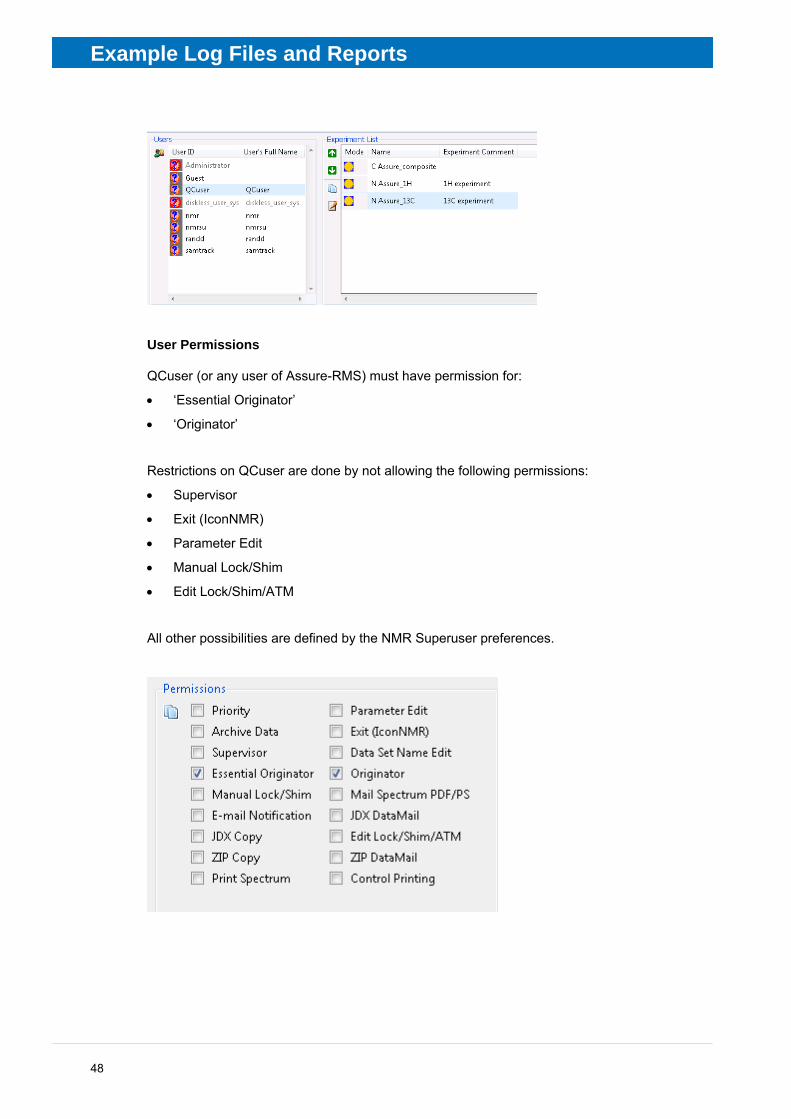
User Permissions
QCuser (or any user of Assure-RMS) must have permission for:
• ‘Essential Originator’
• ‘Originator’
Restrictions on QCuser are done by not allowing the following permissions:
• Supervisor
• Exit (IconNMR)
• Parameter Edit
• Manual Lock/Shim
• Edit Lock/Shim/ATM
All other possibilities are defined by the NMR Superuser preferences.
Example Log Files and Reports
49
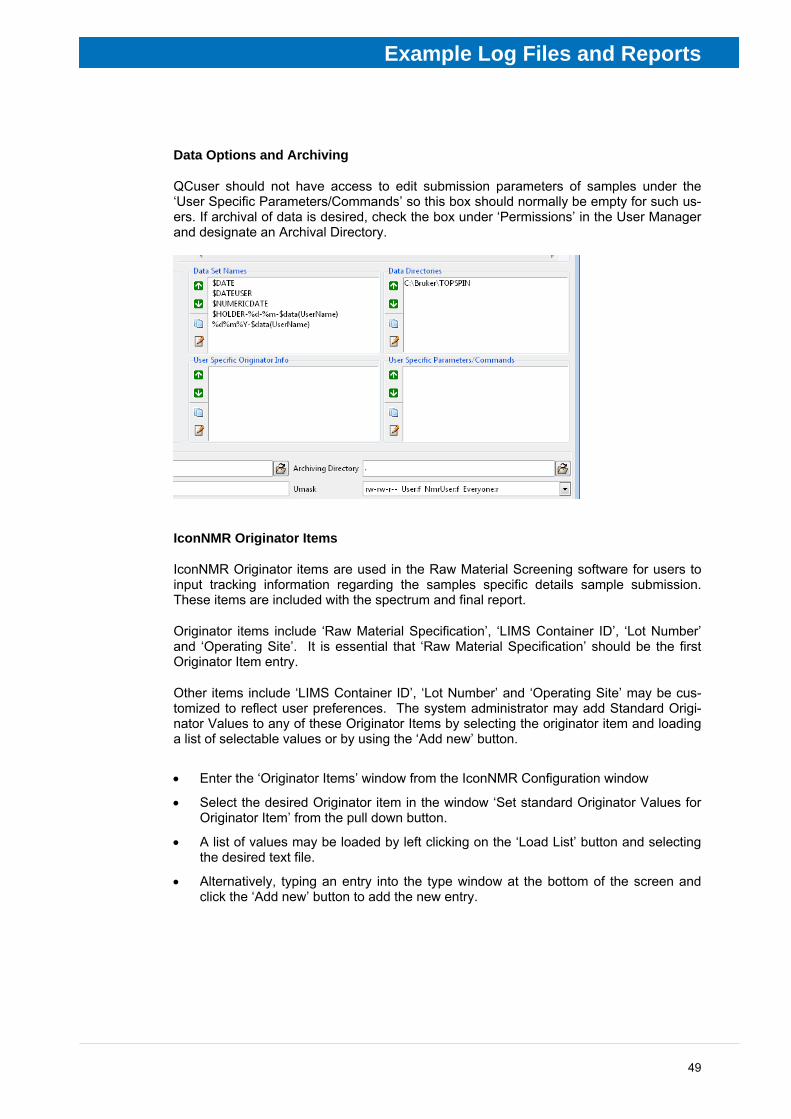
Data Options and Archiving
QCuser should not have access to edit submission parameters of samples under the ‘User Specific Parameters/Commands’ so this box should normally be empty for such us-ers. If archival of data is desired, check the box under ‘Permissions’ in the User Manager and designate an Archival Directory.
IconNMR Originator Items
IconNMR Originator items are used in the Raw Material Screening software for users to input tracking information regarding the samples specific details sample submission. These items are included with the spectrum and final report.
Originator items include ‘Raw Material Specification’, ‘LIMS Container ID’, ‘Lot Number’ and ‘Operating Site’. It is essential that ‘Raw Material Specification’ should be the first Originator Item entry.
Other items include ‘LIMS Container ID’, ‘Lot Number’ and ‘Operating Site’ may be cus-tomized to reflect user preferences. The system administrator may add Standard Origi-nator Values to any of these Originator Items by selecting the originator item and loading a list of selectable values or by using the ‘Add new’ button.
• Enter the ‘Originator Items’ window from the IconNMR Configuration window
• Select the desired Originator item in the window ‘Set standard Originator Values for Originator Item’ from the pull down button.
• A list of values may be loaded by left clicking on the ‘Load List’ button and selecting the desired text file.
• Alternatively, typing an entry into the type window at the bottom of the screen and click the ‘Add new’ button to add the new entry.

Example Log Files and Reports
50
Configuring the Master Switches
Additional configurations used in the Assure-RMS package are found in the Automation Window of IconNMR Configuration.
• Enter the IconNMR Configuration window
• Select ‘Master Switches’
• Turn on ‘Eject last sample in queue’.
• Turn off ‘Never Rotate the Sample’
• Turn on ‘Start run at user login’
Example Log Files and Reports
51
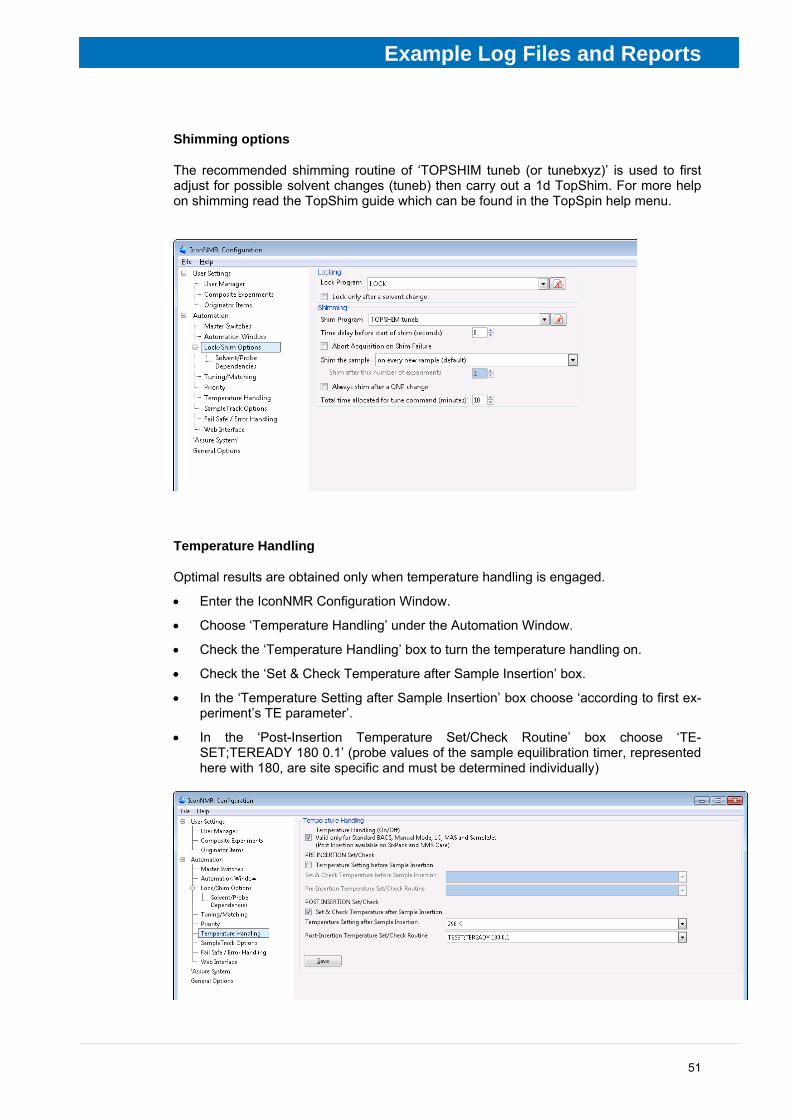
Shimming options
The recommended shimming routine of ‘TOPSHIM tuneb (or tunebxyz)’ is used to first adjust for possible solvent changes (tuneb) then carry out a 1d TopShim. For more help on shimming read the TopShim guide which can be found in the TopSpin help menu.
Temperature Handling
Optimal results are obtained only when temperature handling is engaged.
• Enter the IconNMR Configuration Window.
• Choose ‘Temperature Handling’ under the Automation Window.
• Check the ‘Temperature Handling’ box to turn the temperature handling on.
• Check the ‘Set & Check Temperature after Sample Insertion’ box.
• In the ‘Temperature Setting after Sample Insertion’ box choose ‘according to first ex-periment’s TE parameter’.
• In the ‘Post-Insertion Temperature Set/Check Routine’ box choose ‘TE-SET;TEREADY 180 0.1’ (probe values of the sample equilibration timer, represented here with 180, are site specific and must be determined individually)

Example Log Files and Reports
52
5.4 Running IconNMR: Access-Limited User
Screening Samples using Assure-RMS Screening Software
When the QCuser starts TopSpin 3.0 while logged onto the computer as QCuser the fol-lowing user interface will appear. The System Suitability Tests automatically populates the Experiment Queue and are listed according to holder number. If the System Suitabil-ity Test is expired according to the settings in the QC configuration window then acquisi-tion will begin immediately on the System Suitability Test. The QCuser may enter raw ma-terials for testing without waiting for the System Suitability Test to finish.
Figure 5.2 QCuser window interface.
Notice that several of the traditional choices of IconNMR are not accessible to the QCuser, such as stopping the system, canceling or deleting experiments. Details on setting the permissions for an access-limited user are covered in chapter 6.5.
The purpose of the QCuser is for submitting samples only. This is by design to keep the user from changing conditions important to the automation run in a GLP environment. Similarly, the QCuser has limited access to the functions in the TopSpin interface.
The only means to stop the automation is to use the ‘Change User’ IconNMR. This will allow the NMR Superuser to logon and change the run as needed.

Example Log Files and Reports
53
Submitting a Sample
To submit samples, the QCuser only needs to complete Step 1-4 of the Assure-RMS Automation window. IconNMR will prompt the QCuser for which placeholder the sample will go into in step 4
Submit samples to queue
• Step 1. Sample Fundamentals: Select a ‘Traceable Raw Data Filename’ from the pull down menu
• Step 2. Sample Details:
1. Enter a ‘Raw Material Specification’ from the pull down menu
2. Enter a ‘LIMS Container ID’ number
3. Enter a ‘Lot Number’
4. Enter a ‘Operating Site’ from the pull down menu
• Step 3. Click on ‘Queue Experiment’
• Step 4. Place the sample in the holder as instructed by the software
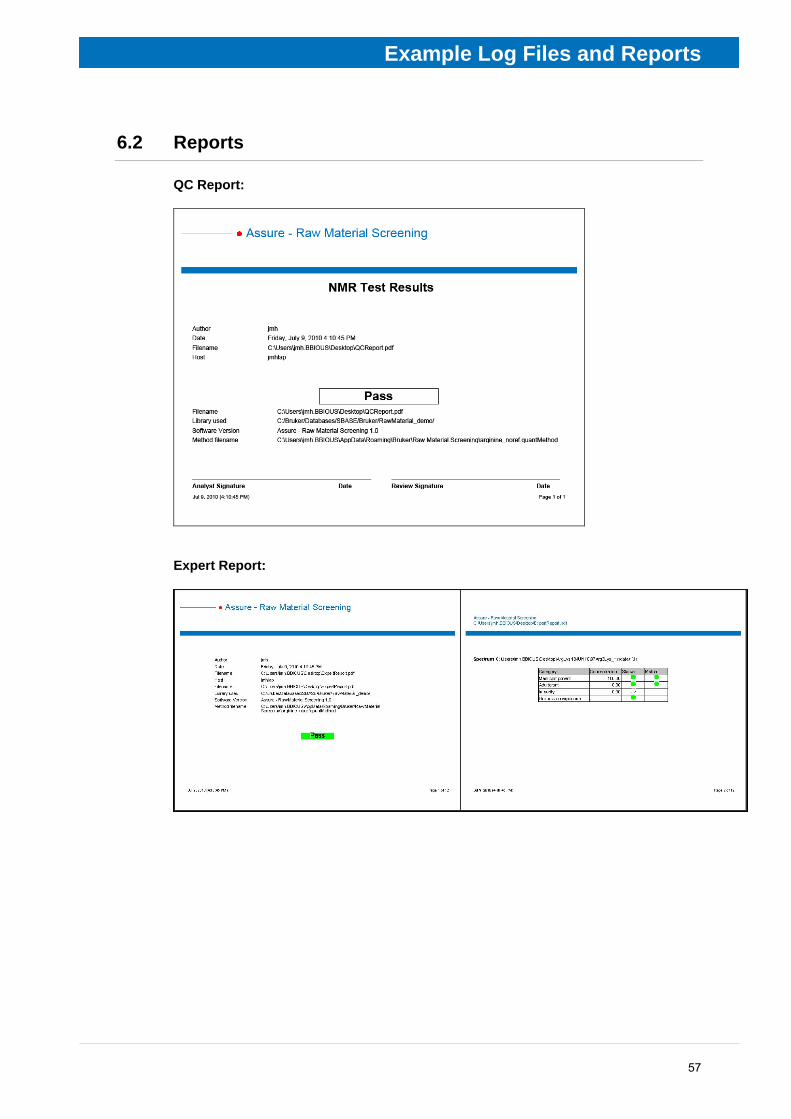
Data is acquired and processed automatically on each sample in the queue. The data is analyzed in the background using Assure-RMS and once the analysis is complete two reports are generated including a (1) QC Report and a (2) Expert Report. Examples of each of these reports are in chapter 6.2. The reports indicate a ‘pass’ or ‘fail’ for the raw material screened.
Example Log Files and Reports
54
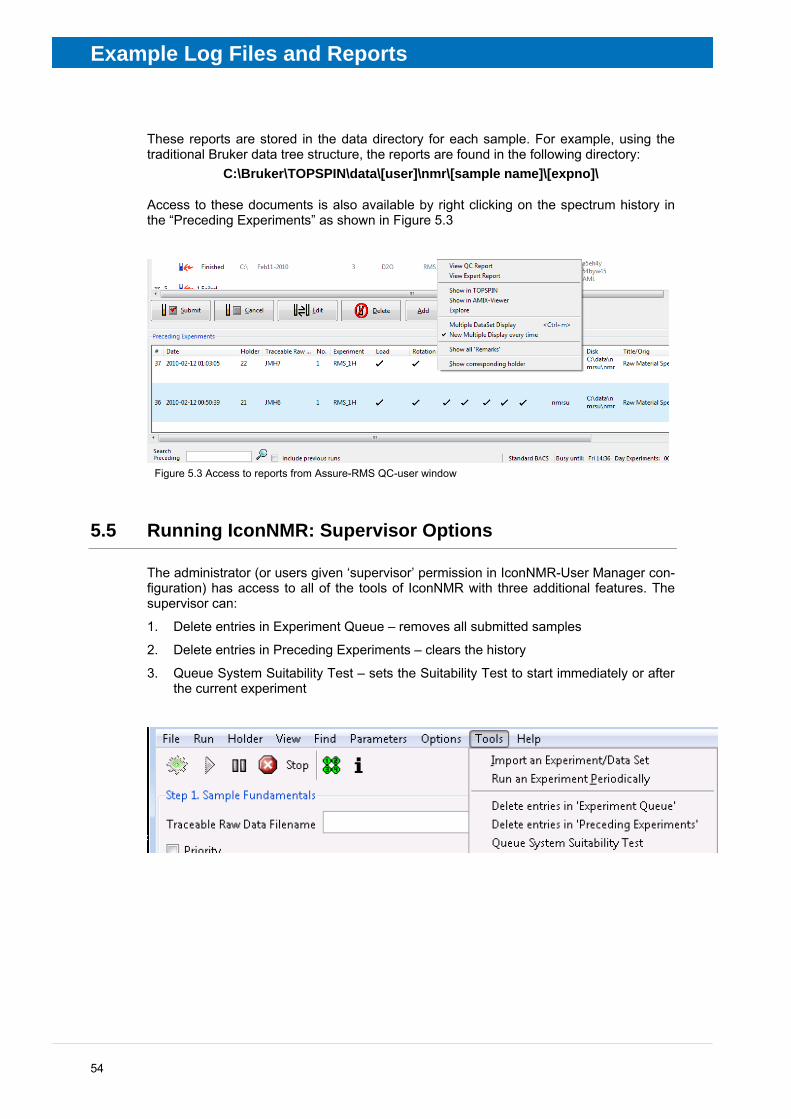
These reports are stored in the data directory for each sample. For example, using the traditional Bruker data tree structure, the reports are found in the following directory:
C:\Bruker\TOPSPIN\data\[user]\nmr\[sample name]\[expno]\
Access to these documents is also available by right clicking on the spectrum history in the “Preceding Experiments” as shown in Figure 5.3
Figure 5.3 Access to reports from Assure-RMS QC-user window
5.5 Running IconNMR: Supervisor Options
The administrator (or users given ‘supervisor’ permission in IconNMR-User Manager con-figuration) has access to all of the tools of IconNMR with three additional features. The supervisor can:
1. Delete entries in Experiment Queue – removes all submitted samples
2. Delete entries in Preceding Experiments – clears the history
3. Queue System Suitability Test – sets the Suitability Test to start immediately or after the current experiment

Example Log Files and Reports
55
Batch Submission
Submitting samples from a spreadsheet in the application independent, comma sepa-rated files (csv) format can be done from the File drop down menu. Chapter 6.4 contains an example csv file for submission. The format for filling the dialogs is shown below:
Figure 5.4 Loading setup from csv file
Example Log Files and Reports
56
6 Example Log Files and Reports
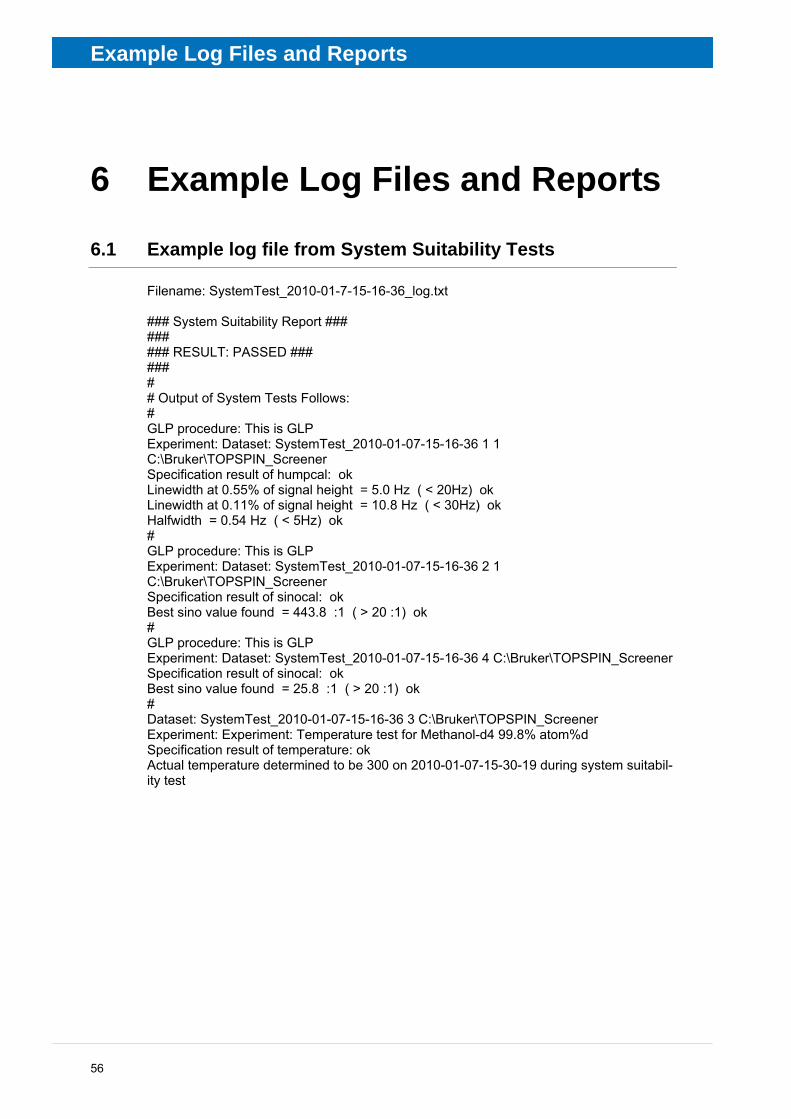
6.1 Example log file from System Suitability Tests
Filename: SystemTest_2010-01-7-15-16-36_log.txt ### System Suitability Report ### ### ### RESULT: PASSED ### ### # # Output of System Tests Follows: # GLP procedure: This is GLP Experiment: Dataset: SystemTest_2010-01-07-15-16-36 1 1 C:\Bruker\TOPSPIN_Screener Specification result of humpcal: ok Linewidth at 0.55% of signal height = 5.0 Hz ( < 20Hz) ok Linewidth at 0.11% of signal height = 10.8 Hz ( < 30Hz) ok Halfwidth = 0.54 Hz ( < 5Hz) ok # GLP procedure: This is GLP Experiment: Dataset: SystemTest_2010-01-07-15-16-36 2 1 C:\Bruker\TOPSPIN_Screener Specification result of sinocal: ok Best sino value found = 443.8 :1 ( > 20 :1) ok # GLP procedure: This is GLP Experiment: Dataset: SystemTest_2010-01-07-15-16-36 4 C:\Bruker\TOPSPIN_Screener Specification result of sinocal: ok Best sino value found = 25.8 :1 ( > 20 :1) ok # Dataset: SystemTest_2010-01-07-15-16-36 3 C:\Bruker\TOPSPIN_Screener Experiment: Experiment: Temperature test for Methanol-d4 99.8% atom%d Specification result of temperature: ok Actual temperature determined to be 300 on 2010-01-07-15-30-19 during system suitabil-ity test
Example Log Files and Reports
57
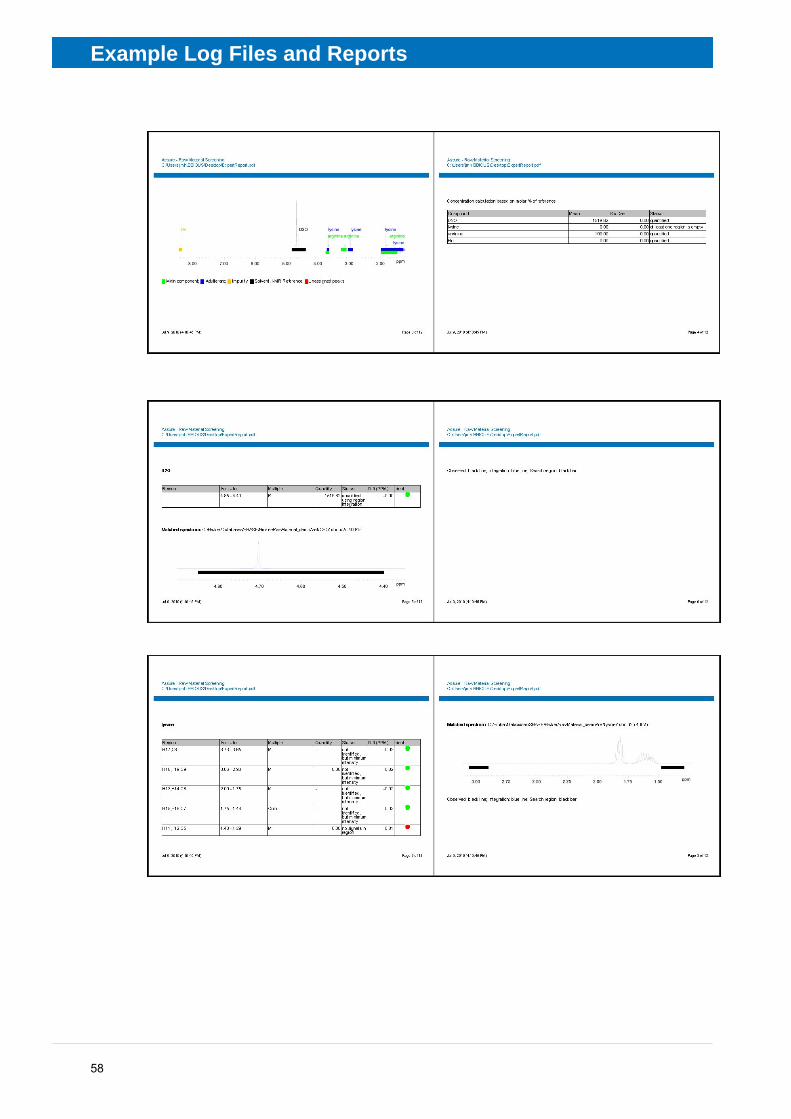
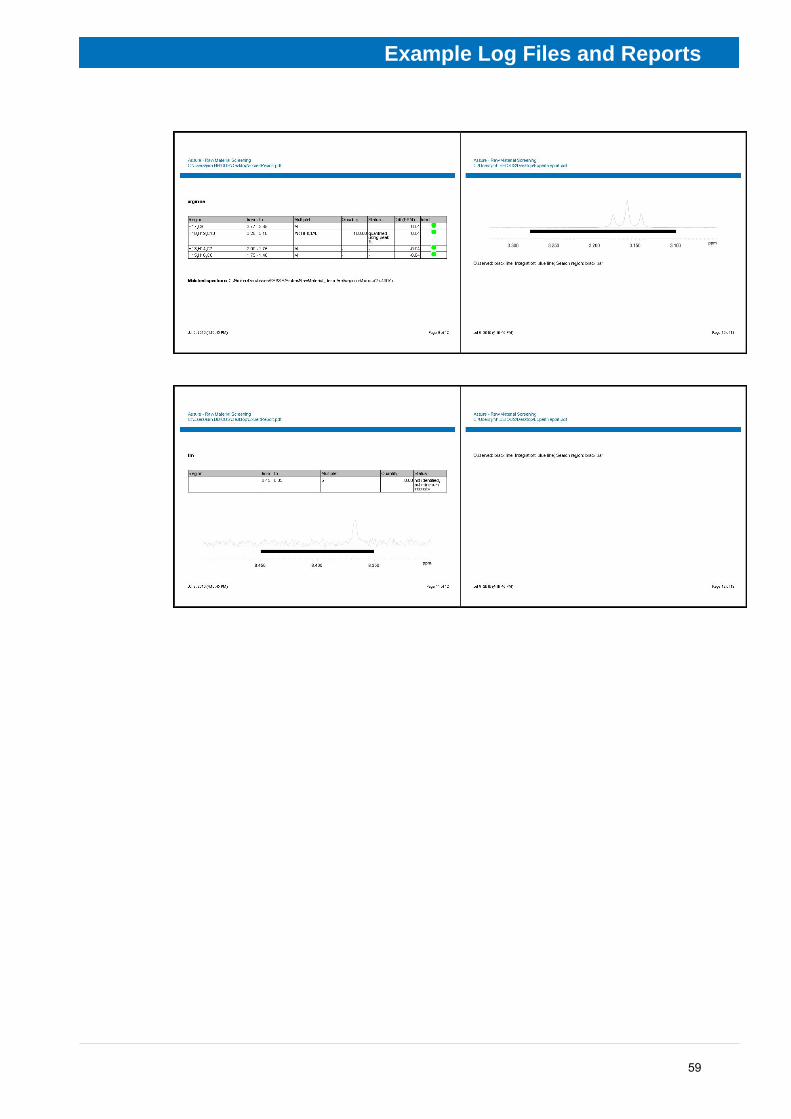
6.2 Reports
QC Report:
Expert Report:
Example Log Files and Reports
58
Example Log Files and Reports
59

Example Log Files and Reports
60
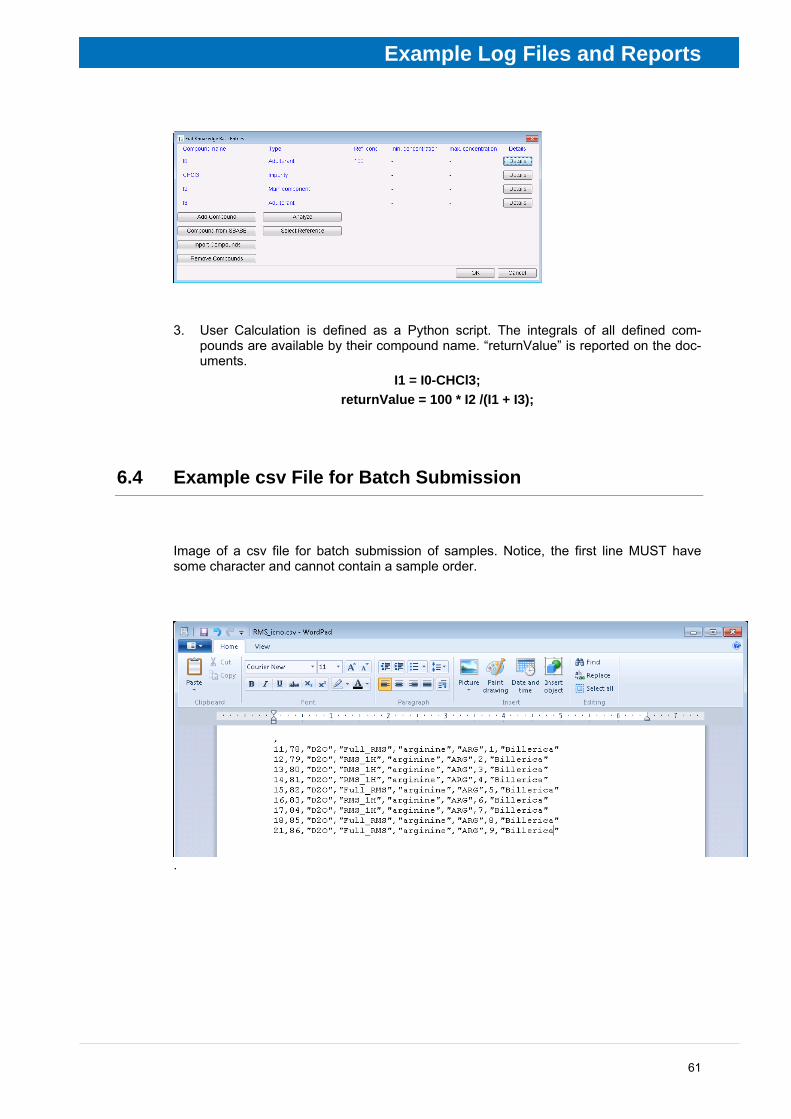
6.3 User Defined Integration Routine
The images here illustrate the settings of the user defined integration routine. Here, the method reflects the screening of tire rubber set by ISO 21461. It determines the aromatic-ity of oil in rubber components according to the following equation:
( ) 100%8.52.035.90.6
5.93.8 ⋅+−
=−−
−
ppmCHClppm
ppmBay III
IH
1. Method report format “Number” is selected.
2. Edit Compound List.
Four compounds are defined:
I0 : Region 9.5-6.0 ppm
I2 : Region 9.5-8.3 ppm
I3 : Region 5.8-0.2 ppm
CHCl3 : Singulet at 7.2 ppm
Example Log Files and Reports
61
3. User Calculation is defined as a Python script. The integrals of all defined com-pounds are available by their compound name. “returnValue” is reported on the doc-uments.
I1 = I0-CHCl3; returnValue = 100 * I2 /(I1 + I3);
6.4 Example csv File for Batch Submission
Image of a csv file for batch submission of samples. Notice, the first line MUST have some character and cannot contain a sample order.
.
Example Log Files and Reports
62
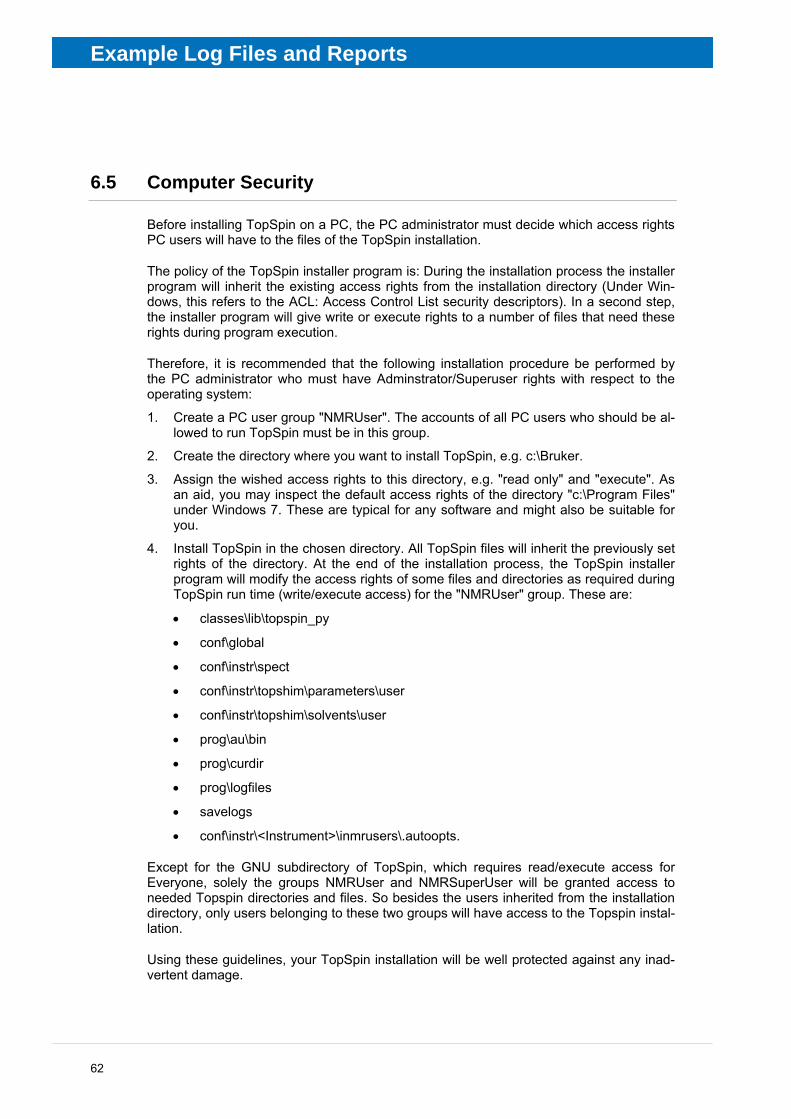
6.5 Computer Security
Before installing TopSpin on a PC, the PC administrator must decide which access rights PC users will have to the files of the TopSpin installation.
The policy of the TopSpin installer program is: During the installation process the installer program will inherit the existing access rights from the installation directory (Under Win-dows, this refers to the ACL: Access Control List security descriptors). In a second step, the installer program will give write or execute rights to a number of files that need these rights during program execution.
Therefore, it is recommended that the following installation procedure be performed by the PC administrator who must have Adminstrator/Superuser rights with respect to the operating system:
1. Create a PC user group "NMRUser". The accounts of all PC users who should be al-lowed to run TopSpin must be in this group.
2. Create the directory where you want to install TopSpin, e.g. c:\Bruker.
3. Assign the wished access rights to this directory, e.g. "read only" and "execute". As an aid, you may inspect the default access rights of the directory "c:\Program Files" under Windows 7. These are typical for any software and might also be suitable for you.
4. Install TopSpin in the chosen directory. All TopSpin files will inherit the previously set rights of the directory. At the end of the installation process, the TopSpin installer program will modify the access rights of some files and directories as required during TopSpin run time (write/execute access) for the "NMRUser" group. These are:
• classes\lib\topspin_py
• conf\global
• conf\instr\spect
• conf\instr\topshim\parameters\user
• conf\instr\topshim\solvents\user
• prog\au\bin
• prog\curdir
• prog\logfiles
• savelogs
• conf\instr\<Instrument>\inmrusers\.autoopts.
Except for the GNU subdirectory of TopSpin, which requires read/execute access for Everyone, solely the groups NMRUser and NMRSuperUser will be granted access to needed Topspin directories and files. So besides the users inherited from the installation directory, only users belonging to these two groups will have access to the Topspin instal-lation.
Using these guidelines, your TopSpin installation will be well protected against any inad-vertent damage.

63
7 Definitions GLP – Good Laboratory Practice
GMP – Good Manufacturing Practice
ICH – International Conference on Harmonisation (of Technical Requirements for Regis-tration of Pharmaceuticals for Human Use)
Knowledgebase – composite library of compounds which contains detailed molecular structure information such as coupling constants, multiplicity and atom count
LOD – Level of detection
LOQ – Level of quantification
QA – Quality Analysis
QC – Quality Control
Quant Method – method which contains details of how the spectrum or spectra will be evaluated including limits for defining failure, quantification method, peak identification and limits and SBASE to be matched.
RMS – Raw Material Screening
SBASE – Spectral database of purified compounds to be used by match algorithm for identification of compounds in screening mode.
System Suitability Test – A set of four samples run periodically to evaluate the continued performance of the instrument.

64
65
8 Contact Manufacturer: Bruker BioSpin NMR am Silberstreifen D-76287 Rheinstetten Germany Phone: +49 721-5161-0 http://www.bruker-biospin.com
NMR Hotlines Contact our NMR service centers. Bruker BioSpin NMR provide dedicated hotlines and service centers, so that our special-ists can respond as quickly as possible to all your service requests, applications ques-tions, software or technical needs. Please select the NMR service center or hotline you wish to contact from our list available at: http://www.bruker-biospin.com/hotlines_nmr.html

66

Appendix
67
Appendix
A.1 Figures
Figure 1.1 Assure-RMS Software Package Overview Diagram ........................................10
Figure 1.2 Workflow of Assure-RMS Software Diagram ...................................................11
Figure 1.3 Raw Material Screening: IconNMR sample submission window for access-limited users. ....................................................................................................12
Figure 2.1 IconNMR easy dialog submission interface .....................................................15
Figure 2.2 Summary of the parallel, complimentary spectral analysis techniques used in the Assure-RMS software package. Spectra are evaluated based on qualitative (left side) and quantitative (right side) properties of the constituents.17
Figure 2.3 Access to the reports via IconNMR Preceding Experiments window...............17
Figure 3.1 Access to the SBASE preparation module of AMIX from Assure-RMS ...........19
Figure 3.2 Action and window arguments for automated picking peaks in AMIX. The resulting peaks which have been picked are shown with tick marks on the Hα (ca. 3.75 ppm) and Hε (ca. 3.05 ppm) resonances. .........................................21
Figure 3.3 An example of the annotate feature from molecule and the resulting annotation in lysine proton H17 (Hα). ................................................................................22
Figure 3.4: Multiplicity tool used to quickly assign multiplets and set coupling constants.23
Figure 3.5: Tools of the Preparation module. The Preparation dropdown has all of the tools necessary to import a spectrum into an SBASE. ....................................24
Figure 4.1 Assure - Raw Material Screening Analysis viewer window layout with SBASE browser open. The SBASE spectrum and molecular structure file from the provided SBASE are shown. ............................................................................26
Figure 4.2 Atom integral balance of lysine. Spectrum shows Hα (H17 – ca. 3.7 ppm) and Hε (H18, H19 – ca. 2.95 ppm). Integrals of relative intensity are indicated. ....28
Figure 4.3: Shows the first window, first tab when editing or starting a new method. This dialog shows the arginine quant method provided with the release software..32
Figure 4.4 Shows the tab for Identification which uses the SBASE to identify and confirm compounds. ......................................................................................................33
Figure 4.5 Dialog box for user defined integration routines...............................................34
Figure 4.6 Analysis results of the arginine quantification method. Tabs are available for 1H, 13C and detailed reports. A green status ball suggests that the compound will be suitable and the yellow status ball suggests the compound may have difficulties for the identification and quantification as defined. .........................37
Figure 4.7: Dialog window for running quantification of a spectrum manually. .................38
Figure 5.1 IconNMR screen showing the user manager interface and current settings for the access-limited QCuser. ..............................................................................47
Appendix
68
Figure 5.2 QCuser window interface................................................................................. 52
Figure 5.3 Access to reports from Assure-RMS QC-user window.................................... 54
Figure 5.4 Loading setup from csv file ............................................................................. 55
Appendix
69
A.2 Tables
Table 1.1: List of samples for System Suitability Tests including their sample type, reorder number and default sample position for the automation robot.........................13
Table 1.2: List of samples for Validation Tests including their sample type, reorder number and default sample position for the automation robot.........................13
Table 4.1 Summary of quantifications methods available based on the relative concentration to the main component as exemplified with lysine as the adulterant and arginine as the main component. .............................................28
Table 4.2 Summary of absolute quantification methods....................................................29
Table 4.3. Summary of integration and failure triggers for defined compound types........36