
Associations between musculoskeletal pain and work-related ... › content › pdf ›...
12
RESEARCH ARTICLE Open Access Associations between musculoskeletal pain and work-related factors among public service sector computer workers in Kaunas County, Lithuania Gintare Kaliniene * , Ruta Ustinaviciene, Lina Skemiene, Vidmantas Vaiciulis and Paulius Vasilavicius Abstract Background: Information technologies in occupational activities have been developing very rapid. Epidemiological studies have shown that musculoskeletal disorders are widely prevalent among employees working with a computer. The aim of this study was to evaluate the prevalence of musculoskeletal pain in various anatomical areas and its associations with individual, ergonomic, and psychosocial factors among computer workers of the public sector in Kaunas County, Lithuania. Methods: The investigation consisting of two parts – questionnaire study (Nordic Musculoskeletal Questionnaire and Copenhagen Psychosocial Questionnaire) and direct observation (evaluation of work ergonomics using the Rapid Upper Limb Assessment [RULA]) – was carried out in three randomly selected public sector companies of Kaunas County. The representative study sample comprised 513 public service office workers. The prevalence of musculoskeletal pain in five anatomical areas of the body (shoulders, elbows, wrists/hands, as well as upper and low back) was evaluated. Results: The prevalence rates of shoulder, elbow, wrist/hand, upper and low back pain were 50.5 %, 20.3 %, 26.3 %, 44.8 %, and 56.1 %, respectively. Individual factors such as gender, age, computer work experience, and body mass index were found as significant for musculoskeletal pain in various musculoskeletal regions. The respondents reporting pain in shoulder, wrist/hand, upper back, and low back areas had a statistically significantly higher mean RULA score. The duration of working with a computer was found as a significant factor for shoulder pain. High quantitative demands were related to musculoskeletal pain in all investigated anatomical areas expect for the low back; weak social support was a significant predictor for complaints in upper and low back areas. Conclusion: This study confirmed associations between musculoskeletal pain and work ergonomics; therefore, preventive measures at the workplace should be directed to the improvement in ergonomic work environment, education, and workload optimization. Keywords: Musculoskeletal pain, Computer work, Ergonomics, RULA * Correspondence: [email protected] Department of Environmental and Occupational Medicine, Public Health Faculty, Lithuanian University of Health Sciences, Tilzes 18, Kaunas LT-47181, Lithuania © 2016 The Author(s). Open Access This article is distributed under the terms of the Creative Commons Attribution 4.0 International License (http://creativecommons.org/licenses/by/4.0/), which permits unrestricted use, distribution, and reproduction in any medium, provided you give appropriate credit to the original author(s) and the source, provide a link to the Creative Commons license, and indicate if changes were made. The Creative Commons Public Domain Dedication waiver (http://creativecommons.org/publicdomain/zero/1.0/) applies to the data made available in this article, unless otherwise stated. Kaliniene et al. BMC Musculoskeletal Disorders (2016) 17:420 DOI 10.1186/s12891-016-1281-7
Transcript of Associations between musculoskeletal pain and work-related ... › content › pdf ›...

RESEARCH ARTICLE Open Access
Associations between musculoskeletal painand work-related factors among publicservice sector computer workers in KaunasCounty, LithuaniaGintare Kaliniene*, Ruta Ustinaviciene, Lina Skemiene, Vidmantas Vaiciulis and Paulius Vasilavicius
Abstract
Background: Information technologies in occupational activities have been developing very rapid. Epidemiologicalstudies have shown that musculoskeletal disorders are widely prevalent among employees working with acomputer. The aim of this study was to evaluate the prevalence of musculoskeletal pain in various anatomical areasand its associations with individual, ergonomic, and psychosocial factors among computer workers of the publicsector in Kaunas County, Lithuania.
Methods: The investigation consisting of two parts – questionnaire study (Nordic Musculoskeletal Questionnaireand Copenhagen Psychosocial Questionnaire) and direct observation (evaluation of work ergonomics using theRapid Upper Limb Assessment [RULA]) – was carried out in three randomly selected public sector companies ofKaunas County. The representative study sample comprised 513 public service office workers. The prevalence ofmusculoskeletal pain in five anatomical areas of the body (shoulders, elbows, wrists/hands, as well as upper andlow back) was evaluated.
Results: The prevalence rates of shoulder, elbow, wrist/hand, upper and low back pain were 50.5 %, 20.3 %, 26.3 %,44.8 %, and 56.1 %, respectively. Individual factors such as gender, age, computer work experience, and body massindex were found as significant for musculoskeletal pain in various musculoskeletal regions. The respondentsreporting pain in shoulder, wrist/hand, upper back, and low back areas had a statistically significantly higher meanRULA score. The duration of working with a computer was found as a significant factor for shoulder pain. Highquantitative demands were related to musculoskeletal pain in all investigated anatomical areas expect for the lowback; weak social support was a significant predictor for complaints in upper and low back areas.
Conclusion: This study confirmed associations between musculoskeletal pain and work ergonomics; therefore,preventive measures at the workplace should be directed to the improvement in ergonomic work environment,education, and workload optimization.
Keywords: Musculoskeletal pain, Computer work, Ergonomics, RULA
* Correspondence: [email protected] of Environmental and Occupational Medicine, Public HealthFaculty, Lithuanian University of Health Sciences, Tilzes 18, Kaunas LT-47181,Lithuania
© 2016 The Author(s). Open Access This article is distributed under the terms of the Creative Commons Attribution 4.0International License (http://creativecommons.org/licenses/by/4.0/), which permits unrestricted use, distribution, andreproduction in any medium, provided you give appropriate credit to the original author(s) and the source, provide a link tothe Creative Commons license, and indicate if changes were made. The Creative Commons Public Domain Dedication waiver(http://creativecommons.org/publicdomain/zero/1.0/) applies to the data made available in this article, unless otherwise stated.
Kaliniene et al. BMC Musculoskeletal Disorders (2016) 17:420 DOI 10.1186/s12891-016-1281-7

BackgroundMusculoskeletal (MS) disorders are the most commonwork-related health problem in Europe, affecting mil-lions of workers [1]. It is also the largest group of occu-pational diseases accounting for about one-third andmore of all registered occupational diseases in theUnited States, Scandinavian countries, and Japan [2].Information technologies have become indispensable
in the office environment, which has led to intensifiedcomputer use. Many epidemiological studies show thatMS complaints are widely prevalent among employeesworking with a computer [3–10]. Scientific reports indi-cate that computer users mostly report complaints aboutpain the neck area [7–11]. Our recent survey on MScomplaints in the neck and their associations with work-related factors has shown a very high prevalence(65.7 %) of MS pain in this area during a 12-monthperiod [12]. However, complaints about pain in otheranatomical body regions (shoulders, upper extremities,back) are also prevalent among computer users. Signifi-cant associations of these complaints with both physical[10, 13–15] and psychosocial [16–19] work environmentare noted in studies. Research confirms that the workingenvironment is not the only factor that has an impact onthe development of MS disorders – individual character-istics such as gender, age, and body mass index (BMI)are also significant [6, 20–22]. Some studies have re-ported evidence that MS disorders have a multifactorialorigin [3, 23, 24]; however, other systematical reviewshave not confirmed psychosocial factors to have a pre-dictive value for MS complaints [25] or have not foundeven moderate evidence to confirm causative relation-ship between computer work and diagnosed MS disor-ders [26]. With the intention to fully consider thepredisposing aspects of MS disorders, all factors – indi-vidual, physical, and psychosocial – were analyzed in thisstudy.The aim of this study was to evaluate the prevalence
of MS pain in various anatomical areas and its associa-tions with individual, ergonomic, and psychosocial fac-tors among computer workers in the public sector ofKaunas County, Lithuania.
MethodsThis study was part of the cross-sectional epidemiologicstudy “Ergonomics of computer work and its interfacewith work environment”, carried out at the Department ofEnvironmental and Occupational Medicine, LithuanianUniversity of Health Science, in 2010.Scientific literature reports that frequency of the event
of interest – MS disorders – in computer working popu-lations varies from 6.6 % to 70 %. The sample size calcu-lation was based on the frequency with 5 % probabilityof error and 95 % reliability, and 0.5 relative frequency
[27], and this resulted in 384 participants needed tocomplete the study. Three institutions from the list of 12public service institutions in Kaunas County were ran-domly selected to recruit participants. Employees whosework ware directly related to computer use were invitedto participate in the study. A total of 570 questionnaireswere distributed among employees, and 513 employeesagreed to participate in the study and completed thequestionnaire properly (response rate, 89.1 %).The study protocol was approved by Kaunas Regional
Ethics Committee for Biomedical Research, Lithuania(Protocol No. BE-2-13). The participation in the studywas anonymous and voluntary; written informed consentto participate in the study was obtained from each par-ticipant together with the completed questionnaire.
QuestionnairesA three-part questionnaire was used in this study. Thefirst part of the questionnaire included the questionsthat were designed to gather individual data of the re-spondents (age, gender, height, weight, and computerwork experience). The division into age categories wasdone for the purpose of more convenient statistical ana-lysis; the participants were divided into four age groups.Computer work experience was categorized into threegroups. The second part was intended to assess the 12-month prevalence of MS pain involving five anatomicalareas of the body: shoulders, elbows, wrists/hands, aswell as upper and low back. For this purpose, the NordicMusculoskeletal Questionnaire was used [28]. The stan-dardized Copenhagen Psychosocial Questionnaire wasemployed in order to evaluate the psychosocial work en-vironment [29]. Five scales (quantitative demands, cogni-tive demands, responsibility demands, degree of freedomat work, and social support) of the Copenhagen Psycho-social Questionnaire, each made up of a certain combin-ation of questions, were used in the study. Each questionhad five possible response options (always, often, some-times, rarely, never or correct, almost correct, somewhatcorrect, almost wrong, wrong). Answers were trans-formed into a number between 0 and 100. An overallscale score was computed as the mean score acrossquestions in each scale. Depending on the mean scalescores, the respondents were divided into three groupsbased on the margins of tertiles: high, average, and lowlevels of observed phenomena (Fig. 1). The internal reli-ability of all five scales and the Nordic MusculoskeletalQuestionnaire scale was good (Cronbach’s α > 0.7).
Instrument of ergonomic investigationDuring this study, the Rapid Upper Limb Assessment(RULA) [30] was used in order to evaluate the work pos-ture and performed movements among computerworkers. If the investigator was not able to determine it
Kaliniene et al. BMC Musculoskeletal Disorders (2016) 17:420 Page 2 of 12

Fig. 1 Tertile margins of psychosocial characteristics: a Quantitative demands, b Cognitive demands, c Responsibility demands, d Degree offreedom at work, e Social support
Kaliniene et al. BMC Musculoskeletal Disorders (2016) 17:420 Page 3 of 12

during surveillance, the employee was asked a few ques-tions, e.g., how much time a day an employee spendstalking on the phone pinching it to the ear with the helpof the shoulder, while performing the routine tasks withthe computer; how long he/she daily spends arrangingthe documents or talking to clients etc. without using acomputer. Following this method, the work posture andmovements of individual areas of the body were evalu-ated in scores with a higher score indicating greaterstress for the MS area under investigation.
Statistical analysisStatistical data analysis was performed using the SPSS(version 20.0) software package. Hypotheses about theequality between the averages of two quantitative vari-ables and two percentage variables were examined by U(non-parametric Mann–Whitney test) and z tests, re-spectively. Values of P < 0.05 were considered statisticallysignificant. In order to determine whether the selectedindividual and work-related factors were associated withMS complaints, binary logistic regression analysis(multivariate) was applied. The results of the analysis arepresented as odds ratios (ORs) and 95 % confidence in-tervals (CIs). The goodness-of-fit of the binary logisticregression models was evaluated using the Hosmer-Lemeshow test.
ResultsThe overwhelming majority of the study population waswomen (94.7 %) with a mean age of 45.9 ± 11.1 yearsand mean computer work experience of 10.7 ± 5.5 years(Table 1). The majority of the respondents estimatedthey worked with a computer more than 6 h per day anddid not have a brake every 2 working hours. The distri-bution analysis showed that about quarter of employeesreported weak social support, one-third, high jobdemands and nearly half, low degree of freedom at work(Table 1). More than half of the employees complainedabout shoulder and low back pain, while elbow pain wasleast prevalent with one-fifth of the respondents com-plaining about it (Fig. 2).The prevalence of MS symptoms was analyzed taking
into account individual and work-related factors(Table 2). The youngest respondents significantly lessfrequently complained about pain in the shoulder thantheir older counterparts. Elbow pain was documented
Table 1 Individual and work-related characteristics of thestudy population
Factors N (%)
Individual
Gender
Men 27 (5.3)
Women 486 (94.7)
Age
23-29 years 55 (10.7)
30-39 years 91 (17.7)
40-49 years 149 (29.1)
50-70 years 218 (42.5)
Computer work experience
1-5 years 115 (22.4)
6-15 years 287 (55.9)
16-36 years 111 (21.7)
BMI
< 18.5 kg/m2 19 (3.7)
18.6-24.9 kg/m2 255 (49.7)
> 25 kg/m2 239 (46.6)
Work-related
Duration of working with a computer
< 4 h/day 20 (3.9)
4-6 h/day 88 (17.2)
> 6 h/day 405 (78.9)
Taking a break every 2 h
Yes 69 (13.5)
No 444 (86.5)
Quantitative demands
Low 208 (40.5)
Average 143 (27.9)
High 162 (31.6)
Cognitive demands
Low 141 (27.5)
Average 191 (37.2)
High 181 (35.3)
Responsibility demands
Low 142 (27.7)
Average 170 (33.1)
High 201 (39.2)
Degree of freedom at work
Low 242 (47.2)
Average 157 (30.6)
High 114 (22.2)
Table 1 Individual and work-related characteristics of thestudy population (Continued)
Social support
Weak 138 (26.9)
Average 183 (35.7)
Strong 192 (37.4)
Kaliniene et al. BMC Musculoskeletal Disorders (2016) 17:420 Page 4 of 12

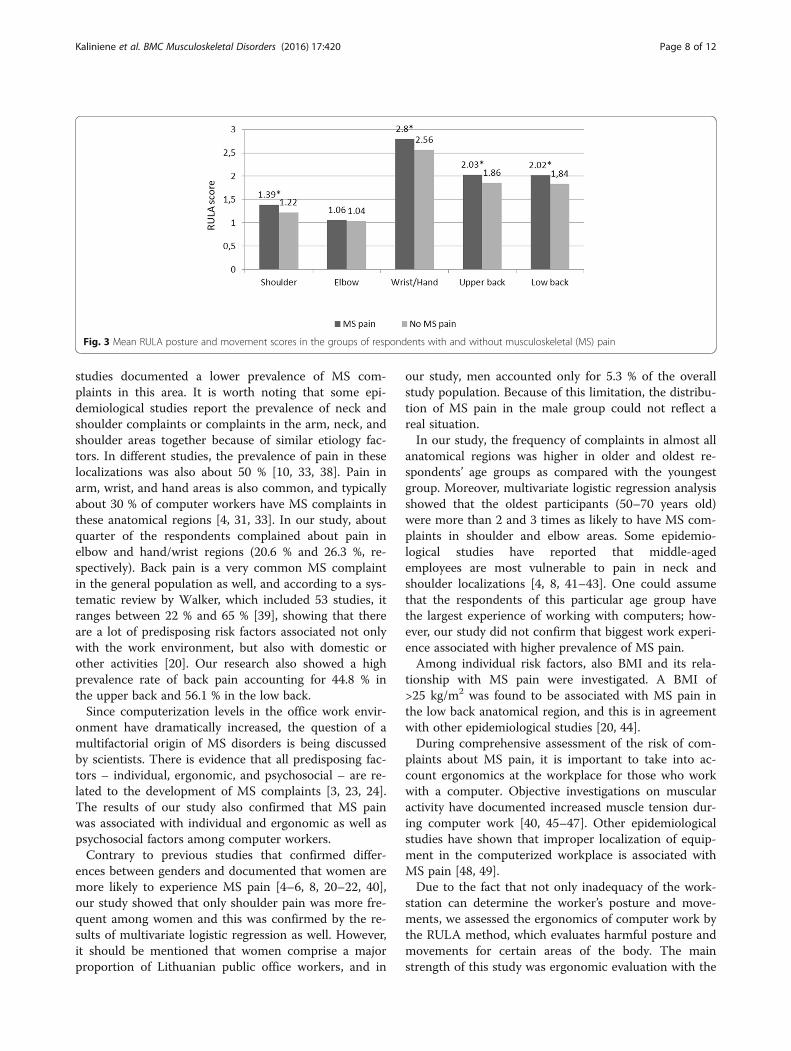
more frequently among employees working with a com-puter for more than 5 years. A BMI greater than 25 kg/m2 had significant associations only with low back pain.Duration of working with a computer was significantlyassociated only with the prevalence of MS pain in theshoulder: the employees working with a computer morethan 4 h per day more frequently complained about painin this area. Wrist/hand and low back complains weremore common among those who did not have any breakevery 2 h. The respondents who reported low quantita-tive demands had pain less frequently in all investigatedanatomical areas except for the low back. Low cognitiveand responsibility demands were associated with less fre-quent pain in the shoulder, elbow, and upper back areas.Significantly higher frequencies of complaints in theshoulder and wrist/hand areas were observed for respon-dents reporting a low degree of freedom at work. Re-spondents with weak social support had a higherfrequency of MS complaints in the low back area(Table 2).The RULA score significantly differed comparing the
groups of respondents with and without MS pain (Fig. 3).The respondents experiencing pain in shoulder, wrist/hand, upper back, and low back areas had a statisticallysignificantly higher mean RULA score.Table 3 shows the results of logistic regression analysis
investigating associations between individual and work-related factors, and pain in different anatomical areas.The results of Hosmer-Lemeshow test revealed good fitsfor all models (χ2 = 7.70, df = 8, P = 0.46 for shouldermodel; χ2 = 10.02, df = 8, P = 0.26 for elbow model; χ2 =4.61, df = 8, P = 0.79 for wrists/hand model; χ2 = 3.16, df= 8, P = 0.92 for upper back model; χ2 = 5.78, df = 8, P =0.67 for low back model).Women and 50–70-year olds were 6 and 2 times more
likely than men and older respondents, respectively, toexperience MS pain in the shoulder. Moreover, timespent working with a computer 4–6 h a day, higher
levels of quantitative demands, and high level of respon-sibility demands were associated with an increased riskof having shoulder pain. For each one-point increase inthe RULA score, the likelihood of having shoulder painincreased by 68 %.Being a 50–70-year old and high levels of quantitative
and responsibility demands were associated with agreater risk of experiencing elbow pain.The likelihood of having wrist/hand pain was posi-
tively associated with a high level of quantitative de-mands. For each one-point increase in the RULAscore, the likelihood of having wrist/hand pain in-creased by 59 %.Computer work experience of 6–15 years, higher levels
of quantitative and responsibility demands, and weak so-cial support at work were found to be associated with agreater odds of experiencing upper back pain. For eachone-point increase in the RULA score, the likelihood ofhaving upper back pain increased by 38 %.Having a BMI of >25 kg/m2, no taking a break every
2 h, and weak social support at work were associatedwith an increased risk of having low back pain. For eachone-point increase in the RULA score, the likelihood ofhaving low back pain increased by 30 %.
DiscussionThe aim of this cross-sectional study was to evaluate theprevalence of MS pain in various anatomical areasamong computer workers in the public sector of KaunasCounty. This study showed a high prevalence of MSpain in body parts such as shoulders, upper back, andlow back among office workers. According to numerousstudies, neck pain is in the leading position with theprevalence ranging from 19 % to 70 % in the populationof office workers [4, 5, 8, 11, 12, 21, 31–36]. The preva-lence of shoulder pain in this study was also high (50 %),and this is in line with the finding of Australian [4] andChinese [31] studies, while Finnish [5] and German [37]
Fig. 2 Prevalence of musculoskeletal pain by different anatomical regions
Kaliniene et al. BMC Musculoskeletal Disorders (2016) 17:420 Page 5 of 12

Table 2 Prevalence of musculoskeletal pain with respect to individual and work-related factors
Factors ShoulderN (%)
ElbowN (%)
Wrist/handN (%)
Upper backN (%)
Low backN (%)
Individual
Gender
Men 4 (14.8) 2 (7.4) 4 (14.8) 9 (45.5) 15 (55.6)
Women 255 (52.5)* 102 (21.0) 131 (27.0) 221 (33.3) 273 (56.2)
Age
23-29 years 19 (34.5) 5 (7.3) 12 (21.8) 19 (34.5) 30 (54.5)
30-39 years 42 (46.2)* 10 (11.0) 21 (23.1) 38 (41.8) 48 (52.7)
40-49 years 75 (50.3)* 36 (24.2)* 46 (28.9) 84 (56.4)* 86 (57.7)
50-70 years 123 (56.4)* 54 (24.8)* 59 (27.1) 89 (40.8) 124 (56.1)
Computer work experience
1-5 years 48 (41.7) 14 (1.2) 26 (22.6) 40 (34.8) 62 (53.9)
6-15 years 152 (53.0) 65 (22.6)* 80 (27.9) 144 (50.2)* 165 (57.5)
16-36 years 59 (53.2) 25 (22.5)* 29 (26.1) 46 (41.4) 61 (55.0)
BMI
< 18.5 kg/m2 9 (47.4) 0 (0) 4 (21.1) 6 (31.6) 8 (42.1)
18.6-24.9 kg/m2 128 (50.2) 50 (19.6) 71 (27.8) 122 (47.8) 133 (51.0)
> 25 kg/m2 122 (51.0) 54 (22.6) 60 (25.1) 102 (41.7) 144 (60.3)*
Work-related
Duration of working with a computer
< 4 h/day 6 (30) 6 (30.0) 5 (25.0) 8 (40) 8 (40.0)
4-6 h/day 47 (53.4)* 14 (15.9) 17 (19.3) 36 (40.9) 55 (62.5)
> 6 h/day 206 (50.9)* 84 (20.7) 113 (27.9) 186 (45.9) 225 (55.6)
Taking a break every 2 h
Yes 30 (43.5) 15 (21.7) 13 (18.8) 26 (37.7) 31 (44.9)
No 229 (51.6) 89 (20.0) 122 (27.5)* 204 (45.9) 257 (57.9)*
Quantitative demands
Low 84 (40.4) 32 (15.4) 42 (20.2) 73 (35.1) 112 (53.8)
Average 80 (55.9)* 30 (21.0) 37 (25.9) 69 (48.3)* 79 (55.2)
High 95 (58.6)* 42 (25.9)* 56 (34.6)* 88 (54.3)* 97 (59.9)
Kalinieneet
al.BMCMusculoskeletalD
isorders (2016) 17:420
Page6of
12

Table 2 Prevalence of musculoskeletal pain with respect to individual and work-related factors (Continued)
Cognitive demands
Low 59 (41.8) 17 (12.1) 31 (22.0) 56 (39.7) 74 (52.5)
Average 96 (50.3) 41 (21.5)* 54 (28.3) 78 (40.8) 114 (59.7)
High 104 (50.5)* 46 (25.4)* 50 (27.6) 96 (53.0)* 100 (55.2)
Responsibility demands
Low 63 (44.4) 23 (16.2) 35 (24.6) 51 (35.9) 80 (56.3)
Average 79 (46.5) 28 (16.5) 45 (26.5) 81 (47.6)* 98 (57.6)
High 117 (58.2)* 53 (26.4)* 55 (27.4) 98 (48.8)* 110 (54.7)
Degree of freedom at work
Low 135 (55.8)* 52 (21.5) 72 (29.8)* 114 (47.1) 138 (57.0)
Average 73 (46.5) 33 (21.0) 40 (25.5) 69 (43.9) 87 (55.4)
High 51 (44.7) 19 (16.7) 23 (20.2) 47 (41.2) 63 (55.3)
Social support
Weak 75 (54.3) 31 (22.5) 37 (26.8) 73 (52.9)* 89 (64.5)*
Average 85 (46.4) 34 (18.6) 46 (25.1) 77 (42.1) 101 (55.2)
Strong 99 (51.6) 39 (20.3) 52 (27.1) 80 (41.7) 98 (51.0)
z test, *P < 0.05 - comparing with: youngest age group; smallest work experience group; 18.6-24.9 kg/m2 BMI group; <4 h/day working with computer respondents group; those who taking break every two hours;working in a positive work environment with respect to current psychosocial factor
Kalinieneet
al.BMCMusculoskeletalD
isorders (2016) 17:420
Page7of
12
studies documented a lower prevalence of MS com-plaints in this area. It is worth noting that some epi-demiological studies report the prevalence of neck andshoulder complaints or complaints in the arm, neck, andshoulder areas together because of similar etiology fac-tors. In different studies, the prevalence of pain in theselocalizations was also about 50 % [10, 33, 38]. Pain inarm, wrist, and hand areas is also common, and typicallyabout 30 % of computer workers have MS complaints inthese anatomical regions [4, 31, 33]. In our study, aboutquarter of the respondents complained about pain inelbow and hand/wrist regions (20.6 % and 26.3 %, re-spectively). Back pain is a very common MS complaintin the general population as well, and according to a sys-tematic review by Walker, which included 53 studies, itranges between 22 % and 65 % [39], showing that thereare a lot of predisposing risk factors associated not onlywith the work environment, but also with domestic orother activities [20]. Our research also showed a highprevalence rate of back pain accounting for 44.8 % inthe upper back and 56.1 % in the low back.Since computerization levels in the office work envir-
onment have dramatically increased, the question of amultifactorial origin of MS disorders is being discussedby scientists. There is evidence that all predisposing fac-tors – individual, ergonomic, and psychosocial – are re-lated to the development of MS complaints [3, 23, 24].The results of our study also confirmed that MS painwas associated with individual and ergonomic as well aspsychosocial factors among computer workers.Contrary to previous studies that confirmed differ-
ences between genders and documented that women aremore likely to experience MS pain [4–6, 8, 20–22, 40],our study showed that only shoulder pain was more fre-quent among women and this was confirmed by the re-sults of multivariate logistic regression as well. However,it should be mentioned that women comprise a majorproportion of Lithuanian public office workers, and in
our study, men accounted only for 5.3 % of the overallstudy population. Because of this limitation, the distribu-tion of MS pain in the male group could not reflect areal situation.In our study, the frequency of complaints in almost all
anatomical regions was higher in older and oldest re-spondents’ age groups as compared with the youngestgroup. Moreover, multivariate logistic regression analysisshowed that the oldest participants (50–70 years old)were more than 2 and 3 times as likely to have MS com-plaints in shoulder and elbow areas. Some epidemio-logical studies have reported that middle-agedemployees are most vulnerable to pain in neck andshoulder localizations [4, 8, 41–43]. One could assumethat the respondents of this particular age group havethe largest experience of working with computers; how-ever, our study did not confirm that biggest work experi-ence associated with higher prevalence of MS pain.Among individual risk factors, also BMI and its rela-
tionship with MS pain were investigated. A BMI of>25 kg/m2 was found to be associated with MS pain inthe low back anatomical region, and this is in agreementwith other epidemiological studies [20, 44].During comprehensive assessment of the risk of com-
plaints about MS pain, it is important to take into ac-count ergonomics at the workplace for those who workwith a computer. Objective investigations on muscularactivity have documented increased muscle tension dur-ing computer work [40, 45–47]. Other epidemiologicalstudies have shown that improper localization of equip-ment in the computerized workplace is associated withMS pain [48, 49].Due to the fact that not only inadequacy of the work-
station can determine the worker’s posture and move-ments, we assessed the ergonomics of computer work bythe RULA method, which evaluates harmful posture andmovements for certain areas of the body. The mainstrength of this study was ergonomic evaluation with the
Fig. 3 Mean RULA posture and movement scores in the groups of respondents with and without musculoskeletal (MS) pain
Kaliniene et al. BMC Musculoskeletal Disorders (2016) 17:420 Page 8 of 12
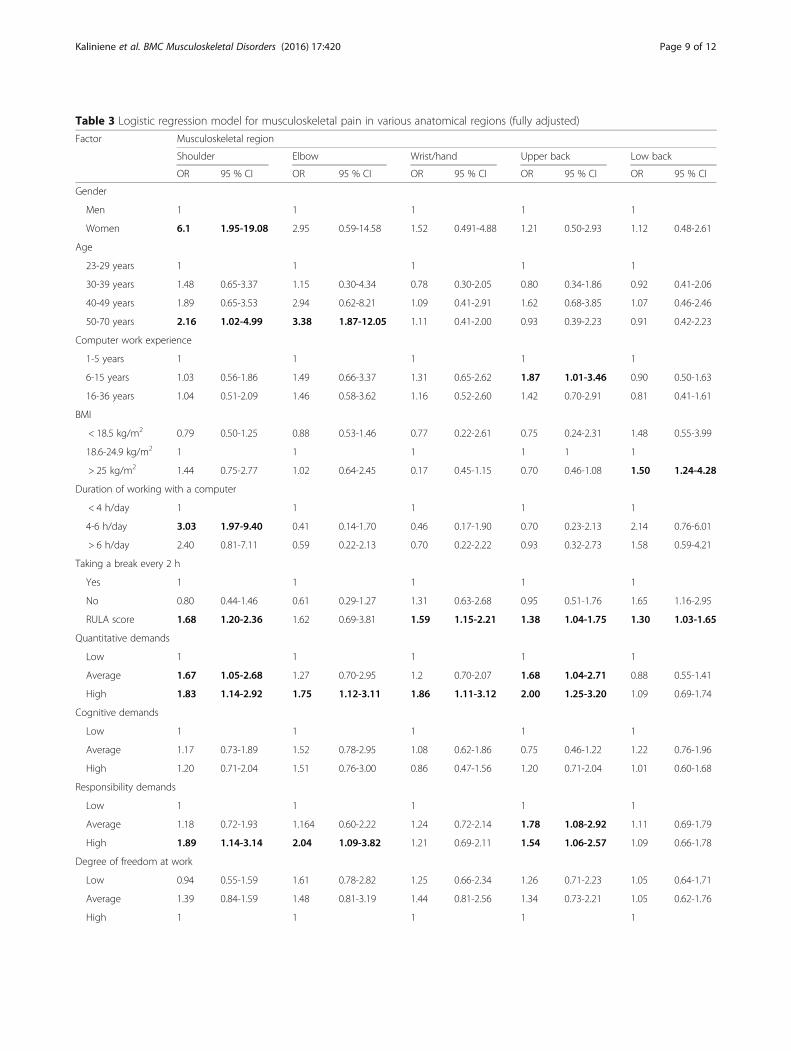
Table 3 Logistic regression model for musculoskeletal pain in various anatomical regions (fully adjusted)
Factor Musculoskeletal region
Shoulder Elbow Wrist/hand Upper back Low back
OR 95 % CI OR 95 % CI OR 95 % CI OR 95 % CI OR 95 % CI
Gender
Men 1 1 1 1 1
Women 6.1 1.95-19.08 2.95 0.59-14.58 1.52 0.491-4.88 1.21 0.50-2.93 1.12 0.48-2.61
Age
23-29 years 1 1 1 1 1
30-39 years 1.48 0.65-3.37 1.15 0.30-4.34 0.78 0.30-2.05 0.80 0.34-1.86 0.92 0.41-2.06
40-49 years 1.89 0.65-3.53 2.94 0.62-8.21 1.09 0.41-2.91 1.62 0.68-3.85 1.07 0.46-2.46
50-70 years 2.16 1.02-4.99 3.38 1.87-12.05 1.11 0.41-2.00 0.93 0.39-2.23 0.91 0.42-2.23
Computer work experience
1-5 years 1 1 1 1 1
6-15 years 1.03 0.56-1.86 1.49 0.66-3.37 1.31 0.65-2.62 1.87 1.01-3.46 0.90 0.50-1.63
16-36 years 1.04 0.51-2.09 1.46 0.58-3.62 1.16 0.52-2.60 1.42 0.70-2.91 0.81 0.41-1.61
BMI
< 18.5 kg/m2 0.79 0.50-1.25 0.88 0.53-1.46 0.77 0.22-2.61 0.75 0.24-2.31 1.48 0.55-3.99
18.6-24.9 kg/m2 1 1 1 1 1 1
> 25 kg/m2 1.44 0.75-2.77 1.02 0.64-2.45 0.17 0.45-1.15 0.70 0.46-1.08 1.50 1.24-4.28
Duration of working with a computer
< 4 h/day 1 1 1 1 1
4-6 h/day 3.03 1.97-9.40 0.41 0.14-1.70 0.46 0.17-1.90 0.70 0.23-2.13 2.14 0.76-6.01
> 6 h/day 2.40 0.81-7.11 0.59 0.22-2.13 0.70 0.22-2.22 0.93 0.32-2.73 1.58 0.59-4.21
Taking a break every 2 h
Yes 1 1 1 1 1
No 0.80 0.44-1.46 0.61 0.29-1.27 1.31 0.63-2.68 0.95 0.51-1.76 1.65 1.16-2.95
RULA score 1.68 1.20-2.36 1.62 0.69-3.81 1.59 1.15-2.21 1.38 1.04-1.75 1.30 1.03-1.65
Quantitative demands
Low 1 1 1 1 1
Average 1.67 1.05-2.68 1.27 0.70-2.95 1.2 0.70-2.07 1.68 1.04-2.71 0.88 0.55-1.41
High 1.83 1.14-2.92 1.75 1.12-3.11 1.86 1.11-3.12 2.00 1.25-3.20 1.09 0.69-1.74
Cognitive demands
Low 1 1 1 1 1
Average 1.17 0.73-1.89 1.52 0.78-2.95 1.08 0.62-1.86 0.75 0.46-1.22 1.22 0.76-1.96
High 1.20 0.71-2.04 1.51 0.76-3.00 0.86 0.47-1.56 1.20 0.71-2.04 1.01 0.60-1.68
Responsibility demands
Low 1 1 1 1 1
Average 1.18 0.72-1.93 1.164 0.60-2.22 1.24 0.72-2.14 1.78 1.08-2.92 1.11 0.69-1.79
High 1.89 1.14-3.14 2.04 1.09-3.82 1.21 0.69-2.11 1.54 1.06-2.57 1.09 0.66-1.78
Degree of freedom at work
Low 0.94 0.55-1.59 1.61 0.78-2.82 1.25 0.66-2.34 1.26 0.71-2.23 1.05 0.64-1.71
Average 1.39 0.84-1.59 1.48 0.81-3.19 1.44 0.81-2.56 1.34 0.73-2.21 1.05 0.62-1.76
High 1 1 1 1 1
Kaliniene et al. BMC Musculoskeletal Disorders (2016) 17:420 Page 9 of 12

RULA method applied by the investigators in order toachieve greater objectivity. The results showed that ahigher RULA score was statistically significantly associ-ated with a greater risk of having MS complaints in theshoulder, wrist/hand, upper back, and low back anatom-ical areas.In many epidemiological studies, MS pain in shoulder
area was investigated together with neck complaints;therefore, work posture and movements were identifiedas significant factors having an impact on pain in bothneck and shoulder areas [13, 14]. In our study, the dur-ation of work with a computer for 4–6 h a day increasedthe likelihood of experiencing pain in the shoulder area,but Blatter et al. showed that employees who work witha computer more than 6 h per day were at increased riskof shoulder pain [50]. Awkward posture and movementsof computer workers have been confirmed as significantrisk factors for MS pain in the arm area [10, 15, 32, 51, 52];however, our data showed significant associationsthese factors and pain only in hand/wrist anatomicalarea.The neck and shoulders are the most affected anatom-
ical regions of the human body in computer workers,and for this reason, MS pain in the back including bothupper and low back is less investigated in scientific stud-ies involving computer workers as a study population.Despite this, some epidemiological studies [4, 32, 49] aswell as our data confirmed associations between MSpain in the back area and inadequate work posture andmovements.Development of information technologies and
computerization has led to many changes in officeworkers’ professional practice and constantly increasingjob demands. Negative consequences of computerizationdue to increasing workload, employer expectations, or jobtension to employees were recognized [53], and high jobdemands were found to be associated with MS symptomsin many populations of office workers [16, 10, 54]. Ourstudy also demonstrated that quantitative job demandswere significantly associated with MS complaints inalmost all investigated anatomical areas except for the lowback. Responsibility demands were found to be a signifi-cant factor for shoulder, elbow, and upper back com-plaints, while weak social support had a significant impacton both upper and low back pain. The observation thatthe odds ratios of all MS pain-predisposing factors – indi-vidual, psychosocial, and ergonomic – were almost of
equal magnitude suggest that their contribution toetiology of MS pain is very similar.
ConclusionsThe prevalence of MS pain among computer users washigh, with shoulders and low back being the most af-fected anatomical areas. Significant associations betweenindividual factors, work ergonomics (inappropriate pos-ture and movements), and MS pain were found. Work-related psychosocial factors had a significant impact onexperiencing pain as well: high quantitative demandswere associated with MS complaints in almost all ana-tomical areas, and weak social support was a significantpredictor for MS complaints in the upper and low backareas.Preventive measures at the workplace should be di-
rected to the improvement in ergonomic work environ-ment and reducing job strain caused inadequateworkload, high responsibilities, and weak social support.
AbbreviationsBMI: Body mass index; CI: Confidence interval; MS: Musculoskeletal; OR: Oddsratio; RULA: Rapid upper limb assessment
AcknowledgmentsThe authors wish to thank the leaders of Kaunas County public servicecompanies for the partnerships. We express gratitude to our Department ofEnvironmental and Occupational Medicine colleagues for provided criticalinput in all phases of this study.
FundingAny funding for this study was not obtained.
Availability of data and materialsAll data concerning the resarche are presented in the manuscript.
Authors’ contributionsGK and RU: substantial contribution to conception and design. GK and VV:acquisition of data, and analysis an interpretation of data. LS, RU and PV:drafting the article or revising it critically for important intellectual content.All authors: final approval of the version to be published.
Competing interestsThe authors have no competing interests to declare.
Consent for publicationNot applicable.
Ethics approval and consent to participateThe study protocol was approved by Kaunas Regional Biomedical ResearchEthics Committee (Lithuania) (Protocol No. BE-2-13). Participation in the studywas anonymous and voluntary. Informed agreement to participate in thestudy was provided with the completed questionnaire.
Received: 27 April 2016 Accepted: 1 October 2016
Table 3 Logistic regression model for musculoskeletal pain in various anatomical regions (fully adjusted) (Continued)
Social support
Weak 1.35 0.82-2.16 1.31 0.62-1.93 0.88 0.53-1.46 1.74 1.07-2.83 1.86 1.15-3.00
Average 0.97 0.61-1.52 1.10 0.73-2.35 0.66 0.56-1.63 1.10 0.70-1.75 1.22 0.79-1.90
Strong 1 1 1 1 1
Kaliniene et al. BMC Musculoskeletal Disorders (2016) 17:420 Page 10 of 12

References1. Health and safety at work in Europe (1999–2007). European Commission,
Employment, Social Affairs and Equal Opportunities, Luxembourg, 2010.http://ec.europa.eu/eurostat/documents/3217494/5718905/KS-31-09-290-EN.PDF/88eef9f7-c229-40de-b1cd-43126bc4a946. Accessed 23 Feb 2016
2. Punnett L, Wegman DH. Work-related musculoskeletal disorders: theepidemiologic evidence and the debate. J Electromyogr Kinesiol.2004;14:13–23.
3. Wahlstrom J. Ergonomics, musculoskeletal disorders and computer work.Occup Med. 2005;55:168–76.
4. Cook C, Limerick BR, Chang S. The prevalence of neck and upper extremitymusculoskeletal symptoms in computer mouse users. Int J Ind Ergon.2000;26:347–56.
5. Sillanpää J, Huikko S, Nyberg M, Kivi P, Laippala P, Uitti P. Effect of work withvisual display units on musculoskeletal disorders in the office environment.Occup Med (Lond). 2003;53:443–51.
6. Jensen C. Development of neck and hand-wrist symptoms in relation toduration of computer use at work. Scand J Work Environ Health.2003;29(3):197–205.
7. Jensen C, Finsen L, Sogaard K, Christensen H. Musculoskeletal symptoms andduration of computer and mouse use. Int J Ind Ergon. 2002;30(4–5):265–75.
8. Canie B, Danneels L, Tiggelen D, De Loose V, Cambier D. Individual andwork related risk factors for neck pain among office workers: a crosssectional study. Eur Spine J. 2007;16:679–86.
9. Eltayeb S, Staal BJ, Kennes J, Lamberts P, Bie R. Prevalence of complains ofarm, neck and shoulder among computer office workers and psychometricevaluation of a risk factor questionnaire. BMC Muscoskel Disord. 2007;8:68.
10. Ranasinghe P, Perera YS, Lamabadusuriya DA, Kulatunga S, Jayawardana N,Rajapakse S, et al. Work related complaints of neck, shoulder and armamong computer office workers: a cross-sectional evaluation of prevalenceand risk factors in a developing country. Environmental Health. 2011;10:70.
11. Oha K, Animägi L, Pääsuke M, Coggon D, Merisalu E. Individual and work-related risk factors for musculoskeletal pain: a cross-sectional study amongEstonian computer users. BMC Muscoskel Disord. 2014;15:181.
12. Kaliniene G, Ustinaviciene R, Skemiene L, Januskevicius V. Associationsbetween the neck musculoskeletal complaints and work related factorsamong public service computer workers in Kaunas. Int J Occup MedEnviron Health. 2013;26(5):670–81.
13. Marcus M, Gerr F, Monteilh C, Ortiz DJ, Gentry E, Cohen S, et al. Aprospective study of computer users: II. Postural risk factors formusculoskeletal symptoms and disorders. Am J Ind Med. 2002;41:236–49.
14. Eltayeb S, Staal JB, Hassan A, de Bie RA. Work Related Risk Factors for Neck,Shoulder and Arms Complaints: A Cohort Study among Dutch ComputerOffice Workers. J Occup Rehabil. 2009;19:315–22.
15. Heuvel SG, Beek AJ, Blatter BM, Bongers PM. Physical risk factors for neckand upper limb disorders in industrial and office workers: results from thesmash study. Occup Environ Med. 2004;61:e47.
16. Griffiths KL, Mackey MG, Adamson BJ. Behavioral and PsychophysiologicalResponses to Job Demands and Association with MusculoskeletalSymptoms in Computer Work. J Occup Rehabil. 2011;21:482–92.
17. Van den Heuvel SG, Van der Beek AJ, Blatter BM, et al. Psychosocialwork characteristics in relation to neck and upper limb symptoms. Pain.2005;114:47–53.
18. Torp SM, Rijse T, Moen BE. The impact of psychosocial work factors onmusculoskeletal pain: a prospective study. J Occup Environ Med. 2001;43:120–6.
19. Zakerian SA, Subramaniam ID. The Relationship Between Psychosocial WorkFactors, Work Stress and Computer-Related Musculoskeletal Discomforts AmongComputer Users in Malaysia. Int J Occup Safety Ergono. 2009;15(4):425–34.
20. Spyropoulos P, Papathanasiou G, Georgoudis G, Chronopoulos E, Koutis H,Koumoutsou F. Prevalence of Low Back Pain in Greek Public Office Workers.Pain Physician. 2007;10:651–60.
21. Akrouf QAS, Crawford JO, Al-Shatti AS, Kamel I. Musculoskeletal disordersamong bank office workers in Kuwait. Eastern Mediterranean Health Journal.2010;16(1):94–100.
22. Juul-Kristensen B, Søgaard K, Strøyer J, Jensen C. Computer users’ risk factorsfor developing shoulder, elbow and back symptoms. Scand J Work EnvironHealth. 2004;30(5):390–8.
23. Griffiths KL, Martin G, Mackey M, Adamson BJ. The Impact of aComputerized Work Environment on Professional Occupational Groups andBehavioural and Physiological Risk Factors for Musculoskeletal Symptoms:A Literature Review. J Occup Rehabil. 2007;17:743–65.
24. Feveile H, Jensen C, Burr H. Risk factors for neck-shoulder and wrist-handsymptoms in a 5-year follow-up study of 3,990 employees in Denmark.Int Arch Occup Environ Health. 2002;75(4):243–51.
25. Paksaichol A, Janwantanakul P, Purepong N, Pensri P, van der Beek AJ.Office workers’ risk factors for the development of non-specific neck pain: asystematic review of prospective cohort studies. Occup Environ Med.2012;69(9):610–8.
26. Waersted M, Hanvold TN, Veiersted KB. Computer work and musculoskeletaldisorders of the neck and upper extremity: A systematic review. BMCMuscoskel Disord. 2010;11:79.
27. Riffenburgh, Robert H. Statistics in Medicine. Burlington: Academic; 2011.28. Kuorinka I, Jonsson B, Kilbom A, Vinterberg H, Biering-Sorensen F,
Andersson G, et al. Standardised Nordic questionnaires for the analysis ofmusculoskeletal symptoms. Applied Ergonomics. 1987;18(3):233–7.
29. Kristensen TS. A new tool for assessing psychosocial factors at work: TheCopenhagen Psychosocial Questionnaire. TUTB Newsl. 2002;19–20:45.
30. Lueder R. A Proposed RULA for Computer Users. San Francisco: UC BerkeleyCenter for Occupational & Environmental Health Continuing EducationProgram; 1996.
31. Wu S, He L, Li J, Wang J, Wang S. Visual Display Terminal Use Increases thePrevalence and Risk of Work-related Musculoskeletal Disorders amongChinese Office Workers: A Cross-sectional Study. J Occup Health.2012;54:34–43.
32. Jensen C, Borg V, Finsen L, Hansen K, Juul-Kristensen B, Christensen H. Jobdemands, muscle activity and musculoskeletal symptoms in relation to workwith the computer mouse. Scand J Work Environ Health. 1998;24(5):418–24.
33. Rocha LE, Glina DMR, Marinho MF, Nagasato D. Risk Factors forMusculoskeletal Symptoms among Call Center Operators of a Bank in SãoPaulo. Brazil. Industrial Health. 2005;43:637–46.
34. Radulović B, Huršidić-Radulović A. Musculoskeletal and eye symptoms incomputer users at work. Arh Hig RadaToksikol. 2012;63:215–8.
35. Korpinen L, Pääkkönen R, Gobba F. White-collar workers’ self-reportedphysical symptoms associated with using computers. Int J Occup Saf Ergon.2012;18(2):137–47.
36. Ye Z, Abe Y, Kusano Y, Takamura N, Eida K, Takemoto T, et al. The Influenceof Visual Display Terminal Use on the Physical and Mental Conditions ofAdministrative Staff in Japan. J PhysiolAnthropol. 2007;26:69–73.
37. Klussmann A, Gebhardt H, Liebers F, Rieger MA. Musculoskeletal symptomsof the upper extremities and the neck: A cross-sectional study onprevalence and symptom predicting factors at visual display terminal (VDT)workstations. BMC Muscoskel Disord. 2008;9:96.
38. Bhanderi D, Choudhary SK, Parmar L, Doshi V. A Study of Occurrence ofMusculoskeletal Discomfort Computer Operators. Indian J Community Med.2008;33(1):65–6.
39. Walker BF. The Prevalence of Low Back Pain: A Systematic Review of theLiterature from 1966 to 1998. J Spinal Disord. 2000;13(3):205–17.
40. Johnston V, Jull G, Darnell R, Jimmieson NL, Souvlis T. Alterations in cervicalmuscle activity in functional and stressful tasks in female office workers withneck pain. Eur J Appl Physiol. 2008;103(3):253–64.
41. El-Bestar SF, El-Mitwalli AA, Khashaba EO. Neck-upper extremitymusculoskeletal disorders among workers in the telecommunicationscompany at Mansoura. Int J Occup Saf Ergon. 2011;17(2):195–205.
42. Tornqvist EW, Hagberg M, Hagman M, Risberg EH, Toomingas A. Theinfluence of working conditions and individual factors on the incidence ofneck and upper limb symptoms among professional computer users.Int Arch Occup Environ Health. 2009;82:689–702.
43. Gerr F, Marcus M, Ensor C, Kleinbaum D, Cohen S, Edwards A, et al. Aprospective Study of Computer Users: Study Design and Incidence ofMusculoskeletal Symptoms and Disorders. Am J Ind Med. 2002;41:221–35.
44. Liuke M, Solovieva S, Lamminen A, Luoma K, Leino-Arjas P, Luukkonen R, etal. Disc degeneration of the lumbar spine in relation to overweight. IntJ Obes (Lond). 2005;29:903–8.
45. Szeto GPY, Straker LM, O’Sullivan PB. Neck shoulder muscle activity ingeneral and task-specific resting postures of symptomatic computer userswith chronic neck pain. Manual Therapy. 2009;14:338–45.
46. Birch L, Juul-KristensenIs B, Chri J, Finsen L, Christensen H. Acute responseto precision, time pressure and mental demand during simulated computerwork. Scand J Work Environ Health. 2000;26(4):299–305.
47. Johnston V, Jull G, Souvlis T, Jimmieson NL. Neck movement and muscleactivity characteristics in female office workers with neck pain. Spine.2008;33(5):555–63.
Kaliniene et al. BMC Musculoskeletal Disorders (2016) 17:420 Page 11 of 12

48. Gerr F, Marcus M, Monteilh C. Epidemiology of musculoskeletal disordersamong computer users: lesson learned from the role of posture andkeyboard use. J Electromyogr Kinesiol. 2004;14:25–31.
49. Gerr F, Monteilh CP, Marcus M. Keyboard use and musculoskeletaloutcomes among computer users. J Occup Rehabil. 2006;16:265–77.
50. Blatter BM, Bongers PM. Duration of computer use and mouse use inrelation to musculoskeletal disorders of neck or upper limb. Int J Ind Ergon.2002;30:295–306.
51. Andersen JH, Harhoff M, Grimstrup S, Vilstrup I, Lassen CF, Brandt LP, et al.Computer mouse use predicts acute pain but not prolonged or chronicpain in the neck and shoulder. Occup Environ Med. 2008;65:126–31.
52. Bergquist U. Health problems during work with visual display terminals.Sweden: Institute of Enviromental medicine, Department of Neuromedicine,National Institute of Occupational Health; 2003.
53. Bridger RS, Brasher K. Cognitive task demands, self-control demands andthe mental well-being of office workers. Ergonomics. 2011;54(9):830–9.
54 Sharan D, Parijat P, Sasidharan AP, Ranganathan R, Mohandoss M, Jose J.Workstyle Risk Factors for Work Related Musculoskeletal Symptoms amongComputer Professionals in India. J Occup Rehabil. 2011;21:520–5.
• We accept pre-submission inquiries
• Our selector tool helps you to find the most relevant journal
• We provide round the clock customer support
• Convenient online submission
• Thorough peer review
• Inclusion in PubMed and all major indexing services
• Maximum visibility for your research
Submit your manuscript atwww.biomedcentral.com/submit
Submit your next manuscript to BioMed Central and we will help you at every step:
Kaliniene et al. BMC Musculoskeletal Disorders (2016) 17:420 Page 12 of 12


