Association of Southeast Asian Nations ASEAN Investment ... · The Member States of the Association...
250
one vision one identity one community ASEAN Investment Report 2015 Infrastructure Investment and Connectivity
Transcript of Association of Southeast Asian Nations ASEAN Investment ... · The Member States of the Association...

one visionone identity
one community
ASEAN Investment Report
2015Infrastructure Investment and Connectivity
Association of S
outheast Asian N
ationsA
SE
AN
INV
ES
TM
EN
T R
EP
OR
T 2015: ASEAN
: @ASEAN
: www.asean.org
www.unctad.org
Invest in ASEAN


ASEAN Investment Report 2015
Infrastructure Investment and Connectivity
The ASEAN SecretariatUnited Nations Conference on
Trade and Development

The Association of Southeast Asian Nations (ASEAN) was established on 8 August 1967. The Member States of the Association are Brunei Darussalam, Cambodia, Indonesia, Lao PDR, Malaysia, Myanmar, Philippines, Singapore, Thailand and Viet Nam. The ASEAN Secretariat is based in Jakarta, Indonesia.
For inquiries, contact:The ASEAN SecretariatPublic Outreach and Civil Society Division70A Jalan SisingamangarajaJakarta 12110IndonesiaPhone : (62 21) 724-3372, 726-2991Fax : (62 21) 739-8234, 724-3504E-mail : [email protected]
General information on ASEAN appears online at the ASEAN Website: www.asean.org
Catalogue-in-Publication Data
ASEAN Investment Report 2015Jakarta: ASEAN Secretariat, November 2015
332.673951. Investment - ASEAN2. Economics - Foreign Direct Investment
ISBN 978-602-0980-51-5
ASEAN: A Community of Opportunities
The text of this publication may be freely quoted or reprinted, provided proper acknowledgement is given and a copy containing the reprinted material is sent to Public Outreach and Civil Society Division of the ASEAN Secretariat, Jakarta.
Copyright Association of Southeast Asian Nations (ASEAN) 2015.All rights reserved.
This publication was prepared by the ASEAN Secretariat and the United Nations Conference on Trade and Development (UNCTAD), and supported by the Government of Australia through the ASEAN-Australia Development Cooperation Program Phase II (AADCP II).
The map in this publication is only indicative and is not drawn to scale.

Disclaimer
The ASEAN Investment Report is produced to facilitate a better understanding of FDI developments in ASEAN. The findings, interpretations, and analysis in the Report should be treated with care, as work on harmonising and improving FDI quality across the region is on-going.
The ASEAN Secretariat and UNCTAD have taken due diligence in the preparation of this publication. However, they shall not be held liable for any omissions or inaccuracies in the content of this publication. The use of company’s name or cases does not imply endorsement by the ASEAN Secretariat, UNCTAD and the Government of Australia. Neither the ASEAN Secretariat, UNCTAD and the Government of Australia accepts any liability for any claims, loss or expenses that may arise or arising from use of information in this publication. Reliance on the information is at the user’s sole risk/responsibility.


FOREWORD
Foreign Direct Investment (FDI) into ASEAN has risen for the third consecutive year from $117.7 billion in 2013 to $136.2 billion in 2014. Despite a 16% decline of global FDI flows in 2014, ASEAN Member States have collectively received the largest FDI among developing countries. Due to robust regional economic fundamentals, cost advantages, regional integration, and on-going efforts to improve the investment environment in ASEAN, the region is now seen as a prime investment destination, attracting investments and influencing corporate strategies in the region.
Investments from ASEAN Member States also continue to rise, reaching $24.4 billion in 2014 from $19.4 billion of the previous year. With intra-ASEAN investment accounting for 18% of the total FDI into the region, ASEAN is now the 2nd largest investor in its own region, manifesting greater interest from the business community to have a stronger regional presence in light of the establishment of the ASEAN Economic Community by the end of 2015.
This year’s ASEAN Investment Report focuses on infrastructure investment and connectivity – both critical in supporting the region’s economic growth as they improve logistical efficiency, reduce transaction costs and support greater flow of trade and investment. Highlighting the important role of the private sector in helping governments to bridge the infrastructure gap in ASEAN and the linkages of various players across the infrastructure value chain, this Annual Report continues to provide useful updates on the latest developments in the ASEAN investment landscape.
With strategic measures in the ASEAN Community Vision 2025 aimed to establish an open, transparent and predictable investment regime in the region beyond 2015, ASEAN will continue to make the region a foremost investment destination globally.
LE LUONG MINHSecretary-General of ASEAN
v

ACKNOWLEDGEMENTS
The ASEAN Investment Report 2015 was prepared under a technical cooperation arrangement between the ASEAN Secretariat and the UNCTAD Division on Investment and Enterprise (DIAE).
The Report was prepared and written by Wee Kee Hwee and Hafiz Mirza. It was overseen by Lim Hong Hin, Deputy Secretary-General of ASEAN for ASEAN Economic Community, ASEAN Secretariat and James Zhan, Director, DIAE, UNCTAD.
The Report benefited from support and contribution provided by the teams at the Services and Investment Division (SID) and the Infrastructure Division at the ASEAN Secretariat. The SID team was led by Tan Tai Hiong and supported by Madelyn Joy Almazora.
The Report benefitted from specific inputs provided by Michael Minges and Torbjorn Fredriksson, Maricel Macesar, Yanfei Li, Christie Richards, Eddy Krismeidi Soemawilaga and Joerg Weber. Other materials for the Report were provided by Paul C.G. Gwee, Jan Hoffmann, Florian Kitt, Sarianna Lundan, Noelia Garcia Nebra, Tran Dong Phuong, Giang Thanh Tung and Megasari Widyaty.
Comments at different stages in the preparation of the Report were provided by members of the ASEAN Coordinating Committee on Investment (CCI) and Choo Wai Meng. The Report has also benefitted from the work of the ASEAN Working Group on International Investment Statistics.
Statistical assistance was provided by Elizabeth Alarilla, Brad Boicourt, Michael Hanni and Sri Wardhani. Hilvy Hanriany, Anne Bouchet, Catherine Corpuz and Sovyana Putranti provided administrative support.
The manuscript was copy-edited with the assistance of Lise Lingo and typeset by Tess Ventura.
Research assistance was provided by Karim Kirollos and Nattanit Mei Fang Wee.
The financial support of the Government of Australia is gratefully acknowledged.
Any correspondences or queries on the content of the AIR should be addressed to:
Services and Investment DivisionMarket Integration DirectorateASEAN Economic Community DepartmentASEAN Secretariat, 70A Jl. Sisingamangaraja,Jakarta 12110, IndonesiaEmail: [email protected]
ASEAN INVESTMENT REPORT 2015: Infrastructure Investment and Connectivity
vi

TAbLE OF CONTENTS
FOREWORD ......................................................................................... v
ACKNOWLEDGEMENTS ...................................................................... vi
AbbREVIATIONS ................................................................................. xi
OVERVIEW ..........................................................................................xv
PART ONE: FDI AND MNEs’ DEVELOPMENT IN ASEAN
ChAPTER 1: FDI DEVELOPMENT AND CORPORATE INVESTMENT STRATEGIES ..................................................................3
1.1. Introduction .................................................................................................3
1.2. FDI trends and developments in 2014 ........................................................3
1.2.1. FDI in ASEAN ................................................................................................ 3
1.2.2. Intra-ASEAN investment ................................................................................ 5
1.2.3. CLMV recipients ............................................................................................ 9
1.2.4. Factors and reasons for 2014 developments .............................................. 18
1.3. MNEs’ strategies and operations in 2014–2015 ........................................20
1.3.1. Foreign MNEs’ continued regional expansion ............................................. 21
1.3.2. Regional players and intraregional corporate investment ........................... 26
1.3.3. Cross-border M&As ..................................................................................... 30
1.4. Policy developments .................................................................................32
1.4.1. Reform and improvement of investment policies ........................................ 33
1.4.2. Investment incentives and tax reforms ........................................................ 34
1.4.3. Investment facilitation and ease of doing business measures .................... 35
1.4.4. Regional and bilateral investment agreements ............................................ 37
1.5. Outlook for 2015-2016 ..............................................................................38
1.6. ASEAN: a rapidly growing South–South cooperation partner ....................40
1.7. Conclusion ................................................................................................47
vii

PART TWO: INFRASTRuCTuRE INVESTMENT AND CONNECTIVITy IN ASEAN
ChAPTER 2: INFRASTRuCTuRE INVESTMENT AND PRIVATE SECTOR PLAyERS IN ASEAN ...........................................................................53
2.1. Introduction ...............................................................................................53
2.2. The importance of infrastructure to ASEAN ..............................................54
2.2.1. Electricity ..................................................................................................... 55
2.2.2. Telecommunication ...................................................................................... 56
2.2.3. Transport ..................................................................................................... 61
2.2.4. Other infrastructure ...................................................................................... 64
2.3. Infrastructure investment needs ..............................................................65
2.4. Foreign private participation in infrastructure in ASEAN ..........................69
2.4.1. FDI in infrastructure ..................................................................................... 71
2.4.2. M&As in infrastructure ................................................................................ 75
2.4.3. Participation through NEMs ........................................................................ 78
2.5. Infrastructure players .............................................................................79
2.5.1. Public versus private sector ........................................................................ 80
2.5.2. Infrastructure players: developed versus developing economies ............... 80
2.5.2.1. Prominence of Chinese MNEs ....................................................... 85
2.5.2.2. Increasing participation of ASEAN companies ............................. 89
2.5.3. Infrastructure financiers and other players .................................................. 94
2.5.4. Sovereign wealth funds ............................................................................... 98
2.6. Conclusion ................................................................................................99
ChAPTER 3: INFRASTRuCTuRE VALuE ChAINS AND MOTIVATIONS OF MNES IN ASEAN ..................................................103
3.1. Introduction .............................................................................................103
3.2. Infrastructure value chains in ASEAN ....................................................103
3.2.1. Electricity value chains .............................................................................. 105
3.2.2. Telecommunication value chains ............................................................... 123
ASEAN INVESTMENT REPORT 2015: Infrastructure Investment and Connectivity
viii

3.2.3. Transport value chains ............................................................................... 129
3.2.4. ICT-enabled value chains: e-commerce .................................................... 135
3.3. Drivers and motivations of MNEs’ infrastructure investment .................138
3.4. Conclusion ..............................................................................................144
ChAPTER 4: INFRASTRuCTuRE AND ECONOMIC CONNECTIVITy IN ASEAN ................................................................147
4.1. Introduction .............................................................................................147
4.2. ASEAN connectivity .................................................................................148
4.2.1. Infrastructure connectivity ......................................................................... 148
4.2.1.1. Electricity...................................................................................... 151
4.2.1.2. Transport ...................................................................................... 155
4.2.1.3. ICT ................................................................................................ 160
4.2.2. Regional economic connectivity ............................................................... 163
4.2.3. Subregional connectivity ........................................................................... 169
4.2.4. Extraregional sources of connectivity ........................................................ 170
4.3. Impacts of regional connectivity .............................................................170
4.3.1. Electricity connectivity impact ................................................................... 170
4.3.2. Transport connectivity impact ................................................................... 174
4.3.3. ICT impact ................................................................................................. 175
4.3.4. Spillover benefits ....................................................................................... 176
4.4. MNEs’ role in regional connectivity .........................................................176
4.5. Regional - subregional connectivity projects ..........................................183
4.6. Conclusion ..............................................................................................183
REFERENCES ..................................................................................189
ANNExES ........................................................................................197
Table of Contents
ix


AbbREVIATIONS
ACIA ASEAN Comprehensive Investment AgreementAEC ASEAN Economic CommunityAFAS ASEAN Framework Agreement on ServicesAFTA ASEAN Free Trade AreaAHN ASEAN Highway NetworkAIA ASEAN Investment AreaAICO ASEAN Industrial CooperationAIR ASEAN Investment ReportAPG ASEAN Power GridATIGA ASEAN Trade in Goods AgreementBITs bilateral investment treatiesBOT build-operate-transferBOO build-operate-ownBTO build-transfer-operateCEPT-AFTA Common Effective Preferential Tariff Scheme for AFTADTTs double taxation treatiesEPC engineering, procurement and constructionFDI foreign direct investmentFTAs free trade agreementsGDP gross domestic productGFCF gross fixed capital formationGLCs Government-linked companiesHAPUA Head of ASEAN Power Utilities/AuthoritiesICT information and communication technologyIIA international investment agreementsIPP independent power producerM&A mergers and acquisitionMDB multilateral development bankMLA mandated lead arrangerMNEs multinational enterprisesMRA mutual recognition arrangementMW megawattsNEMs non-equity modalitiesO&M operation and management
Abbreviations
xi

OBM original brand manufacturerODA official development assistanceOFDI outward foreign direct investmentPPA power purchase agreementPPI private participation in infrastructurePPP public-private partnershipRCEP Regional Comprehensive Economic PartnershipRORO Roll-On/Roll-OffRVCs regional value chainsSEA-ME-WE South East Asia–Middle East–Western EuropeSEZ special economic zoneSIM subscriber identity moduleSKRL Singapore-Kunming Rail LinkSOEs State-owned enterprisesSMEs small and medium-sized enterprisesSWF sovereign wealth fundTAGP Trans-ASEAN Gas PipelineTEU twenty-foot equivalent unitUNCTAD United Nations Conference on Trade and DevelopmentWIR World Investment ReportWSS water supply and sanitation
ASEAN INVESTMENT REPORT 2015: Infrastructure Investment and Connectivity
xii

Overview
xiii
OVERVIEW

160,000
140,000
120,000
100,000
80,000
60,000
40,000
20,000
0

Overview
xv
OVERVIEW
FDI DEVELOPMENT AND CORPORATE INVESTMENT STRATEGIES
FDI flows to ASEAN rose for the third consecutive year, from $117.7 billion in 2013 to $136.2 billion in 2014, despite a 16% decline in global flows (figure 1). This level exceeded inflows to China for the first time since 1993, making ASEAN the largest recipient of FDI in the developing world. Most Member States witnessed an increase in FDI flows last year.
A number of key developments contributed to the further annual rise in FDI. Foreign MNEs and other ASEAN companies continued to expand their operations in the region in a range of industries for a number of various reasons. Regional expansion strategies of foreign and ASEAN companies remain a key aspect of the region’s investment landscape in 2014 and 2015. FDI in services increased significantly last year. The region’s investment environment also improved further as more regional and national measures favourable to FDI were introduced or announced. Behind these motives are strong regional economic fundamentals such as cost advantages and market factors, including regional integration, attracting investment and influencing corporate strategy in ASEAN. The major sources of investment in 2014 remained largely the same as in 2013, with two-thirds of FDI continuing to come from the top five investment source regions and economies, namely the European Union (EU), intra-ASEAN and Japan, the United States as well as Hong Kong (China).
The rise in FDI in 2014 was also driven by an increase in intraregional investment and strong FDI flows from a majority of ASEAN’s Dialogue Partners. They include Australia, China, the EU, the Republic of Korea and the United States. However, FDI flows from
Figure 1.FDI flows to ASEAN rose by 16%, to $136 billion in 2014 overtakingChina as the largest FDI recipient(Millions of dollars)
0
20 000
40 000
60 000
80 000
100 000
120 000
140 000
160 000
2005 2006 2007 2008 2009 2010 2011 2012 2013 2014
Source: ASEAN Secretariat, ASEAN FDI Database (accessed 1 July 2015).
FDI flows to the region rose by 16%, to $136 billion in 2014 – making ASEAN the largest FDI recipient in the developing world
160,000
140,000
120,000
100,000
80,000
60,000
40,000
20,000
0

ASEAN INVESTMENT REPORT 2015: Infrastructure Investment and Connectivity
xvi
Japan to the region plummeted by 39%, to $13.4 billion, reflecting the general downward global FDI trend of Japanese investment in 2014. Notwithstanding the FDI decline, Japan remained the largest investor in manufacturing activities in the region last year. The EU was the largest investor as a whole, followed by ASEAN. Increased FDI from France, Luxembourg and the United Kingdom contributed to the rise in the EU’s investment.
Intra-ASEAN investment rose by 26%, from $19.4 billion in 2013 to $24.4 billion in 2014 – accounting for 18% of total inflows into the region (figure 2). This upward intraregional investment trend suggests a growing interest of ASEAN companies in establishing a stronger regional presence, in particular in recent years, in light of emerging opportunities and the influence of the impending ASEAN Economic Community (AEC) 2015.
Manufacturing FDI declined to $22.2 billion from $33.3 billion in 2013 but this was compensated for by a strong surge in FDI in finance, from $28.3 billion in 2013 to $43.1 billion. FDI in agriculture also rose from $2.3 billion to $4.5 billion, while investment in the extractive industries declined from $8.0 billion to $7.3 billion. FDI from the EU and the United States dominated in finance, while investments by ASEAN companies were to the fore in the primary sector (agriculture and mining activities) and real estate.
A notable aspect of the changing landscape of FDI in ASEAN is the growing frequency of transfers of labour-intensive manufacturing activities from higher-cost locations in other Asian economies and within ASEAN to the CLMV (Cambodia, Lao PDR, Myanmar and Viet Nam) countries, as well as other ASEAN Member States such as Indonesia. This development is strengthening further regional production networks and regional value chains - boosting connectivity between CLMV countries and the other ASEAN Member States as production from the former is supplied to affiliates or customers based in the latter. This industrial connectivity is contributing to the development of supporting industries and
Figure 2. Intra-ASEAN investment rose by 26% to $24.4 billion in 2014(Millions of dollars)
Source: ASEAN Secretariat, ASEAN FDI Database (accessed 1 July 2015).
0
5'000
10'000
15'000
20'000
25'000
30'000
2000 2001 2002 2003 2004 2005 2006 2007 2008 2009 2010 2011 2012 2013 2014
30,000
25,000
20,000
15,000
10,000
5,000
0

Overview
xvii
increasing the region’s manufacturing competitiveness, which draws on the complementary locational advantages increasingly being tapped by multinational enterprises (MNEs) and ASEAN companies. Furthermore, the rise in regional economic activities by MNEs and companies from the other ASEAN Member States is helping bridge the development divide in the region through investment.
In 2014–2015, ASEAN Member States continued to introduce measures favourable to investment. They included measures to make investing easier, increase transparency and improve the investment environment. Others included national investment policy reforms, industrial development policies, incentives and tax reforms, investment facilitation, streamlining of investment procedures, strengthening of institutional support for investors, establishment of more economic zones and infrastructure development. The ASEAN Member States are also involved with other investment-related agreements at the bilateral, plurilateral and regional levels, at various stages of negotiation and development. They include investment agreements for ASEAN free trade agreements with Dialogue Partners and the Regional Comprehensive Economic Partnership. Some Member States continue to negotiate and implement bilateral and plurilateral free trade agreements that include investment agreements or chapters, and bilateral investment treaties.
Achieving a fourth consecutive year of higher FDI inflows in 2015 is likely to pose a challenge for the region. Cross-border merger and acquisition (M&A) sales and FDI flows to ASEAN in the first half of 2015 were down, against the backdrop of global economic fragilities and slower regional growth. However, the level of inflows will remain high – close to the level of 2014. The outlook for 2016 is cautiously optimistic, but much depends on the health of the global economy and corporate investment plans as well as the delivery of the AEC benefits in both depth and scope. Supporting further investment into the region in 2016 and beyond are the region’s strong macroeconomic fundamentals, economic resilience, increasingly affluent consumers and influences of regional integration, as well as the cost competitiveness of the region, the strong cash holdings of ASEAN companies and the continued regional investment expansion plans of investors. Various recent surveys of companies highlight that a growing number of MNEs have favourable perceptions of the region that have translated into investment. Many have investment plans that target the region in the next few years.
ASEAN is also a major source of FDI for other developing countries. Outward FDI flows from the region to the world rose by 19% in 2014, to $80 billion. In perspective, this is greater than the outward flows of France and Spain combined, and more than 2.5 times those of the Republic of Korea in 2014. Companies from the region are expected to continue to internationalize in 2015 and beyond, including using more M&A strategies in accessing markets – further strengthening South-South partnerships. The increasing financial strength of ASEAN MNEs – their strong profitability and cash holdings – is encouraging them to regionalize and internationalize. Emerging investment opportunities abroad are also driving investment overseas. The top 100 ASEAN companies by market capitalization had combined cash holdings of $228 billion and combined assets of nearly $3 trillion in 2014. Most of them have operations in other ASEAN Member States (table 1).

ASEAN INVESTMENT REPORT 2015: Infrastructure Investment and Connectivity
xviii
Table 1. Top 100 ASEAN companies have strong assets and significant cash holdings, 2014 (Millions of dollars)
Company Country Industry
2014
Net income Total assets Market capitalization
Cash or near cash holding
Singapore Telecommunications Singapore Telecommunication 2,901 31,249 46,219 410DBS Group Holdings Singapore Banks 3,194 332,653 38,447 14,733Overseas-Chinese Banking Corp Singapore Banks 3,033 302,881 31,457 19,109United Overseas Bank Singapore Banks 2,565 231,551 29,678 26,484PTT Thailand Oil, gas and consumable fuels 1,718 54,062 28,120 6,199Bank Central Asia Indonesia Banks 1,391 44,443 26,034 4,710Malayan Banking Malaysia Banks 2,053 182,864 24,405 18,858Bank Rakyat Indonesia Indonesia Banks 2,045 64,518 23,121 5,935Advanced Info Service Thailand Telecommunication (wireless) 1,110 3,839 22,675 434Telekomunikasi Indonesia Indonesia Telecommunication 1,235 11,335 22,629 1,424Tenaga Nasional Malaysia Electric utilities 2,000 34,993 22,093 2,565Avago Technologies Singapore Semiconductors 263 10,491 21,936 1,604Bank Mandiri Indonesia Banks 1,676 68,788 20,227 5,746Public Bank Malaysia Banks 1,381 98,735 20,181 3,220Siam Commercial Bank Thailand Banks 1,642 82,033 18,771 1,282Sime Darby Malaysia Industrial conglomerates 1,034 15,871 18,271 ..Axiata Group Malaysia Telecommunication (wireless) 718 14,030 17,279 1,457Kasikornbank Thailand Banks 1,421 72,596 16,653 1,’764Siam Cement Thailand Construction materials 1,035 14,154 16,335 579Wilmar International Singapore Food products 1,156 43,558 15,642 3,127Maxis Malaysia Telecommunication (wireless) 525 5,172 14,685 437SM Investments Corp Philippines Industrial conglomerates 640 15,912 14,506 1,546Philippine Long Distance Tel Philippines Telecommunication (wireless) 768 9,752 14,030 596Digi.Com Malaysia Telecommunication (wireless) 621 1,229 13,700 150PTT Explor & Prod Public Co Thailand Oil, gas and consumable fuels 662 23,328 13,511 3,947CIMB Group Holdings Bhd Malaysia Banks 950 118,280 13,376 10,332Thai Beverage Thailand Beverages 668 5,226 13,079 68Petronas Gas Malaysia Gas utilities 563 3,787 12,523 182Petronas Chemicals Group Malaysia Chemicals 754 8,129 12,452 2,584Keppel Corp Singapore Industrial conglomerates 1,488 23,820 12,104 4,330Perusahaan Gas Negara Indonesia Gas utilities 723 6,215 11,719 1,216CP Thailand Food and staples retailing 313 9,918 11,601 980IHH Healthcare Malaysia Health care 231 8,179 11,258 704Bangkok Bank Thailand Banks 1,119 83,862 11,252 1,822SM Prime Holdings Philippines Real estate 414 8,691 10,999 788Ayala Land Philippines Real estate 333 8,693 10,689 641Capitaland Singapore Real estate 916 33,301 10,641 2,043Airports of Thailand Thailand Transportation infrastructure 379 4,741 10,525 216IOI Corp Malaysia Food products 1,040 4,777 10,396 ..JG Summit Holdings Philippines Industrial conglomerates 411 12,489 10,352 838Global Logistic Properties Singapore Real estate 685 13,947 10,025 1,446Genting Singapore Singapore Hotels, restaurants and leisure 501 9,566 9,870 2,791Singapore Airlines Singapore Airlines 286 17,995 9,786 3,826Krung Thai Bank Thailand Banks 1,022 83,238 9,640 2,269Ayala Corporation Philippines Diversified financial services 419 16,228 9,609 2,030Genting Malaysia Hotels, restaurants and leisure 553 20,932 9,419 4,681Gudang Garam Indonesia Tobacco 453 4,684 9,396 128MISC Malaysia Marine 674 11,876 9,204 1,382Bank Negara Indonesia Indonesia Banks 910 33,514 9,152 2,904Universal Robina Corp Philippines Food products 262 1,734 9,078 224BDO Unibank Philippines Banks 514 41,655 8,788 6,951Great Eastern Holdings Singapore Insurance 694 49,579 8,572 2,457

Overview
xix
Company Country Industry2014
Net income Total assets Market capitalization
Cash or near cash holding
Bank of the Philippine Islands Philippines Banks 406 32,414 8,262 5,598Bangkok Dusit Med Service Thailand Health care 228 2,833 8,096 109Singapore Tech Engineering Singapore Aerospace and defense 420 6,280 8,003 1,104Sapurakencana Petroleum Malaysia Energy equipment and services 343 7,948 7,856 345Hong Leong Bank Malaysia Banks 648 53,079 7,735 ..Semen Indonesia Indonesia Construction materials 469 2,761 7,731 397Intouch Holdings Thailand Telecommunication (wireless) 455 1,662 7,672 90Telekom Malaysia Malaysia Telecommunication 254 6,461 7,308 853Aboitiz Power Corp Philippines Independent power producers 376 4,845 7,056 900City Developments Singapore Real estate 608 14,872 7,050 2,817PTT Global Chemical Thailand Chemicals 463 12,299 7,021 469Dynasty Ceramic Thailand Building products 38 158 7,005 6Total Access Communication Thailand Telecommunication (wireless) 330 3,234 6,943 177Kalbe Farma Indonesia Pharmaceuticals 174 1,’000 6,901 153Kuala Lumpur Kepong Malaysia Food products 307 3,928 6,842 395AMMB Holdings Malaysia Banks 557 40,643 6,646 3,771Genting Malaysia Malaysia Hotels, restaurants and leisure 363 5,940 6,591 791Aboitiz Equity Ventures Philippines Industrial conglomerates 414 6,281 6,524 1,129Manila Electric Company Philippines Electric utilities 407 6,014 6,449 1,553Petrovietnam Gas Joint Stock Viet Nam Gas utilities 667 2,516 6,249 1,126Central Pattana Thailand Real estate 225 2,705 6,205 76Sembcorp Industries Singapore Industrial conglomerates 632 12,966 5,994 1,254Singapore Exchange Singapore Finance 254 1,316 5,963 ..Big C Supercenter Thailand Food and staples retailing 223 3,123 5,941 347RHB Capital Malaysia Banks 623 62,646 5,598 6,185Charoen Pokphand Thailand Food products 325 12,664 5,472 1,021Starhub Singapore Telecommunication (wireless) 292 1,500 5,412 199Singapore Press Holdings Singapore Media 322 5,326 5,371 355Capitaland Mall Trust Singapore Real estate investment trusts 489 7,442 5,332 853Siam Makro Thailand Food and staples retailing 150 1,327 5,287 139Hong Leong Financial Group Malaysia Banks 526 59,256 5,268 ..International Container Terminal Services Philippines Transportation infrastructure 182 3,401 5,235 194
YTL Corp Malaysia Multi-utilities 479 19,020 5,231 ..Sembcorp Marine Singapore Machinery 442 6,219 5,143 813Globe Telecom Philippines Telecommunication (wireless) 301 4,012 5,133 375Jollibee Foods Corp Philippines Hotels, restaurants and leisure 121 1,210 5,127 170Alliance Global Group Philippines Industrial conglomerates 298 9,156 5,114 1,835Metropolitan Bank & Trust Philippines Banks 453 35,864 5,092 5,594Charoen Pokphand Indonesia Indonesia Food products 147 1,678 4,987 71Petronas Dagangan Malaysia Oil, gas and consumable fuels 153 2,725 4,857 525PPB Group Malaysia Food products 280 5,313 4,842 194DMCI Holdings Philippines Industrial conglomerates 243 3,066 4,659 341Astro Malaysia Holdings Malaysia Media 141 2,121 4,564 372Vietnam Dairy Products Jsc Viet Nam Food products 286 1,205 4,467 71Golden Agri-Resources Singapore Food products 114 14,667 4,458 323Ascendas Real Estate Investment Trust Singapore Real estate investment trusts 383 5,848 4,317 30SIA Engineering Singapore Transportation infrastructure 211 1,357 4,291 44Comfortdelgro Corp Singapore Road and rail 224 3,949 4,199 623Total 70,553 2,928,468 1,131,906 228,137
Source: UNCTAD 2015b, based on Bloomberg.
Table 1. Top 100 ASEAN companies have strong assets and significant cash holdings, 2014 (Millions of dollars) (concluded)

ASEAN INVESTMENT REPORT 2015: Infrastructure Investment and Connectivity
xx
INFRASTRuCTuRE INVESTMENT AND PRIVATE SECTOR PLAyERS IN ASEAN
Infrastructure plays an important role in the region’s economic, social and environmental development, including through boosting connectivity. As the backbone of the economy in all the ASEAN Member States, it contributes to improving the region’s investment environment for attracting FDI. Greater connectivity of national transport infrastructure enhances logistical efficiency and supports the growth of investment, trade and commerce. Investment in power infrastructure increases energy security, provides electricity to industrial estates in rural areas and is essential for achieving universal access for all. As with other infrastructure sectors, the provision of information and communication technology (ICT) infrastructure supports downstream businesses such as e-commerce and connects Member States with each other, as well as with the world. Infrastructure development plays an important role in reducing the transaction costs of doing business in the region.
ASEAN Member States have invested in infrastructure to varying degrees in terms of spending and development. However, further infrastructure investment is needed across a wide range of economic, social and environmental sectors if Member States are to achieve their economic plans and other objectives, including those related to national and regional connectivity. The private sector has been a significant player in the region’s infrastructure development. The roles of banks, other financial institutions and donors of official development assistance (ODA) in supporting infrastructure development have also been important.
The infrastructure investment needs for the region through 2025 – covering power, transport, ICT, and water and sanitation – are huge. Some $110 billion a year will be needed for infrastructure investment in these sectors. Given the current spending by Member States, the infrastructure investment gap will be equally huge but resources need to be found if the gap is to be filled and future demand is to be met. The private sector can play a greater role to help bridge the gap. There is a need for a more concerted effort by all stakeholders to mobilize and channel investment from additional potential resources to infrastructure in the region. Filling the gap is possible. For instance, in addition to resources outside the region that can also be tapped, there is at least $10 trillion worth of assets in ASEAN Member States – mostly with the private sector – that can be potential sources of funding.
The private sector participates in the region’s infrastructure development through a number of modalities. They include FDI, M&As, privatization, non-equity modalities (concessions and contracts), and partnership or consortium arrangements. Some modalities are more significant than others for private sector participation. The privatization of public infrastructure and the maturity of the M&A environment, including opportunities to acquire assets in a host country, can influence private sector participation. Firms’ experience, skill sets and ability to win contracts are additional influences. MNEs from developed and developing economies, including from ASEAN, are participating in infrastructure

Overview
xxi
development in the region through contractual arrangements, whether as engineering, procurement and construction (EPC) contractors or subcontractors (table 2). They also invest, build, operate and manage infrastructure assets. Concessionary arrangements and contracts, a form of NEM, continue to be key features of MNEs’ participation in infrastructure development in ASEAN.
Table 2. MNEs from both developed and developing economies participate in ASEAN infrastructure development (Selected cases)
MNEs Home country Industry
Sumitomo Corporation Japan Power and electricity
Mitsubishi Corporation Japan Power and electricity
Itochu Corporation Japan Power and electricity
Kyushu Electric Power Japan Power and electricity
Toshiba Japan Power and electricity
Electric Power Development Company Japan Power and electricity
Marubeni Japan Power and electricity
Ormat International United States Power and electricity
APR Energy United States Power and electricity
AES Corporation United States Power and electricity
GE United States Power and electricity
Xylem United States Power and electricity
ACO Investment Group United States Power and electricity
SunEdison United States Power and electricity
Open Systems International United States Power and electricity
Alstom France Power and electricity
Prysmian Power Link SRL Italy Power and electricity
Conergy AG Germany Power and electricity
Statkraft Norfund Power Invest AS Norway Power and electricity
China Southern Grid International China Power and electricity
China Huadian Corporation China Power and electricity
China National Heavy Machinery Corporation China Power and electricity
China Datang Corporation China Power and electricity
Hydrolancang International Company China Power and electricity
Southern Power Grid Company Limited China Power and electricity
China Power International Holdings Limited China Power and electricity
Korean Electric Power Corporation Republic of Korea Power and electricity
Hyundai Engineering Company Republic of Korea Power and electricity
Daelim Industrial Company Republic of Korea Power and electricity
Doosan Heavy Industries and Construction Republic of Korea Power and electricity
SK Engineering and Construction Republic of Korea Power and electricity
South Korea Electric Power Corporation Republic of Korea Power and electricity
Korea Western Power Republic of Korea Power and electricity

ASEAN INVESTMENT REPORT 2015: Infrastructure Investment and Connectivity
xxii
MNEs Home country Industry
Sumitomo Mitsui Construction Japan Transport
Mitsui Company Limited Japan Transport
Tokyu Corporation Japan Transport
Obayashi Corporation Japan Transport
Shimizu Corporation Japan Transport
Takenaka Corporation Japan Transport
GE United States Transport
Alstom Transport France Transport
Invensys Rail United Kingdom Transport
Damen Netherlands Transport
A.P. Moeller-Maersk Denmark Transport
Fraport AG Germany Transport
Vinci Group France Transport
TUV Rheinland Group Germany Transport
China Railway Group China Transport
Guangxi Beibu International Port Group China Transport
China Merchants Group China Transport
China CAMC Engineering Company China Transport
China Harbour Engineering Company China Transport
Shanghai Tunnel Engineering Company China Transport
China Railway No. 5 Engineering Group Company China Transport
Yunnan Sunny Road and Bridge Company China Transport
Lotte Engineering and Construction Republic of Korea Transport
Samsung C&T Corporation Republic of Korea Transport
Daelim Industrial Company Republic of Korea Transport
Daewoo Engineering and Construction Company Republic of Korea Transport
NTT Docomo Japan Telecommunication
KDDI Japan Telecommunication
Huawei China Telecommunication
ZTE China Telecommunication
China Telecom Global Limited China Telecommunication
China Telecommunications Corporation China Telecommunication
Source: UNCTAD, based on Table 2.9.
Table 2. MNEs from both developed and developing economies participate in ASEAN infrastructure development (Selected cases) (concluded)
MNEs from developed countries have been involved in infrastructure development in ASEAN for a long time. More recently, Chinese infrastructure-related companies have become notable players in building infrastructure in ASEAN in a very short period of time. These Chinese players not only operate as contractors, but also invest in, own and operate infrastructure. Some have an extensive regional presence through contracts and subsidiaries. In 2014, 62 Chinese companies were among the top 250 international

Overview
xxiii
contractors in terms of revenues, and a majority of these companies are in or are expanding their operations in ASEAN.
The number of ASEAN companies involved in infrastructure development is increasing; such companies are also investing outside the region and building infrastructure in other developing countries. In addition to winning contracts, infrastructure-related companies from Indonesia, Malaysia, the Philippines, Singapore, Thailand and Viet Nam have established subsidiaries in other ASEAN Member States (table 3).
Various types of infrastructure financiers have been playing an important role in providing or arranging finance for infrastructure development in ASEAN. They include ODA donors, MDBs, specialized infrastructure funds, private equity investors, commercial banks and sovereign wealth funds. A significant part of financing for infrastructure projects in the region comes from these sources.
Table 3. Increasing regional presence from some infrastructure–related companies from ASEAN, 2014
Name of companyHome country
IndustryMarket
capitalization ($ million)
Total revenues ($ million)
ASEAN locations of selected subsidiaries or contract operations
Adhi Karya Indonesia Construction, engineering
249 698 Singapore
Axiata Group Malaysia Telecommunication 12,583 5,398 Cambodia, Singapore
Ayala Land Philippines Real estate 10,898 2,011 Malaysia
Bangkok Dusit Medical Services Thailand Hospitals 8,347 1,720 Cambodia, Singapore
Banpu Thailand Mining, electricity 1,607 3,098 Indonesia, Singapore, Thailand
Bukit Asam Indonesia Mining, electricity 948 1,053 Other ASEAN Member States
CapitaLand Singapore Real estate 8,438 3,376 Malaysia, Viet Nam
City Developments Singapore Real estate 5,275 3,118 Indonesia, Malaysia, Myanmar,Philippines, Thailand, Viet Nam
EGAT Thailand Electricity .. 16,508 Lao PDR, Myanmar
EGCO Thailand Electricity .. 78 Indonesia, Lao PDR, Philippines and Thailand
Enco Holdings Malaysia Engineering .. .. Indonesia and Thailand
First Philippine Holdings Corporation
Philippines Conglomerate 2,260 874 Indonesia, Singapore, Thailand
Gamuda Malaysia Infrastructure 2,675 775 Viet Nam
Genting Berhad Malaysia Conglomerate (Electricity)
6,912 5,486 Indonesia
Gunkul Thailand Electricity 660 91 Singapore
IHH Healthcare Malaysia Hospitals 11,457 2,175 Indonesia, Singapore
International Container Terminal Philippines Harbour facilities 3,945 1,119 Indonesia
Intouch Holdings Thailand Telecommunication 6,893 315 Cambodia, Singapore
Italian-Thai Development Thailand Infrastructure 1,231 1,477 Cambodia, Indonesia, Lao PDR, Malaysia, Myanmar, Philippines, Viet Nam
Keppel Corporation Singapore Conglomeratea 9,190 10,086 Indonesia, Malaysia, Myanmar,Philippines, Thailand, Viet Nam
KPJ Healthcare Malaysia Hospitals 1,056 766 Indonesia, Singapore, Thailand

ASEAN INVESTMENT REPORT 2015: Infrastructure Investment and Connectivity
xxiv
Name of companyHome country
IndustryMarket
capitalization ($ million)
Total revenues ($ million)
ASEAN locations of selected subsidiaries or contract operations
Malaysia Airports Malaysia Airports 2,252 991 Manages airports in Cambodia andoutside ASEAN
Manila Water Philippines Water 918 367 Singapore, Viet Nam
Maxis Malaysia Telecommunication 11,985 2,429 Indonesia, Singapore
Metro Pacific Investments Corp. Philippines Road construction 2,997 932 Indonesia, Thailand, Viet Nam
Muhibbha Malaysia Infrastructure, engineering
.. .. Cambodia, Philippines, Singapore
Nusa Konstruksi Enjiniring Tbk Indonesia Construction, engineering
27 165 Malaysia
Philippine Long Distance Telephone
Philippines Telecommunication 12,006 3,832 Malaysia
Port of Singapore Authority Singapore Ports .. 2,877 Indonesia, Thailand, Viet Nam
PTT Thailand Oil and gas 20,174 86,545 Cambodia, Indonesia, Malaysia,Myanmar, Philippines, Thailand, Viet Nam
Ratchaburi Electricity Generating Holding
Thailand Electricity 2,135 1,702 Cambodia, Lao PDR, Singapore
Salcon Singapore Engineering 106 77 Singapore, Viet Nam
San Miguel Philippines Conglomeratea 2,328 17,569 Malaysia, Singapore, Thailand, Viet Nam
Sembcorp Industries Singapore Conglomeratea 4,432 8,317 Indonesia, Malaysia, Philippines, Viet Nam
Semen Indonesia Indonesia Building materials 4,243 2,182 Viet Nam
Siam Cement Thailand Building materials 1,384 14,945 Cambodia, Indonesia, Malaysia, Philippines, Lao PDR, Singapore, Viet Nam
Singapore Telecommunication Singapore Telecommunication 42,060 12,618 Indonesia, Philippines, Malaysia, Philippines, Thailand
Supalai PCL Thailand Real estate 882 566 Philippines, Singapore
Telekom Malaysia Malaysia Telecommunication 6,097 3,256 Indonesia, Singapore
Telekomunikasi Indonesia Indonesia Telecommunication 20,081 7,307 Singapore
Tenaga Nasional Malaysia Electricity 16,103 13,760 Cambodia, Indonesia, Lao PDR, Thailand, Viet Nam
Total Access Communication Thailand Telecommunication 4,445 2,752 Malaysia, Singapore
Truba Alam Manunggal Engineering
Indonesia Construction, engineering
57 105 Singapore
United Envirotech Singapore Engineering 1,224 267 Malaysia
UPP Holdings Singapore Electricity 89 88 Malaysia
Viettel Viet Nam Telecommunication .. .. Cambodia, Lao PDR
YTL Malaysia Utilities 4,043 6,245 Cambodia, Indonesia, Singapore,Thailand
Source: UNCTAD 2015b, based on companies’ information and Orbis.
Note: real estate includes commercial and industrial estates.a Includes various infrastructure.
Table 3. Increasing regional presence from some infrastructure–related companies from ASEAN, 2014 (concluded)

Overview
xxv
INFRASTRuCTuRE VALuE ChAINS AND MOTIVATIONS OF MNES IN ASEAN
Infrastructure value chains in ASEAN are complex and involve networks of players. In segments of these chains, MNEs contribute specific technology and skill sets that support the delivery of infrastructure. Among other roles, MNEs participate as equipment and material suppliers; solution providers; engineering, procurement and construction (EPC) companies; subcontractors; owners or sponsors; and project financiers (figure 3).
MNEs’ motives for investing in infrastructure in ASEAN vary. Winning an infrastructure contract is an important consideration that can influence the establishment of a subsidiary or representative office in a host country or in a region. Most motives are related to market and strategic considerations. Some MNEs invest in infrastructure to support their core business; for instance, shipping companies develop port terminals or telecommunication service providers establish ICT infrastructure in order to achieve overall operational efficiency. Some upstream MNEs invest in downstream infrastructure to establish an integrated business – for example, from mining to power generation. Others invest to diversify into or across infrastructure chains or segments to generate revenues, reduce risk or increase corporate valuation. Yet others pursue a horizontal expansion strategy, investing overseas in order to maximize returns from exploiting their proprietary advantage, knowledge or skill sets (e.g. airport companies invest in or build airport infrastructure abroad).
In general, the value chain of infrastructure industries ranges from design, construction and development to operation and management (O&M). Different companies may be involved at each stage. In some cases, the same company may be involved across a number of segments from development to O&M, which reflects such companies’ integrated business strategy, diversified skills and ability to win multiple contracts. Other companies might be involved at the construction or development stages; and, in a similar vein, companies may also provide only equipment or solutions to EPC contractors in the value chain. Each infrastructure sector has its own specific features and interconnections of different players, involving both local and foreign-owned entities. In some countries and sectors, key value chain segments are dominated by MNEs (e.g. EPC contractors, equipment suppliers, solution providers).
In electricity infrastructure across ASEAN, MNEs frequently operate as EPC contractors of power plants, transmission lines and power stations. Some also invest in and own power plants. These MNEs come from both developed and developing economies.
The telecommunication value chain can be broadly segmented into the provision and construction of infrastructure, the operation of telecommunication services and the provision of value added services. Of particular importance are the inputs used for investment in telecommunication infrastructure. Operators are at the centre of the telecommunication

ASEAN INVESTMENT REPORT 2015: Infrastructure Investment and Connectivity
xxvi
Fig
ure
3.
Pla
yers
in
dif
fere
nt
segm
en
ts o
f an
in
frast
ructu
re v
alu
e c
hain
are
in
terc
on
necte
d (a s
imp
lifi
ed
illu
stra
tion
)
Sou
rce:
UN
CTA
D 2
015b
.N
ote:
see
als
o �g
ure
3.1.
Desi
gn
Raw
mat
eria
ls a
ndpr
imar
y re
sour
ces
Spec
ializ
ed e
quip
men
t or
sol
utio
n pr
ovid
ers
Oper
atio
n an
dm
aint
enan
ceEn
d us
ers/
purc
hase
rs
Com
pani
es p
rovid
ing
raw
m
ater
ials
(e.g
. ste
el,
cem
ent a
nd a
spha
lt) fo
r de
velo
pmen
t or o
pera
tion
of a
n in
frast
ruct
ure
asse
t.
Com
pani
es p
rovid
ing
ener
gy s
ourc
es (e
.g. g
as,
coal
) to
oper
ate
an
infra
stru
ctur
e as
set (
e.g.
po
wer
pla
nt).
Exam
ples
:
Raw
mat
eria
ls:Si
am C
emen
t (Th
aila
nd),
Tata
Ste
el (I
ndia
), Ho
lcim
(S
witz
erla
nd)
Ener
gy s
ourc
es:
Banp
u (T
haila
nd),
Adar
o En
ergy
(Ind
ones
ia),
Petro
nas
Gas
(Mal
aysia
), PT
T (T
haila
nd),
Buki
t Asa
m
(Indo
nesia
), Sh
ell
(Net
herla
nds)
, Che
vron
(U
nite
d St
ates
)
Engi
neer
ing
com
pani
es
and
engi
neer
ing
solu
tions
ent
ities
.So
me
com
pani
es
oper
atin
g as
tech
nolo
gy
and
solu
tion
prov
ider
s,
such
as
GE (U
nite
d St
ates
), Si
emen
s (G
erm
any)
and
ABB
(S
witz
erla
nd),
are
also
in
volv
ed w
ith
engi
neer
ing
desi
gn a
nd
plan
ning
in d
evel
opm
ent
of a
n in
frast
ruct
ure
asse
t.
Com
pani
es p
rovi
ding
sp
ecia
lized
equ
ipm
ent
and
mac
hine
ry (e
.g.
heav
y ea
rthw
ork
mac
hine
s, tu
rbin
es,
gene
rato
rs, w
ind
and
sola
r po
wer
eq
uipm
ent,
cabl
es fo
r te
leco
mm
unic
atio
n,
cran
es fo
r po
rts)
.
Som
e al
so d
evel
op
infr
astr
uctu
re u
nder
co
nces
sion
s or
as
EPC
con
trac
tors
.So
me
prov
ide
syst
em
solu
tions
for
urba
n m
ass
tran
spor
t in
fras
truc
ture
.
Exam
ples
:
Pow
er:
GE
(Uni
ted
Stat
es),
Siem
ens
(Ger
man
y),
ABB
(Sw
itzer
land
), Fu
ji El
ectr
ic (J
apan
), To
shib
a (J
apan
), Al
stom
(Fra
nce)
Urb
an m
ass
tran
spor
t:M
arub
eni a
nd H
itach
i (J
apan
)
Deve
lopm
ent/
cons
truc
tion
Com
pani
es th
at b
uild
th
e in
fras
truc
ture
as
sets
(und
erta
ke th
e en
gine
erin
g,
proc
urem
ent a
nd
cons
truc
tion
of a
n as
set).
In s
ome
case
s th
ese
com
pani
es a
lso
own
the
asse
ts th
ey
deve
lope
d un
der
long
-ter
m c
ontr
actu
al
arra
ngem
ents
with
a
host
cou
ntry
's
auth
ority
.
Exam
ples
:
Pow
er:
Mar
uben
i (Ja
pan)
, GD
F Su
ez (F
ranc
e),
APR
Ener
gy (U
nite
d St
ates
), Si
emen
s (G
erm
any)
, Mits
ui
(Jap
an),
Vest
as
(Den
mar
k), E
lect
ricité
de
Fra
nce,
EGC
O
(Tha
iland
)
Port
s:
PSA
(Sin
gapo
re),
DP
Wor
ld (U
nite
d Ar
ab
Emira
tes)
, Hut
chin
son
Port
s Ho
ldin
g (H
ong
Kong
, Chi
na)
Com
pani
es th
at o
pera
te
and
mai
ntai
n in
frast
ruct
ure
asse
ts.
They
can
incl
ude
com
pani
es th
at b
uild
th
e as
sets
and
co
mpa
nies
app
oint
ed
spec
i�ca
lly to
ope
rate
an
d m
aint
ain
the
asse
ts
unde
rco
nces
sion
s an
d/or
lo
ng-t
erm
ser
vice
co
ntra
ct.
Gov
ernm
ent
agen
cies
, hou
se-
hold
s, p
ublic
use
rs,
busi
ness
and
in
dust
rial u
sers
(e.g
. in
dust
rial e
stat
es)
In th
e po
wer
indu
stry
, som
e co
mpa
nies
sup
ply
equi
pmen
t an
d ar
e al
so th
e EP
C co
mpa
nies
.
Subc
ontr
actin
g
Com
pani
es th
at
rece
ive
cont
ract
s fro
m
EPC
com
pani
es to
co
nduc
t act
iviti
es in
a
give
n se
gmen
t of a
va
lue
chai
n w
ith
infra
stru
ctur
e de
velo
pmen
t asp
ects
. Fo
r ins
tanc
e, a
su
bcon
tract
or m
ay b
e ap
poin
ted
to b
uild
tu
nnel
s fo
r the
co
nstru
ctio
n of
a
hydr
opow
er d
am o
r for
ro
ad, r
ail o
r mar
ine
stru
ctur
es o
r civ
il co
nstru
ctio
n w
orks
.
Exam
ples
:
Firs
t Bal
four
(P
hilip
pine
s),
Blac
k &
Veat
ch (U
nite
d St
ates
),Yo
koga
wa
Elec
tric
(Jap
an),
Anta
ra K
oh
(Sin
gapo
re)

Overview
xxvii
sector value chain. They make the decisions regarding infrastructure investment, users subscribe to their services, and third parties use their networks to provide add-on applications. The starting point for an analysis of ASEAN’s telecommunication segmentation is the operators themselves, particularly retail operators that have facility-based licenses. The ASEAN telecommunication service market has two salient features. One is a relatively high level of privatization. Almost 60% of telecommunication operators are private or partly private entities. The second is foreign involvement with major telecommunication MNEs investing in the region, including supplying ICT equipment and system solutions.
The transport infrastructure value chain is also complex. In ports, for instance, it involves engineering design, construction, development, equipment and material supply, and road and rail construction both in and linking to the port. In road infrastructure, a similar sequence of value chain segments exists. Aside from investors in ports, other players also contribute to ports development by designing or building them. Foreign and local companies in ASEAN also play an important role in airports development in the region. For urban mass rapid transportation systems in the region, a portfolio of local and foreign companies with different skill sets work together to deliver the infrastructure. They include companies contracted for engineering design, rail network construction, station development, civil construction works, tunneling and production of equipment and system solutions, including train sets. A combination of players is also involved at different stages of the road and bridge development process. They include companies providing services for technical design, materials, construction, subcontracting, tunneling, equipment manufacturing and supply, and technology or solution systems.
The strong interconnection of ICT and other downstream businesses has been well documented. The value chain of ICT, in particular telecommunication infrastructure, extends to downstream business operations such as e-commerce. Without ICT infrastructure, e-commerce would not exist in its present form. E-commerce is increasingly an important platform for trade, commerce and business development in the region, which is an important channel for promoting entrepreneurship and small and medium-size enterprises. More and more goods and services are delivered over ICT networks in ASEAN.
Understanding the value chain of infrastructure, the interconnection of different players and their motives for participation is essential. Understanding who plays what roles in which segments of the chains can help governments design or package infrastructure projects for fund raising or skill-acquiring purposes.
ASEAN INVESTMENT REPORT 2015: Infrastructure Investment and Connectivity
xxviii
INFRASTRuCTuRE AND ECONOMIC CONNECTIVITy IN ASEAN
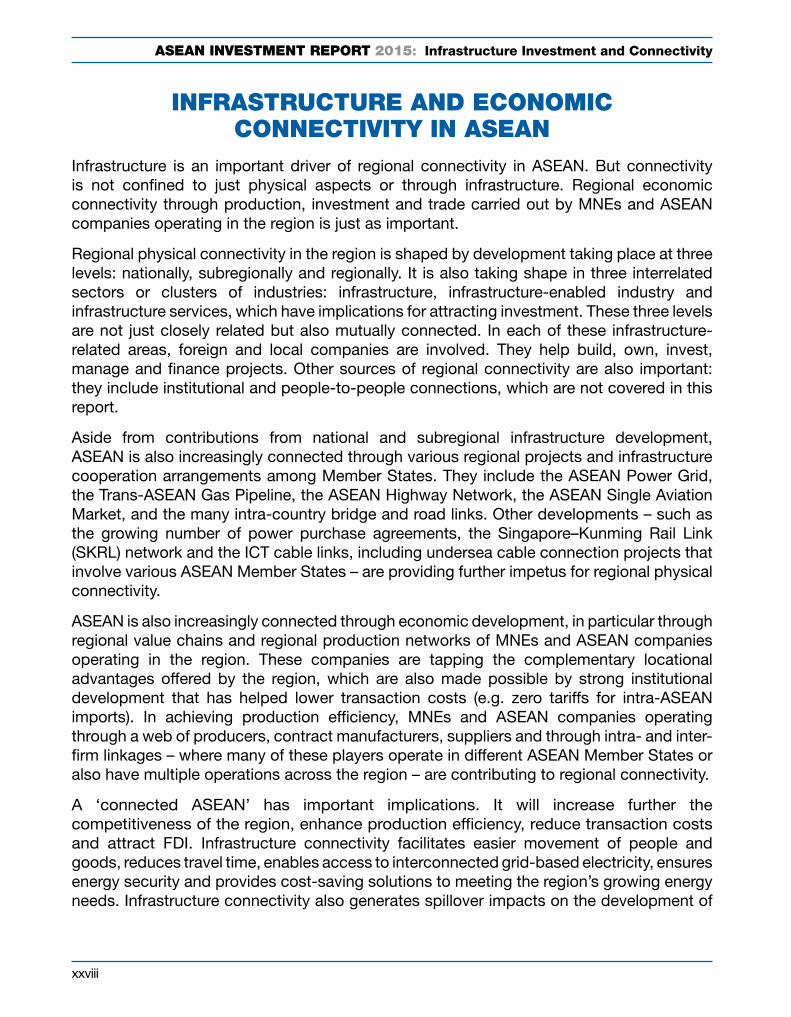
Infrastructure is an important driver of regional connectivity in ASEAN. But connectivity is not confined to just physical aspects or through infrastructure. Regional economic connectivity through production, investment and trade carried out by MNEs and ASEAN companies operating in the region is just as important.
Regional physical connectivity in the region is shaped by development taking place at three levels: nationally, subregionally and regionally. It is also taking shape in three interrelated sectors or clusters of industries: infrastructure, infrastructure-enabled industry and infrastructure services, which have implications for attracting investment. These three levels are not just closely related but also mutually connected. In each of these infrastructure-related areas, foreign and local companies are involved. They help build, own, invest, manage and finance projects. Other sources of regional connectivity are also important: they include institutional and people-to-people connections, which are not covered in this report.
Aside from contributions from national and subregional infrastructure development, ASEAN is also increasingly connected through various regional projects and infrastructure cooperation arrangements among Member States. They include the ASEAN Power Grid, the Trans-ASEAN Gas Pipeline, the ASEAN Highway Network, the ASEAN Single Aviation Market, and the many intra-country bridge and road links. Other developments – such as the growing number of power purchase agreements, the Singapore–Kunming Rail Link (SKRL) network and the ICT cable links, including undersea cable connection projects that involve various ASEAN Member States – are providing further impetus for regional physical connectivity.
ASEAN is also increasingly connected through economic development, in particular through regional value chains and regional production networks of MNEs and ASEAN companies operating in the region. These companies are tapping the complementary locational advantages offered by the region, which are also made possible by strong institutional development that has helped lower transaction costs (e.g. zero tariffs for intra-ASEAN imports). In achieving production efficiency, MNEs and ASEAN companies operating through a web of producers, contract manufacturers, suppliers and through intra- and inter-firm linkages – where many of these players operate in different ASEAN Member States or also have multiple operations across the region – are contributing to regional connectivity.
A ‘connected ASEAN’ has important implications. It will increase further the competitiveness of the region, enhance production efficiency, reduce transaction costs and attract FDI. Infrastructure connectivity facilitates easier movement of people and goods, reduces travel time, enables access to interconnected grid-based electricity, ensures energy security and provides cost-saving solutions to meeting the region’s growing energy needs. Infrastructure connectivity also generates spillover impacts on the development of

Overview
xxix
downstream businesses and other economic activities that are dependent on the provision of quality infrastructure. They contribute to downstream infrastructure-enabled business development such as in logistics, business process outsourcing, tourism and e-commerce, all of which have implications for business-to-business and regional connectivity.
With completed projects, significant plans and ongoing infrastructure development across the region, the landscape of ASEAN physical connectivity is expected to be considerably more densely drawn by 2030 than it is today. For example, the electrification rate is expected to reach nearly 100%, providing universal access to all in the region by 2030. More grid interconnections have been agreed and most are to be completed by 2026, which involves various ASEAN Member States. The ICT penetration rate is expected to rise significantly, providing modern connections to more homes and industries, and thus supporting development of more competitive downstream infrastructure-led businesses. In transport, the SKRL – which involves several ASEAN Member States – is expected to significantly reduce travel time and generate benefits along the route. With the completion of the last missing national roads in the AHN in 2015, ASEAN Member States are now physically interconnected by 38,400 km of road routes. Air transportation is expected to grow rapidly as a consequence of the increasingly affluent society, greater ASEAN connectivity and growing regional cooperation to realize a single ASEAN aviation market. ASEAN Member States are upgrading and expanding their major airports to cope with rising demand. The numbers of ASEAN based carriers including budget airlines have grown and the numbers of planes operated by them increased rapidly in recent years – supporting greater movement of people across the region.
On regional economic connectivity, local firms and foreign MNEs have been key actors – contributing through their activities in regional production networks and regional value chains involving different ASEAN Member States. The interrelationship of MNEs, suppliers, contract manufacturers, and inter- and intra-firm linkages will further strengthen regional connectivity. With a connected ASEAN, the environment for regional value chain and production network operations will become even more conducive, which in turn will encourage more such activities, strengthening further ASEAN’s integration.
In summary, ASEAN Member States are increasingly interconnected, both physically and economically. This growing regional connectivity has important implications for building competitiveness, for achieving regional integration and for realizing the goals of the AEC. The private sector – MNEs and ASEAN companies – has been and will remain a central contributor to a progressively connected ASEAN in the future.


Chapter 1: FDI development and corporate investment strategies
1
PART ONE
FDI AND MNEs’ DEVELOPMENT IN ASEAN

ASEAN INVESTMENT REPORT 2015: Infrastructure Investment and Connectivity
2

Chapter 1: FDI development and corporate investment strategies
3
ChAPTER 1
FDI DEVELOPMENT AND CORPORATE INVESTMENT STRATEGIES
1.1. Introduction
FDI flows to ASEAN rose for the third consecutive year, to $136.2 billion, in 2014. A number of key developments contributed to the further annual rise in FDI. MNEs and other ASEAN companies continued to expand their operations in the region, and some also announced plans to invest more in the post–AEC 2015 environment as the region establishes a single market and production base. Intra-ASEAN investment remained strong and growing, with ASEAN companies using more greenfield strategies. The CLMV countries (Cambodia, Lao PDR, Myanmar and Viet Nam) attracted higher levels of FDI, including in infrastructure and manufacturing activities. FDI in services, in particular finance, rose significantly. The region’s investment environment improved further as regional and national measures favourable to FDI were introduced or announced.
This chapter analyses FDI development and corporate investment activities in ASEAN in 2014 and the first half of 2015. It examines FDI into ASEAN, intra-ASEAN investment, cross-border M&As and the operating strategies of foreign and regional MNEs.
1.2. FDI trends and developments in 2014
The region saw the strongest rise in FDI inflows in 2014 with levels exceeding inflows to China for the first time since 1993, making ASEAN the largest recipient of FDI in the developing world. FDI flows into the region rose by 16%, from $117.7 billion in 2013 to $136.2 billion in 2014, despite the fragility of the global economy and a 16% decline in global flows (figure 1.1). Most ASEAN Member States witnessed an increase in FDI flows, while a few recorded a small decline (annex table 1.1). Strong regional economic fundamentals, cost advantages and market factors including regional integration were the key forces attracting investment and influencing corporate strategy in ASEAN (section 1.2.4). Major sources of investment in 2014 remained largely the same as in 2013, with two-thirds of FDI continuing to come from the top five investors (table 1.1). Some 76% of FDI into the region last year came from the top 10 economies.1 China, with increased FDI into the region, continued to dominate in Cambodia, Lao PDR and Myanmar, but significant investment by Korean electronic MNEs pushed the Republic of Korea to become the largest investor in Viet Nam that year.
1.2.1. FDI in ASEAN
The rise in FDI in the region in 2014 was driven by a 26% increase in intraregional investment and strong FDI inflows from a majority of Dialogue Partners. In

ASEAN INVESTMENT REPORT 2015: Infrastructure Investment and Connectivity
4
particular, FDI flows from the United States rose by 165%, followed by increases from Australia (63%), the European Union (EU) (31%), the Republic of Korea (22%) and China (31%). Investment from Hong Kong (China) rose by 82%, to $9.5 billion (annex table 1.2). However, FDI flows from Japan to the region plummeted by 39%, to $13.4 billion, reflecting the general downward global trend of Japanese FDI in 2014. The EU was the largest investor as a whole, followed by ASEAN. Increased FDI from France, Luxembourg and the United Kingdom contributed to the rise in the EU’s investment in the region.
Inflows concentrated in finance and services, including in infrastructure. Manufacturing FDI declined to $22.2 billion from $33.3 billion in 2013 but was compensated by a strong surge in FDI in finance, from $28.3 billion in 2013 to $43.1 billion in 2014. FDI in agriculture rose from $2.3 billion to $4.5 billion, while investment into the extractive industry declined from $8.0 billion to $7.3 billion.
FDI from different source countries concentrated in different industries. EU investors were active in finance ($13.9 billion), manufacturing ($4.2 billion) and the extractive industry ($2.3 billion). These three industries accounted for 70% of the EU’s FDI into the region in 2014. A majority of the investment from Australia, Canada, Hong Kong (China), India, Taiwan Province of China and the United States was also in finance. The European Union, United States and Hong Kong (China) contributed 56% of investment in the finance industry.
Asian investors, including those from Japan and the Republic of Korea, continued to have significant investment in the manufacturing industry. FDI from China flowed primarily to real estate, finance, and wholesale and retail trade.
Intra-ASEAN investments were particularly strong in manufacturing ($6.6 billion) and real estate ($4.6 billion). Investment from within ASEAN dominated in the primary sector (agriculture and forestry), with a 146% rise, from $1.6 billion in 2013 to $3.9 billion in
Figure I.1.FDI flows to ASEAN rose by 16%, to $136 billion in 2014 overtakingChina as the largest FDI recipient(Millions of dollars)
0
20 000
40 000
60 000
80 000
100 000
120 000
140 000
160 000
2005 2006 2007 2008 2009 2010 2011 2012 2013 2014
Source: ASEAN Secretariat, ASEAN FDI Database (accessed 1 July 2015).
160,000
140,000
120,000
100,000
80,000
60,000
40,000
20,000
0
FDI flows to the region rose by 16%, to $136 billion in 2014 – making ASEAN the largest FDI recipient in the developing world

Chapter 1: FDI development and corporate investment strategies
5
Table 1.1.The top 5 investors accounted for 65% of FDI flows and the top 5 industry recipients accounted for 73% in 2014 (Millions of dollars)
Investing country
2013 2014Economy Amount Economy Amount
European Union 22,255.7 European Union 29,268.5
Japan 21,766.1 ASEAN 24,377.4
ASEAN 19,399.6 Japan 13,381.1
China 6,778.5 United States 13,042.0
Hong Kong (China) 5,230.2 Hong Kong (China) 9,504.9
Total top 5 $75,430.1 Total top 5 $89,574.9
Top 5 share of total FDI flows in ASEAN 64% Top 5 share of total FDI flows in ASEAN 66%
Industry recipient
2013 2014Industry Amount Industry Amount
Manufacturing 33,342.1 Finance 43,052.2
Finance 28,263.7 Manufacturing 22,215.3
Wholesale & retail trade 13,946.6 Wholesale & retail trade 17,055.2
Real estate 9,821.5 Real estate 10,040.0
Extractive activities (mining & quarrying) 8,042.2 Extractive activities (mining & quarrying) 7,295.1
Total top 5 $93,416.1 Total top 5 $99,657.9
Top 5 share of total FDI flows in ASEAN 79% Top 5 share of total FDI flows in ASEAN 73%
Source: ASEAN Secretariat, ASEAN FDI Database (accessed 1 July 2015).
2014. Intra-ASEAN investment alone accounted for some 88% of total FDI flows into this economic sector in 2014. These three industries (manufacturing, real estate, agriculture) received 62% of all investment originating within the region.
In the extractive industry, the European Union, ASEAN and China were the three largest investors. Their combined $4.6 billion investment contributed 63% of FDI inflows into this industry. Active foreign participation through contractual arrangements and direct investments is contributing to the growth of activities in the infrastructure industry. FDI flows in construction, real estate and information and communication technology (ICT) rose (annex table 1.2). Companies from Asia and ASEAN are major players in the infrastructure industry, including real estate (chapter 2).
1.2.2. Intra-ASEAN investment
Intra-ASEAN investment rose from $19.4 billion in 2013 to $24.4 billion in 2014, accounting for 18% of total inflows into the region (figure 1.2, annex table 1.2). This upward intraregional trend suggests a growing interest of ASEAN companies in establishing a stronger regional presence, particularly in recent years, in light of emerging opportunities and AEC-2015 influences.

ASEAN INVESTMENT REPORT 2015: Infrastructure Investment and Connectivity
6
Intraregional investment is a major source of FDI for the region. For instance, ASEAN was the largest investor in Indonesia, accounting for 60% of FDI flows into that Member State last year, primarily in agriculture, manufacturing and finance. ASEAN investments in CLMV countries were also significant. In Viet Nam they were mainly in manufacturing, while in Cambodia they were mainly in agriculture.
Investors from different Member States dominated in different industries. Singapore was the largest source of regional investment in a number of industries; Malaysia led in investment in construction, transportation and storage, and ICT.
ASEAN companies also invest in the region through mergers and acquisitions (M&As), which contributed to a stronger intraregional investment scenario. Singaporean and Malaysian companies were active regional acquirers in a range of industries (section 1.3).
The intraregional analysis for 2014 highlights a few important developments:
i. Malaysian investors continued to be active in infrastructure-related industries, including in real estate and construction activities (table 1.2). They do so to expand markets and diversify revenue sources, given the limited home market. Investment from Malaysia rose by 146% to $3.9 billion, primarily in real estate, services and ICT.
ii. Thai companies, while continuing to invest regionally, were less active in cross-border M&A activities, which contrasted significantly with the situation in 2013 (section 1.3.3). Thai companies made only $1.6 billion in acquisitions in ASEAN in 2014 as compared with $13.3 billion in 2013. However, Thai direct investment in the region rose from $131 million to $818 million in 2014; with most investment in manufacturing activities, followed by finance and mining.
iii. Companies from Viet Nam continued to focus on investment in agriculture and extractive industries in neighbouring Member States such as Cambodia and Lao PDR.
Figure I.2. Intra-ASEAN investment rose by 26% to $24.4 billion in 2014(Millions of dollars)
Source: ASEAN Secretariat, ASEAN FDI Database (accessed 1 July 2015).
0
5'000
10'000
15'000
20'000
25'000
30'000
2000 2001 2002 2003 2004 2005 2006 2007 2008 2009 2010 2011 2012 2013 2014
30,000
25,000
20,000
15,000
10,000
5,000
0

Chapter 1: FDI development and corporate investment strategies
7
Tab
le 1
.2.
Intr
a-A
SE
AN
in
ve
stm
en
ts r
ose
, e
sp
ecia
lly i
n k
ey i
nd
ustr
ies
(M
illio
ns
of
do
llars
)
Sou
rce
coun
try
2
013
Bru
nei
Dar
ussa
lam
Cam
bodi
aIn
done
sia
Lao
PD
RM
alay
sia
Mya
nmar
Phi
lippi
nes
Sin
gapo
reTh
aila
ndVi
et N
amS
uppr
esse
d da
taTo
tal
Agr
icul
ture
, for
estr
y, a
nd fi
shin
g
0.1
..
1
.1
..
145
.3
..
..
1,3
03.4
3
3.3
116
.2
..
1,5
99.3
Min
ing
and
quar
ryin
g 0
.7
..
20.
0 ..
(5
.9)
..
(0.8
) 2
06.0
1
29.9
1
29.4
..
4
79.3
Man
ufac
turin
g 2
7.6
(0.7
) 1
28.0
0
.1
305
.3
(0.4
) (3
8.5)
5,5
35.7
(1
7.1)
16.
1 (1
48.9
) 5
,807
.2
Elec
tric
ity, g
as, s
team
and
air
cond
ition
ing
supp
ly 3
.2
..
1.5
(0
.2)
14.
7 ..
..
2
13.1
1
5.7
..
..
248
.0
Wat
er s
uppl
y; s
ewer
age
and
was
te m
anag
emen
t 0
.1
..
..
..
1.0
..
..
2
3.7
0.4
..
..
2
5.1
Con
stru
ctio
n 0
.3
..
0.2
(2
6.1)
(24.
5) ..
0
.4
27.
8 0
.8
0.5
0
.9
(19.
6)
Who
lesa
le a
nd re
tail
trad
e; re
pair
of m
otor
veh
icle
s an
d cy
cles
1.5
0
.1
(21.
1) ..
1
26.0
1
0.5
8.3
4
74.4
4
7.4
7.4
0
.6
655
.0
Tran
spor
tatio
n an
d st
orag
e 0
.1
..
23.
1 ..
2
66.8
..
..
1
0.5
(40.
3) (0
.3)
11.
3 2
71.1
Acc
omod
atio
n an
d fo
od s
ervi
ce a
ctiv
ities
(2.6
) ..
(0
.7)
..
10.
3 ..
..
1
01.5
1
.9
4.1
..
1
14.4
Info
rmat
ion
and
com
mun
icat
ion
0.2
..
1
.5
..
322
.5
..
0.6
6
3.6
0.2
0
.5
..
389
.0
Fina
ncia
l and
Insu
ranc
e ac
tiviti
es 0
.4
..
361
.0
(19.
4) (1
,186
.8)
..
125
.4
3,3
52.1
(5
94.4
) (6
1.9)
959
.0
2,9
35.4
Rea
l est
ate
activ
ities
2.0
0
.2
1,7
84.9
1
.0
1,2
18.6
8
0.6
(69.
0) 1
,694
.6
7.4
5
7.1
26.
7 4
,804
.0
Pro
fess
iona
l, sc
ient
ific
and
tech
nica
l act
iviti
es 1
.3
..
10.
4 ..
2
.0
..
(0.8
) 5
7.5
4.2
1
.5
..
76.
2
Adm
inis
trat
ive
and
supp
ort s
ervi
ce a
ctiv
ities
..
..
..
..
1.5
..
..
1
06.5
(3
.6)
0.1
..
1
04.5
Educ
atio
n 0
.2
..
0.1
..
0
.3
..
..
12.
8 0
.9
..
..
14.
4
Hum
an h
ealth
and
soc
ial w
ork
activ
ities
0.1
..
0
.1
..
0.2
..
..
1
4.4
0.7
..
..
1
5.5
Art
s, e
nter
tain
men
t and
recr
eatio
n 0
.1
0.1
..
..
0
.1
..
..
(1.0
) 0
.4
..
..
(0.3
)
Oth
er s
ervi
ces
36.
5 2
.0
55.
9 ..
3
70.6
3
.8
(508
.5)
537
.4
31.
9 6
0.0
(0.2
) 5
89.5
Oth
ers/
Uns
peci
fied
..
..
..
..
..
..
..
..
..
..
..
104
.6
Dat
a su
ppre
ssed
by
a M
embe
r Sta
te fo
r con
fiden
tial r
easo
n 7
81.4
..
(1
69.5
) ..
..
(2
.0)
23.
8 ..
1
6.7
9.4
..
..
Mya
nmar
’s d
ata
0.7
..
1
6.4
..
4.0
..
..
6
54.8
4
94.5
1
6.4
..
1’1
86.8
Intr
a-A
SEA
N in
vest
men
t fro
m:
853
.9
1.7
2
’212
.8
(44.
6) 1
,572
.1
92.
5 (4
58.9
) 1
4,38
8.7
130
.7
356
.5
894
.4
19,
399.
3 /...
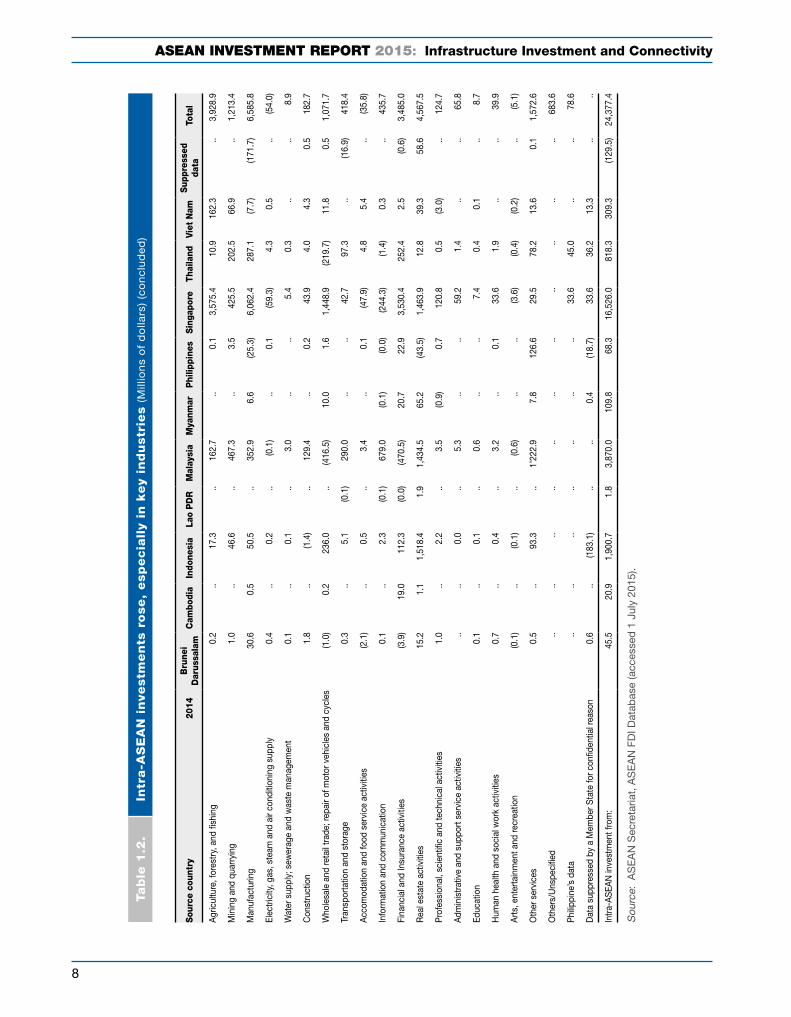
ASEAN INVESTMENT REPORT 2015: Infrastructure Investment and Connectivity
8
Sou
rce
coun
try
2
014
Bru
nei
Dar
ussa
lam
Cam
bodi
aIn
done
sia
Lao
PD
RM
alay
sia
Mya
nmar
Phi
lippi
nes
Sin
gapo
reTh
aila
ndVi
et N
amS
uppr
esse
d da
taTo
tal
Agr
icul
ture
, for
estr
y, a
nd fi
shin
g
0.2
..
1
7.3
..
162
.7
..
0.1
3
,575
.4
10.
9 1
62.3
..
3
,928
.9
Min
ing
and
quar
ryin
g 1
.0
..
46.
6 ..
4
67.3
..
3
.5
425
.5
202
.5
66.
9 ..
1
,213
.4
Man
ufac
turin
g 3
0.6
0.5
5
0.5
..
352
.9
6.6
(2
5.3)
6,0
62.4
2
87.1
(7
.7)
(171
.7)
6,5
85.8
Elec
tric
ity, g
as, s
team
and
air
cond
ition
ing
supp
ly 0
.4
..
0.2
..
(0
.1)
..
0.1
(5
9.3)
4.3
0
.5
..
(54.
0)
Wat
er s
uppl
y; s
ewer
age
and
was
te m
anag
emen
t 0
.1
..
0.1
..
3
.0
..
..
5.4
0
.3
..
..
8.9
Con
stru
ctio
n 1
.8
..
(1.4
) ..
1
29.4
..
0
.2
43.
9 4
.0
4.3
0
.5
182
.7
Who
lesa
le a
nd re
tail
trad
e; re
pair
of m
otor
veh
icle
s an
d cy
cles
(1.0
) 0
.2
236
.0
..
(416
.5)
10.
0 1
.6
1,4
48.9
(2
19.7
) 1
1.8
0.5
1
,071
.7
Tran
spor
tatio
n an
d st
orag
e 0
.3
..
5.1
(0
.1)
290
.0
..
..
42.
7 9
7.3
..
(16.
9) 4
18.4
Acc
omod
atio
n an
d fo
od s
ervi
ce a
ctiv
ities
(2.1
) ..
0
.5
..
3.4
..
0
.1
(47.
9) 4
.8
5.4
..
(3
5.8)
Info
rmat
ion
and
com
mun
icat
ion
0.1
..
2
.3
(0.1
) 6
79.0
(0
.1)
(0.0
) (2
44.3
) (1
.4)
0.3
..
4
35.7
Fina
ncia
l and
Insu
ranc
e ac
tiviti
es (3
.9)
19.
0 1
12.3
(0
.0)
(470
.5)
20.
7 2
2.9
3,5
30.4
2
52.4
2
.5
(0.6
) 3
,485
.0
Rea
l est
ate
activ
ities
15.
2 1
.1
1,5
18.4
1
.9
1,4
34.5
6
5.2
(43.
5) 1
,463
.9
12.
8 3
9.3
58.
6 4
,567
.5
Pro
fess
iona
l, sc
ient
ific
and
tech
nica
l act
iviti
es 1
.0
..
2.2
..
3
.5
(0.9
) 0
.7
120
.8
0.5
(3
.0)
..
124
.7
Adm
inis
trat
ive
and
supp
ort s
ervi
ce a
ctiv
ities
..
..
0.0
..
5
.3
..
..
59.
2 1
.4
..
..
65.
8
Educ
atio
n 0
.1
..
0.1
..
0
.6
..
..
7.4
0
.4
0.1
..
8
.7
Hum
an h
ealth
and
soc
ial w
ork
activ
ities
0.7
..
0
.4
..
3.2
..
0
.1
33.
6 1
.9
..
..
39.
9
Art
s, e
nter
tain
men
t and
recr
eatio
n (0
.1)
..
(0.1
) ..
(0
.6)
..
..
(3.6
) (0
.4)
(0.2
) ..
(5
.1)
Oth
er s
ervi
ces
0.5
..
9
3.3
..
1’2
22.9
7
.8
126
.6
29.
5 7
8.2
13.
6 0
.1
1,5
72.6
Oth
ers/
Uns
peci
fied
..
..
..
..
..
..
..
..
..
..
..
683
.6
Phi
lippi
ne’s
dat
a ..
..
..
..
..
..
..
3
3.6
45.
0 ..
..
7
8.6
Dat
a su
ppre
ssed
by
a M
embe
r Sta
te fo
r con
fiden
tial r
easo
n 0
.6
..
(183
.1)
..
..
0.4
(1
8.7)
33.
6 3
6.2
13.
3 ..
..
Intr
a-A
SEA
N in
vest
men
t fro
m:
45.
5 2
0.9
1,9
00.7
1
.8
3,8
70.0
1
09.8
6
8.3
16,
526.
0 8
18.3
3
09.3
(1
29.5
) 2
4,37
7.4
Sou
rce:
AS
EA
N S
ecre
taria
t, A
SE
AN
FD
I Dat
abas
e (a
cces
sed
1 J
uly
2015
).
Tab
le 1
.2.
Intr
a-A
SE
AN
in
ve
stm
en
ts r
ose
, e
sp
ecia
lly i
n k
ey i
nd
ustr
ies
(M
illio
ns
of
do
llars
) (c
on
clu
de
d)

Chapter 1: FDI development and corporate investment strategies
9
iv. Indonesian companies remained active in regional real estate. Some 80% of the country’s investments in the region in 2014 were in real estate activities, suggesting the growing interest of Indonesian companies in investing regionally, particularly in this industry.
v. Singapore remained the largest regional investor. In 2014, investments from Singapore accounted for 68% of all intra-ASEAN direct investment. This includes both investment from indigenous companies and those made by foreign affiliates based in Singapore. Four industries continued to attract much of Singapore’s regional investment: manufacturing, agriculture, finance and real estate.
1.2.3. CLMV recipients: bridging the development divide through investment
The CLMV countries are benefiting from cost advantages, economic growth and natural resource endowment in attracting FDI. Inflows to the CLMV countries declined marginally, by 3%, to $12.8 billion in 2014 because of the huge and surprising drop in FDI inflows to Myanmar (table 1.3). However, FDI to Cambodia, Lao PDR and Viet Nam rose, with a significant amount of investment directed to manufacturing, infrastructure, real estate and construction. FDI to these industries reflects the rapid economic growth and rising demand in these Member States. FDI in finance was also significant, reflecting investment opportunities in the industry, economic development and the desire of foreign banks to establish facilities to capture customers from home, local and other foreign clients that are operating in these economies.
More foreign companies are building manufacturing facilities in these locations in 2014-2015.2 Some, such as LG and Samsung, are also making huge manufacturing investments. Some foreign companies with operations in China invested or announced plans to set up operations in the CLMV countries to tap the relatively low labour costs. Some foreign and ASEAN companies in higher-cost Member States are also doing the same by setting up operations in these lower-cost locations.
Investments to CLMV countries were dominated by sources from China, ASEAN, the Republic of Korea and other Asian economies; all these investments grew last year (table 1.4). Although the major sources of FDI were similar across the four Member States, there are differences in terms of industry destination, reflecting in part these countries’ respective natural resource endowments and labour supply situations. Korean investment to Viet Nam in 2014 stood out in particular. Chinese investment dominates in Cambodia, Lao PDR and Myanmar.
2010 2011 2012 2013 2014
Cambodia 782.6 891.7 1,557.1 1,274.9 1,726.5
Lao PDR 332.6 466.8 294.4 426.7 913.2
Myanmar 2,248.8 2,058.2 1,354.2 2,620.9 946.2
Viet Nam 8,000.0 7,519.0 8,368.0 8,900.0 9,200.1
CLMV Total 11,363.9 10,935.8 11,573.7 13,222.5 12,786.1
Source: ASEAN Secretariat, ASEAN FDI Database (accessed 1 July 2015).
Table 1.3.Most CLMV countries saw a rise in FDI in 2014 (Millions of dollars)

ASEAN INVESTMENT REPORT 2015: Infrastructure Investment and Connectivity
10
Tab
le 1
.4.
Th
e t
op
10
in
ve
sto
rs i
n C
am
bo
dia
, L
ao
PD
R,
Myan
mar
an
d V
iet
Nam
are
main
ly f
rom
Asia
Cam
bodia
Lao P
DR
2013
20
14
20
14
Chi
na 2
86.8
C
hina
553
.9
Chi
na61
4.3
Kor
ea, R
epub
lic o
f 1
78.2
V
iet
Nam
179
.7
Thai
land
102.
9
Taiw
an P
rovi
nce
of C
hina
173
.3
Hon
g K
ong
(Chi
na)
136
.2
Hon
g K
ong
(Chi
na)
48.2
Uni
ted
Kin
gdom
1
16.0
Ta
iwan
Pro
vinc
e of
Chi
na 1
22.2
N
ethe
rland
s47
.8
Mal
aysi
a 9
7.9
Kor
ea, R
epub
lic o
f 1
06.3
S
witz
erla
nd28
.0
Sin
gap
ore
83.
7 M
alay
sia
85.
2 C
amb
odia
19.0
Hon
g K
ong
(Chi
na)
82.
8 Ja
pan
84.
9 A
ustr
alia
15.8
Thai
land
61.
8 S
inga
por
e 6
0.8
Kor
ea, R
epub
lic o
f 12
.6
Vie
t N
am 5
4.3
Uni
ted
Sta
tes
50.
3 V
iet
Nam
10.8
Jap
an 3
8.5
Uni
ted
Kin
gdom
4
6.7
Mal
aysi
a3.
7
Top
10
tota
l 1
,173
.2
1,4
26.2
To
p 1
0 to
tal
903.
0
Tota
l FD
I 1
,274
.9
1,7
26.5
To
tal F
DI
913.
2
Top
10
shar
e of
tot
al F
DI (
%)
92.
0 8
2.6
Top
10
shar
e of
tot
al F
DI (
%)
98.9
Mya
nm
ar
Vie
t N
am
2013
20
14
20
13
20
14
Chi
na79
2.6
Sin
gap
ore
578.
5Ja
pan
2,3
65.2
K
orea
, Rep
ublic
of
3,2
48.2
Sin
gap
ore
654.
8H
ong
Kon
g (C
hina
)11
3.4
Sin
gap
ore
1,8
01.1
H
ong
Kon
g (C
hina
) 1
,280
.1
Thai
land
494.
5Th
aila
nd82
.4K
orea
, Rep
ublic
of
1,7
66.8
S
inga
por
e 1
,219
.5
Hon
g K
ong
(Chi
na)
272
Chi
na70
.5C
hina
948
.2
Jap
an 9
69.2
Fran
ce20
2.3
Jap
an37
.7R
ussi
an F
eder
atio
n 4
20.5
Ta
iwan
Pro
vinc
e of
Chi
na 5
18.1
Uni
ted
Kin
gdom
68
.9U
nite
d K
ingd
om
28.3
Hon
g K
ong
(Chi
na)
288
.9
Virg
in Is
land
s, B
ritis
h 2
91.7
Jap
an36
Vie
t N
am22
.7Ta
iwan
Pro
vinc
e of
Chi
na 2
45.0
C
hina
209
.6
Kor
ea, D
emoc
ratic
Peo
ple
’s R
epub
lic o
f 29
.8K
orea
, Rep
ublic
of
11.1
Thai
land
167
.0
Mal
aysi
a 1
63.7
Net
herla
nds
24.4
Ind
ia0.
7N
ethe
rland
s 1
62.1
U
nite
d K
ingd
om
146
.0
Ind
ones
ia16
.4S
amoa
0.7
Cay
man
Isla
nds
147
.6
Uni
ted
Sta
tes
130
.5
Top
10
tota
l2
591.
794
6.0
Top
10
tota
l 8
,312
.4
8,1
76.6
Tota
l FD
I 2
620.
994
6.2
Tota
l FD
I 8
’,900
.0
9,2
00.1
Top
10
shar
e of
tot
al F
DI (
%)
98.9
100.
0To
p 1
0 sh
are
of t
otal
FD
I (%
)93
.488
.9
Sou
rce:
AS
EA
N S
ecre
taria
t, A
SE
AN
FD
I Dat
abas
e (a
cces
sed
1 J
uly
2015
).

Chapter 1: FDI development and corporate investment strategies
11
An important feature of the rise in manufacturing FDI in CLMV countries is that it expands regional production networks and strengthens regional value chains, boosting connectivity between CLMV countries and the other ASEAN Member States as production from the former is supplied to affiliates or customers based in the latter. This connectivity is contributing to the development of supporting industries and increasing the region’s manufacturing competitiveness, which draws on the complementary locational advantages tapped by MNEs and ASEAN companies. The rise in regional economic activities by MNEs and companies from the other ASEAN Member States is helping bridge the development divide through investment.
Cambodia: Manufacturing industry and Chinese companies continue to dominate in FDI flows
FDI flows into Cambodia increased by 35% in 2014 to $1.7 billion (table 1.5). China remained the largest investor, followed by ASEAN and Hong Kong (China). These economies accounted for about 60% of FDI inflows to the country last year.
Chinese companies were the largest manufacturing investor, responsible for about 46% of FDI into that industry. Some Chinese companies are relocating their operations to the host country because of increasing production costs at home. More foreign companies, particularly Asian MNEs, are also opening factories in labour-intensive industries such as garments.
Investments in agriculture activities in Cambodia were also considerable and dominated by ASEAN, in particular Viet Nam. Malaysia was a significant regional investor in finance. ASEAN companies were also the largest investors in construction and real estate in 2014.
Automotive part and component manufacturers are setting up factories in Cambodia’s industrial zones near Thailand because of low labour costs and proximity to customers based in Thailand. NHK Spring (Japan), a Toyota supplier, is building a factory in 2015 in an industrial zone near the Thailand–Cambodia border.3 Denso (Japan) and Yazaki (Japan) are operating in Cambodia to produce automotive parts and components, which will be supplied to customers in the region. In 2015, these companies announced plans to expand further in the host country with additional production facilities. Sam Chai Steel (Thailand) is also planning to build a factory in the industrial zone. Siam City Cement (Thailand) entered into a joint venture in 2015 with a local company to operate a cement plant. Crystal Group (Hong Kong, China) opened a new garment factory in 2015, while Rojana (Thailand) announced that it is planning to build an industrial park in Cambodia.
As with other major MNEs, Toyota is planning to build a new showroom, warehouse and training centre in the Phnom Penh special economic zone (SEZ), with construction due to start in 2016. Coca-Cola (United States) is building another factory worth $100 million, which will be located in the Phnom Penh SEZ; and AEON (Japan), which opened a mall in 2014, is planning to open a second one in Phnom Penh.

ASEAN INVESTMENT REPORT 2015: Infrastructure Investment and Connectivity
12
Tab
le 1
.5.
Man
ufa
ctu
rin
g a
nd
fin
an
ce
do
min
ate
FD
I fl
ow
s i
n C
am
bo
dia
, 2
01
3−
20
14 (
Mill
ion
s o
f d
olla
rs)
20
13
Jap
an
Un
ited
S
tate
sE
uro
pean
U
nio
n
Em
erg
ing M
ark
ets
of
East
Asi
a
Ind
iaA
ust
ralia
Russ
ian
Federa
tion
AS
EA
NC
anada
Oth
er
countr
ies
Tota
lK
ore
a,
Rep
ub
lic
of
Hon
g K
on
g
(Ch
ina)
Taiw
an
P
rovi
nce
of
Ch
ina
Ch
ina
Su
bto
tal
Agr
icul
ture
, for
estr
y, a
nd fi
shin
g
-
4.7
1
4.3
29.
9 -
-
5
8.1
87.
9 5
.1
4.5
-
1
91.0
-
2
.6
310
.1
Man
ufac
turin
g 5
.7
2.2
4
0.8
65.
8 5
5.4
52.
8 1
66.3
3
40.4
-
-
-
4
2.5
3.9
2
7.2
462
.7
Acc
omod
atio
n an
d fo
od s
ervi
ce
activ
ities
-
2.1
4
.0
13.
9 4
.4
-
4.8
2
3.1
-
2.2
2
.2
19.
9 -
-
5
3.4
Fina
ncia
l and
Insu
ranc
e ac
tiviti
es 5
.3
16.
3 1
2.4
25.
7 1
0.2
119
.2
10.
8 1
65.8
1
.0
8.0
-
2
5.8
(10.
7) (2
0.1)
203
.8
Oth
er s
ervi
ces
activ
ities
27.
5 8
.6
44.
0 4
2.9
12.
8 1
.3
46.
7 1
03.7
-
4
.5
8.6
1
9.6
-
28.
5 2
44.9
Tota
l 3
8.5
3
3.9
1
15.5
1
78.2
8
2.8
1
73.3
2
86.8
7
21.0
6
.1
19.1
1
0.8
2
98
.8
(6
.8)
38
.1 1
,27
4.9
20
14
Jap
an
Un
ited
S
tate
sE
uro
pean
U
nio
n
Em
erg
ing M
ark
ets
of
East
Asi
a
Ind
iaA
ust
ralia
Russ
ian
Federa
tion
AS
EA
NC
anada
Oth
er
countr
ies
Tota
lK
ore
a,
Rep
ub
lic
of
Hon
g K
on
g
(Ch
ina)
Taiw
an
P
rovi
nce
of
Ch
ina
Ch
ina
Su
bto
tal
Agr
icul
ture
, for
estr
y, a
nd fi
shin
g
-
3.9
1
2.0
13.
1 9
.9
-
46.
4 6
9.4
3.2
7
.1
-
194
.4
-
-
290
.1
Min
ing
and
qua
rryi
ng -
-
-
-
-
-
1
7.4
17.
4 -
-
-
-
-
-
1
7.4
Man
ufac
turin
g 9
.7
9.5
3
3.0
27.
8 7
3.5
56.
1 2
43.6
4
01.0
-
2
.1
-
32.
7 4
.5
31.
4 5
23.9
Con
stru
ctio
n -
-
-
-
-
-
1
.2
1.2
-
4
.9
-
16.
1 -
-
2
2.2
Acc
omod
atio
n an
d fo
od s
ervi
ce
activ
ities
-
1.2
5
.3
32.
3 3
0.9
-
18.
9 8
2.1
-
-
-
11.
0 -
-
9
9.6
Info
rmat
ion
and
com
mun
icat
ion
-
-
-
-
-
Fina
ncia
l and
Insu
ranc
e ac
tiviti
es 1
0.8
25.
7 6
7.2
9.7
1
2.6
62.
0 1
9.7
103
.9
0.0
1
6.7
-
70.
6 -
2
9.7
324
.6
Rea
l est
ate
activ
ities
-
-
-
1.5
-
-
-
1
.5
-
-
-
17.
4 -
-
1
8.8
Oth
er s
ervi
ces
activ
ities
64.
4 1
0.0
21.
3 2
2.0
9.3
4
.2
206
.7
242
.2
-
2.4
2
.3
30.
3 -
5
6.9
429
.9
Tota
l 8
4.9
5
0.3
1
38.8
1
06.3
1
36.2
1
22.2
5
53.9
9
18.6
3
.3
33.3
2
.3
37
2.5
4
.5
11
8.0
1,7
26
.5
Sou
rce:
AS
EA
N S
ecre
taria
t, A
SE
AN
FD
I Dat
abas
e (a
cces
sed
1 J
uly
2015
).

Chapter 1: FDI development and corporate investment strategies
13
Chinese companies continued to dominate in infrastructure (chapter 2). China National Heavy Machinery Corporation (CHMC) started operation of the $540 million, 246 MW Tatay River hydropower plant in 2014; it will sell electricity from the plant to the State-owned Electricity of Cambodia for 42 years.4 Smart Axiata, a subsidiary of Axiata (Malaysia), expanded the 4G LTE network in Cambodia in 2014. South East Asia Telecom Group (China), through its subsidiary in Singapore, announced plans to expand in Cambodia in 2015, with a $400 million investment in telecommunication infrastructure. It has already invested $100 million in upgrading the Cambodian subsidiary’s networks.5
Lao PDR: Chinese FDI dominates, concentrated in infrastructure
FDI into Lao PDR rose by 113% to $913 million in 2014. Infrastructure remained the principal target sector. Investment in SEZs also rose in the same year. Some two-thirds of FDI in 2014 came from China. More than 90% of Chinese FDI in Lao PDR was in infrastructure, of which 73% ($420 million) went to power generation activities. Companies such as China Huadian, China National Heavy Machinery Corporation, and China Electric Power Technology Import and Export Corporation are building power plants with expected commercial operation dates in 2015. In addition to investors from China, MNEs from other countries are active in the infrastructure industry. For instance, SN Power (Norway) bought a 20% stake in the 500 MW Theun-Hinboun Hydropower Company from Statkraft (Norway) in 2014. Velcan Energy (France) received an approval in 2014 to develop a $150 million hydropower project.
In addition, Lao PDR is receiving investment in manufacturing activities, albeit at a low level. For instance, Toyota Boshoku has started producing automotive seat covers at its plant in the country to supply Toyota’s operation in Thailand. Mitsubishi Materials is building an $8 million factory to produce thermostats and temperature control equipment. Nikon and Minebea are also operating plants in the country. Given the geographical proximity, Thai companies are also expanding their presence. Siam Cement is building a $309 million cement factory and Kasikorn Bank opened an operation in 2014.
Myanmar: Surprising decline in FDI flows; but investment in infrastructure and manufacturing continue to be strong
FDI flows to Myanmar plummeted, from $2.6 billion in 2013 to just less than $1 billion in 2014. This decline contrasts with media reports and company news announcements that indicate growing investment in Myanmar in recent years, including in large projects. Within this statistical context, about 44% of FDI in 2014 was in transportation and storage – the single largest recipient industry. Chinese companies continue to be the largest investors, active in extractive industries and in infrastructure projects. For instance, Zhejiang Orient Engineering is building a hydropower plant to be completed by 2016.
Myanmar also attracted more FDI in the manufacturing industries in 2014. Some Japanese automotive companies such as Toyota and Nissan are investing in Myanmar, and Denso – a parts and components manufacturer – has set up a subsidiary in the country, driven by cost

ASEAN INVESTMENT REPORT 2015: Infrastructure Investment and Connectivity
14
reasons. Suzuki (Japan) is building an additional factory to produce automotive parts in the Thilawa SEZ. Twelve of 26 companies that committed to establish plants in the Thilawa SEZ in late 2014 were Japanese, including automotive part manufacturers such as Koyo Radiator. Acecook (Japan) is constructing an instant noodles factory in the SEZ in 2015.
Other automotive MNEs such as Mitsubishi (Japan), Ford (United States), Chevrolet (United States), Mercedes-Benz (Germany), KIA (Republic of Korea) and Hyundai (Republic of Korea) have opened showrooms and service centres in the country. Jaguar, Land Rover, BMW and Mazda are also opening centres in the country.6 APM Automotive Indochina, a subsidiary of Tan Chong Motor Holdings (Malaysia), is building a factory in the Bago region to assemble Nissan cars. Investment in the factory is expected to reach more than $200 million over the next few years. Colgate-Palmolive (United States) received a license in 2014 to operate in Myanmar, and Nestle (Switzerland) is investing in the country. Foreign garment manufacturers such as Fu Yuen Garment from Macao (China) and three Taiwanese companies with local registered names (Eslite Garment, Polar North Garment and Eusebio Sporting Company) were given licenses in 2014 to start manufacturing.7 In addition, Ball Corporation (United States) and Foster Electric (Japan) are building factories in the Thilawa SEZ. The latter has recently established a sub-subsidiary in Myanmar to manufacture and sell speakers, headphones and related parts with $3 million in registered capital.
In other manufacturing activities, Asahi (Japan) formed a joint venture in 2014 with a local partner to manufacture beverages in the country.8 Carlsberg (Denmark) opened a $75 million brewery with a local joint venture partner in May 2015. Other beer manufacturers such as Heineken (Netherlands) are also planning to open breweries through joint ventures.9 Yum Brand (United States) opened a KFC store with a local partner in June 2015.
In finance, Myanmar granted provisional foreign banking licenses in October 2014 to banks from Malaysia, Singapore, Thailand, Australia, China and Japan.10 Some of these banks, such as OCBC (Singapore), UOB (Singapore), Maybank (Malaysia), Sumitomo Mitsui (Japan) and Bank of Tokyo-Mitsubishi (Japan), opened a branch each this year. Dongbu Insurance (Republic of Korea) also opened a branch in 2015.
In real estate and infrastructure, Accor (France) is constructing two new hotels. Mitsubishi Corporation (Japan) and Hitachi (Japan) signed a $20 million contract to supply and install railway signaling systems. JGC Corporation (Japan), together with its Singapore consortium partners, in 2014 won a $1.4 billion contract to build the new Hanthawaddy airport, while Mitsubishi and Jalux won contracts to renovate and operate the Mandalay airport.11 Vestas (Denmark) announced in 2015 that it is developing a wind power project with an initial investment of $3 million.
A number of foreign companies have established a presence or an office in Myanmar in 2014–2015. These companies include ThyssenKrupp (Germany) and ABB (Switzerland).
Some ASEAN companies have announced significant investment plans to enter Myanmar in the next few years. For instance, Lippo Group (Indonesia) is planning to invest about

Chapter 1: FDI development and corporate investment strategies
15
$600 million to $1 billion in a number of industries, which include hospitality, health care and education services. Global Power Synergy (Thailand), together with its consortium partners, is building a 400 MW gas power plant in Thilawa SEZ, and MDR (Singapore) established in 2015 a subsidiary for providing graphic design solutions and large format digital inkjet production.
Viet Nam: Significant rise in Korean investment and FDI in manufacturing dominates
FDI to Viet Nam increased from $8.9 billion in 2013 to $9.2 billion in 2014, induced by a significant rise in investment from the Republic of Korea and Hong Kong (China) (table 1.6). These two economies together with ASEAN were the three largest investors in 2014, contributing 66% of FDI.
FDI in manufacturing rose significantly, accounting for 71% of total inflows, as a result of the surge in Korean investment. Manufacturing FDI from ASEAN, Hong Kong (China) and Japan was also significant. Real estate and construction were the second and third largest recipients of FDI inflows, and also rose significantly, the former to three times and the latter to five times the level of 2013.
Korean FDI grew by 8.6 times last year, with MNEs such as Samsung expanding significantly in the country with new production of electronic products and mobile phones. Samsung opened a $2 billion smartphone plant in March 2014 and in November announced plans to further expand its mobile phone facilities in the country with another $3 billion plant.12 As a consequence, Viet Nam is now the largest mobile phone production facility for Samsung: about 50% of Samsung’s mobile phones are manufactured there, with the remaining share coming from its production bases in Brazil, China, India, Indonesia and the Republic of Korea.13 In addition to mobile phone operations, Samsung is also building factories for display panels, home appliances and electrical components in Viet Nam.14
Other Korean companies are also expanding in Viet Nam. They include LG Electronics, Kumho Tire and Lotte. The number of Lotte Mart stores increased to 10 in 2014 with the inauguration of 5 new supermarkets.15 Lotte has announced that the group will open a few more in 2015 and plans to have a total of 60 supermarkets in Viet Nam by 2020. It plans to also open 70 cinemas in the next few years, and the number of its Lotteria fast food outlets has more than doubled, from 100 outlets in 2011 to 207 in 2014. In March 2015, the group was involved in a $250 million coffee plantation project in the host country.
In addition to Korean FDI in manufacturing, investments from Korean companies in construction and real estate also rose significantly. Construction saw a considerable increase, from $17 million in 2013 to $161 million in 2014; and real estate climbed from $78 million in 2013 to $422 million in 2014.
Japanese companies such as Panasonic and Canon that have operations in other ASEAN Member States are also expanding into Viet Nam. Yazaki and Bridgestone started operations in the country in 2015. AEON (Japan) opened two shopping centres in 2014 and expanded

ASEAN INVESTMENT REPORT 2015: Infrastructure Investment and Connectivity
16
Tab
le 1
.6.
Man
ufa
ctu
rin
g c
on
tin
ue
s t
o d
om
inate
FD
I fl
ow
s t
o V
iet
Nam
, 2
01
3−
20
14 (
Mill
ion
s o
f d
olla
rs)
20
13
Jap
an
Un
ited
S
tate
sE
uro
pean
U
nio
n
Em
erg
ing M
ark
ets
of
East
Asi
a
Ind
iaA
ust
ralia
New
Z
eala
nd
Russ
ian
Federa
tion
AS
EA
NC
anada
Oth
er
countr
ies
Tota
lK
ore
a,
Rep
ub
lic
of
Hon
g K
on
g
(Ch
ina)
Taiw
an
P
rovi
nce
of
Ch
ina
Ch
ina
Su
b-t
ota
l
Agr
icul
ture
, for
estr
y, a
nd fi
shin
g
9.5
0.2
1.4
7
.1 1
.2
1.0
3
.8
13.
0 0
.00
0.2
0
.0 1
.7
8.3
0
.0 1
.3
35.
7
Min
ing
and
qua
rryi
ng 8
.7 0
.2
1.3
6
.5 1
.1 0
.9 3
.5 1
2.0
0.0
0 0
.2 0
. 1
.6
7.7
0
.0
1.2
3
2.9
Man
ufac
turin
g 1
,819
.4 3
9.7
269
.5 1
,359
.1
222
.2
188
.5 7
29.4
2
,499
.1
0.9
40.
1 0
.5
323
.5
1,5
98.9
8
.1
246
.4
6,8
46.1
Ele
ctric
ity, g
as, s
team
and
air
cond
ition
ing
sup
ply
222
.1 4
.8
32.
9 1
65.9
27.
1 2
3.0
89.
1 3
05.1
0.1
4
.9 0
.1
39.
5 1
95.2
1
.0
30.
1 8
35.9
Wat
er s
upp
ly; s
ewer
age
and
was
te
man
agem
ent
5.6
0
.1 0
.8 4
.2
0.7
0
.6 2
.2
7.7
0.0
0
.1 0
.0 1
.0
4.9
0
.0
0.8
2
1.1
Con
stru
ctio
n 2
3.1
0.5
0 3
.4 1
7.3
2.8
2
.4 9
.3 3
1.7
0.0
0
.5
0.0
4.1
2
0.3
0.1
3.1
86.
9
Who
lesa
le a
nd r
etai
l tra
de;
rep
air
of
mot
or v
ehic
les
and
cyc
les
59.
6 1
.3
8.8
4
4.5
7.3
6
.2 2
3.9
81.
9 0
.0
1.3
0.0
10.
6 5
2.4
0.3
8.1
224
.3
Tran
spor
tatio
n an
d s
tora
ge 4
.9
0.1
0
.7 3
.6
0.6
0
.5 2
.0
6.7
0
.0 0
.1 0
.0
0.9
4
.3
0.0
0.7
1
8.4
Acc
omod
atio
n an
d fo
od s
ervi
ce
activ
ities
26.
3 0
.6 3
.9
19.
6 3
.2
2.7
1
0.5
36.
1 0
.0
0.6
0
.0
4.7
2
3.1
0.1
3.6
9
8.9
Info
rmat
ion
and
com
mun
icat
ion
6.6
0.1
1.0
4
.9
0.8
0
.7 2
.7 9
.1
0.0
0
.2 0
.0 1
.2 5
.8
0.0
0
.9
24.
9
Fina
ncia
l and
Insu
ranc
e ac
tiviti
es 0
.1
0.0
0
.0
0.1
0
.0
0.0
0.0
0.2
0
.0
0.0
0.0
0
.0
0.1
0
.0
0.0
0
.4
Rea
l est
ate
activ
ities
104
.0
2.3
1
5.4
77.
7 1
2.7
10.
8 4
1.7
142
.9
0.1
2
.3 0
.0
18.
5 9
1.4
0.5
14.
1 3
91.3
Pro
fess
iona
l, sc
ient
ific
and
te
chni
cal a
ctiv
ities
45.
4 1
.0
6.7
33.
9 5
.5 4
.7 1
8.2
62.
3 0
.0 1
.0 0
.0 8
.1
39.
9 0
.2
6.2
1
70.8
Ad
min
istr
ativ
e an
d s
upp
ort
serv
ice
activ
ities
0.1
0.0
0.0
0
.1
0.0
0.0
0.0
0
.1 0
.0 0
.0
0. 0
0.0
0
.1
0.0
0
.0
0.3
Ed
ucat
ion
12.
9 0
.3 1
.9
9.6
1.6
1
.3 5
.2
17.
7 0
.0 0
.3 0
.0 2
.3 1
1.3
0.1
1
.8
48.
5
Hum
an h
ealth
and
soc
ial w
ork
activ
ities
9.8
0.2
1
.5 7
.3
1.2
1
.0 3
.9
13.
2 0
.0 0
.2
0.0
1.7
8
.6 0
.0
1.3
3
6.9
Art
s, e
nter
tain
men
t an
d r
ecre
atio
n 5
.5 0
.1 0
.8
4.1
0
.7
0.6
2.2
7
.6
0.0
0.1
0.0
1
.0
4.9
0.0
0
.8
20.
8
Oth
er s
ervi
ces
activ
ities
1.6
0
.0
0.2
1
.2
0.2
0
.2
0.6
2
.2
0.0
0
.0
0.0
0
.3
1.4
0
.0
0.2
5
.9
Tota
l 2
,365
.2 5
1.6
350
.4
1,7
66.8
288
.9
245
.1
948
.2 3
,248
.9
1.1
52.
2 0
.6
420
.5
2,0
78.6
1
0.5
320
.4
8,9
00.0
/...
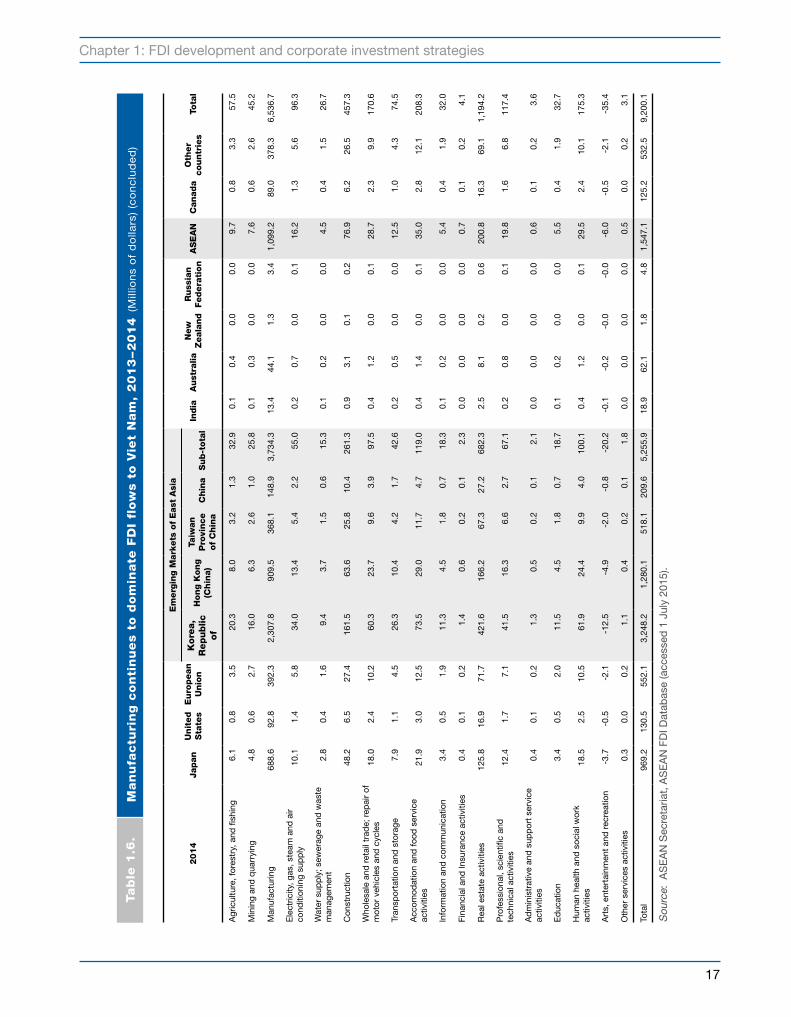
Chapter 1: FDI development and corporate investment strategies
17
Tab
le 1
.6.
Man
ufa
ctu
rin
g c
on
tin
ue
s t
o d
om
inate
FD
I fl
ow
s t
o V
iet
Nam
, 2
01
3−
20
14 (
Mill
ion
s o
f d
olla
rs)
(co
nc
lud
ed
)
20
14
Jap
an
Un
ited
S
tate
sE
uro
pean
U
nio
n
Em
erg
ing M
ark
ets
of
East
Asi
a
Ind
iaA
ust
ralia
New
Z
eala
nd
Russ
ian
Federa
tion
AS
EA
NC
anada
Oth
er
countr
ies
Tota
lK
ore
a,
Rep
ub
lic
of
Hon
g K
on
g
(Ch
ina)
Taiw
an
P
rovi
nce
of
Ch
ina
Ch
ina
Su
b-t
ota
l
Agr
icul
ture
, for
estr
y, a
nd fi
shin
g
6.1
0
.8
3.5
2
0.3
8.0
3
.2
1.3
3
2.9
0.1
0.4
0
.0 0
.0 9
.7
0.8
3
.3 5
7.5
Min
ing
and
qua
rryi
ng 4
.8
0.6
2
.7
16.
0 6
.3
2.6
1
.0
25.
8 0
.1
0.3
0
.0
0.0
7
.6
0.6
2
.6 4
5.2
Man
ufac
turin
g 6
88.6
9
2.8
392
.3
2,3
07.8
9
09.5
3
68.1
1
48.9
3
,734
.3
13.
4 4
4.1
1.3
3.4
1
,099
.2
89.
0 3
78.3
6
,536
.7
Ele
ctric
ity, g
as, s
team
and
air
cond
ition
ing
sup
ply
10.
1 1
.4
5.8
3
4.0
13.
4 5
.4
2.2
5
5.0
0.2
0
.7 0
.0
0.1
16.
2 1
.3
5.6
96.
3
Wat
er s
upp
ly; s
ewer
age
and
was
te
man
agem
ent
2.8
0
.4
1.6
9
.4
3.7
1
.5
0.6
1
5.3
0.1
0
.2 0
.0 0
.0
4.5
0
.4
1.5
26.
7
Con
stru
ctio
n 4
8.2
6.5
2
7.4
161
.5
63.
6 2
5.8
10.
4 2
61.3
0
.9
3.1
0
.1 0
.2
76.
9 6
.2
26.
5 4
57.3
Who
lesa
le a
nd r
etai
l tra
de;
rep
air
of
mot
or v
ehic
les
and
cyc
les
18.
0 2
.4
10.
2 6
0.3
23.
7 9
.6
3.9
9
7.5
0.4
1
.2
0.0
0.1
2
8.7
2.3
9
.9
170
.6
Tran
spor
tatio
n an
d s
tora
ge 7
.9
1.1
4
.5
26.
3 1
0.4
4.2
1.7
4
2.6
0.2
0
.5
0.0
0
.0 1
2.5
1.0
4
.3
74.
5
Acc
omod
atio
n an
d fo
od s
ervi
ce
activ
ities
21.
9 3
.0
12.
5 7
3.5
29.
0 1
1.7
4.7
119
.0
0.4
1
.4
0.0
0
.1
35.
0 2
.8
12.
1 2
08.3
Info
rmat
ion
and
com
mun
icat
ion
3.4
0
.5
1.9
1
1.3
4.5
1
.8
0.7
1
8.3
0.1
0
.2
0.0
0.0
5.4
0
.4
1.9
3
2.0
Fina
ncia
l and
Insu
ranc
e ac
tiviti
es 0
.4
0.1
0
.2
1.4
0
.6
0.2
0
.1
2.3
0
.0
0.0
0
.0 0
.0 0
.7 0
.1
0.2
4.1
Rea
l est
ate
activ
ities
125
.8
16.
9 7
1.7
421
.6
166
.2
67.
3 2
7.2
682
.3
2.5
8
.1
0.2
0.6
200
.8
16.
3 6
9.1
1,1
94.2
Pro
fess
iona
l, sc
ient
ific
and
te
chni
cal a
ctiv
ities
12.
4 1
.7
7.1
4
1.5
16.
3 6
.6 2
.7
67.
1 0
.2
0.8
0
.0 0
.1 1
9.8
1.6
6
.8 1
17.4
Ad
min
istr
ativ
e an
d s
upp
ort
serv
ice
activ
ities
0.4
0
.1
0.2
1
.3
0.5
0
.2
0.1
2
.1
0.0
0
.0
0.0
0.0
0.6
0
.1
0.2
3
.6
Ed
ucat
ion
3.4
0
.5
2.0
1
1.5
4.5
1
.8
0.7
1
8.7
0.1
0
.2
0.0
0
.0
5.5
0
.4
1.9
3
2.7
Hum
an h
ealth
and
soc
ial w
ork
activ
ities
18.
5 2
.5
10.
5 6
1.9
24.
4 9
.9
4.0
1
00.1
0
.4
1.2
0
.0 0
.1
29.
5 2
.4
10.
1 1
75.3
Art
s, e
nter
tain
men
t an
d r
ecre
atio
n -
3.7
-0.
5 -
2.1
-12
.5
-4.
9 -
2.0
-0.
8 -
20.2
-
0.1
-0.
2 -
0.0
-0.
0 -
6.0
-0.
5 -
2.1
-35
.4
Oth
er s
ervi
ces
activ
ities
0.3
0
.0
0.2
1
.1
0.4
0
.2
0.1
1
.8
0.0
0
.0
0.0
0.0
0.5
0
.0
0.2
3
.1
Tota
l 9
69.2
1
30.5
5
52.1
3
,248
.2
1,2
80.1
5
18.1
2
09.6
5
,255
.9
18.
9 6
2.1
1.8
4.8
1
,547
.1
125
.2
532
.5
9,2
00.1
Sou
rce:
AS
EA
N S
ecre
taria
t, A
SE
AN
FD
I Dat
abas
e (a
cces
sed
1 J
uly
2015
).

ASEAN INVESTMENT REPORT 2015: Infrastructure Investment and Connectivity
18
further with the acquisition of a stake in two major local retailers in 2015. Technology companies from Europe and the United States such as Nokia, Intel and Microsoft are investing or expanding their presence in the host country too.
ASEAN companies have been active in expanding into Viet Nam. Amata Corporation (Thailand), which already has a presence in the host country, is building a new integrated city industrial estate. Its subsidiary, Amata Vietnam, received official approval in August 2014 to develop the $530 million Amata City Long Thanh industrial park in Dong Nai.16 Semen Indonesia bought a significant stake in Thang Long Cement (Viet Nam) in 2012 and is planning to further expand its operations in the country in 2015. It will increase capacity with a $300 million investment in a new plant as part of its business expansion strategy in ASEAN.
1.2.4. Factors and reasons for 2014 developments
A number of factors contributed to a further annual rise in FDI flows in ASEAN in 2014. The continued drive for regional expansion by MNEs was an important factor. The improving regional perception among international investors and increasing investment opportunities in the region helped attract more FDI. ASEAN companies also invested more last year as they continued to pursue regional investment plans.
Economic growth and anticipation of the AEC have encouraged foreign and ASEAN MNEs to invest in the region (AIR 2014). These factors together with rapidly growing per capita income and increasingly affluent consumers have led to rapid growth in market-seeking FDI, such as that in the retail industry (table 1.7). For instance, Lotte (Republic of Korea), Parkson (Malaysia) and AEON (Japan) opened more stores in the region in 2014 and plan to open more branches in 2015. The expected increase in demand for automotive vehicles further attracted major global automotive assemblers to increase their investment and expand production capacities in the region.
Rapid growth of industries such as the electronics and automotive industry, including parts and components production, is encouraging the expansion of regional investment into new plants and new product categories. For instance, many Japanese MNEs in Indonesia and Thailand expanded in these Member States in 2014. Japanese automotive MNEs such as Mazda, Nissan, Mitsubishi, Toyota and Honda, which already had significant presence in these Member States, have been expanding their production capacities into so-called eco-cars in Thailand and automotive manufacturing in Indonesia.17 Some Japanese automotive makers have been expanding also in the Philippines. Daihatsu is expanding in Malaysia with a new engine plant. As automotive
Table 1.7.
Strong macroeconomic fundamentals continue to characterize ASEAN, 2005 and 2010-2014
Selected indicators 2005 2010 2011 2012 2013 2014
GDP at current prices ($ billions) 922.6 1 898.1 2 205.9 2 336.9 2 402.0 2 570.5
GDP per capita ($) 1 675.2 3 215.9 3 683.1 3 850.8 3 907.6 4 129.8
Population (millions) 550.7 590.2 598.9 606.9 614.7 622.4
Source: ASEAN Secretariat, ASEANStat.

Chapter 1: FDI development and corporate investment strategies
19
assemblers expand their operations in the region, they are encouraging more of their suppliers to establish facilities close to them to achieve efficient supply chain networks. LG has been encouraging some of its suppliers and business partners to set up operations near to its facilities in Viet Nam. More automotive part and component manufacturers have invested in the region to be close to major hubs and places where the industry is booming in the host countries.
Cost advantages (e.g. low labour costs) in some Member States are attracting greater manufacturing FDI from outside and within the region. This investment is contributing to a growing regional division of labour and value chains that are connecting the ASEAN Member States more closely. Many automotive part and component MNEs, including major global electronic players such as LG, Samsung, Panasonic, Nikon and Intel, set up operations or expanded in the region last year. Some Chinese companies and foreign MNEs based in China are moving parts of their manufacturing operations to lower-cost ASEAN locations such as the CLMV countries. These MNEs include garment manufacturers as well.
Rapid urbanization, rising per capita income and growing populations are increasing demand for various infrastructure services, which in turn increases private investors’ interest in infrastructure investment in the region. Many foreign and ASEAN MNEs were involved in infrastructure developments in the region in 2014–2015 through contracts and concessions (chapters 2, 3 and 4). The announcement of huge infrastructure plans by and commitments of ASEAN Member States to deliver better-quality infrastructure services in the near and long term also contributed toward the rise in infrastructure investment.
Corporate aspirations to regionalize or to be major regional players in conjunction with increasing costs and market limitations at home continue to drive ASEAN companies to invest in neighbouring Member States. Strong corporate profitability and the growing cash reserves of the major ASEAN companies have added impetus to their regionalization and internationalization plans, which are also helping strengthen South-South cooperation (section 1.6).
The ongoing improvement of the region’s investment environment through policies introduced in past years (AIR 2013, AIR 2014) and emerging investment opportunities was another key contributory factor in the 2014 FDI situation.
The strong FDI inflows in 2014 can also be explained by motivations for investment in different industries, which in general do not differ from the past. FDI and intra-ASEAN investment in the extractive industry has been motivated largely by access to natural resources such as in mining of coal, oil and gas, and other minerals in resource-rich Member States. For this reason, Indonesia and Myanmar received significantly more extractive FDI than others in the region, including through production sharing and concession arrangements.
Agriculture investment in the region has been influenced by agro-climatic factors and by access to agricultural land and low-cost labour supply. Indonesia continued to attract significant palm oil and agriculture investment. Other ASEAN Member States such as the CLMV countries also attracted notable amounts of FDI in agriculture.

ASEAN INVESTMENT REPORT 2015: Infrastructure Investment and Connectivity
20
FDI into the manufacturing industry continued to be influenced by cost and market factors. Much depends also on the host country and the stage of development of an industry in the different Member States. For instance, investment in low value added manufacturing of electronics and of automotive parts and components in CLMV countries is generally motivated by cost reasons alone. Investment in textiles, garments and shoe manufacturing such as in Indonesia, Cambodia, Myanmar and Viet Nam is also cost oriented. Keeping costs low is an important motive. For some products and in some Member States – such as Indonesia, Thailand and the Philippines – investments are influenced by both cost and market factors (e.g. automotive manufacturing).
As in past years, FDI in services continued to be influenced by access to markets and in some cases strategic assets such as in finance and banking. The rapid growth of demand for residential property, commercial and industrial real estate, and construction led to an increase in FDI in these industries in some ASEAN Member States last year.
Some MNEs are also establishing regional operational headquarters in some ASEAN Member States, where these subsidiaries subsequently have made investment in the region on behalf of the parent. In some cases, these subsidiaries also supervised regional operations and have been tasked with the responsibilities of coordinating intra-company regional logistics and investment expansion plans. For instance, Japanese affiliates based in Singapore have been investing directly in CLMV countries and in the other ASEAN Member States. Many investment applications to the Board of Investment (BOI) of Thailand in 2014 for automotive, and parts and components production came from MNE affiliates operating in Singapore and other ASEAN Member States.
These reasons and motivations also apply to intraregional investment. Close cultural affinity and geographical proximity played significant roles in attracting intraregional investment in the region, as did the drive of ASEAN MNEs to become more significant regional players as ASEAN becomes more integrated. These additional and important reasons encouraged more ASEAN companies to plan regionally, including undertaking investment expansion plans targeting the region.
1.3. MNEs’ strategies and operations in 2014-2015: regional investment expansion strategies continue with the AEC a growing influence in investment plans
AIR 2014 highlighted that regional investment expansion by MNEs from developed and developing economies was a key contributory factor explaining FDI flows into the region in 2013. The regional expansion strategies of foreign and ASEAN companies remained a key aspect of the region’s investment landscape in 2014 and 2015. The strong regional expansion by MNEs again played an important role in pushing FDI to a higher level in 2014.
MNEs continue to expand their operations and regional footprints in ASEAN for various reasons. Notwithstanding the general decline in Japanese FDI, some Japanese companies continued to expand their regional presence by undertaking new and expansion projects

Chapter 1: FDI development and corporate investment strategies
21
in the same host country and in other ASEAN Member States. Some retail-based MNEs continue to expand regionally by establishing more stores in different Member States to capture market share and strengthen their foothold in light of market potential. Many MNEs are participating in the development of infrastructure in the region by winning contracts and concessions in 2014–2015, and operating through non-equity modalities (NEMs).
The role of contractors and subcontractors in infrastructure activities cannot be overlooked. Although their NEM operations are not captured in the FDI numbers, they nonetheless are important value chain players in the industry. Foreign investment and MNEs’ operations through NEMs are driving the rise in infrastructure activities in some ASEAN Member States. This aspect of corporate operation through contracts and concessions in ASEAN is an important feature of MNEs’ strategies which has significant implications for infrastructure developments in the region. In addition, by developing infrastructure and building their regional value chains, MNEs are helping ASEAN Member States become better connected (box 1.1).
Another significant development in MNEs’ operations in the region is the growing frequency of transfers of labour-intensive activities from higher-cost locations in other Asian economies and within ASEAN to the CLMV countries, as well as other ASEAN Member States such as Indonesia. MNEs making such transfers include manufacturing companies in textiles and garments. Mitsubishi’s trading house, with a local joint venture partner, is investing $60 million to build seven factories in Central Java, Indonesia, in 2014. Other garment manufacturers, such as Aoyama Trading (Japan) and Makalot Industrial (Taiwan Province of China), are shifting production from China to Central Java, Indonesia, because of cost reasons.18
An important implication of the ongoing corporate regional strategy is the contribution such MNEs make to the growth of intraregional production arrangements and supply chain connectivity. For instance, Nikon’s recent operation in Lao PDR is linking production facilities and operations with other Nikon affiliates in Thailand, as components produced in Lao PDR are exported to Thailand.
In 2014 and 2015,19 many automotive MNEs expanded and continued to expand production facilities in the region to support growing production volume and new product lines and to increase production of parts and components. These MNEs also expanded regionally with new investment projects and expansions of existing ones.
Another notable corporate strategy in 2014 was that foreign corporations – including those headquartered in ASEAN – made fewer cross-border M&As in the region in terms of high-value deals.
1.3.1. Foreign MNEs’ continued regional expansion
Foreign and ASEAN MNEs continue to expand their activities in the region in a range of industries. They expanded operations through projects that increase production capacities

ASEAN INVESTMENT REPORT 2015: Infrastructure Investment and Connectivity
22
by adding production lines and new plants and by expanding factories for manufacturing of existing product categories (AIR 2014). They also invested in new plants producing products in new categories in the same host country and in other ASEAN Member States. Some MNEs that already have significant presence in the region invest in new facilities in lower-cost ASEAN Member States that are connected to those MNEs’ former regional production networks. Some are expanding by taking on a portfolio of infrastructure projects concurrently across the region. Other MNEs have expanded into different business operations in different ASEAN Member States.
Marubeni Corporation (Japan), a major trading and investment business conglomerate, made a number of investment expansions in 2014-2015 in the region. It invested in Cambodia’s power sector through the acquisition of a 20% stake in a foreign independent power producer in 2014. Together with Tokyo Electric Power (Japan), it is currently building more power plants in the Philippines, with a new power plant to commence operation in 2017. It
Box 1.1. ASEAN Connectivity: lowering transaction costs and increasing regional competitiveness
A key element of ASEAN’s regional integration is connectivity and its implication for lowering the transaction costs of doing business and investing in the region (chapter 4). Regional connectivity increases the competitiveness of ASEAN in attracting investment and enhances production efficiency. Connectivity can be an important locational determinant of FDI and will further support ASEAN’s efforts to attract investment in the post–AEC 2015 environment.
Regional physical connectivity, through development in different infrastructure sectors, can reduce logistical costs, ease the movement of goods, expand access to electricity and improve the overall investment-enabling environment.
Physical connectivity has a broader nuance (chapters 2 and 4). It is not just building infrastructure and connecting countries but also generates spillover effects to other complementary industries and investment in them. They relate to, for instance, telecommunication infrastructure that enables the use of the Internet and mobile phones and supports e-commerce businesses; transport infrastructure that supports logistic businesses and the movement of people; port infrastructure that supports shipping operations and the movement of goods; airport infrastructure that supports connectivity of tourism and hospitality businesses; electricity infrastructure that enables power pooling; and industrial estates development that enables the establishment of many factories and manufacturing industries.
The operations of MNEs and FDI also contribute to strengthening regional connectivity (chapter 4), through investment and participation in physical infrastructure development, regional production networks, regional value chain activities (AIR 2014) and company linkages. MNEs’ regional expansion, which includes the distribution and coordination of production facilities across the region, is also contributing to further growth in connectivity between Member States.
The rise in FDI and MNEs’ participation in the region will further strengthen regional connectivity as ASEAN moves forward with the AEC.
Source: UNCTAD and ASEAN Secretariat.

Chapter 1: FDI development and corporate investment strategies
23
also expanded in 2014 by operating turnkey contracts to build power plants with consortium partners such as Mitsubishi Hitachi Power Systems (Japan) and Daelim Industrial (Republic of Korea). The company is starting a corrugated container business in Myanmar through a joint venture and has signed an agreement, together with Mitsubishi Corporation (Japan) and Sumitomo (Japan), to establish Myanmar Japan Thilawa Development Ltd. to market and sell Myanmar Thilawa SEZ to investors. In early 2014, Marubeni announced further involvement in the Indonesian power infrastructure and the building of another power plant worth $900 million in Viet Nam. In 2015, the company announced plans to build a major gas-fired power plant in Myanmar. With Alstom (France), Marubeni won a contract in 2015 to jointly build a $1 billion power plant in Thailand.
AEON, a major Japanese retailer, has expanded rapidly in ASEAN in recent years. The company plans to expand by opening more stores in the region between 2014 and 2016. In 2014, it opened its first stores in Cambodia and Viet Nam, and announced that it will open more outlets in these Member States. In the same year, it also opened a number of stores in various states in northern Malaysia. In May 2015, AEON expanded to Indonesia by opening its first store there; it plans to open 20 more new malls in West Java and Jakarta after 2016.
Hitachi, which already has a range of business operations in various ASEAN Member States, is expanding its infrastructure systems business in the region. It established Hitachi Infrastructure Systems (Asia) in Singapore in April 2014 to supervise the company’s infrastructure businesses in the region. The company won a significant contract in 2014 to expand the capability of the Sentosa Express light-rail system with a new wireless signaling system and another train set in Singapore. Hitachi, together with a local company, won an engineering, procurement and construction (EPC) contract in November 2014 to supply and construct the Chaiya Phum substation in Thailand by 2016. In partnership with Mitsubishi Corporation, it won a contract in 2015 to supply and install railway signaling systems in Myanmar by 2017. Mitsubishi Hitachi Power Systems announced plans in April 2015 to transfer the manufacturing of small- and medium-scale boilers from Japan to its production base in the Philippines. The company built a new plant in Indonesia in 2015, under its subsidiary Hitachi Automotive Systems Indonesia, which was established in November 2014. In January 2015, Hitachi acquired Aqua Works and Engineering (Singapore) to expand its infrastructure operations in that host country. The company also plans to build industrial parks in ASEAN Member States such as Cambodia.
A consortium of MNEs comprising Hitachi (Japan), Veolia (France) and Posco Engineering and Construction (Republic of Korea) was awarded a $130 million contract in February 2015 to expand a large-scale sewage treatment facility in Viet Nam. Mitsubishi Hitachi Power Systems (Japan) and Daelim (Republic of Korea) won a turnkey contract in June 2014 to build a 420 MW coal-fired power generation plant in Quezon Province, in the Philippines, for Pagbilao Energy (sponsor). The sponsor is jointly owned by TeaM Energy Corporation (Japan) and Aboitiz Power Corporation (Philippines). The former is owned equally by Marubeni Corporation and Tokyo Electric Power.

ASEAN INVESTMENT REPORT 2015: Infrastructure Investment and Connectivity
24
MNEs from the United States are expanding in the region. Having opened a bottling plant in Myanmar in 2013, Coca-Cola (United States) plans to invest $200 million over five years in the country and is expanding its factory in Cambodia with an additional $100 million investment from 2014 to 2018. Windsor Holdings, based in Singapore and owned by Square1 Infrastructure (United States), won a contract in 2015 to build 500 telecommunication towers in Myanmar for Ooredoo (Qatar).20
Volvo (Sweden) announced in 2014 that it is investing $23 million in the next three to five years to expand its network in Malaysia. Volkswagen (Germany) plans to build a $140 million factory in Indonesia in 2015. The company announced plans in 2014 to invest $1.29 billion to build a new manufacturing plant in Thailand to produce fuel-efficient cars; it is expected to go on line by 2019.21
Another indicator of MNEs’ expansion drive in the region is the increasing number of investment applications made by foreign companies for expansion purposes in ASEAN Member States. For instance, 55% of the approved manufacturing projects with foreign participation in Malaysia in 2014 were for the expansion of existing facilities and for the diversification of operations into new product development. They were associated with reinvestment from existing foreign investors, which suggests the confidence of these investors in operating in Malaysia. Some 203 expansion projects were approved in Malaysia in 2014, as compared with 196 in 2013. And MNEs operating in different industries were reported to have started operations on those projects. The companies include Honda (Japan), Tokuyama (Japan), Advanced Micro Devices (United States), Infineon Technologies (Germany), Ibiden Electronics (Japan), Flextronics (Singapore), FMC Technologies (United States) and Kiswire (Republic of Korea).
Similarly, the Thai BOI received more applications for FDI expansion projects than for new ones in 2014 (box 1.2). UOB (2015) found that one in four Asian enterprises plans to expand into Myanmar in 2015. They include companies from China, Hong Kong (China) and ASEAN.
In addition, some MNEs are not just expanding in the same host country. Their other subsidiaries are also expanding concurrently in other ASEAN Member States. Denso (Japan), with approval to expand its facilities in Thailand in 2014, is opening a plant in Cambodia to produce magnetos and sensor components, setting up a subsidiary in Myanmar, and operating a new plant in Indonesia. Suzuki plans to expand operations in Thailand to produce eco-cars; it will start construction of a second facility in Myanmar and started a new plant in Indonesia in 2015. With approval for new operations in Thailand, Mitsubishi is expanding in Indonesia, with a new plant to start operation in 2017. Toshiba (Japan) plans to invest $1 billion between 2014 and 2018 to expand its operations in the ASEAN region. Other Japanese MNEs that already have significant presence in the region have also further expanded in various ASEAN Member States in 2014–2015. They include Yazaki, which started auto parts production in Cambodia and Daihatsu, and is building a new engine plant in Malaysia.

Chapter 1: FDI development and corporate investment strategies
25
Box 1.2. Investment expansion of foreign companies in Thailand
The numbers of investment applications by foreign companies for expansion purposes in Thailand rose from 671 in 2013 to 1,087 in 2014. These numbers indicate the interest of these foreign companies to expand in the host country. A majority of them are Japanese companies with expansion plans in the assembling and manufacturing of automotive parts and components (box table 1.2.1). Some foreign automotive companies also made more investments into manufacturing of new products (e.g. eco-cars).
Box table 1.2.1. Investment expansion and new projects from selected countries and regions, 2013-2014
2013 2014
No. of projects
Investment(Billions of
baht)
No. of projects
Investment(Billions of
baht)
Japan Expansion projects 356 253.4 528 260.2
New projects 206 29.4 144 33.1
ASEAN Expansion projects 81 45.8 129 93.4
New projects 54 8.7 55 6.1
United States Expansion projects 31 10.9 46 50.2
New projects 24 0.7 28 80.8
European Union
Expansion projects 66 22.0 67 62.4
New projects 66 9.4 164 91.2
Korea, Republic of
Expansion projects 24 3.3 35 6.9
New projects 22 0.6 28 11.4
China Expansion projects 19 24.7 32 23.2
New projects 26 17.8 42 10.6
Source: BOI, Thailand.Note: On net application basis.
Companies such as Suzuki, Honda, Nissan, Mitsubishi and Mazda – all from Japan and already with significant presence in Thailand – are expanding in the country. Japanese auto part and component manufacturers such as Aisin Ai, JTEKT, Bridgestone, Denso, Boshoku Automotive, Hitachi Automotive Systems, Calsonic Kansei and GS Yuasa received approval in 2014 from the Thai BOI to expand operations in the host country. Similarly, Japanese electronics manufacturers such as Furukawa Fitel, Rohm, Sharp, NMB-Minebea, Panasonic, Murata, Nidec, MMC Electronics and Fuji Electric have received official approval to expand operations in Thailand.
Other companies, which include Ford Motor, General Motors, Hutchinson Technology, Pepsi-Cola, Johnson Controls and Visteon (all from the United States), and Saint-Gobain (France), Robert Bosch (Germany), Electrolux (Sweden) and Aeroworks (Netherlands), are expanding in the host country.
Source: UNCTAD based on BOI, Thailand.

ASEAN INVESTMENT REPORT 2015: Infrastructure Investment and Connectivity
26
1.3.2. Regional players and intraregional corporate investment
Companies from ASEAN Member States have been actively investing and expanding regionally too – a trend more visible a few years ago (AIR 2014). ASEAN companies that made regional investment in selected activities in 2014-201522 include the following:
TOA Paint (Thailand), which already has operations in other ASEAN Member States such as Lao PDR, Malaysia, Myanmar and Viet Nam, is planning to expand operations to Cambodia and Indonesia later in 2015.23 The aim is to further increase the company’s production base regionally and to prepare for the AEC. Other Thai companies are also expanding in the region in 2014. They include Siam Cement in Lao PDR, Saha Group in Myanmar and a number of Thai banks. Thai Oil, a refinery company of PTT (Thailand), is planning to expand in Indonesia and Myanmar with new refinery capacity.
Parkson, a subsidiary of the Lion Group (Malaysia), has been expanding in ASEAN. With 14 stores already in Indonesia, 1 in Myanmar and 9 in Viet Nam, Parkson is opening its first store in Cambodia later in 2015. The company opened a store in Indonesia in 2014 and another in Viet Nam in January 2015, and it plans to open more stores in the region.
Wah Seong (Malaysia), through its subsidiary in Cambodia, is investing to build a biomass power plant; it signed a power purchase agreement with Baitang Plc (Cambodia) in December 2014. The plant will start operation in 2016. The company also expanded its business portfolio regionally in 2014, when it ventured into a river port business in Myanmar. The company plans to expand the port services, including constructing more storage tanks and a fabrication yard to serve customers operating in the Thilawa SEZ.
Keppel Land (Singapore) is expanding its foothold in real estate operations in ASEAN and further afield. In ASEAN, it is building Phase 2 of the Saigon Centre in Ho Chi Minh City, Viet Nam, as well as Phase 1 of the International Financial Centre Jakarta in Indonesia, to be completed by 2015, with Phase 2 to be completed by 2020. The company is developing Phase 2 of its SM-KL Project in the Philippines and has acquired a 40% stake in a joint venture to develop the Junction City Office Tower in Yangon, Myanmar.
Sembcorp (Singapore) is building an integrated port and industrial estate in Indonesia and won a contract in 2015 to develop and operate a $300 million, 225 MW, gas-fired power plant in Myanmar. The company also started to build its seventh Vietnam Singapore Industrial Park in Nghe An Province in 2015.
ASEAN banks and insurance companies have been making new investments or undertaking expansion in the region. Many of the top 20 ASEAN banks, which had combined assets of $2.1 trillion in 2014, expanded their operations regionally in 2014-2015 (table 1.8). In addition to Thai banks such as Bangkok Bank, Kasikorn Bank and Siam Commercial Bank, other ASEAN banks, including United Overseas Bank (Singapore), OCBC (Singapore), Maybank (Malaysia), CIMB (Malaysia) and RHB Capital (Malaysia), also expanded activities in other ASEAN Member States in 2014 and 2015. Vietnamese banks are also expanding in neighbouring ASEAN Member States. Some were granted approvals in 2014 from the State

Chapter 1: FDI development and corporate investment strategies
27
Bank of Vietnam to upgrade or open subsidiaries in Lao PDR and Cambodia. They include Sacombank, Saigon-Hanoi Bank and Vietinbank.24
Other companies are also expanding in neighbouring countries. For example, Vinamilk (Viet Nam) is to start operation in Cambodia in 2015 (see box 1.4).25 Furthermore, many ASEAN companies, large and small, invested in the region last year and in 2015 by acquiring equity stakes in other ASEAN companies in the region (table 1.9). These companies include the following:
• Indonesia: Pharma Healthcare and Sinar Mas • Malaysia: Johor Corporation, CIMB, Gadang Holdings, SapuraKencana, Parkson,
Felda Global Ventures, YTL and Top Glove• The Philippines: JG Summit and Xurpas
Table 1.8. The top 20 ASEAN banks have regional footprints and significant assets, 2014(Millions of dollars)
Bank Headquarters Net income Total assets Market capitalization
Cash or near cash holding
Selected host country
DBS Group Singapore 3,194 332,653 38,447 14,733 Indonesia
Oversea-Chinese Banking Corp. Singapore 3,033 302,881 31,457 19,109 Brunei Darussalam, Indonesia and Malaysia
United Overseas Bank Singapore 2,565 231,551 29,678 26,484 Indonesia, Malaysia, Philippines, Thailand
Malayan Banking Malaysia 2,053 182,864 24,405 18,858 Indonesia, Philippines, Singapore, Cambodia
CIMB Group Malaysia 950 118,280 13,376 10,332 Brunei Darussalam, Cambodia, Indonesia, Myanmar, Singapore, Thailand, Viet Nam
Public Bank Malaysia 1,381 98,735 20,181 3,220 Cambodia, Lao PDR, Viet Nam
Bangkok Bank Thailand 1,119 83,862 11,252 1,822 Cambodia, Indonesia, Lao PDR, Malaysia, Myanmar, Philippines, Singapore, Viet Nam
Krung Thai Bank Thailand 1,022 83,238 9,640 2,269 Lao PDR, Myanmar and Singapore
Siam Commercial Bank Thailand 1,642 82,033 18,771 1,282 Cambodia, Myanmar, Lao PDR, Singapore and Viet Nam
Kasikorn Bank Thailand 1,421 72,596 16,653 1,764 Lao PDR, Myanmar and Viet Nam
Bank Mandiri Indonesia 1,676 68,788 20,227 5,746 Malaysia and Singapore
Bank Rakyat Indonesia 2,045 64,518 23,121 5,935 Singapore
RHB Capital Malaysia 623 62,646 5,598 6,185 Brunei Darussalam, Cambodia, Indonesia, Lao PDR, Myanmar, Singapore, Thailand and Viet Nam
Hong Leong Financial Group Malaysia 526 59,256 5,268 .. Cambodia, Singapore and Viet Nam
Hong Leong Bank Malaysia 648 53,079 7,735 .. Cambodia, Singapore and Viet Nam
Bank Central Asia Indonesia 1,391 44,443 26,034 4,710 Singapore
BDO Unibank Philippines 514 41,655 8,788 6,951 Singapore
AMMB Holdings Malaysia 557 40,643 6,646 3,771 Indonesia
Metropolitan Bank and Trust Philippines 453 35,864 5,092 5,594 Singapore
Bank Negara Indonesia 910 33,514 9,152 2,904 Singapore
Total of the top 20 ASEAN banks .. 27,722 2,093,099 331,522 141,669 ..
Source: UNCTAD 2015b, based on data of Bloomberg and company websites.
Note: Based on total assets reported for 2014.
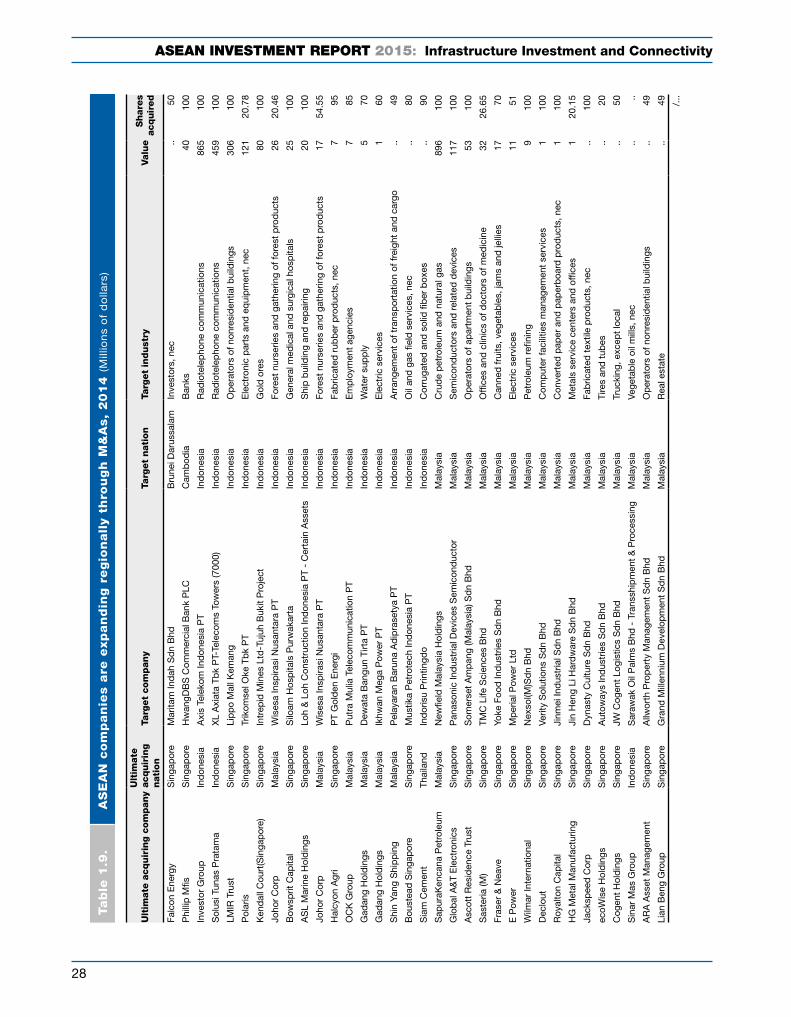
ASEAN INVESTMENT REPORT 2015: Infrastructure Investment and Connectivity
28
Tab
le 1
.9.
AS
EA
N c
om
pan
ies a
re e
xp
an
din
g r
eg
ion
all
y t
hro
ug
h M
&A
s,
20
14
(M
illio
ns
of
do
llars
)
Ult
imate
acq
uir
ing c
om
pan
yU
ltim
ate
acq
uir
ing
nati
on
Targ
et
com
pan
yTa
rget
nati
on
Targ
et
ind
ust
ryValu
eS
hare
s acquir
ed
Falc
on E
nerg
yS
inga
por
eM
arita
m In
dah
Sd
n B
hdB
rune
i Dar
ussa
lam
Inve
stor
s, n
ec ..
50
Phi
llip
Mfis
Sin
gap
ore
Hw
angD
BS
Com
mer
cial
Ban
k P
LCC
amb
odia
Ban
ks 4
010
0
Inve
stor
Gro
upIn
don
esia
Axi
s Te
leko
m In
don
esia
PT
Ind
ones
iaR
adio
tele
pho
ne c
omm
unic
atio
ns 8
6510
0
Sol
usi T
unas
Pra
tam
a In
don
esia
XL
Axi
ata
Tbk
PT-
Tele
com
s To
wer
s (7
000)
Ind
ones
iaR
adio
tele
pho
ne c
omm
unic
atio
ns 4
5910
0
LMIR
Tru
stS
inga
por
eLi
pp
o M
all K
eman
gIn
don
esia
Op
erat
ors
of n
onre
sid
entia
l bui
ldin
gs 3
0610
0
Pol
aris
S
inga
por
eTr
ikom
sel O
ke T
bk
PT
Ind
ones
iaE
lect
roni
c p
arts
and
eq
uip
men
t, n
ec 1
2120
.78
Ken
dal
l Cou
rt(S
inga
por
e)S
inga
por
eIn
trep
id M
ines
Ltd
-Tuj
uh B
ukit
Pro
ject
Ind
ones
iaG
old
ore
s 8
010
0
Joho
r C
orp
Mal
aysi
aW
ises
a In
spira
si N
usan
tara
PT
Ind
ones
iaFo
rest
nur
serie
s an
d g
athe
ring
of fo
rest
pro
duc
ts 2
620
.46
Bow
sprit
Cap
ital
Sin
gap
ore
Silo
am H
osp
itals
Pur
wak
arta
Ind
ones
iaG
ener
al m
edic
al a
nd s
urgi
cal h
osp
itals
25
100
AS
L M
arin
e H
old
ings
Sin
gap
ore
Loh
& L
oh C
onst
ruct
ion
Ind
ones
ia P
T -
Cer
tain
Ass
ets
Ind
ones
iaS
hip
bui
ldin
g an
d r
epai
ring
20
100
Joho
r C
orp
Mal
aysi
aW
ises
a In
spira
si N
usan
tara
PT
Ind
ones
iaFo
rest
nur
serie
s an
d g
athe
ring
of fo
rest
pro
duc
ts 1
754
.55
Hal
cyon
Agr
i S
inga
por
eP
T G
old
en E
nerg
iIn
don
esia
Fab
ricat
ed r
ubb
er p
rod
ucts
, nec
795
OC
K G
roup
Mal
aysi
aP
utra
Mul
ia T
elec
omm
unic
atio
n P
TIn
don
esia
Em
plo
ymen
t ag
enci
es 7
85
Gad
ang
Hol
din
gs
Mal
aysi
aD
ewat
a B
angu
n Ti
rta
PT
Ind
ones
iaW
ater
sup
ply
570
Gad
ang
Hol
din
gs
Mal
aysi
aIk
hwan
Meg
a P
ower
PT
Ind
ones
iaE
lect
ric s
ervi
ces
160
Shi
n Ya
ng S
hip
pin
g M
alay
sia
Pel
ayar
an B
arun
a A
dip
rase
tya
PT
Ind
ones
iaA
rran
gem
ent
of t
rans
por
tatio
n of
frei
ght
and
car
go ..
49
Bou
stea
d S
inga
por
eS
inga
por
eM
ustik
a P
etro
tech
Ind
ones
ia P
TIn
don
esia
Oil
and
gas
fiel
d s
ervi
ces,
nec
..80
Sia
m C
emen
tTh
aila
ndIn
dor
isu
Prin
tingd
oIn
don
esia
Cor
ruga
ted
and
sol
id fi
ber
box
es..
90
Sap
uraK
enca
na P
etro
leum
M
alay
sia
New
field
Mal
aysi
a H
old
ings
Mal
aysi
aC
rud
e p
etro
leum
and
nat
ural
gas
896
100
Glo
bal
A&
T E
lect
roni
csS
inga
por
eP
anas
onic
Ind
ustr
ial D
evic
es S
emic
ond
ucto
rM
alay
sia
Sem
icon
duc
tors
and
rel
ated
dev
ices
117
100
Asc
ott
Res
iden
ce T
rust
Sin
gap
ore
Som
erse
t A
mp
ang
(Mal
aysi
a) S
dn
Bhd
Mal
aysi
aO
per
ator
s of
ap
artm
ent
bui
ldin
gs 5
310
0
Sas
teria
(M)
Sin
gap
ore
TMC
Life
Sci
ence
s B
hdM
alay
sia
Offi
ces
and
clin
ics
of d
octo
rs o
f med
icin
e 3
226
.65
Fras
er &
Nea
ve
Sin
gap
ore
Yoke
Foo
d In
dus
trie
s S
dn
Bhd
Mal
aysi
aC
anne
d fr
uits
, veg
etab
les,
jam
s an
d je
llies
17
70
E P
ower
S
inga
por
eM
per
ial P
ower
Ltd
Mal
aysi
aE
lect
ric s
ervi
ces
11
51
Wilm
ar In
tern
atio
nal
Sin
gap
ore
Nex
sol(M
)Sd
n B
hdM
alay
sia
Pet
role
um r
efin
ing
910
0
Dec
lout
Sin
gap
ore
Verit
y S
olut
ions
Sd
n B
hdM
alay
sia
Com
put
er fa
cilit
ies
man
agem
ent
serv
ices
110
0
Roy
alto
n C
apita
lS
inga
por
eJi
nmei
Ind
ustr
ial S
dn
Bhd
Mal
aysi
aC
onve
rted
pap
er a
nd p
aper
boa
rd p
rod
ucts
, nec
110
0
HG
Met
al M
anuf
actu
ring
Sin
gap
ore
Jin
Hen
g Li
Har
dw
are
Sd
n B
hdM
alay
sia
Met
als
serv
ice
cent
ers
and
offi
ces
120
.15
Jack
spee
d C
orp
S
inga
por
eD
ynas
ty C
ultu
re S
dn
Bhd
Mal
aysi
aFa
bric
ated
tex
tile
pro
duc
ts, n
ec ..
100
ecoW
ise
Hol
din
gsS
inga
por
eA
utow
ays
Ind
ustr
ies
Sd
n B
hdM
alay
sia
Tire
s an
d t
ubes
..20
Cog
ent
Hol
din
gsS
inga
por
eJW
Cog
ent
Logi
stic
s S
dn
Bhd
Mal
aysi
aTr
ucki
ng, e
xcep
t lo
cal
..50
Sin
ar M
as G
roup
Ind
ones
iaS
araw
ak O
il P
alm
s B
hd -
Tra
nssh
ipm
ent
& P
roce
ssin
g M
alay
sia
Vege
tab
le o
il m
ills,
nec
....
AR
A A
sset
Man
agem
ent
Sin
gap
ore
Allw
orth
Pro
per
ty M
anag
emen
t S
dn
Bhd
Mal
aysi
aO
per
ator
s of
non
resi
den
tial b
uild
ings
..49
Lian
Ben
g G
roup
Sin
gap
ore
Gra
nd M
illen
nium
Dev
elop
men
t S
dn
Bhd
Mal
aysi
aR
eal e
stat
e..
49 /...

Chapter 1: FDI development and corporate investment strategies
29
Ult
imate
acq
uir
ing c
om
pan
yU
ltim
ate
acq
uir
ing
nati
on
Targ
et
com
pan
yTa
rget
nati
on
Targ
et
ind
ust
ryValu
eS
hare
s acquir
ed
Cen
tral
Mar
ketin
g G
roup
Thai
land
HC
H G
roup
Mal
aysi
aW
omen
’s a
nd c
hild
ren’
s cl
othi
ng..
100
Qua
n M
in H
old
ings
Sin
gap
ore
Q &
M D
enta
l Sur
gery
(Ban
dar
Put
eri P
ucho
ng)
Mal
aysi
aO
ffice
s an
d c
linic
s of
den
tists
..20
Sin
gap
ore
Sin
gap
ore
Em
per
ador
Inc
Phi
lipp
ines
Dis
tille
d a
nd b
lend
ed li
quo
rs 3
9110
.67
JG S
umm
it H
old
ings
P
hilip
pin
esTi
gera
ir P
hilip
pin
esP
hilip
pin
esA
ir tr
ansp
orta
tion,
sch
edul
ed 1
510
0
Ban
co D
e O
ro U
nib
ank
Phi
lipp
ines
Citi
ban
k S
avin
gs In
cP
hilip
pin
esB
anks
..99
.99
Ele
ctric
ity G
ener
atin
g P
CL
Thai
land
Mas
in-A
ES
Pte
Ltd
Sin
gap
ore
Ele
ctric
ser
vice
s 4
5345
Pea
k H
otel
s &
Res
orts
Gro
upS
inga
por
eS
ilver
link
Res
orts
Ltd
Sin
gap
ore
Hot
els
and
mot
els
358
100
DB
S G
roup
Hol
din
gs
Sin
gap
ore
Soc
iéét
é G
énér
ale
Priv
ate
Ban
king
Sin
gap
ore
Inve
stm
ent
advi
ce 2
2010
0
Feld
a G
lob
al V
entu
res
Mal
aysi
aA
sian
Pla
ntat
ions
Ltd
Sin
gap
ore
Cas
h gr
ains
, nec
171
100
Top
Glo
ve
Mal
aysi
aM
edi-
Flex
Ltd
Sin
gap
ore
Pla
stic
s p
rod
ucts
, nec
23
20.2
3
Inve
stor
Gro
upIn
don
esia
Nav
igat
Gro
up P
te L
tdS
inga
por
eE
lect
rical
ap
par
atus
and
eq
uip
men
t 2
16.
7
YTL
Cor
p
Mal
aysi
aS
in H
eng
Cha
n (S
inga
por
e) P
te L
tdS
inga
por
eP
rep
ared
ani
mal
feed
s, e
xcep
t fo
r d
ogs
and
cat
s 1
910
0
Mitr
a In
vest
ind
o In
don
esia
Gol
dw
ater
LS
Pte
Ltd
Sin
gap
ore
Cru
de
pet
role
um a
nd n
atur
al g
as 1
490
Enc
o H
old
ings
M
alay
sia
Ken
cana
Bio
Ene
rgy
Pte
Ltd
Sin
gap
ore
Ele
ctric
ser
vice
s 5
30
Kob
ay T
echn
olog
y M
alay
sia
Mic
roha
ndlin
g A
sia
Pte
Ltd
Sin
gap
ore
Mea
surin
g an
d c
ontr
ollin
g d
evic
es ..
49
Nam
Che
ong
Mal
aysi
aM
arco
Pol
o O
ffsho
re (I
V) P
te L
tdS
inga
por
eD
eep
sea
fore
ign
tran
spor
tatio
n of
frei
ght
..50
Nav
is C
apita
l Par
tner
sM
alay
sia
MFS
Tec
hnol
ogy
(S) P
te L
tdS
inga
por
eP
rinte
d c
ircui
t b
oard
s..
..
Xur
pas
P
hilip
pin
esA
ltitu
de
Gam
es P
te L
tdS
inga
por
eC
omp
uter
faci
litie
s m
anag
emen
t se
rvic
es..
21.7
Nav
is C
apita
l Par
tner
sM
alay
sia
Cla
dte
k H
old
ings
Pte
Ltd
Sin
gap
ore
Oil
and
gas
fiel
d s
ervi
ces,
nec
..10
0
Exa
byt
es N
etw
ork
Mal
aysi
aU
sony
x P
te L
tdS
inga
por
eC
omp
uter
rel
ated
ser
vice
s, n
ec..
100
Ast
ro H
old
ings
M
alay
sia
Asi
a S
por
ts V
entu
res
Pte
Ltd
Sin
gap
ore
Man
agem
ent
cons
ultin
g se
rvic
es..
50
Inve
stor
Gro
upTh
aila
ndH
ess
Thai
land
Hol
din
gs II
Ltd
Thai
land
Pet
role
um r
efin
ing
1,00
010
0
B G
rimm
Pow
er
Thai
land
Sim
e D
arb
y P
ower
Co
Ltd
Thai
land
Ele
ctric
ser
vice
s 1
6310
0
Loyz
Ene
rgy
Sin
gap
ore
Car
narv
on T
haila
nd L
td -
Ons
hore
Con
cess
ions
Thai
land
Cru
de
pet
role
um a
nd n
atur
al g
as 6
520
Hot
el R
oyal
Sin
gap
ore
Pan
ali C
o Lt
dTh
aila
ndH
otel
s an
d m
otel
s 4
010
0
Cat
cha
Med
iaM
alay
sia
One
2Car
Co
Ltd
Thai
land
Bus
ines
s se
rvic
es, n
ec 1
510
0
Tune
Mon
ey
Mal
aysi
aO
sots
pa
Insu
ranc
e P
CL
Thai
land
Insu
ranc
e ag
ents
, bro
kers
and
ser
vice
13
49
Hot
el P
rop
ertie
sS
inga
por
eLa
em K
a P
rop
ertie
s C
o Lt
dTh
aila
ndR
eal e
stat
e 3
45
TEE
Inte
rnat
iona
lS
inga
por
eC
MC
Com
mun
icat
ions
(Tha
iland
) Co
Ltd
Thai
land
Tele
pho
ne c
omm
unic
atio
ns ..
20
Phi
llip
Sec
uriti
es
Sin
gap
ore
Fina
nsa
Life
Ass
uran
ce C
o Lt
dTh
aila
ndLi
fe in
sura
nce
..98
Thor
ough
bre
d H
old
ings
S
inga
por
eTh
ai T
ech
Ste
el (2
003)
Co
Ltd
Thai
land
Col
d-r
olle
d s
teel
she
et, s
trip
and
bar
s..
70
Furn
iweb
Ind
ustr
ial P
rod
ucts
Mal
aysi
aFu
rnite
ch C
omp
onen
ts (V
ietn
am) C
o Lt
dV
iet
Nam
Met
al h
ouse
hold
furn
iture
..10
.44
Triy
ard
s H
old
ings
S
inga
por
eS
trat
egic
Mar
ine
(V) C
o Lt
dV
iet
Nam
Shi
p b
uild
ing
and
rep
airin
g..
100
Sou
rce:
UN
CTA
D, U
NC
TAD
M&
A D
atab
ase
(acc
esse
d 1
5 Ju
ly 2
015)
.
Not
e: S
elec
ted
cas
es,
on g
ross
bas
is. n
ec =
not
els
ewhe
re c
lass
ified
.
Tab
le 1
.9.
AS
EA
N c
om
pan
ies a
re e
xp
an
din
g r
eg
ion
all
y t
hro
ug
h M
&A
s,
20
14
(M
illio
ns
of
do
llars
) (c
on
clu
de
d)

ASEAN INVESTMENT REPORT 2015: Infrastructure Investment and Connectivity
30
• Singapore: LMIR Trust, Polaris, Boustead, Fraser and Neave, E-Power, Wilmar, CapitaLand, Jackspeed Corporation, Jubilee Industries, Tembusu Industries and DBS
• Thailand: Siam Cement, Electricity Generating PCL, Bangchak Petroleum, Power Buy and B. Grimm Power
1.3.3. Cross-border M&As
Cross-border M&A sales in ASEAN were down, but purchases made by ASEAN companies rose. MNEs continued to use cross-border M&A as a strategy for participating in and accessing the ASEAN market, establishing quick production or service platforms, and acquiring strategic assets in the region. The use of cross-border M&As tends to be by MNEs from some key source countries and concentrated in ASEAN Member States with more mature M&As environments.
Although the value of cross-border M&As in the region declined by nearly 50%,26 the number of deals held steady (410 in 2014 compared with 409 in 2013), suggesting that MNEs continue to have interest in using M&As as a channel to operate in the region. The decline in value was due to the drop in the size of deals, including mega deals, those exceeding $500 million (from 17 in 2013 to just 10 in 2014).
Companies from developed and developing economies acquired considerably fewer assets in the region last year (table 1.10). Cross-border M&As by companies from developing economies fell by almost 50%, mainly as a result of the significant dive in the numbers and values of cross-border M&As made by ASEAN companies in particular. In addition, regional cross-border M&A deals by ASEAN companies fell from $20.3 billion in 2013 to just $7.4 billion in 2014, due to the significant decline in M&As made by Thai companies. Regional cross-border M&As made by Thai companies in 2014 stood at $1.6 billion, which significantly contrasted with the $13.1 billion recorded in 2013.
The decline in M&As does not necessarily suggest a loss of appetite by ASEAN companies for making acquisitions in the region. The timing of M&A opportunities, particularly those involving mega deals, of which many were done in 2012-2013, also contributed. The plunge in cross-border M&As also highlights the inherent “lumpiness” in the values of M&A activities and the effect of mega deals on trends in cross-border M&As.
Although cross-border M&A deals by Japanese companies also declined significantly, Japan was nonetheless the largest acquirer of assets in ASEAN, with nearly $4 billion in deals, followed by the United States with $3.1 billion (a 19-fold increase, compared with deals made by American companies in 2013). Deals by Chinese companies rose by 13 times to $2.4 billion in 2014. Indonesian and Korean companies also made significant acquisitions in the region.
Cross-border M&As in the region in all three key economic sectors (i.e. primary, manufacturing and services) declined (table 1.11). However, deals in infrastructure-related industries bucked the trend. Cross-border M&A values in ICT rose significantly from $0.4

Chapter 1: FDI development and corporate investment strategies
31
Table 1.10. Cross-border M&A sales in ASEAN fell by nearly 50% in 2014 (Millions of dollars)
2010 2011 2012 2013 2014
World 21,324 34,353 23,043 40,363 21,700
Developed economies 6,232 18,070 10,664 15,989 9,776
Europe 3,163 7,803 6,988 6,766 1,151
European Union 2,622 7,571 6,987 5,566 954
France 318 1,464 1,305 57 42
Germany 613 282 .. 52 211
Italy .. .. 123 697 85
Netherlands 4 329 4,812 2,043 ..
Sweden 16 5 3 .. 220
United Kingdom 1,660 5,228 625 2,108 304
Other developed Europe 541 232 .. 1,200 197
Switzerland 319 231 .. 1,186 197
North America 888 4,632 567 223 3,114
United States 871 3,399 513 164 3,114
Other developed countries 2,181 5,635 3,109 9,000 5,511
Australia 253 473 555 539 1,303
Japan 1,928 5,162 2,554 8,461 3,896
Developing economies 14,698 16,226 12,233 23,269 11,864
Africa 270 .. 263 256 119
Latin America and the Caribbean 40 705 14 724 ..
Asia 14,388 15,521 11,955 22,289 11,745
China 1,014 1,150 222 186 2,397
Hong Kong, China 520 939 2,235 1,545 1,074
Korea, Republic of 2,023 1,321 161 142 754
ASEAN 9,348 9,646 8,460 20,339 7,436
Indonesia 1,223 759 936 1,321 1,992
Malaysia 3,699 2,046 383 3,454 1,464
Philippines 1 22 705 108 27
Singapore 3,833 5,890 2,355 2,376 2,336
Thailand 542 928 3,950 13,077 1,617
Viet Nam 50 .. 31 2 ..
Source: UNCTAD, UNCTAD M&A Database.
Note: gross basis.
billion in 2013 to $3.6 billion in 2014, transportation and storage deals rose by 25% to $1.5 billion and electricity, gas, water and sanitation deals by 4% to $1.1 billion in 2014. Trade, manufacturing and finance witnessed significant declines in cross-border M&A sales.
Most of the significant deals were made in infrastructure-related industry by Chinese and ASEAN companies, indicating the growing use of the M&A strategy to establish a presence in the region. China Mobile acquired a 23% stake in True Corporation (Thailand) for $882 million, Solusi Tunas Pratama (Indonesia) acquired Malaysian-owned Axiata-Telecom Towers in Indonesia for $459 million, Electricity Generating (Thailand) acquired a 45% interest in Masin-AES in Singapore for $453 million, and a Korean company acquired Angat Hydroelectric Power Plant in the Philippines for $441 million.

ASEAN INVESTMENT REPORT 2015: Infrastructure Investment and Connectivity
32
Table 1.11. Cross-border M&A sales in infrastructure-related industries in ASEAN rose in 2014 (Millions of dollars)
2010 2011 2012 2013 2014
Total 21,324 34,353 23,043 40,363 21,700
Primary 2,515 6,752 4,300 3,448 2,015
Agriculture, forestry and fishing 42 479 254 3 237
Mining and quarrying 2,474 6,273 4,046 3,445 1,778
Manufacturing 5,126 5,539 9,709 14,219 4,105
Food, beverages and tobacco 1,995 1,040 7,445 10,745 1,273
Paper and paper products 22 261 18 11 108
Coke and refined petroleum products .. .. .. .. 1,009
Chemicals and chemical products 1,463 1,214 660 23 275
Pharmaceuticals, medicinal chemical and botanical products - 122 95 610 182
Rubber and plastics products 448 379 106 164 30
Basic metal and metal products 375 576 78 719 400
Computer, electronic, optical products and electrical equipment 100 1,393 514 87 171
Motor vehicles and other transport equipment 39 166 114 1,267 515
Non-metallic mineral products 316 85 231 64 28
Machinery and equipment 12 112 101 45 85
Services 13,682 22,062 9,034 22,697 15,580
Electricity, gas, water and waste management 157 2,612 632 1,077 1,122
Construction 440 143 71 103 9
Trade 1,659 1,769 930 7,867 326
Accommodation and food service activities 63 414 471 1,925 729
Transportation and storage 731 3,746 296 1,194 1,497
Information and communication 222 725 524 438 3,563
Financial and insurance activities 5,517 6,923 3,547 8,133 3,172
Business activities 1,661 4,260 1,796 1,646 3,921
Education .. 37 16 .. 12
Arts, entertainment and recreation 17 78 3 6 1,113
Other service activities 2 32 29 .. 25
Source: UNCTAD, UNCTAD M&A Database.
Note: gross basis.
Japanese companies made significant acquisitions in finance, in particular, in the insurance industry in Indonesia. Sumitomo Mitsui Financial Group acquired a 15.7 % stake in Bank Tabungan Pensiunan Nasional (Indonesia) for $526 million, Nippon Life Insurance acquired a 20% interest in Asuransi Jiwa Sequis Life (Indonesia) for $424 million, and Sumitomo Life Insurance acquired 40% ownership of BNI Life Insurance (Indonesia) for $357 million.
1.4. Policy developments
ASEAN Member States continue to introduce measures in 2014-201527 to make investing easier, increase transparency and improve the investment environment. Measures introduced include national investment policy reforms, industrial development policies, incentives and tax reforms, investment facilitation, infrastructure development and institutional support to investors. The ASEAN Member States are also involved with other

Chapter 1: FDI development and corporate investment strategies
33
investment-related agreements at the bilateral, plurilateral and regional levels, which are at various stages of negotiation and development. Some of the measures introduced or announced in 2014–2015 include those laid out in the following subsections.
1.4.1. Reform and improvement of investment policies
In a number of Member States, the following reforms and improvements in investment policies were made:
• Indonesia enacted Presidential Regulation Number 39 Year 2014, “Lists of Business Fields that are Closed for Investment and Business Fields that are Conditionally Open for Investment”, which aims to provide clearer, more transparent and more certain investment policies.
• The Myanmar Investment Commission issued notifications in August 2014 on (i) amended classification of types of economic activities, (ii) economic activities requiring environmental impact assessment and (iii) investment businesses that will be granted or not granted exemption and tax relief.
• The Philippines issued the 10th Foreign Investment Negative List on 29 May 2015 to reflect the changes in its List A (sectors in which foreign ownership is limited by mandate of the constitution and specific laws). The list provides clarity on which professional practices are open to foreigners, subject to reciprocity.
• Singapore amended the Companies Act of 1967 in October 2014 to reduce the regulatory burden on companies, provide for greater business flexibility and improve the corporate governance landscape in the country.
• The Thailand BOI made Announcement No. 2/2557 on 3 December 2014, promoting more high-value industries and eco-friendly production in the country. This announcement became effective for applications submitted from 1 January 2015.
• Viet Nam amended its Investment Law and Enterprise Law; the amendment took effect on 1 July 2015. The new law guarantees the freedom of doing business in Viet Nam except for the clearly defined business lines prohibited by the law.
A number of Member States are updating or improving their investment policies. For instance, Cambodia is drafting a new law on investment to update the law that was adopted in 1994 and amended in 2003. Myanmar is working on merging the Myanmar Citizens Investment Law and the Foreign Investment Law into a single law, as well as updating the century-old Myanmar Companies Act (1914).
Some Member States have also announced efforts to align investment policies with national economic or industrial development policy. They include the following:
• Cambodia is working on its “Industrial Development Policy 2015-2025”, which will be launched later in 2015. It has also adopted what are called “Four Key Concrete Measures” to be accomplished by 2018, which target economic areas such as electricity, the transport and logistics system, labour development, and the Sihanoukville SEZ.

ASEAN INVESTMENT REPORT 2015: Infrastructure Investment and Connectivity
34
• Malaysia launched the 11th Malaysia Plan on 21 May 2015 to chart its latest direction to become a high-income nation by 2020. The plan includes strategies to position Malaysia as a high-tech hub for manufacturing and services activities, and to attract quality investments in high value added industries as well as new growth areas.
• Myanmar’s National Comprehensive Development Plan, which consists of four detailed five-year plans from 2011 to 2030, is in the approval process. It will include a long-term 20-year Foreign Direct Investment Promotion Plan.
• The 2011–2016 Philippines’ Development Plan, which focuses on industrialization, identified six broad sectors as priorities. In aligning its investment strategy with this industrial plan, a new approach was undertaken through the Investment Priorities Plan starting in 2014. Instead of an annual listing of industries to be granted fiscal incentives, the plan will be effective for three years, to provide investors with predictable policies for investing in new areas identified by the Government.
• In line with Thailand’s 11th National Economic and Social Development Plan (2012-2016), the BOI approved a “Seven-Year Investment Strategy” (2015-2021) in November 2014. The strategy focuses on promoting investments that create value and have a positive impact on society and the environment; it became effective for applications submitted starting 1 January 2015.
1.4.2. Investment incentives and tax reforms
ASEAN Member States have also made announcements about the provision of incentives and tax reforms. They include the following:
• Indonesia issued Government Regulation Number 18 Year 2015 (effective since 6 May 2015) to improve tax incentives for investments made in certain business fields or regions. It offers more types of incentives with more relaxed conditions and broader eligibility criteria for business fields and regions.
• Malaysia announced four new incentives in the 2015 budget for investments made in less developed areas, industrial estates, and projects that increase automation in labour-intensive industries, and establishment of principal hubs.
• Thailand’s “Seven-Year Investment Strategy” (2015-2021), approved in November 2014, offers fiscal incentives on the basis of the importance of the activities and the merit of the investment (such as whether it enhances competitiveness, promotes decentralization, or encourages industrial area development).
On tax matters, Indonesia, Malaysia and Myanmar updated their tax schemes. Thailand postponed its tax increase and Brunei Darussalam announced a number of agreements on the avoidance of double taxation. These developments are as follows:
• Brunei Darussalam signed the Agreement on the Avoidance of Double Taxation with the Republic of Korea on 9 December 2014. The Tax Information Exchange Agreement between Brunei Darussalam and Canada entered into force on 24 December 2014, and the Brunei Darussalam-United Arab Emirates Avoidance of Double Taxation Agreement came into effect on 1 January 2015.

Chapter 1: FDI development and corporate investment strategies
35
• Indonesia’s Government Regulation Number 18 Year 2015 not only provides an income tax facility for investment made in certain business fields or regions, it also improves the procedure of applying for income tax exemption. Investors can submit applications through a one-stop service centre and results will be provided within 30 working days.
• Malaysia implemented a goods and services tax (GST) on 1 April 2015. Businesses making taxable annual sales of more than RM 500,000 are required to register for GST. The GST rate is fixed at 6%.
• Myanmar promulgated the Law Amending the Income Tax Law, Commercial Tax Law, and Union Tax Law in March 2014. Tax rate structures have been simplified and foreign currency–denominated contracts are no longer subject to 1% stamp duty.
• Thailand postponed the planned increase in the value added tax rate from 7% to 10% in 2014. It had also reduced the corporate income tax from 30% to 23% in 2012 and to 20% in 2013.
1.4.3. Investment facilitation and ease of doing business measures
Member States implemented various initiatives to facilitate investment and to increase the ease of doing business. They include streamlining of investment procedures, increases in institutional support for investors, and establishment of more economic zones and infrastructure development.
Streamlining of processes and requirements
Member States also streamlined investment application processes to make investment easy. These actions included the following:
• Brunei Darussalam amended its Miscellaneous License Act on 1 January 2015, to allow business licenses to be issued immediately by a single authority under the Ministry of Home Affairs, once the business incorporation or registration certificates have been issued by the Ministry of Finance; businesses are given a grace period to fulfil all the requirements.
• Myanmar’s new Foreign Investment Rules reduce the number of steps and documents for the business approval process.
• The Philippines unveiled reforms on 14 April 2015, simplifying the process of starting a business to 6 steps and 8 days, from 16 steps and 34 days.
One-start, one-stop centres
Indonesia and Myanmar established one-stop centres to facilitate investment.
• Indonesia revived its Investment One-Stop Service (OSS) Centre on 26 January 2015, making the process faster, simpler, more transparent and convenient. The OSS Centre obtains authority from related technical ministries or agencies to issue licensing and

ASEAN INVESTMENT REPORT 2015: Infrastructure Investment and Connectivity
36
non-licensing documents for particular sectors. It integrates with 22 ministries and agencies, covering most business fields. Indonesia’s investment agency, BKPM, is also assisting regional governments in implementing OSS centres at provincial and district levels, which are targeted to be integrated with the OSS Centre in Jakarta in 2016.
• Myanmar moved its office of the Directorate of Investment and Company Administration from Nay Pyi Taw to Yangon in July 2014, to be closer to its one-stop centre and the business community. One-stop centres have been further extended to branch offices in Monywa, Pathein and Dawei in 2015.
Special economic zones (SEZs)
Myanmar and Thailand announced investment policies relating to SEZs:
• Myanmar promulgated its SEZ Law in January 2014, which decentralizes decision-making to the SEZ committee and allows seven years’ income tax exemption – eight years for construction companies in designated areas.
• The Thailand BOI’s Announcement No. 4/2557 grants an additional three-year corporate income tax exemption on top of basic incentives for investment projects located in the country’s five SEZs. Maximum incentives will be offered to 13 targeted industries, covering 61 business activities, if they locate operations in one of the SEZs.
Other measures and infrastructure development
Some Member States also made announcements or introduced other measures that support investment, which include national infrastructure development plans:
• Brunei Darussalam is preparing a comprehensive National Land Transport Master Plan. Several sector-specific industrial parks that are ready to be utilized by investors have been allocated.
• Indonesia enacted Presidential Regulation Number 30 Year 2015 on 17 March 2015, which covers land procurement for public infrastructure. The Government will take over the responsibility for conducting such procurement.
• The 11th Malaysia Plan, launched on 21 May 2015, announced several major infrastructure projects to boost growth, to be funded by both the private and the public sectors. These projects include additional Mass Rapid Transit (MRT) and Light-Rail Transit (LRT) rail lines.
• Singapore amended its Land Titles Act, effective 15 August 2014, to provide greater clarity, consistency and operational efficiency. For example, the provisions relating to the surrender and reissuance of title to land (whether registered or unregistered, whether subject to mortgage or charge, and whether of the same or different tenure) have been streamlined and simplified to a single process.
• Thailand is restructuring its trade and investment schemes, and enhancing its competitiveness through the development of the financial market and capital market, the intellectual property management system, local infrastructure, and energy security.

Chapter 1: FDI development and corporate investment strategies
37
• Viet Nam issued a decree on public-private partnerships on 14 February 2015 to regulate the conditions and procedures for implementing infrastructure investment projects in that form.
1.4.4. Regional and bilateral investment agreements
ASEAN Member States are collectively negotiating investment agreements for various ASEAN free trade agreements (FTAs) with Dialogue Partners, including the Regional Comprehensive Economic Partnership.
Individual Member States continue to actively negotiate and implement bilateral and plurilateral FTAs that include investment agreements or chapters. Some Member States have concluded additional bilateral investment treaties (BITs) and investment promotion and protection agreements (IPPAs). The concluded BITs include the following:
• Cambodia-Belarus BIT on 23 April 2014• Cambodia-Russia BIT on 3 March 2014• Myanmar-Republic of Korea IPPA, signed on 5 June 2014• Myanmar-Israel IPPA on 5 October 2014• Singapore BITs with Burkina Faso and Côte d’Ivoire, signed on 27 August 2014• EU-Singapore FTA’s investment protection chapter, initialled in May 2015• Viet Nam-South Korea FTA, signed on 5 May 2015 • Viet Nam-Eurasian Custom Union FTA, signed on 29 May 2015
Some Member States are negotiating other bilateral investment instruments with a number of different partner countries. They include the following:
• Trans-Pacific Partnership Agreement, participated in by Brunei Darussalam, Malaysia, Singapore, and Viet Nam
• Separate BITs by Lao PDR with Azerbaijan, Canada, Pakistan, Portugal, Serbia, Turkey, and Ukraine
• Malaysia-European Free Trade Association (EFTA) Economic Partnership Agreement (MEEPA)
• Myanmar-EU Investment Protection Agreement • Philippines-EFTA• Philippines-EU FTA• Philippines-Mexico IPPA• Singapore-Turkey FTA• Thailand-India FTA• Thailand-EU FTA• Thailand-Canada FTA

ASEAN INVESTMENT REPORT 2015: Infrastructure Investment and Connectivity
38
1.5. Outlook for 2015-2016
FDI inflows in 2015 are likely to decline marginally or stay at about the same level as in 2014, partly because of global economic fragilities and slower growth in the region. Cross-border M&A sales and FDI flows to the region in the first half of 2015 were down. Those weak numbers do not augur well for the region to record higher annual FDI flows in 2015 to surpass the level achieved in 2014.
The outlook for 2016 is cautiously optimistic, but much depends on the health of the global economy and corporate investment plans as well as the delivery of the AEC in terms of depth and scope. Supporting further investment into the region in 2016 and beyond are the region’s strong macroeconomic fundamentals, its economic resilience and the influences of regional integration, as well as the cost competitiveness of the region, the strong cash holdings of ASEAN companies, and the continued regional investment expansion plans of investors.
A number of specific factors are worth highlighting:
• The region’s growing number of middle-income consumers and its comparatively higher economic growth as compared with the world average will continue to play important roles in attracting market-seeking FDI and influencing corporate investment plans.
• As the region becomes more integrated, companies are positioning themselves strategically with more expected to expand regionally in post-AEC 2015. The AEC is expected to increase the competitiveness of the region and connectivity between ASEAN Member States, which will help reduce the transaction costs of investment and the cost of doing business in the region across a wide range of industries.
• The growing competitiveness of the region will play a key role in attracting FDI, with MNEs constantly seeking lower-cost locations and opportunities for production networks to increase their efficiency. The rise in production costs in locations outside the region and within ASEAN will encourage efficiency-seeking FDI to and within the region.
• MNEs, both foreign and ASEAN, will continue to exploit complementary locational advantages within the region with respect to building an effective supply chain strategy and achieving production efficiency. This will entail investment and production operations that are based on differences in locational cost structures, factors of production and skill levels that match MNEs’ strategy. As MNEs engage in regional division of production for reasons of markets, costs or access to natural resources, they are connecting the Member States through production, investment and inter- and intra-firm linkages – making the region a stronger magnet for attracting FDI from new and existing investors.
• The huge infrastructure plans announced by ASEAN Member States and their commitment to attracting private investment into infrastructure will contribute to the rise in investment in this industry, including in industrial estates development

Chapter 1: FDI development and corporate investment strategies
39
Box 1.3. Reforming international investment governance
In its World Investment Report 2015: Reforming International Investment Governance, UNCTAD presents policy options for meeting the five key challenges in governance:
• Safeguarding the right to regulate: Options include clarifying or circumscribing provisions such as most-favoured-nation (MFN) treatment, fair and equitable treatment (FET), and indirect expropriation, and including exceptions.
• Reforming investment dispute settlement: Options include (i) reforming the existing mechanism for investor-State dispute settlement (ISDS) while keeping its basic structure, or (ii) replacing existing ISDS arbitration systems, which could include (1) the creation of a standing international investment court, (2) State-State dispute settlement and/or (3) reliance on domestic judicial systems of the host State.
• Promoting and facilitating investment: Options include adding inward and outward investment promotion provisions (i.e. host and home country measures), and joint and regional investment promotion provisions, including an ombudsperson for investment facilitation.
• Ensuring responsible investment: Options include establishing provisions on investor responsibilities, such as clauses on compliance with domestic laws and on corporate social responsibility.
• Enhancing the systemic consistency of the international investment agreements (IIA) regime: Options include improving the coherence of the IIA regime, consolidating and streamlining the IIA network, managing the interaction between IIAs and other bodies of international law, and linking IIA reform to the domestic policy agenda.
Some of the reform options can be combined and tailored to meet several reform objectives. On the whole, policymakers need to find the right balance, meeting reform needs while maintaining the investment protection rationale of IIAs. Countries can use the action menu presented in WIR 2015 and define their own road maps for IIA reform: they can pick and choose, and adapt and adopt, various reform actions and options to formulate their own reform packages, in line with their national development strategies and specific circumstances.
At the same time, IIA reform is a global challenge; at the global level, there is therefore a need for a holistic approach to reforming the regime in a systematic and comprehensive manner. An effective support structure is important to achieve this. The outcome document of the Third International Conference on Financing for Development has entrusted UNCTAD to play a lead role to facilitate such a global endeavour. It calls upon UNCTAD to continue its work on investment agreements, including meetings and consultations with Member States.
Overall, IIA reform – at all levels – should be guided by the goals of harnessing IIAs for sustainable and inclusive growth, and determining the most effective means to safeguard the right to regulate while providing protection and facilitation of investment. Reform should focus on critical areas, include actions at all levels, take a systematic and sequential approach, ensure inclusiveness and transparency, and make use of multilateral support structures – such as the one provided by UNCTAD.
Source: UNCTAD.

ASEAN INVESTMENT REPORT 2015: Infrastructure Investment and Connectivity
40
and construction activities. Private participation in infrastructure should not be examined from FDI statistics alone but also from analysis of non-equity approaches to participation by the private sector (chapters 2 and 3).
• The investment environment in the region continues to improve with reforms and favourable investment measures announced or introduced by ASEAN Member States. At the international level, stakeholders show interest in addressing international investment governance issues (box 1.3).
• Recent surveys of companies found that an increasing number of MNEs have favourable perceptions of the region which have translated into investment. Many have investment plans that target the region in the next few years (AmCham-Singapore and US Chamber of Commerce 2014, 2015; EU-ASEAN Business Council 2015; JETRO 2015; KPMG 2015; Economist 2014). Some have already adopted an integrated regional business strategy, and others are planning to do the same in the post-AEC 2015 environment.
1.6. ASEAN: a rapidly growing South–South cooperation partner
ASEAN is both a major recipient and a source of FDI. The region is an important source of and partner in South–South cooperation. Outward FDI flows from the region to the world rose by 19% in 2014, to $80 billion – greater than the outward FDI flows of France and Spain combined, and 2.6 times greater than the outward FDI of the Republic of Korea. Companies from the region are expected to increase their internationalization in 2015 and beyond, including using more M&A strategies – hence strengthening further South-South partnerships.
Outward FDI flows from ASEAN have been growing steadily since 2012, when a significant outflow went to other developing economies, including in the region. The geographical reach of enterprise internationalization differs by Member State. On average, Singaporean and Malaysian companies are more internationalized, with a bigger global footprint than companies from the other Member States. Vietnamese companies continue to invest heavily in neighbouring countries (box 1.4). An increasing number of Indonesian, Philippine and Thai companies are investing regionally because of emerging investment opportunities and the AEC. Companies from Indonesia, Malaysia, the Philippines and Singapore invested abroad actively last year, while FDI from Thailand and Viet Nam declined.
The increasing financial strength of ASEAN MNEs – their strong profitability and cash holdings – are encouraging them to regionalize and internationalize (table 1.12). Emerging investment opportunities abroad are driving them to invest overseas. In some cases, limited markets or saturated growth, or land and labour constraints at home are key drivers (AIR 2013 and AIR 2014).
The top 100 ASEAN companies by market capitalization had combined cash holdings of $228 billion and combined assets of nearly $3 trillion in 2014. Most of them have operations in other ASEAN Member States. Some are subsidiaries of a group of companies, which have extensive regional presence and overseas investment outside the region.

Chapter 1: FDI development and corporate investment strategies
41
Company Country Industry
2014
Net income Total assets Market capitalization
Cash or near cash holding
Singapore Telecommunications Singapore Telecommunication 2,901 31,249 46,219 410DBS Group Holdings Singapore Banks 3,194 332,653 38,447 14,733Overseas-Chinese Banking Corp Singapore Banks 3,033 302,881 31,457 19,109United Overseas Bank Singapore Banks 2,565 231,551 29,678 26,484PTT Thailand Oil, gas and consumable fuels 1,718 54,062 28,120 6,199Bank Central Asia Indonesia Banks 1,391 44,443 26,034 4,710Malayan Banking Malaysia Banks 2,053 182,864 24,405 18,858Bank Rakyat Indonesia Indonesia Banks 2,045 64,518 23,121 5,935Advanced Info Service Thailand Telecommunication (wireless) 1,110 3,839 22,675 434Telekomunikasi Indonesia Indonesia Telecommunication 1,235 11,335 22,629 1,424Tenaga Nasional Malaysia Electric utilities 2,000 34,993 22,093 2,565Avago Technologies Singapore Semiconductors 263 10,491 21,936 1,604Bank Mandiri Indonesia Banks 1,676 68,788 20,227 5,746Public Bank Malaysia Banks 1,381 98,735 20,181 3,220Siam Commercial Bank Thailand Banks 1,642 82,033 18,771 1,282Sime Darby Malaysia Industrial conglomerates 1,034 15,871 18,271 ..Axiata Group Malaysia Telecommunication (wireless) 718 14,030 17,279 1,457Kasikornbank Thailand Banks 1,421 72,596 16,653 1,’764Siam Cement Thailand Construction materials 1,035 14,154 16,335 579Wilmar International Singapore Food products 1,156 43,558 15,642 3,127Maxis Malaysia Telecommunication (wireless) 525 5,172 14,685 437SM Investments Corp Philippines Industrial conglomerates 640 15,912 14,506 1,546Philippine Long Distance Tel Philippines Telecommunication (wireless) 768 9,752 14,030 596Digi.Com Malaysia Telecommunication (wireless) 621 1,229 13,700 150PTT Exploration & Production Thailand Oil, gas and consumable fuels 662 23,328 13,511 3,947CIMB Group Holdings Bhd Malaysia Banks 950 118,280 13,376 10,332Thai Beverage Thailand Beverages 668 5,226 13,079 68Petronas Gas Malaysia Gas utilities 563 3,787 12,523 182Petronas Chemicals Group Malaysia Chemicals 754 8,129 12,452 2,584Keppel Corp Singapore Industrial conglomerates 1,488 23,820 12,104 4,330Perusahaan Gas Negara Indonesia Gas utilities 723 6,215 11,719 1,216CP Thailand Food and staples retailing 313 9,918 11,601 980IHH Healthcare Malaysia Health care 231 8,179 11,258 704Bangkok Bank Thailand Banks 1,119 83,862 11,252 1,822SM Prime Holdings Philippines Real estate 414 8,691 10,999 788Ayala Land Philippines Real estate 333 8,693 10,689 641Capitaland Singapore Real estate 916 33,301 10,641 2,043Airports of Thailand Thailand Transportation infrastructure 379 4,741 10,525 216IOI Corp Malaysia Food products 1,040 4,777 10,396 ..JG Summit Holdings Philippines Industrial conglomerates 411 12,489 10,352 838Global Logistic Properties Singapore Real estate 685 13,947 10,025 1,446Genting Singapore Singapore Hotels, restaurants and leisure 501 9,566 9,870 2,791Singapore Airlines Singapore Airlines 286 17,995 9,786 3,826Krung Thai Bank Thailand Banks 1,022 83,238 9,640 2,269Ayala Corporation Philippines Diversified financial services 419 16,228 9,609 2,030Genting Malaysia Hotels, restaurants and leisure 553 20,932 9,419 4,681Gudang Garam Indonesia Tobacco 453 4,684 9,396 128MISC Malaysia Marine 674 11,876 9,204 1,382Bank Negara Indonesia Indonesia Banks 910 33,514 9,152 2,904Universal Robina Corp Philippines Food products 262 1,734 9,078 224BDO Unibank Philippines Banks 514 41,655 8,788 6,951Great Eastern Holdings Singapore Insurance 694 49,579 8,572 2,457
Table 1.12. Top 100 ASEAN companies have strong assets and significant cash holdings, 2014 (Millions of dollars)

ASEAN INVESTMENT REPORT 2015: Infrastructure Investment and Connectivity
42
Company Country Industry2014
Net income Total assets Market capitalization
Cash or near cash holding
Bank of the Philippine Islands Philippines Banks 406 32,414 8,262 5,598Bangkok Dusit Med Service Thailand Health care 228 2,833 8,096 109Singapore Tech Engineering Singapore Aerospace and defense 420 6,280 8,003 1,104Sapurakencana Petroleum Malaysia Energy equipment and services 343 7,948 7,856 345Hong Leong Bank Malaysia Banks 648 53,079 7,735 ..Semen Indonesia Indonesia Construction materials 469 2,761 7,731 397Intouch Holdings Thailand Telecommunication (wireless) 455 1,662 7,672 90Telekom Malaysia Malaysia Telecommunication 254 6,461 7,308 853Aboitiz Power Corp Philippines Independent power producers 376 4,845 7,056 900City Developments Singapore Real estate 608 14,872 7,050 2,817PTT Global Chemical Thailand Chemicals 463 12,299 7,021 469Dynasty Ceramic Thailand Building products 38 158 7,005 6Total Access Communication Thailand Telecommunication (wireless) 330 3,234 6,943 177Kalbe Farma Indonesia Pharmaceuticals 174 1,’000 6,901 153Kuala Lumpur Kepong Malaysia Food products 307 3,928 6,842 395AMMB Holdings Malaysia Banks 557 40,643 6,646 3,771Genting Malaysia Malaysia Hotels, restaurants and leisure 363 5,940 6,591 791Aboitiz Equity Ventures Philippines Industrial conglomerates 414 6,281 6,524 1,129Manila Electric Company Philippines Electric utilities 407 6,014 6,449 1,553Petrovietnam Gas Joint Stock Viet Nam Gas utilities 667 2,516 6,249 1,126Central Pattana Thailand Real estate 225 2,705 6,205 76Sembcorp Industries Singapore Industrial conglomerates 632 12,966 5,994 1,254Singapore Exchange Singapore Finance 254 1,316 5,963 ..Big C Supercenter Thailand Food and staples retailing 223 3,123 5,941 347RHB Capital Malaysia Banks 623 62,646 5,598 6,185Charoen Pokphand Thailand Food products 325 12,664 5,472 1,021Starhub Singapore Telecommunication (wireless) 292 1,500 5,412 199Singapore Press Holdings Singapore Media 322 5,326 5,371 355Capitaland Mall Trust Singapore Real estate investment trusts 489 7,442 5,332 853Siam Makro Thailand Food and staples retailing 150 1,327 5,287 139Hong Leong Financial Group Malaysia Banks 526 59,256 5,268 ..International Container Terminal Services Philippines Transportation infrastructure 182 3,401 5,235 194
YTL Corp Malaysia Multi-utilities 479 19,020 5,231 ..Sembcorp Marine Singapore Machinery 442 6,219 5,143 813Globe Telecom Philippines Telecommunication (wireless) 301 4,012 5,133 375Jollibee Foods Corp Philippines Hotels, restaurants and leisure 121 1,210 5,127 170Alliance Global Group Philippines Industrial conglomerates 298 9,156 5,114 1,835Metropolitan Bank & Trust Philippines Banks 453 35,864 5,092 5,594Charoen Pokphand Indonesia Indonesia Food products 147 1,678 4,987 71Petronas Dagangan Malaysia Oil, gas and consumable fuels 153 2,725 4,857 525PPB Group Malaysia Food products 280 5,313 4,842 194DMCI Holdings Philippines Industrial conglomerates 243 3,066 4,659 341Astro Malaysia Holdings Malaysia Media 141 2,121 4,564 372Vietnam Dairy Products Jsc Viet Nam Food products 286 1,205 4,467 71Golden Agri-Resources Singapore Food products 114 14,667 4,458 323Ascendas Real Estate Investment Trust Singapore Real estate investment trusts 383 5,848 4,317 30SIA Engineering Singapore Transportation infrastructure 211 1,357 4,291 44Comfortdelgro Corp Singapore Road and rail 224 3,949 4,199 623Total 70,553 2,928,468 1,131,906 228,137
Source: UNCTAD 2015b, based on Bloomberg.
Table 1.12. Top 100 ASEAN companies have strong assets and significant cash holdings, 2014 (Millions of dollars) (concluded)

Chapter 1: FDI development and corporate investment strategies
43
The strong cash reserves of these 100 top ASEAN companies are more than the combined global FDI made by companies from France, Germany, Italy and the Netherlands in 2014. These cash reserves are also greater than the combined 2014 GDP of Cambodia, Lao PDR and Viet Nam. These companies and their cash reserves are potential sources of investment for other developing economies. They operate in different sectors, in particular in agriculture, extractive, manufacturing, and services industries. Many of these companies aspire to be strong regional or international players in their industries.
In particular, ASEAN engineering, construction and infrastructure companies have contributed to strengthening South–South cooperation through the development of infrastructure in other developing economies (chapter 2 and section 1.3). For instance, Malaysian companies such as UEM, Bina Puri, Gamuda, MTD Construction, HG Power Transmission, Scomi, IJM, Mudajaya, Ho Hup Construction, Ranhill and WCT have been building infrastructure projects in ASEAN and further afield (table 1.13).
Other ASEAN companies have been active in developing and operating infrastructure assets in many developing economies, including those in the region. They include companies in the following Member States:
Box 1.4. Outflows of FDI from Viet Nam
Licensed Vietnamese investments abroad in 2014 registered by the Ministry of Planning and Investment exceeded $1.78 billion, involving some 109 newly licensed projects worth more than $1 billion and 22 expansion projects.a These investments were made in 28 countries and territories; Tanzania, the leading destination, accounted for 34% of Viet Nam’s total overseas registered investment capital last year. Cambodia came second with a 31% share, followed by Burundi at 16%. However, in terms of projects, Cambodia was the largest destination, with 23 projects or 21% of all of Viet Nam’s overseas investment projects. Singapore came second with 16 projects, followed by Lao PDR (13) and the United States (12). As of the end of 2014, Vietnamese companies had invested about $20 billion, most of it concentrated in the oil and gas industries, followed by the agriculture and forestry, hydroelectric, ICT and finance industries.
Vietnamese companies that announced major investments included Viettel, with a combined $525 million investment in two major telecommunication network projects in Tanzania and Burundi in 2014. An Dong Mia made an $80 million investment in a rubber plantation project in Cambodia. Hoang Anh Gia Lai Group announced plans to jointly operate a luxury hotel with Melia Hotels (Spain) in Myanmar in 2015 and also handed over the completed $36 million Attapeu International Airport to the Government of Lao PDR. It has started operation of the $550 million HAGL Centre in Myanmar. The Bank for the Investment and Development of Vietnam and Viettel received approval from Myanmar in 2015 to operate in that host country. The Vietnam Rubber Group opened a rubber latex processing plant in 2015 in Cambodia.
Source: UNCTAD.a Viet Nam News, “International investments top $1.7 billion in 2014”, 13 February 2015 (http://
vietnamnews.vn/economy/266508/intl-investments-top-17b-in-2014.html).

ASEAN INVESTMENT REPORT 2015: Infrastructure Investment and Connectivity
44
Table 1.13. Malaysian companies built a variety of infrastructure in developing economies and elsewhere in 2013−2015 (Selected cases)
Company Types of projects Location
Contract value
($ million)Year of
completion
ASEAN Member States
Trans Resources Corp Modernization of airport terminal Brunei Darussalam 98 2014
Bina Puri Building construction Brunei Darussalam 4 2014
MTD Construction Toll road Indonesia 371 2015
Johawaki Construction of road and toll road Indonesia 428 2014
UEM Builders Toll road Indonesia 641 2015
Bina Puri Mini hydropower plant Indonesia 10 2015
Salcon Engineering Others Lao PDR 1 2013
Eastern Soldar Engineering & Construction Tankage work - construction and commissioning Singapore 16 2014
Salcon Engineering Construction of reservior Thailand 7 2014
Prinsiptek Building and residential development Thailand 14 2015
Bina Puri Building construction Thailand 25 2014
Salcon Engineering Water treatment Viet Nam 22 2013
Gamuda Transmission line, mechanical and electrical activities Viet Nam 146 2013
Ireka Engineering & Construction Hospital builidng Viet Nam 26 2013
Other developing economies
Malaysian Maritime & Dredging Dredging and bank protection, jetty facilities Bangladesh 27 2013
HG Power Transmission Transmission line Bangladesh 5 2014
HG Power Transmission Transmission line Bangladesh 23 2015
Scomi Rail Monorial system Brazil 621 2014
Scomi Rail Monorial system Brazil 652 2015
MTD Highway construction China 429 2014
Mersing Construction & Engineering Sewage conveyance system Hong Kong, China 14 2014
Mersing Construction & Engineering Water system Hong Kong, China 26 2015
IJM Road and highway construction - Andhra Pradesh India 24 2014
Salcon Engineering Water treatment India 5 2013
IJM Road construction - Mahua-Jaipur Section India 6 2015
IJM Road construction - Mahua-Jaipur Section India 9 2014
UEM Builders Building construction India 13 2014
UEM Builders Road works India 50 2013
Mudajaya Power plant (Equipment procurement) India 588 2013
Ho Hup Construction Road construction Iraq 20 2015
Ho Hup Construction Water system project Iraq 88 2015
Steelworks Engineering Sectional steel water tank Kenya .. 2013
Ranhill Residential development Libya 143 2013
WCT Expressway Oman .. 2015
WCT Road and building developmenta Qatar 334 2015
Bina Puri Water system and pipeline Saudi Arabia 8 2013
Salcon Engineering Water supply system Sri Lanka 18 2015
MTD Sewage tunnel United Arab Emirates 19 2013
Source: CIDB Malaysia.a Refers to the year the project was awarded.

Chapter 1: FDI development and corporate investment strategies
45
• Indonesia: Waskita Karya, Wijaya Karya and Semen Indonesia• Philippines: International Container Terminal, San Miguel, Ayala and Manila Water• Singapore: Sembcorp, Keppel Corporation, City Development, CapitaLand and
Changi Airports International• Thailand: ITD, EGCO, Ratchaburi, Banpu, Amata, Siam Cement and EGATi• Viet Nam: Viettel, EVN and VLP
ASEAN banks such as CIMB, Maybank, DBS, Bangkok Bank, OUB, DBS and Kasikorn Bank have also played a role in South–South infrastructure development by providing finance for projects based in other developing economies (chapter 2).
The internationalization of ASEAN companies through cross-border M&As has been on a steady rise, with most transactions concentrated in developing Asia. ASEAN companies have also been active in using M&As in their internationalization processes, indicating their growing financial prowess and abilities to acquire strategic assets abroad. Global cross-border M&A purchases by ASEAN companies have been rising consistently since 2009. ASEAN companies acquired more assets abroad than cross-border M&A sales witnessed in the region in 2014. As in 2013, most cross-border M&A purchases by ASEAN companies were made in developing Asian economies (table 1.14).
The infrastructure, finance and hospitality industries were the focus of M&A purchases by ASEAN companies in 2014 (table 1.15). Some of the cross-border M&A deals made by ASEAN companies exceeded $1 billion. These mega deals were dominated by Singapore companies, which made two such deals in Hong Kong (China) that averaged more than $5 billion each. Sovereign wealth funds based in the region and Government-linked companies were also active in cross-border M&As. For instance, Temasek (Singapore) acquired a 25% share in Watson Holdings (Hong Kong, China) for $5.7 billion and three oil blocks in the United Republic of Tanzania for $1.3 billion. Petronas (Malaysia) acquired Talisman Energy-Montney Assets (Canada) for $1.4 billion. GIC (Singapore) acquired an 11% stake in Emperador (Philippines) for $391 million. Malaysia Airports Holdings acquired the final 40% share of Sabiha Gokcen Uluslararasi Havaalani (Turkey) that it did not yet own, for $290 million, and Singapore Telecommunication acquired Adconion Media (United States) for $255 million.
Other private companies from Singapore, Malaysia, Thailand, Indonesia and the Philippines also made significant M&As abroad in various industries (annex table 1.3). OCBC (Singapore) bought 97.8% of Wing Hang Bank (Hong Kong, China) for $4.8 billion. St James Holdings (Singapore) bought Perennial Real Estate Holdings (China) for $2.8 billion; RGE (Indonesia) acquired Sateri Holdings Ltd-Viscose fiber assets (China) for $863 million; and JG Summit Holdings (Philippines) purchased NZ Snack Food Holdings (New Zealand) for $608 million.
ASEAN companies made 35 deals exceeding $250 million in 2014 as compared with only 21 in 201328 (annex table 1.3). These numbers provide further evidence of the growing financial strengths of ASEAN companies that support acquisition of assets abroad.

ASEAN INVESTMENT REPORT 2015: Infrastructure Investment and Connectivity
46
Table 1.14. Cross-border M&A acquisitions by ASEAN companies globally rose by 5% to $43.1 billion in 2014 (Millions of dollars)
Target nation 2010 2011 2012 2013 2014World 26,117 31,990 31,357 41,112 43,109
Developed economies 9,749 16,249 16,752 6,061 14,800European Union 2,937 3,962 5,970 1,769 3,385
Germany 95 39 190 .. 516United Kingdom 238 3,446 5,225 1,337 2,230
North America 906 8,807 6,786 2,075 4,186Canada 609 3,481 5,430 183 1,433United States 297 5,326 1,356 1,892 2,753
Other developed countries 5,374 3,070 3,787 2,014 7,181Australia 5,017 2,738 3,033 1,491 3,779Japan 282 225 724 523 2,599
Developing economies 16,368 15,741 14,604 35,048 28,309United Republic of Tanzania .. .. 18 .. 1,293Brazil 2,250 .. 66 .. 1,285China 1,413 2,386 1,594 10,544 5,299Hong Kong, China 2,733 3,156 3,402 976 10,934ASEAN 9,237 9,646 8,460 20,339 7,436Cambodia 5 .. 101 166 40Indonesia 2,461 2,222 1,493 2,705 2,508Malaysia 1,300 792 1,402 3,249 1,463Philippines 45 418 425 94 455Singapore 5,077 5,803 4,196 7,748 1,594Thailand 192 362 457 6,232 1,363Viet Nam 158 49 387 146 12
Source: UNCTAD, UNCTAD M&A Database (accessed 1 July 2015).
Note: gross basis.
Table 1.15. Cross-border M&As by ASEAN companies were concentrated in finance, services, infrastructure and extractive industries in 2014 (Millions of dollars)
Industry 2010 2011 2012 2013 2014
Total 26,117 31,990 31,357 41,112 43,109
Primary 3,238 3,219 7,620 3,327 2,933
Mining and quarrying 3,225 1,888 6,780 3,218 2,818
Manufacturing 4,420 7,404 10,900 8,299 4,058
Food, beverages and tobacco 3,664 533 5,879 7,686 2,578
Manufacture of paper and paper products 142 7 2 88 864
Manufacture of computer, electronic, optical products and electrical equipment 20 461 216 32 339
Services 18,459 21,366 12,836 29,486 36,118
Electricity, gas, water and waste management 323 490 818 271 882
Construction 86 - 28 21 166
Trade 595 633 740 6,144 630
Accommodation and food service activities 620 255 218 37 4,012
Transportation and storage 248 513 272 559 1,870
Information and communication 355 277 1,353 597 1,001
Financial and insurance activities 8,649 16,870 6,257 14,955 14,409
Business activities 3,207 1,981 1,469 2,512 3,827
Public administration and defence; compulsory social security 4,282 344 1,680 4,172 9,274
Source: UNCTAD, UNCTAD M&A Database (accessed 15 July 2015).
Note: gross basis.

Chapter 1: FDI development and corporate investment strategies
47
1.7. Conclusion
The year 2014 saw a new record level of FDI inflows to ASEAN and witnessed further corporate investment expansions, with many companies keen to establish a stronger regional footprint. The AEC, the broader ASEAN regional connectivity and the growing competitiveness of economies in the region were key influencing factors. Many existing and potential investors look forward to the arrival of the AEC later in the year; many have expressed plans to expand their operations in the region in post-AEC 2015. In addition, given the strong economic fundamentals, resilient economies and growing affluence of consumers in the region, the prospect for ASEAN to attract higher levels of FDI flows in the next few years – surpassing the level of last year – is promising. An integrating ASEAN is increasingly influencing how MNEs invest, plan, network and operate in the region.
A consequence of the growing FDI and corporate expansion is that regional production networks (RPNs) and regional value chains (RVCs) are expected to further intensify as more foreign and ASEAN companies position themselves to operate in different Member States. Companies do so partly because of their corporate strategies, which include gaining access to resources, markets and inputs and increasing operation efficiency by tapping the complementary locational advantages offered in the region. Lower transaction costs contributed by regional integration also play a role. By year end 2015, 96% of all tariff lines in ASEAN will have zero rates for intra-ASEAN imports – supporting further intraregional trade and production networks. Final goods or intermediate products manufactured in one Member State can be exported to another Member State without tariff burdens. Put differently, companies are producing as if they were within a single-country model of operation but across a number of Member States connected through RVCs. Regional corporate expansion is another important source of ASEAN connectivity contributed by intra- and inter-company linkages involving the facilities of MNEs and ASEAN companies located in different parts of the region.
MNEs will continue to expand their presence in the region. The growth of intra-ASEAN investment and the regionalization of more ASEAN companies will remain a key feature of the future investment landscape. ASEAN companies are also taking advantage of investment and business opportunities offered further afield. Outward FDI flows from the region have been increasing steadily since 2012. ASEAN companies are playing an important role in strengthening South–South cooperation as most of their investments are within the region and to other developing economies. Their strong cash reserves and their aspirations to be regional players and to internationalize will continue to drive them to invest abroad, including through greater use of M&A strategies to access markets.
The increase in manufacturing FDI in the CLMV countries and the relocation of labour-intensive operations to these locations, as well as in other Member States, is contributing to regional connectivity. Production from these locations is being supplied to affiliates or customers based in the other ASEAN Member States. This connectivity is contributing

ASEAN INVESTMENT REPORT 2015: Infrastructure Investment and Connectivity
48
to the development of supporting industries and the regional division of labour. The rise in regional economic activities involving MNEs and ASEAN companies is helping bridge the development divide through investment and production, especially between the CLMV countries and the other Member States.
Notes
1 Aside from ASEAN as a region, they include Japan, the United States, Hong Kong (China), the United Kingdom, China, Luxembourg, the Netherlands, Australia and the Republic of Korea.
2 Covers through the first half of 2015.3 Phnom Penh Post, “Plans to turn Poipet into automotive parts manufacturing hub”, 20 June
2015 (http://www.phnompenhpost.com/post-weekend/plans-turn-poipet-automotive-parts-manufacturing-hub).
4 Xinhua, “6th China-built hydropower dam in Cambodia starts operation”, 14 August 2014 (http://en.people.cn/n/2014/0814/c90777-8769756.html).
5 Nex Telecom Asia, “Seatel Cambodia to invest $500 million to launch 4G services”, 11 February 2015 (http://nextelecomasia.com/2g-3g-4g/seatel-cambodia-to-invest-500-million-to-launch-4g-services/).
6 Investvine, “Thai, Japanese Firms To Build Car Plants In Myanmar”, 7 May 2014 (http://investvine.com/thai-japanese-firms-to-build-car-plants-in-myanmar/).
7 Investvine, “Colgate-Palmolive To Open Factory In Myanmar”, 25 June 2015 (http://investvine.com/colgate-palmolive-to-open-factory-in-myanmar/).
8 Bloomberg, “Coca-Cola to Suzuki Myanmar Factory Rush Spurs Shipping”, 27 March 2014 (http://www.bloomberg.com/news/articles/2014-03-27/coca-cola-to-suzuki-myanmar-factory-rush-spurs-shipping).
9 Investvine, “Carlsberg Begins Brewing Beer In Myanmar”,11 May 2015 (http://investvine.com/carlsberg-begins-brewing-beer-in-myanmar/).
10 Consult-Myanmar, “Japan gets 3 out of 9 foreign banking licenses in Myanmar”, 9 October 2014 (http://consult-myanmar.com/2014/10/09/japan-gets-3-out-of-9-foreign-banking-licenses-in-myanmar/).
11 Oxford Business, “The Report: Myanmar 2015”, 2015.12 Reuters, “Samsung Electronics to build a $3 billion smartphone plant in Vietnam”, 10
November 2014 (http://www.reuters.com/article/2014/11/10/us-samsung-elec-vietnam-idUSKCN0IU03R20141110); Business Korea, “South Korea to invest US$7.3 billion in Vietnam this year”, 29 December 2014 (http://businesskorea.co.kr/article/8265/largest-vietnam-investor-south-korea-invest-us73-billion-vietnam-year).
13 Business Korea , “50% of Samsung Mobile Phones Made in Korea”, 28 January 2015 (http://www.businesskorea.co.kr/article/8785/samsung-made-vietnam-50-samsung-mobile-phones-made-vietnam).
14 FT.com, “Vietnam opens door to hard money and soft power”, 1 March 2015 (http://www.ft.com/intl/cms/s/0/004f7e36-bc0e-11e4-a6d7-00144feab7de.html#axzz3ddlkspYZ).

Chapter 1: FDI development and corporate investment strategies
49
15 Vietnamnet, “Korean Lotte group expands investment in Vietnam”, 4 April 2015 (http://www.vietnambreakingnews.com/2015/04/korean-lotte-group-expands-investment-in-vietnam/).
16 Investvine, “Thailand’s Amata invests in Vietnam industrial park”, 22 August 2014 (http://investvine.com/thailands-amata-invests-in-vietnam-industrial-park/).
17 Wall Street Journal, “Falling sales threaten Thailand’s car-making supremacy in Southeast Asia”, 24 March 2015 (http://www.wsj.com/articles/falling-sales-threaten-thailands-car-making-supremacy-in-southeast-asia-1427217924; and TIR, “Eco-car projects to spur demand for Thai automotive parts and components”, Vol. 25, January 2015.
(http://www.boi.go.th/tir/issue_content.php?issueid=119;page=42).18 ‘Indonesia pushes Central Java as Asian low-cost manufacturing hub’ Investvine, 6 August 2014
(http://investvine.com/indonesia-pushes-central-java-as-asian-low-cost-manufacturing-hub/).19 Up to the first half of 2015.20 http://www.mmtimes.com/index.php/business/technology/14357-newcomer-to-build-500-
ooredoo-towers.html21 Investvine, “Volkswagen to build factory in Indonesia”, 10 September 2014 (http://investvine.
com/volkswagen-to-open-new-plant-in-indonesia/).22 Up to the first half of 2015.23 Bangkok Post, “Toa expands to Cambodia, Indonesia”, 28 April 2015 (http://www.bangkokpost.
com/business/news/544331/toa-expands-to-cambodia-indonesia).24 http://www.vietnambreakingnews.com/tag/hanoi-commercial-joint-stock-bank/25 http://asia.nikkei.com/Business/AC/Vietnam-s-No.-1-dairy-company-eyes-global-rank26 On gross basis.27 Covers up to the first half of 2015.28 On gross basis.


Chapter 2: Infrastructure investment and private sector players in ASEAN
51
PART TWO
INFRASTRuCTuRE INVESTMENT AND CONNECTIVITy IN ASEAN


Chapter 2: Infrastructure investment and private sector players in ASEAN
53
ChAPTER 2
INFRASTRuCTuRE INVESTMENT AND PRIVATE SECTOR PLAyERS IN ASEAN
2.1. Introduction
The importance of infrastructure to ASEAN Member States cannot be emphasized enough. Member States in the region have been investing in infrastructure with varying degrees of spending and development. However, more infrastructure investment is needed across a wide range of economic, social and environmental sectors if ASEAN Member States are to achieve the objectives of their economic plans, including those related to national and regional connectivity (chapter 4). The private sector, domestic and foreign, has been a significant player in the region’s infrastructure development. The roles of banks, other financial institutions and donors of official development assistance (ODA) have also been significant. In various infrastructure sectors, the presence of foreign multinational enterprises (MNEs) is highly visible.
Investing in infrastructure to meet rapid growth in demand has been a challenge for most ASEAN Member States. Some need to invest more to overcome years of under investment, while others need to invest to expand, upgrade or rehabilitate existing facilities. Finding resources, mobilizing and channeling them to suitable projects, including involving different players to deliver the infrastructure needed, are crucial steps. Although the private sector cannot replace the State, it needs to play a larger role to help address the infrastructure gap.
ASEAN Member States have taken steps to liberalize their infrastructure industries, with some sectors more deregulated than others and some Member States more open than others. Some countries have also privatized infrastructure assets, such as those in telecommunication and power generation. There has been an increasing trend of the private sector owning public assets. More pro-private sector policy initiatives, including public-private partnership (PPP) arrangements, have been introduced to encourage private sector participation in the region.
There are many different aspects and types of players in infrastructure development. Contractual arrangements are distinguishing features of the infrastructure industry, and ASEAN is no exception. This report examines investment in three key physical infrastructure sectors, namely power, transport, and information and communication technology, or ICT. Each of these sectors has key features and characteristics that need to be appreciated (WIR 2008). The report does not examine corporate governance issues and the complex financing aspects of infrastructure. It is also not in the scope of this report to address the different implications of infrastructure but to recognize that although infrastructure can have less desirable impacts (e.g. land issues and ecosystem concerns), it
53

ASEAN INVESTMENT REPORT 2015: Infrastructure Investment and Connectivity
54
can also bring favourable economic, social and environmental consequences. Stakeholders need to address these potential implications in a balanced manner, taking into account the need to protect vulnerable segments of society and the need for development.
This chapter analyses both investment and the different categories of foreign private sector players in infrastructure development in ASEAN. The chapter further highlights the importance of infrastructure to the Member States and the huge scale of future investment needs in the region.
2.2. The importance of infrastructure to ASEAN
Infrastructure plays an important role in the region’s economic, social, environmental and connectivity development. It is the backbone of the economy of all the ASEAN Member States and is a key driver for realising the ASEAN Economic Community. Countries in the region continue to develop infrastructure to provide reliable services to households, businesses and industries. They recognize the importance of infrastructure for alleviating poverty and supporting development. Each ASEAN Member State has significant infrastructure development plans; the challenge is to implement these plans in the period earmarked and to attract private sector participation.
The importance of infrastructure for supporting economic growth, increasing competitiveness, improving quality of life and ensuring universal access for all cannot be emphasized enough (WIR 2014). Evidence indicates that the provision of adequate infrastructure in services such as electricity, telecommunication and transportation can help boost GDP (box 2.1) and connect each Member State nationally and regionally as well as internationally (through land transport, ports and airports). Greater connectivity of transport infrastructure enhances logistical efficiency and supports the growth of trade, commerce and investment.
The lack of adequate infrastructure has held back the economic development of some Member States, such as Cambodia, Lao PDR, Myanmar and Indonesia. With adequate infrastructure, it is estimated that Indonesia’s GDP could grow at a rate between 7% and 9% annually, instead of the current rate of 6% to 6.5%.1 The overcrowded ports and the poor connectivity between the country’s islands have led to high logistics costs of about 24% of GDP, as compared with only 16% in Thailand.2 If logistics costs could be brought down to 16% of GDP with improvements in marine logistics and national transport infrastructure connectivity, Indonesian businesses, government and households could save about $70 billion to $80 billion a year in logistics costs.
A study found that better infrastructure can have positive impacts on income and poverty levels in the countries in the Greater Mekong Subregion. These countries are likely to experience an increase in GDP between 1.1% and 8.3%, with the highest increases in Cambodia, Lao PDR, Myanmar, Viet Nam and Thailand (Stone et al. 2012). A lack of infrastructure increases economic costs. A study estimated that congestion in metropolitan Manila would lead to some $54 million in economic costs per day, and about $23 million in

Chapter 2: Infrastructure investment and private sector players in ASEAN
55
the Bulacan, Cavite, Laguna and Rizal areas. This amounts to $27.2 billion per year lost due to congestion, equivalent to 11% of the country’s GDP.3
In Lao PDR, investment and development in power plants over the years have expanded the supply of electricity to reach more homes. Access to electricity by household has increased from only 16% in 1995 to more than 70% today.4 Many of the power plants built and owned by foreign investors in Lao PDR export electricity to neighbouring countries. Investment in infrastructure can also generate additional employment in a country. An increase of infrastructure investment equivalent to 1% of GDP could generate an additional 700,000 jobs in Indonesia (McKinsey Global Institute 2013).
Box 2.1. The importance of infrastructure investment: experiences of other regions and countries
If the infrastructure gap in Latin America is addressed so as to reduce the gap to the level in middle-income countries in other regions, it is estimated that economic growth in the region could be raised by two percentage points annually, on average (Calderon and Servén 2010).
Weak infrastructure reduces the productivity of African companies by 40% and the growth of per capita income by 2% (UNCTAD 2014a). High transportation costs are a major impediment to African countries attempting to penetrate global markets competitively and inhibit African countries from trading with each other (African Development Bank (AfDB) 2010; Naudé and Matthee 2007). A study estimated that if the road connections between the Central African Republic and the Democratic Republic of the Congo were upgraded, regional trade could increase by $10 billion to $30 billion per year (Buys et al. 2006).
A study assessing the impact of mobile telephony on economic growth involving 96 developed and developing economies found that (i) for a given level of total mobile penetration, a 10% substitution from 2G to 3G penetration increases GDP per capita growth by 0.15 percentage points; (ii) a doubling of mobile data use leads to an increase in the GDP per capita growth rate of 0.5 percentage points; and (iii) a 10% increase in mobile penetration increases Total Factor Productivity in the long run by 4.2 percentage points (Deloitte LLP 2012).
Another study suggests that an increase in infrastructure investment equivalent to 1% of GDP would generate an additional 3.4 million direct and indirect jobs in India and 1.3 million in Brazil (McKinsey Global Institute 2013).
2.2.1. Electricity
Infrastructure development in electricity has helped expand utilities’ capacity to serve more households and industries. It has also intensified grid connectivity between different parts of countries and among Member States, including remote areas and industrial estates where national electricity grids formerly could not reach. For instance, both grid connections and power trade arrangements between ASEAN Member States are increasing (chapter 4). More than 90% of the electricity generated at the Nam Theun 2 hydropower plant in Lao PDR is exported to Thailand, and this plant alone is expected to expand the electricity-generating capacity of the country by

ASEAN INVESTMENT REPORT 2015: Infrastructure Investment and Connectivity
56
150% and bring in $2 billion in export revenue for the government throughout the 25-year concession period.5 This revenue may be used for other development needs, including in social sectors. The power sector is an important export revenue source for Lao PDR. About 85% of power generation in the country is exported to neighbouring countries. By 2020, the power sector alone is expected to contribute some 16% to the country’s GDP.6
The construction of the Mong Duong II coal-fired thermal plant in Viet Nam involved 6,000 construction jobs and is expected to be completed in 2015; it will serve more than 2 million households. The Song Hau I power plant in Viet Nam, also to be completed in 2015, will ease power shortages in the southern part of the country. The Burgos wind farm in the Philippines, completed in 2014, is expected to serve more than 2 million households and offset 200,000 tonnes of carbon dioxide emissions per year. An undersea cable in Indonesia will help bring electricity from resource-rich Sumatra to electricity-hungry Java. Without investment in more power plants, grid connections and transmission lines, many areas of countries in the region would remain dark and would face challenges in bringing industrial parks to rural areas. To this end, investment in electricity infrastructure ensures reliability of power supply, supports rural development and alleviates poverty by bringing investment and employment to rural areas.
ASEAN Member States, as a group, had an electrification rate of at least 78.5%7 in 2012 (table 2.1). By 2020, the region is expected to achieve nearly 90% electrification, with six Member States achieving universal access. However, the provision of reliable and affordable electricity is uneven. By 2030, the region will have or be near to achieving universal access for all, if the current plans of four Member States are fulfilled. To reach this universal access target, countries in the region need to continue to invest to expand installed capacity and to improve transmission and distribution infrastructure, including the interconnection of countries through regional power grids. Equally important are maintaining and upgrading electricity infrastructure.
2.2.2. Telecommunication
The telecommunication penetration rates in some ASEAN Member States are among the highest in the developing countries, and the industry has attracted significant interest and participation from the private sector, which has contributed to the rapid growth of the industry in the region (box 2.2).
2012 2020 2030b
ASEAN 78.5 88.1 97.0
Brunei Darussalam 100 100 100
Cambodia 34 54 70
Indonesia 76 97 100
Lao PDR 78 90 100
Malaysia 100 100 100
Myanmar 32 47 100
Philippines 70 90a 100
Singapore 100 100 100
Thailand 99 100 100
Viet Nam 96 100 100
Sources: UNCTAD, based on World Energy Outlook 2014, national and other sources.
a Based on 2017 indicative rate. b Except for Lao PDR the numbers are based on national plans.
Table 2.1.
More people are gaining accessed to electricity in ASEAN, with universal access a common feature by 2030 Electrification Rate (% of population)

Chapter 2: Infrastructure investment and private sector players in ASEAN
57
Box 2.2. Rapid growth of ICT in ASEAN
The telecommunications sector in ASEAN grew rapidly in the last decade, particularly in access to mobile voice and data networks. The number of mobile subscriptions increased almost five times between 2005 and 2014 (box figure 2.2.1, left). Except for Lao PDR and Myanmar, all the Member States now have more mobile phone subscriptions than people (box figure 2.2.1, right).
Box figure 2.2.1. Increasing ASEAN mobile subscriptions
Source: UNCTAD, based on information adapted from regulatory authorities and operator reports.
Today, mobile broadband far exceeds fixed broadband in subscriptions: in 2014, mobile broadband penetration in ASEAN reached 43% of the population compared with only 3% for wired broadband. Telecommunication service revenues have increased in parallel with the growth in access. The ASEAN telecommunication service market was estimated to be worth $64 billion in 2014, more than double what it was a decade previously (box figure 2.2.2, left). Indonesia is the region’s largest market while Singapore, Thailand, Malaysia and Viet Nam have similar market sizes at 16%–17% of the region’s total (box figure 2.2.2, right).
Data traffic is growing rapidly throughout the region, coupled with the increase in smartphone ownership. Monthly mobile data traffic per smartphone in ASEAN and Oceania was 1.2 GB in 2014 and is forecast to more than triple to 4 GB by 2020 (Ericsson 2015). In order to accommodate this growth in data use, international Internet bandwidth is increasing (box figure 2.2.3). Some ASEAN operators are forging partnerships with large content providers to store their data locally (e.g. caching) in order to increase performance and reduce demand for international bandwidth. Neutral Internet Exchange Points, by which domestic and regional traffic could be freely exchanged, would reduce demand for international bandwidth. However, for the most part, they have not been as successful in ASEAN as other regions. One reason is that incumbent operators want to protect their international transit business (Internet Society 2015).
0
20
40
60
80
100
120
140
-
100
200
300
400
500
600
700
800
2005 2007 2009 2011 2013
Subscriptions (millions) Penetration
45 114 97
Mobile, 2014
2634
47
66
78
90
102
110116 115
146192
268
377449
529610
664712 711
Subscriptions (millions) Penetration
0.5 20 270 5 15 8 136
113
134
107
67
149
29
115
148141
150
Brune
i
Darus
salam
Lao
People
’s
Democ
ratic
Rep
ublic
Cambod
ia
Indon
esia
Mala
ysia
Mya
nmar
Philippine
s
Singap
ore
Thail
and
Viet N
am

ASEAN INVESTMENT REPORT 2015: Infrastructure Investment and Connectivity
58
Box figure 2.2.2. Rising ASEAN telecommunication service revenue
Source: UNCTAD, based on information adapted from operator reports and Infocomm Development Authority of Singapore.
Note: Converted to dollars at annual average exchange rates.
Box figure 2.2.3. Growing international Internet bandwidth in ASEAN
Source: UNCTAD, based on information adapted from regulatory authorities.
Investment in telecommunication infrastructure has enabled more efficient telephony services and increased the degree of penetration, with more people able to use telecommunication service even in remote areas. This development has contributed to national and global connectivity, enhancing communication and ICT connections, and bringing remote areas into the modern information age.
Many people are benefitting from improvements in the telecommunication infrastructure in the CLMV countries (Cambodia, Lao PDR, Myanmar and Viet Nam) as well as in the
31
2832
3943 45
56 5660
64 63
0
10
20
30
40
50
60
70
2005 2006 2007 2008 2009 2010 2011 2012 2013 2014
ASEAN telecommunication service revenue ($ billion) Distribution of telecommunication service revenue, 2014
Indonesia23%
Thailand17%
Singapore17%
Malaysia16%
Viet Nam16%
Philippines9%
Other2%
Cambodia1%
Lao PDR1%
Myanmar0.4%
Brunei Darussalam0.3%
Box 2.2. Rapid growth of ICT in ASEAN (concluded)
BITs per person, 2014
509 909
32 269
18 058
11 984
11 022
8 043
2 087
1 911
953
753
Singapore
Malaysia
Thailand
ASEAN
Philippines
Viet Nam
Indonesia
Cambodia
Lao PDR
Myanmar
2 142 3 093
4 737
7 430
82 90 373 846 1 217
2 018
3 588
5 119
7 740
11 984
2005 2006 2007 2008 2009 2010 2011 2012 2013 2014
Gbps Bits per person
8 000
7 000
6 000
5 000
4 000
3 000
2 000
1 000
-
14 000
12 000
10 000
8 000
6 000
4 000
2 000
-45 51 211 485
7051 185

Chapter 2: Infrastructure investment and private sector players in ASEAN
59
other ASEAN Member States. In the Philippines, the liberalization of the telecommunication sector and regulatory reforms have contributed to the entry of new players, which has resulted in rapid growth of the network, increase in foreign investment, access to technology, improvement in ICT efficiency and the emergence of new services. The Government’s efforts to reach the underserved and unserved areas have made good progress. In 2014, 111% of the population are mobile phone users and 37% used the Internet, compared with only 89% and 25%, respectively in 2010.8
The improvement of the ICT infrastructure has important economic implications for the Member States (box 2.3). It has helped expand connectivity and access to technology, which was once limited to those who could buy equipment and facilities at exorbitant prices.
Box 2.3. The importance of ICT
The rise in telecommunication access has seen a corresponding increase in the size of the communications sector in most ASEAN Member States for which data are available. The value added of the telecommunication sector has grown over the last decade in ASEAN, although its contribution to overall GDP has varied (box figure 2.3.1, left). In Indonesia, the communication sector has outpaced GDP growth and its contribution has risen to 6.8% of the economy in 2013, the highest in ASEAN (box figure 2.3.1, right). This is a 4.2 percentage point increase since 2005. The contribution in the Philippines was 0.1 percentage point lower in 2013 than it was in 2005, even though communications value added has grown 90% over that period in constant prices. In terms of its direct economic impact, growth in the communications sector contributed between 3% and 14% of GDP growth in 2013, among countries for which data are available.
Box figure 2.3.1. Rising communications value added in ASEAN
Source: UNCTAD, based on information adapted from national statistics agencies.Note: Communications refers to telecommunication and posts. Data for Viet Nam refer to Information and
communication, which includes telecommunication, broadcasting, publishing and computer and information services.
The impacts of telecommunication are wider than its direct contribution. Telecommunication infrastructure is essential for enabling the service economy, supporting e-commerce and driving the software industry. Broadband access, in particular, is a critical general-purpose technology
31
Communications value added(% of GDP, 2013)
2005 2006 2007 2008 2009 2010 2011 2012 2013
Communications value added (% GDP), constant prices
Indonesia Malaysia Philippines Thailand
8.0
7.0
6.0
5.0
4.0
3.0
2.0
1.0
0 0.8
1.5
3.6
4.1
4.2
4.7
6.8
Viet Nam
BruneiDarussalam
Thailand
Malaysia
Singapore
Philippines
Indonesia

ASEAN INVESTMENT REPORT 2015: Infrastructure Investment and Connectivity
60
Box 2.3. The importance of ICT (continued)
essential for growth and competitiveness. A number of studies have attempted to measure the link between broadband access and economic growth. Though the methodologies differ, they generally find that increases in fixed broadband access contribute to an increase in GDP. However the evidence is mixed, particularly where penetration levels have not reached a particular threshold (e.g., fixed broadband greater than 10%). In many ASEAN Member States, fixed broadband penetration is considerably below this level (box figure 2.3.2, right) and Internet users make up less than half the population (box figure 2.3.2, left). This points to the need to increase Internet and fixed broadband penetration in order for the Internet economy to have greater economic impact.
Box figure 2.3.2. Mixed evidence of Internet users and fixed broadband penetration, 2014
Even basic voice coverage and access are incomplete in some Member States. For example, the percentage of the population that owns a mobile phone is a more telling statistic than the subscription penetration figures, which are distorted by multiple SIM cards and machine-to-machine subscriptions (box figure 2.3.3, left). Though coverage of 2G mobile networks is relatively high in ASEAN, it is still incomplete in a number of Member States, leaving 60 million people without access to a signal, mainly in rural areas. As a result, there is a gap between urban and rural mobile penetration (box figure 2.3.3, right). This could be alleviated through well-designed universal service programs.
Fixed broadband subscriptions (per 100 people)
Internet users (% of surveyed population)
12
13
20
22
35
39
41
51
68
81
0 20 40 60 80 100
Myanmar
Lao PDR
Cambodia
Indonesia
Thailand
Philippines
Viet Nam
Malaysia
Brunei Darussalam
Singapore
0.2
0.3
7.3
0.2
1.4
1.5
5.7
7.7
8.0
26.6
0 10 20 30
Cambodia
Myanmar
Indonesia
Philippines
Viet Nam
Brunei Darussalam
Malaysia
Thailand
Singapore
Lao PDR
Improvements in the telecommunication infrastructure in Myanmar contributed to lowering service costs and have brought down the cost of a SIM card from $2,000 to just $1.50 in five years.9 Similarly, in Lao PDR, the cost of using a mobile phone has come down significantly, from $9.20 for three minutes in 2000 to $0.24 in 2014. With the rapid development in Myanmar’s communication network, mobile phone penetration in the country is expected to rise from a low base of 4% in early 2012 to 75% before the end of 2016.10

Chapter 2: Infrastructure investment and private sector players in ASEAN
61
Box figure 2.3.3. Demand-side mobile access indicators are more telling statistics
Source: UNCTAD, based on information adapted from Pew, DHS and national telecommunication regulatory authorities and statistical offices.
Note: In the left chart, data for the Philippines, Indonesia, Viet Nam, Malaysia and Thailand refer to users 18 and older. Data for Brunei Darussalam refers to users aged 15 and older; data for Singapore refer to users age (7 years and older) in 2013.
31
Households with mobile phone (%), latest year available
Mobile phone users (% of surveyed population), 2014
74 78 8290 92 92 93
115 107
138
113
149141 148
0
100
200
Ownership Subscriptions
62
83 84 8981
90 91 91 90 91
56
76 7889
77
0102030405060708090
100
National Urban Rural
Brune
i
Darus
salam
Indon
esia
Mala
ysia
Philippine
s
Singap
ore
Thail
and
Viet N
am
Philippine
s
Thail
and
Viet N
am
Indon
esia
Cambod
ia
2.2.3. Transport
Bridges
The construction of bridges in the region has connected lands that are otherwise separated by seas and rivers, and eased the movement of people and goods between areas that once were difficult or time consuming to reach. Evidence indicates that bridge connections have helped such areas expand commercial activities, tourism, and investment and increase local economic growth. Bridges have not only enhanced national linkages but also facilitated regional connectivity. The construction and operation of the First and Second Penang Bridge in Malaysia physically connected Penang Island with the mainland peninsula, significantly reducing the travel time and increasing logistical efficiency. Brunei Darussalam is building one of the longest bridges (30 km) in that country, to connect Muara with Temburong, which is at present physically separated from the rest of the country.11 The construction of the 5.4 km Suramadu Bridge connected the second largest Indonesian city, Surabaya, to the Madura Islands. Travel time across the strait has been significantly reduced as compared with ferry crossings. With the involvement of foreign and local contractors, Viet Nam is building its longest sea bridge, linking the northern city of Haiphong to the port of Lach Huyen. Many bridges have been built to link areas within countries and to link neighbouring countries. Many more are being built or are in the planning stage in various ASEAN Member States.
Box 2.3. The importance of ICT (concluded)

ASEAN INVESTMENT REPORT 2015: Infrastructure Investment and Connectivity
62
Roads
National road connections also support smooth movement of goods and people, including bringing produce from farms to markets and industrial goods from ports to factories – and vice versa. Good road connections and networks can reduce logistical costs, thereby increasing the competitiveness of businesses and that of a country as a whole.
Completion of missing road links and upgrading of national roads is important for transportation efficiency. The completed Cambodia National Road No. 41, laid by Chinese contractors, connects Cambodia National Roads No. 3 and No. 4, which enhances the national road network and improves connectivity. These roads also provide an important channel to the southern coastal cities and ports. Cambodia is also building the 174 km National Road No. 58, which will link Samrong City with Poipet City in 2018 – making the country better connected.
The construction of the $2.9 billion Jakarta Integrated Tunnel, involving Bouygues (France), consists of two tunnels that will carry traffic and flood water on separate levels, which will help address Jakarta’s traffic congestion and flood problem.12 The Indonesian Government is planning to construct the 2,700 km Trans-Sumatra toll road in 2015, which is estimated to cost $23 billion.13 The toll road will be the main highway on Sumatra that connects Banda Aceh in the north to Bandar Lampung in the south through 24 sections stretching across 10 provinces.
In Malaysia, seven new highways are being built in 2015 at an estimated cost of $6.19 billion, to connect areas and to increase road network efficiency. The projects include the Serdang–Kinrara–Putrajaya Highway, the Duta–Ulu Kelang Expressway extension, the Sungai Besi–Ulu Kelang Elevated Expressway, the Damansara–Shah Alam Expressway, the Kinrara–Damansara Expressway, the Kuala Lumpur Outer Ring Road and the West Coast Expressway from Banting to Taiping.14 The construction of Malaysia’s West Coast Expressway when completed in 2019 will cut travel times between Taiping and Banting considerably.15
Rail
The plan to develop a number of high-speed rail links nationally and between ASEAN Member States (Singapore-Kunming Rail Link) is expected to generate significant impacts along the route aside from employment opportunities from such projects (chapter 4). An important aspect of rail development is its ability to connect cities and enable transportation of goods and people. It plays a crucial role in moving minerals and natural resources from mines to ports, refineries and markets. Like road transport, it contributes to the development of trade and exports, including support for downstream logistical businesses.
The urban transport system in various major cities in ASEAN has helped move massive numbers of people rapidly in and across the cities on a daily basis. Such urban rail network systems have increased the efficiency of capital cities and help reduce the number of vehicles in congested cities. While some ASEAN Member

Chapter 2: Infrastructure investment and private sector players in ASEAN
63
States are building their capital’s mass rail transport networks, others are expanding their intracity rail systems and intercity rail networks. The MRT system in Jakarta is expected to commence operation in 2018. Kuala Lumpur’s MRT system is being expanded with more lines and an extended network. Singapore is also expanding its MRT networks, from 178 km of line to 360 km by 2030. Thailand continues to expand Bangkok’s MRT and BTS infrastructure to cope with growing demand and urbanisation. The Hanoi Metro project started in 2015, and the Ho Chi Minh City Metro network is expected to begin in 2020.
Airports and seaports
Without air and seaports, a country is disconnected from a region and from the world. The provision of airports and ports is significant for connectivity, trade and commerce, and for supporting the growth of tourism. The development and upgrading of airports in the region have contributed to the rapid growth of low-cost budget airlines and related businesses (box 2.4, chapter 4). The latter in turn play a key role in supporting the growth of tourism in the region and in generating employment.
Box 2.4. More airports are being developed or upgraded in ASEAN
ASEAN countries are investing in new airports and upgrading existing ones to cope with rising demand and increasing capacity. The private sector is playing a role in airports development through PPP arrangements and concessions, and as engineering, procurement and construction (EPC) contractors (chapter 3). More private sector participation is being solicited. Over the next five years, at least $33 billion will be needed in the region to spend on building and expanding airports.
For instance, Indonesia will need $15 billion to construct and develop airports through to 2019. A third terminal at the Soekarno Hatta airport in Jakarta is expected in 2015. Some $1.7 billion is needed to build a third runway and a passenger terminal. In Malaysia, KLIA 2, a new terminal with a value of $800 million, intended for low-cost budget airlines, opened in 2014. The Government has continued to invest and upgrade airports in the country. In 2014, $310 million was allocated for upgrading of airports and $217 million for enhancing capacity in KLIA.
The Government of Myanmar expects the new Hanthawaddy International Airport to be operational by the end of 2019. This airport, which will be privately operated, will be the premier gateway for entry into the country with the capacity initially to handle 12 million passengers per year. The cost of the airport will be about $1.5 billion. The Philippines is planning to upgrade 49 airports over the next five years, at an estimated cost of $2.5 billion. Most of the upgrades will be done through PPPs. The Philippine Government is also planning to construct a new Manila Airport at an estimated cost of about $10 billion. The airport will be financed through PPP and funding support from Japan. It is expected to operate in 2025 and accommodate 55 million passengers per year.16
The expansion of Singapore’s Changi Airport is under way. A fourth terminal is to be completed by 2017 at a cost of at least $2.2 billion. Terminal 1 will be expanded to handle more passengers – from 17 million to 24 million people per year – and the new Terminal 4 will add capacity for another 16 million passengers a year. Singapore is also planning to build Terminal 5.

ASEAN INVESTMENT REPORT 2015: Infrastructure Investment and Connectivity
64
Box 2.4. More airports are being developed or upgraded in ASEAN (concluded)
The Thai Government has allocated $1.9 billion for the second phase of the expansion work on Bangkok’s Suvarnabhumi airport. About $589 million will be spent on construction of a new runway, $340 million for road works and $900 million for the construction of a new terminal complex. A second terminal at the Don Muang airport, for budget airlines, will open in 2015. A new international terminal at Phuket Airport in the southern part of Thailand is expected to open in 2016, at a cost of over $300 million, including further redevelopment works scheduled for completion by 2017.
Viet Nam is also seeking domestic and foreign investors to participate in airports development and upgrading through PPPs. Projects include the development of the Long Thanh airport to alleviate traffic congestion at Ho Chi Minh City’s Tan Son Nhat Airport. In 2013, the Civil Aviation Administration of Viet Nam committed more than $8.1 billion to aviation infrastructure projects, of which Long Thanh airport would account for $7.2 billion. Viet Nam is also building new and smaller regional airports. For example, a groundbreaking ceremony was held in early 2015 for an airport in the south-central resort town of Phan Thiet. The airport is expected to become operational in 2018.
Other Member States, such as Brunei Darussalam, are also expanding and upgrading their international airports (section 3.2.3).
Source: CAPA Centre for Aviation.
The $4 billion expansion of the Tanjung Priok seaport in Indonesia, when complete in 2023, will triple the port’s annual shipping capacity and ease congestion (Jones 2014). The port handles more than 50% of the country’s imports and exports. The construction of an $18.5 million port terminal in Bataan (Philippines), when complete in 2016, will increase the port capacity by a minimum of 3 million tonnes of cargo annually; a joint venture of Nectar Group (United Kingdom) and Seasia Logistics (Philippines) is doing the work.17 The modernization and upgrading of the $422 million Davao Sasa Port18 to be financed through PPP is expected to handle 1.2 million 20-foot equivalent units (TEUs) annually. The port is also expected to serve as a transshipment hub for BIMP-EAGA and will support the establishment of the ASEAN Roll-On/Roll-Off (RORO) shipping network and short sea shipping route.19
Malaysia is planning to expand Port Klang to further boost movement of goods through it. Expansions have nearly doubled capacity in the Northport (from 2.9 million to 5.6 million TEUs) and in the Westport (from 7.5 million to 14 million TEUs).20 The $3.8 billion investment by the Port Authority of Thailand to expand the Chabang Port to ease congestion will expand capacity by 240% from 5.6 million TEUs to 18.8 million by 2020. The port currently handles half of the imports and exports of Thailand.21
2.2.4. Other infrastructure
ASEAN Member States have developed many special economic zones, including industrial, science and technology parks that generate significant economic, technological and social impacts. The benefits of these parks to an economy would not materialize if not for the
Chapter 2: Infrastructure investment and private sector players in ASEAN
65
provision of a reliable supply of electricity, water, telecommunication and road networks. A 2015 UNIDO study estimated that there are more than 1,000 economic zones in ASEAN (893 industrial parks, 84 special economic zones, 2 eco-industrial parks, 25 technology parks, and 1 innovation district), and the numbers of such zones are increasing in the region.
These zones have help attracted many MNEs and house many factories that have created jobs. For instance, the Batamindo Industrial Park in Batam Island (Indonesia), developed by Sembcorp (Singapore), has attracted more than 70 manufacturing MNEs and generated at least 60,000 jobs, economically transforming the island.22
Viet Nam has 212 industrial parks in operation. At the end of 2014, its economic zones and industrial parks had attracted more than 5,500 FDI projects with a registered capital of $85.5 billion, of which 59% had been disbursed.23 The import-export turnover associated with enterprises operating in these zones and parks amounted to $73.4 billion in 2014. Together, these enterprises created some 2.4 million jobs in the country.
Lao PDR is expected to have established 15 SEZs by the end of 2015, and another 10 more by 2020. Most of these zones will be developed in border areas and remote parts of the country, to promote development in rural areas. Indonesia is planning to build 8 SEZs and 14 new industrial estates between 2015 and 2019. One industrial park there is being developed by China Minsheng Investment Company. The project is expected to be completed in 2020 at an estimated cost of $5 billion.24 Myanmar has 19 industrial estates and is developing 7 more as well as 3 SEZs in the country. Thailand plans to develop 12 SEZs along its borders (namely, with Cambodia, Lao PDR, Myanmar and Malaysia). Brunei Darussalam has established sector-specific industrial parks that are ready to be used. They include the Rimba Digital Junction (an industrial park for high-tech industries), the Bukit Panggal Industrial Park (to house export-oriented energy-intensive manufacturing industries) and the Brunei BioInnovation Corridor (an international halal-themed industry park).
Other infrastructure, such as dams, has also played an important role in economic and social development in the region. The construction of dams for hydropower plants has not only helped increase electricity generation capacity and cultivate renewable energy, but also has prevented floods and supported the irrigation of nearby agricultural areas, providing livelihoods for farmers. For instance, in Viet Nam the dams at the Ban Ve hydroelectric power plant and the Dai Ninh hydroelectric plant help prevent flooding in the surrounding areas as well as supply water for irrigation in agriculture.
2.3. Infrastructure investment needs
Infrastructure investment needs in ASEAN are huge, estimated to be about $110 billion per year through to 2025. It is possible to meet this need from resources held mainly by the private sector. Various studies have estimated the region’s infrastructure investment needs, which range from about $60 billion to $150 billion

ASEAN INVESTMENT REPORT 2015: Infrastructure Investment and Connectivity
66
per year for different future periods and coverage of ASEAN Member States (table 2.2 and box 2.5).25 UNCTAD has estimated that the region would need at least $110 billion in annual investment in power, transport, telecommunication, and water and sanitation for the next decade. This estimate excludes investment needs for cross-border regional connectivity projects.
The power sector and transport infrastructure dominate annual investment needs. They together will account for the lion’s share of the future needs, as they have in the past. This is also consistent with estimates of other studies (ADB-ADBI 2009, Goldman Sachs 2013, Bhattacharyay et al. 2012). Investment needs in water and sanitation remain low but more needs to be done to expand the provision of quality infrastructure service in this area, and to ensure universal access.
Table 2.2. Annual infrastructure investment needs in ASEAN are huge, 2015–2025
ADB-ADBI (2009)
McKinsey GlobalInstitute (2013)
KPMG (2014a)
Bhattacharyay et al. (2012)
Goldman Sachs (2013)
UNCTAD estimate
Estimated annual investment needs(Billions of dollars)
60 133 146 100 69 110
Sectors covered Power, transport, telecom-munication, WSS
Power, transport, telecom-munication, WSS
.. Power, transport, telecom-munication, WSS
Power, transport
Power, transport, telecom-munication, WSS
Period covered 2010–2020 2013–2030 mainly 2013–2030
2010–2030 2013–2030 2015–2025
Countries covered All except Brunei Darussalam, Singapore
All ASEAN Member States
All except Brunei Darussalam, Singapore
All except Brunei Darussalam, Singapore
Only Indonesia, Malaysia, Philippines and Thailand
All ASEAN Member States
Source: UNCTAD 2015b.
Note: WSS = water supply and sanitation
The infrastructure development plans of ASEAN Member States also differ in terms of magnitude and sectors. Infrastructure quality and coverage in ASEAN differ markedly between the Member States. Some already possess good-quality infrastructure from significant investment made in the past, including investments in maintenance and upgrades. Others have under invested in infrastructure and need to do more to ensure the provision of adequate-quality infrastructure assets to support economic growth and meet rapidly growing demand.
Additional resources are available to be tapped to finance infrastructure development in the region (table 2.3). Although public finances are central and fundamental, the scale of investment required means that the private sector, including MNEs, must play a pivotal role. A number of key challenges and policy options can be considered for mobilization and channeling of resources to infrastructure investment (WIR 2014). The role of MDBs and ODAs remains important, and they need to continue to support infrastructure development in the region to help ASEAN Member States become better connected.

Chapter 2: Infrastructure investment and private sector players in ASEAN
67
Box 2.5. ASEAN needs at least $110 billion annually in infrastructure investment through to 2025
The $110 billion estimate of infrastructure investment needs provides an indication of magnitude. It is estimated as follows:
• Electricity (generation, transmission, distribution) = $ 38 billion• Transport (road, rail, ports and airports) = $ 55 billion• Telecommunication (ICT) = $ 9.2 billion• Water and sanitation = $ 7.8 billion
The estimate for electricity is based on IEA 2014, which provides estimates of investment needs in electricity for the region between 2014 and 2025. The estimates, based on new policies, cover generation, transmission and distribution.
The estimate for transport is based on two calculations: the median of investment needs of $42 billion calculated by Bhattacharyay (2013) and the estimates based on percentage share of GDP for transport indicated in Bhattacharyay et al. (2012). It excludes Brunei Darussalam and Singapore. GDP figures at current prices for 2013-2020 from the World Economic Outlook database were applied. The annual average for the period was projected to cover 2021-2025.
Future telecommunication investment in ASEAN will be driven by the expansion of mobile broadband networks, upgrades of wired access and national and international backbones to fibre optic, and increases in network capacity. The estimate for ICT is at about the level spent in the previous decade. It is based on the average cost needed to expand mobile and wired broadband service, including associated backbone transmission investments based on historical investment data for each country. It is assumed that in the next decade more emphasis will be needed on development and upgrading of infrastructure to support mobile and data technology. The estimates cover 2015 through to 2025 and build on the assumption that mobile broadband penetration will reach the existing rate of 2G population coverage. Two reasons that investment will not increase are the trend by operators to outsource more network deployment and the savings achieved from infrastructure sharing, particularly for existing mobile antenna towers.
The annual investment needs for water supply and sanitation (WSS) are based on the percentage share of GDP for WSS of Bhattacharyay et al. (2012). The estimate excludes Brunei Darussalam and Singapore. GDP figures at current prices for 2013-2020 from the World Economic Outlook database were applied. The annual average for the period was projected to cover 2021-2025.
Source: UNCTAD.
In addition to the list in table 2.3, other private sector funds can be considered. They include potential facilities for infrastructure projects from foreign banks and international development financial institutions such as the Asian Development Bank (ADB) and the World Bank. In addition, a number of specialized funds can be tapped for infrastructure investment in the region. They include, for example, the China-ASEAN Investment Cooperation Fund with a potential size of $10 billion, the ASEAN Infrastructure Fund managed by the ADB and the soon to be established Asian Infrastructure Investment Bank. Commercial banks, mainly foreign entities, are further important sources. In 2014, they provided about $8 billion in financing facilities to infrastructure projects in ASEAN.

ASEAN INVESTMENT REPORT 2015: Infrastructure Investment and Connectivity
68
The region is expected to invest more in the next decade in light of the strong commitments of Member States to increase the quality of their infrastructure, the announcement of huge infrastructure investment plans and the growing demand for more infrastructure.
The future infrastructure investment needs of ASEAN far exceed available public resources. This large gap needs to be filled. The public sector alone cannot deliver the infrastructure to
Table 2.3. At least $10 trillion in available resources can be tapped for infrastructure investment in ASEAN, 2015
Type of resources YearAmount
($ billions)Source
ASEAN Bond Markets 2015 1,081 Asian Development Bank Bond Monitoring.Based on second-quarter 2015 bond markets data of Indonesia ($125 billion), Malaysia ($285 billion), Philippines ($103 billion), Singapore ($241 billion), Thailand ($284 billion) and Viet Nam ($43 billion).
ASEAN Stock Exchanges
2015 2,002 World Federation of Exchanges. Based on stock exchange market capitalization in August 2015 of Indonesia ($334 billion), Malaysia ($363 billion), Philippines ($243 billion), Singapore ($639 billion), Thailand ($373 billion) and Viet Nam ($50 billion).
ASEAN Infrastructure Companies(Total assets)
2014 1,567 Orbis.Covers construction, real estate, utilities and telecommunication companies. Based on 3,319 infrastructure companies with reported financial data; of which 3,030 domestic infrastructure companies with combined total assets of $1.45 trillion and 289 foreign construction companies operating in ASEAN with $117 billion. Information for some companies was based on 2012 data (latest year for which data are available).
ASEAN Banks(Total assets)
2014 4,619 Orbis.Based on 477 banks with reported $4,619 billion total assets, with operations in ASEAN, of which 338 are domestic and 139 foreign owned. Domestic banks collectively held $4 trillion, and foreign bank subsidiaries owned $619 billion in total assets. Information for some companies was based on 2012 data (latest year for which data are available).
ASEAN Insurance Companies(Total assets)
2014 504 Orbis. Based on data for 278 domestically owned insurance companies and 118 foreign-owned companies operating in ASEAN. Total assets of domestic insurance companies were $340 billion, and foreign-owned subsidiaries held $164 billion. Information for some companies was based on 2012 data (latest year for which data are available).
ASEAN Pension Funds(Total assets)
2014 38 Orbis. Based on data for 222 pension fund companies with reported financial data, of which 176 domestic companies held total assets of $31 billion and 36 foreign ones operating in ASEAN held $7 billion. Information for some companies was based on 2012 data (latest year for which data are available).
Memorandum:
Gross domestic saving 2014 820 World Bank.Exclude data on Myanmar.
Foreign-exchange reserves
2014/2015 750 IMF: Data for Indonesia, Malaysia, Philippines, Singapore and Thailand reported in August 2015. World Bank: Data for Brunei Darussalam, Cambodia, Lao PDR, Myanmar and Viet Nam based on 2014 data and for Myanmar on 2012 data.
Sovereign wealth fund 2014 620 Sovereign Wealth Fund Institute: Based on December 2014 data for Brunei Investment Agency (Brunei Darussalam), Government Investment Unit (Indonesia), Khazanah Nasional (Malaysia), GIC Private Limited (Singapore), Temasek (Singapore) and Vietnam`s State Capital Investment Corporation (Viet Nam).
Source: UNCTAD 2015b.

Chapter 2: Infrastructure investment and private sector players in ASEAN
69
meet the growing needs. It is imperative that the private sector play a greater role, including through effective PPPs.
2.4. Foreign private participation in infrastructure in ASEAN
Private participation in infrastructure development in the region is rising, with most private involvement occurring in the transport, telecommunication and power sectors. MNEs from within ASEAN and outside the region are active in the last two and in some transport infrastructure, such as urban rail networks and port terminals.
Many players are involved in infrastructure developments in ASEAN. Domestic investors and foreign MNEs continue to contribute to infrastructure development across sectors (chapter 3). The State has traditionally been the main developer, owner and provider of infrastructure services in the region. However, this role of the State is declining. Private sector participation as investors and owners of infrastructure assets in the region is growing.
Countries in the region have been investing in gross fixed capital formation (GFCF), which has grown much faster than the rate of GDP. But more investment in GFCF, in particular in infrastructure, is needed to support economic development. Some Member States invest more in GFCF than others. In Member States such as Lao PDR and Indonesia, GFCF accounted for about 32% and 30% of GDP between 2005 and 2013, while in Cambodia and the Philippines it accounted for only 18% and 19%, respectively.
The share of private investment in GFCF for more developed ASEAN Member States (i.e. Indonesia, Malaysia, Thailand, Singapore26) rose between 2000–2004 and 2010–2014, while the Philippines remains stable at about 87% (table 2.4). These statistics highlight
Table 2.4. Rising pivate investment in GFCF in some ASEAN Member States(Annual average 2000–2004, 2005–2009, 2010–2014 at constant price; Millions of dollars)
Brunei Darussalam
Cambodia Indonesia Lao PDR Malaysia Myanmar Philippines Singapore Thailand Viet Nam
2000–2004 (annual average)
GFCF ($ million) 944 758 131,560 .. 28,757 3,892 15,866 29,936 16,233 20,220
Public investment share (%) .. 36 13 .. 56 43 13 24 31 29
Private investment share (%) .. 64 87 .. 44 57 87 76 69 71
2005–2009 (annual average)
GFCF ($ million) 1,413 1,217 180,598 .. 38,475 5,480 19,795 44,193 25,825 32,108
Public investment share (%) .. 33 11 .. 46 43 13 16 26 29
Private investment share (%) .. 67 89 .. 54 57 87 84 74 71
2010–2014 (annual average)
GFCF ($ million) 1,975 1,820 251,255 .. 61,610 10,014 30,492 72,452 33,366 33,519
Public investment share (%) .. 44 9 .. 41 45 14 18 22 33
Private investment share (%) .. 56 91 .. 59 55 86 82 78 67
Source: IMF, WEO Database.

ASEAN INVESTMENT REPORT 2015: Infrastructure Investment and Connectivity
70
the growing importance of private investment across the region in economic development, including in infrastructure. They also suggest that the CLMV countries would need to encourage greater private sector participation in economic development and to release public resources to use in areas where it would be more challenging to attract private investment (e.g. in social sectors such as water, sanitation and education).
The form of MNE involvement in infrastructure operations varies significantly by sector, in part reflecting the policies of host countries in the region, the openness of the sectors, investment opportunities and the risk-return relationship perceived by investors. The private sector has been participating in infrastructure development in the region through a number of modalities. They include foreign direct investment (FDI) (greenfield), mergers and acquisitions (M&As), privatization participation, non-equity modalities (concessions), and partnership or consortium arrangements. Some modalities are more significant than others for private sector participation. The privatization of public infrastructure and the maturity of the M&A environment, including opportunities to acquire assets in a host country, can influence private sector participation. Firms’ experience, skill sets and ability to win contracts are additional influences. MNEs from developed and developing countries, including from ASEAN, are participating in infrastructure development in the region through contractual arrangements, whether as engineering, procurement and construction (EPC) contractors or subcontractors. They also invest, build, operate and manage infrastructure assets.
The choice of modalities would also depend on company, host country and infrastructure sectors. In some Member States and in some sectors such as road construction, the domestic private sector are active players. In others, foreign companies have a significant presence; an example is in electricity generation in Lao PDR and Myanmar, which is also supported by those countries’ policy and investment opportunities. However, in large and complex infrastructure projects, foreign companies’ participation is high because of the skills, experience and access to finance that they bring.
ASEAN Member States are using PPPs to attract private participation in infrastructure development. Member States such as Indonesia, Lao PDR, Myanmar, the Philippines and Viet Nam have all implemented and announced PPP projects. Concession arrangements such as build-operate-transfer (BOT), build-operate-own (BOO) and build-transfer-operate (BTO), turnkey and – in some cases – guarantees of revenue streams through long-term power purchase agreements or toll collection concessions have attracted private sector participation.
FDI is an important form of MNE involvement in telecommunication and in power generation in the region because of the liberalization of those industries over the years. In some Member States such as Singapore, power generation assets have been privatized and foreign MNEs are now owners of these assets. Senoko Power, once owned by the Government, is now owned by Lion Power, which is controlled by a consortium led by Marubeni (Japan) and including GDF Suez (France), Kansai Electric Power (Japan), Kyushu

Chapter 2: Infrastructure investment and private sector players in ASEAN
71
Electric Power (Japan) and Japan Bank for International Cooperation. The Huaneng Group (China) now owns Tuas Power and YTL Power International (Malaysia) owns Power Seraya in Singapore. The lion’s share of electricity generation in Singapore is supplied from power plants owned by foreign MNEs. In telecommunication, foreign players dominate in some Member States.
2.4.1. FDI in infrastructure
The growing FDI in infrastructure is dominated by investments in transportation and storage, and in ICT, and in real estate (table 2.5). The World Bank data on private participation in infrastructure (PPI), which are on a project basis also indicate the dominance of private participation in these infrastructure sectors and in electricity (table 2.6). On average, PPI in four ASEAN Member States – Indonesia, Lao PDR, Thailand and Viet Nam – has been increasing since the 1990s.27
Except for the decline in 2012–2013, FDI in real estate28 has been on a rising trend, while FDI in construction has recovered from the significant plunge in 2011–2012, to nearly reach the peak of 2008. FDI in these activities remains at a high level (figure 2.1).
FDI in infrastructure accounted for about 12-15% of total FDI inflows into the region in 2012 and 2014 (if real estate activities are included), with differences between ASEAN Member States. Indonesia, Thailand and Viet Nam saw a rise in FDI in infrastructure investments in 2014. FDI in transportation and storage, information and communication, and real estate rose in Indonesia, while in Thailand FDI in information and communication rose. Viet Nam witnessed an increase in FDI in construction and real estate.
Figure 2.1. Rising FDI flows in real estate and recovery in construction in ASEAN(Millions of dollars)
Source: ASEAN Secretariat, ASEAN FDI Database (accessed 1 July 2015).
0
200
400
600
800
1,000
1,200
1,400
1,600
1,800
0
2,000
4,000
6,000
8,000
10,000
12,000
14,000
2005 2006 2007 2008 2009 2010 2011 2012 2013 2014
Real estate Construction

ASEAN INVESTMENT REPORT 2015: Infrastructure Investment and Connectivity
72
Tab
le 2
.5.
Tra
nsp
ort
ati
on
, in
form
ati
on
an
d c
om
mu
nic
ati
on
, an
d r
eal
esta
te d
om
inate
in
frastr
uctu
re F
DI
in A
SE
AN (M
illio
ns
of
do
llars
)
Bru
nei
Daru
ssala
mIn
don
esi
aM
ala
ysia
Mya
nm
ar
Ph
ilip
pin
es
Sin
gapore
Thaila
nd
Vie
t N
am
Tota
l
20
12
Ele
ctric
ity, g
as, s
team
and
air
cond
ition
ing
sup
ply
..
199
.1
21.
2 ..
(2
3.2)
..
(26.
6) 4
9.8
220
.3
Wat
er s
upp
ly; s
ewer
age,
was
te m
anag
emen
t an
d
rem
edia
tion
activ
ities
..
85.
3 (1
3.8)
233
.2
(1.8
) ..
(5
6.6)
0.3
2
46.6
Con
stru
ctio
n 3
8.3
(76.
2) 5
7.0
..
8.8
1
27.4
(1
70.2
) 1
77.1
1
62.1
Tr
ansp
orta
tion
and
sto
rage
4.3
9
97.8
(1
67.5
) ..
(9
.6)
2,1
58.6
3
9.8
116
.3
3,1
39.6
In
form
atio
n an
d c
omm
unic
atio
n ..
2
,025
.8
18.
4 ..
1
9.6
(225
.8)
213
.4
2,0
51.4
R
eal e
stat
e ac
tiviti
es ..
8
30.6
1
82.0
..
1
63.5
7
,741
.6
1,0
14.6
1
,013
.4
10,
945.
8 To
tal o
f the
sel
ecte
d in
fras
truc
ture
sec
tors
(if
incl
udin
g re
al e
stat
e) 8
5.1
7,2
94.3
1
2.8
233
.2
151
.1
12,
313.
6 1
35.8
2
,127
.0
16,
765.
9
Tota
l FD
I 8
64.8
1
9,13
7.9
9,4
00.0
1
,354
.2
2,7
97.0
6
0,98
0.3
10,
699.
2 8
,368
.0
115
,452
.8
20
13
Ele
ctric
ity, g
as, s
team
and
air
cond
ition
ing
sup
ply
..
208
.8
98.
1 ..
(2
7.4)
..
41.
4 8
35.9
1
,156
.8
Wat
er s
upp
ly; s
ewer
age,
was
te m
anag
emen
t an
d
rem
edia
tion
activ
ities
0.1
8
9.5
(8.1
) 3
1.6
461
.4
..
6.7
2
1.0
602
.2
Con
stru
ctio
n (4
1.9)
148
.9
280
.1
..
1.7
3
16.3
3
3.0
86.
9 8
25.0
Tr
ansp
orta
tion
and
sto
rage
1.3
6
24.8
2
56.1
4
05.6
2
1.3
1,3
87.7
8
7.2
18.
4 2
,802
.5
Info
rmat
ion
and
com
mun
icat
ion
(0.7
) 1
,268
.5
752
.8
..
5.2
..
1
45.6
2
4.9
2,1
96.5
R
eal e
stat
e ac
tiviti
es ..
8
34.8
1
,020
.0
44.
5 7
0.5
5,8
13.2
1
,647
.2
391
.3
9,8
21.5
To
tal o
f the
sel
ecte
d in
fras
truc
ture
sec
tors
(if
incl
udin
g re
al e
stat
e) (8
2.3)
5,5
15.6
3
,778
.3
918
.9
995
.0
9,2
21.2
2
,275
.1
2,3
65.7
1
7,40
4.5
Tota
l FD
I 7
25.5
1
8,44
3.8
12,
297.
4 2
,621
.0
3,8
59.8
5
6,13
8.3
12,
999.
8 8
,900
.0
117
,687
.1
20
14
Ele
ctric
ity, g
as, s
team
and
air
cond
ition
ing
sup
ply
..
184
.1
(11.
0) 2
.2
(58.
4) ..
(2
62.0
) 9
6.3
(48.
9)W
ater
sup
ply
; sew
erag
e, w
aste
man
agem
ent
and
re
med
iatio
n ac
tiviti
es (0
.1)
78.
9 (1
.2)
..
(24.
0) ..
6
.7
26.
7 8
6.9
Con
stru
ctio
n 2
2.5
101
.8
265
.2
..
6.1
8
8.6
84.
1 4
57.3
1
,047
.8
Tran
spor
tatio
n an
d s
tora
ge 4
.5
739
.7
203
.5
413
.3
90.
2 1
,034
.4
52.
2 7
4.5
2,6
12.3
In
form
atio
n an
d c
omm
unic
atio
n (2
.4)
1,7
26.0
(3
1.5)
..
13.
2 ..
8
09.3
3
2.0
2,5
46.6
R
eal e
stat
e ac
tiviti
es ..
1
,371
.7
839
.3
29.
3 1
53.8
5
,150
.7
1,2
73.4
1
,194
.2
10,
031.
3 To
tal o
f the
sel
ecte
d in
fras
truc
ture
sec
tors
(if
incl
udin
g re
al e
stat
e) 4
9.1
7,0
32.7
1
,689
.0
860
.4
207
.9
7,3
96.7
2
,653
.9
2,5
67.8
1
6,27
6.1
Tota
l FD
I 5
68.2
2
2,27
6.3
10,
714.
0 9
46.2
6
,200
.5
72,
098.
3 1
1,53
7.9
9,2
00.1
1
36,1
81.4
Sou
rce:
AS
EA
N S
ecre
taria
t, A
SE
AN
FD
I Dat
abas
e (a
cces
sed
1 A
ugus
t 20
15).
a In
clud
es in
dus
tria
l est
ates
, sp
eica
l eco
nom
ic z
ones
, fre
e tr
ade
zone
s an
d c
omm
erci
al p
rop
ertie
s.

Chapter 2: Infrastructure investment and private sector players in ASEAN
73
Tab
le 2
.6.
Pri
vate
part
icip
ati
on
in
in
frastr
uctu
re i
s u
neven
in
AS
EA
N,
19
91
–20
14 (M
illio
ns
of
do
llars
)
Ind
on
esi
aM
ala
ysia
Ph
ilip
pin
es
Thaila
nd
Ene
rgy
Tele
com
Tran
spor
tW
SS
Tota
lE
nerg
yTe
leco
mTr
ansp
ort
WS
STo
tal
Ene
rgy
Tele
com
Tran
spor
tW
SS
Tota
lE
nerg
yTe
leco
mTr
ansp
ort
WS
STo
tal
1991
....
11..
11..
....
....
379
54..
..43
3..
252
16..
268
1992
137
..11
5..
252
1,35
0..
160
284
1,79
416
054
....
214
..1,
854
48..
1,90
2
1993
..25
035
2..
602
1,33
0..
814
2,55
84,
702
1,87
954
....
1,93
317
12,
460
....
2,63
1
1994
596
1,24
927
..1,
872
3,18
274
82,
011
790
6,73
11,
243
735
....
1,97
850
416
0..
..66
4
1995
2,47
01,
804
503
200
4,97
71,
200
1,01
21,
889
104,
111
2,32
959
330
0..
3,22
21,
385
370
1,70
016
03,
615
1996
3,20
43,
694
....
6,89
8..
1,03
32,
948
..3,
981
1,61
41,
192
514
..3,
320
2,38
91,
013
150
..3,
552
1997
2,72
51,
511
..12
34,
359
215
673
2,18
2..
3,07
01,
673
2,40
11,
127
7,56
612
,767
2,14
164
4..
612,
846
1998
330
579
..63
21,
541
..17
559
2..
767
1,26
054
7..
..1,
807
574
331
27..
932
1999
125
1,26
01,
028
..2,
413
195
296
314
..80
518
262
678
288
819
037
764
6669
7
2000
..64
2..
..64
2..
276
1,08
03,
965
5,32
11,
764
384
5..
2,15
385
951
1..
91,
379
2001
..1,
421
..37
1,45
81,
765
419
684
..2,
868
672
1,15
790
9..
2,73
889
01,
672
455
240
3,25
7
2002
188
1,32
2..
..1,
510
1247
5..
1650
312
670
630
..86
2..
1,19
8..
..1,
198
2003
829
940
....
1,76
92,
050
438
1,57
0..
4,05
845
476
7..
..1,
221
1,33
666
445
342,
079
2004
158
895
159
81,
220
1,21
01,
204
342
2,52
15,
277
322
930
....
1,25
20
613
439
..1,
052
2005
321,
538
..1,
570
1,60
048
358
7..
2,67
099
672
....
771
1,60
994
5..
242
2,79
6
2006
662
1,47
637
220
2,53
020
348
753
1..
1,22
164
661
921
550
41,
984
197
1,13
0..
191,
346
2007
423
3,51
71,
140
..5,
080
..59
542
3..
1,01
82,
083
1,52
6..
..3,
609
..1,
031
....
1,03
1
2008
2,88
52,
876
....
5,76
1..
882
425
..1,
307
1,82
01,
209
315
..3,
344
2,34
140
6..
..2,
747
2009
..2,
976
220
..3,
196
182
778
....
960
4,60
51,
198
9627
5,92
6..
539
....
539
2010
2,30
01,
846
....
4,14
634
947
253
..1,
234
2,14
91,
385
343
..3,
877
745
420
....
1,16
5
2011
366
2,01
2..
..2,
378
2484
5..
..86
999
31,
104
370
..2,
467
1,64
659
7..
..2,
243
2012
288
2,66
41,
989
154,
956
2,17
592
938
1..
3,48
573
61,
620
5017
82,
584
1,58
11,
169
....
2,75
0
2013
1,93
11,
772
..14
03,
843
1,28
392
5..
..2,
208
1,26
573
545
..2,
045
1,70
31,
706
....
3,40
9
2014
1,65
1..
....
1,65
1..
....
....
....
....
..93
4..
....
934
Tota
l21
,300
36,2
445,
916
1,17
564
,635
18,0
1013
,620
17,1
8610
,144
58,9
6028
,453
20,2
684,
397
8,27
761
,395
21,1
9520
,062
2,94
483
145
,032

ASEAN INVESTMENT REPORT 2015: Infrastructure Investment and Connectivity
74
Cam
bod
iaLao P
DR
Mya
nm
ar
Vie
t N
am
Year
Ene
rgy
Tele
com
Tran
spor
tW
SS
Tota
lE
nerg
yTe
leco
mTr
ansp
ort
WS
STo
tal
Ene
rgy
Tele
com
Tran
spor
tW
SS
Tota
lE
nerg
yTe
leco
mTr
ansp
ort
WS
STo
tal
1991
....
....
....
....
....
....
....
....
....
....
1992
..13
....
13..
....
....
....
....
....
....
....
1993
..18
....
18..
....
....
....
....
....
....
....
1994
....
....
....
....
....
....
....
....
..10
..10
1995
..2
120
..12
2..
....
....
394
....
..39
4..
256
....
256
1996
..8
....
853
692
....
628
....
50..
5020
5..
15..
220
1997
127
78..
..20
5..
....
....
325
....
..32
511
0..
70..
180
1998
..14
....
14..
1..
..1
....
....
....
....
3939
1999
161
....
17..
7..
..7
....
....
..40
....
..40
2000
..2
....
2..
52
..7
....
....
....
130
..20
150
2001
2812
65..
105
..12
....
12..
....
....
87..
..15
424
1
2002
428
7..
39..
20..
..20
....
....
..1,
780
..20
1,80
0
2003
..17
....
17..
6..
..6
....
....
..41
223
0..
764
9
2004
258
53..
86..
34..
..34
....
....
....
70..
..70
2005
2569
....
941,
250
10..
..1,
260
....
....
..93
....
9218
5
2006
..3
40..
431,
070
10..
..1,
080
556
....
..55
6..
682
133
..81
5
2007
655
166
....
821
....
....
....
....
....
367
645
267
..1,
279
2008
4737
....
8487
0..
....
870
....
....
..17
0..
365
..53
5
2009
..39
0..
..39
0..
125
2..
127
....
....
..34
926
720
0..
816
2010
1,86
418
....
1,88
23,
860
....
..3,
860
....
....
..94
3..
155
..1,
098
2011
..4
....
445
2..
....
452
....
....
..2,
770
....
..2,
770
2012
..7
....
750
1..
....
501
....
....
..16
9..
....
169
2013
....
....
....
....
....
170
....
..17
0..
..27
6..
276
2014
....
....
..1,
043
....
..1,
043
....
....
....
....
....
Tota
l2,
791
895
285
..3,
971
9,58
232
24
..9,
908
1,44
5..
50..
1,49
57,
495
2,28
01,
511
312
11,5
98
Sou
rce:
Wor
ld B
ank,
PP
I Dat
abas
e.
Not
e: D
ata
for
2014
cov
er u
p t
o fir
st h
alf o
f the
yea
r. W
SS
= w
ater
sup
ply
and
san
itatio
n.
Tab
le 2
.6.
Pri
vate
part
icip
ati
on
in
in
frastr
uctu
re i
s u
neven
in
AS
EA
N,
19
91
–20
14 (M
illio
ns
of
do
llars
) (c
on
clu
de
d)

Chapter 2: Infrastructure investment and private sector players in ASEAN
75
2.4.2. M&As in infrastructure
Cross-border M&As in infrastructure in ASEAN are also on the rise (table 2.7). Some 18% of the M&A deals in the region in 2010-2014 related to infrastructure activities. Cross-border infrastructure M&As rose significantly, from $2.8 billion in 2013 to $6.2 billion in 2014, and involved more ASEAN Member States including, to a small extent, Cambodia and Viet Nam. This development indicates the increasing opportunities for foreign investors to use M&A strategies in the region.
Most of the cross-border infrastructure M&As are in information and communication, transportation and storage, and energy (power) as well as in water services and sanitation. Foreign and ASEAN companies are active acquirers of infrastructure-related assets (table 2.8). Among MNEs from developed countries, Japanese companies dominated. Among the developing economies, China, Hong Kong (China), the Republic of Korea and some ASEAN Member States were active buyers in 2013–2014. Companies based in Indonesia, Malaysia, Singapore and Thailand made notable infrastructure-related acquisitions. They include companies such as E-Power (Singapore), Enco Holdings (Malaysia), Electricity Generating PCL (Thailand), B. Grimm Power (Thailand) in the electricity sector; Gadang Holdings (Malaysia) and Salcon (Malaysia) in water and sanitation; Ortus Holdings (Singapore) in transportation; and Axiata (Malaysia), Solusi Tunas Pratama (Indonesia) and TEE International (Singapore) in telecommunication.
Table 2.7. Infrastructure M&A activity in ASEAN is on the rise
Deals (number)
2010 2011 2012 2013 20142010−2014,
annual average
Total 547 584 502 409 410 490
of which:
Electricity, gas, water and waste management 14 17 19 9 12 14
Construction 14 12 14 15 9 13
Transportation and storage 31 27 18 25 24 25
Information and communication 33 48 25 30 48 37
Subtotal of selected infrastructure-related sectors 92 104 76 79 93 89
Value ($ million)
2010 2011 2012 2013 20142010−2014,
annual average
Total 21,324 34,353 23,043 40,363 21,700 28,157
of which:
Electricity, gas, water and waste management 157 2,612 632 1,077 1,122 1,120
Construction 440 143 71 103 9 153
Transportation and storage 731 3,746 296 1,194 1,497 1,493
Information and communication 222 725 524 438 3,563 1,095
Subtotal of selected infrastructure-related sectors 1,550 7,226 1,523 2,813 6,192 3,861
Source: UNCTAD, UNCTAD M&As Database.
Note: gross basis.

ASEAN INVESTMENT REPORT 2015: Infrastructure Investment and Connectivity
76
Tab
le 2
.8.
Asia
n c
om
pan
ies a
re a
cti
ve i
n i
nfr
astr
uctu
re M
&A
acti
vit
y i
n A
SE
AN
(S
ele
cte
d c
ases),
20
13
–20
14
Year
Targ
et
com
pan
yTa
rget
nati
on
Targ
et
ind
ust
ryU
ltim
ate
acq
uir
ing c
om
pany
Ult
imate
acquir
ing n
ati
on
Valu
e
($ m
illio
n)
Share
acquir
ed
(%)
Ele
ctric
ity
2013
Gun
kul P
ower
Gen
Th
aila
ndC
ogen
erat
ion
Chu
bu
Ele
ctric
Pow
er
Jap
an..
49
2013
Pow
ertu
de
Mal
aysi
aC
ogen
erat
ion
Ren
otex
Gro
up
Sey
chel
les
..51
2014
MH
Bio
-Ene
rgy
Gro
up
Cam
bod
iaC
ogen
erat
ion
Und
iscl
osed
Acq
uiro
run
spec
ified
26
80
2013
Glo
bal
Bus
ines
s P
ower
P
hilip
pin
esE
lect
ric s
ervi
ces
OR
IX C
orp
Jap
an 1
6520
2013
PT
Cik
aeng
an T
irta
Ene
rgi
Ind
ones
iaE
lect
ric s
ervi
ces
Nip
pon
Koe
i Ja
pan
..90
2013
GM
R E
nerg
yS
inga
por
eE
lect
ric s
ervi
ces
Firs
t P
acifi
c H
ong
Kon
g, C
hina
482
70
2014
Ang
at H
ydro
elec
tric
Pow
er P
lant
Phi
lipp
ines
Ele
ctric
ser
vice
sK
orea
Wat
er R
esou
rces
Cor
pK
orea
, Rep
ublic
of
441
100
2014
Mp
eria
l Pow
erM
alay
sia
Ele
ctric
ser
vice
sE
Pow
er
Sin
gap
ore
11
51
2014
And
aman
Pow
er &
Util
ity
Thai
land
Ele
ctric
ser
vice
sA
ll A
sia
Ass
et C
apita
l H
ong
Kon
g, C
hina
..4.
5
2014
Ken
cana
Bio
Ene
rgy
Sin
gap
ore
Ele
ctric
ser
vice
sE
nco
Hol
din
gs
Mal
aysi
a 5
30
2014
Mas
in-A
ES
S
inga
por
eE
lect
ric s
ervi
ces
Ele
ctric
ity G
ener
atin
g P
CL
Thai
land
453
45
2014
Mya
nmar
Pow
er
Mya
nmar
Ele
ctric
ser
vice
sM
itsui
& C
o Ja
pan
..44
2014
Ikhw
an M
ega
Pow
erIn
don
esia
Ele
ctric
ser
vice
sG
adan
g H
old
ings
Mal
aysi
a 1
60
2014
Sim
e D
arb
y P
ower
Co
Ltd
Thai
land
Ele
ctric
ser
vice
sB
Grim
m P
ower
Thai
land
163
100
2014
Sia
m S
olar
Pow
erTh
aila
ndE
lect
ric s
ervi
ces
Toyo
Tha
i Cor
pTh
aila
nd..
5
2013
Gra
ma
Baz
itaIn
don
esia
Ele
ctric
al w
ork
End
ress
+H
ause
r C
onsu
ltS
witz
erla
nd..
100
2014
Cof
ely
DC
Sin
gap
ore
Ele
ctric
al w
ork
Sue
zFr
ance
..10
0
Wat
er a
nd S
anita
tion
2013
May
nila
d W
ater
Ser
vice
sP
hilip
pin
esW
ater
and
san
itatio
nM
arub
eni C
orp
Jap
an 4
0020
2014
Dew
ata
Ban
gun
Tirt
aIn
don
esia
Wat
er a
nd s
anita
tion
Gad
ang
Hol
din
gsM
alay
sia
570
2014
Pam
Lyo
nnai
se J
aya
Ind
ones
iaW
ater
and
san
itatio
nJa
rdin
e M
athe
son
Hol
din
gs
Hon
g K
ong,
Chi
na..
19
2013
Sai
gon
Wat
er In
fras
truc
ture
Cor
pV
iet
Nam
Wat
er a
nd s
anita
tion
Man
ila W
ater
P
hilip
pin
es 1
531
.47
2013
Uni
ted
Env
irote
chS
inga
por
eW
ater
and
san
itatio
nK
KR
& C
o LP
Uni
ted
Sta
tes
40
11.1
8
2014
Sou
nd G
lob
al
Sin
gap
ore
Wat
er a
nd s
anita
tion
Bei
jing
San
ghua
Env
i Tec
h D
vlp
Chi
na 1
31.
55
2013
Sal
con
Dar
co E
nviro
nmen
tal
Sin
gap
ore
Wat
er a
nd s
anita
tion
Sal
con
Mal
aysi
a 2
040
2014
Pan
Pac
ific
Cor
pV
iet
Nam
Wat
er a
nd s
anita
tion
TAE
LM
alay
sia
12
20
Tran
spor
tatio
n
2013
Vie
tnam
Kum
ho A
sian
a P
laza
Sai
gon
Vie
t N
amH
ighw
ay a
nd s
tree
t co
nstr
uctio
nA
sian
a A
irlin
esK
orea
, Rep
ublic
of
67
50
2014
Bie
n H
oa V
ung
Tau
Exp
ress
way
Dev
pV
iet
Nam
Hig
hway
and
str
eet
cons
truc
tion
Und
iscl
osed
Acq
uiro
run
spec
ified
..10
2014
Rac
h M
ieu
Brid
ge B
OT
Vie
t N
amB
ridge
and
hig
hway
con
stru
ctio
nU
ndis
clos
ed A
cqui
ror
unsp
ecifi
ed 2
25
2014
UFI
S A
irpor
t S
olut
ions
Sin
gap
ore
Airp
orts
and
airp
ort
term
inal
ser
vice
sA
mad
eus
IT H
old
ing
Sp
ain
..10
0
2013
Jaka
rta
Mon
orai
l In
don
esia
Loca
l and
sub
urb
an t
rans
itO
rtus
Hol
din
gs
Sin
gap
ore
..90

Chapter 2: Infrastructure investment and private sector players in ASEAN
77
Tab
le 2
.8.
Asia
n c
om
pan
ies a
re a
cti
ve i
n i
nfr
astr
uctu
re M
&A
acti
vit
y i
n A
SE
AN
(S
ele
cte
d c
ases),
20
13
–20
14
(c
on
dlu
de
d)
2014
Klik
Eat
Ind
ones
iaIn
don
esia
Loca
l and
sub
urb
an t
rans
itYu
me
No
Mac
hi S
ouzo
u Li
nkai
Ja
pan
..36
.4
Year
Targ
et
com
pan
yTa
rget
nati
on
Targ
et
ind
ust
ryU
ltim
ate
acq
uir
ing c
om
pany
Ult
imate
acquir
ing n
ati
on
Valu
e
($ m
illio
n)
Share
acquir
ed
(%)
Tele
com
mun
icat
ion
2013
Infr
atec
h In
don
esia
In
don
esia
Rad
iote
lep
hone
com
mun
icat
ion
Bab
el In
vest
men
t U
nite
d K
ingd
om..
70
2013
Late
lzC
amb
odia
Rad
iote
lep
hone
com
mun
icat
ion
Axi
ata
Gro
up
Mal
aysi
a 1
5510
0
2013
Hut
chis
on C
P T
elec
omm
unic
atio
nsIn
don
esia
Rad
iote
lep
hone
com
mun
icat
ion
Inve
stor
Gro
upIn
don
esia
..35
2013
Sot
elco
C
amb
odia
Rad
iote
lep
hone
com
mun
icat
ion
Huo
t Va
ntha
nC
amb
odia
..90
2014
YuuZ
oo C
orp
Sin
gap
ore
Rad
iote
lep
hone
com
mun
icat
ion
Con
tel C
orp
Chi
na 2
610
0
2014
True
Cor
pTh
aila
ndR
adio
tele
pho
ne c
omm
unic
atio
nC
hina
Mob
ile C
omm
unic
atio
n C
orp.
Chi
na 8
8223
.36
2014
Axi
s Te
leko
m In
don
esia
Ind
ones
iaR
adio
tele
pho
ne c
omm
unic
atio
nIn
vest
or G
roup
Ind
ones
ia 8
6510
0
2014
XL
Axi
ata
- Te
leco
ms
Tow
ers
Ind
ones
iaR
adio
tele
pho
ne c
omm
unic
atio
nS
olus
i Tun
as P
rata
ma
Ind
ones
ia 4
5910
0
2014
CM
C C
omm
unic
atio
nsS
inga
por
eR
adio
tele
pho
ne c
omm
unic
atio
nTE
E In
tern
atio
nal
Sin
gap
ore
..20
2013
Dig
ital P
ort
Asi
a Th
aila
ndTe
lep
hone
com
mun
icat
ion
NTT
Jap
an..
74
2013
Kan
g JS
CV
iet
Nam
Tele
pho
ne c
omm
unic
atio
nM
ox T
elec
omG
erm
any
..65
2013
Ner
a Te
leco
mm
unic
atio
nsS
inga
por
eTe
lep
hone
com
mun
icat
ion
Nor
thst
ar E
qui
ty P
artn
ers
Ind
ones
ia 5
3.32
2014
Pro
pel
Net
wor
kM
alay
sia
Tele
pho
ne c
omm
unic
atio
nK
YO
CE
RA
Cor
pJa
pan
..50
2014
CM
C C
omm
unic
atio
nsTh
aila
ndTe
lep
hone
com
mun
icat
ion
TEE
Inte
rnat
iona
lS
inga
por
e..
20
2013
Sol
usi T
unas
Pra
tam
aIn
don
esia
Com
mun
icat
ion
serv
ices
Cah
aya
Anu
gera
h N
usan
tara
Hon
g K
ong,
Chi
na 2
97.
46
Sou
rce:
UN
CTA
D, U
NC
TAD
M&
A D
atab
ase.

ASEAN INVESTMENT REPORT 2015: Infrastructure Investment and Connectivity
78
Japanese MNEs such as Chubu Electric Power, Orix, Nippon Koei and Mitsui acquired electricity-related companies in ASEAN. Yume No Machi Souzou Linkai acquired companies in transportation; and NTT and Kyocera acquired companies in telecommunication. European MNEs such as Babel (United Kingdom) and Mox Telecom (Germany) also made acquisitions in telecommunication.
The infrastructure development in ASEAN Member States evolved differently. MNEs’ participation in infrastructure development in the region is dominated by greenfield activities, in particular through non-equity modalities (NEMs) (WIR 2011).
2.4.3. Participation through NEMs
Concessionary arrangements and contracts, a form of NEM, continue to dominate in infrastructure sectors. They are key features of MNEs’ participation in infrastructure development in ASEAN. Participation through NEMs is significant and overwhelmed FDI numbers, which have consistently under reported MNEs’ participation in infrastructure development. Much of the under-reporting arises from the data collection methodology, which does not capture non-equity forms of participation such as concessions and contracts (box 2.6).
Infrastructure MNEs may decide to serve an ASEAN host market through FDI or M&As or through NEMs. Through NEMs, MNEs participate in infrastructure development by providing trade in services and construction services. In assessing the role of MNEs in infrastructure in ASEAN, it is therefore important to reflect on the different forms of MNEs’ participation.
Box 2.6. FDI statistics do not capture the full extent of investments in infrastructure
When it comes to investment in infrastructure, users of FDI statistics are often puzzled by the numbers reported. They read about billions of dollars spent on infrastructure development yet see little evidence of it in the FDI statistics of many countries.
This anomaly arises because of a number of methodological and definitional issues in relation to reporting on infrastructure investment. A significant amount of infrastructure activities occur on a contractual basis; they are not captured through FDI accounting. Services provided in development of infrastructure are captured under trade in services and not in FDI. In addition, investments in infrastructure are also dispersed in other foreign investments (through bilateral and multilateral loans of governments, including ODA grants), a small amount of foreign portfolio investment (bonds and individual investments through specialized investment funds), commercial loans, private domestic investments and PPP arrangements.
Accounting for FDI in infrastructure is made more difficult because there is no single industrial classification for infrastructure. The data must be culled from different industrial classifications in ISIC Rev4. Infrastructure such as railroads and harbours developed by a mining company appears as an investment in mining rather than in an infrastructure classification such as transportation. There is also the factor of errors and omissions in data compilation, especially related to construction based on EPC contracts associated with infrastructure, including many types of investment in real estate development (e.g. industrial estates, commercial, retail, recreational, free trade zones).
Source: Richards (2015).

Chapter 2: Infrastructure investment and private sector players in ASEAN
79
The use of a consortium model is also a common strategy among MNEs, particularly for huge and complex projects. Such joint efforts help pool resources, finance and skills to manage and build large projects. It is also a model that could improve the chances of winning concessions in some countries. Consortium-based projects include the partnership of AES (United States), Posco Power (Republic of Korea) and China Investment Corporation for the Mong Duong II independent power producer (IPP) project in Viet Nam. Another is the consortium of Électricité de France International, EGCO (Electricity-Generating Public Company; Thailand), Italian-Thai Development (Thailand) and the Government of Lao PDR for the Nam Theun 2 hydropower project in Lao PDR. The consortium arrangement is also common with megaprojects such as the construction of mass transit systems and in ICT projects in ASEAN.
2.5. Infrastructure players
Infrastructure players in ASEAN differ in behaviour, background and aspiration. They can be categorized as the public and private sectors, the local and foreign private sectors, developed and developing countries, and ODA donors and various types of financiers, including companies participating in different segments of infrastructure value chains. For instance, the public sector invests in infrastructure for general public benefits and national economic interests, while the private sector invests to generate a return and increase shareholders’ wealth. The different categories of players have different perceptions of the economic values of projects, different risk-return attitudes, different skill sets, different motivations, and different commitments to the development of public and welfare infrastructure-related services.
Technological development, environmental awareness and the use of integrated business models by MNEs are also broadening the categories of players. The increasing use of green and renewable technology has provided opportunities for new players to enter the power industry in generating electricity. Solution or equipment providers have entered at higher points in the value chain of the infrastructure industry rather than remaining confined to simply manufacturing and providing equipment to other players higher up in the chain. Gunkul Engineering (Thailand), a supplier of electrical equipment for power transmission and distribution, is moving into power generation and is making the production of renewable energy its core business. It has power generation activities in Myanmar. The company expects revenues from its power-generating business to surpass those from sales of equipment by 2018.29 Similarly, Sarawak Cable (Malaysia) not only manufactures and provides electrical equipment to power plants and transmission line developers but has also invested in power generation in Indonesia.
Government policy towards promoting the generation of electricity from renewable energy sources such as solar power has also provided opportunities for new players to enter the electricity market in ASEAN. Companies such as GE and Alstom not only produce equipment and machinery for power-generating or EPC companies but also are involved in the electricity generation segment of the value chain themselves. Natural resource
ASEAN INVESTMENT REPORT 2015: Infrastructure Investment and Connectivity
80
extractive companies such as Bukit Asam (Indonesia), Petronas (Malaysia), PTT (Thailand) and Pertamina (Indonesia) are also involved with downstream electricity generation.
Given the huge future investment needs, limited public budgets and significant national infrastructure plans of ASEAN Member States, the private sector is encouraged to play a greater role in infrastructure development through direct investment, concessionary arrangements and PPPs.
2.5.1. Public versus private sector
In many ASEAN Member States, the public sector continues to account for the lion’s share of infrastructure spending, albeit with declining contributions over time. In Indonesia, the public sector accounted for about two-thirds and the private sector one-third of infrastructure spending. In some infrastructure sectors such as telecommunication and electricity generation, the private sector role has become more dominant and the public sector role smaller.
In social areas such as education, water supply and health care, the public sector continues to be the main player, with private participation limited by low prospects for obtaining attractive economic returns. In contrast, private participation in telecommunication has been overwhelming because of the opportunities for obtaining attractive returns on investment.
2.5.2. Infrastructure players: developed versus developing economies
MNEs from both developed and developing economies participate in infrastructure development in ASEAN (table 2.9). The former continues to play an important role in the region and the latter has become more visible. Traditionally, MNEs from developed countries have dominated the infrastructure landscape across the region. They faced few challenges. In more recent times, with the emergence of new players from Asia and ASEAN, that landscape has changed.
Backed by their ownership advantages, knowledge, brand names and financial capacity, MNEs from developed countries were the partners of choice for building infrastructure in the region in the past. Over time, infrastructure companies from developing economies such as the Republic of Korea and Hong Kong (China) have participated in infrastructure projects in the region. In more recent times, new sources of players from within the region and China became notable contributors.
The number of actors operating or investing in the region’s infrastructure industry is now more diversified than in the past. However, infrastructure-related MNEs continue to invest and some have expanded their presence across the region. Examples from developed countries include J-Power (Japan), AES (United States), Sumitomo (Japan), GDF Suez (France), Siemens (Germany), ABB (Switzerland), APR Energy (United States), Mitsui (Japan), GE (United States) and Marubeni (Japan) (table 2.10).

Chapter 2: Infrastructure investment and private sector players in ASEAN
81
Table 2.9. MNEs from both developed and developing economies participate in ASEAN infrastructure development (Selected cases)
MNEs Key Projects
Developed economies
Japan
Power and electricity
Sumitomo Corporation EPC contract to build a 1,000 MW ultra-supercritical coal-fired power plant in Manjung, Malaysia
Mitsubishi CorporationDelivery of two 600 MW supercritical steam turbines and generators for the upcoming Vinh Tan 4 thermal power project in Binh Thuan Province of Viet Nam
Itochu Corporation and Kyushu Electric Power Company
Construction works on the $1.6 billion geothermal power plant in Sarulla, North Sumatra Province, Indonesia
ToshibaAs part of a consortium, contract to deliver two 600 MW supercritical steam turbines and generators for the upcoming Vinh Tan 4 thermal power project in Binh Thuan Province of Viet Nam
Electric Power Development Company Developing a gas turbine–based power project in Ayutthaya in Thailand
Marubeni Several power, transport and plant projects in Myanmar, Thailand, Indonesia and the Philippines
Transport
Sumitomo Mitsui Construction Constructing Viet Nam’s longest sea bridge, linking Haiphong City to Lach Huyen Port
Mitsui Company Limited Operating the first container terminal at Kalibaru Port in North Jakarta, Indonesia
Tokyu Corporation Constructing three elevated stations in Phase I of Jakarta’s north−south MRT corridor project
Obayashi Corporation and Shimizu Corporation
Constructing a 5.9 km underground tunnel and implementing two underground construction packages for Jakarta’s north−south MRT corridor project
Takenaka Corporation Developing Terminal 3 of the Ninoy Aquino International Airport in the Philippines
Telecommunication
NTT Docomo, Softbank and KDDI Involved in telecommunication infrastructure in the region
United States
Power and electricity
Ormat InternationalConstruction works on the $1.6 billion geothermal power plant in Sarulla, North Sumatra Province, Indonesia
APR Energy Developing a 100 MW power generation plant in Myanmar
AES Corporation Developing the 630 MW Masinloc power plant in the Philippines
GE Developing a wind grid in Viet Nam
Xylem Contract to supply customized pumps for the 1,285 MW Xayaburi dam project
ACO Investment Group Developing two 150 MW solar energy plants worth $480 million in Myanmar
SunEdison Developing solar energy plants in Malaysia
Open Systems International Providing energy management equipment, supervisory control and a data acquisition/energy management system at load dispatch centres across Viet Nam
Transport
GE Contract to supply 40 engines for Boeing 787 Dreamliners owned by Vietnam Airlines
Boeing Corporation Contract to supply 80 Boeing 737 jets from Singapore-based BOC Aviation Limited
European Union
Power and electricity
Alstom (France)
Supplying the turbine and generator for a 27 MW power plant in Iloilo Province, the Philippines; contracts worth 422.98 billion dong with the National Power Transmission Corporation to supply power equipment and materials for the 500 kV My Tho and 220 kV Vinh Tan substations in southern Viet Nam; supplying three-phase shunt reactors for the Hongsa power plant in Lao PDR

ASEAN INVESTMENT REPORT 2015: Infrastructure Investment and Connectivity
82
MNEs Key Projects
Prysmian Power Link SRL (Italy) Connecting Phu Quoc Island, Viet Nam, to the national grid on an EPC basis
Conergy AG (Germany)Commissioned the first phase (13 MW) of a 22 MW solar photovoltaic project on a turnkey basis in the San Carlos Economic Zone of San Carlos City, the Philippines
Statkraft Norfund Power Invest AS (Norway) Developing several greenfield power projects in the Philippines
Transport
Alstom Transport (France) Developing various MRT projects in Bangkok and Singapore
Invensys Rail (United Kingdom) Providing the signalling systems for all three stages of Singpaore’s Downtown Line
Damen (Netherlands) Investing in Vietnamese shipping yards
A.P. Moeller-Maersk (Denmark) Deployed a jack-up rig in Malaysia
Fraport AG (Germany) Developing Terminal 3 of Manila’s Ninoy Aquino International Airport in the Philippines
Vinci Group (France) Holds stakes in key airports of Cambodia
Wright Bus (North Ireland) and Volvo Bus Corporation (Sweden)
Supplying 415 double-decker buses to Singapore by 2017
TUV Rheinland Group (Germany) Involved in the Jakarta monorail system project
Scania (Sweden) Delivering 360 city buses to Malaysia’s State-owned Syarikat Prasarana Negara Berhad
Telecommunication
Telenor (Norway) Providing telecommunication services in Myanmar
Developing economies
China
Power and electricity
China Southern Grid International Constructing the Nam Tha 1 hydropower dam in Bokeo Province in Lao PDR
China Huadian Corporation Constructing a 338 MW hydropower dam in Mondol Seima district in Cambodia; developing the $630 million Phase I of the biggest power plant in Bali, Indonesia
China National Heavy Machinery CorporationDeveloping the Phnom Penh–Sihanoukville transmission line and East Phnom Penh–Neakleung–Svay Rieng transmission line in Cambodia
China Datang Corporation Developing the 120 MW Atai hydropower plant, along with its transmission line, in Cambodia
Hydrolancang International Company Constructing the 530 MW Hlawga power plant in Myanmar
Hanergy Group Holding Limited Developing a 1,400 MW hydropower plant along the Thanlwin River in Myanmar
Southern Power Grid Company Limited and China Power International Holdings Limited
EPC contract for the $2 billion, 1,200 MW Vinh Tan 1 coal-fired power plant in Viet Nam
Yingli Energy Setting up a 5 MW ground-mounted solar photovoltaic project in Thailand
Guangdong No. 3 Water Conservancy Constructing three hydropower dams on the Nam Ma River in Houaphanh Province in Lao PDR
Transport
China Railway Group Constructing a railway link, a steel plant, and a seaport in Cambodia; developing Line 2A of the Hanoi Metro
Guangxi Beibu International Port Group Expanding the Kuantan Port in Pahang in Malaysia
Changchun Bombardier Railway Vehicles Supplying 73 units of C951 three-car trains for the driverless Downtown Line of Singapore’s MRT
CSR Qingdao SifangContract to supply 91 four-car driverless train sets for the Thomson Line and the Eastern Region Line of the Singapore MRT
China Merchants Group Developing the Tanjung Sauh Port, Batam Island, in Indonesia
Changchun Railway Vehicles and China Communications Construction Company
Involved in Indonesia’s first monorail system in Jakarta
China CAMC Engineering Company Limited Expanding the Luang Prabang International Airport in Lao PDR
CNR Group’s Dalian Locomotive & Rolling Stock Company
Supplying trains for the PhP 3.77 billion Metro Rail Transit Line 3 capacity expansion project
Table 2.9. MNEs from both developed and developing economies participate in ASEAN infrastructure development (Selected cases) (continued)

Chapter 2: Infrastructure investment and private sector players in ASEAN
83
MNEs Key Projects
China Harbour Engineering Company Limited Undertaking Phase I of the Samalaju Port project in Sarawak, Malaysia
Shanghai Tunnel Engineering CompanyConstructing 7 km twin tunnels from Woodlands to the Mandai depot on the Thomson Line in Singapore; contract for the Shenton Way station and associated tunnels
China National Petroleum Corporation Constructing a deep-sea port on Madae Island, in Rakhine State, Myanmar
China Railway No. 5 Engineering Group Company Limited
Building the Fourth Friendship Bridge on the Mekong River across the Lao PDR and Thailand border
Yunnan Sunny Road and Bridge Company Limited
Constructing Road No. 13 North in Lao PDR
Telecommunication
Huawei and ZTE Providing telecommunication services in various ASEAN Member States
China Telecom Global Limited; China Telecommunications Corporation; China Mobile International
Developing the 8,900 km Southeast Asia–Japan Cable system linking Brunei Darussalam, mainland China, Hong Kong (China), Japan, Singapore and the Philippines
Republic of Korea
Power and Electricity
BKB Company Limited Developing a 500 MW power plant at Thaketa in Myanmar
Korean Electric Power Corporation Building two greenfield 100 MW power plants inside the Naga Power Plant Complex in the city of Naga in southern Cebu
Hyundai Engineering Company Constructing a 47 MW hydropower plant in Indonesia
Daelim Industrial CompanyEPC contract to build a 1,000 MW, ultra-supercritical, coal-fired power plant in Manjung, Malaysia; EPC contractor for Phase I of the PhP 13 billion 210 MW coal-fired power plant in Maasim, Sarangani in the Philippines
Doosan Heavy Industries and ConstructionDelivering two 600 MW supercritical steam turbines and generators for the upcoming Vinh Tan 4 thermal power project in Binh Thuan Province of Viet Nam; contractor for the 1,200 MW Nghi Son 2 thermal power plant in the northern province of Thanh Hoa
SK Engineering and Construction and Korea Western Power
Developing the 410 MW Sapien-Senamnoi hydroelectric project in Thailand; developing an electricity transmission line connecting the 410 MW Xe Pian Xe Namnoy hydropower plant in Lao PDR to a substation in Ubon Ratchathani, Thailand
South Korea Electric Power Corporation Developing the 1,200 MW Nghi Son 2 thermal power plant in Viet Nam
KTC Cable Developing the Kampong Cham−Kampong Thom−Siem Reap line and a substation at Kampong Thom
Transport
Lotte Engineering and Construction Constructing the first section of the 140km Da Nang−Quang Ngai Expressway in Viet Nam
Samsung C&T CorporationDeveloping the third phase of Singapore’s LNG terminal located in Jurong Island; building the Caldecott station on Singapore’s MRT
Daelim Industrial Company LimitedDeveloping an 8.5 km elevated rail system in Hanoi; contract for the Outram Park station and associated tunnels in Singapore; constructing the Sungai Brunei Bridge in Brunei Darussalam
Daewoo Engineering and Construction Company Limited
Undertaking various MRT projects in Singapore
Water supply and sanitation
Korea Water Resources CorporationDeveloping drinking water treatment projects in Bali, Gresik and Semarang in Indonesia; undertaking flood prevention project in Thailand
Source: UNCTAD, based on Southeast Asia Infrastructure Research.
Table 2.9. MNEs from both developed and developing economies participate in ASEAN infrastructure development (Selected cases) (concluded)

ASEAN INVESTMENT REPORT 2015: Infrastructure Investment and Connectivity
84
Subsidiary/plant Location Activities Sector
Eastern Power and Electric Company Thailand IPP in Bang Po Electricity
Marubeni Asian Power Singapore Marketing and development of power projects in the Asia Pacific region
Electricity
Cirebon Electric Power Indonesia IPP in Cirebon Electricity
Jawa Power Indonesia IPP in Paiton Electricity
Matlamat Cakera Canggih Indonesia Marketing, development, contracting and project execution of power projects in Indonesia Electricity
San Roque Power Corporation Philippines Hydro IPP in Luzon Electricity
Senoko Energy Singapore IPP in Singapore Electricity
TeaM Energy Corporation Philippines Holding company for the Ilijan, Pagbilao and Sual power plants in the Philippines
Electricity
Maynilad Water Services Philippines Providing water and wastewater services to the 17 municipalities in the West Zone of Metro Manila and its vicinities
Water and sanitation
Eastern Sea Laem Chabang Terminal Thailand Container terminal operation Port
Megalopolis Manunggal Industrial Development Indonesia
Development, sale and management of MM 2100 industrial town
Industrial infrastructure
Source: UNCTAD, based on information from Marubeni’s website.Note: IPP = independent power producer.
Table 2.10. Marubeni: Participation in infrastructure development across ASEAN (Selected cases)
Developing economies’ infrastructure companies such as those from Hong Kong (China) and the Republic of Korea expanded their operations in ASEAN by winning concessions and through a complex structure of investment ownership (box 2.7). The emergence and growing presence of Chinese infrastructure companies in the region has also contributed to the significance of developing economies’ MNEs in ASEAN’s infrastructure development.
Box 2.7. Infrastructure participation by a complex MNE group in ASEAN
First Pacific, headquartered in Hong Kong (China), is a conglomerate with significant investment operations in various industries in ASEAN. In infrastructure, it has extensive operations in roads, power, water, hospitals, rail and telecommunication. Through a complex group and affiliates relationship, First Pacific has a strong interest in infrastructure activities in ASEAN Member States (box figure 2.7.1).
All these subsidiaries, incorporated in the Philippines and Singapore, are major investors in infrastructure assets in their own right. They invest in and expand infrastructure assets locally and in some cases overseas. Through a subsidiary, for example, Metro Pacific Investments (Philippines) has toll road operations in Thailand on the Don Muang Tollway; it has power business in Singapore through FPM Power and Meralco.

Chapter 2: Infrastructure investment and private sector players in ASEAN
85
2.5.2.1. Prominence of Chinese MNEs
Chinese infrastructure-related companies are rapidly becoming more prominent in the infrastructure development landscape in ASEAN. They have participated in building infrastructure across all sectors in the region. These players are not only operating as contractors but also are investing in and owning infrastructure.
Chinese companies have become notable players in building infrastructure in ASEAN in a very short period of time. Some have an extensive regional presence built by establishing subsidiaries. Although most of these companies are State-owned enterprises, Chinese private companies such as Huawei also participate. In 2014, 62 Chinese companies were among the top 250 international contractors in terms of international revenues, and a majority of these companies have built infrastructure projects or are expanding their operations in ASEAN (table 2.11).
Box figure 2.7.1. Complex involvement of First Pacific in infrastructure activities in ASEAN
Source: UNCTAD and ASEAN Secretariat, based on company’s information and MPIC (http://www.mpic.com.ph/investments/).
First Pacific(Hong Kong,
China)
PLDT(25.6%)
(Philippines)
Metro Pacific Investments Corporation (MPIC) (52.1%, Philippines)
FPM PowerHoldings
(68%, Singapore)
Pacific LightPower
(70%, Singapore)
Manila NorthTollways
(75.6%, Philippines)
Cavite InfraGroup
(100%, Philippines)
Don MuangTollway
(29.4%, Thailand)
Meralco(34.9%,
Philippines)
Beacon(50% direct)
(50% by PLDT)(Philippines)
Maynilad(52.8%,
Philippines)
Metropac WaterInvestment
(100%, Philippines)
AF Payments(20%, Philippines)
Light RailManila
(55%, Philippines)
Metro PacificHospitals Holdings
(60%, Philippines)
15%Directly ownedby MPIC as well
Telecommunication Infrastructure Natural resources
Toll roads Power Water Rail Hospitals
Box 2.7. Infrastructure participation by a complex MNE group in ASEAN (concluded)

ASEAN INVESTMENT REPORT 2015: Infrastructure Investment and Connectivity
86
Com
pan
yS
ele
cte
d A
SE
AN
Mem
ber
Sta
te locati
on
s of
con
tracts
AS
EA
N loca
tion o
f se
lect
ed s
ubsi
dia
ries
Chi
na C
omm
unic
atio
ns C
onst
ruct
ion
Gro
upC
amb
odia
, In
don
esia
, Mal
aysi
a, M
yanm
ar, P
hilip
pin
es, S
inga
por
e, V
iet
Nam
Indo
nesi
a, P
hilip
pine
s, S
inga
pore
,
Sin
ohyd
ro G
roup
Bru
nei D
arus
sala
m, I
ndon
esia
, Lao
PD
R, M
alay
sia,
Sin
gap
ore,
Tha
iland
, Vie
t N
am..
Chi
na S
tate
Con
stru
ctio
n E
ngin
eerin
g C
orp
orat
ion
Ind
ones
ia, M
alay
sia,
Phi
lipp
ines
, Sin
gap
ore,
Thai
land
, Vie
t N
amIn
done
sia,
Phi
lippi
nes,
Sin
gapo
re, T
haila
nd, V
iet N
am
Chi
na N
atio
nal M
achi
nery
Ind
ustr
y C
orp
C
amb
odia
, Ind
ones
ia,
Lao
PD
R, M
alay
sia,
Lao
PD
R, P
hilip
pin
es, T
haila
nd, V
iet
Nam
Mal
aysi
a
Chi
na R
ailw
ay G
roup
A n
umb
er o
f AS
EA
N M
emb
er S
tate
sS
inga
pore
, Tha
iland
CIT
IC C
onst
ruct
ion
Ind
ones
ia, P
hilip
pin
es, T
haila
nd, V
iet
Nam
Cam
bodi
a, S
inga
pore
Chi
na M
etal
lurg
ical
Gro
upA
num
ber
of A
SE
AN
Mem
ber
Sta
tes
..
Chi
na R
ailw
ay C
onst
ruct
ion
Cor
por
atio
n Li
mite
dA
num
ber
of A
SE
AN
Mem
ber
Sta
tes
..
Sep
coiii
Ele
ctric
Pow
er C
onst
ruct
ion
Ind
ones
ia, P
hilip
pin
es, S
inga
por
e, V
iet
Nam
..
Chi
na G
ezho
uba
Gro
up C
omp
any
Cam
bod
ia, I
ndon
esia
, Lao
PD
R, M
yanm
ar, T
haila
ndM
alay
sia,
Sin
gapo
re, T
haila
nd
SE
PC
O E
lect
ric P
ower
Con
stru
ctio
nIn
don
esia
Indo
nesi
a
Chi
na C
ivil
Eng
inee
ring
Con
stru
ctio
n C
amb
odia
, Mal
aysi
a, S
inga
por
e, T
haila
nd, V
iet
Nam
Indo
nesi
a, S
inga
pore
Sha
ngha
i Ele
ctric
Gro
upIn
don
esia
, M
alay
sia,
Phi
lipp
ines
, Vie
t N
amIn
done
sia,
Mal
aysi
a, P
hilip
pine
s, S
inga
pore
, Tha
iland
, Vi
et N
am
Chi
na G
ener
al T
echn
olog
yIn
don
esia
, Mya
nmar
, Vie
t N
amM
yanm
ar
Chi
na N
atio
nal C
hem
ical
Eng
inee
ring
Gro
upIn
don
esia
, Mal
aysi
a, V
iet
Nam
Indo
nesi
a, M
alay
sia,
Phi
lippi
nes,
Sin
gapo
re,T
haila
nd,
Viet
Nam
Chi
na In
tern
atio
nal W
ater
& E
lect
ric C
orp
Ind
ones
ia, L
ao P
DR
, Mal
aysi
a, M
yanm
ar, P
hilip
pin
es, T
haila
nd, V
iet
Nam
..
CG
C O
vers
eas
Con
stru
ctio
n G
roup
Ind
ones
iaIn
done
sia
Sin
opec
Eng
inee
ring
(Gro
up)
Ind
ones
ia, M
alay
sia,
Mya
nmar
, Sin
gap
ore,
Tha
iland
, Vie
t N
amS
inga
pore
Don
gfan
g E
lect
ric C
orp
.In
don
esia
, Mal
aysi
a, V
iet
Nam
..
Qin
gjia
n G
roup
P
hilip
pin
es, S
inga
por
e, T
haila
nd, V
iet
Nam
Sin
gapo
re
Sha
ngha
i Con
stru
ctio
n G
roup
Cam
bod
ia, I
ndon
esia
, Lao
PD
R,
Mal
aysi
a, P
hilip
pin
es,
Sin
gap
ore,
Tha
iland
, Vie
t N
amIn
done
sia,
Mal
aysi
a, P
hilip
pine
s, S
inga
pore
, Tha
iland
, Vi
et N
am
Chi
na G
eo-E
ngin
eerin
gC
amb
odia
, Lao
PD
RLa
o P
DR
Chi
na J
iang
su In
tern
atio
nal E
con
and
Tec
hnic
al
Sin
gap
ore
..
Bei
jing
Con
stru
ctio
n E
ngee
ring
Gro
up
Mal
aysi
a, P
hilip
pin
es, S
inga
por
e, T
haila
nd, V
iet
Nam
Mal
aysi
a, P
hilip
pine
s, S
inga
pore
, Tha
iland
, Vie
t Nam
Chi
na D
alia
n In
tern
atio
nal E
cono
mic
and
Tec
hnic
al C
orp
.M
alay
sia,
Sin
gap
ore
..
Anh
ui C
onst
ruct
ion
Eng
inee
ring
Gro
upLa
o P
DR
, Tha
iland
, Vie
t N
amTh
aila
nd
Chi
na A
lum
inum
Inte
rnat
iona
l Eng
inee
ring
Mal
aysi
a, V
iet
Nam
..
Chi
na Y
unan
Con
stru
cutio
n E
ngin
eerin
g G
roup
Cam
bod
ia, L
ao P
DR
, M
alay
sia,
Mya
nmar
, Tha
iland
, Vie
t N
amC
ambo
dia,
Lao
PD
R, T
haila
nd
Zho
ngd
ing
Inte
rnat
iona
l Eng
inee
ring
Ind
ones
ia, M
alay
sia,
Tha
iland
..
Sin
oste
el E
qui
pm
ent
and
Eng
inee
ring
Co
Ind
ones
ia, M
alay
sia,
Tha
iland
, Vie
t N
amS
inga
pore
Chi
na H
uanq
iu C
ontr
actin
g &
Eng
inee
ring
Ind
ones
ia, S
inga
por
eIn
done
sia,
Sin
gapo
re
Jian
gsu
Zho
ngxi
n C
onst
rucu
tion
Sin
gap
ore,
Vie
t N
am..
Wei
hai I
nter
natio
nal E
cono
mic
& T
echn
ical
Coo
per
ativ
eM
alay
sia,
Sin
gap
ore
..
Inte
rnat
iona
l Co.
of Y
anjia
n G
roup
M
alay
sia
..
Chi
na N
atio
nal C
omp
lete
Pla
nt Im
por
t &
Exp
ort
Cor
pIn
don
esia
, Mya
nmar
, Vie
t N
amVi
et N
am
Sou
rce:
UN
CTA
D 2
015b
, bas
ed o
n co
mp
anie
s’ in
form
atio
n, O
rbis
and
Eng
inee
ring
New
s-R
ecor
d.
Tab
le 2
.11
.M
ajo
r C
hin
ese i
nte
rnati
on
al
con
tracto
rs h
ave a
pre
sen
ce i
n A
SE
AN

Chapter 2: Infrastructure investment and private sector players in ASEAN
87
Many Chinese companies are involved with power projects in ASEAN either as EPC contractors or as subcontractors (NEMs). These companies include Sinohydro Corporation, Three Gorges Corporation, Huaneng Group, Gezhouba Corporation, Guodian Corporation, State Grid Corporation, Datang Corporation and China Southern Power Grid. In some ASEAN Member States, such as in the CLMV countries, Chinese companies are the largest investors and contractors of infrastructure projects.
While Chinese companies’ participation in infrastructure development in ASEAN is significant and increasing (box 2.8), the FDI numbers under report the situation as many Chinese companies operate through NEMs. Chinese companies have helped build many recent significant projects across the region, including hydropower plants and dams in Lao PDR; roads, bridges and hydropower plants in Myanmar; ports and land transport infrastructure in Cambodia; industrial estates, bridges and rail lines in Indonesia; power plants in the Philippines; urban rail networks in Viet Nam; and high-speed rail projects in some ASEAN Member States.
Box 2.8. Chinese companies are increasingly a significant force in ASEAN’s infrastructure landscape
More than $50 billion – or an annual average of $10 billion – in infrastructure projects in five ASEAN Member Statesa with expected completion dates between 2013 and 2017 are associated with Chinese companies. In perspective, this is about 17% of the region’s annual infrastructure investment needs in 2015 (if based on $60 billion per year).
Chinese companies are building a 400 km rail line, a steel plant and a seaport in Cambodia, to be completed by 2017. These projects are estimated to be worth a combined $11.2 billion. The China Railway Group is developing the railway line, while Sinomach’s subsidiary China Ocean Engineering Construction is involved with building the port component. Another Sinomach subsidiary (China Perfect Machinery Industry) and Cambodian Petrochemical are jointly building a $2.3 billion oil refinery, to be completed by 2015. With financing facilities provided by the Chinese EXIM Bank, China National Heavy Machinery Company is involved in building the Tatay River hydropower dam, which is expected to cost $540 million, and China Huadian Corporation is building the Lower Stung Russei Chrum hydropower station, which is estimated to cost $580 million. Cambodia plans to build 10 dams between 2010 and 2019, and 6 involve financing from Chinese banks. Chinese companies are also building other infrastructure such as power plants, electricity transmission lines and bridges.
In Indonesia, many Chinese companies are involved in the construction of power plants, ports, road and rail infrastructure through various projects that started in 2012–2013. Chinese investors are developing a China–Indonesia Industrial Investment and Cooperation Zone and other railway projects in the country. Sinopec is building an oil storage terminal in the Batam Free Trade Zone that is estimated to cost about $850 million. China Power Investment and Anhui Conch Cement are involved with a $17 billion hydropower project in North Kalimantan that is to be completed by 2021. Other Chinese companies such as China Railway Group, China Honggiao Group and China Communications Construction Group are involved with transport, power and communication projects in Indonesia. Sinohydro is involved in dam construction; Gezhauba

ASEAN INVESTMENT REPORT 2015: Infrastructure Investment and Connectivity
88
Group and China Power International are building coal and hydropower plants; and Shanghai Construction and China Harbour Engineering are building toll roads in the host country. In recent years, other companies such as China Huadian, Dongfang Electric and Sinohydro have built coal-fired power stations and hydropower plants.
Chinese companies are involved with hydropower, roads and railway projects in Lao PDR. These companies include Sinohydro Group. China and the Lao government are jointly developing a 420 km railway linking the country with Kunming in Yunnan Province. China Three Gorges Corporation and China International Water and Electric Corporation are involved in the Nam Ngiep 1 Hydropower project, which is to be completed by 2019 at an estimated cost of $868 million. China National Electric Engineering Company is building the Laos Hongsa coal-fired power plant, estimated to cost some $1.68 billion. Four of 10 special economic zones (SEZs) in the country were built with Chinese investment or financing:
(i) The Boten Beautiful Land SEZ, built by Yunnan Hai Cheng Industrial Group with an investment amount of $500 million
(ii) The Saysetha Development Zone, a joint venture between a Chinese company, the Lao government and a local Laotian investor involving $128 million
(iii) The Golden Triangle SEZ, through a joint venture of $86.6 million between a Chinese company and the Lao government. In August 2013, a group of Chinese companies opened a complex worth $80 million in this SEZ.
(iv) The Thatluang Lake SEZ, by a Chinese developer, involving $1.6 billion
In Myanmar, Chinese companies have been involved with various infrastructure projects such as railways, ports, dams, oil and gas pipelines, hydropower projects and mining. For instance, China National Petroleum Corporation participated in the construction of the Sino-Burma oil and gas pipeline, Sinohydro in the Hatgyi dam in Karen State and China Power Investment in Chibwenge hydropower plant in Kachin State. Other Chinese companies such as China Non-ferrous Metal Mining Group, Datang Corporation, Huaneng Group, China Three Gorges Corporation, Wanbao Mining Company, Norinco and China Railway Engineering are present in Myanmar.
Chinese companies have been involved with various large-scale infrastructure projects in Malaysia for some time. In recent years, companies such as China Communications and Construction Company and China Harbour Engineering, together with local partners, have constructed the Penang Second Bridge, which was opened in March 2014 at an estimated cost of $1.5 billion. Beijing Urban Construction Group, together with local partners, is involved in various road and tunnel projects in Penang that are estimated to cost some $2.6 billion. China Three Gorges Corporation and Sinohydro continue to participate in various hydropower projects, while companies such as Shougang Group and Prosperity Minerals are involved with steel plant projects. Other companies, such as ZTE and Huawei, have been involved with the development of telecommunication infrastructure in Malaysia. A Chinese company, Guangxi Beibu Gulf International Port Group, is building infrastructure projects, including an industrial park and an expansion of the port in Kuantan State.
Source: ASEAN Investment Report 2014.Note: a Cambodia, Indonesia, Lao PDR, Malaysia and Myanmar.
Box 2.8. Chinese companies are increasingly a significant force in ASEAN’s infrastructure landscape (concluded)

Chapter 2: Infrastructure investment and private sector players in ASEAN
89
A consortium of Indonesian companies, together with China Road and Bridge Corporation (CRBC) and China Harbour Engineering, constructed the 5.4 km, $445 million Suramadu Bridge connecting Surabaya with Madura. CRBC is also involved in the construction of the Cao Lanh Bridge in southern Viet Nam, which is to be completed by 2017. The company also contributed to building the 95 km Cambodia National Road No. 41, which opened in 2015. The Shanghai Construction Group was the main contractor for the construction of Cambodia’s National Road No. 58.30 The China Railway Eryuan Engineering Group is helping to develop a high-speed train line linking Lao PDR to the border town with China. The line will be part of the SKRL and is expected to be completed by 2021.31
In 2015, China expressed interest in investing and providing finance for infrastructure projects in Indonesia. Some $63 billion has been announced in relation to Indonesia’s huge infrastructure plans for 2015–2019 (table 2.12).
2.5.2.2. Increasing participation of ASEAN companies
The numbers of ASEAN companies involved in infrastructure development are increasing, and they are also investing outside the region in other developing countries, strengthening South–South cooperation.
In addition to winning contracts, infrastructure-related companies from Indonesia, Malaysia, the Philippines, Singapore, Thailand and Viet Nam have established subsidiaries in other ASEAN Member States (table 2.13). Some have more intraregional presence than others. In particular, more Malaysian and Singaporean companies are participating in infrastructure projects in the region, with increasing involvement by Thai companies. Infrastructure companies from Indonesia and Viet Nam are increasingly more visible in intraregional infrastructure activities, albeit fewer in their numbers.
ASEAN companies are also owners of infrastructure assets in other ASEAN Member States. In electricity, these companies include EGCO (Thailand), Ratchaburi (Thailand), YTL (Malaysia), Genting (Malaysia), EVN (Viet Nam) and VLP (Viet Nam) (box 2.9). In airports: Malaysia Airports Holding, Muhibbah Engineering (Malaysia), Yongnam Holdings (Singapore). In ports: PSA (Singapore) and International Container Terminal Services (Philippines). In industrial estates: Amata (Thailand) and ITD (Thailand). And in telecommunication: SingTel (Singapore) and Axiata (Malaysia).
Some ASEAN companies supply materials and resources to operate or construct infrastructure assets. These companies include Siam Cement (Thailand), Banpu (Thailand) and Semen Indonesia (Indonesia) (chapter 3).
Financinga 19.8
Electricity 15.3
Industrial estates 10.4
Railways 6.6
Smelting 6.4
Seaports 2.0
Others 2.9
Source: “Indonesia banks on $63 billion from China”, Wall Street Journal, 1 April 2015 (http://www.wsj.com/articles/indonesia-banks-on-63-billion-from-china-1427896422).
a Credit facility for companies involved in multiple sectors.
Table 2.12.Potential Chinese investment and financing in Indonesia(Billions of dollars)

ASEAN INVESTMENT REPORT 2015: Infrastructure Investment and Connectivity
90
Table 2.13. Increasing regional presence from some infrastructure-related companies from ASEAN, 2014
Name of companyHome
countryIndustry
Market capitalization
($ million)
Total revenues ($ million)
ASEAN locations of selected subsidiaries or contract operations
Adhi Karya IndonesiaConstruction, engineering
249 698 Singapore
Axiata Group Malaysia Telecommunication 12,583 5,398 Cambodia, Singapore
Ayala Land Philippines Real estate 10,898 2,011 Malaysia
Bangkok Dusit Medical Services Thailand Hospitals 8,347 1,720 Cambodia, Singapore
Banpu Thailand Mining, electricity 1,607 3,098 Indonesia, Singapore, Thailand
Bukit Asam Indonesia Mining, electricity 948 1,053 Other ASEAN Member States
CapitaLand Singapore Real estate 8,438 3,376 Malaysia, Viet Nam
City Developments Singapore Real estate 5,275 3,118 Indonesia, Malaysia, Myanmar, Philippines, Thailand, Viet Nam
EGAT Thailand Electricity .. 16,508 Lao PDR and Myanmar
EGCO Thailand Electricity .. 78 Indonesia, Lao PDR, Philippines and Thailand
Enco Holdings Malaysia Engineering .. .. Indonesia and Thailand
First Philippine Holdings Corporation
Philippines Conglomerate 2,260 874 Indonesia, Singapore, Thailand
Gamuda Malaysia Infrastructure 2,675 775 Viet Nam
Genting Berhad Malaysia Conglomerate 6,912 5,486 Indonesia, Myanmar, Philippines, Singapore, Thailand
Gunkul Thailand Electricity 660 91 Singapore
IHH Healthcare Malaysia Hospitals 11,457 2,175 Indonesia, Singapore
International Container Terminal Philippines Harbour facilities 3,945 1,119 Indonesia
Intouch Holdings Thailand Telecommunication 6,893 315 Cambodia, Singapore
Italian-Thai Development Thailand Infrastructure 1,231 1,477 Cambodia, Indonesia, Lao PDR, Malaysia, Myanmar, Philippines, Viet Nam
Keppel Corporation Singapore Conglomeratea 9,190 10,086 Indonesia, Malaysia, Myanmar, Philippines, Thailand, Viet Nam
KPJ Healthcare Malaysia Hospitals 1,056 766 Indonesia, Singapore, Thailand
Malaysia Airports Malaysia Airports 2,252 991 Manages airports in Cambodia and outside ASEAN
Manila Water Philippines Water 918 367 Singapore, Viet Nam
Maxis Malaysia Telecommunication 11,985 2,429 Indonesia, Singapore
Metro Pacific Investments Corp. Philippines Road construction 2,997 932 Indonesia, Thailand, Viet Nam
Muhibbha MalaysiaInfrastructure, engineering
.. .. Cambodia, Philippines, Singapore
Nusa Konstruksi Enjiniring Tbk IndonesiaConstruction, engineering
27 165 Malaysia
Philippine Long Distance Telephone
Philippines Telecommunication 12,006 3,832 Malaysia
Port of Singapore Authority Singapore Ports .. 2,877 Indonesia, Thailand and Viet Nam
PTT Thailand Oil and gas 20,174 86,545 Cambodia, Indonesia, Malaysia, Myanmar, Philippines, Thailand, Viet Nam
Ratchaburi Electricity Generating Holding
Thailand Electricity 2,135 1,702 Cambodia, Lao PDR, Singapore
Salcon Singapore Engineering 106 77 Singapore, Viet Nam

Chapter 2: Infrastructure investment and private sector players in ASEAN
91
Table 2.13. Increasing regional presence from some infrastructure-related companies from ASEAN, 2014 (concluded)
Name of companyHome
countryIndustry
Market capitalization
($ million)
Total revenues ($ million)
ASEAN locations of selected subsidiaries or contract operations
San Miguel Philippines Conglomeratea 2,328 17,569 Malaysia, Singapore, Thailand, Viet Nam
Sembcorp Industries Singapore Conglomeratea 4,432 8,317 Indonesia, Malaysia, Philippines, Viet Nam
Semen Indonesia Indonesia Building materials 4,243 2,182 Viet Nam
Siam Cement Thailand Building materials 1,384 14,945 Cambodia, Indonesia, Malaysia, Philippines, Lao PDR, Singapore, Viet Nam
Singapore Telecommunication Singapore Telecommunication 42,060 12,618 Indonesia, Philippines, Malaysia, Philippines, Thailand
Supalai PCL Thailand Real estate 882 566 Philippines, Singapore
Telekom Malaysia Malaysia Telecommunication 6,097 3,256 Indonesia, Singapore
Telekomunikasi Indonesia Indonesia Telecommunication 20,081 7,307 Singapore
Tenaga Nasional Malaysia Electricity 16,103 13,760 Cambodia, Indonesia, Lao PDR, Thailand, Viet Nam
Total Access Communication Thailand Telecommunication 4,445 2,752 Malaysia, Singapore
Truba Alam Manunggal Engineering
IndonesiaConstruction, engineering
57 105 Singapore
United Envirotech Singapore Engineering 1,224 267 Malaysia
UPP Holdings Singapore Electricity 89 88 Malaysia
Viettel Viet Nam Telecommunication .. .. Cambodia, Lao PDR
YTL Malaysia Utilities 4,043 6,245 Cambodia, Indonesia, Singapore, Thailand
Source: UNCTAD 2015b, based on companies’ information and Orbis.Note: real estate includes commercial and industrial estates.a Includes various infrastructure.
Box 2.9. The internationalization of ASEAN power companies
Electricity-Generating Public Company (EGCO), headquartered in Thailand, is involved in generation and sales of electricity in Thailand as well as abroad. The group operated 23 power plants in 2014, with total equity contracted capacity of 3,767 MW in five countries in the Asia Pacific region. Most of the plants are in Thailand, with the group increasingly expanding in Indonesia, Lao PDR and the Philippines. Most of EGCO’s overseas operations in electricity generation and sales are concentrated in ASEAN. The company plans to invest some $1.5 billion in expansion of capacity in Indonesia and the Philippines, and is studying the potential to expand three overseas power projects (namely, the San Buenaventura and Masinloc coal-fired power plants in the Philippines, and the Star Energy geothermal power station in Indonesia). EGCO plans to co-invest with local business partners to expand the existing power plants and acquire commercial operating assets in Lao PDR, the Philippines and Indonesia, where it already has a strong presence. It also looks for new opportunities to invest in other countries such as Myanmar.
Ratchaburi Electricity Generating Holding (Ratchaburi), based in Thailand, also operates overseas through a number of subsidiaries and affiliates. The company aims to be a leading integrated energy company in Asia Pacific, where it currently has significant operations in ASEAN countries. It has a presence in Cambodia, Lao PDR and Singapore. It plans to have more generating businesses in neighbouring countries (Cambodia, Myanmar and Viet Nam), including in other ASEAN countries and in the Asia-Pacific region.

ASEAN INVESTMENT REPORT 2015: Infrastructure Investment and Connectivity
92
ASEAN infrastructure companies are contributing to South–South cooperation and connectivity with other regions. Aside from participating in infrastructure projects in the region, ASEAN companies have contributed to infrastructure development in other developing countries. For instance, some Indonesian and Malaysian companies have constructed infrastructure in a wide range of sectors and in different countries between 2011 and 2015 (table 2.14; box 2.10).
Box 2.10. Tenaga Nasional: Expanding internationally based on horizontal strategy
Tenaga Nasional (Malaysia) aspires to be a regional champion and has a presence in nine countries outside Malaysia.a It has power plant activities in Asia and the Middle East. In ASEAN, it has a presence in Indonesia, Myanmar and Viet Nam. It also has a presence in other developing countries such as in Sri Lanka, Turkey, Kuwait, the United Arab Emirates and Saudi Arabia. The company has representative offices in Jakarta and Hanoi.
In 2014, Tenaga signed an investment agreement with KLS Energy Lanka (Sri Lanka) for a joint development of a 35 MW hybrid wind and solar project in Jaffna, Sri Lanka. The project is expected to be completed in 2016. The EPC contract was awarded to China Machinery Engineering Corporation in 2014.
In 2014, Tenaga was awarded a seven-year O&M contract for the open-cycle gas turbine Plant–1 at the Sabiya power generation and distillation plant, in Kuwait, in partnership with Kharafi National (Kuwait).
Source: Tenaga Nasional, company websites and annual reports.a Tenaga Nasional, Annual Report 2014, p. 28 (http://www.tnb.com.my/tnb/application/uploads/
annualreports/b6e32400d256d64b390a4510bf5be66e.pdf)
Italian-Thai Development (Thailand) is a construction and infrastructure company with activities ranging from ports and rail construction to industrial park development in Thailand, and in other countries in Asia and Africa. It has construction subsidiaries in Malaysia, Myanmar, and the Philippines. In Indonesia, ITD has a subsidiary operating in coal digestion services and in Lao PDR it has one operating in the construction of hydropower plants.
YTL Power International (Malaysia) has overseas activities in a number of countries. In the utilities business, it owns and operates power plants in Indonesia, Malaysia and Singapore. The company is also involved with operations and maintenance (O&M) activities in many other countries, including in Indonesia.
Viet-Lao Power Joint Stock Company (Viet Nam) is involved with eight hydropower plants in Lao PDR and has established three subsidiaries in the host country. It is currently building the Xekaman 1 hydropower plant, which will export 80% of the electricity it generates to Viet Nam.
Tenaga (Malaysia) also has activities in power projects in some ASEAN Member States (see box 2.10)
Source: UNCTAD 2015b, based on companies’ annual reports and corporate information.
Box 2.9. The internationalization of ASEAN power companies (concluded)

Chapter 2: Infrastructure investment and private sector players in ASEAN
93
Table 2.14. Infrastructure-related MNEs from Indonesia and Malaysia are internationalizing: selected projects completed in 2011–2015
Company Home country Project Sector LocationYear of
completionValue
($ million)
Waskita Karya Indonesia
Road infrastructure Transportation Saudi Arabia 2013 ..
Educational building Education Saudi Arabia 2012 ..
Road and bridges Transportation Timor Leste 2013 ..
Wijaya Karya Indonesia
Road infrastructure TransportationPapua New Guinea
2011 ..
Road infrastructure Transportation Brunei Darussalam 2012 ..
Road and bridges Transportation Timor Leste 2012 ..
Hutama Karya Indonesia Power plant Electricity Timor Leste 2011 ..
Pembagunan Perumahan Indonesia Road infrastructure Transportation Timor Leste 2013 ..
Muhibbah Engineering Malaysia Section of airport Transportation Qatar 2012 370
Eversendai Corp Malaysia Airport Transportation Qatar 2012 97
Mudajaya Malaysia Power plant (equipment) Electricity India 2013 588
Sunway Construction Malaysia Highway Transportation India 2012 117
IJM Construction Malaysia
Highway Transportation India 2012 67
Road Transportation India 2012 201
Road Transportation India 2014 9
Road Transportation India 2015 6
UEM Builders MalaysiaRoad Transportation India 2012 78
Highway Transportation Indonesia 2015 641
MTD Construction Malaysia
Sewer Water and sanitationUnited Arab Emirates
2013 19
Highway Transportation Indonesia 2015 371
Highway Transportation China 2014 429
WCT Engineering MalaysiaHighway Transportation Oman 2015 ..
Airfield paving - road Transportation Qatar 2012 74
Gamuda MalaysiaBridges Transportation Bahrain 2011 627
Sewerage treatment Water and sanitation Viet Nam 2012 390
Bina Puri MalaysiaWater pipe Water and sanitation Saudi Arabia 2013 6
Power plant Electricity Indonesia 2015 10
Zelan Malaysia Power plant Electricity Indonesia 2012 486
HG Power Transmission Malaysia
Power transmission lines ElectricityPapua New Guinea
2012 1
Power transmission lines Electricity Bangladesh 2012 9
Power transmission lines Electricity Bangladesh 2014 5
Power transmission lines Electricity Indonesia 2012 20
Power transmission lines Electricity Bangladesh 2015 23
Scomi MalaysiaMonorail system Railway India 2011 607
Monorail system Railway Brazil 2014 621
Ho Hup Construction MalaysiaRoad Transportation Iraq 2015 20
Water treatment system Water and sanitation Iraq 2015 87
Puncak Niaga Malaysia Water treatment system Water and sanitation China 2011 5
Trans Resources MalaysiaSewer and water works Water and sanitation Australia 2011 13
Airport Transportation Brunei Darussalam 2014 98
Ranhill Water MalaysiaWater treatment system Water and sanitation China 2011 77
Wastewater plant Water and sanitation China 2011 19
Salcon Engineering Malaysia
Water transmission Water and sanitation Viet Nam 2013 22
Water treatment system Water and sanitation India 2013 5
Water treatment system Water and sanitation Thailand 2014 7
Water treatment system Water and sanitation Sri Lanka 2015 18
Source: UNCTAD 2015b, based on information of CIDB (Malaysia).

ASEAN INVESTMENT REPORT 2015: Infrastructure Investment and Connectivity
94
2.5.3. Infrastructure financiers and other players
The various categories of infrastructure financiers all play an important role in providing or arranging finance for infrastructure development in ASEAN. They include ODA donors, MDBs, specialized infrastructure funds, private equity investors, commercial banks and Sovereign wealth funds. A significant part of financing for infrastructure projects in the region comes from these sources.
Multilateral development banks (MDBs) such as the World Bank and Asian Development Bank have been contributing to infrastructure development in the region. The contribution includes concessionary loans and technical assistance grants. For instance, the Asian Development Bank, the World Bank and the Thai government provided a loan for the improvement of the 900 km R10 road route linking Viet Nam to Dawei in Myanmar.32 The European Investment Bank, Asian Development Bank and Agence Française de Développement provided a loan facility to build Line 3 of the metro in Hanoi.33 Other infrastructure projects in ASEAN have also benefitted from receiving loans from MDBs and other financial institutions in 2014 (table 2.15).
ODA from a number of donor countries such as Japan, the Republic of Korea, the United States and the European Union have also contributed to infrastructure development in some ASEAN Member States. For instance, Japan is providing ODA grants and lower-interest loans to a number of ASEAN Member States for infrastructure development projects (table 2.16). The Japan International Cooperation Agency is providing a loan to finance the construction of Line 1 of the underground transport system in Ho Chi Minh City, Viet Nam. Segments of Line 1 of the metro in Jakarta and the construction of the Bangkok BTS also received ODA loans from Japan.
The Asian Infrastructure Investment Bank is expected to start operation later in 2015. With an authorized capital base of $100 billion, it will provide an important source of financing
Table 2.15. MDbs and international development financial institutions support infrastructure projects in ASEAN, 2014
Project CountryDebt
($ million)IDFI involvement
($ million)Remarks
Sarulla geothermal Indonesia 1,170 822JBIC loan: $492 million ADB loan: $330 million
Rautau Dedap geothermal Indonesia 50 50 ADB loan
DSLNG LNG project Indonesia 1,526 1,526JBIC loan: $763 million Kexim: $382 million and $190 million cover Nexui cover: $191 million
Indonesia infrastructure finance Indonesia .. 250 IFC loan
Rajamandala electric power Indonesia 110 66 JBIC loan
Nam Ngiep I power plant Lao PDR 643 250JBIC: $200 million ADB: $50 million
San Gabriel power plant Philippines 265 265Kfw-IPEX loan with a Hermes cover
Source: Thomson Reuters, published in Project Finance International, 14 January 2015, http://www.pfie.com/Journals/2015/01/13/y/k/v/PFILeagueTables2014.pdf.
Note: IDFI = International development finance institution, selected cases.

Chapter 2: Infrastructure investment and private sector players in ASEAN
95
Table 2.16. Japanese ODA has supported infrastructure activities in CLMV countries, 2013−2015
Project name Sector SubsectorDate of
approval
Amount approved (¥ million)
Main portion (applied to reduced
interest rate)
Interest rate (%)
Repayment period (years)
Cambodia
National Road No. 5 Improvement Project (Thlea Ma’am−Battambang and Sri Sophorn−Poipet Sections) (I)
Transportation Road 3/30/2015 19,208 0.01 40
Phnom Penh City Transmission and Distribution System Expansion Project (Phase 2) (I)
Electricity Electricity 3/30/2015 3,816 0.01 40
National Road No. 5 Improvement Project (Prek Kdam−Thlea Ma’am Section) (I)
Transportation Road 7/10/2014 1,699 0.01 40
Phnom Penh City Transmission and Distribution System Expansion Project
Electricity Electricity 7/10/2014 6,480 0.01 40
Southwest Phnom Penh Irrigation and Drainage Rehabilitation and Improvement Project
Water and sanitationIrrigation and flood control
7/10/2014 5,606 0.01 40
National Road No. 5 Improvement Project (Battambang−Sri Sophorn Section)
Transportation Road 5/16/2013 8,852 0.01 40
Lao PDR
Vientiane International Airport Terminal Expansion Project
Transportation Airports 1/10/2014 9,017 0.7 30
Nam Ngum 1 Hydropower Station Extension Project
Electric power Power plants 6/21/2013 5,545 0.55 40
Myanmar
Communication Network Improvement Project
Telecommunication Telecommunication 3/26/2015 10,500 0.01 40
National Power Transmission Network Development Project Phase I
Electric power Transmission lines and distribution systems
3/26/2015 24,678 0.01 40
Greater Yangon Water Supply Improvement Project
Water and sanitationWater supply, sewerage and sanitation
9/5/2014 23,683 0.01 40
Irrigation Development Project in Western Bago Region
Irrigation and flood control
Irrigation and flood control
9/5/2014 14,870 0.01 40
Infrastructure Development Project in Thilawa Area Phase II
Transportation Roads 9/5/2014 4,613 0.01 40
Yangon−Mandalay Railway Improvement Project Phase I (I)
Transportation Railways 9/5/2014 20,000 0.01 40
Infrastructure Development Project in Thilawa Area Phase I
Others Others 6/7/2013 20,000 0.01 40
Regional Development Project for Poverty Reduction Phase I
OthersUrban/rural community infrastructure
6/7/2013 17,000 0.01 40
Urgent Rehabilitation and Upgrade Project Phase I
Electric power Other electric power 6/7/2013 14,052 0.01 40
Viet Nam
O Mon Thermal Power Plant Unit No. 2 Construction Project (II)
Electric power and gas
Power plants 3/22/2013 6,221 1.4 30
Second Transport Sector Loan for National Road Network Improvement
Transportation Bridges 3/22/2013 24,771 1.4 30
Source: JICA.

ASEAN INVESTMENT REPORT 2015: Infrastructure Investment and Connectivity
96
Tab
le 2
.17
.Fin
an
cia
l in
sti
tuti
on
s,
com
merc
ial
ban
ks a
nd
len
ders
fin
an
ce p
ow
er
infr
astr
uctu
re p
roje
cts
in
AS
EA
N (
sele
cte
d c
ases)
(Mill
ion
s o
f d
olla
rs)
Ass
et
Clo
se d
ate
Locati
on
Valu
eLen
ders
/Ban
ks
Sponso
rs
Bur
gos
Win
d F
arm
Nov
201
4P
hilip
pin
esD
ebt:
315
E
ksp
ort
Kre
dit
Fond
en (
Den
mar
k) g
uara
ntee
d a
p
art
of t
he d
olla
r lo
an c
omp
onen
t. F
orei
gn b
anks
p
rovi
ded
lo
ans,
w
hich
p
artic
ipat
ed
by
Aus
tral
ia
and
N
ew
Zea
land
B
anki
ng
Gro
up
(AN
Z),
DZ
B
ank
AG
, IN
G B
ank
NV,
May
ban
k (M
alay
sia)
and
N
ord
deu
tsch
e La
ndes
ban
k G
ironz
entr
ale.
Lo
cal
lend
ers
incl
ude
BD
O U
nib
ank,
Lan
d B
ank
of t
he
Phi
lipp
ines
, Phi
lipp
ine
Nat
iona
l Ban
k, a
nd S
ecur
ity
Ban
k C
orp
orat
ion.
ED
C (P
hilip
pin
es)
GE
D &
Mits
ui G
as
Pow
er P
lant
Nov
201
4Th
aila
ndD
ebt:
1,8
08
Mits
ubis
hi U
FJ F
inan
cial
($2
26.0
), B
angk
ok B
ank
($22
6.0
m),
Sia
m C
omm
erci
al B
ank
($22
6.0
m),
Kas
ikor
nban
k (2
26.0
), M
izuh
o Fi
nanc
ial
($22
6.0
m),
CIM
B ($
226.
0), L
H F
inan
cial
($22
6.0)
Mits
ui (J
apan
)G
ulf E
nerg
y D
evel
opm
ent
(1,6
80) o
wne
d b
y G
ulf J
P (J
apan
)
Nam
Ngi
ep 1
H
ydro
pow
er P
lant
Aug
201
4La
o P
DR
Deb
t: 7
46.5
Ja
pan
Ban
k fo
r In
tern
atio
nal C
oop
erat
ion
($10
6.6)
, S
umito
mo
Mits
ui
Fina
ncia
l ($
106.
6),
Ban
gkok
B
ank
($10
6.6)
, S
iam
Com
mer
cial
Ban
k ($
106.
6),
Miz
uho
Fina
ncia
l ($1
06.6
), M
itsub
ishi
UFJ
Fin
anci
al
($10
6.6)
, Exp
ort
Imp
ort
Ban
k of
Tha
iland
($10
6.6)
KP
IC
Net
herla
nds
(KP
N),
a w
holly
-ow
ned
su
bsi
dia
ry o
f K
ansa
i E
lect
ric (
Jap
an,
45%
), E
GAT
In
tern
atio
nal
(30%
), su
bsi
dia
ry
of
Ele
ctric
ity G
ener
atin
g A
utho
rity
of T
haila
nd,
and
La
o H
old
ing
Sta
te
Ent
erp
rise
(LH
SE
, 25
%),
a w
holly
-ow
ned
su
bsi
dia
ry
of
the
Gov
ernm
ent
of L
ao P
DR
.
EV
N V
inh
Tan
4 P
ower
Pla
ntJu
l 201
4V
iet
Nam
Deb
t: 3
38.2
Ja
pan
Ban
k fo
r In
tern
atio
nal C
oop
erat
ion
and
B
ank
of T
okyo
-Mits
ubis
hi U
FJ (B
TMU
)E
lect
ricity
of V
iet
Nam
Ban
ten
IPP
D
ec 2
013
Ind
ones
iaD
ebt:
730
M
alay
sia
Exi
m
Ban
k ($
200)
, co
mm
erci
al
ban
ks
($50
4) w
hich
incl
ude
Citi
ban
k an
d o
ther
Mal
aysi
an
ban
ks s
uch
as C
IMB
, May
ban
k, R
HB
Gen
ting
Pow
er H
old
ings
(Mal
aysi
a)
Sen
oko
Ene
rgy
June
201
3S
inga
por
eD
ebt:
208
1.2
Com
mer
cial
b
anks
in
clud
e Ja
pan
ese
ban
ks:
Miz
uho,
B
TMU
, S
umito
mo
Mits
ui
Ban
king
C
orp
orat
ion
(SM
BC
); an
d
Sin
gap
orea
n b
anks
: D
BS
, OC
BC
Lion
Pow
er -
ow
ned
by
a co
nsor
tium
co
mp
risin
g M
arub
eni C
orp
orat
ion
(Jap
an),
GD
F S
uez
(Fra
nce)
, Kan
sai E
lect
ric P
ower
(J
apan
), K
yush
u E
lect
ric P
ower
(Jap
an) a
nd
Jap
an B
ank
for
Inte
rnat
iona
l Coo
per
atio
n)
Non
g S
aeng
, S
arab
uri P
ower
P
lant
Nov
emb
er 2
011
Thai
land
Deb
t: 1
184
Jap
an B
ank
for
Inte
rnat
iona
l Coo
per
atio
n (J
BIC
) ($
270)
, A
DB
($1
70),
Miz
uho
($10
0) a
nd $
104
(bat
h tr
anch
es) f
rom
Tha
i Ban
ks: S
iam
Com
mer
cial
Ban
k an
d K
asik
orn
Ban
k
Gul
f JP
UT
- 90
% o
wne
d b
y E
lect
ric P
ower
D
evel
opm
ent
(Jap
an)
U-T
hai,
Ayu
thay
a P
ower
Pla
ntO
ctob
er 2
012
Thai
land
Deb
t: 1
247
JBIC
($2
84),
AD
B (
$184
m),
BTM
U (
$100
) an
d
$568
(bat
h tr
anch
es) f
rom
BTM
U,
SM
BC
and
Tha
i b
anks
: B
angk
ok B
ank,
Kas
ikor
n B
ank,
Lan
d a
nd
Hou
ses
Ban
k, S
iam
Com
mer
cial
Ban
k
Gul
f JP
UT
- 90
% o
wne
d b
y E
lect
ric P
ower
D
evel
opm
ent
(Jap
an)
Sou
rce:
U
NC
TAD
201
5b, b
ased
on
info
rmat
ion
of B
loom
ber
g N
ew E
nerg
y Fi
nanc
e an
d P
roje
ct F
inan
ce In
tern
atio
nal.

Chapter 2: Infrastructure investment and private sector players in ASEAN
97
for regional infrastructure development. Japan has also announced plans to expand financing for infrastructure projects in Asia with $110 billion for the next five years.34 Other regional financial facilities include the ASEAN–China Infrastructure Funds and the ASEAN Infrastructure Fund, which have financed various projects in ASEAN Member States (AIR 2014).
Commercial financial institutions have been playing a key role in providing infrastructure project financing in the region (table 2.17). In 2014 alone, the various mandated lead arrangers and banks were responsible for raising at least $8.7 billion of financing facilities for infrastructure projects in ASEAN (annex table 2.1). ASEAN banks are also involved in providing finance for infrastructure projects undertaken within the region. For instance, Malaysian banks such as Maybank, Exim Bank, CIMB and RHB Bank are participating in $730 million of project financing in favour of PT Lestari Banten Energi, the project company for the design, engineering, construction and operation of the 660 MW coal-fired IPP in Banten, West Java, Indonesia.35 Similarly, many Thai banks, such as Bangkok Bank, Siam Commercial Bank, Kasikornbank and Krung Thai Bank, have also been involved in infrastructure project financing in power projects in neighbouring countries. Singapore banks such as DBS, UOB and OCBC are also active financiers of infrastructure projects in the region. Specialized infrastructure funds have been involved in financing projects in the region. A number of these funds are based in Singapore (table 2.18).
Table 2.18. Selected infrastructure funds are targeting the Asia and Pacific region
Manager location Infrastructure fund Stage Target sectors Size ($ million)
Singapore Equis Direct Investment Fund Fundraising, investment
Energy, telecommunication 300
Singapore Equis Asia Fund II Fundraising Transport, energy, telecommunication, environment
1,000
Singapore Mizuho AsiaInfra Capital Pte. Ltd. Fundraising, investment
Transport, energy, environment 125
United Kingdom Macquarie Asia Infrastructure Fund LP Fundraising Transport, energy, telecommunication, environment
..
Australia Macquarie International Infrastructure Fund (MIIF) Fully invested Transport, energy, telecommunication ..
Singapore Challenger Emerging Market Infrastructure Fund (EMIF) Investment Transport, energy 238
United States J.P. Morgan Asian Infrastructure & Related Resources Opportunity Fund I
Investment Transport, energy, social infrastructure, environment
857
Australia The Infrastructure Fund (TIF) Fundraising, investment
Transport, energy, social infrastructure, environment
..
Australia CFS Australian Clean Energy Infrastructure Fund Fundraising Energy ..
Singapore Equis Asia Fund l Investment Energy 647
Bahrain Islamic Development Bank Infrastructure Fund II Fundraising Transport, energy, telecommunication, social infrastructure, environment
..
United States IFC Global Infrastructure Fund, LP Investment Transport, energy, telecommunication, social infrastructure, environment
1,200
United Kingdom Actis Energy 3 Investment Energy 1,150
Singapore South East Asia Strategic Assets Fund (SEASAF) Investment Transport, energy, telecommunication, environment
147
Singapore Armstrong S.E. Asia Clean Energy Fund Investment Energy, environment 164
Australia AMP Capital Asian Giants Infra Fund Investment Transport, energy, telecommunication, environment
161
Source: InfraPPP Database.

ASEAN INVESTMENT REPORT 2015: Infrastructure Investment and Connectivity
98
Table 2.19. Khazanah’s contribution to infrastructure development in ASEAN through GLCs that it owns (selected cases)
Company Industry Host country
CIMB Banking (CIMB provides loans to infrastructure projects including in other neighbouring countries)
Brunei Darussalam, Cambodia, Indonesia, Singapore Thailand, Viet Nam
IHH Hospitals Brunei Darussalam, Singapore, Viet Nam
UEM Infrastructure/engineering Brunei Darussalam, Indonesia
Axiata Telecommunications Cambodia, Indonesia, Singapore
Plus Expressways Road infrastructure Indonesia
Tenaga Electricity Indonesia
Source: Khazanah, Malaysia.
Temasek is involved in investment in selected infrastructure sectors both at home and abroad, in particular in telecommunication, ports, power and engineering activities through some of the Singapore GLCs. It had a net portfolio value of $195 billion as of 31 March 2015. In telecommunication in ASEAN, it has a stake in Intouch, based in Thailand, through MediaCorp. Through Singapore Technologies Telemedia, it has an indirect interest in Sky Cable (Philippines), U Mobile (Malaysia) and Asia Mobile Holdings, which owns a stake in Lao Telecommunications.
In power generation, Sembcorp is involved in power projects in ASEAN and non-ASEAN countries. For instance, Sembcorp co-owns the 746 MW Phu My 3 combined-cycle gas turbine power plant in Viet Nam. Temasek is also involved in ports development, operation and management in a number of countries through the Port of Authority of Singapore (PSA), a major government-linked company. In engineering and construction, Keppel Corporation and ST Engineering provide Temasek a platform for contributing to infrastructure development in other countries.
2.5.4. Sovereign wealth funds
Sovereign wealth funds (SWFs) are another source of finance for infrastructure projects. In the ASEAN region, these funds include Khazanah (Malaysia) and Temasek (Singapore), which have directly or indirectly participated in infrastructure activities. In most cases, they invest in infrastructure assets at home and abroad through companies they owned or through government-linked companies. Their purpose in investing is to generate a stream of revenues from acceptable projects.
Khazanah had a $32 billion net portfolio worth as of 31 December 2014. It participated in infrastructure projects both in the ASEAN region through UEM and Plus Expressways International. The latter is building the 116 km Cikampek-Palimen Expressway in West Java (Indonesia). Through the Opus Group that it owned, Khazanah is contributing to infrastructure development in Indonesia and outside ASEAN. Khazanah also own Malaysia Airports Holding, which has contracts to operate and manage airports in Cambodia and outside the region. In addition, through a number of Malaysian government-linked companies that it owned, Khazanah is also indirectly contributing to infrastructure development in a number of sectors and in many other ASEAN Member States (table 2.19).

Chapter 2: Infrastructure investment and private sector players in ASEAN
99
2.6. Conclusion
Evidence indicates that with better infrastructure, higher economic and industrial growth can be attained, more logistical efficiency can be achieved and significant economic cost savings can be made. Infrastructure development has increased household and industry access to electricity, brought industrial estates to rural areas, facilitated connectivity through road, rail and bridge links, provided ICT connection and led to the emergence of infrastructure-enabled downstream businesses (e-commerce and business process outsourcing activities) in ASEAN. Improved infrastructure can contribute to increasing the competitiveness of the region and attracting FDI.
Given the importance of infrastructure, ASEAN Member States are investing in upgrading and building new national infrastructure in electricity, transport and ICT. Some have to invest more than others because of years of under-investment and because of rapid growth in demand from population, urbanization and rapid industrial development. Member States have also announced significant plans to improve national infrastructure services.
With growing demand, the region’s infrastructure investment need is huge. However, it is possible that this need can be met with potential additional resources. The region will require about $110 billion annually in investment in power, transport, ICT, and water and sanitation. Aside from other resources outside ASEAN, there are some $10 trillion worth of assets in companies and institutions associated with the region that can be tapped. The challenge is to mobilize and channel these additional sources of funding to infrastructure in the region. A number of approaches to mobilizing and channeling investment to infrastructure were suggested in the World Investment Report 2014, approaches which could be considered or adapted in ASEAN.
The actors operating or investing in the region’s infrastructure industry are now more diversified than in the past. They differ in behaviour, background and aspiration, and can be categorized as the public and private sectors, the local and foreign private sectors, developed and developing countries, and ODA donors and various types of financiers, including companies participating in different segments of infrastructure value chains. ASEAN companies and the foreign private sector have been playing roles in infrastructure development in the region. They have been participating through various modalities, which include FDI, privatization, NEMs, cross-border M&As, and partnership or consortium arrangements. They operate as contractors, suppliers and subcontractors.
Infrastructure investors and contractors from some Asian economies are prominent in ASEAN. Some European and American engineering and equipment manufacturers also have a strong presence. Chinese investors and contractors have become increasingly more visible in the region in a relatively short period of time. They will continue to be active players in the region because of emerging opportunities, the internationalization drive of Chinese firms, strategies to grow revenue streams from winning overseas contracts and encouragement from home government measures.

ASEAN INVESTMENT REPORT 2015: Infrastructure Investment and Connectivity
100
Infrastructure-related companies from ASEAN are also increasingly owning and building infrastructure in other Member States. The various categories of infrastructure financiers can play an important role in providing or arranging finance for infrastructure development in ASEAN. They include ODA donors, MDBs, specialized infrastructure funds, private equity investors, commercial banks and sovereign wealth funds. A significant part of financing for infrastructure projects in the region comes from these sources.
The private sector in all categories needs to play a greater role in infrastructure development in the region over the next decade if the infrastructure plans of the ASEAN Member States are to be realized. States cannot do it alone and the private sector cannot replace the States in infrastructure development. There is a need for a closer public-private partnership, including involving other stakeholders to deliver infrastructure.
The form of MNE involvement in infrastructure operations varies significantly by sector, in part reflecting the policies of host countries in the region, the openness of the sectors, investment opportunities and the risk-return relationship perceived by investors. Some modalities are more significant than others. Firms’ experience, skill sets and ability to win contracts are key influences.
Participation through NEMs, which is a key feature of the region’s infrastructure industry, means that MNEs’ participation in infrastructure development is under reported. Much of the under-reporting arises from data collection methodology, which does not capture non-equity forms of participation such as concessions and management contracts. Any analysis of private sector participation in infrastructure needs to look at not just FDI numbers but also NEM activities, where a significant share of private sector activities are concentrated.
Notes
1 Indonesia-Investments, “Infrastructure in Indonesia”, (undated) (http://www.indonesia-investments.com/business/risks/infrastructure/item381)
2 World Bank, “The tale of two ports in Indonesia”, News, 26 May 2015 (http://www.worldbank.org/en/news/feature/2015/05/26/the-tale-of-two-ports-in-indonesia)
3 http://www.aseanconnections.com/pdf/Infrastructure-In-depth-Philippines.pdf4 World Bank, “Access to electricity – data” (http://data.worldbank.org/indicator/EG.ELC.ACCS.
ZS)5 World Bank, “Can We Make Hydropower Work for All in Laos?”, News, May 14, 2015 (http://
www.worldbank.org/en/news/opinion/2015/05/14/can-we-make-hydropower-work-for-all-in-laos)
6 Kouphokham, Khamso. “Overview of the Lao power development programme”, presentation at the 2nd EAS Energy Efficiency Conference, Phnom Penh, Cambodia, 31st July–1 August 2012 (http://www.eria.org/events/2.%20Mr.Khamso%20Kouphokham%20-%20Overview%20of%20the%20Lao%20Power%20Development%20Program.pdf).
7 In terms of the region’s population.

Chapter 2: Infrastructure investment and private sector players in ASEAN
101
8 Figures were from ITU.9 Bloomberg Business, “Telecom: When a SIM card goes from $2000 to $1.50”, 29 September
2014 (http://www.bloomberg.com/bw/articles/2014-09-29/myanmar-opens-its-mobile-phone-market-cuing-carrier-frenzy)
10 Nomura Equity Research, “Myanmar - an untapped telco market”, 14 March 2012 (http://www.iflr.com/pdfs/newsletters/Asia%20Telecoms%20-%20Myanmar-an%20untapped%20telco%20market%20%2814%20Mar%202012%29.pdf)
11 World Highways, “Big Brunei bridge being built”, 3 February 2015 (http://www.worldhighways.com/categories/road-highway-structures/news/big-brunei-bridge-being-built/)
12 World Highways, “Antaredja wins Jakarta Integrated Tunnel project contract”, 5 May 2014 (http://www.worldhighways.com/categories/road-highway-structures/news/antaredja-wins-jakarta-integrated-tunnel-project-contract/)
13 Indonesia-Investments, “Construction Trans-Sumatra Toll Road expected to start in April 2015”, 9 March 2015 (http://www.indonesia-investments.com/news/todays-headlines/construction-trans-sumatra-toll-road-expected-to-start-in-april-2015/item5376)
14 World Highways, “New Malaysian highway projects planned for 2015”, 30 September 2014 (http://www.worldhighways.com/categories/road-highway-structures/news/new-malaysian-highway-projects-planned-for-2015/)
15 World Highways, “Malaysian expressway project awarded”, 25 December 2015 (http://www.worldhighways.com/categories/road-highway-structures/news/malaysian-expressway-project-awarded/)
16 Roadmap for Transport Infrastructure Development for Metro Manila and its Surrounding Areas; published by Japan International Cooperation Agency (JICA) and National Economic and Development Authority (NEDA) in March 2014
17 http://me-freight.com/news/open/31CE4D7307BD8CBAC2257E6E00363219Q=New-Philippines-port-terminal-to-launch-in
18 https://ppp.gov.ph/?ppp_projects=davao-sasa-port19 DTI-ROG20 http://www.joc.com/port-news/asian-ports/port-klang/malaysia%E2%80%99s-plan-spend-
millions-dollars-port-klang-short-details_20150319.html21 http://www.portcalls.com/thailand-eyes-3-8-billion-expansion-of-laem-chabang-port/ and
http://www.seanews.com.tr/news/116776/Thailand-begins-Laem-Chabang-Port-expansion-ahead-of-APEC-2015-entry.html
22 http://www.sembcorp.com/en/integrated-urban-development-indonesia.aspx23 “Ministry urged to destroyed ineffective IZs?” Viet Nam News, 20 March 2015 (http://vietnamnews.
vn/economy/267827/ministry-urged-to-destroy-ineffective-izs.html)24 “CMI-Industrial Park Development, Indonesia”, World Construction Network, 3 April 2015 (http://
www.worldconstructionnetwork.com/projects/cmi-industrial-park-development-indonesia/)25 The differences of the various estimates are related to different methodologies, coverage and
assumptions.26 A longer time horizon reveals that the share of private investment in Singapore’s GFCF rose from
about 67% in the 1980s to 82% in 2010-2014.

ASEAN INVESTMENT REPORT 2015: Infrastructure Investment and Connectivity
102
27 The World Bank PPI data have a number of limitations in assessing the full extent of private participation in infrastructure, which are explained in WIR 2008.
28 Includes commercial and industrial development. The latter covers industrial estates and SEZs.29 Bangkok Post, “Gunkul begins shift to renewable power”, 19 September 2014 (http://www.
bangkokpost.com/business/news/433025/gunkul-begins-shift-to-renewable-power)30 “Cambodian highway construction continuing”, World Highways, 31 March 2015 (http://
www.worldhighways.com/categories/auctions-equipment-supply-servicing-finance/news/cambodian-highway-construction-continuing/)
31 “MoT/MoPWT/MoC – Thailand to China High-Speed Railway Line”, World Construction Network, 12 January 2015 (http://www.worldconstructionnetwork.com/projects/motmopwtmoc-thailand-to-china-high-speed-railway-line-thailand/)
32 “Thailand/Vietnam R10 route to be developed”, World Highways, 11 June 2013 (http://www.worldhighways.com/sections/general/news/thailand-vietnam-r10-route-to-be-developed/)
33 http://www.railwaygazette.com/news/single-view/view/eib-supports-hanoi-metro.html34 Wall Street Journal, “Japan plans to expand infrastructure investment in Asia”, 21 May 2015 (http://
www.wsj.com/articles/japan-plans-to-expand-infrastructure-investment-in-asia-1432206297)35 Shearman & Sterling, “Landmark Banten IPP project reaches financial close, News and Insights,
12 December 2013 (http://www.shearman.com/en/newsinsights/news/2013/12/landmark-banten-ipp-project)

Chapter 3: Infrastructure value chains and motivations of MNEs in ASEAN
103
ChAPTER 3
INFRASTRuCTuRE VALuE ChAINS AND MOTIVATIONS OF MNES IN ASEAN
3.1. Introduction
Infrastructure value chains in ASEAN are complex and involve a network of players. In segments of a number of chains, MNEs contribute specific technology and skill sets that support the delivery of infrastructure. Among other roles, MNEs participate as equipment and material suppliers; solution providers; engineering, procurement and construction (EPC) companies; subcontractors; owners or sponsors; as well as project financiers.
MNEs’ motives for investing in infrastructure in ASEAN vary. Winning infrastructure contracts is an important consideration that can influence the establishment of a subsidiary or representative office in a host country or in a region. Most motives are related to market and strategic considerations. Some MNEs invest in infrastructure to support their core business; for instance, shipping companies develop port terminals or telecommunication service providers establish information and communication technology (ICT) infrastructure in order to achieve overall operation efficiency. Some upstream MNEs invest in downstream infrastructure to establish an integrated business – for example, from mining to power generation. Others invest to diversify into or across infrastructure chains or segments to generate revenues, reduce risk or increase corporate valuation. Some pursue a horizontal expansion strategy, investing overseas in order to maximize returns from exploiting their proprietary advantage, knowledge or skill sets (e.g. airport companies invest in or build airports infrastructure abroad).
This chapter examines the interconnection of infrastructure value chain players in ASEAN and demonstrates that in most segments MNEs play an important role in delivering infrastructure. The chapter also analyses key drivers and motivations that influence MNEs to invest or participate in infrastructure development in the region.
3.2. Infrastructure value chains in ASEAN
In general, the value chain of infrastructure industries ranges from design, construction and development to operation and management (O&M) (figures 3.1 and 3.2). Different companies may be involved at each stage. In some cases, the same company may be involved across a number of segments from development to O&M, which reflects such companies’ integrated business strategy, diversified skills and ability to win multiple contracts. Another set of companies might be involved at the construction or development stages. Some companies may provide only equipment or solutions to EPC contractors in the value chain (box 3.1).
103

ASEAN INVESTMENT REPORT 2015: Infrastructure Investment and Connectivity
104
Box 3.1. Equipment and solution providers are present in ASEAN
Some equipment manufacturers and service providers associated with infrastructure development in ASEAN also have an extensive presence in the region. They have established manufacturing and service operations in multiple ASEAN Member States to better serve clients or to achieve production efficiencies (box table 3.1.1).
Box table 3.1.1. Participation of equipment manufacturers and service providers
Company Nationality Sector Presence (selected locations)
Volvo Construction Equipment Sweden Construction Cambodia, Indonesia, Lao PDR, Malaysia, Myanmar, Philippines, Singapore, Thailand, Viet Nam
Liu Gong Machinery Company Limited
China Construction Dealers in Indonesia, Lao PDR, Malaysia, Myanmar, Philippines, Singapore, Thailand, Viet Nam
Komatsu Japan Construction Distributors in Brunei Darussalam, Indonesia, Lao PDR, Malaysia, Myanmar, Philippines, Singapore, Thailand, Viet Nam
Sandvik Sweden Construction Brunei Darussalam, Cambodia, Indonesia, Lao PDR, Malaysia, Philippines, Singapore, Thailand, Viet Nam
Sany Heavy Industry Company China Construction Sales and service networks in Brunei Darussalam, Indonesia, Lao PDR, Malaysia, Myanmar, Philippines, Thailand, Viet Nam
Shantui Construction Machinery Company Limited
China Construction Myanmar, Indonesia, Singapore
Daewoo Engineering Korea, Republic of Construction/ engineering
Presence across ASEAN
JCB United Kingdom Construction Brunei Darussalam, Cambodia, Indonesia, Malaysia, Myanmar, Philippines, Singapore, Thailand, Viet Nam
Liebherr Germany Construction Indonesia, Malaysia, Singapore, Thailand
Caterpillar United States Construction Dealers in Brunei Darussalam, Cambodia, Indonesia, Malaysia, Singapore, Thailand, Viet Nam
XCMG China Construction Dealers in Brunei, Cambodia, Indonesia, Lao PDR, Myanmar, Malaysia, Philippines, Singapore, Thailand, Viet Nam
CNH Industrial Switzerland Construction Presence across ASEAN
Zoom lion China Construction Subsidiaries in Singapore and Viet Nam. Representative offices in Cambodia, Thailand, Malaysia
Siemens Germany Electrical equiptment
Cambodia, Indonesia, Malaysia, Myanmar, Philippines, Singapore, Thailand, Viet Nam
Schneider Electric France Electrical equiptment
Brunei Darussalam, Cambodia, Indonesia, Malaysia, Myanmar, Philippines, Singapore, Thailand, Viet Nam
Mitsubishi Heavy Industry Japan Electrical equipment
Cambodia, Indonesia, Lao PDR, Malaysia, Philippines, Singapore, Thailand, Viet Nam
Kirloskar Brothers Limited India Electrical equipment
Cambodia, Lao PDR, Singapore, Thailand, Viet Nam
Doosan Heavy Industries and Construction
Korea, Republic of Energy Indonesia, Philippines, Thailand, Viet Nam
Wärtsilä Finland Energy Indonesia, Malaysia, Philippines, Singapore, Viet Nam
China National Machinery Import and Export Corporation
China Energy Indonesia, Malaysia, Viet Nam
IHC Merwede Netherlands Maritime equiptment
Regional office in Singapore
Trina Solar China Solar Regional office in Singapore
AEG Power Solutions Germany Solar Malaysia, Singapore, Thailand
Yingli Solar China Solar Regional office in Singapore
Ericsson Sweden Telecom-munication
Brunei Darussalam, Cambodia, Indonesia, Malaysia, Myanmar, Philippines, Singapore, Thailand, Viet Nam
Alcatel-Lucent France Telecom-munication
Brunei Darussalam, Cambodia, Indonesia, Malaysia, Philippines, Singapore, Thailand, Viet Nam
Huawei China Telecom-munication Indonesia, Malaysia, Philippines, Thailand
Source: Southeast Asia Infrastructure Research.

Chapter 3: Infrastructure value chains and motivations of MNEs in ASEAN
105
Each infrastructure sector has its own specific features and interconnections of different players, involving both local and foreign-owned entities. In some countries and sectors, key value chain segments are dominated by MNEs (e.g. EPC contractors, equipment suppliers, solution providers).
The interconnection of players in different parts of value chains is important for infrastructure development. Companies operating in the extractive industries, such as gas and coal mining, play a key role in providing the necessary fuels for power plants to generate electricity. Technology and equipment suppliers manufacture turbine engines, wind power generators and solar panels to capture energy sources for conversion into electricity. Engineering companies and project contractors assist investors and owners in building power plants, dams and wind farms for electricity generation. In telecommunication and transport (e.g. urban rail and airports), MNEs are involved across different segments of the value chains from engineering design, construction, and development to O&M. Various categories of financiers play a crucial role in contributing or helping to raise the necessary finance for undertaking infrastructure projects (chapter 2). It is important to understand who plays what role in which segments of the value chain and how they are connected to add value to bring infrastructure projects to fruition, and to continuing operation.
Figure 3.1. Infrastructure value chains involve a number of key segments(Simplified representation)
Source: UNCTAD 2015b.
Design Development andconstruction
Operation andmanagement
Customers/Users
EPCSpecialist providers(solution, system,
equipment)Subcontractors Raw material
suppliers
3.2.1. Electricity value chains
In electricity infrastructure development across ASEAN, MNEs frequently operate as EPC contractors of power plants, transmission lines and power stations. Some also invest in and own power plants. These MNEs come from both developed and developing countries (box 3.2).
The rapid rise in electricity demand, the regional power grid programme and the commitment by Member States in the region to invest in and upgrade the electricity infrastructure make power investment an attractive target for many electricity infrastructure-related MNEs (chapter 2). Strong industrial development, rising per capita income, large and rapidly

ASEAN INVESTMENT REPORT 2015: Infrastructure Investment and Connectivity
106
Fig
ure
3.2
.P
laye
rs in
dif
fere
nt
segm
en
ts o
f an
in
frast
ructu
re v
alu
e c
hain
are
in
terc
on
necte
d (a s
imp
lifi
ed
illu
stra
tion
)
Sou
rce:
UN
CTA
D 2
015b
.N
ote:
see
als
o �g
ure
3.1.
Desi
gn
Raw
mat
eria
ls a
ndpr
imar
y re
sour
ces
Spec
ializ
ed e
quip
men
t or
sol
utio
n pr
ovid
ers
Oper
atio
n an
dm
aint
enan
ceEn
d us
ers/
purc
hase
rs
Com
pani
es p
rovid
ing
raw
m
ater
ials
(e.g
. ste
el,
cem
ent a
nd a
spha
lt) fo
r de
velo
pmen
t or o
pera
tion
of a
n in
frast
ruct
ure
asse
t.
Com
pani
es p
rovid
ing
ener
gy s
ourc
es (e
.g. g
as,
coal
) to
oper
ate
an
infra
stru
ctur
e as
set (
e.g.
po
wer
pla
nt).
Exam
ples
:
Raw
mat
eria
ls:Si
am C
emen
t (Th
aila
nd),
Tata
Ste
el (I
ndia
), Ho
lcim
(S
witz
erla
nd)
Ener
gy s
ourc
es:
Banp
u (T
haila
nd),
Adar
o En
ergy
(Ind
ones
ia),
Petro
nas
Gas
(Mal
aysia
), PT
T (T
haila
nd),
Buki
t Asa
m
(Indo
nesia
), Sh
ell
(Net
herla
nds)
, Che
vron
(U
nite
d St
ates
)
Engi
neer
ing
com
pani
es
and
engi
neer
ing
solu
tions
ent
ities
.So
me
com
pani
es
oper
atin
g as
tech
nolo
gy
and
solu
tion
prov
ider
s,
such
as
GE (U
nite
d St
ates
), Si
emen
s (G
erm
any)
and
ABB
(S
witz
erla
nd),
are
also
in
volv
ed w
ith
engi
neer
ing
desi
gn a
nd
plan
ning
in d
evel
opm
ent
of a
n in
frast
ruct
ure
asse
t.
Com
pani
es p
rovi
ding
sp
ecia
lized
equ
ipm
ent
and
mac
hine
ry (e
.g.
heav
y ea
rthw
ork
mac
hine
s, tu
rbin
es,
gene
rato
rs, w
ind
and
sola
r po
wer
eq
uipm
ent,
cabl
es fo
r te
leco
mm
unic
atio
n,
cran
es fo
r po
rts)
.
Som
e al
so d
evel
op
infr
astr
uctu
re u
nder
co
nces
sion
s or
as
EPC
con
trac
tors
.So
me
prov
ide
syst
em
solu
tions
for
urba
n m
ass
tran
spor
t in
fras
truc
ture
.
Exam
ples
:
Pow
er:
GE
(Uni
ted
Stat
es),
Siem
ens
(Ger
man
y),
ABB
(Sw
itzer
land
), Fu
ji El
ectr
ic (J
apan
), To
shib
a (J
apan
), Al
stom
(Fra
nce)
Urb
an m
ass
tran
spor
t:M
arub
eni a
nd H
itach
i (J
apan
)
Deve
lopm
ent/
cons
truc
tion
Com
pani
es th
at b
uild
th
e in
fras
truc
ture
as
sets
(und
erta
ke th
e en
gine
erin
g,
proc
urem
ent a
nd
cons
truc
tion
of a
n as
set).
In s
ome
case
s th
ese
com
pani
es a
lso
own
the
asse
ts th
ey
deve
lope
d un
der
long
-ter
m c
ontr
actu
al
arra
ngem
ents
with
a
host
cou
ntry
's
auth
ority
.
Exam
ples
:
Pow
er:
Mar
uben
i (Ja
pan)
, GD
F Su
ez (F
ranc
e),
APR
Ener
gy (U
nite
d St
ates
), Si
emen
s (G
erm
any)
, Mits
ui
(Jap
an),
Vest
as
(Den
mar
k), E
lect
ricité
de
Fra
nce,
EGC
O
(Tha
iland
)
Port
s:
PSA
(Sin
gapo
re),
DP
Wor
ld (U
nite
d Ar
ab
Emira
tes)
, Hut
chin
son
Port
s Ho
ldin
g (H
ong
Kong
, Chi
na)
Com
pani
es th
at o
pera
te
and
mai
ntai
n in
frast
ruct
ure
asse
ts.
They
can
incl
ude
com
pani
es th
at b
uild
th
e as
sets
and
co
mpa
nies
app
oint
ed
spec
i�ca
lly to
ope
rate
an
d m
aint
ain
the
asse
ts
unde
rco
nces
sion
s an
d/or
lo
ng-t
erm
ser
vice
co
ntra
ct.
Gov
ernm
ent
agen
cies
, hou
se-
hold
s, p
ublic
use
rs,
busi
ness
and
in
dust
rial u
sers
(e.g
. in
dust
rial e
stat
es)
In th
e po
wer
indu
stry
, som
e co
mpa
nies
sup
ply
equi
pmen
t an
d ar
e al
so th
e EP
C co
mpa
nies
.
Subc
ontr
actin
g
Com
pani
es th
at
rece
ive
cont
ract
s fro
m
EPC
com
pani
es to
co
nduc
t act
iviti
es in
a
give
n se
gmen
t of a
va
lue
chai
n w
ith
infra
stru
ctur
e de
velo
pmen
t asp
ects
. Fo
r ins
tanc
e, a
su
bcon
tract
or m
ay b
e ap
poin
ted
to b
uild
tu
nnel
s fo
r the
co
nstru
ctio
n of
a
hydr
opow
er d
am o
r for
ro
ad, r
ail o
r mar
ine
stru
ctur
es o
r civ
il co
nstru
ctio
n w
orks
.
Exam
ples
:
Firs
t Bal
four
(P
hilip
pine
s),
Blac
k &
Veat
ch (U
nite
d St
ates
),Yo
koga
wa
Elec
tric
(Jap
an),
Anta
ra K
oh
(Sin
gapo
re)

Chapter 3: Infrastructure value chains and motivations of MNEs in ASEAN
107
Box 3.2. Foreign power players in electricity generation are in ASEAN (selected cases)
CambodiaCambodia invites foreign players to participate in power generation. As a result, there has been an increasing number of foreign independent power producers (IPPs) in the country. They operate under power purchase agreements (PPAs). Electricity transmission and distribution is controlled by the country’s electricity agency. Foreign companies involved in the country’s electricity industry are dominated by Chinese players, which include State Grid Corporation of China, Sinohydro Corporation, China Southern Power Grid, China Hydropower Corporation, Huadian, China National Heavy Machinery Corporation. Non-Chinese players include Pestech International (Malaysia), EVN (Viet Nam) and Korean MNEs.
IndonesiaIndonesia is encouraging the private sector to play a greater role in the development of the country’s electricity infrastructure, including through public-private partnerships (PPPs) and concessionary arrangements. An increasing number of MNEs are investing in power generation in Indonesia. These companies include Solar Guys International (Australia), Daewoo Engineering and Construction (Republic of Korea), Genting (Malaysia), Itochu (Japan), Kyushu Electric Power (Japan), Tenaga (Malaysia), Sinohydro (China), Kansai Electric Power (Japan) and Tata Power (India).
Lao PDRLao PDR has a very significant hydropower potential of about 26 GW but only 3 GW of capacity have been built. Exporting electricity to neighbouring countries such as Cambodia, Thailand and Viet Nam is one of the key features of the industry. Electricity sales to neighbouring countries account for a significant share of the country’s total export revenues. MNEs played an important role in the development of the electricity industry, in particular in power generation through hydropower. Investors from Thailand and China dominate in power plant investment. Some of the MNEs involved in the construction of power plants and operation of power concessions include EDF (France), Velcan Energy (France), EGCO (Electricity Generating Company, Thailand), Banpu (Thailand), Glow Energy-GDF Suez (France), SK Engineering and Construction (Republic of Korea), Korean Western Power (Republic of Korea), Sinohydro Corporation (China), Vietnam-Lao Power (VLP) (Viet Nam), Hoang Anh Gia Lai Group (Viet Nam), ITD (Thailand) and PTTi (Thailand).
MyanmarMyanmar needs to invest more in power generation to increase capacity and to meet growing demand, including upgrading existing old facilities. More foreign investors have been investing in the country’s infrastructure in recent years. MNEs from China are major players in the country’s power generation sector. They include Sinohydro, Datang United Hydropower, China Southern Power, Gezhouba, China Heavy Machinery Corporation, Yunnan Machinery Export Import, and Huadian. Other MNEs such as EGATi (Thailand), Toyo-Thai Corporation (Thailand) and Sumitomo Corporation (Japan) also have a presence in the country.
PhilippinesThe Philippines government has actively privatized power plants, which has led to the emergence of local and foreign IPPs. To help the country cope with growing demand, private sector

ASEAN INVESTMENT REPORT 2015: Infrastructure Investment and Connectivity
108
participation in IPPs is strongly encouraged. About 82% of the country’s installed capacity in 2014 was contributed by private sector IPPs,a which are dominated by large local players such as San Miguel, Aboitiz, the Lopez group and Global Power Corporation. Foreign players such as AES (United States), EGCO (Thailand), KEPCO (Republic of Korea), LG (Republic of Korea), Mitsubishi Corporation (Japan), Tokyo Electric (Japan), Marubeni (Japan), Kyushu Electric (Japan) and TeaM Energy (Japan) have been participating in power generation in the country, either as owners or EPC contractors of projects.
SingaporeSince 1995, Singapore has been liberalizing the electricity industry through various processes. The liberalization and privatization of power assets has encouraged the local and foreign private sector to participate in the electricity industry as IPPs, in wholesale distribution for contestable markets and in retailing of electricity. About 80% of the total licensed generation capacity in 2014 was associated with foreign-owned power plants. Through privatization, Senoko Power is now owned by Lion Power Holding, a consortium consisting of Marubeni (Japan), GDF Suez (France), Kansai Electric Power (Japan), Kyushu Electric Power (Japan) and the Japan Bank for International Cooperation. Tuas Power is owned and operated by Huaneng Power International (China) and Power Seraya by YTL Power International (Malaysia). PacificLight, a company owned by FPM Power Holdings and Petronas Power (Malaysia), participated in power generation. The former in turn is owned by First Pacific (Hong Kong, China) and Meralco (Philippines). Upstream companies such as Shell Eastern Petroleum and ExxonMobil Asia Pacific are also involved in power generation. Foreign players are involved in O&M activities; for example, Alstom (France) is a turnkey contractor of the Keppel Merlimau Cogen 800 MW expansion plant.
ThailandElectricity demand in Thailand has grown rapidly and the importation of electricity from neighbouring countries is a common feature of the Thai electricity supply scenario. The Thai government has signed PPAs with Cambodia, Lao PDR, Malaysia and Myanmar to supplement electricity supply. The country has privatized electricity generation and has been encouraging private sector participation in power generation through IPPs and PPAs. Key local players in power generation include the Electricity Generating Authority of Thailand (EGAT), EGCO, Ratchaburi Electricity Generating Holding, Banpu and other local players. Some of these companies also operate in neighbouring countries to export electricity back to Thailand to serve the local market. Foreign MNEs such as J-Power (Japan), GDF Suez (France), SPC Power Corporation (Philippines), China Light and Power (Hong Kong, China), Mitsubishi (Japan), Tokyo Electric Power (Japan) and Marubeni (Japan) have investment in power generation in Thailand.
Viet NamMore foreign companies are investing in Viet Nam’s power industry. These companies include the China Southern Power Grid, EGAT (Thailand), Toyo Ink Group, Sembcorp Utilities (Singapore), PHI Group (United States), Tata Power (India), Sumitomo (Japan) and Doosan Heavy Industries and Construction (Republic of Korea).
Source: UNCTAD 2015b.a See “About PIPPA”, Philippine Independent Power Producers Association (http://pippaonline.org/
about).
Box 3.2. Foreign power players in electricity generation are in ASEAN (concluded)
Chapter 3: Infrastructure value chains and motivations of MNEs in ASEAN
109
growing populations (including urbanization) also make the region an attractive place to invest. Such factors will continue to drive the growth in electricity investment by the private sector, including MNEs, in the region for the foreseeable future. For instance, in Myanmar, 10 power plants were completed in 2013 and 2014, and 7 more are due for completion by 2016. The government has plans to develop another 87 power plants to meet future demand, and most of these plants are to be built by foreign investors.1 The Philippines announced plans to establish 23 new coal-fired power plants by 2020, while Indonesia plans to build 35 power plants between 2015 and 2019. The rising demand for more power plants to be built in the region also means more opportunities for power MNEs to participate in the infrastructure development through contracts.
The role of MNEs in the electricity industry can be appreciated by understanding the different types of players, what they do in each value chain segment and how they are connected, in particular in power plant development and electricity generation (figure 3.3). For instance, in the development of the $440 million, 300 MW Dai Ninh hydroelectric power plant in Viet Nam, Japanese, German and Vietnamese companies played major roles. A consortium of Toshiba and Nissho Iwai provided the design, manufacturing, installation and commissioning of the equipment at the plant. A joint venture of Nippon Koei and Electric Power Development Corporation was the project consultant. Sumitomo and Japan AE Power were the main substation contractors. Siemens and Vietnamese Power Construction Company No. 2 were the subcontractors. Siemens was awarded the contract to provide the design, manufacturing and construction of the substations and their accompanying telecommunication systems. It provided the 500kV/220kV equipment from Germany, the control and protection systems from Indonesia and the telecommunication systems from Singapore.2 In another example, in 2015, Toshiba (Japan) won a contract to provide turbines and generators to the EPC Chinese company (Zhejiang Orient Engineering) for the construction of the Upper Yeywa hydropower plant in Myanmar, which is owned and being developed by Myanmar Electric Power Enterprise.
(a) Raw materials and energy source suppliers
MNEs operating in this segment include those supplying raw materials (cement and steel) to build power plants. Such companies include Holcim (Switzerland) and Siam Cement (Thailand). MNEs and local companies also supply fuel as a source for electricity, usually on a long-term contract basis. MNEs operating in pertinent extractive industries include Adaro Energy (Indonesia), Pertamina (Indonesia), Petronas (Malaysia), PTT (Thailand), Banpu (Thailand), and Bukit Assam (Indonesia), all of which supply energy sources such as gas and coal to power plants. The Malampaya deepwater gas-to-power project in the Philippines involves Shell Philippines Exploration, Chevron, and the Government of the Philippines, which supplies natural gas to three power plants in Batangas, Philippines. Holcim’s subsidiary in the Philippines supplied ready-mix concrete for the construction of the Phividec coal thermal power plant in Northern Mindanao.

ASEAN INVESTMENT REPORT 2015: Infrastructure Investment and Connectivity
110
Sou
rce:
UN
CTA
D 2
015b
.
Fig
ure
3.3
.T
he e
lectr
icit
y va
lue c
hain
can b
e c
om
ple
x and invo
lves
a p
ort
folio o
f pla
yers
Oper
atio
n an
d M
aint
enan
ceac
tiviti
es a
nd p
laye
rs
Valu
e ch
ain
Deve
lopm
ent o
fpo
wer
pla
nts
Gene
ratio
n(U
tility
com
pani
esan
d IP
Ps)
Tran
smis
sion
Dist
ribut
ion
User
sHo
useh
olds
Com
mer
cial
Indu
stria
l
Ener
gy
sour
ce
supp
liers
Play
ers
Raw
mat
eria
l su
pplie
rs
Engi
neer
ing
com
pani
esEP
Cco
mpa
nies
Sub-
cont
ract
ors
Equi
pmen
t/so
lutio
npr
ovid
ers

Chapter 3: Infrastructure value chains and motivations of MNEs in ASEAN
111
In addition, some extractive companies are also involved in downstream activities (power generation) (box 3.3). Integrating different segments of value chains is a natural business model for some resource-based MNEs. Upstream companies such as Shell Eastern Petroleum and Exxon Mobil Asia Pacific are involved in power generation in Singapore, producing electricity primarily for their own use.
Box 3.3. MNEs in the extractive industry are involved with power generation in ASEAN (selected cases)
Banpu (Thailand), a coal producer, has significant coal mining operations in Indonesia. The company is diversifying into power generation. For instance, in Thailand, it has a 50% share in BLCP Power Limited, a 1,434 MW coal-fired power plant in Map Ta Phut Industrial Estate in Rayong Province. It has recently become involved in another electricity-generating project in the Hongsa power plant in Lao PDR with Ratchaburi Electricity Generating Holding and Lao Holding State Enterprise (LHSE), a State-owned enterprise of Lao PDR. The Hongsa power plant is expected to commence commercial operations in 2015. The company is also building a new power plant in China that will commence operation in 2017. Banpu’s long-term corporate strategy is to explore and enter into new energy possibilities in bio-energy, wind power and solar energy.a
Pertamina (Indonesia), a State-owned oil and gas company, is involved in a gas-fired IPP together with Marubeni (Japan). The project will involve value chain segments from upstream gas exploration and production to mid-stream transmission and storage, and downstream power generation.b
Petronas (Malaysia), through its subsidiary Petronas Power, operates in the power business to maximize value chain benefits by integrating with the group’s liquefied natural gas supply business. It undertakes investment in power generation activities at home and abroad. Together with First Pacific (Hong Kong, China) and Meralco (Philippines), it jointly owns FPM Power Holdings, which in turn owns PacificLight (Singapore), which is involved in the generation and retailing of electricity. Petronas continues to expand in the power sector and is constructing, at an estimated cost of about $1 billion, a gas-fired power plant with a generation capacity of 1,200 MW in Pengerang, Southern Johor, Malaysia. The plant, which is expected to be complete by 2016, contracted Technip (France) to provide the engineering design and support.c
PTT (Thailand) invests abroad through its subsidiaries PTT International and PTT Green Energy to explore alternative energy and to secure energy sources. At home, it provides energy sources such as gas to gas-fired power plants owned by local and foreign IPPs. Through PTT International, the group has invested in power plants overseas. For instance, it holds a 25% stake in Xayaburi Power and a 40% stake in Nam Lik-1 Power. Both assets are in Lao PDR.
Adaro Energy (Indonesia), a coal mining company, is diversifying into power generation as part of its coal value chain. About 75% of the coal production is destined for overseas customers, primarily in Asia, and a majority of them operate in the utilities business. Adaro Energy is involved in the coal supply chain from pit to port to power generation. The activities include mining, barging, shiploading, dredging, port services, marketing and power production. The company is involved in a $4 billion, 2x1,000 MW coal-fired steam power plant in Central Java, Indonesia,

ASEAN INVESTMENT REPORT 2015: Infrastructure Investment and Connectivity
112
with a consortium comprising its subsidiary Adaro Power, Electric Power Development (Japan) and Itochu Corporation (Japan). The plant will start commercial operation in 2016 with Adaro Energy supplying majority of the coal requirements. In addition, the company together with Korea Electric Power Corp. (KEPCO) established Tanjung Power (Indonesia) in August 2013 to develop, build and operate a 2x100 MW coal-fired power plant in South Kalimantan. The power plant will use approximately 1 million tonnes of coal per year, the majority of which will be supplied by Adaro Energy. The company has also entered into a joint venture with China Shenhua Overseas Development and Investment to operate a coal-fired power plant in Indonesia.
Bukit Asam (Indonesia), a State-owned company in coal mining, is increasingly involved in power generation with coal supplied from its mines. Some of the power plants are built with foreign MNEs such as the $1.6 billion, 2x620 MW Banko Tengah plant in Indonesia in partnership with China Huadian. The construction of the plant will begin in 2016 and commercial operation in 2019. In addition, the $2.4 billion, 800–1,200 MW Peranap power plant in Indonesia, operated in partnership with PLN (Indonesia) and TNB (Malaysia), will use coal from Bukit Asam’s source and will commence operation in 2020.
Source: UNCTAD 2015b, based on information from companies’ websites and annual reports.a “Coal: Banpu powers up”, The Asia Miner, 9 March 2015 (http://www.asiaminer.com/news/latest-
news/6598-coal-banpu-powers-up.html#.VVNkeU103Cw).b “Execution of Memorandum of Understanding with PT. Pertamina”, Marubeni News Release, 20
February 2014 (http://www.marubeni.com/news/2014/release/00010.html)c “Petronas-Pengerang gas-fired power plant, Johor, Malaysia”, World Construction Network, 27 May
2013 (http://www.worldconstructionnetwork.com/projects/petronas-pengerang-gas-fired-power-plant-johor-malaysia/)
(b) Sponsors and owners of power plants
MNEs play an increasingly important role in the development of power plants in the region as sponsors, owners or as independent power producers (IPPs) (table 3.1). They own and operate power plants through various forms of long-term concessions (e.g. build-operate-transfer, build-operate-own) in the host country. In most cases, MNEs that own power plants sell the electricity generated to national electricity authorities under some form of power purchase agreements (PPAs), to industrial customers, or as exports to a third or home country.
In the CLMV countries (Cambodia, Lao PDR, Myanmar, Viet Nam), foreign companies dominated the construction and development of power plants. For instance, in Lao PDR this segment is dominated by investors from Thailand and China (table 3.2).
In the power sector, some MNEs have a significant presence in the region. Electric Power Development (J-Power), headquartered in Japan, has invested abroad in 38 power plants. As of 2015, half of these power assets are in ASEAN (table 3.3). It has 15 IPP projects in operation in Thailand with an additional one that is to commence operation in 2015. It has
Box 3.3. MNEs in extractive industry are involved with power generation in ASEAN (selected cases) (concluded)

Chapter 3: Infrastructure value chains and motivations of MNEs in ASEAN
113
Tab
le 3
.1.
Fo
reig
n a
nd
re
gio
nal
MN
Es b
uil
d e
lectr
icit
y in
frastr
uctu
re i
n A
SE
AN
, 2
01
2–2
01
4 (
Se
lec
ted
pro
jec
ts a
nd
ec
on
om
ies)
Pro
ject
Secto
rLocati
on
Fin
an
cia
l clo
sure
(Y
ear)
Sp
on
sor
Valu
e
($
m
illio
n)
Inst
alle
d
capacit
y (M
W)
Technolo
gy
Type o
f P
PI
PPA
arr
angem
ent
Nam
eE
qu
ity
stake
Nati
on
alit
y
Bin
a P
uri D
esa
Pat
tene
teng
E
lect
ricity
G
ener
atio
nIn
don
esia
2012
Bin
a P
uri
80M
alay
sia
104
Hyd
roB
OT
Yes
SG
I-M
itab
u S
olar
Pla
nt P
hase
IE
lect
ricity
G
ener
atio
nIn
don
esia
2012
Mita
bu
Aus
tral
ia..
Aus
tral
ia10
450
Sol
ar, P
VB
OO
Yes
Sol
ar G
uys
Inte
rnat
iona
l..
Aus
tral
ia
Kom
ipo
Wam
pu
Ele
ctric
ity
Gen
erat
ion
Ind
ones
ia20
12D
aew
oo E
& C
..R
epub
lic o
f Kor
ea17
445
Hyd
roB
OT
Yes
Kor
ea M
idla
nd P
ower
Cor
p.
..
Cila
cap
Pow
er P
lant
Pha
se II
Ele
ctric
ity
Gen
erat
ion
Ind
ones
ia20
13P
T S
umb
er E
nerg
i Sak
ti P
rima
51In
don
esia
900
660
Coa
lB
OT
Yes
Ban
ten
Coa
l-Fi
red
Pow
er P
lant
Ele
ctric
ity
Gen
erat
ion
Ind
ones
ia20
13G
entin
g G
roup
95M
alay
sia
1,00
066
0C
oal
BO
TYe
s
Kru
eng
Isep
Hyd
rop
ower
Pro
ject
Ele
ctric
ity
Gen
erat
ion
Ind
ones
ia20
13P
T S
enag
an E
nerg
i10
0M
alay
sia
3110
Hyd
roB
OO
..
Sar
ulla
Geo
ther
mal
Pro
ject
Ele
ctric
ity
Gen
erat
ion
Ind
ones
ia20
14
Itoch
u C
orp
25Ja
pan
1,54
133
0G
eoth
erm
alB
OO
Yes
Kyu
shu
Ele
ctric
Pow
er
25Ja
pan
Orm
at T
urb
ines
12.7
5Is
real
PT
Med
co E
nerg
i Int
erna
tiona
l37
.25
Ind
ones
ia
Raj
aman
dal
a H
ydro
Pow
er P
lant
Ele
ctric
ity
Gen
erat
ion
Ind
ones
ia20
14K
ansa
i Ele
ctric
Pow
er10
0Ja
pan
111
47H
ydro
BO
TYe
s
Sin
ohyd
ro N
am K
han
II an
d II
IE
lect
ricity
G
ener
atio
nLa
o P
DR
2012
Sin
ohyd
ro85
Chi
na43
017
3H
ydro
BO
TYe
s
Hag
Nam
Kon
g II
Ele
ctric
ity
Gen
erat
ion
Lao
PD
R20
12H
oang
Anh
Gia
Lai
Gro
up10
0V
iet
Nam
7166
Hyd
roB
OT
Yes
Xe-
Pai
n X
e-N
amno
y E
lect
ricity
G
ener
atio
nLa
o P
DR
2014
Kor
ea W
este
rn P
ower
25R
epub
lic o
f Kor
ea
1,04
341
0H
ydro
BO
T..
Rat
chab
uri E
lect
ricity
Gen
erat
ing
Hol
din
g25
Thai
land
SK
Cor
p.
26R
epub
lic o
f Kor
ea
Cyp
ark
Paj
am S
olar
Bio
gas
Pla
ntE
lect
ricity
G
ener
atio
nM
alay
sia
2012
Cyp
ark
Res
ourc
es..
Mal
aysi
a17
7S
olar
, PV,
B
ioga
sB
OO
Yes
LG E
lect
roni
c..
Rep
ublic
of K
orea
Kua
la L
ump
ur A
irpor
t S
olar
Pla
nts
Ele
ctric
ity
Gen
erat
ion
Mal
aysi
a20
13S
unE
dis
on10
0U
nite
d S
tate
s41
15S
olar
, PV
BO
OYe
s
AS
EA
Akl
an B
iom
ass
Pla
ntE
lect
ricity
G
ener
atio
nP
hilip
pin
es20
12A
SE
A O
ne P
ower
..P
hilip
pin
es12
12B
iom
ass
BO
OYe
sLG
Gro
up..
Rep
ublic
of K
orea
Ahl
one
Pow
er P
lant
Ele
ctric
ity
Gen
erat
ion
Mya
nmar
2013
Toyo
-Tha
i Cor
por
atio
n10
0Th
aila
nd17
012
1G
asB
OO
Yes
Gul
f Uta
i Pow
er P
lant
Ele
ctric
ity
Gen
erat
ion
Thai
land
2012
J-P
ower
90
Jap
an1,
280
1,60
0G
asB
OO
Yes
Sur
in S
olar
PV
I, II
and
III
Ele
ctric
ity
Gen
erat
ion
Thai
land
2013
SP
C P
ower
Cor
p.
100
Phi
lipp
ines
4822
Sol
ar, P
VB
OO
Yes
SP
C L
opb
uri P
V P
lant
Ele
ctric
ity
Gen
erat
ion
Thai
land
2013
Chi
na L
ight
& P
ower
33H
ong
Kon
g, C
hina
154
Sol
ar, P
VB
OO
..M
itsub
ishi
33Ja
pan
EG
CO
33Th
aila
nd
Kha
non
4 C
CG
TE
lect
ricity
G
ener
atio
nTh
aila
nd20
14M
itsub
ishi
50Ja
pan
822
930
Gas
BO
OYe
sTo
kyo
Ele
ctric
Pow
er50
Jap
an
Sou
rce:
Wor
ld B
ank,
PP
I Dat
abas
e.
Not
e:
PP
I = P
rivat
e p
artic
ipat
ion
in in
fras
truc
ture
; P
PA =
Pow
er p
urch
ase
agre
emen
t; B
OO
= b
uild
, ow
n, o
per
ate;
BO
T =
bui
ld, o
per
ate,
tra
nsfe
r; P
V =
pho
tovo
ltaic
.

ASEAN INVESTMENT REPORT 2015: Infrastructure Investment and Connectivity
114
Table 3.2. MNEs play an important role in the development and ownership of power plants in the CLMV countries, selected projects, 2010-2015
Name MW COD Off-taker Finance Ownership at COD
Lao PDR
Nam Theun 2 1,080 201095% EGAT (Thailand)
26 international private banks and international financial institutions
EDF (France) 35%; EGCO (Thailand) 25%; LHSE (Lao PDR) 25%; Italian-Thai Development (Thailand) 15%
XPXN 400 2013 EGAT (Thailand) Thai and international banks Korean-led consortium; LHSE (Lao PDR)
Xekaman 3 250 2012 EVN (Viet Nam)Vietnam Investment and Development Bank, Vietnam Commercial Bank
Viet-Lao Power (VLP-Viet Nam); Electricité du Laos (EdL) 15%
Nam Ngiep 2 280 2013 EdL (Lao PDR) China BFI CWE (China) 90%; EdL 10%
Nam Ou 1,100 2012 EdL (Lao PDR) China BFI Sinohydro (China), EdL
Xayaburi 1,285 2012 EGAT (Thailand) Thai banks PTTi; CH. Kanchang (Thailand); EdL
Nam Ngum 5 120 2012 EdL (Lao PDR) China Exim Bank Sinohydro (China) 85%; EdL 15%
Nam Ngum 2 615 2011> 95% EGAT (Thailand)
Thai banks Ch. Kanchang (Thailand) 28.5%; Ratchaburi (Thailand) 25%; EdL 25%; Bangkok Expressway (Thailand) 12.5%; others 9%
Nam Lik 1-2 100 2010 EdL (Lao PDR) China Development Bank CWE (China) 90%; EdL 10%
Under Development
Xayaburi 1,285 .. EGAT (Thailand) Thai banks CH. Kanchang (Thailand); LHSE (Lao PDR)
Nam Ou 1,100 .. EdL/EGAT China BFI Under Negotiations (formerly Japanese led)
Nam Thuen 1 520 .. EdL (Lao PDR) China BFI Sinohydro (China); LHSE (Lao PDR)
Xekaman 1 468 .. EVN (Viet Nam) Vietnam Development Bank Viet-Lao Power 70%; EdL 30%
Nam Ngiep 3 460 .. EVN (Viet Nam) Negotiation VLP (Viet Nam) 85%; LHSE (Lao PDR) 15%
XPXN 400 .. EGAT (Thailand) Thai and international banks Korean-led consortium; LHSE
THPC Expansion 280 .. EGAT (Thailand) International banks EdL 60%; GMS Power 40%
Nam Ngiep 2 280 .. EGAT (Thailand) China Development Bank CWE (China) 90%; EdL 10%
Nam Ngiep 1 262 .. EGAT (Thailand)ADB,Thai and international banks
Kansai Electric Power (Japan); EGATi (Thailand); LHSE (Lao PDR)
Nam Khan 2&3 173 .. EdL (Lao PDR) China ExIm Sinohydro (China) 85%; EdL 15%
Nam Tha 1 170 .. EdL (Lao PDR) China BFI China Southern Grid International; EdL
Nam Phay 140 .. EdL (Lao PDR) Negotiation Norinco International Corp. (China) 85%; EdL 15%
Nam Kong 2 66 .. EdL (Lao PDR) BIDV (Viet Nam) Hoang Anh Gia Lai Group (Viet Nam) 100%
Nam Lik 1 65 .. EGAT (Thailand) Negotiation Gamuda (Malaysia), EGCO (Thailand), LHSE (Lao PDR)
Cambodia
Kirirom 3 18 2013 .. .. China State Grid
Kam Chay 194 2011 .. .. Sinohydro (China)
Projects Planned or Under Development
Russei Chrum Krom 246 2015 .. .. China Huadian
Stung Tatay 120 2015 .. .. China National Heavy Machinery Corporation
Stung Atay 12 2015 .. ..China Electric Power Technology Import & Export Corporation
Kirirom 1 338 2015 .. ..China Electric Power Technology Import & Export Corporation
Stung Treng 980 2020 .. .. ..
Sambor 2,600 2020 .. .. China Southern Power
Lower Se San 2 400 2020 .. .. Royal Group
Lower Sre Pok 2 222 2020 .. .. EVN (Viet Nam)
Stung Battamburg 1 24 2020 .. .. Korean Company
Stung Sen 40 2020 .. .. Korean Company
Myanmar
Yeywa 790 Domestic sale China Exim Bank, CITIC (China)MEPE/HPGE; CITIC (China); Sinohydro (China); CHMC, CGGC, Siemens, Malcolm Dunstan, Colenco, HTCT

Chapter 3: Infrastructure value chains and motivations of MNEs in ASEAN
115
Name MW COD Off-taker Finance Ownership at COD
Upper Paungluang 140 Domestic sale China Exim Bank MEPE; Colenco, Malcolm Dunstan, Yunnan Machinery ExIm (China)
Shweli I 60050% exported to China; 50% for domestic sale
China Exim Bank Yunnan Machinery Exim (China); Datang United Hydropower (China); China Southern Power Corp.
Dapeyin I & IIa 40890% to China; 10% for domestic sale
China Exim Bank MEPE, Datang United Hydropower (China)
Lower Paungluanga 280 Domestic sale China Exim Bank MEPE, Yunnan Machinery Exim (China), Sinohydro (China)
Planned/Under Development
TaSang 7,110 .. Thai and Chinese banks EGATi (Thailand); China Three Gorges (China)
Wei Gyi 4,540 EGATi (Thailand) Thai Banks EGATi (Thailand)
Kunlong 2,400 .. Goldwater Resources; Hanergy Holding
7 Dams Project: Chibwe, Kaunglanphu, Laiza, Lakin, Myitsone, Pashe, Phizaw.
13,360
China Power Investment; China Gezhouba; Sinohydro
China BFI Asia World Company, MEPE
Hat Gyi 1,200EGATi (Thailand); Sinohydro (China)
Thai and Chinese banks EGATi, Sinohydro, MEPE
Viet Nam
Se San 3A 108 2007 .. 20% Russia; 50% Vietnamese banks; 30% EVN/EVN
Song Ba Ha 220 2009 .. JBIC/EVN
Se San 4 255 2010 .. JBIC/EVN
Son La 2,400 2010–2012 .. 70% Vietnamese banks; 30% EVN
Dak Mi 4 192 2012 .. Vietnamese banks/EVN
Source: “Regional Hydropower: Developments and Challenges”, a presentation by DFDL: Legal and Tax at American Chamber of Commerce-Singapore, 16 May 2014, Singapore (http://www.dfdl.com/images/stories/160514_AmCham_Singapore_final_short_version_2.pdf).
Note: COD = commercial operation date, MW = megawatt.a Operational.
Table 3.2. MNEs play an important role in the development and ownership of power plants in the CLMV countries, selected projects, 2010-2015 (concluded)
three power plant projects in operation in the Philippines and one in Viet Nam. Another project is under construction in Indonesia.
GDF Suez (France) is a major utility company with extensive international operations. In ASEAN, it has operations in Indonesia, Singapore and Thailand. It has many subsidiaries, such as Tractebel Engineering, operating in the region. In electric generation and cogeneration, it operates through its subsidiary Glow Group in Thailand. The IPP business in Thailand generates and sells electricity primarily to the Electricity Generating Authority of Thailand (EGAT), and supports 30 industrial customers, mainly based in the Map Ta Phut industrial zone. It is also strongly involved in the development of thermal, geothermal and renewable energy in Indonesia, where it is the largest IPP through a consortium that owns Paiton Energy. The other partners in this venture comprise Mitsui & Co (Japan), Tokyo Electric Power (Japan) and Batu Hitam Perkasa (Indonesia). GDF Suez also manages the plant’s operations through its majority-owned subsidiary in PT Ipmomi. In 2012, GDF Suez, together with Sumitomo Corporation (Japan), Marubeni (Japan) and Supreme Energy

ASEAN INVESTMENT REPORT 2015: Infrastructure Investment and Connectivity
116
Table 3.3. J-Power has growing electricity generation operations in ASEAN, 2015
Projects TypeOutput ca-pacity (MW)
Ownership share (%)
Owned ca-pacity (MW)
Power purchaserValidity of purchase
agreement
Thailand
Roi-Et Biomass (Chaff) 10 24.7 2 EGAT to 2024
Rayong CCGT 112 20 22EGAT, companies in the industrial park
to 2024
Gulf Cogeneration CCGT 110 49 54EGAT, companies in the industrial park
to 2019
Samutprakarn CCGT 117 49 57EGAT, companies in the industrial park
to 2020
Nong Khae CCGT 120 49 59EGAT, companies in the industrial park
to 2021
Yala Biomass (Rubber Wood Waste)
20 49 10 EGAT to 2031
Kaeng Khoi 2 CCGT 1,468 49 719 EGAT to 2033
SPPs,a seven CCGT 790 86.6 684EGAT, companies in the industrial park
to 2038
Nong Seang CCGT 1,600 90 1,440 EGAT to 2039
U-Thai (under construction)
CCGT 1,600 90 1,440 EGAT 25-year PPA
Philippines
CBK (3 projects) Hydroelectric 728 50 364 National Power Corporation to 2026
Viet Nam
Nhon Trach 2 CCGT 750 5 38 Vietnam Electricity to 2021
Indonesia
Central Java (under construction)
Coal 2,000 34 680 PT Perusahaan Listrik Negara25-year PPA from commercial operation
Source: UNCTAD and ASEAN Secretariat, based on information from J-Power company website.Note: CCGT (combined-cycle gas turbines), PPA = power purchase agreement, SPP = small power producer. EGAT (Electricity Generating
Authority of Thailand) is a State-owned electric power utility company of Thailand. PT Perusahaan Listrik Negara is a State-owned electric power utility company of Indonesia.
a Consists of seven SPP projects (KP1, KP2, TLC, NNK, NLL, CRN, NK2). J-Power holds a 67.5% stake in the NLL plant and a 90% stake in the other six.
(Indonesia), signed a 30-year PPA with PLN (Indonesia) for three geothermal projects in Sumatra, Indonesia.
Velcan Energy (France) develops, finances, builds and operates hydropower concessions in emerging markets including in Lao PDR and Indonesia. It has two concessions under development in Lao PDR, the 52 MW Nam Phouan and the 41 MW Nam Ang, each with a concession period of 30 years, which includes construction. In Indonesia, Velcan has projects at various stages of commercial negotiations. Given the market potential for electricity, Velcan has been actively prospecting in Indonesia.
AES (United States)3 operates in 18 countries involving plants with 35 GW of generating capacity. In ASEAN, it has subsidiaries in the Philippines and Viet Nam. Through expanding its investment, AES Philippines has increased the generation capacity at the Masinloc power plant from 50% to 74% and is increasing net production by 62% within two years. The plant started commercial operation in 2008 with a gross installed capacity of 630 MW; AES owned a 51% equity interest. A recent power project of AES in Viet Nam is the $1.95 billion

Chapter 3: Infrastructure value chains and motivations of MNEs in ASEAN
117
Mong Duong 2 coal-fired power plant, which is the largest private sector power project in the host country. The 1,240 MW plant started commercial operation in the first half of 2015. It was built under a build-operate-transfer agreement and a 25-year PPA with Electricity of Vietnam and a 25-year coal supply agreement with a State-owned enterprise (Vinacomin). AES has a 51% equity interest in the power plant, Posco Power Corp. (Republic of Korea) has a 30% interest and China Investment Corporation a 19% interest.
In addition, many ASEAN MNEs or power utility companies own power plants in other ASEAN Member States (chapter 2). These companies include EGCO (Thailand), EVN (Viet Nam), Genting (Malaysia), ITD (Thailand), Hoang Anh Gia Lai Group (Viet Nam), Prestech International (Malaysia), Ratchaburi Electricity Generating Holding (Thailand), Vietnam-Lao Power (VLP, Viet Nam) and YTL (Malaysia). Furthermore, many power plants in the region owned by national utility companies were built by MNEs (box 3.4).
Box 3.4. Tenaga’s power plants are built by MNEs from developed and developing countries
Tenaga (Malaysia) is one of the largest utility companies in the region. It operates in generation, transmission and distribution of electricity. It has increasingly invested in and operated in power generation projects abroad. In Malaysia, it owns many power plants, which have been built with the participation of MNEs. For instance in 2014, Tenaga had nine power plant projects in Malaysia at varying stages of completion, with most involving foreign EPC companies (box table 3.4.1).
Box table 3.4.1. Tenaga power plants in Malaysia are constructed by MNEs, 2014
Name of projectInstalled capacity
(MW)EPC Nationality Commercial
operation date
Stage of completion in 2014
Prai Combined-Cycle Gas Turbine
1,071 Samsung Engineering & Construction
Korea, Republic of
January 2016 79.9%
Manjung Coal-Fired Power Plant Project (Manjung 4)
1,010 Consortium: • Alstom• China National Machinery
Import and Export Corporation
• CMC Machipex
FranceChina
China
2015 99.5% in August
Fast Track 3A Coal-Fired Power Plant (Manjung 5)
1,000 Consortium:•Sumitomo •Daelim
JapanKorea, Republic of
October 2017 18.8% in August
Combined-Cycle Generating Plant Redevelopment Project
384.7 Sinohydro China September 2015 63.8% in August
Ulu Jelai Hydroelectric Project (2 x 186 MW)
372 Consortium:• Tindakan Mewah •Salini Costruttori SpA
MalaysiaItaly
December 2015 and March 2016
63.4% in August
Hulu Terengganu Hydroelectric Project 2x125 MW Puah and 2x7.5 MW Tembat
265 • Loh & Loh •Sinohydro
MalaysiaChina
September 2015 and December 2015 for the Puah units; March 2016 and April 2016 for the Tembat units
84.3% in August
Source: UNCTAD and ASEAN Secretariat, based on information from Tenaga Nasional company website and Annual Report 2014.

ASEAN INVESTMENT REPORT 2015: Infrastructure Investment and Connectivity
118
(c) EPC companies
Some MNEs help to build power plants in ASEAN as EPC entities, sometimes in cooperation with other players (table 3.4). They provide key engineering service, procurement of equipment and construction of power plants either entirely by themselves or through engaging subcontractors to carry out specific or specialized engineering work. In some cases it is difficult to distinguish between a sponsor or owner and EPC companies, as the latter also often own a stake in the power plant they built and are also involved in supplying equipment.
Some EPC MNEs in ASEAN power plant projects include Sharp (Japan) for the construction of a 52 MW solar power plant in Thailand, Vestas Wind Systems (Denmark) for the Burgos wind farm in the Philippines, the Siemens–Marubeni consortium for Chana combined power plant-2 in Thailand, Doosan Heavy Industries and Construction (Republic of Korea) for the Mong Duong 2 coal-fired thermal plant and Vinh Tan 4 thermal power plant in Viet Nam, and Sumitomo (Japan) for the various EPC power plant projects across ASEAN (box 3.5).
Other EPC contractors of power plants include the Alstom (France)–Marubeni (Japan) consortium, which in 2015 won the contract to build a new 600 MW lignite-fired power facility in Mae Moh, Thailand, for EGAT (Thailand).4 Alstom will provide technological expertise and equipment such as the boiler, steam turbine and generator, while Marubeni will provide the rest of the equipment needed as well as civil and installation works. In addition, Conergy (Germany) is building an 8 MW solar power plant in Sa Kaeo, Thailand for B. Grimm Power (Thailand).
Doosan Heavy Industries and Construction (Republic of Korea) is an EPC contractor offering a wide range of services ranging from the manufacturing of boilers, power generation systems and desalination facilities to the construction of power plants. It has a presence in ASEAN through two subsidiaries in Viet Nam and sales offices in Indonesia, the Philippines and Thailand. It has won major power plant projects in Viet Nam as an EPC company and equipment supplier, making it a significant integrated power solution provider in that country (table 3.5).
(d) Subcontractors to EPC companies
Although many subcontractors are local companies, some are foreign MNEs engaged by EPC principals to perform specialized tasks. For instance, Black and Veatch (United States) was a subcontractor for the Siemens-Marubeni EPC consortium for the Chana combined power plant-2 in Thailand; Toyo Engineering (Japan) for the Mitsui & Co (Japan) EPC contract for the gas-fired cogeneration plants in Thailand; and Yokogawa (Japan) for the Doosan Heavy Industries and Construction (Republic of Korea) EPC contract for the Mong Dong-2 coal-fired thermal plant in Viet Nam.
GDF Suez’s subsidiary Tractebel Engineering, based in ASEAN, provides engineering services for and technical advice on hydropower, renewable and thermal projects to clients in ASEAN. It has recently opened a branch in the Philippines. It provided engineering

Chapter 3: Infrastructure value chains and motivations of MNEs in ASEAN
119
Tab
le 3
.4.
MN
Es p
art
icip
ate
in
ele
ctr
icit
y i
nfr
astr
uctu
re v
alu
e c
hain
s i
n A
SE
AN
, se
lecte
d p
roje
cts
Pro
ject
Cou
ntr
yLocati
on
Exp
ecte
d
date
of
op
era
tion
Tota
l cap
acit
y (M
W)
Valu
e ($
)O
wn
ers
/ sp
on
sors
Arr
an
gem
en
tE
PC
Sele
cte
d
subcontr
acto
rsR
em
ark
s
Cha
na C
omb
ined
Pow
er
Pla
nt-2
Thai
land
Son
gkhl
a20
14 8
00
435
mill
ion
EG
ATTu
rnke
yS
iem
ens-
Mar
uben
i C
onso
rtiu
m
Bla
ck &
Vea
tch
(for
BoP
eq
upm
ent)
Sie
men
s an
d M
arub
eni a
lso
sup
plie
d e
qui
pm
ent.
Fue
l for
th
e p
lant
sup
plie
d fr
om t
he
offs
hore
Tha
iland
-Mal
aysi
a jo
int
dev
elop
men
t.
A L
uoi H
ydro
elec
tric
Pow
er
Pla
ntV
iet
Nam
Thua
Thi
en
Hue
Pro
vinc
e20
12 1
70
202
mill
ion
Cen
tral
H
ydro
pow
er J
SC
....
Cav
ico
Cor
p fo
r Tu
nnel
Invo
lves
con
stru
ctio
n of
tr
ansm
issi
on li
nes
and
pow
er
stat
ions
Ban
Ve
Hyd
roel
ectr
ic P
ower
P
lant
Vie
t N
amN
ghe
An
Pro
vinc
e20
10 3
20
390
mill
ion
Éle
ctric
ité d
e V
ietn
am..
Son
g D
a C
orp
Cav
ico
Cor
pIn
volv
es c
onst
ruct
ion
of
tran
smis
sion
line
s an
d p
ower
st
atio
ns
Bur
gos
Win
d F
arm
Phi
lipp
ines
Iloco
s N
orte
P
rovi
nce
2014
150
45
0 m
illio
nE
DC
Bur
gos
Win
d
Pow
er C
orp
20 y
ears
fit
-in-
tarif
fVe
stas
Win
d
Sys
tem
s (D
enm
ark)
Firs
t B
alfo
urVe
stas
als
o gi
ven
O&
M
cont
ract
; Firs
t B
alfo
ur a
lso
acts
as
EP
C fo
r tr
anm
issi
on li
ne
dev
elop
men
t.
Gas
Fire
d C
ogen
erat
ion
(120
M
W x
9 p
roje
cts;
130
MW
x
3 p
roje
cts)
Thai
land
Ind
ustr
ial
esta
tes
2017
−20
19 1
,470
2.
4 b
illio
nG
ED
& M
itsui
(J
apan
)B
OO
Mits
uiTo
yo E
ngin
eerin
g C
orp
orat
ion
..
Mon
g D
uong
-2 C
oal-
fired
Th
erm
al P
lant
Vie
t N
amQ
uang
Nin
h P
rovi
nce
2014
1,2
40
2.1
bill
ion
AE
S (5
1%),
Pos
co
Ene
rgy
(30%
), C
hina
Inve
stm
ent
Cor
p (1
9%)
BO
T (2
5 ye
ars)
Doo
san
Hea
vy
Ind
ustr
ies
and
C
onst
ruct
ion
(Rep
ublic
of
Kor
ea)
Yoko
gaw
a E
lect
ric
(Jap
an)
Doo
san
also
sup
plie
d
equi
pm
ent.
Vin
com
in
sup
plie
d c
oal u
nder
a 2
5-ye
ar
agre
emen
t. F
inan
cing
cam
e fr
om 1
2 fo
reig
n b
anks
, whi
ch
incl
uded
BN
P P
arib
as, C
réd
it A
gric
ole,
HS
BC
, IN
G, N
atix
is.
Nam
The
un 2
Hyd
rop
ower
P
roje
ctLa
o P
DR
Kha
mm
uan
Pro
vinc
e20
10 1
,070
1.
3 b
illio
nN
TPC
, whi
ch
is o
wne
d b
y É
lect
ricité
d
e Fr
ance
In
tern
atio
nal
(Fra
nce,
35%
), E
GC
O (T
haila
nd,
25%
), Ita
lian-
Thai
D
evel
opm
ent
(Tha
iland
, 15%
), G
over
nmen
t of
La
o P
DR
, 25%
BO
OT
(31
year
s)E
DF
(mai
n d
evel
oper
)A
EC
OM
(Uni
ted
S
tate
s) fo
r co
nstr
uctin
g tr
ansm
issi
on li
nes;
th
ree
sub
cont
ract
s to
Jap
anes
e fir
ms,
one
to
ITD
(T
haila
nd) a
nd
anot
her
sub
cont
ract
to
a c
onso
rtiu
m
of E
urop
ean
and
C
anad
ian
firm
sa
Als
o in
volv
es c
onst
ruct
ion
of t
rans
mis
sion
line
acr
oss
the
Lao-
Thai
bor
der
. Fou
r m
ultil
ater
al d
evel
opm
ent
ban
ks
(incl
udin
g th
at W
orld
Ban
k an
d A
sian
Dev
elop
men
t B
ank)
p
rovi
ded
fina
ncin
g su
pp
ort
alon
g w
ith d
evel
opm
ent
agen
cies
of d
evel
oped
co
untr
ies.
Maj
ority
of t
he
elec
tric
ity fr
om t
his
pla
nt is
ex
por
ted
to
Thai
land
.
Vin
h Ta
n 4
Ther
mal
Pow
er
Pla
ntV
iet
Nam
Bin
h Th
uan
2018
1,2
001.
5 b
illio
nV
ietn
am E
lect
ricity
G
roup
(EV
N)
..D
oosa
n H
eavy
In
dus
trie
s an
d
Con
stru
ctio
n (R
epub
lic o
f K
orea
)
..C
omp
any
also
sup
plie
s eq
uip
men
t fo
r p
lant
co
nstr
uctio
n.
Ban
ten
IPP
Ind
ones
iaB
ante
n, W
est
Java
2017
660
1
bill
ion
Gen
ting
(Mal
aysi
a)B
OT
(25
year
s)H
arb
in (C
hina
)..
25-y
ear
pow
er p
urch
ase
agre
emen
t w
ith P
LN. L
esta
ri B
ante
n E
nerg
i (95
% o
wne
d
by
Gen
ting)
is t
he a
pp
oint
ed
oper
ator
.
Sou
rce:
U
NC
TAD
.
Not
e: B
OO
= b
uild
, ow
n, o
per
ate;
BO
OT
= b
uild
, ow
n, o
per
ate,
tra
nsfe
r; B
OT
= b
uild
, op
erat
e, t
rans
fer.
a
http
://w
ww
.oec
d.o
rg/d
ac/e
valu
atio
n/d
cdnd
ep/4
4539
854.
pd
f

ASEAN INVESTMENT REPORT 2015: Infrastructure Investment and Connectivity
120
Table 3.5. Doosan Heavy industries and construction: recent significant power projects in Viet Nam
Power plantTotal capacity
(MW)Contract award
dateEstimated
completion dateScope of operation
Mong Duong 2 1,200 Dec 2010 2014 EPC
Mong Doung 1 1,080 Dec 2011 .. Supply of main equipment
Vinh Tan 4 1,200 Dec 2013 2018 EPC and supply of equipment
Nighi Son 1,300 Dec 2014 .. EPC and supply of equipment
Song Hau 1 1,200 April 2015 2019EPC in power generation facilities and supply of equipment (e.g. boilers and turbines)
Source: UNCTAD, based on information from company’s website.
Note: All plants are coal fired. EPC = engineering, procurement and construction.
Box 3.5. Sumitomo Corporation (Japan): An active EPC player in power industry in ASEAN
Sumitomo has extensive operations in ASEAN in different infrastructure sectors. It has built power plants in Indonesia, Malaysia, the Philippines and Viet Nam and has subsidiaries across the region. It plans to further expand its regional footprint, including in EPC activities.
In Indonesia, Sumitomo is the EPC contractor for the Kamojang geothermal power station (35 MW capacity) owned by Pertamina Geothermal Energy (Indonesia).a By 2014, Sumitomo Corporation had been involved with 11 EPC geothermal power construction projects in Indonesia, including some for which it was awarded contracts by Pertamina last year.b These projects account for about 50% of current and anticipated geothermal power generation in the country. Sumitomo has also built geothermal power stations in the Philippines.
The company is constructing a gas-fired power plant next to the Thilawa Special Economic Zone in Myanmar. The plant will start operation in 2016.c The company is also constructing a number of coal-fired thermal power stations and other power plants in Viet Nam. It is building the Pha Lai 2 coal-fired power station on an EPC turnkey basis. It is operating the Phu My 2-2 gas-fired combined-cycle power plant jointly with EDF (France) and Tokyo Electric Power Company (Japan) in an ongoing IPP project. And it recently won an EPC contract to construct the Duyen Hai 3 coal-fired thermal power station expansion project, to be completed by 2018.d
Source: UNCTAD and ASEAN Secretariat, based on information from Sumitomo Corporation company website and annual reports.
a Sumitomo Corporation, “Sumitomo Corporation Signs Deal with PT. Pertamina Geothermal Energy for Construction of the Fifth Unit of the Kamojang Geothermal Plant”, news release, 7 October 2013 (http://www.sumitomocorp.co.jp/english/news/detail/id=27206).
b Sumitomo Corporation, “Contract Awarded by PT Pertamina Geothermal Energy for Construction of Units 5 and 6 at Lahendong Geothermal Power Station in Indonesia”, news release, 12 December 2014 (http://www.sumitomocorp.co.jp/english/news/detail/id=28151).
c Sumitomo Corporation, “Contract Awarded for Construction of Units 1 and 2 of gas-fired power generation plant that will provide electricity to Myanmar’s Thilawa SEZ”, news release, 6 March 2016 (http://www.sumitomocorp.co.jp/english/news/detail/id=28411).
d Sumitomo Corporation, “Order Received for Construction of Duyen Hai 3 Extension Coal-fired Power Plant (1 x 688 MW) from Vietnamese State-run Power Company”, news release, 26 November 2014 (http://www.sumitomocorp.co.jp/english/news/detail/id=28132).

Chapter 3: Infrastructure value chains and motivations of MNEs in ASEAN
121
services to the 120 MW SPR combined-cycle gas turbine projects in Thailand, the 410 MW Xepian Xe Namnoy and the 65 MW Nam Lik 1 hydropower projects in Lao PDR, the 90 MW First Gen Avion project in the Philippines and the 600 MW Vinh Tan 4 project in Viet Nam as well as for the strengthening of the West Kalimantan power grid in Indonesia.
Mitsui Engineering and Shipbuilding (Japan) has been awarded a subcontract for civil construction work for a recent Sumitomo EPC power plant project in Viet Nam, and Black and Veatch (United States) will be responsible for technical coordination work.
(e) Technology, equipment and other solution providers are active players in the region
Many MNEs operating in this segment of the value chain are expanding their presence in ASEAN because of their investment and contractual activities in power plant development. Many developed-country MNEs operate in this segment of the value chain. They provide dedicated equipment such as turbines and generators to EPC companies to build power plants or transformers. Other MNEs in this segment are solution or technology providers to power plant projects to support the power generation system.
For instance, Fuji Electric (Japan) supplied steam turbines and generators to Sumitomo’s various recent EPC power plant projects in Indonesia. Mitsubishi Hitachi Power Systems (Japan) has been awarded a contract to supply key components (turbines and power generators) and Taihei Dengyo Kaisha (Japan) a contract to provide other equipment for the construction of Sumitomo’s EPC gas-fired power plants in Myanmar in 2016. Toshiba Corporation (Japan) has been contracted to provide key equipment such as the steam turbine and generator, and Babcock and Wilcox (United States) the boiler for Sumitomo’s EPC power plant project in Viet Nam, which is to be completed by 2018.
Aside from being an EPC contractor and holding equity stakes in IPP projects in Viet Nam, Sumitomo is also a supplier of equipment, such as to the A Vuong and Buon Kuop hydroelectric power plants (see box 3.5). ABB (Switzerland) provided high-voltage power transformers to EGAT in 2014 to support the transmission links from two hydropower plants in Lao PDR.
ABB (Switzerland) won a contract to supply an integrated electrical and control solution to a Slovakia EPC company, Istroenergo Group, for the construction of the 97 MW San Gabriel Avion open-cycle, gas-fired power plant in the Philippines, which is to start commissioning in 2015.5 ABB won a contract to provide an automation system for the supercritical power plant in Banten Serang, Indonesia, which is being built by the EPC contractor, Harbin Power Engineering (China).6 The plant is expected to start operation in 2016. ABB is also to provide system design, engineering, installation assistance, commissioning support and training. The plant is owned by PT Lestari Banten Energi (Indonesia), which in turn is owned by Genting (Malaysia).

ASEAN INVESTMENT REPORT 2015: Infrastructure Investment and Connectivity
122
GE, which has manufacturing operations in ASEAN, is also a major supplier of power equipment to plants across the region. For example, it manufactured and supplied about 100 gas engines to Navigat (Indonesia), which have been installed in power plants in Indonesia and Thailand, which together generated 330 MW of electricity. It has also supplied four 9F gas turbines to two power stations of EGAT (Thailand). For renewable energy power plants (solar and wind), GE has manufactured and supplied turbines to many projects in the region, which include 62 wind turbines for the construction of the Bac Lien wind farm in Viet Nam.
Northwind Power Development Corporation (Denmark) supplied wind turbine generators for the construction of the North Luzon wind power plant in the Philippines. Gamesa (Spain) was awarded a contract in 2015 to supply 25 turbines for wind farms in Nakhon Ratchasima (Thailand), which are to be developed by PowerChina ZhongNan (China).7 Gamesa has a footprint in the Philippines and Viet Nam, where it has supplied equipment to power plants. Fuji Electric (Japan) won a contract in 2015 to supply geothermal steam turbines and generators to PT Pertamina Geothermal Energy (Indonesia) for Units 5 and 6 at the Lahendong geothermal area.
(f) Integrated power plant contractors
Some MNEs, such as Siemens (Germany), are involved in all or most of the electricity value chains in ASEAN. Siemens, through its various subsidiaries, has won several contracts in ASEAN to build power plants, which include EPC operations, supply of equipment and long-term maintenance activities. For instance, it is constructing a 414 MW combined-cycle gas-fired power plant in Batangas City, the Philippines, with equipment supplied from within the Siemens group. It will also operate the power plant for the owner, First Gen Corporation (Philippines).8 In Thailand, it has been awarded contracts to supply 18 industrial gas turbines, which include providing technical assistance to install the turbines and the long-term maintenance work. Together with Samsung C&T (Republic of Korea), Siemens is building a 800 MW combined-cycle gas turbine power plant in Singapore for Pacific Light Power. As with other similar past projects (e.g. cogeneration combined cycle power plant for PowerSeraya), Siemens will also supply equipment and commissioning of the power plant.
(g) Manufacturing MNEs producing electricity for own use
As part of their strategy to reduce costs and improve competitiveness, some manufacturing MNEs are building power plants to generate electricity for their own consumption at their manufacturing plants in ASEAN. For instance, Asahi Glass (Japan) announced that it will be investing $400 million to build and own a 250 MW coal-fired plant at its Indonesian subsidiary PT Asahimas Chemical, in Banten. The move is being made to significantly reduce power costs, a major expense of the business. The power plant is scheduled to begin operation in 2017.9

Chapter 3: Infrastructure value chains and motivations of MNEs in ASEAN
123
3.2.2. Telecommunication value chains
Telecommunication infrastructure consists of backbone transmission networks, switches, access networks such as base stations for wireless networks and supporting software systems. Backbones employ fibre-optic cable or wireless (microwave, point to point, and satellite) transmission systems. Access systems include wireless base stations or coaxial cable or copper to homes and businesses. Civil works are necessary as well, from digging trenches to raising towers and poles.
The telecommunication value chain can be broadly segmented into the provision and construction of infrastructure, the operation of telecommunication services and the provision of value added services. Of particular importance are the inputs used for investment in telecommunication infrastructure (figure 3.4).
Operators are at the centre of the telecommunication sector value chain. They make the decisions regarding infrastructure investment, users subscribe to their services, and third parties use their networks to provide add-on applications. Therefore, the starting point for an analysis of ASEAN’s telecommunication segmentation is the operators themselves, particularly retail operators that have facility-based licenses.
The ASEAN telecommunication service market has two salient features. One is a relatively high level of privatization. Almost 60% of telecommunication operators are private or partly private entities (table 3.6). The second is foreign involvement. All ASEAN members except for Brunei Darussalam have at least one foreign strategic investor in their telecommunication sector. These strategic investors come from both within and outside ASEAN. Axiata (Malaysia) and Singtel have three investments each in ASEAN telecommunication operators. Vietnam’s Viettel has two investments. Investors from outside the region include Ooredoo (Qatar), which has two investments through Asia Mobile Holdings (AMH), a joint venture with Singapore Technologies Telemedia, and two direct investments (in Indonesia
Source: UNCTAD and ASEAN Secretariat.
Figure 3.4. Telecommunication infrastructure involves different inputs from different players
Raw material suppliers(e.g. cables)
Equipment vendorsPassive infrastructure
suppliers(e.g. poles, ducts, towers)
Software systemsdevelopers
System integrators

ASEAN INVESTMENT REPORT 2015: Infrastructure Investment and Connectivity
124
Table 3.6. Main facilities-based telecommunication operations in ASEAN involve strategic investors
Country Operator Private (%) Publicly listed Strategic investor (country)a Share (%)
Cambodia
CamGSM 100 .. .. ..Metfone b .. Viettel (Viet Nam) 100Smart 100 .. Axiata (Malaysia) 88Telecom Cambodia 0 .. .. ..
Indonesia
Indosat 86 Ooredoo (Qatar) 65
Telkom 47 .. ..Telkomsel c Singtel (Singapore) 35XL 100 Axiata (Malaysia) 67
Lao PDRETL 0 .. .. ..LTC 49 .. Asia Mobile Holdings (Singapore) 24Unitel b .. Viettel (Viet Nam) 51
Malaysia
Celcom 100 .. ..DiGi 100 Telenor (Norway) 49Maxis 100 .. ..TM 71 .. ..
MyanmarMPT 0 .. ..Ooredoo 100 Ooredoo (Qatar) 100Telenor 100 Telenor (Norway) 100
PhilippinesGlobe 100 Singtel (Singapore) 47PLDT 100 NTT (Japan) 26
SingaporeM1 100 Axiata (Malaysia) 28SingTel 49 ..StarHub 100 Ooredoo (Qatar) 14
Thailand
AIS 100 Singtel (Singapore) 23CAT 0 .. ..DTAC 100 Telenor (Norway) 43Jasmine 100 .. ..TOT 0 .. ..TRUE 100 China Mobile 18
Viet Nam
VNPT 0 .. .. ..VinaPhone 0 .. .. ..Mobifone 0 .. .. ..Viettel 0 .. .. ..
TOTAL 37 22 15 17
Source: UNCTAD and ASEAN Secretariat. Note: MPT = Myanma Post and Telecommunication. a Informatoin as of September 2015. b Investment by foreign strategic operators that are government owned. c 65% held by Telkom Indonesia, which is 47% private.
and Myanmar). Telenor (Norway) is active in three Member States (Malaysia, Myanmar and Thailand). Hutchison Whampoa (Hong Kong, China) has relatively small cellular operations in Indonesia and Viet Nam.
Although telecommunication operators account for the bulk of capital expenditure throughout the region, others are investing, too. Wholesalers are providing backbone transmission, the public sector is investing in government backbones and services, and private sector firms are deploying in-house networks.

Chapter 3: Infrastructure value chains and motivations of MNEs in ASEAN
125
(a) Raw materials suppliers
Although many ASEAN Member States host some degree of telecommunication equipment manufacturing, these manufacturers generally make components that are integrated into products by other companies. Some of these products, such as fibre-optic cable, might be used by local operators.10 Fibre-optic cable requires inputs such as copper and aluminium, which typically need to be imported. Some fibre manufacturers are joint ventures with foreign partners. For example, OPCOM (Malaysia) is 30% owned by Sweden’s Ericsson, and Sucaco (Indonesia) is 12% owned by Furukawa (Japan), which provides technical assistance to the company.
(b) Passive infrastructure
Passive infrastructure consists of conduits for transmission equipment such as ducts and towers for cables and towers for wireless antennas. The main costs for the development of this infrastructure are often not for the physical elements but rather for land acquisition, taxes, rent and civil works. Principal operators can outsource the construction work for their own passive infrastructure. In some cases, they may choose to lease it or sell it to independent operators and then rent it back. In some countries, towers are operated independently and operators lease space to place their antennas. Some operators may have subsidiaries to carry out these activities for financial reasons (e.g., the construction costs are borne by the subsidiary and therefore are not treated as capital expenditures by the operator which instead incurs operating costs to lease the facilities). Public entities such as road ministries, railway companies, electric utilities and local governments may also own passive infrastructure and lease it to operators. Singapore provides an example of a single passive infrastructure that is shared among different operators (box 3.6).
Private companies are involved in passive infrastructure, particularly for towers (table 3.7). Ideally, this reduces duplication and promotes infrastructure sharing by allowing for independent ownership and leasing to multiple operators on each tower. In Indonesia, operators have been selling their towers to independent operators and leasing them back. Telkom, the country’s largest operator, divested 49% of its tower subsidiary to Indonesia’s second largest target operator, Tower Bersama Infrastructure (TBI), in exchange for 6% equity, valuing each tower at $226,000. The country’s third largest mobile operator, XL, sold some 3,500 towers to PT Solusi Tunas Pratama for $460 million and leased them back for a period of 10 years. The sale is somewhat surprising considering that XL’s joint venture partner, Axiata (Malaysia) has a tower subsidiary with some 14,000 towers in Malaysia and Cambodia, as well as in Bangladesh and Sri Lanka, and 12,000 km of fibre in Pakistan.
Myanmar is a particularly interesting tower market. It has been estimated that some 17,000 telecommunication towers will be needed over the next few years to achieve 70% mobile coverage.11 Digicel (Ireland) built more than 1,000 towers in Myanmar.12 It established a 75% joint venture in Myanmar in 2013 for the tower business and is leasing the towers to one of the licensed operators. Windsor (Singapore) is building 500 towers to lease to Ooredoo’s (Qatar) subsidiary in Myanmar. The Myanmar firm Pan Asia Majestic Eagle Limited recently

ASEAN INVESTMENT REPORT 2015: Infrastructure Investment and Connectivity
126
Box 3.6. Infrastructure sharing in Singapore
Another way of looking at segmentation in the telecommunication sector is the example of Singapore’s Next-Generation Nationwide Broadband Network (Next Gen NBN), an open-access network funded with a government subsidy of up to S$1 billion. The Government designed Next Gen NBN in order to realize its vision of making the country an information and communications hub and to create new economic opportunities (box figure 3.6.1). The model called for creating an open-access fibre backbone and network in order to rationalize investment. Under the model, one company was selected to construct the fibre backbone and a second to develop the wholesale transmission network. Service providers utilize the network and pay regulated wholesale prices. The backbone company, NetLink Trust (formerly known as OpenNet) was selected in September 2008 and awarded a grant of up to S$750 million for the fibre backbone rollout. It owns all the fibre-optic cables and offers wholesale dark-fibre services to others on a nondiscriminatory basis. To facilitate deployment, NetLink Trust made use of relevant existing passive infrastructure, such as ducts, manholes and exchanges.
Nucleus Connect, a wholly owned subsidiary of operator StarHub, was selected as the operating company in April 2009 to develop and operate the wholesale transmission network. It began commercial operations on 31 August 2010.
The results have been impressive. By June 2015, there were 812,000 fibre subscriptions in Singapore. It ranked sixth in the world in fibre penetration in 2014.a According to the International Telecommunications Union (ITU), Singapore has the cheapest fixed broadband prices in ASEAN, the second cheapest in the Asia-Pacific region and the third cheapest in the world.b
Box figure 3.6.1. Singapore infrastructure-sharing model for Next Gen NBN
Source: Infocomm Development Authority of Singapore.a http://www.ftthcouncil.eu/documents/PressReleases/2015/PR2015_FTTH_Subscribers.pdfb http://www.itu.int/en/ITU-D/Statistics/Pages/publications/mis2014.aspx

Chapter 3: Infrastructure value chains and motivations of MNEs in ASEAN
127
received $85 million in financing from a consortium of banks to deploy over 1,250 telecommunication towers for Ooredoo Myanmar.13 Apollo Towers (United States) is deploying 700 towers to lease to Telenor Myanmar.14
(c) Equipment vendors
The most expensive segment is that for specialized equipment used to deploy telecommunication networks. The equipment market for this key
telecommunication infrastructure is highly concentrated, with only about half a dozen global players: Huawei and ZTE (China), Ericsson (Sweden), Nokia Siemens Networks15 (Finland) and Alcatel-Lucent (France) (table 3.8).16 These vendors provide 2G/3G/4G wireless equipment as well as fibre-optic transmission equipment. They often provide an end-to-end solution for network deployment. Equipment selection is based on a variety of factors including technical solution, price and payment options. Data on the value of equipment awards is not available, often due to contractual arrangements. Ericsson’s sales to ASEAN have averaged €15 billion since 2012.
Some equipment vendors are also active in constructing regional and international fibre-optic backbones linking ASEAN countries to each other and to global networks. Operator consortiums fund these networks (chapter 2).
Operators are generally not dependent on a single vendor. Although there may be costs in changing suppliers, the new vendor generally tries to minimize those costs. In addition, over time, innovations have made equipment more interoperable. Operators may select different vendors for separate components of their network, such as backbone transmission and mobile access networks, or for different generations of mobile telephony. M1 (Singapore) provides an example: it has worked with no fewer than four equipment
Table 3.7.Tower ownership in ASEAN differs between Member States, 2015
CountryNumber of
towersOwned by operators
Owned by tower companies
Indonesia 66,690 30,010 36,680
Malaysia 20,000 13,300 6,700
Myanmar 7,238 2,200 5,038
Thailand 55,000
Viet Nam 55,000 45,000 10,000
Source: UNCTAD and ASEAN Secretariat, based on information adapted from TowerXchange Research (http://www.towerxchange.com/towerxchanges-analysis-of-the-independent-tower-market-in-asia/).
Table 3.8. Top telecommunication network equipment manufacturers are from Europe and China, 2014
Vendor HeadquartersRevenue($ billion)
Asia-Pacific sales, 2014Contracts awarded in ASEAN
(2013-2015)$ billion % Scope 3G 4G Backbone
Alcatel-Lucent France 17 1.7 10 Excluding China .. 1 4
Ericsson Sweden 33 2.3 7 SE Asia and Oceania 2 2 ..
Huaweia China 34 5.1 15 Excluding China 3 1 ..
Nokia Finland 17 4.4 26 Excluding China 4 1 ..
ZTEa China 9 1.4 15 Asia excluding China .. 3 1
Source: UNCTAD and ASEAN Secretariat, based on information adapted from company annual reports.a Revenues for Huawei exclude “consumer business” and those for ZTE “handset terminals”. Asia-Pacific revenue share refers to total
revenues for those two companies.

ASEAN INVESTMENT REPORT 2015: Infrastructure Investment and Connectivity
128
vendors for different parts of its networks (table 3.9). Foreign strategic investors active in ASEAN also sign contracts with specific vendors for equipment to be used across their networks. By pooling their requirements in different markets, they can achieve economies of scale and obtain lower prices for equipment. For example, NEC (Japan) signed an agreement to supply routers and optical communication equipment to 13 telecommunication subsidiaries of Telenor (Norway) around the world, including those in Malaysia, Myanmar and Thailand.19
As networks transform to Internet protocol (IP), specialized Internet hardware companies are selling more equipment to telecommunication operators. Cisco (United States), which specializes in Internet router and switching equipment, has larger revenues than any of the global telecommunication equipment vendors. It is active in the region, supplying equipment to governments, private businesses, the academic sector and telecommunication operators. Examples include a private network for a consortium of ASEAN operators,20 equipment for deployment of Wi-Fi hotspots for Indonesia’s Telkom21 and videoconferencing equipment in Viet Nam.22
(d) Software systems
Telecommunication networks are major users of software applications, such as for supporting network monitoring, performance, billing and operations support. This software is sometimes bundled with equipment and other times purchased separately, particularly for specialized applications. Although operators sometimes purchase from local software developers, global developers are usually the recipients of larger contracts. Software vendors sometimes join with local partners who have knowledge of local markets.
Examples include the following:
• In Malaysia, local company NSS MSC Sdn Bhd provided an encrypted SMS package for mobile operator Celcom.23
• Amdocs (United States) has won contracts for its applications from several operators in the region. It has a particular niche in mobile money. It was awarded a three-year contract to integrate Singtel (Singapore) billing and customer support systems for retail, enterprise and government users into a single platform.24 In the Philippines, it was awarded a seven-year managed services engagement with responsibility for Globe’s business support systems.25 Amdocs has provided billing systems for True in Thailand,26 VNPT in Viet Nam27 and XL in Indonesia.28
• Dialogic (United States) teamed with Khine Thit Sar Co Ltd, a Myanmar telecommunication integrator and reseller, to provide intelligent call control software to Myanma Posts and Telecommunications.29
Table 3.9.Singapore M1 network deployments involve mainly European vendors, 2013
Network component Vendor Description
Microwave backbone Ericsson Expansion
900 MHz 3G network Nokia New network
All IP (Internet protocol) network
NokiaConvert core infrastructure to IP
Small cell Alcatel-LucentEnhance indoor radio coverage
3G network expansion HuaweiExpand 2.1 GHz network
4G small cell Alcatel-Lucent Trial
Source: UNCTAD and ASEAN Secretariat, based on information adapted from M1 Limited data.

Chapter 3: Infrastructure value chains and motivations of MNEs in ASEAN
129
(e) System integration
Systems integrators are involved in activities such as linking equipment and software from different vendors, managing civil works and representing global companies in local markets. They tend to be domestic companies that are familiar with the local telecommunication industry and have connections with the different operators in the market. For example, Intex Telecom Systems30 represents a number of major equipment vendors in the Philippines. It was one of Nokia Siemens Networks’ first partners and also represents Huawei (China), Ericsson (Sweden), Alcatel (France) and ZTE (China). Another example is Ntegrator (Singapore), which operates throughout a number of ASEAN Member States (Cambodia, Malaysia, Myanmar, Singapore, Thailand and Viet Nam), designing, installing and implementing wired and wireless networks as well as providing project management, maintenance and support.31
3.2.3. Transport value chains
The transport infrastructure value chain is also complex. In ports, for instance, it involves engineering design, construction, development, equipment and material supply, and road and rail construction both in and linking to the port. In road infrastructure, a similar sequence of value chain segments exists.
(a) Ports
Port operators such as the Port of Singapore Authority, Hutchinson Port Holdings (Hong Kong, China) and DP World (United Arab Emirates) invest abroad to expand their core business in ports development and operation. Some international shipping companies also invest in and operate port terminals to support their shipping logistics businesses (table 3.10). Maersk (Denmark) has a 30% interest in Port of Tanjung Pelepas (Malaysia) through its port operating arm, APM Terminal. Other companies, such as Marubeni (Japan), have port interests in Thailand, although port operation and shipping are not their core businesses.
Other port MNEs and shipping companies are also partnering with local companies to build and operate port terminals in the region. Mitsui & Co. (Japan), Nippon Yusen Kabushiki Kaisha (Japan), PSA International (Singapore) and PT Pelabuhan Indonesia II (Indonesia) are building a $300 million container terminal at the Tanjung Priok Port in Jakarta.32 In 2015, Mitsui O.S.K. Lines partnered with a local company (SahaThai Terminal) in Thailand to build a new barge terminal operation in Bangkok, which is expected to open in 2016. In Viet Nam, three Japanese MNEs (Mitsui O.S.K. Lines, Nippon Yusen KK, and Itochu Corporation) together with a local company (Vietnam National Shipping Lines) are building a $349 million container terminal in northern Viet Nam, to be completed in 2015.33 The operation of Tan Cang-Cai Mep International Container Terminal l in Viet Nam is jointly owned by Hanjin (Republic of Korea), Mitsui O.S.K. Lines (Japan), Wan Hai (Taiwan Province of China), Saigon Newport (Viet Nam) and Vietnam National Shipping Lines.

ASEAN INVESTMENT REPORT 2015: Infrastructure Investment and Connectivity
130
Tab
le 3
.10
.M
ajo
r p
ort
an
d s
hip
pin
g M
NE
s a
re i
nve
sti
ng
in
po
rts i
n A
SE
AN
(S
ele
cte
d c
ase
s)
Com
pany
Acti
vity
Head
qu
art
ers
Sele
cte
d s
ub
sid
iary
/aff
iliate
Sele
cte
d h
ost
cou
ntr
yR
em
ark
s
DP
Wor
ldP
ort
inve
stm
ent
and
op
erat
orU
nite
d A
rab
Em
irate
sP
T Te
rmin
al P
etik
emas
, Sur
abay
aIn
don
esia
Ow
ns 4
9% s
hare
of s
ubsi
dia
ry; 5
1% o
wne
d
by
Pel
abuh
an In
don
esia
III (
a S
tate
-ow
ned
co
mp
any)
Asi
an T
erm
inal
Inc.
Phi
lipp
ines
Has
a s
take
in t
he a
ffilia
te
Laem
Cha
ban
g In
tern
atio
nal T
erm
inal
Thai
land
Ow
ns 3
4.5%
sha
re o
f the
affi
liate
Sai
gon
Pre
mie
r C
onta
iner
Ter
min
alV
iet
Nam
Ow
ns 8
0% o
f sub
sid
iary
; 20%
ow
ned
by
Tan
Thua
n In
dus
tria
l Pro
mot
ion
Com
pan
y(a
Sta
te-o
wne
d c
omp
any)
Hut
chin
son
Por
ts
Hol
din
gP
ort
inve
stor
, d
evel
oper
and
op
erat
or in
26
coun
trie
s
Hon
g K
ong,
Chi
naJa
kart
a In
tern
atio
nal C
onta
iner
Ter
min
alK
oja
Term
inal
Ind
ones
iaIn
don
esia
.. ..
Por
t K
lang
Mal
aysi
a..
Mya
nmar
Inte
rnat
iona
l Ter
min
als
Thila
wa
Mya
nmar
..
Hut
chin
son
Laem
chab
ang
Term
inal
Thai
Lae
mch
aban
g Te
rmin
alTh
aila
ndTh
aila
nd..
Sai
gon
Inte
rnat
iona
l Ter
min
als
Vie
t N
am..
SS
A M
arin
eP
ort
inve
stor
and
op
erat
orU
nite
d S
tate
sC
ai L
an In
tern
atio
nal C
onta
iner
Ter
min
alS
P-S
SA
Inte
rnat
iona
l Ter
min
al, C
ai M
epV
iet
Nam
Vie
t N
am..
Inte
rnat
iona
l C
onta
iner
Ter
min
al
Ser
vice
s, In
c.
Inve
st, d
evel
op, m
anag
e an
d o
per
ate
cont
aine
r p
orts
and
ter
min
als
Phi
lipp
ines
New
Mua
ra C
onta
iner
Ter
min
al S
ervi
ces
Bru
nei D
arus
sala
m..
PT
Mak
assa
r Te
rmin
al S
ervi
ces,
Sou
th
Sul
awes
iP
T P
bm
Ola
h Ja
sa A
ndal
, Jak
arta
Ind
ones
ia
Ind
ones
ia..
AP
M T
erm
inal
sS
hip
pin
g an
d p
ort
term
inal
op
erat
ions
in 3
8 co
untr
ies
Net
herla
nds
Tanj
ung
Pel
epas
Mal
aysi
aH
as a
30%
sta
ke in
the
affi
liate
Laem
Cha
ban
gTh
aila
nd..
Cai
Mep
Vie
t N
am..
Chi
na O
cean
S
hip
pin
g (C
osco
)S
hip
pin
g an
d lo
gist
ics
serv
ices
Chi
naC
osco
Cor
por
atio
n (S
inga
por
e)S
inga
por
e..
Eve
rgre
en M
arin
eM
ain
bus
ines
s in
sh
ipp
ing
logi
stic
sTa
iwan
Pro
vinc
e of
Chi
na..
Mal
aysi
aTh
aila
ndO
wns
con
tain
er t
erm
inal
s in
AS
EA
N M
emb
er
Sta
tes,
suc
h as
in M
alay
sia
and
Tha
iland
Han
jinM
ain
bus
ines
s in
sh
ipp
ing
logi
stic
sR
epub
lic o
f Kor
ea..
Vie
t N
amO
wns
ter
min
als
in A
SE
AN
Mem
ber
Sta
tes,
su
ch a
s in
Vie
t N
am
S
ourc
e:
UN
CTA
D 2
015b
, bas
ed o
n in
form
atio
n fr
om c
omp
anie
s’ w
ebsi
tes.

Chapter 3: Infrastructure value chains and motivations of MNEs in ASEAN
131
Aside from investors, other players also contribute to ports development by designing or building them. For instance, Mitsui Engineering and Shipbuilding (Japan) is providing 29 cranes estimated at $126 million in Port Klang (Malaysia). Indonesian Port Corporation, a State-owned operator, is expanding the port at Tanjung Priok, Jakarta. PT PP (Persero) (Indonesia) is the main contractor for the expansion project. Royal HaskoningDHV (Netherlands) won the contract to be the lead consultant, supervising the construction of the expansion of a section of the port with local subconsultant Atrya Swascipta Rekayasa.34 The contract covers reclamation, revetments, an access bridge, a container yard and wharf structures. Van Oord (Netherlands) is to provide expertise to deepen the harbour, which includes reclaiming land.35 Mitsui & Co. (Japan) won the contract to build, finance and operate the first container terminal.
Companies such as Antara Koh (Singapore) provided subcontracting services involving specialist tasks to other main contractors in port and other transport infrastructure projects in ASEAN. For instance, for a local company, it supplied and installed piles for container and general cargo docks at Ahlone International Port Terminal (1) in Yangon, Myanmar in 2014.
(b) Airports
Foreign and local companies in ASEAN also play an important role in airport development in the region. The construction of the $1 billion Changi Airport Terminal 4 in Singapore, to be completed in 2017, involves a portfolio of players. A consortium led by SAA Architects (Singapore) and including Benoy (United Kingdom), AECOM (United States) and Beca Carter Hollings & Ferner (SEA) (New Zealand) is responsible for the architecture and design work.36 Local company CSC Holdings was awarded the contract to provide foundation works for the construction of the airport terminal building, ancillary buildings and other infrastructure, while Takenaka Corporation (Japan) is responsible for the construction work. Yongnam (Singapore) won a subcontract for structural steel work. The airport is owned by the Changi Airport Group.
Indonesia is building the $485 million Terminal 3 at the Soekarno Hatta International Airport (Jakarta).37 The new terminal is part of an ongoing $1.24 billion airport expansion plan by operator Angkasa Pura II, which is a State-owned company. Many companies are involved in the building work. The terminal is being built by a consortium led by Wijaya Karya (Indonesia), and including Waskita Karya (Indonesia), Pembangunan Perumahan (Indonesia), Hyundai Engineering (Republic of Korea), Jaya Teknik Indonesia and Indulexco. Incheon Airport (Republic of Korea) and Jaya CM (Indonesia) are acting as project management consultants. Other airport specialists and other Korean companies based in Jakarta are involved with the project. Woodhead (Australia) is the lead architect and designer of the Terminal 3 complex.
Other ASEAN Member States have also expanded or upgraded their key airports, work which involved foreign and local companies. The $900 million Noi Bai International Airport Terminal 2 in Viet Nam, funded through Japanese official development assistance (ODA),

ASEAN INVESTMENT REPORT 2015: Infrastructure Investment and Connectivity
132
was opened in December 2014. The terminal was built by a group of companies that included Taisei Corporation (Japan) and local company Vinaconex (Viet Nam). Japan Airport Consultants provided supervision on the construction activities. Expansion of the Wattay International Airport in Lao PDR, estimated to cost $37.7 million, involved a number of companies. China CAMC Engineering Company was a main contractor, and Nippon Koei (Japan) won a consulting contract. In addition, a new cargo terminal, completed in 2011, was built by Lao-Japan Airport Terminal Building Service. Azusa Sekkei (Japan) designed the terminal and the Bank of Japan provided the $830 million financing facilities. Brunei Darussalam is modernizing and expanding its international airport using a consortium led by Changi Airport Consultants Contractors (Singapore) and AECOM (United States).38 Trans Resources Corporation (Malaysia) and Swee Private Limited (Singapore) were subcontracted by the consortium to carry out the construction works.
(c) Rail
For urban mass rapid transportation systems, a portfolio of local and foreign companies with different skill sets work together to deliver the infrastructure. They include companies contracted for engineering design, rail network construction, station development, civil construction works, tunneling contraction, and production of equipment and system solutions including train sets. The rail value chain and the interconnection of players can be illustrated by the following cases.
Daelim Industrial (Republic of Korea) is building the $84 million, 8.5 km elevated section Line 3 of Hanoi’s metro, to be completed in late 2016.39 The line is expected to transport 200,000 people daily.40 In 2014, a consortium of Shimizu (Japan) and Maeda Corp. (Japan) won the contract to build the 2.6 km underground section of Line 1 of Ho Chi Minh City’s metro.41 Hitachi (Japan) is to provide 17 three-car train sets, signalling, telecommunication, power supplies, platform screen doors, automated fare collection and depot facilities for the city’s Line 1 metro network.42
In Indonesia, a consortium led by Mitsui (Japan), which includes Toyo Engineering (Japan), Kobe Steel (Japan) and local firm PT Inti Karya Persada Tehnik (IKPT) is to build a segment of Line 1 of the Jakarta metro.43 Toyo Engineering is the project manager and will supply overhead electrification and substations, track work, escalators and lifts. Kobe Steel is responsible for systems integration, as well as supplying signalling, telecommunication, automatic fare collection and platform screen door equipment. IKPT is to undertake local installation and supply subcomponents. Sumitomo Corp (Japan) and Nippon Sharyo (Japan) will provide 16 six-car train sets for the Line 1 network. The metro will have the capacity to carry 173,000 people daily. Construction of Line 1 involved a consortium of Shimizu (Japan), Obayashi (Japan), Wijaya Karya (Indonesia) and Jaya Konstruksi (Indonesia) to construct two underground civil works packages. A consortium of Sumitomo Mitsui Construction Company (Japan) and PT Hutama Karya (Indonesia) will undertake another.44 Sumitomo (Japan) and Nippon Sharyo (Japan) have established a railway engineering firm in Indonesia with a local partner.45 Sumitomo was awarded a ¥13 billion contract in 2015

Chapter 3: Infrastructure value chains and motivations of MNEs in ASEAN
133
to supply MRT Jakarta (Indonesia) with 96 subway cars (as equipment supplier) for the North–South Line of the Jakarta Mass Rapid Transit system.
In Thailand, the 23 km Purple Line of the Bangkok Mass Transit System (BTS) is expected to begin operation in 2016. Construction of the line is being developed by Bangkok Metro Public Company under a 30-year PPP contract. CH Karnchang (Thailand), main contractor of the line, awarded Marubeni (Japan) and Toshiba (Japan) a contract to provide rolling stock and power, signalling, control, telecommunication and other railway systems for the line, along with 10 years of maintenance.46 East Japan Railway’s J-TREC is to provide 21 three-car metro train sets.
Local and foreign companies are involved in the construction of the northern extension of the BTS Skytrain Sukhumvit Line from Mo Chit to Ku Kot. These companies include Italian-Thai Development (Thailand) for civil works on the 12 km Mo Chit–Saphan Mai section. A joint venture of Unique Engineering & Construction (Thailand), Sinohydro (China) and China Harbour Engineering will construct the 7.5 km Saphan Mai–Ku Kot section.47 Other contractors associated with the extension of this BTS line include a joint venture of Sino-Thai Engineering & Construction (Thailand) and AS Associate Engineering (Thailand). Construction of the 16-station extension is scheduled to be completed in 2020.
In Singapore, an urban rail project, Downtown Line Stage 1, was completed in 2013 with the participation of a number of companies on different construction and development activities.48 Examples of the players include Taisei Corporation (Japan), which designed and constructed the line. Shimizu Corporation (Japan) constructed the tunnel between Promenade station and Marina Bay. Cross Street station was built by a joint venture of Soletanche Bachy (France), Koh Brothers (Singapore) and Samsung Engineering and Construction (Japan). The former two won the contract to carry out civil works for the project and were involved with the construction of the Bugis station and associated tunnels. The Chinatown station was built by Gammon Construction (Hong Kong, China). CPG Corporation (Singapore) was a subcontractor of the Soletanche Bachy and Koh Brothers joint venture for engineering, construction and management services for the tunnel construction near Bugis station. Alstom (France) installed the tracks and supplied the design and related equipment for the DTL Stage 1 project. Bombardier Transportation (Canada) and its subsidiary in Singapore supplied 73 three-car train sets. Westinghouse Brake and Signal Holdings (United Kingdom) supplied and installed the signalling system and platform screen doors. The communication systems were supplied by Singapore Technologies Electronics. Otis Elevator Company (United States) supplied, installed and commissioned 108 lifts. Constructions Industrielles de la Méditerranée (France) designed, manufactured and commissioned 299 escalators.
Downtown Line Stage 2 in Singapore, at an estimated $644.5 million, is due to be completed in 2015. The project also involved a portfolio of companies.49 Some of these companies and their specific activities include Invensys Rail (United Kingdom) for comprehensive signalling and communication for the project, track laying by Alstom (France), design and construction work by a joint venture of GS Engineering and Construction (Republic of

ASEAN INVESTMENT REPORT 2015: Infrastructure Investment and Connectivity
134
Korea) and Hock Seng Infrastructure (Singapore). Tunneling works involved a number of companies, including SK E&C (Republic of Korea) and McConnell Dowel (Australia) for the design and construction of two tunnels and Shanghai Tunnel Engineering (China) for construction of a tunnel. A design and construction contract was awarded to SsangTong Engineering & Construction (Republic of Korea), which subcontracted the work to Mott Macdonald (United Kingdom).
(d) Bridges and roads
Various types of companies, foreign and local, are involved at different stages of road and bridge development. They include companies providing services for technical design, materials, construction, subcontracting, tunneling, equipment manufacturers and suppliers, and technology or solution system providers.
In bridge development, a subsidiary of LafargeHolcim (Switzerland) supplied cement for the construction of the $150 million, 705 m Phu My Bridge in Viet Nam. The bridge was constructed by a consortium consisting of Bilfinger Berger (Germany) and Baulderstone Hornibrook (Australia). Chau Thai Concrete Corporation 620 (Viet Nam) developed the bridge viaducts as a subcontractor. Freyssinet, a subsidiary of the Vinci Group (France), installed the cable stays, prestress and heavy lifts as a specialist subcontractor. The design of the main bridge was by Arcadis (France). Cardno (Australia) developed the approach structures. Cardno and Leonhardt, and Andrä und Partner (Germany) designed the temporary work and provided construction engineering services for the main bridge.50 Societé Générale (France) provided financial facilities for the project with export credit loans from Germany, France and Australia. Subcontractors such as Antara Koh (Singapore) constructed the foundation for the Neak Loeung Bridge across the Mekong River in Cambodia in 2013 for the main contractor, Sumitomo Mitsui Construction (Japan). In 2011, Antara Koh undertook the foundation works for the construction of the Nhat Tan Bridge and a 3.9 km bridge section over the Red River in Hanoi for Sumitomo Mitsui Construction (Japan).
While the construction of roads is often dominated by local companies, foreign companies are significant players as solution or system providers. For instance, a consortium of Japanese companies comprising Toshiba Corporation, Hitachi and Itochu is to provide a $39 million intelligent transport system for part of Viet Nam’s North-South Expressway. The system will include electronic toll collection, traffic control and equipment monitoring systems. Vix Technology (Australia) is developing a cashless payment system for the Kuala Lumpur-Klang Valley multimodal transport system.51
The Secondary National Roads Development project in the Philippines, which is due to be completed in 2016, involves different players in different stages of the road construction. Tetra Tech (United States) and Gauff Engenierre (Germany) are involved in the project design, while Katahira Engineers International (Japan) is responsible for the management and construction supervision of the project, Qingjian (China) is responsible for construction work under Contract Package 2, and Hanjin (Republic of Korea) together with Yakal (Philippines) is undertaking construction work under Contract Package 4.

Chapter 3: Infrastructure value chains and motivations of MNEs in ASEAN
135
The completed Marina Coastal Expressway in Singapore involved main contractors and subcontractors. The former includes a consortium of Mott MacDonald (United Kingdom), Samsung (Republic of Korea) and Ssangyong (Republic of Korea), in which each brought specific skill sets that contributed to the completion of the project.
The $40 million Vietnam–Lao PDR 2E highway was a priority project for the two countries. The highway was developed by a consortium consisting of Lao Transport Engineering Consult (LTEC), Transport Engineering Design Inc. (TEDI-Viet Nam), and Lao Cooperation. It involved eight bridges. LTEC and TEDI-Vietnam provided supervision and consultancy services, while Lao Cooperation Company carried out construction on 30 km of the highway. Road Company No. 18 (Viet Nam) constructed the remaining 38.2 km stretch. The Government of Viet Nam provided a 15-year soft loan facility for the project.
The construction of the $1.4 billion Da Nang–Quang Ngai Expressway in Viet Nam is expected to be completed in 2017.52 The project involves a joint venture of Korean companies (Korea Expressway Corporation and Dohwa Engineering), which are to provide integrated project review and monitoring consulting services. A consortium of Japanese companies (Nippon Koei, Nippon Engineering Consultants and Chodai) and Thai Engineering Consultants won the contract to design and provide consulting services. A Japanese consultant based in Viet Nam (Fukken & Minami Consultant) is a subcontractor in the project. Two local Vietnamese companies will manage and implement the construction of the project (Civil Engineering Construction Corporation No. 4 and Thang Long Construction Corporation).
3.2.4. ICT-enabled value chains: e-commerce
The value chain of ICT, in particular telecommunication infrastructure, extends to downstream business operations such as e-commerce. Without ICT infrastructure, e-commerce would not exist in the way it does today. Yet, e-commerce is increasingly an important platform for trade, commerce and business development in the region, which is an important channel for promoting entrepreneurship and SMEs.
From the perspective of a small enterprise, engaging in business-to-business (B2B) e-commerce may be a requirement for participating in national or global value chains. Meanwhile, business-to-consumer (B2C) e-commerce may allow smaller firms to access new clients domestically and abroad. E-commerce currently accounts for less than 1% of the total retail sales in ASEAN (AT Kearney 2015), but this share is expected to grow.
High-quality and affordable access to ICT infrastructure and services are essential for enterprises and consumers to engage in e-commerce. At the most basic level, people need to be able to communicate by mobile phones. It is increasingly important for the Internet to be accessible and for data services to be provided in both urban and rural areas. Most Internet traffic now comes from mobile devices. High-speed, broadband connectivity is required to seize the full opportunities from e-commerce, including leveraging cloud solutions for the purchase of digital products that need high-quality broadband service.

ASEAN INVESTMENT REPORT 2015: Infrastructure Investment and Connectivity
136
More and more goods and services are delivered over ICT networks. Such digital delivery can happen in several ways: instant and permanent download to the user’s computer, limited download (for example, a rental product such as a video that expires after a certain time), streaming download or cloud storage (upload and download). The digital delivery process is affected by the quality of a buyer’s Internet connection (UNCTAD 2013a). Whereas small digital products (for example, a song or a book) require a relatively slow download speed, videos require faster speeds. Low latency – that is, more direct routing over the network – is also critical for products such as videos.
The network speed situation in ASEAN varies. According to data compiled by the Ookla Net Index, average download speeds in July 2015 ranged from 3.7 Mbps in the Philippines to 131.6 Mbps in Singapore – the highest in the world (figure 3.5).
Singapore has the highest penetration of Internet access – 40 times more users than in Myanmar (table 3.11). More than half of all Internet users in Singapore already buy online, as compared with less than 10% in Indonesia and Thailand.
The proportion of enterprises that access the Internet is influenced by their size, with larger firms tending to have higher levels of use. For example, in Thailand, 20% of large enterprises placed orders online in 2012 but only 2% of micro enterprises. In Indonesia,
the corresponding figures for 2014 were 54% for large enterprises and 4% for micro ones.53
On the part of a seller, a web presence for accepting orders is necessary. About 110,000 e-commerce sites in the world generated non-negligible revenue in 2014.54 Given that e-commerce sites require security software, a useful proxy for the quality of e-commerce infrastructure is the number of so-called secure servers that use encryption technology for Internet transactions. There are considerable differences between countries. In 2014, there were over 930 secure data servers per million inhabitants in high-income economies compared with one server per million inhabitants in the least developed countries. Such diversity is visible also in ASEAN,
Source: Ookla Net Index (http://www.netindex.com/download/allcountries/) (accessed 20 July 2015).
Figure 3.5.Singapore has the highest broadband speeds for households in ASEAN, July 2015 (Mbps)
0 50 100 150
Singapore
Thailand
Viet Nam
Cambodia
Brunei Darussalam
Malaysia
Indonesia
Lao PDR
Myanmar
Philippines
Upload speeds (Mbps)
Download speeds (Mbps)

Chapter 3: Infrastructure value chains and motivations of MNEs in ASEAN
137
Table 3.11. Uneven e-commerce readiness in ASEAN, 2014 (selected indicators)
CountryShare of individuals using the Internet
(%)
Secure servers per million inhabitants
Rank in UNCTAD B2C e-commerce index
Share of Internet users buying online
(%)a
Singapore 81.0 822.3 26 52
Malaysia 67.5 87.7 45 24
Brunei Darussalam 64.5 148.9 .. 38
Viet Nam 48.3 11.9 90 ..
Philippines 37.0 10.8 .. ..
Thailand 34.9 23.5 70 7
Indonesia 17.1 6.3 88 10
Lao PDR 14.3 2.0 106 ..
Cambodia 9.0 3.0 92 ..
Myanmar 2.1 0.5 .. ..
Sources: ITU, World Bank and UNCTAD.a Data refer to 2014 for Indonesia, 2013 for Brunei Darussalam and Thailand, 2012 for Singapore and 2011 for Malaysia.
with only 0.5 secure servers per million people in Myanmar and more than 800 per million people in Singapore (table 3.11).
A 2013 UNCTAD study conducted in collaboration with the ASEAN Secretariat made several recommendations on how to better leverage cyber laws to contribute to the development of the ASEAN Economic Community (UNCTAD 2013b). The recommendations include commissioning an updated road map to help Member States develop and harmonize domestic e-commerce laws; strengthening information-sharing exchanges of best practices; building capacity; promoting a greater awareness of e-commerce legislation among users; strengthening cross-border harmonization on jurisdictional issues, conflict resolution and cooperation, including in cybercrime, consumer protection and e-signatures; and implementing a multiyear project on e-commerce and law reform.
E-commerce readiness among ASEAN economies varies considerably, but there are promising developments in most countries (UNCTAD 2015a). In the Philippines, growing exports of various ICT-enabled services are a good example of B2B e-commerce. In Cambodia, local retailers, such as Little Fashion and Shop168.com, allow customers to browse and order products online. They use private delivery services in Phnom Penh and receive cash on delivery. In Viet Nam, some companies are now specializing in addressing the delivery and payment function of e-commerce. A well-known example is Giao Hang Nhanh. In 2012, its first year of business, it delivered more than 60,000 orders; in 2013, it served more than 800 online merchants and handled over $70,000 of transactions per week.55
There is generally little information on cross-border trade and investment related to e-commerce in the ASEAN region. None of the top 10 Internet retailer companies in Asia are from an ASEAN Member State. The top five largest e-commerce sites were Zalora, Lazada, Reebonz, iBuyGroup (all of which are based in Singapore) and Groupon (United

ASEAN INVESTMENT REPORT 2015: Infrastructure Investment and Connectivity
138
States).56 Several of them are active in multiple ASEAN Member States. Both Zalora and Lazada are partly owned by Rocket Internet (Germany).
3.3. Drivers and motivations of MNEs’ infrastructure investment
In infrastructure activities, MNEs derive their competitive advantages from a variety of sources and invest mostly to access markets and increase revenue bases. In some cases, infrastructure-related companies invest in different segments of a value chain as part of their integrated business models by moving into upstream or downstream operations, or to support forward or backward vertical integration of core business functions. Non-infrastructure companies and financiers invest in infrastructure to diversify and hold a portfolio of assets, with varying degrees of risk-return arrangements.
Drivers and motivations can be categorized as “push” and “pull” factors (AIR 2013). The former relate to factors driving MNEs to invest abroad while the latter relate to locational and regional factors that lead MNEs to operate in the region.
The drivers and motivations of investment in infrastructure differ by companies and industries. Drivers include opportunities to exploit firm ownership advantages, corporate aspirations and other home country factors that drive infrastructure-related MNEs to venture overseas. Motives can be subdivided into four main types: market-seeking, resource-seeking, efficiency-seeking and strategic asset–seeking. For instance, MNEs investing in power generation activities in a host country with a view to selling to local buyers or exporting to neighbouring countries can be classified as having a “market-oriented motive”. This is the case for Thai power companies, which have built power plants in Lao PDR to export electricity back to Thailand (e.g. EGAT International, EGCO and Ratchaburi Electricity Generating Holding). However, motives can also be mixed. Some of the companies in this group chose to invest in Lao PDR because they could gain access to ample hydropower resources (resource-seeking motive) and they are likely to regard the move as a more efficient strategy to secure energy supplies to serve the growing Thai market (strategic asset–seeking motive). Such power investment by Thai companies can also be motivated by efficiency-seeking motives in that it also helps to save the cost of power project construction and generation at home, both of which can be relatively higher.57
Infrastructure companies need to possess certain ownership advantages to invest abroad (table 3.12). These might include, for instance, engineering skills, technological superiority, or management skills in managing, constructing and operating complex projects. Possession of international brand names, a proven record of successful projects, and global networks and alliances (including strong financial resources) are also important advantages. Companies invest abroad to exploit their core skills or infrastructure business operations. For instance, the Port of Singapore Authority, DP World (United Arab Emirates) and Hutchinson Ports Holdings (Hong Kong, China) invest abroad in a horizontal overseas investment strategy to exploit core business skills in port investment and operation. The latter two MNEs have significant port operations in ASEAN. Malaysia Airports Holdings, exploiting its airport operations abroad, has managed two airports in Cambodia. It now has

Chapter 3: Infrastructure value chains and motivations of MNEs in ASEAN
139
Table 3.12. Infrastructure FDI is influenced by different drivers and motivations
Sources Key factors Specific elementsFirm ownership advantages Proprietary advantage and knowledge Possess technological capabilities and engineering skills,
including a proven record in handling and managing huge, complex infrastructure projects. Building, managing and operating infrastructure assets is the core business.
Brand names and global networks and reputation
Some infrastructure companies have reputations or brand names that have helped them secure infrastructure projects in ASEAN Member States. Increasingly infrastructure MNEs and construction companies from developing countries are emerging in the region because of their cost advantage and technological capabilities. Chinese companies are able to win contracts in ASEAN Member States partly because of their cost advantage.
Financial capacity and access to financial facilities
Some infrastructure MNEs have access to the huge financial resources of the parent company and hence are able to invest in or operate projects that require large capital outlays. Some have easier access to finance that supports the undertaking of international infrastructure projects.
Business models, strategy and alliances
• Integrated business model such as linking upstream to downstream operations
• Business networks and alliances to form consortiums, including through joint venture arrangements to take on large, complex projects, help pool expertise and resources, and spread out risks
Some MNEs invest abroad because they are pursuing an integrated business strategy. These MNEs move up the value chain from construction of assets for others to ownership and operation of assets in the host country. Some invest in infrastructure in host countries to support their core business operations. Strategic alliances and partnerships with other major infrastructure players under a consortium arrangement can also encourage overseas ventures.
Oil and gas exploration and production, and coal mining companies invest in power generation plants. Shipping companies operate terminal ports in foreign countries.
Internationalization drive To expand revenue bases and access new markets; sometimes to strengthen market share; to pursue aspirations to be among key global or regional market players.
The need to be close to customers or have a significant presence by setting up subsidiaries or representative offices in host countries with rapidly growing infrastructure industries; also helps in securing contracts
With limited or saturated markets at home, many infrastructure companies in Malaysia and Singapore invest abroad or secure infrastructure contracts mainly in other developing countries. Korean, Japanese and European companies also invest abroad, in the face of saturated markets at home and encouraged by opportunities from internationalization.
Equipment suppliers, solution providers, and engineering and construction companies set up operations in host countries. Many Japanese, Korean, Chinese, European and American construction and infrastructure-related companies have established a presence in ASEAN Member States.
Changing external environment
Technological change, providing new opportunity to technology suppliers to move up the value chain
Technology suppliers integrate power production such as in wind or solar power.

ASEAN INVESTMENT REPORT 2015: Infrastructure Investment and Connectivity
140
Sources Key factors Specific elementsHome country factors Limited or saturated market, making it
difficult to support growthLimited opportunities to grow and expand revenues
Government policy supporting or encouraging going abroad
Examples include Singapore’s enterprise internationalization policy and the Chinese and Thai governments’ outward FDI policies.
Support from home country banks and financial institutions in providing loans for investment in infrastructure projects
Exim banks providing supportCommercial banks providing syndicated loans for infrastructure projects
Competition at home Drive home-based MNEs to diversify markets and increase growth from emerging markets
Host country measures Market size and market attraction Rapid economic growth, urbanization, and rising per capita and population growth indicate potential for strong growth in demand in infrastructure services.High-growth market attracts investment because of potential returns.
Liberalization, deregulation and privatization
Sectors that were once closed for foreign investments are now open, with majority or wholly owned foreign ownership allowed in some cases. Industry liberalization opens up investment opportunities to MNEs.
Privatization of power and telecommunication assets in some ASEAN Member States has led to the rise in the number of private players (e.g. IPPs in electricity, telecommunication operators). Some ASEAN Member States such as Singapore have privatized electricity generation assets, which provides opportunities for foreign MNEs to participate in power generation in the host country.
PPP programme, concessions and huge infrastructure plans
Such programmes have attracted private participation in infrastructure in ASEAN.
Bilateral and regional infrastructure cooperation programmes
Power purchase agreements between countries enable exports of electricity generated in one country to a neighbouring country.
Regional factors Regional initiatives such as the ASEAN Economic Community and the ASEAN Connectivity programme
Regional initiatives or projects such as the ASEAN Power Grids, PPAs, Trans-ASEAN Gas Pipelines, SKRL, open skies initiative, and the proposed roll-on roll-off shipping programme (chapter 4).
Source: UNCTAD 2015b.
Table 3.12. Infrastructure FDI are influenced by different drivers and motivations (concluded)
operations in India, Turkey and Qatar. Similarly, Changi Airports International (Singapore) is involved in development of and investment in airports in a number of countries including Brazil, the Russian Federation and India through joint partnerships with other companies.
Corporate strategy and aspirations can also be important forces driving infrastructure companies to venture abroad. Some infrastructure-related MNEs have internationalized to expand their market reach, global footprint and revenue bases through various approaches and for different reasons. They internationalize to grow and to be a major or larger player in their industry. These MNEs include Alstom (France), Axiata (Malaysia), GDF Suez (France), GE (United States), Hitachi (Japan), Huawei (China), ITD (Thailand), Singapore

Chapter 3: Infrastructure value chains and motivations of MNEs in ASEAN
141
Telecommunication, Telenor (Norway), and many other Malaysian, Singaporean and Thai infrastructure MNEs.
Some infrastructure-related companies invest abroad to pursue corporate development or expansion strategies (horizontal, vertical and diversification) (table 3.13). For instance, equipment suppliers or solution providers become owners of infrastructure assets in the power generation and telecommunication industries. Shipping companies invest abroad in port terminals to support their shipping businesses, and EPC companies may not only construct infrastructure assets abroad but also own and operate them.
Companies such as Keppel Corporation (Singapore) acquired and operate ports in Guangdong Province, China, to provide integrated logistics solutions for industrial clients based in and around that province. Maersk (Denmark), a shipping company, invests in port terminals in ASEAN countries to support its international shipping operations. Similarly, Hanjin Shipping (Republic of Korea), Mitsui O.S.K Lines (Japan) and Wanhai Lines (Taiwan Province of China) invested in and are operating Tan Cang Cai Mep International Terminal in Viet Nam in a joint venture with Saigon New Port to support their shipping businesses. Banpu (Thailand), a mining company, invests in and operates power plants at home and abroad.
Some MNEs invest abroad as a diversification strategy to bolster revenue streams from different business activities, such as sovereign wealth funds (SWFs) and commercial banks taking a stake in infrastructure projects located outside their home countries. There are also MNEs that invest in infrastructure projects as a result of emerging opportunities. For example, Toyo Ink (Malaysia), a chemical manufacturing company producing solvents and water-based ink, is building a power plant in Viet Nam. However, such cases are few.
Changes in the environment external to a company, such as the emergence of new technologies and climate change concerns, can provide an impetus for companies to venture abroad to take advantage of new opportunities. Renewable technology for power generation (e.g. wind, wave and solar) provides opportunities for a new set of power generation companies to invest in and operate abroad using new technology. The technological development in mobile phone and data service has provided opportunities for companies to get involved in telecommunication infrastructure and services in overseas countries.
In some cases, infrastructure MNEs invest abroad because of limited opportunities to grow at home and increasing competition in home markets (e.g. engineering and construction companies in Malaysia and Singapore). The support of home governments can play an important role in encouraging MNEs to invest abroad and in the region, for example, through international cooperation programmes (e.g. ODA) and provision of financing facilities. The encouragement provided by home governments (e.g. in China and Singapore) has helped companies from these countries venture abroad (AIR 2014, Wenbin and Wilkes 2011, UNCTAD 2007, Wee 2007). More and more countries are adopting outward FDI policies or measures to encourage their national companies, including infrastructure and construction

ASEAN INVESTMENT REPORT 2015: Infrastructure Investment and Connectivity
142
Table 3.13. Power, ports and telecommunication infrastructure companies with overseas expansion strategies, selected factors and cases
Strategy Horizontal strategy Vertical strategy Diversification strategy Opportunistic drive
Primary reason Owners of infrastructure assets expand abroad to replicate their core infrastructure operation or exploit core skills.
Companies invest and operate in upstream or downstream or backward or forward integration to support integrated business models.
Companies in unrelated business areas invest in infrastructure activities abroad to diversify revenue sources from their core business operations (portfolio diversification).
Companies undertake infrastructure investment or projects to take advantage of opportunities in overseas locations where they have won contracts.
Examples of industry
Transport: ports Ports operation is the core business. Companies invest abroad in container terminals for geographical expansion and diversification reasons.
Maritime shipping is the main business. Companies invest abroad in container terminals to support their shipping operations. Companies operate or invest in ports to support integrated logistics businesses for industrial customers.
Financial asset management is the main business. Companies invest in container terminals for valuation and revenue generation.
EPC companies and concession opportunities
Examples of port and related companies
• Port of Singapore Authority (Singapore)
• Dubai Port World (United Arab Emirates)
• Hutchinson Ports Holding (Hong Kong, China)
• SSA Marine (United States)
• International Container Terminal Services, Inc. (Philippines)
• APM (Denmark)• Cosco (China)• APL (Singapore)a
• Evergreen (Taiwan Province of China)
• Hanjin (Republic of Korea)
E.g. Keppel Corp. (Singapore) invests in river ports in Guangdong Province, China. Hanjin Shipping (Republic of Korea), Mitsui O.S.K Lines (Japan) and Wanhai Lines (Taiwan Province of China) invest in Tan Cang Cai Mep International Terminal in Viet Nam with Saigon New Port.
• SWFs (Khazanah – Malaysia; Temasek – Singapore)
• Corporate infrastructure funds
(Macquarie Infrastructure Fund, Morgan Stanley Infrastructure Fund)• Commercial banks• Other financiers
Transport: airports Airport operation is the core business. Companies invest abroad in airport development and management for geographical expansion and diversification reasons.
Airline or courier service is the main business. Companies invest in airports or airport-related infrastructure (air cargo/freight hub) to support their airline or courier operations.
Financial asset management is the main business. Companies invest in airports for valuation and revenue generation.
EPC and concession opportunities
• Eversendai (Malaysia)• Muhibbah Engineering
(Malaysia)
Examples of airport and related companies
• Malaysia Airports Holding (Malaysia)
• Changi Airports International (Singapore)
• Vinci (France)• Incheon (Republic of
Korea)• Yongnam (Singapore)
• DHL• FedEx• Bangkok Airways• Emirates Airline
• SWF (Khazanah – Malaysia; Temasek – Singapore)
• Infrastructure funds• Financial institutions
Utilities: power Power generation is the core business. Companies invest abroad in power generation for geographical expansion and diversification reasons.
Oil, gas and coal production is the main business. Companies invest abroad in power generation to support their business integration models (from upstream to downstream activities). Some technology or equipment suppliers invest abroad to integrate different segments of the value chains from supplying equipment to power generation activities.
Financial asset management is the main business. Companies invest in power generation for valuation and revenue generation.
EPC and concession opportunities
Companies win contracts or receive investment approval to develop and/or operate and manage infrastructure assets in a host country (e.g. Toyo Ink (Malaysia) is building a power plant in Viet Nam).

Chapter 3: Infrastructure value chains and motivations of MNEs in ASEAN
143
Strategy Horizontal strategy Vertical strategy Diversification strategy Opportunistic drive
Examples of power and related companies
• EGCO (Thailand)• GDF Suez (France)• Electricité de France• Ratchaburi Electricity
Generating Holding (Thailand)
• Banpu (Thailand)• Petronas (Malaysia)• Adaro Energy (Indonesia)• BP (United Kingdom)• GE (United States)• Alstom (France)
SWFs; commercial banks and infrastructure funds
• Contractors: Marubeni (Japan), ABB (Switzerland), Alstom (France), Zelan (Malaysia)
Telecom-munication
Telecommunication is the core business. Companies invest abroad in telecommunication infrastructure to exploit core skills and for geographical expansion reasons.
Providing telecommunication (e.g. mobile and data) services is the main business. Companies invest abroad as part of their business integration strategies and to expand their market bases.
Financial asset management is the main business. Companies invest in telecommunication for valuation and revenue generation.
EPC and concession opportunities
Examples of telecom-munication and related companies
• Axiata (Malaysia)• China Mobile (China)• SingTel (Singapore)• Huawei (China)• Ooredoo (Qatar) • Telenor (Norway)
• Axiata (Malaysia)• China Mobile (China)• SingTel (Singapore)• Huawei (China)• Ooredoo (Qatar) • Telenor (Norway)
SWFs; commercial banks and infrastructure funds
Sources: UNCTAD 2015b and Rodrigue and Notteboom (2009).Note: a A subsidiary of Neptune Orient Lines.
Table 3.13. Power, ports and telecommunication infrastructure companies with overseas expansion strategies, selected factors and cases (concluded)
entities, to internationalize or regionalize (examples include Malaysia, Singapore, Thailand and Viet Nam).
State-owned banks, exim (export-import) banks and commercial financial institutions of a home country have played a role in supporting infrastructure companies in undertaking projects overseas (chapter 2). Chinese, Malaysian, Thai and Japanese banks, for instance, have provided financing facilities and long-term loans to their national companies that are involved with overseas infrastructure activities in the region. The China-ASEAN Investment Cooperation Fund has supported infrastructure activities involving Chinese MNEs (AIR 2014).
ASEAN infrastructure-related companies have internationalized or regionalized for a combination of “push” and “pull” factors (AIR 2013). Some do so to take advantage of opportunities in the rapidly integrating region or farther abroad. Some have been compelled to go abroad because of limiting factors in the home countries such as saturated markets and limited opportunities for growth.
Significant potential in a host country market attracts infrastructure investment. Potential draws include, among others, a rapidly growing economy, a large population and a commitment to huge national infrastructure investment plans. Countries in the ASEAN region possess many of these locational determinants (KPMG 2014b, PwC 2014).
Privatization of infrastructure assets and active promotion of private participation through PPP programmes in infrastructure have played a role in attracting investment involving MNEs. Similarly, PPAs between countries influence investment decisions in power generation projects such as that between Thailand and Lao PDR.

ASEAN INVESTMENT REPORT 2015: Infrastructure Investment and Connectivity
144
3.4. Conclusion
In general, the value chain of infrastructure industries ranges from design, construction and development to operation and management (O&M). The infrastructure value chain in ASEAN is complex and involves a portfolio of players. In each of the infrastructure sectors (power, transport and ICT) examined, different players bring specific skill sets to support the delivery of infrastructure. In most cases, these players work in close partnership or consortia involving many other subcontractors from raw material suppliers, engineering design companies and equipment suppliers to solution providers and specialized service contractors. In some Member States and infrastructure sectors, key value chain segments are dominated by MNEs (e.g. EPC contractors, equipment suppliers, solution providers). MNEs from developed and developing economies, including from ASEAN, are investing, building, operating, financing and managing infrastructure assets in the region.
Different companies may be involved at different stages of the value chain. In some cases, the same company may be involved across a number of segments from development to O&M, which reflects such companies’ integrated business strategy, diversified skills and ability to win multiple contracts. Another set of companies might be involved at the construction or development stages. Some companies may provide only equipment or solutions to EPC contractors in the value chain. Each infrastructure sector has its own specific features and interconnections of different players, involving both local and foreign-owned entities. It is important to understand who plays what role in the infrastructure value chain so that projects can be packaged to target stakeholders.
MNEs’ motives for investing in infrastructure in ASEAN vary. Winning infrastructure contracts is an important consideration. Most motives are related to market and strategic considerations. Some MNEs invest in infrastructure to support their core business in order to achieve overall operation efficiency. Upstream MNEs may invest in downstream infrastructure to establish an integrated business. Others invest to diversify into or across infrastructure chains or segments to generate revenues, reduce risk or increase corporate valuation. Some pursue a horizontal expansion strategy, investing overseas in order to maximize returns from exploiting their proprietary advantage, knowledge or skill sets. While most of these reasons can be associated with “push” factors, other reasons such as “pull” factors can also influence an MNE’s participation. Rapid population growth, strong demand, urbanization, an affluent society and the commitment of ASEAN Member States to improving infrastructure have also encouraged regional and foreign companies to participate in infrastructure development.
Notes
1 See Oxford Business Group, “The Report: Myanmar 2015”, 20152 http://www.power-technology.com/projects/dai-nanh/3 AES (http://www.aes.com/our-business/asia-sbu/default.aspx)4 Power-technology.com, “Alstom-Marubeni consortium wins €950m contract for power project
in Thailand”, March 2015 (http://www.power-technology.com/news/newsalstom-marubeni-

Chapter 3: Infrastructure value chains and motivations of MNEs in ASEAN
145
consortium-wins-950m-contract-of-power-project-in-thailand-4528548)5 ABB, “Powering up the Philippines”, Power Generation Reference (http://new.abb.com/power-
generation/references/powering-up-the-philippines)6 ABB, “Helping Java reduce its power shortage”, Power Generation Reference (http://new.abb.
com/power-generation/references/helping-java-reduce-its-power-shortage)7 http://www.gamesacorp.com/en/communication/news/gamesa-enters-the-thai-market-with-
an-order-for-the-supply-of-60-mw-at-three-wind-farms.html?idCategoria=0&fechaDesde=&especifica=0&texto=&idSeccion=0&fechaHasta=
8 KfW IPEX-Bank, “Most efficient power plant in Southeast Asia: KfW IPEX-Bank finances San Gabriel CCP power plant”, press release, 11 July 2014 (https://www.kfw-ipex-bank.de/International-financing/KfW-IPEX-Bank/Presse/Pressemitteilungen/Pressemitteilungsdetails_213760.html)
9 Asahi Glass Company, “AGC to construct power plant in Indonesia – Aimed at enhancing competitiveness in Southeast Asia and accelerating growth strategies of chemicals segment”, news release, 8 April 2015 (http://www.asahi-glass.jp/english/news/2015/0408e.pdf)
10 http://www.thesundaily.my/news/93790511 http://infopub.sgx.com/FileOpen/Windsor-PressRelease-Telecoms_final_May%202015.ashx?A
pp=Announcement&FileID=34854312 http://www.independent.ie/business/irish/digicel-mulls-sale-of-myanmar-towers-31352046.
html13 http://www.prnewswire.com/news-releases/pan-asia-majestic-eagle-limited-pamel-enters-
into-first-ever-non-recourse-cross-border-financing-in-myanmar-277685381.html14 http://www.reuters.com/article/2015/05/20/apollo-towers-myanmar-idUSnBw206326a100+
BSW2015052015 In April 2015, Nokia and Alcatel-Lucent announced they would merge. See https://www.alcatel-
lucent.com/press/2015/nokia-and-alcatel-lucent-combine-create-innovative-leader-next-generation-technology-and-services-ip
16 http://uk.reuters.com/article/2012/04/25/zte-earns-idUKL3E8FN8Q22012042517 http://pr.huawei.com/en/news/hw-433846-mct.htm#.Ve2rJrQ7P2w18 https://www.alcatel-lucent.com/press/2014/alcatel-lucent-starts-construction-sea-me-we-5-
undersea-cable-system-linking-singapore-and-france19 https://www.infinera.com/nec-and-telenor-group-sign-a-global-framework-agreement-to-
deliver-end-to-end-transport-network-solutions/20 http://newsroom.cisco.com/press-release-content?type=webcontent&articleId=4275421 http://newsroom.cisco.com/press-release-content?articleId=111429922 http://newsroom.cisco.com/bg/press-release-content?type=webcontent&articleId=433305823 http://www.prweb.com/releases/2006/06/prweb399987.htm24 http://www.amdocs.com/news/pages/amdocs-wins-major-project-at-singtel.aspx25 http://www.amdocs.com/news/pages/amdocs-delivers-bss-bidw-transformation-global-
telecom.aspx26 http://www.amdocs.com/news/pages/amdocs-and-true-extend-engagement.aspx27 http://www.amdocs.com/news/pages/vietnamtelecom070409.aspx28 http://www.amdocs.com/news/pages/xl-axiata-deploys-amdocs-mobile-payments-for-direct-
carrier-billing.aspx29 https://www.dialogic.com/en/company/press-releases/2014/2014-08-26-myanma-posts-and-
telecommunications-modernizes-network-with-dialogic-ngn-infrastructure.aspx30 http://www.intextelecom.com

ASEAN INVESTMENT REPORT 2015: Infrastructure Investment and Connectivity
146
31 http://ntegrator.listedcompany.com/newsroom/20141103_173406_5HC_6PDW2Q0MH614ORDU.1.pdf
32 http://container-mag.com/2014/12/22/new-container-terminal-set-built-tanjung-priok-port/33 http://www.amchamvietnam.com/3963/japan-firms-to-build-joint-venture-container-port-in-
north-vietnam/34 http://jakartaglobe.beritasatu.com/business/dutch-firm-wins-contract-for-tanjung-priok-port-
extension/35 http://www.vanoord.com/activities/tanjung-priok-port-expansion-project36 http://www.takenaka.co.jp/takenaka_e/about/news/2014/m1001_01.html37 http://www.aci-apa.com/features/airport-design/85/design-build-jakarta-soekarno-hatta-
international-airport38 http://www.rtbnews.rtb.gov.bn/index.php?option=com_content&view=article&id=8806%3Amo
dernisation-and-expansion-of-brunei-international-airport-terminal&Itemid=7439 http://www.railwaygazette.com/news/news/asia/single-view/view/hanoi-metro-line-3-
contractor-chosen.html40 http://www.railwaygazette.com/news/single-view/view/eib-supports-hanoi-metro.html41 http://www.railwaygazette.com/news/news/asia/single-view/view/ho-chi-minh-city-selects-
underground-contractors.html42 http://www.railwaygazette.com/news/urban/single-view/view/ho-chi-minh-city-line-1-em-
contract-signed.html43 http://www.railwaygazette.com/news/news/asia/single-view/view/last-jakarta-line-1-contract-
awarded.html?sword_list%5B%5D=indonesia&no_cache=144 http://www.railwaygazette.com/news/urban/single-view/view/jakarta-metro-contracts-signed.
html45 http://www.railwaygazette.com/news/news/asia/single-view/view/jakarta-metro-trains-ordered.
html46 http://www.railwaygazette.com/news/urban/single-view/view/purple-line-trains-set-sail-for-
bangkok.html?sword_list%5B%5D=thailand&no_cache=147 http://www.railwaygazette.com/news/urban/single-view/view/bangkok-sukhumvit-line-
extension-contracts.html48 http://www.railway-technology.com/projects/dtl-stage-1/49 http://www.railway-technology.com/projects/downtown-line/50 http://www.cmnzl.co.nz/assets/sm/3512/61/0007-E59Edmonds.pdf51 http://www.railwaygazette.com/news/technology/single-view/view/kuala-lumpur-multi-modal-
ticketing-contract-awarded.html?sword_list%5B%5D=kuala&sword_list%5B%5D=lumpur&no_cache=1
52 http://www.roadtraffic-technology.com/projects/-da-nang-quang-ngai-expressway-vietnam/53 Data from UNCTAD Stat: http://unctadstat.unctad.org/wds/TableViewer/tableView.aspx54 “How many ecommerce companies are there?”, The Data Point, 18 June 2014; available at
http://blog.rjmetrics.com/2014/06/18/how-many-ecommerce-companies-are-there/ (accessed 26 January 2015).
55 https://www.techinasia.com/giao-hang-nhanh-solves-logistics-vietnams-growing-ecommerce-market/
56 See Business Insider Singapore, “ASEAN’s 5 Biggest E-Commerce Sites”, 23 June 201457 Assuming that power plants are to be developed using the same type of technology (e.g.
hydropower plant).

Chapter 4: Infrastructure and economic connectivity in ASEAN
147
ChAPTER 4
INFRASTRuCTuRE AND ECONOMICCONNECTIVITy IN ASEAN
4.1. Introduction
ASEAN Member States are increasingly interconnected through physical, institutional and economic links. The implementation of regional programmes such as those in the Master Plan on ASEAN Connectivity and Declaration on the AEC Blueprint strengthens regional linkages. Sectoral programmes under the AEC pillar are also contributing to regional connectivity through investment, trade, production, services and infrastructure development.
Regional connectivity is shaped by development that is taking place at three levels: nationally, subregionally and regionally. It is also taking shape in three interrelated sectors or clusters of industries: infrastructure, infrastructure-enabled industry and infrastructure services, which have implications for attracting investment. These three levels are not just closely related but also mutually connected. In each of these levels, the private sector – both foreign and local – is involved. Also contributing to regional connectivity is the rapid growth in intraregional investment and regional value chains (RVCs). This growth, which is expected to continue, involves different players (e.g. B2B, intra- and inter-firm linkages) operating in different Member States (AIR 2014). The AEC, when fully implemented, will provide another impetus in influencing regionally oriented corporate strategies and encouraging foreign and ASEAN companies to expand their regional footprints (chapter 1).
Although much attention has been given in recent years to institutional arrangements related to regional connectivity, these arrangements alone will not bring about the connectivity desired to achieve regional integration. The role of the private sector is highly important. There is evidence that foreign and local private sector actors are already playing a role, but they need to participate more to help realize an environment that more strongly supports regional connectivity.
The landscape of ASEAN physical connectivity is expected to be considerably more densely drawn by 2030 than it is today. For example, the electrification rate is expected to reach nearly 100%, providing universal access to all in the region by 2030. The growth rate of ICT penetration is expected to rise significantly, providing modern connections to more homes and industries, and thus supporting development of more competitive downstream infrastructure-led businesses. In transport, the SKRL – which involves several ASEAN Member States – is expected to significantly reduce travel time from Kunming (China) to Singapore, and generate benefits along the route. With the completion of the last missing national roads in the AHN in 2015, ASEAN Member States are now physically interconnected by 23 designated national highway networks with a total length of 38,400 kilometers (km)
ASEAN INVESTMENT REPORT 2015: Infrastructure Investment and Connectivity
148
of road routes. Air transportation is expected to grow rapidly as a consequence of the increasingly affluent society, greater ASEAN connectivity, and growing regional cooperation to realize a single ASEAN aviation market. The total seat capacity of ASEAN airlines saw double-digit growth in 2009–2013, and the share of low-cost carriers in the region rose significantly, from 13.2% in 2003 to 57% in 2014.
Evidence indicates that physical and regional economic connectivity generate benefits to ASEAN Member States. Greater connectivity in ASEAN will have an important impact on the region’s competitiveness and support more intraregional economic activities. Goods and people can be moved more cost-efficiently across the region, and more industrial areas as well as households can access electricity and stronger ICT connections. Regional value chain activities by ASEAN companies and MNEs will grow more intensely – further strengthening regional connectivity.
This chapter examines regional connectivity in the context of physical infrastructure, investment and business-to-business (B2B) activity. Owing to space and scope constraints, institutional and people-to-people aspects of ASEAN connectivity are not analyzed, although their contributions to strengthening regional connectivity are equally important. It highlights how the region is currently physically connected through power, transport and ICT infrastructure and economically connected through investment, production, trade, and inter- and intra-firm linkages.
4.2. ASEAN connectivity
Two key sources of regional mandates provide the guiding principles for regional infrastructure and economic connectivity. They are the Master Plan on ASEAN Connectivity and the Declaration on the ASEAN Economic Community Blueprint (figure 4.1). The former covers connectivity in a broader context including physical aspects such as infrastructure, which expand the opportunities for MNEs to participate. The latter covers connectivity in the economic context such as through investment, trade, production and services, which have implications for MNEs’ strategies.
In addition to infrastructure, institutional development in ASEAN is also central for regional connectivity. Much progress has been made in the area of the ASEAN Trade in Goods Agreement (ATIGA), the ASEAN Comprehensive Investment Agreement (ACIA), the ASEAN Framework Agreement on Services (AFAS), customs development (AIR 2014), and regional cooperation in transport, energy and ICT, which are all part of the AEC Blueprint.
4.2.1. Infrastructure connectivity
ASEAN Member States are increasingly interconnected through infrastructure development undertaken at the national, subregional and regional levels. Various major regional infrastructure projects have been identified and prioritized (table 4.1); some have been completed while others have yet to be implemented. Some subregional infrastructure projects, such as those related to the Brunei Darussalam–Indonesia–Malaysia–

Chapter 4: Infrastructure and economic connectivity in ASEAN
149
ASEAN Connectivity
CoverageSources Role in Connec vity
Physical
Institutional
Economic
People-to-people
Infrastructure
Frameworks, agreements & institutional development
ASEAN Economic Community + sectoral cooperation programmes
Movement of people
Power grid interconnection + power trade
•
•
Road networks and routes link• Bridge links• Rail networks and rail link• Airports + airlines connectivity• Ports-RORO, trade faciitation• ICT connectivity• Energy cooperation (ASEAN Gas
Pipeline and energy trade)
• Set framework and direction for regional integration + connectivity
•• Intra-regional trade, investment
• Production and business to business connectivity
Regional division of labour
••
An ASEAN identityTourism
• Public sector, privatesector, MDB, ODA, SWF
• Public sector• ASEAN bodies
• GLCs and SWFs)Private sector (including
• People, culture/ heritage
• Modes of transport + ICT facilities
• budget airlinesRegional carriers and
• Master Plan on ASEAN Connectivity• Declaration on the AEC Blueprint
and services
Key Players
Figure 4.1. ASEAN Member States are connecting through four key sources of linkages
Source: UNCTAD 2015b.Note:RORO = roll-on/roll-off, SWF = sovereign wealth fund.
Philippine East ASEAN Growth Area (BIMP-EAGA), the Indonesia–Malaysia–Thailand Growth Triangle (IMT-GT) and the Greater Mekong Subregion (GMS), are also contributing to regional connectivity (annex tables 4.1 and 4.2). These projects include infrastructure development in power, transport and ICT.
ASEAN Member States are cooperating as well as individually implementing infrastructure projects that have significant national and regional connectivity aspects. Regional connectivity cannot be achieved without the development or upgrading of national infrastructure. When a national road or rail network within a Member State is completed and connected, it provides a strong foundation to realize regional connectivity by linking it to networks in other Member States. One implication of these developments is that by

ASEAN INVESTMENT REPORT 2015: Infrastructure Investment and Connectivity
150
Table 4.1. Regional infrastructure projects are connecting ASEAN Member States (Selected cases)
Title of project Sector Objectives Status/remarks
Construction of the AHN (completion of missing links and upgrade of transit transport routes in Lao PDR and Myanmar)
Road
The main objective of the AHN is to establish an efficient, integrated, safe and environmentally sustainable regional land transport corridor linking all ASEAN Member States and beyond. ASEAN Member States have been developing and upgrading various sections of the AHN as integral components of their national programmes.
Some ASEAN Member States face the challenges of poor-quality roads and incomplete road networks.
Lao PDR and Myanmar have constructed the last missing links of the AHN. They and the other Member States are upgrading “below Class III” roadsa in segments of the AHN.
As of 2015, all the missing links in the AHN have been eliminated. However, efforts are under way to upgrade some routes in some Member States.
Singapore–Kunming Rail Link (SKRL) Rail
The main objective of the SKRL is to provide a complementary mode of land transportation. It also aims to provide a more efficient and economical mode for cross-border cargo transportation in the region and beyond.
The participating ASEAN Member States are to complete the SKRL missing links.
Some Member States are starting to upgrade their national rail networks and build high-speed rail lines. For instance, Malaysia and Singapore are making advances in their discussion to jointly build high-speed rail lines linking the two cities. Thailand has announced plans to start building high-speed rail lines running from north to south in the country.
ASEAN Broadband Corridor ICT
The project aims to address different definitions of broadband speeds and promote greater broadband penetration and affordability as well as universal access in the region.
From 2013, the project covers the implementation of regional and national strategies to enhance penetration, affordability and universal access to broadband Internet service.
Melaka–Pekanbaru Power Interconnection Power
This project supports investment in strategic transmission assets that connect countries, to optimize power networks by reducing the overall need for reserve capacity, improving system reliability, removing transmission bottlenecks and transmitting cheaper power from one area to another. Malaysia and Indonesia plan to exchange peaking capacity and spinning reserve to accommodate differences in their peak hours and load curves.
The project involves construction of a 500 kV high-voltage direct current (HVDC) power transmission line between Melaka (Malaysia) and Pekanbaru (Indonesia). It also includes the construction of a 600 MV ±250 kilovolt (kV) HVDC transmission line from Sumatra to Peninsula Malaysia as well as converter stations and other transmission facilities.
West Kalimantan–Sarawak Power Interconnection Power
This project supports investment in strategic transmission assets that connect international boundaries, to optimize power networks by reducing the overall need for reserve capacity, improving system reliability, removing transmission bottlenecks and transmitting cheaper power from one area to another.
Sarawak (Malaysia) exports additional electricity to West Kalimantan (Indonesia), generating income for Sarawak Energy. West Kalimantan will benefit from the improved quality and reliability of power supply. The project will help diversify the energy generation portfolio by retiring old and inefficient oil-based power plants and reducing carbon dioxide emissions in Borneo.
ASEAN Roll-On/Roll-Off (RORO) Shipping Network and Short Sea Shipping
Port
The aim is to establish RORO routes in ASEAN to link mainland and archipelagic regions to provide a seamless intermodal transport system.
The RORO shipping network could reduce transport costs, and expand business activities and commerce, as well as improve local government revenues. The RORO is one of the prioritized connectivity projects.
Source: UNCTAD and ASEAN Secretariat.a Under the AHN, Class III roads are two lanes (narrow) with double bituminous pavement. They can be used only when funding for
construction and/or land for the road is limited. The type of pavement should be upgraded to asphalt concrete or cement concrete. Class III is also regarded as the minimum desirable standard. Upgrading of any road sections that are less than Class III to comply with the Class III standard should be encouraged.
Note: AHN = ASEAN Highway Network, RORO = roll-on/roll-off.

Chapter 4: Infrastructure and economic connectivity in ASEAN
151
2030 the regional connectivity landscape will be one that is more interconnected in power, transport and ICT than it is today.
In addition to the regional projects covered in table 4.1, ASEAN is also increasingly interconnected through the development of the Trans-ASEAN Gas Pipeline (TAGP), which aims to develop a regional gas grid by 2020 to make it possible to transport gas across borders (ASEAN Secretariat 2012a). The TAGP has expanded to cover from piped gas to liquefied natural gas (LNG) as the options for gas supply in the region. Thirteen gas pipeline interconnection projects connecting six Member States bilaterally, with a total length of approximately 3,673 km, have been successfully commissioned as of 2015. Four LNG regasification terminals with throughput capacity of 17.8 million tonnes per year are now also operational. At least one more regasification terminal will be operational by 2020, and several more are in the planning, construction and capacity expansion stages.
4.2.1.1. Electricity
Power purchase and exchange agreements in ASEAN are increasing, which is contributing to regional connectivity. This increase highlights the growth of trade in electricity among ASEAN Member States. Countries with a surplus can export electricity more cost-effectively to other Member States with supply shortages.
ASEAN Member States have signed long-term bilateral power purchase agreements (PPAs) for export/import or exchange of electricity, involving different Member States (table 4.2).
Table 4.2. Increasing PPAs among ASEAN Member States, 2015 (Selected bilateral cases)
Brunei Darussalam
Cambodia IndonesiaLao PDR
Malaysia Myanmar Philippines Singapore Thailand Viet Nam
Brunei Darussalam
X
Cambodia X X X
Indonesia X
Lao PDR X X X
Malaysia X X X X
Myanmar X
Philippines X
Singapore
Thailand X X X X
Viet Nam X
Source: UNCTAD 2015b and media sources.Note: Each bilateral PPA between two ASEAN Member States can involve a number of PPAs with different power plants’ companies
in the producing country and a public utility company in the buying country.

ASEAN INVESTMENT REPORT 2015: Infrastructure Investment and Connectivity
152
These PPAs contribute to regional power connectivity. Some power plants, as in Lao PDR, are built and produce power to supply primarily to neighbouring countries, such as Thailand. A Member State may sign multiple PPAs with a power-exporting Member State covering several purchase arrangements with different power plants owned by different power-producing companies based in the latter. Many of the power plants involved in cross-country PPAs are associated with MNEs as owners, co-owners or contractors (chapters 2 and 3). Another important aspect of PPAs is that they increase production and market linkages in power supply in the region, hence contributing to strengthening the infrastructure connectivity between Member States.
ASEAN Member States are connecting through the ASEAN Power Grid (APG) system (box 4.1). The 16 power grid interconnection projects earmarked for the APG system will
Box 4.1. Power interconnection between ASEAN Member States, selected cases
Some ASEAN Member States have already established grid interconnections. Some are currently developing interconnections of transmission lines for power trade while others are already exporting or importing power. The list below provides selected cases of existing and ongoing power grid interconnection projects in the region.
Malaysia–Thailand Power Interconnection (existing)
Malaysia’s national grid system is interconnected to Thailand’s transmission system through an HVDC interconnection with a transmission capacity of 300 megawatts (MW) and a 132 kV HVAC overhead line with a maximum transmission capacity of 90 MW.
The Khlong Ngae (Thailand)–Gurun (Malaysia) 110 km transmission system connects the 230 kV AC network of Thailand with the 275 kV AC network of Malaysia, which started commercial operation in 2001. Siemens built the transmission infrastructure as a turnkey project, complete with the HVDC system design and network integration, delivery of the converter stations, AC switch gear, and the interconnecting 300 kV DC overhead line.
Malaysia–Singapore Power Interconnection (existing)
Malaysia’s power grid is also connected to Singapore’s transmission system by two 230 kV submarine cables with a firm transmission capacity of 200 MW.a
Malaysia–Indonesia Power Interconnection (ongoing)
Melaka (Malaysia) and Pekanbaru (Indonesia) are jointly developing a grid interconnection. This will involve construction of a 600 MW joint electricity network between Melaka and Pekanbaru. The interconnection is expected to cost $500 million. PLN, the Indonesian utility agency, will cover $300 million and Malaysia’s TNB will bear $200 million.
West Kalimantan–Sarawak Power Interconnection (ongoing)
This project aims to connect the electricity grids in West Kalimantan (Indonesia) and Sarawak (Malaysia). The latter will export additional electricity to the former. The project is estimated to cost about $120 million, with $41 million to be covered by Malaysia. PLN (Indonesia) will build an 83 km, 275 kV transmission line from the Bengkayang substation to the border with Sarawak (Malaysia) while SESCO (Sarawak, Malaysia) will build a 42 km, 275 kV transmission line from the Mambong substation to the border with West Kalimantan (Indonesia).

Chapter 4: Infrastructure and economic connectivity in ASEAN
153
further link the ASEAN Member States. Although the electricity transmission infrastructure is dominated by national utility agencies, the private sector is also involved — largely as a contractor in the development of this segment of the electricity value chain.
A primary objective of the ASEAN Power Grid is to achieve long-term security, availability and reliability of electricity supply through an integrated system. Existing power grid interconnections in the region (tables 4.3 and 4.4) connect several ASEAN Member States and involve 3,489 megawatts (MW). As of May 2015, a number of power grids are being developed to connect Lao PDR with Thailand, with Viet Nam, and with Cambodia; and Malaysia with Indonesia, with Brunei Darussalam and with Thailand, which will provide an additional 5,072 MW of cross-border power supply in the region.
A number of additional regional power grid interconnections can be expected by 2020 (Ibrahim 2014). They will include the interconnections between Sarawak (Malaysia) and Brunei Darussalam by 2018, between Lao PDR and Cambodia in 2017, between Malaysia and Sumatra (Indonesia) and the Philippines in 2020. Three more power grid projects —between Thailand and Malaysia, Thailand and Lao PDR, and Lao PDR and Viet Nam —are expected before 2020. In addition, the Lao PDR–Thailand–Malaysia–Singapore Power
Lao PDR–Viet Nam Power Transmission Interconnection (ongoing)
This project, with an estimated cost of $218 million, consists of two parts to be implemented between 2014 and 2018: (i) construction of a 59 km, 500 kV transmission line and a 230 kV/500 kV substation in Hatxan (Lao PDR); and (ii) construction of a 94 km, 500 kV transmission line and expansion of the existing 220/500 kV Pleiku substation in Viet Nam. The grid interconnection will involve transmission of 3,157 gigawatt-hours per year of electricity from eight small hydropower plants (with a total of 1,013 MW capacity) in southern Lao PDR, to be developed by independent power producers.
Thailand–Lao PDR 500 kV Substation Transmission Facility (ongoing)
The project, with an estimated cost of $106 million, covers a 500 kV line from Udon Thani (Thailand) to Nabong (Lao PDR). It aims to transfer power to Thailand from several hydropower projects in the Central-1 area of Lao PDR. These hydropower projects include Nam Ngum 2, Nam Theun 1 and Nam Ngiep 1, with a total installed capacity of over 1,500 MW, largely for export to Thailand.
Thailand–Lao PDR–Viet Nam Interconnection (ongoing)
This project, estimated to cost $278 million, will interconnect Thailand and Viet Nam via Lao PDR, and cover the Lao PDR–Viet Nam section. It will introduce a step change in the development of the regional power market and lead to reduced reserve requirements, lower costs and enhanced confidence in the regional power market.
A number of potential GMS power projects with connectivity prospects involving some ASEAN Member States have been identified (Asian Development Bank 2013b).
Sources: Asian Development Bank (2013a and 2013b), ASEAN Secretariat (2012b) and Tenaga (2014).a Tenaga Nasional, Annual Report 2014.
Box 4.1. Power interconnection between ASEAN Member States (concluded)

ASEAN INVESTMENT REPORT 2015: Infrastructure Investment and Connectivity
154
Integration Project aims to involve cross-border power trade of up to 100 MW from Lao PDR to Singapore through Malaysia and Thailand, using the existing grid interconnections. This pilot project has been positioned as a pathfinder on the road toward realizing the APG.
Although the volume of regional power trade is small, it has significant potential for further growth. By 2026, some 19,576 MW of cross-border power purchases and 3,000 MW of electricity exchange is expected to occur through cross-border interconnections in the region (Ibrahim 2014). When completed, the 16 currently earmarked grid interconnections will account for at least 10% of the total installed capacity in the region. As the region becomes more grid connected in the future, the volume of electricity trade and number of power plants are expected to grow.
Table 4.3. More power grids interconnection to connect ASEAN (Capacity status as of May 2015 in MW)
Existing Ongoing Future Total
Northern System 2,659 3,942 15,774–18,924 22,375–25,525
9. Thailand–Lao PDR 2,111 3,352 1,865 7,328
10. Lao PDR–Viet Nam 248 290 .. 538
11. Thailand–Myanmar .. .. 11,709–14,859 11,709–14,859
12. Viet Nam–Cambodia 200 .. .. 200
13. Lao PDR–Cambodia .. 300 .. 300
14. Thailand–Cambodia 100 .. 2,200 2,300
Southern System 450 600 1,800 2,850
1. P. Malaysia–Singapore 450 .. 600 1,050
4. P. Malaysia–Sumatra (Indonesia) .. 600 .. 600
5. Batam (Indonesia)–Singapore .. .. 600 600
16. Singapore–Sumatra (Indonesia) .. .. 600 600
Eastern System .. 430 600 1,030
6. Sarawak (Malaysia)–West Kalimantan (Indonesia) .. 230 .. 230
7. Philippines–Sabah (Malaysia) .. .. 500 500
8. Sarawak (Malaysia)–Sabah (Malaysia)–Brunei Darussalam .. 200 100 300
15. E.Sabah (Malaysia)–E. Kalimantan (Indonesia) .. .. .. ..
Northern-Southern System 380 100 300 780
2. Thailand–Peninsula Malaysia 380 100 300 780
Southern–Eastern System .. .. 3,200 3,200
3. Sarawak (Malaysia)–Peninsula Malaysia .. .. 3,200 3,200
Total 3,489 5,072 21,674 - 24,824 30,235 - 33,385
Source: HAPUA.
Note: numbers in the first column of the table relate to specific projects inidcated in table 4.4.
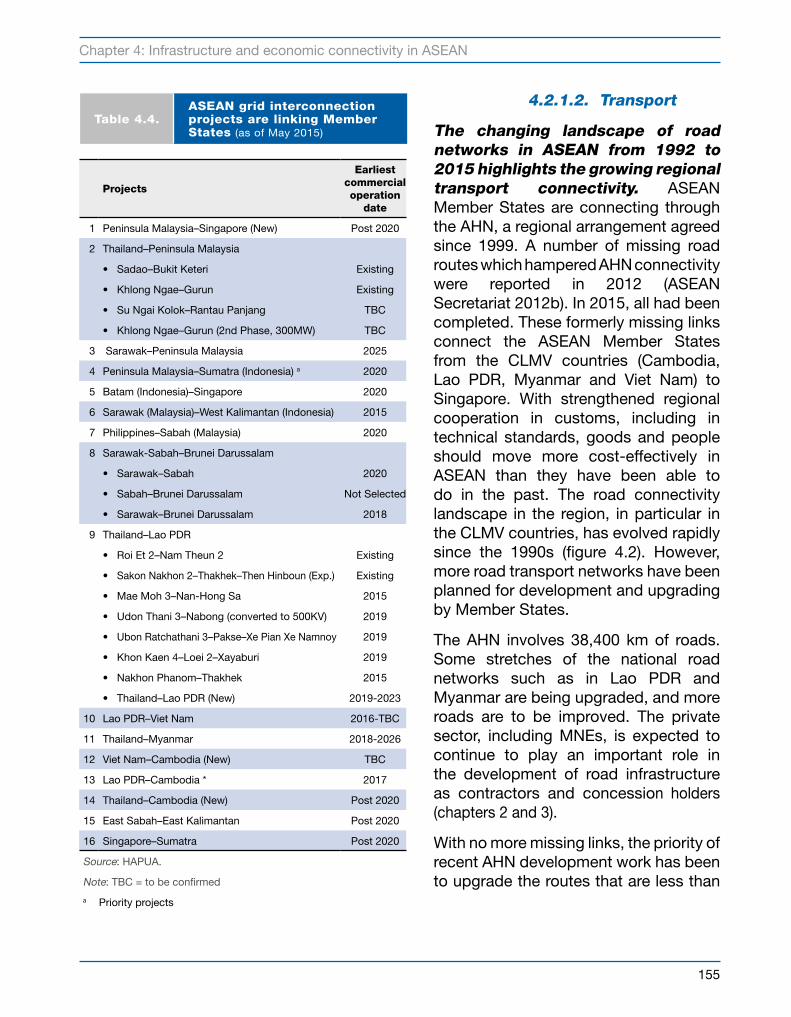
Chapter 4: Infrastructure and economic connectivity in ASEAN
155
4.2.1.2. Transport
The changing landscape of road networks in ASEAN from 1992 to 2015 highlights the growing regional transport connectivity. ASEAN Member States are connecting through the AHN, a regional arrangement agreed since 1999. A number of missing road routes which hampered AHN connectivity were reported in 2012 (ASEAN Secretariat 2012b). In 2015, all had been completed. These formerly missing links connect the ASEAN Member States from the CLMV countries (Cambodia, Lao PDR, Myanmar and Viet Nam) to Singapore. With strengthened regional cooperation in customs, including in technical standards, goods and people should move more cost-effectively in ASEAN than they have been able to do in the past. The road connectivity landscape in the region, in particular in the CLMV countries, has evolved rapidly since the 1990s (figure 4.2). However, more road transport networks have been planned for development and upgrading by Member States.
The AHN involves 38,400 km of roads. Some stretches of the national road networks such as in Lao PDR and Myanmar are being upgraded, and more roads are to be improved. The private sector, including MNEs, is expected to continue to play an important role in the development of road infrastructure as contractors and concession holders (chapters 2 and 3).
With no more missing links, the priority of recent AHN development work has been to upgrade the routes that are less than
Table 4.4.ASEAN grid interconnection projects are linking Member States (as of May 2015)
Projects
Earliest commercial operation
date
1 Peninsula Malaysia–Singapore (New) Post 2020
2 Thailand–Peninsula Malaysia
•Sadao–BukitKeteri Existing
•KhlongNgae–Gurun Existing
•SuNgaiKolok–RantauPanjang TBC
•KhlongNgae–Gurun(2ndPhase,300MW) TBC
3 Sarawak–Peninsula Malaysia 2025
4 Peninsula Malaysia–Sumatra (Indonesia) a 2020
5 Batam (Indonesia)–Singapore 2020
6 Sarawak (Malaysia)–West Kalimantan (Indonesia) 2015
7 Philippines–Sabah (Malaysia) 2020
8 Sarawak-Sabah–Brunei Darussalam
•Sarawak–Sabah 2020
•Sabah–BruneiDarussalam Not Selected
•Sarawak–BruneiDarussalam 2018
9 Thailand–Lao PDR
•RoiEt2–NamTheun2 Existing
•Sakon Nakhon 2–Thakhek–Then Hinboun (Exp.) Existing
•MaeMoh3–Nan-HongSa 2015
•UdonThani3–Nabong(convertedto500KV) 2019
•Ubon Ratchathani 3–Pakse–Xe Pian Xe Namnoy 2019
•KhonKaen4–Loei2–Xayaburi 2019
•NakhonPhanom–Thakhek 2015
•Thailand–LaoPDR(New) 2019-2023
10 Lao PDR–Viet Nam 2016-TBC
11 Thailand–Myanmar 2018-2026
12 Viet Nam–Cambodia (New) TBC
13 Lao PDR–Cambodia * 2017
14 Thailand–Cambodia (New) Post 2020
15 East Sabah–East Kalimantan Post 2020
16 Singapore–Sumatra Post 2020
Source: HAPUA.
Note: TBC = to be confirmed
a Priority projects

ASEAN INVESTMENT REPORT 2015: Infrastructure Investment and Connectivity
156
Class III on the transit transport routes in Indonesia, Lao PDR and Myanmar. By 2020, all designated national routes are to be upgraded to at least Class I or primary road standards, and low-traffic-volume non-arterial routes to at least Class II standards. The total length of roads that are less than Class III has been reduced by 46.2%, from 5,311 km in 2010 to 2,454 km in 2015.
Land transport infrastructure implemented and planned at the BIMP-EAGA and GMS levels will also help strengthen regional connectivity (table 4.5; ADB-ADBI 2009, ADB 2015). For instance, when completed, the project to deepen the connectivity of the GMS Southern Economic Corridor and upgrade a road section in Cambodia connecting Battambang and Siem Reap will strengthen connectivity between Cambodia, Thailand and Viet Nam. Other planned projects that will help strengthen ASEAN’s connectivity include the following:
• The proposed $0.5 million construction of the Poipet (Cambodia)–Klong Loeuk (Thailand) Railway Bridge.
• The $150 million road development from Luang Namtha Province (Lao PDR) to the Lao PDR–Myanmar Friendship Bridge.
• The Fifth Lao–Thai International Friendship Bridge across the Mekong River, which facilitates the transport of goods and people from northern Thailand through central Lao PDR and central Viet Nam by the NR8 land route.
• The $100 million East–West Economic Corridor Eindu–Kawkareik Road Improvement, which is part of the AHN.
• The $60 million Mae Sot (Thailand)–Myawaddy (Myanmar) border crossing and infrastructure improvements that include 16.9 km of four-lane divided highway (13.3 km in Thailand and 3.6 km in Myanmar), a 100 meter bridge across the Moei River at the border, and associated border-crossing facilities.
• The $30 million Friendship Bridge over the Mekong River at Xiengkok (Lao PDR) and Kainglap (Myanmar).
• The $2 billion Bang Yai–Kanchanaburi Intercity Motorway, which is an important component of Thailand’s National Highway Development Plan and part of the Laem Chabang–Bangkok (Thailand)–Dawei (Myanmar) Corridor.
• Viet Nam plans to improve the 900 km Southern Economic Corridor, R10 route, linking Dawei in Myanmar to southern Viet Nam. The route will facilitate transportation of goods in the subregion and is expected to support social, tourism and cultural exchanges among the constituent countries.1
Existing bridge links between ASEAN Member States such as those between Thailand and Lao PDR; Thailand and Myanmar; Lao PDR and Myanmar; Malaysia and Singapore; and Brunei Darussalam and Malaysia have helped establish connectivity and increase transportation development, including tourism.
The SKRL will further strengthen rail connectivity between major cities in ASEAN. The SKRL, with rail running from Kunming (China) to Singapore, involves seven ASEAN Member States. The SKRL is a prioritized project of the ASEAN transport cooperation effort

Chapter 4: Infrastructure and economic connectivity in ASEAN
157
Fig
ure
4.2
.G
reate
r ro
ad n
etw
ork
connecti
vity
in s
ele
cte
d A
SE
AN
Mem
ber
Sta
tes,
1992,
2005 a
nd 2
015
GM
S infr
ast
ructu
re im
pro
vem
ents
: R
oad t
ransp
ort
netw
ork
1992
GM
S in
frast
ructu
re im
pro
vem
en
ts:
Road
tra
nsp
ort
netw
ork
20
05
GM
S infr
ast
ructu
re im
pro
vem
ents
: R
oad t
ransp
ort
netw
ork
(2015 C
om
mit
ted)
Sou
rce:
AD
B.

ASEAN INVESTMENT REPORT 2015: Infrastructure Investment and Connectivity
158
and under the Master Plan on ASEAN Connectivity. When completed, it will connect the capital cities of Cambodia, Lao PDR, Myanmar, Thailand and Viet Nam. The SKRL “Eastern Line” will run through Thailand, Cambodia, and Viet Nam, and a “Western Line” will run through Thailand and Myanmar. There are missing links or links that need to be rehabilitated in six Member States: Cambodia, Lao PDR, Malaysia, Myanmar, Thailand and Viet Nam. Some SKRL-related projects in selected ASEAN Member States are at various stages of development (table 4.6).
The Kuala Lumpur–Singapore high-speed rail link discussion between the governments of Malaysia and Singapore has made significant progress. However, the exact date for commence of the construction of the link has yet to be agreed. Thailand and Lao PDR have announced plans to construct their parts of the SKRL segments.
Intercountry rail projects developed or to be developed at the subregional level will further connect ASEAN Member States. A number of rail projects have the potential to connect the CLMV countries under the GMS programme. For instance, the railway project from Batdoeung (Cambodia) to Lock Ninh (Viet Nam), estimated to cost $1.1 billion, will connect the two countries (ADB 2013b). Similarly, the 145 km Ho Chi Minh–Loc Ninh rail link, estimated to cost $900 million, will help deepen the rail network links between Viet Nam and Cambodia. When complete, the planned high-speed rail networks in a number of ASEAN Member States will considerably change the rail transport infrastructure landscape in the region (table 4.7).
ASEAN Member States are building, expanding and upgrading airports, which will also strengthen connectivity through air travel and tourism (chapter 2). The
Selected investment projects Country coverage
Sector Cost estimate
($ million)
Cost to country
Poipet–Aranyaprathet New Road with Cross-Border Facilities Cambodia, Thailand
Road .. Cambodia
Mekong River Bridge at Xiengkok (Lao PDR)–Kainglap (Myanmar) along the ASEAN–India Highway
Lao PDR, Myanmar
Bridge 23 Lao PDR
Mekong Bridge at Paksan–Bungkane (with Thailand) Lao PDR, Thailand
Bridge .. Lao PDR
Selamphao Bridge at the end of NR14A between Lao PDR and Cambodia
Cambodia,
Lao PDR
Bridge 30 Lao PDR
Mekong River Bridge at Xiengkok (Lao PDR)–Kainglap (Myanmar) along the ASEAN–India Highway
Lao PDR, Myanmar
Bridge 16 Myanmar
Mae Sot–Myawaddy Border Crossing and Infrastructure Improvements
Myanmar, Thailand
Other infrastructure
30 Myanmar
Aranyaprathet–Poipet New Road with Border-Crossing Facilities
Cambodia, Thailand
Road .. Thailand
Mekong Bridge at Bungkane–Paksan Lao PDR, Thailand
Bridge .. Thailand
Source: ADB 2013b.
Table 4.5. Transport infrastructure projects in the GMS also contribute toconnectivity

Chapter 4: Infrastructure and economic connectivity in ASEAN
159
CountryMissing sections, route and spur lines
Rail lengthFeasibility
study statusConstruction status
Planned completion
yearExisting length
of sectionNew
construction
Cambodia Poipet (Thailand border)–Sisophon ..
28 Completed Ongoing 2016
Cambodia
Phnom Penh–Tra Peang Sre (Cambodia/Viet Nam border) (Cambodia/Viet Nam border)
32255 Completed Seeking funding 2025
Viet NamLoc Ninh (Cambodia/Viet Nam border)–Ho Chi Minh City
20 129 Completed Seeking funding 2025
Thailand Aranyaprathet–Klongluk .. 6 Completed Completed 2015
Lao PDR Vientiane–Thakhek* .. 330 Ongoing Date of commence-ment to be determined Beyond 2025
Lao PDR Thakhek–Mu Gia (Viet Nam border)* ..
136 Ongoing Date of commence-ment to be determined Beyond 2025
Viet Nam Mu Gia (Lao PDR border)–Tan Apa .. 53 Pre-Feasibility
Study completedDate of commence-ment to be determined Beyond 2025
Viet Nam Tan Ap–VungAnga 6 66 Ongoing Date of commence-ment to be determined Beyond 2025
Source: ASEAN Secretariat and SKRL Fact Sheet Summary cited in ASEAN Secretariat (2012b).a spur line.
Table 4.6. The SKRL will further connect ASEAN Member States
Table 4.7. Many high-speed rail networks in ASEAN expected by 2022
CountryLength
(km)Stations
(no.)Cost
($ billion)Expected opening
Indonesia 144 6 6.17 2020
Indonesia 685 9 21.4 2022
Philippines 84 3 3.00 ..
Thailand 745 13 7.04 2021
Thailand 221 5 2.22 2022
Thailand 615 .. .. ..
Thailand 982 .. .. ..
Viet Nam 1,630 .. .. 2020
Malaysia–Singapore 400 .. 2.44 2020
Lao PDR–Viet Nam 220 11 5.00 2017
Total 5’726 47+ 47.27+ ..
Source : Southeast Asia Infrastructure Research.
numbers of airlines using or benefiting from these airports have also risen. The numbers of ASEAN-based airlines including budget carriers have grown. The numbers of planes of many low-cost carriers in the region have increased rapidly in recent years. Lion Air operating from Indonesia alone is expected to saw its fleet size rise from 91 in January 2013 to 105 in January 2015, Air Asia’s operation from Malaysia only is projected to see its fleet increase from 64 in January 2013 to 76 in January 2015, and Malindo Air based in Malaysia is projected to have a new fleet of 10 aircrafts by January 2015 (Sobie 2014). In addition, the numbers of seats offered by domestic and international airlines in the region have also increased significantly, from 33.6 million in 2005 to 188 million in 2014.
These airports and local airlines are contributing to regional connectivity through the provision of affordable transportation, movement of people and tourism. The numbers of intra-ASEAN visitor arrivals have risen from 34.8 million in 2010 to more than 45.2 million in 2014.2 ASEAN cooperation in establishing an ASEAN Single Aviation Market will further accentuate regional air travel connectivity (box 4.2).

ASEAN INVESTMENT REPORT 2015: Infrastructure Investment and Connectivity
160
Box 4.2. ASEAN Single Aviation Market will increase air travel connectivity
ASEAN Member States are implementing an open skies policy in 2015 as part of the formal ASEAN Single Aviation Market (ASAM). The following related agreements have been signed: the ASEAN Multilateral Agreement on Air Services, the ASEAN Multilateral Agreement on the Full Liberalization of Air Freight Services and the ASEAN Multilateral Agreement on the Full Liberalization of Passenger Air Services along with their respective protocols.
These agreements provide the competitive space for greater expansion and opportunities for air travel within the ASEAN region, in terms of more destinations, increased capacities and lower fares. The open skies agreements and related protocols have entered into force and been operationalized. These agreements contributed to the development of low-cost carrier operations, which now account for more than half of all airline capacity in the region. Several intra-ASEAN international routes are now the busiest in the world. The enhanced air connectivity has contributed to the development of tourism within the region. In 2014, ASEAN recorded a new high for visitor arrivals into the region – more than 105 million, a 2.8% increase from 2013.
The ASAM is one of the key pillars supporting the establishment of the AEC by facilitating free, efficient, safe and secure movement of people and goods within and potentially beyond ASEAN. The ASAM includes economic initiatives related to ownership and control, charters, tariffs, competition law, consumer protection, airport user charges, dispute resolution and dialogue partners. ASEAN Member States also put effort into the liberalization of air transport ancillary services, which will put in place the system and process for economic liberalization and regulatory convergence in support of the ASAM.
In addition to economic components, the ASAM also covers technical components, including aviation safety, aviation security and air traffic management. Within Aviation Safety, ASAM initiatives achieved significant progress in developing the ASEAN Aviation Regulatory Monitoring System, the ASEAN Foreign Operator Safety Assessment, and the Mutual Recognition Arrangement on Certificates, Approvals and Licences of Civil Aviation. Under the ASAM, the following measures have been completed: (1) the ASEAN Regional Contingency Plan; (2) the Capacity-Building Framework on Air Traffic Management; and (3) identification of key regional initiatives and required enabling technologies.
Source: ASEAN Secretariat.
4.2.1.3. ICT
Regional cooperation on ICT, such as the ASEAN Broadband Corridor and inter-country projects, is contributing to reducing the digital divide and increasing ICT connectivity in the region. Some of the ICT equipment vendors in ASEAN are active in constructing regional and international backbones that link Member States to each other and to global networks. Operator consortiums fund these networks. For example, Huawei is building an undersea fibre cable to link Malaysia, Cambodia and Thailand.3 The SEA-ME-WE 5 submarine fibre-optic cable running from Singapore to France, being constructed by Alcatel-Lucent, will traverse Indonesia, Malaysia, Myanmar, Singapore and Thailand.4 NEC is building an Asia-Pacific gateway, connecting Singapore, Malaysia, Thailand and Viet Nam.

Chapter 4: Infrastructure and economic connectivity in ASEAN
161
Regional interconnectivity has increased, and today ASEAN is criss-crossed by numerous submarine cable systems (figure 4.3). They interconnect ASEAN nations as well as other countries within the Asia-Pacific region and on to global fibre-optic backbones.
All ASEAN Member States that border another have a transborder link (table 4.8). Most also have at least one submarine cable in common with one or several ASEAN Member States. However, participating in the same undersea cable network does not necessarily mean there is end-to-end connectivity between all the countries involved, as additional transmission gear must be installed between any two countries. Thailand and Viet Nam are the most connected, with terrestrial telecommunication connections to all their bordering neighbours and on one or more undersea cable networks with the other countries.
Figure 4.3. ASEAN Member States are also interconnected through underseafiber-optic cable networks, 2015
Source: http://www.submarinecablemap.com/#/.
Lao PDR
Nam

ASEAN INVESTMENT REPORT 2015: Infrastructure Investment and Connectivity
162
A number of existing ICT infrastructure networks already connect or are connecting some ASEAN Member States. They include the following:
• The $36 million, 1,100 km submarine cable network connecting Thailand, Indonesia and Singapore, which provides customers with enhanced transmission of broadband traffic.
• The 147 km, repeaterless submarine telecommunications cable system between Dumai (Indonesia) and Melaka (Malaysia).
• The 400 km, intra-Asia regional submarine cable system between Batam (Indonesia), Dumai (Indonesia) and Melaka (Malaysia).
• The 1,300 km Jakabare Cable System, involving Java–Kalimantan–Batam–Singapore, which provides high bandwidth between these cities and between Jakarta and Singapore.
• The $430 million, 7,200 km intra-Asia submarine cable system involving the Philippines, Malaysia and Singapore and connecting to other Asian economies such as Japan and Hong Kong (China). This cable network also provides high-capacity communications, connecting the Greater Mekong Subregion with the other Asian economies (chapter 3).
ICT infrastructure helps connect people and businesses through communication facilities and access to information, by Internet links and by fixed and wireless telephone lines. ICT
Brunei Darussalam UF TF+UF UF UF UF UF
Cambodia TF UF UF UF TF TF
Indonesia UF T+UF UF UF UF UF UF
Lao PDR TF T TF TF
Malaysia UF UF T+UF UF TF+UF TF+UF UF
Myanmar UF UF UF UF UF T UF
Philippines UF UF UF UF UF UF UF UF
Singapore UF UF UF TF+UF UF UF UF UF
Thailand UF TF UF TF TF TF UF UF UF
Viet Nam UF TF UF TF UF UF UF UF UF
Source: UNCTAD.Note: TF = Terrestrial fiber. UF = Undersea fiber. T = Terrestrial, non-fiber. Undersea fiber connections refer to being on the same
submarine cable network and may not include direct country-to-country telecommunications traffic capability.
Table 4.8. Inter-ASEAN telecommunications connectivity involves all Member States
Bru
nei D
arus
sala
m
Cam
boo
dia
Ind
ones
ia
Lao
PD
R
Mal
aysi
a
Mya
nmar
Phi
lipp
ines
Sin
gap
ore
Thai
land
Vie
t N
am

Chapter 4: Infrastructure and economic connectivity in ASEAN
163
infrastructure development in the region is not only connecting ASEAN Member States but is also connecting the infrastructure to ICT-enabled downstream businesses. The development of good-quality ICT infrastructure is central to the provision and the existence of ICT-enabled services such as e-commerce, which is a growing platform for trade, business and entrepreneurship development in the region.
4.2.2. Regional economic connectivity
The region is also interconnected through investment, production, trade and services involving inter- and intra-firm operations by foreign and local companies based in different ASEAN Member States. More ASEAN companies are also investing in the region for various economic and strategic reasons, including regional integration influences (AIR 2013, AIR 2014). The rise in intra-ASEAN investment and ASEAN MNE regionalization is strengthening regional connectivity. Although some ASEAN firms are contributing to regional connectivity by having a presence in another ASEAN Member State, others are helping the region connect by producing inputs, intermediate products or final products as contract manufacturers or suppliers to other MNEs operating in the region.
Foreign companies’ investment and operations in ASEAN also contribute to regional connectivity. Some of these companies have multiple plants or operations in different ASEAN Member States, with operations interconnected across different locations. Many of these companies are involved with RVCs and RPNs (AIR 2014). These companies are tapping different locational advantages in the region to achieve production efficiency or to access certain strategic inputs (land, labour or raw materials) that match their corporate strategies. Through them, ASEAN as a region becomes more interconnected because of intraregional trade and production activities involving inter- and intra-firm arrangements (figures 4.4 and 4.5). In other words, RVCs and RPNs are important sources of ASEAN economic connectivity.
Although regional integration in ASEAN plays a role in providing an environment conducive for RVC activities, the increasing ability of MNEs to slice, distribute
Figure 4.4. MNEs’ RVCs and RPNs connect ASEAN
Source: Adapted from AIR 2014.
RVCs and RPNs of MNEs
“B” assembles inputs into intermediate
products for customers in the same host country
or in other ASEAN Member States
Two or more affiliates operating within the same ASEAN
Member State
Two or more affiliates operating in
different ASEANMember States
Integrated businessmodel (different
affiliates involved in different segments of the entire value chains
in different ASEANMember States)
A B C
Inputs

ASEAN INVESTMENT REPORT 2015: Infrastructure Investment and Connectivity
164
Fig
ure
4.5
.R
VC
s connect
com
panie
s and c
ountr
ies
in t
he r
egio
n
Sou
rce:
AIR
201
4.N
ote:
CB
U =
com
ple
tely
bui
lt-up
, HD
D =
har
d d
isk
driv
e, O
BM
= o
rigin
al b
rand
man
ufac
ture
r, O
EM
= o
rigin
al e
qui
pm
ent
man
ufac
ture
r
Exa
mple
sE
xcha
nge
of C
BU
mod
els
and
par
ts b
etw
een
Maz
da’
s op
erat
ions
in M
alay
sia
and
in
Tha
iland
, and
am
ong
Toyo
ta a
ffilia
tes
in A
SE
AN
Exc
hang
e in
the
reg
ion
of
par
ts a
nd c
omp
onen
ts
pro
duc
ed in
diff
eren
t A
SE
AN
Mem
ber
Sta
tes
by
com
pan
ies
such
as
Hon
da,
To
yota
, Den
so a
nd V
olvo
Inte
grat
ed b
usin
ess
mod
els
pur
sued
by
Wilm
ar
(Sin
gap
ore)
, IO
I (M
alay
sia)
, S
ime
Dar
by
(Mal
aysi
a) a
nd
othe
r p
alm
oil
MN
Es
in
AS
EA
N, s
tren
gthe
ning
in
traf
irm r
elat
ions
hip
s ac
ross
AS
EA
N c
ount
ries
Wes
tern
Dig
ital’s
and
S
eaga
te T
echn
olog
y’s
regi
onal
pro
duc
tion
netw
orks
in A
SE
AN
for
HD
Ds,
incr
easi
ng in
traf
irm
linka
ges
and
inte
rcou
ntry
co
nnec
tivity
Exa
mple
sS
upp
lier
rela
tions
hip
b
etw
een
OB
Ms
and
OE
Ms
such
as
bet
wee
n W
este
rn
Dig
ital a
nd A
pp
le
Hoy
a su
pp
ly o
f HD
D g
lass
su
bst
rate
s an
d N
idec
(bas
e p
late
s) t
o Fu
ji E
lect
ric,
whi
ch in
tur
n su
pp
lies
to
HD
D O
BM
, all
oper
atin
g in
A
SE
AN
in a
n in
terc
onne
cted
or
inte
rfirm
rel
atio
nshi
p
EM
S c
omp
anie
s p
rovi
din
g as
sem
bly
ser
vice
s fo
r el
ectr
onic
s O
EM
s su
ch a
s A
pp
le, H
P a
nd S
ony
that
are
al
so p
rese
nt in
the
reg
ion
Str
ong
inte
rfirm
con
nect
ions
b
etw
een
maj
or a
uto
par
t m
anuf
actu
rers
and
au
tom
otiv
e M
NE
s in
AS
EA
N
Wilm
ar (S
inga
por
e)
sup
ply
ing
pro
duc
tion
inp
uts
to P
roct
er a
nd G
amb
le’s
op
erat
ions
in A
SE
AN
Exa
mple
sO
BM
, OE
M a
nd fi
rst-
tier
com
pon
ent
MN
Es
outs
ourc
ing
to lo
cal
man
ufac
ture
rs t
o su
pp
ly o
r co
ntra
ct m
anuf
actu
re a
sp
ecifi
c p
art
or m
ultip
le
par
ts; i
nclu
de
man
y S
inga
por
ean
and
Mal
aysi
an
HD
D c
omp
onen
t m
anuf
actu
rers
tha
t al
so
have
op
erat
ions
in o
ther
A
SE
AN
cou
ntrie
s
Loca
l con
trac
t m
anuf
actu
rers
in o
ther
A
SE
AN
cou
ntrie
s al
so
invo
lved
; e.g
. Sia
m
Pre
cisi
on C
omp
onen
ts a
nd
Aap
ico
in T
haila
nd, M
MI i
n S
inga
por
e an
d E
ng
Tech
nolo
gi in
Mal
aysi
a
Man
y lo
cal g
arm
ent
sup
plie
rs a
nd c
ontr
act
man
ufac
ture
rs o
per
atin
g in
A
SE
AN
for
maj
or b
rand
na
mes
suc
h as
Ad
idas
, H
&M
and
Nik
e
Exa
mple
sW
ithin
com
pon
ent
man
ufac
turin
g, m
any
tiers
of
sup
plie
rs c
onne
cted
at
coun
try
and
reg
iona
l lev
els;
e.
g. t
hird
-tie
r su
pp
liers
su
pp
lyin
g to
sec
ond
-tie
r m
anuf
actu
rers
, who
sup
ply
p
arts
and
com
pon
ents
to
first
-tie
r m
anuf
actu
rers
, w
hich
– a
s th
e m
ain
sup
plie
rs –
sup
ply
dire
ctly
to
maj
or a
utom
otiv
e an
d
elec
tron
ic O
BM
s op
erat
ing
in t
he r
egio
n
Exa
mple
sIn
dep
end
ent
sup
plie
rs
(fore
ign
and
ind
igen
ous
AS
EA
N c
omp
anie
s) t
hat
oper
ate
in t
he r
egio
n,
attr
acte
d b
y in
dus
tria
l ag
glom
erat
ion,
incr
ease
d
dem
and
and
pro
duc
tion
activ
ities
, inc
lud
ing
opp
ortu
nitie
s fo
r in
vest
men
t an
d b
usin
ess
activ
ities
MN
Es’
intr
a-fi
rm
rela
tionsh
ips
MN
Es’
inte
r-fi
rm
rela
tionsh
ips
Arm
’s-l
ength
su
pplie
rs
MN
Es
and local contr
act
manufa
ctu
rers
’re
lati
onsh
ip
Dif
fere
nt
tiers
of
contr
act
manufa
ctu
rers
’ re
lati
onsh
ip
Pla
yers
in
RV
Cs

Chapter 4: Infrastructure and economic connectivity in ASEAN
165
and coordinate different value chain segments and functions to be performed by different players or firms contributes to regional connectivity (box 4.3, WIR 2013). Table 4.9 provides selected sources of economic connectivity associated with or contributed by activities of ASEAN and foreign MNEs in the region.
Institutional development in economic areas is another key source for regional connectivity. The various economic programmes under the AEC – such as the ATIGA, the ACIA, the AFAS, the single window and customs cooperation – are contributing to a more conducive environment for investment, trade, production and services in the region (figure 4.6, table 4.10). The realization of the AEC late in 2015 is an important development that will have a significant impact in strengthening regional economic connectivity well into the future.
ModeSelected aspects or sources of connectivity
Cases/examples
Production •Multiple plants and RVCs involving different ASEAN Member States
•Business linkages (intra-firm and inter-firm linkages)
•RPN strategy of companies to achieve production efficiency, engendered by regional division of labour and locational complementarity
• HDD production involving Western Digital and Seagate Technology intrafirm and interfirm connectivity in various ASEAN Member States (AIR 2014)
• Electronics: RVCs involving different MNEs, contract manufacturers and local firms in ASEAN
• Automotive: Toyota, Volvo, Mazda and Denso, Valeo and Robert Bosch auto-part production networks in ASEAN involving multiple plants or a network of suppliers across the region
• Agriculture: Wilmar, Sime Darby and IOI operating in different palm oil value chains from plantation to processing and mechandising in different ASEAN Member States
Investment • Investment contributing to regional expansion and strengthening of regional foothold by MNEs
•Rise of intra-ASEAN investment and enterprise regionalization
• Increase in intra-ASEAN cross-border M&As
• GE’s extensive investment in different Member States for different business operations
• First-, second- and third-tier Japanese automotive companies’ investment across ASEAN
• Retail: AEON (Japan), Parkson (Malaysia), Lotte (Republic of Korea) and Central (Thailand), with multiple operations across ASEAN
• Intra-ASEAN investment by firms from Indonesia, Malaysia, the Philippines, Singapore, Thailand and Viet Nam
• Intraregional cross-border M&As by ASEAN firms in ASEAN
Non-equity modalities
Contractual arrangements – EPC consultants, solution providers, equipment suppliers in infrastructure development and contract manufacturers in manufacturing industry
• ASEAN companies undertaking concessionary projects in other ASEAN countries (e.g. infrastructure) and as contract manufacturers
• ASEAN and foreign companies participating in infrastructure development nationally that has regional connectivity contributions such as interconnection of transmission grids, intercountry bridge links, road and rail construction that are part of the AHN and SKRL
Trade Intraregional trade activities including sourcing of parts and components and in services
• Companies (local and foreign) producing in one country and supplying parts and components to other ASEAN Member States (e.g. intermediate goods)
• Final goods traded regionally• Intraregional trade in commodities (coal, gas, electricity, oil and palm
oil)
Source: UNCTAD 2015b.Note: AHN = ASEAN Highway Network, EPC = engineering, procurement and construction.
Table 4.9. Private sector plays a key role in economic connectivity in ASEAN(Selected cases)

ASEAN INVESTMENT REPORT 2015: Infrastructure Investment and Connectivity
166
Box 4.3. RVCs and RPNs contribute to regional connectivity in ASEAN
RVCs in ASEAN are growing. Foreign and local companies operating in the region have increased their sourcing of inputs from the region to use in producing or assembling components or final products in the value chains they are associated with (AIR 2014). Intra-ASEAN manufacturing value added inputs in ASEAN exports rose more than eight-fold between 1990 and 2011, from $100 billion to $855 billion. Intra-ASEAN trade in intermediate inputs used in ASEAN exports is expected to grow more, aided by growth or expansion of operations by MNEs in the region in 2013–2015 (chapter 1 and AIR 2014).
RVCs in ASEAN are spreading, involving more companies, more countries and a wider range of products that help connect the region. The expanding operations of MNEs in the region and the increasing capacity of local firms in producing inputs used in subsequent stages of the value chains in ASEAN play roles in this growth. Regional integration is also contributing to this trend in RVCs, which are connecting ASEAN countries through foreign direct investment (FDI), non-equity modalities, trade in intermediate inputs and finished goods, and arm’s-length transactions.
RVCs strengthen regional connectivity through production, investment, trade and business linkages (box figure 4.3.1). They also help connect countries, companies and industries in the region.
Box figure 4.3.1. Regional integration, RVCs and ASEAN’s connectivity
Source: AIR 2014.
RVCs involve the multifaceted interconnection of many companies operating in different ASEAN countries (in-country and regionally), which encompass intra- and inter-firm relationships, including extensive webs of supplier connections and contractual arrangements. RVCs and the connectivity of firms and ASEAN countries take place across different industries. In the electronics and automotive industries, different players produce different components and parts in different ASEAN Member States for a lead firm, which also has different business operations (e.g. manufacturing, assembly, regional administrative functions including marketing, and sourcing activities) in the region.
ASEAN
AEC
IncreasesASEAN connectivity,through production,
investment, trade andbusiness linkages
RVCs
Examples• Automotive
• Electronics
EMSSubcomponentsKey electronics componentsConsumer electronics (e.g. computers)
• Agriculture (palm oil)
Facilitatesregional value chains
and productionnetworks
Regionalintegration Exports and GVC connection
• Global
• Intraregional
Companies’connectivity
Countries’connectivity
Industries’connectivity

Chapter 4: Infrastructure and economic connectivity in ASEAN
167
RVCs in ASEAN also take place at a number of different levels: sub-component and component manufacturing, assembly and post-assembly. At each stage, major companies operate on an RPN basis with multiple plants in a host country and connect in subsequent stages of the value chains with affiliates or other suppliers or customers operating in different ASEAN Member States. For parts and components that they do not produce or that they produce in insufficient quantity, these companies source directly or through contract manufacturing from their suppliers in the region. RVCs also occur through the interconnection of business functions of different affiliates operating in ASEAN countries. Intra-firm RVC business connections within an MNE group can include research and development, manufacturing of key components, assembly, sourcing of other intermediate inputs, testing, regional administrative and logistics operations, and marketing and distribution functions based in different ASEAN Member States.
Source: AIR 2014.
Box 4.3. RVCs and RPNs contribute to regional connectivity in ASEAN (concluded)
A single market and production base
• 10 rapidly growing economies• 625 million population• $2.4 trillion combined GDP• Young labour force• Rapidly expanding middle-class consumers• Strong locational complementarity
AEC
ATIGASingle Window ACIA AFAS
MRAASEAN
Connectivity
Free flow ofgoods &
sourcing ofinputs
Free flow ofinvestment
Free tradein services
Free flow ofskilled labour
Free flow ofcapital
Objectiveof AEC
Mechanism/arrangement
ASEAN Finance Cooperation
ASEAN StockExchanges
ASEAN Disclosure Standard
Figure 4.6. AEC: A key source for regional economic connectivity
Source: AIR 2014 and UNCTAD 2014b.Note: ACIA = ASEAN Comprehensive Investment Agreement; AFAS = ASEAN Framework Agreement on Services; ATIGA = ASEAN Trade in Goods Agreement; MRA = Mutual Recognition Arrangement

ASEAN INVESTMENT REPORT 2015: Infrastructure Investment and Connectivity
168
Regional initiatives Measures/mechanism Selected effects on RVCs
ASEAN Comprehensive Investment Agreement (ACIA)
• Removes investment impediments and opens up industries for investment
• Provides investment promotion and protection
• Enhances regional investment cooperation and facilitation
• Increases transparency and provision of investment information
• Improves regional investment environment through collective and individual actions in liberalization, facilitation and promotion of ASEAN as an investment region
• Increases the competitiveness of ASEAN for FDI and intra-ASEAN investment
• Supports investment networks in ASEAN, which can lead to increase in RPN and RVC activities, including multi-plant operations regionally
• Supports contract manufacturing and related investment by first-, second- and third-tier component manufacturers
ASEAN Trade in Goods Agreement (ATIGA)
• 96% of the 99,434 total tariff lines in ASEAN will have zero tariff for intra-ASEAN imports by 31 December 2015.
• However, 99.2% of the total tariff lines of the six major ASEAN economies (Brunei Darussalam, Indonesia, Malaysia, the Philippines, Singapore, Thailand) are already at a 0% rate.
• Lowers transaction costs• Zero tariff = goods move across the region as if
within a single country• Facilitates regional sourcing of final products and
intermediate goods; increases production efficiency• Facilitates intra- and inter-firm trade within the region,
hence increasing regional connectivity• Supports contract manufacturing by ASEAN and
non-ASEAN firms across the region because of the ease of movement of goods regionally and the lower cost
Customs and Trade Facilitation • ASEAN single window • Facilitates easier, smoother and more efficient flow of goods and customs clearance
• Reduces lead time from factory to customers• Streamlines customs procedures and processes,
hence reducing the cost of physically moving goods regionally
Industrial Cooperation • AICOa
• SME cooperation• Supports RPNs through exchange of parts and
components by automotive, electronics and other companies
• Improves both regional cooperation in SME development and capacity for national SMEs to be regional players, thereby supporting industry in the region
ASEAN Connectivity • Connecting ASEAN through physical infrastructure, people and institutions
• Increases connectivity in ASEAN, which helps lower further the transaction costs of doing business
• Facilitates investment in power and cross-border energy trade – increasing the reliability of power and other energy supply
• Lowers the cost of transporting and delivering goods and services across ASEAN and to the world
• Increases efficiency of travel within the region and to other international hubs
• Easier access to skills and professionals in the region
ASEAN FrameworkAgreement on Services (AFAS)
• Mutual recognition of standards• Services liberalization packages on
WTO-plus principle
• Facilitates movement of skills and professionals in the region
• Investment opportunities in the services sector
Strengthening external relations
• ASEAN-China FTA• ASEAN-India FTA• ASEAN-Japan CEP• RCEP• Others
• Expands market reach for companies operating in ASEAN to other partner markets and resources
• Increases opportunity for RVCs to link with operations in partner countries
Source: Based on AIR 2013 and UNCTAD 2014b.Note: AICO = ASEAN Industrial Cooperation; RCEP = Regional Comprehensive Economic Partnership; RVCs = regional value
chains; RPNs = regional production networks; SME = small- and medium-size enterprisea No new AICO applications from 1 January 2013 because most ATIGA tariffs are already at a 0% rate, so there is no AICO tariff benefit
to be gained.
Table 4.10. Regional measures/agreements can affect production and the RVC landscape

Chapter 4: Infrastructure and economic connectivity in ASEAN
169
4.2.3. Subregional connectivity
Subregional economic and infrastructure cooperation among constituent members or contiguous areas is also connecting ASEAN Member States. These subregional arrangements include the BIMP-EAGA, the IMT-GT and the GMS (table 4.11).
Economic activities and subregional infrastructure projects completed or being developed in these subregions contribute to regional connectivity. Development in these subregions would make it easier to realize broader regional economic and infrastructure connectivity. Annex tables 4.1 and 4.2 highlight some of the identified priority infrastructure projects involving ASEAN Member States under the BIMP-EAGA and GMS. Most of the projects are in transport infrastructure. As of 30 June 2015 there were 41 high-priority investment projects in transport, electricity and economic zones listed in the GMS Regional Investment Framework 2013-2022 (RIF). These projects worth $16.3 billion at various stages of implementation and consideration are directly associated with the five ASEAN Member States in the GMS (ADB 2015).
Subregion Members Areas of cooperation (selected coverage)
East ASEAN Growth Area (BIMP-EAGA), formally launched in 1994
The entire sultanate of Brunei Darussalam; the provinces in Kalimantan, Sulawesi, Maluku and Papua in eastern Indonesia; the states of Sabah and Sarawak and the federal territory of Labuan in Malaysia; and Mindanao and Palawan in the Philippines
Aims to increase economic cooperation and connectivity among members of the subregion and outside the subregion. Areas of cooperation include trade, tourism, investments and infrastructure development. The role of the private sector is important.
Indonesia–Malaysia–Thailand Growth Triangle (IMT-GT) established in 1993
14 provinces in southern Thailand: Krabi, Nakhon Si Thammarat, Narathiwat, Pattani, Phattalung, Satun, Songkhla, Trang, Yala, Chumphon, Ranong, Surat Thani, Phang Nga, and Phuket
8 northern states of Peninsular Malaysia: Kedah, Kelantan, Melaka, Negeri Sembilan, Penang, Perak, Perlis, and Selangor
10 provinces of Sumatra, Indonesia: Aceh, Bangka-Belitung, Bengkulu, Jambi, Lampung, North Sumatra, Riau, Riau Islands, South Sumatra, and West Sumatra
Aims to accelerate economic cooperation and integration among the members. The private sector has been playing and is expected to continue to play a role in this process. Areas of cooperation include trade, investment, infrastructure, tourism and agriculture.
Greater Mekong Subregion (GMS) formed in 1992
Cambodia, the People’s Republic of China (Yunnan Province and Guangxi Zhuang Autonomous Region), Lao PDR, Myanmar, Thailand, and Viet Nam
Aims to strengthen cooperation and connectivity of Member States. Subregional projects cover transport, energy, telecommunications, environment, human resource development, tourism, trade, private sector investment and agriculture. ADB has provided support since 1992.
Source: Based on information of these subregions and ADB.
Table 4.11. Subregional arrangements contribute to regional connectivity(Selected cases)

ASEAN INVESTMENT REPORT 2015: Infrastructure Investment and Connectivity
170
4.2.4. Extraregional sources of connectivity
Some ASEAN Member States are also undertaking projects with non-ASEAN neighbouring countries (e.g. China and India), which can contribute to improving infrastructure and connectivity between the ASEAN Member States. For instance, the $370 million proposed project to improve the Upper Mekong River Navigation Channel from China and Myanmar to Houayxay (Lao PDR) will increase connectivity among the ASEAN Member States as well as with China.5 The 500 kilovolt (kV) interconnection between the People’s Republic of China, Lao PDR and Thailand, estimated to cost $600–800 million, will have an impact on power connectivity between the ASEAN Member States and with China.
4.3. Impacts of regional connectivity
Regional connectivity in ASEAN has a direct impact on lowering transaction costs and on increasing competitiveness and economic activities including generating an enhanced environment for investment, trade and production in the region. It facilitates easier movement of people and goods, reduces travel time, enables reliable access to interconnected grid-based electricity and generates spillover benefits for downstream businesses (table 4.12). Furthermore, ICT connectivity reduces the regional digital divide and supports the growth of ICT-enabled downstream business activities (e.g. e-commerce). With regional connectivity, the environment for RVC and RPN operations will become even more conducive and in turn RVCs/RPNs will further strengthen ASEAN’s integration.
4.3.1. Electricity connectivity impact
Resource endowments in the region are uneven. Some ASEAN Member States have significant fuel resources available for electricity generation, while others face challenges in securing fuel sources for power electricity generation plants. Regional power exchange or trade and grid interconnections provide solutions to increase regional cooperation to overcome power challenges. Such regional cooperation increases not just grid connectivity but also trade and resource connection among ASEAN Member States. Regional power infrastructure development can benefit participating countries in terms of total investment cost reductions, improve the stability of electricity supply and move towards decarbonization (access to renewable energy). For some Member States, it helps to generate revenue from electricity trade, which can be used to support national infrastructure development.
Increasing power trade benefits power-producing as well as power-importing Member States. Those with ample energy sources (e.g. hydropower, geothermal, coal) can produce electricity more cost-effectively, while those with limited energy sources to generate electricity can gain from importing. Subject to location, distance and peak time, Member States can benefit from power exchange or power trade. The region can also achieve optimal use of energy resources, fuel diversification and energy security.
For instance, more hydropower plants are being built in Lao PDR to supply electricity to Thailand and other neighbouring countries (box 4.4). A Trans-Borneo Power Grid transmission link project currently being developed would bring hydropower from Sarawak

Chapter 4: Infrastructure and economic connectivity in ASEAN
171
InfrastructureInstitutional arrangements
Selected objectives
Impact on selected sectors/ areas
Cases/examples
Electricity •PPAs•ASEAN
Power Grid
•Energy security and reliability
•Power markets development
•Power grid interconnection
• Lower-cost electricity through export/import
•Power plant development based on energy source allocation
•Power exchange or trade between neighbouring energy-surplus and energy-deficient countries. Encourage investment in power plants in fuel source–rich Member States.
•Contiguous and remote areas can be developed. More industrial estates and commerce can be established.
•Economic and industrial plans can be supported.
• Increase supply of electricity to more homes and more factories.
•Rural development can be achieved, including employment generation and opportunities for women.
• Improved quality of life and living standard.
•Electricity generated in the Hongsa power plant in Lao PDR transmitted to Thailand.
•Some 90% of electricity from the Xe Pian Xe Namnoy hydropower plant exported to Thailand.
•Sarawak (Malaysia)-West Kalimantan (Indonesia) power grid connection benefitting the two countries in terms of access, cheaper cost, electricity trade and improved environment.
•Malaysia–Thailand grid inter-connection for power exchange.
Transport
(Road, Rail, Airports and Ports)
•AHN•SKRL•Airports
connectivity•RORO (ports)
•Ease of movement of goods and people
•Support trade and exports
•Regional transport connectivity and link with outside the region
•Upgrading and modernization of transport infrastructure services
•Development of transport missing link (road and rail)
• Lowering of logistic and transaction costs for agriculture, manufacturing and services industries.
•Support the tourism industry and hospitality businesses, and promote cultures of the region (people-to-people connectivity).
•Enable downstream logistic businesses to exist.
• Increases competitiveness of industries in attracting FDI.
•Reduce traveling time within country and regionally through intercountry transport networks.
•Airport links, supporting feeder hubs, international connections and rise of budget airlines.
•Bridge links, connecting islands and contiguous areas separated by seas and rivers, which have an effect on border trade and tourism.
•SKRL and national high-speed rail development in Malaysia to Singapore and in Thailand.
•Airport upgrades and new airports development in ASEAN Member States
•Completion of missing roads under the AHN arrangement.
• Linking of national highways and road networks with neighbouring countries such as the road connection of Thailand with Malaysia, Malaysia with Singapore, Lao PDR with Thailand and the Trans-Borneo highway.
•The improvement of the road from Pontianak, West Kalimantan (Indonesia) to the Sarawak (Malaysia) border shortens the route by 100 km and reduces travel time and cost.
•Singapore–Malaysia bridge causeway link, Thailand–Lao PDR bridge link, Thailand–Myanmar bridge link and Malaysia–Brunei Darussalam Friendship Bridge connection.
ICT ASEAN Broadband Corridor
• ICT access and bridging digital divide
•Support ICT-enabled business (e-commerce, BPO, ICT service providers)
• ASEAN’s average broadband subscriptions per 100 inhabitants grew from 5.1 in 2010 to 8.5 in 2014.
Source: UNCTAD 2015b.Note: AHN = ASEAN Highway Network, BPO = business process outsourcing, ICT = information and communication technology, PPA
= power purchase agreement, RORO = roll-on/roll-off, SKRL = Singapore-Kunming Rail Link.
Table 4.12. Contribution from infrastructure connectivity in ASEAN involves various sectors(Selected cases)

ASEAN INVESTMENT REPORT 2015: Infrastructure Investment and Connectivity
172
(Malaysia) to West Kalimantan (Indonesia). The project will help Sarawak Energy, a State-owned entity, sell excess electricity generated from the hydropower plant and would help West Kalimantan to secure a more cost-competitive power supply. Under a power exchange agreement signed between Perusahaan Listrik Negara (Indonesia) and Sarawak, the former would be able to obtain electricity for West Kalimantan at $0.18 per kilowatt-hour in lieu of its fuel-generated electricity at $0.25 per kilowatt-hour. The power exchange between the two countries will also contribute to reducing carbon dioxide emissions by 400,000 tonnes a year by 2020.6
Tenaga (Malaysia) signed an agreement with Indonesian state-owned utility company PLN and coal miner Bukit Asam (Indonesia) in 2012 to build a coal-fired power plant in Sumatera, Indonesia.7 The agreement also covers the construction of a 275 kV interconnection line from Melaka, Malaysia to Sumatra, Indonesia. The power plants will have a combined capacity of 1,200 MW. The interconnection project for a 600 MW HVDC link will span across the Straits of Melaka connecting Teluk Gong in Melaka, Malaysia and Perawang, Riau. The
Box 4.4. Regional power trade projects increase power connectivity and access to cheaper electricity in ASEAN
Power trade projects among ASEAN Member States are increasing and will further enhance regional connectivity. This is achieved with provision of affordable grid-based electricity from an exporting country to an import recipient. Lao PDR and Viet Nam are exporting electricity to a number of neighbouring countries with grid interconnection. More grid connectivity projects are being planned. They will include the following main components:
Component 1Development of a cross-border 115 kV transmission line linking Ban Hat (Lao PDR) and Stung Treng (Cambodia), to facilitate import of lower-cost electricity from Lao PDR to displace higher- cost diesel-fueled generation sources in Cambodia.
Component 2
Development of a cross-border 115 kV transmission line linking Tan Bien (Viet Nam) and Kampong Cham (Cambodia) for bilateral power exchanges, beginning with imports of lower-cost electricity from Viet Nam to displace diesel-fueled generation in Cambodia, and leading over the long term to the transfer of surplus hydropower from Cambodia to Viet Nam.
Component 3
Development of the Xeset 1 to Saravan segment of the proposed 115 kV transmission link that will eventually interconnect electricity grids from (western) Thailand through (southern) Lao PDR to (southern) Cambodia.
Component 4
Development (feasibility, design, building, commissioning) of a modern Load Dispatch Center for Lao PDR to facilitate regional power trade and development of grid-to-grid interconnections and to enhance the security of a future integrated GMS power grid.
Source: World Bank, “GMS Power Trade (Lao PDR) Project” (http://www.worldbank.org/projects/P105331/gms-power-trade-laos-project?lang=en).

Chapter 4: Infrastructure and economic connectivity in ASEAN
173
commercial operation date for the various power plant projects will range from 2018 to 2019.
The construction of a transmission line from the Viet Nam border to major substations in Cambodia provided a reliable and affordable supply of electricity, which made possible the development of a special economic zone in Kampot province (Cambodia). The economic zone in turn attracted some 40 businesses and generated 10,000 jobs for the local community.8
Regional power trade can potentially provide cost-saving solutions to meet ASEAN’s growing electricity demand (box 4.5). A study estimated that under the assumptions of a 20% and 50% regional power trade situation, the total cost to meet the growing electricity
Box 4.5. Benefits and feasibility of ASEAN power grid interconnectivity
The APG and subregional power cooperation such as is occurring at the GMS level are key levers for regional power grid interconnectivity among the ASEAN Member States. Both have been making steady progress, in the form of bilateral interconnection projects with long-term PPAs. This is perceived as the first stage towards the fully functioning regional grid for multilateral trading of power (Li and Chang 2015).
A fully functioning regional grid can generate many benefits for participating ASEAN Member States. Through such interconnection, the development of cheaper renewable energy resources, which exist in abundance in the region, could be further developed, especially hydropower in the GMS. In addition, the interconnected grids can take advantage of the varying timing of peak and non-peak hours in different countries and thus save a large portion of the investment in expensive peak power generation capacities. The Economic Research Institute for ASEAN and East Asia (ERIA) (2013) estimated some $11 billion net savings in the cost of electricity generation for all ASEAN Member States and two Southwest China provinces as well as Northeast India in a 20-year period, despite the high initial costs of investment in interconnecting transmission lines.
However, the high upfront cost of new transmission lines for cross-border interconnection and the uncertainty of future demand for imports and exports of electricity through these transmission lines complicate the financial decisions to invest. The financial feasibility of each proposed cross-border transmission line needs to be carefully studied. One study identified that the power grid interconnection among Lao PDR, Malaysia, Singapore, Thailand, and Viet Nam is financially feasible and should be prioritized (ERIA 2014). This finding coincides with the initiative by the governments of Lao PDR, Thailand, Malaysia, and Singapore to develop interconnection and demonstrate a multilateral framework for cross-border trade in electricity.
Further institutional issues still hinder the realization of a fully interconnected power grid in the region. These are mainly concerned with (i) regional coordination of infrastructure development plans and rules for data and information communication, (ii) wheeling charges (transmission tariffs) for multilateral cross-border power trade with proper unbundling and coordinated review criteria in each participating Member State, and (iii) harmonization of technical standards, including operation and connection standards (Li 2015).
Source: ERIA.

ASEAN INVESTMENT REPORT 2015: Infrastructure Investment and Connectivity
174
demand in ASEAN during 2010–2030 could decline by 3% and 3.9%, or equivalent cost savings of $21 billion and $29 billion in 20 years if compared with the “no regional power trade” scenario (Chang and Li 2012).
Another study of power interconnection projects among the ASEAN Member States indicates that significant benefits can be expected from several transmission interconnections (Thailand–Lao PDR, Viet Nam–Lao PDR–Thailand, and Lao PDR–Thailand–Malaysia–Singapore) in relation to the estimated cost of the transmission lines (table 4.13). Grid connections between Thailand and Cambodia and between Malaysia and Indonesia are also expected to generate benefits for the constituent members. In addition, the eventual interconnection of the 16 earmarked ASEAN power grids and power exchange is expected to generate a net saving of $788 million and a reduction in installed capacity by 2,013 MW in the region (Ibrahim 2014).
Selected casesPossible cumulative cost
benefit range($ million)
Estimated cost of transmission line
($ million)Order of priority
Thailand–Cambodia 4,560–5,470 162–1,009 Second priority
Thailand–Lao PDR 19,282–20,604 728–1,957 First priority
Thailand–Myanmar (4,607)–(2,766) 2,244–3,956 Need careful assessment
Myanmar–Thailand–Malaysia–Singapore (1,118)–3,064 2,384–6,272 Need careful assessment
Viet Nam–Lao PDR–Thailand 21,604–23,715 922–2,885 First priority
Malaysia–Indonesia 3,968–4,087 1,790–1,901 Second priority
Lao PDR–Thailand–Malaysia–Singapore 23,217–26,557 868–4,273 First priority
Source: Kutani and Li (2014).
Table 4.13. Interconnection grids and their priority in ASEAN
4.3.2. Transport connectivity impact
Transport infrastructure connectivity also contributes to lower transaction costs in moving goods and people, including significantly reducing travel time and supporting intraregional trade.9 Bridge links across seas and rivers make travel more easy, reduce transit time and cost including contribute to border trade, and increase tourism. Such bridge links include the causeway link between Malaysia and Singapore, and the various inter-country bridges that provided the link such as between Thailand and Lao PDR, Thailand and Myanmar, Lao PDR and Myanmar as well as between Cambodia and Viet Nam. Aside from lower logistical costs, these bridge linkages reduce travel time and provide faster movement of goods and people, which can enhance trade, business and tourism.
Infrastructure projects undertaken in the GMS have generated economic benefits to the constituent members. Road improvements in Champasak Province (Lao PDR) were estimated to have increased the number of tourists by 128% between 1998 and 2004 (the early years when the road was improved) because of travel conditions and connectivity

Chapter 4: Infrastructure and economic connectivity in ASEAN
175
with neighbouring countries (ADB 2008). The opening of the second Mekong International Bridge in December 2006 led to an 8% increase in tourism in the first two months of 2007 alone. The increase in interconnected roads has meant an increase in regional tours, which is true of Lao PDR, Thailand and Viet Nam (Rattanatay 2007). The improvement in the GMS subregional transport network generated an estimated 45% decline in land transport costs and a 25% drop in the cost of imports (ADB 2009).
The Phnom Penh (Cambodia) to Ho Chi Minh City (Viet Nam) highway project reduced travel times to schools and markets by about 40% (Phyrum et al. 2007). The development of the Densavanh to Khanthabouly road, between the Lao PDR and Viet Nam borders, reduced travel time from approximately 12 hours to 2.5–3 hours (Rattanatay 2007). The improvement of the road from Pontianak (West Kalimantan, Indonesia) to the Sarawak (Malaysia) border is expected to shorten the route by 100 km, in addition to saving vehicle operating costs and time (annex table 4.2). The opening of the Pandaruan Bridge (Malaysia–Brunei Darussalam Friendship Bridge) in 2013 helped improve connectivity between the two countries and significantly save traveling time by replacing ferry crossings – which used to require commuters to spend up to 2 hours to cross the 60 m wide river as compared with the few minutes it takes now. The construction of the Kuala Lurah border-crossing facility, when completed, will significantly reduce travel time for road users and improve connectivity in the subregion involving Brunei Darussalam and Sabah (Malaysia) and Sarawak (Malaysia) (annex table 4.2). The 3,200 km India–Myanmar–Thailand Trilateral Highway project, which is expected to open in November 2015, is projected to cut travel time from 3 hours to 45 minutes for the first 26.5 km of the highway.10
The SKRL will connect the capital cities of Cambodia, Lao PDR, Myanmar, Viet Nam and Thailand, and connect to Kuala Lumpur and Singapore. The 330 km Kuala Lumpur–Singapore high-speed rail link when completed will form part of the SKRL. Travel time between the two cities will drop to 90 minutes instead of the current 6 hours. The rail link between the countries is projected to have a significant impact on several industries, including tourism and logistics.
The AHN serves as the skeleton of land transport for the region, connecting capitals, seaports and airports. It also provides vital support in facilitating investment and tourism development in the region. The AHN enhances transport connectivity not only in and between the ASEAN Member States but also with neighbouring countries and beyond, as it is also connected to the Asian Highway Network. The AHN provides important support for intra- and inter-regional trade with more efficient and greater accessibility for goods and services. It also helps reduce transportation and trade costs, establish linkages with regional and global supply chains, and facilitate greater regional integration.
4.3.3. ICT Impact
There is evidence to support the benefits of improvement of ICT infrastructure, which significantly lower cost and access to ICT facilities by a broader range of users, such as in the case of the CLMV countries (chapter 2).

ASEAN INVESTMENT REPORT 2015: Infrastructure Investment and Connectivity
176
4.3.4. Spillover benefits
There are other spillover effects from infrastructure connectivity. Two distinctive business categories would benefit from regional infrastructure improvement. Downstream businesses that rely directly on the provision of quality infrastructure such as logistic companies, e-commerce and tourism fall in one category. Another category is businesses, factories and industrial estates in remote areas. Given that electricity can be supplied to remote areas or industrial estates in another Member State, more factories in these poor areas can be lighted and established because of the certainty of power supply. These industrial estates in turn help attract more factories, create employment, generate exports, induce rural development, alleviate poverty and facilitate gender equality.
Infrastructure development and connectivity increases the attractiveness of the investment environment in ASEAN. Cost savings and increased competitiveness will be key features arising from regional connectivity. At the level it is now, regional connectivity has influenced investment, trade and production activities in the region. However, a physically more connected region will bring about a stronger, economically connected ASEAN, which in turn will increase the attractiveness of the region in attracting FDI, promote trade and support additional RVC/RPN activities.
4.4. MNEs’ role in regional connectivity
The private sector, including MNEs, plays an important role in regional connectivity through investing, building and managing infrastructure. Furthermore, MNEs involved in intraregional production activities, provision of services and intraregional trade are another important catalyst for ASEAN connectivity.
The role of the private sector in regional connectivity has not been well documented as compared with that of institutional development. The private sector makes physical and economic connectivity possible through investment and business operations, which are facilitated by regional institutional development and setting.
ASEAN and foreign MNEs participate in infrastructure development across the region (chapters 2 and 3). Some participate as concession holders and engineering, procurement and construction (EPC) contractors, delivering infrastructure and connecting it at national, subregional and regional levels. Some provide finance to enable the implementation and completion of infrastructure projects that have a regional connectivity element, while some invest as owners of infrastructure assets.
MNEs from within and outside the region are helping ASEAN get interconnected. For instance, Korean companies such as SK Engineering and Construction and Korea Western Power constructed transmission lines linking Lao PDR and Thailand for supply of electricity.11 ASEAN and foreign companies such as Vinci (France), Yongnam (Singapore) and Muhibbah Engineering (Malaysia) are investing and managing a number of airports in the region,

Chapter 4: Infrastructure and economic connectivity in ASEAN
177
which connect travel to and from other ASEAN Member States.12 Japan`s Sumitomo Mitsui Construction and China Railway No. 5 Engineering Group have built bridges that link ASEAN Member States,13 and China Railway Construction Corporation and Malaysia’s Giant Consolidated helped in rail connectivity.14
Power infrastructure connectivity
MNEs have been involved in the construction and ownership of power plants that supplied electricity from one Member State to other Member States (chapter 2). Some of these MNEs also built power stations and transmission lines connecting to power plants. These companies include China National Electric Engineering Company, Obayashi (Japan), EGAT (Thailand), Tenaga (Malaysia), Banpu (Thailand) and Siemens (Germany). Companies such as Sarawak Energy (Malaysia), Sarawak Cable (Malaysia), Siemens (Germany) and AECOM (United States) have played a role in the construction of transmission lines and power connectivity in the region (box 4.6).
There is significant potential for private sector participation in transmission line projects in ASEAN (table 4.14). The region has a network of at least 3.1 million km of transmission and distribution lines in 2011. It is estimated that the region would need some 250,000 km of additional transmission lines and a further 4.0 million km of distribution lines to connect end-users between 2011 and 2035 (IEA 2013). Table 4.15 shows the role of MNEs in energy connectivity projects.
Country Connectivity Private participation
Cambodia Several cross-border interconnections are planned, mainly at low voltage. A 230 kV line to Lao PDR may be constructed.
This is significant for both large-scale and small-scale generation.
Lao PDR Many cross-border interconnections are planned, mainly for export of power to Thailand and Viet Nam.
The private sector is very strong in generation and potentially will enter transmission.
Myanmar Very large investments are likely to be needed to transmit power to China and Myanmar. These pose great challenges of sustainability.
Considerable private finance is the only conceivable basis for expansion on the scale envisaged.
Thailand Strong connections are with Lao PDR and several cross-border connections planned with Cambodia and Myanmar.
The most recent power development plan appears to eschew private finance, except for small and very small power producers.
Viet Nam Several lines to China may be substantially strengthened; greater connectivity to Cambodia is likely.
Private finance was successful in the early 2000s but then dried up. Reforms have been made to the public-private partnership regime.
Source: Asian Development Bank (2013a).
Table 4.14. The private sector can play important roles in power connectivity in GMS(Planned projects)

ASEAN INVESTMENT REPORT 2015: Infrastructure Investment and Connectivity
178
Box 4.6. Companies help ASEAN Member States connected through power projects (Selected cases)
Sarawak Energy (Malaysia) is a State-owned energy company. It is involved with electrical power generation, transmission and distribution. It transfers energy from its power plants in the Sarawak region to other regions in Malaysia. In late 2013, the company signed on for a 500 kV transmission line project with Toshiba Transmission and Distribution System (Japan) and China Xian Electric Engineering, to build a high-voltage transmission line over 500 km from Similajau in Bintulu to Tondong in Kuching (Sarawak, Malaysia).a
Sarawak Cable (Malaysia), 16.5% owned by Sarawak Energy (Malaysia), is constructing transmission lines between Sarawak (Malaysia) and West Kalimantan (Indonesia) to deliver 230 MW of renewable energy. The transmission line goes through the state grid, which is owned by Sarawak Energy.b Sarawak Cable has also constructed a 275 kV underground high-voltage cable, which exports electricity from Malaysia to Indonesia. In addition, Sarawak Cable owns 78% of PT Inpola Mitra Elektrindo (Indonesia), which is developing a 10 MW power plant in Indonesia, due to be completed at the end of 2015.c
Siemens Energy (Germany) has constructed and has ongoing power projects in ASEAN, including the First NatGas Power in the Philippines, Block 2 of the Chana combined-cycle power plant in Thailand (jointly with Marubeni), the Pengerang cogeneration plant in Malaysia, the PLP combined-cycle power plant in Singapore and the Nhon Trach 2 combined-cycle power plant in Viet Nam.d Aside from building power plants, Siemens Energy has also played a role in developing power connectivity projects in the region. Completed transmission projects undertaken by the company as a lead contractor include the 300 MW Thailand–Malaysia HVDC interconnection system, which involved construction of the Khlong Ngae converter station at the Thai border and the Gurun converter station at the Malaysia border, which were then linked with an overhead transmission line of 110 km carrying 300 kV of electricity.e
AECOM (United States) is a technical and management support services MNE that operates in the transportation and energy industries. It has completed hydropower projects in ASEAN, such as the Mrica hydropower project in Indonesia and the Buon Kuop hydropower plant in Viet Nam. The company is currently involved with the construction of a power line interconnectivity project associated with the Nam Theun II hydropower plant in Lao PDR, which is 40% owned by Electricité de France, 25% by Lao Holding State Enterprise and 35% by EGAT (Thailand). AECOM is to construct a 115 kV, 70 km line from Nam Theun II to Pakse and a 500 kV, 170 km line from the power station to Savannakhet and across the Mekong River to Thailand.
Source: UNCTAD 2015b.a http://www.sarawakenergy.com.my/index.php/news-events-top/latest-news-events/latest-media-
release/513-sarawak-energy-inks-deal-with-toshiba-ttda-china-xian-electric-for-500kv-transmission-backbone
b http://www.theborneopost.com/2015/03/19/electricity-to-be-exported-to-kalimantan-by-year-end/c http://www.thestar.com.my/Business/Business-News/2015/02/16/Sarawak-Cable-getting-better-
power-deal-in-Sumatra/?style=bizd http://www.energy.siemens.com/hq/en/sustainable-energy/e http://www2.egat.co.th/hvdc/INTRODUCTION.HTML

Chapter 4: Infrastructure and economic connectivity in ASEAN
179
Project Location Owner EPC TransmissionCapacity (MW)
Remarks and Source
Hongsa Xayaboury in Lao PDR near Thailand
LHSE (Lao PDR) 20%
Banpu (Thailand) 40%
Ratchburi (Thailand) 40%
Chinese consortium led by China National Electric Engineering Company.
1878 In June 2015, unit 1 started to supply 500 kV through a transmission line to EGAT’s grid in Thailand. The commercial operation dates of units 2 and 3 are expected to occur in November 2015 and March 2016. First Northeast Electric Power Engineering (NEPC) is the subcontractor. ABB (Switzerland) is providing the technology/system solution. The cost of the project is $3.7 billion. A transmission line has been constructed to supply energy to Thailand.
Xekaman 1 Vientiane and Xiangkouang
Viet-Laos Power Joint Stock Company and Laos Electricity Corporation
CK Power (Thailand) 322 The plant was built at a cost of $441 million. With the Xekaman Xansay hydropower station, the combined output will be 1.2 billion kWh per year. About 20% of the output will be for the local market and the remaining 80% for export to Viet Nam. Andritz (Austria) won a contract in 2013 to deliver the electromechanical equipment.
Nam Ngiep 1
Bolikhamxay PIC Netherlands (45%), a subsidiary of Kansai Electric Power, EGAT International (30%), and Lao Holding State Enterprise (25%)
Obayashi (Japan) 290 Some 1,620 GWh of electricity is projected to be generated annually. To export the power, two transmission lines will need to be constructed. The 125 km 115 kV transmission line will be constructed by EDL (Electricité du Laos) and Japan’s Obayashi won the civil engineering contract.
Sepian-Xenamnoy
Attapeu andChampasak
LLHSE 24%SK Engineering & Construction (Republic of Korea) 26%Korea Western Power (Republic of Korea) 25% Ratchaburi Electric Generating Holding Public Company (Thailand) 25%
SK Engineering and Construction (Republic of Korea)
410 Some 90% of the electricity generated by the plant will be sold to EGAT (Thailand), with the remaining 10% sold to EDL (Lao PDR). Power will be exported through a 230 kV transmission line to the Pakse Substation, and from there a 500 kV Transmission Line to the Thai-Lao PDR borders. KOWEPCO (Republic of Korea) was awarded a 27-year operations and maintenance contract.Tractebel Engineering (France) was given the owner’s engineering contract. TEAM GROUP (Thailand) completed the environmental impact assessment. ATT Consultants (Thailand) designed the transmission system which will eventually export electricity to Thailand. The pre-feasibility and feasibility study was done by Afconsult (Switzerland).
Nam Theun 2
Electricité de France (40%)
Lao Holding State Enterprise (25%)
Electricity Generating Public Company Limited (35%)
AECOM (United States) 1070 The majority of the electricity is exported to Thailand, earning the Lao PDR government average revenue of $80 million per year over the 25 years of the concession period. The commercial operation date of the plant was 2010.
Khlong Ngae-Gurun
EGAT (Thailand) Siemens AG (Germany) was the main contractor.
300 The Thailand–Malaysia HVDC interconnection is a 110 km, 300 kV DC overhead transmission line. Teshmont Consultants (Canada) was a subcontractor.
Xayaburi Hydro-power Project
EGAT (Thailand) Ch. Karnchang (Thailand)
175 About 95% of the electricity generated by the plant will be exported to Thailand through a planned 200 km transmission line from the plant to Loei Province.
Pöyry’s Energy Business Group (Finland) was the engineer for the construction of the dam and plant. The other subcontractors included Afconsult (Switzerland), Whessoe Engineers (United Kingdom).
Sapien-Senamnoi
Lao PDR Government
SK Engineering & Construction (Republic of Korea)and Korea Western Power (Republic of Korea)
410 The power generated at the site will be transmitted to Thailand and power stations in Lao PDR. The project is expected to cost $1 billion.
Source: UNCTAD 2015b, based on industry and media information.
Table 4.15. The private sector contributes to power interconnection between ASEAN Member States (Selected cases)

ASEAN INVESTMENT REPORT 2015: Infrastructure Investment and Connectivity
180
Land transport infrastructure connectivity
MNEs are playing an important role in developing bridges that link ASEAN Member States. Some are contributing to regional connectivity through building roads and rail links. Many MNEs have built and are building infrastructure that connect the region. Alstom (France) is involved in construction of tunnels in the mountainous areas of Viet Nam to connect rail lines that will be part of the SKRL network. Companies such as the China Railway Construction, Marubeni (Japan), Toshiba (Japan) and Japan Transport Engineering Company are involved with transport infrastructure projects that contributed to regional connectivity (table 4.16). Other companies such as Sumitomo Corporation (Japan) and Italian-Thai Development (Thailand) have constructed bridges that helped connect ASEAN Member States.
In addition, the region is further connected through the activities of other MNEs that rely on the provision of infrastructure. These MNEs include those that operate in businesses such as logistics, business process outsourcing, e-commerce, industrial estates and tourism activities. Without quality infrastructure services, these MNEs will be less likely to invest and operate in a country or region. The existence of quality infrastructure also encourages other MNEs to expand their activities that span across the region with multiple plants in multiple locations.
Table 4.16. Transport infrastructure is also important for regional connectivity(Selected projects)
Infrastructure Connecting countriesCompanies (Contractors)
Remarks
Neak Loeung Bridge Cambodia and Viet Nam Sumitomo Mitsui Construction (Japan)
Construction of the bridge started in 2011 and is expected to be completed in 2015 at an estimated cost of $130 million.
Second Thai–Lao Friendship Bridge
Savannakhet (Lao PDR) and Mukdahan (Thailand)
Sumitomo Corporation (Japan) Completed in 2006 at an estimated cost of $70 million.
Third Thai–Lao Friendship Bridge
Thahhek (Lao PDR) and Nakhon Phanom (Thailand)
Italian-Thai Development (Thailand) Completed in 2011 at an estimated cost of $57 million.
Fourth Thai–Lao Friendship Bridge
Thailand and Lao PDR China Railway No.5 Engineering Group and Krung Thon Engineering (Thailand)
The two companies jointly constructed the bridge, which was completed in 2013.
The budget of the bridge was estimated at about $44.8 million.
Lao–Myanmar Friendship Bridge
Luang Namtha (Lao PDR) and Xienglap, Thakilek (Myanmar)
China Harzone Industry Corporation supplied steel trusses for the construction of the bridge.
The bridge links Lao PDR’s National Road No.17E and Myanmar’s National Road No. 4, and connects Xiengkok river port in the Long district in Lao PDR with Xienglap, Thakilek district (Myanmar). The bridge was opened in May 2015.
Kuala Lumpur to Singapore High-Speed Rail Link
Malaysia to Singapore A number of companies have been reported to have expressed interest in undertaking the project:•China Railway Construction
Corporation
The project is in the bidding process.

Chapter 4: Infrastructure and economic connectivity in ASEAN
181
Table 4.16. Transport infrastructure is also important for regional connectivity(Selected projects) (concluded)
Economic connectivity
Regional and foreign MNEs are contributing to growing RVCs and RPNs, which are connecting ASEAN Member States (AIR 2014). These MNEs include those operating in the automotive industry as vehicle manufacturers, and parts and components producers (box 4.7). Many automotive parts and components manufacturers operate in different ASEAN Member States, and they supply components to automotive manufacturers or to first- and second-tier parts and components producers in the region.
In electronics, MNEs such as Western Digital and Seagate Technology have multiple plants in different ASEAN Member States, producing different key parts and components of hard disk drives (HDDs). They also assemble components supplied by other suppliers operating in the region (together with parts that they produce) into intermediate products to supply to computer companies such as Apple, HP, Lenovo, Samsung, Toshiba and Acer (AIR 2014). Many of the latter group of companies also have multiple plants in ASEAN. Many HDD and other electronic component manufacturers and suppliers operate in different ASEAN Member States.
The relationship between equipment brand owners (e.g. Western Digital, Seagate Technology, Apple and Sony) and the networks of electronic component manufacturers in ASEAN increases regional economic connectivity.
Infrastructure Connecting countriesCompanies (Contractors)
Remarks
•East Japan Railway Company (JR East)
•Alstom (France)•Siemens AG (Germany)
Thai Railway Construction (eventually part of the SKRL)
Thailand China Railway Construction Corporation
Expected to start in 2015.
Thai–Lao–China rail freight link
Thailand, Lao PDR and Cambodia
Giant Consolidated (Malaysia) The rail link is estimated to cost $7.2 billion. Construction of the project will be undertaken with Chinese supervision.
900 km double railway line in Thailand
Eventually part of the SKRL Siemens (Germany)..
Thailand to Viet Nam Railway (through Lao PDR)
Thailand to Viet Nam Giant Consolidated Ltd (Malaysia) Rich Banco Berhad (New Zealand) provided a loan to Giant Consolidated Limited (Malaysia) to fund the construction of rail running across Lao PDR from the Thai to the Vietnamese border.
Sources: UNCTAD 2015b, based on industry reports and media.

ASEAN INVESTMENT REPORT 2015: Infrastructure Investment and Connectivity
182
In agriculture, such as in palm oil cultivation and related merchandise development, regional companies are operating in plantations, refineries and production in different ASEAN Member States. These companies include IOI (Malaysia), Wilmar (Singapore), Sime Darby (Malaysia) and Golden Agri (Indonesia). They have also established business linkages with contract farmers in host countries such as Indonesia and Malaysia (AIR 2014).
Some of these companies in turn provide raw materials and intermediate products to food and non-good consumer MNEs operating in different segments of the palm oil value chain. These companies, such as P&G (United States), Unilever (Netherlands/United Kingdom), Cargill (United States) and Nestlé (Switzerland) also have operations in different ASEAN Member States.
Box 4.7. RVC and RPN players in ASEAN
The number of RVC/RPN players in ASEAN is increasing. They include both foreign and ASEAN MNEs. These players in automotive and electronic industries in the region include the following:
Major automotive manufacturers
BMW, Daihatsu, Ford, GM, Hino, Honda, Hyundai, Isuzu, Land Rover, Mazda, Mitsubishi, Nissan, Renault, Suzuki, Toyota and Volvo.
Selected auto part and component manufacturers
AAPICO Hitech, Aisin Ai, Aisin Seiki, Amkor Technology, BASF, Calsonic Kansei, Continental, Cummins, Denso, Delphi Automotive Systems, EDS Manufacturing, Faurecia, Furukawa, GKN, Heraeus Materials, Hitachi Automotive Systems, Jatim Autocomp, Johnson Controls, JTEKT, Kayaba, KDS, Lear, Murata Electronics, Nichicon, Nok Corporation, NSK, ON Semiconductor, Robert Bosch, Sanko Gosei Technology, Sanko Kiki, SCG Industries, Showa Manufacturing, Sumitomo Electric Industries, Tokai Rika, TRW, Usui International Corporation, Valeo, Yazaki and ZF Friedrichshafen.
Selected HDD part and component manufacturers in different ASEAN Member States: Malaysia: Dufu, Eng Technologi, Epson Precision, Fuji Electric, Hiroshige, Iomega, JCY, LKT Tech, MATC, Min Aik, MMI Precision, Notion, ShinEtsu, Syquest Technology, Totoku, VTec. Philippines: CAM Mechatronics, Eng Tecknologi, Hoya, Miyoshi Precision, Nidec, Nitkoshi, TDK. Singapore: Amtek Tech, Beyonics Technology, MMI Industries, Nidec, Norelco, Patec, Showa Denko. Thailand: Cal-Comp, Fujikura Electronics, Furukawa, Hoya Hutchinson Tech, Kuroda, Microsemi, Miyoshi Precision, Minebea, Nidec, Nitto Denko, Nok Precision, NHK Spring, NMB, Shin-Ei Precision, Shin-Etsu Magnetics, TDK. Viet Nam: Armstrong, Hoya.
Other electronic MNEs, including electronic manufacturing services firms, in ASEAN: Benchmark Electronics, Celestica, Compal Electronics, Di-Nikko Engineering, Delta Electronics, Dell, Electrolux, HP, Hitachi, Hon Hai Precision Industry, Intel, Jabil, LG, Plexus, National Semiconductor, New Kinpo Group, Nikon, Nokia, Panasonic, Sanmina, Sanyo, SIIX, Sony, Sumitronics, Texas Instruments, and UMC Electronics.
Source: AIR 2014.

Chapter 4: Infrastructure and economic connectivity in ASEAN
183
4.5. Regional – subregional connectivity projects
Various priority projects related to regional physical connectivity and infrastructure are highlighted in the Master Plan on ASEAN Connectivity (ASEAN Secretariat 2012a). These projects include infrastructure developments in power grid interconnection, road and rail transportation networks, and ICT. There are also priority projects in trade facilitation (e.g. the national single window, mutual recognition arrangements), travel facilitation (e.g. easing visa requirements) and elimination of scheduled investment impediments. These regional projects are at various stages of implementation. When fully implemented, they will strengthen regional connectivity.
At the GMS subregional level, 57 priority infrastructure investment projects as of 30 June 2015 related to transport, electricity and ICT, which are to be implemented between 2014 and 2018 (Annex table 4.1, ADB 2015). These projects, which aim to connect and develop the GMS constituent members, are estimated to cost $30 billion during the five-year programme, and a significant proportion of the finance is to come from MDBs, ODA and private sector participation. The projects cover construction of new infrastructure and upgrading of existing assets in transport (i.e. road, bridge, rail and port link), electricity and ICT connectivity. The list of projects and their huge cost illustrates the important role of MDBs to these projects with connectivity implications in the GMS area.
Planned infrastructure connectivity projects, including upgrading of existing facilities in the BIMP-EAGA, are dominated by land transport improvement and connectivity activities (annex table 4.2). Other projects to strengthen this subregion include commerce, tourism and investment.
4.6. Conclusion
ASEAN Member States are increasingly interconnected through national, subregional and regional infrastructure development. The region is also interconnected through production, investment and trade activities carried out by MNEs and ASEAN companies operating in different Member States. The implementation of regional programmes such as those highlighted in the Master Plan on ASEAN Connectivity and the Declaration on the AEC Blueprint will further strengthen regional linkages.
In addition to the development of national and subregional infrastructure connections, ASEAN Member States are also connecting through a number of major regional infrastructure programmes. The APG and the TAGP are contributing to energy security in the region. Some electricity grids are already interconnected, some are being developed, and more are expected to be completed by 2026. The increase in PPAs together with existing and ongoing grid connection is further linking the ASEAN Member States. In gas supply infrastructure, significant developments have also been made. Gas can now be moved to demand centres both through pipelines and through a network of gas terminal facilities for LNG.

ASEAN INVESTMENT REPORT 2015: Infrastructure Investment and Connectivity
184
The AHN is also contributing to regional connectivity. In 2015, all remaining missing roads that had held back regional connectivity were built; Member States continue to upgrade the quality of their national roads as part of their commitment in the AHN, which comprises 38,400 km of ASEAN highways. In rail, some Member States are planning to construct high-speed rail lines and some are already developing their sections of the SKRL. The latter will involve some 6,890 km of lines running through several ASEAN Member States. Bridge links and the various intercountry friendship bridges in the region are also connecting some Member States and contiguous areas otherwise separated by rivers and seas.
For facilitating short shipping routes and the transport of goods within the region, an RORO initiative has been introduced in ASEAN ports; the initial run of ASEAN RORO service is expected to be launched by 2017. ASEAN Member States are expanding and upgrading airports to cope with greater demand for air travel, and to support tourism and the growth of regional airlines, with rapidly increasing numbers of planes serving the region. These airport investments play an important role in facilitating the movement of people and the downstream operation of budget airlines and related logistic businesses. The ASEAN Open Skies Agreements have entered into force and been operationalized, and will significantly change the region’s air transport landscape.
In ICT, ASEAN Member States are cooperating in laying an increasing number of criss-crossing undersea cable systems and installing broadband connections.
In moving forward, more cross-border regional infrastructure connectivity work still needs to be done. The overall investment needs for regional physical connectivity projects are huge. Given that public financing is limited, funding for some of these connectivity projects will need to come from multiple stakeholders (public sector, private sector, multilateral development banks [MDBs] and official development assistance). The private sector, both ASEAN and foreign companies, has been involved in investing, building, operating and financing infrastructure development that helps connect the ASEAN Member States. However, the private sector would need to play a greater role to help deliver future infrastructure projects with regional connectivity elements.
Physical connectivity has an important implication for improving logistic efficiency, supporting tourism, lowering transaction costs, and increasing access to regional energy supply, including providing cost-saving solutions to meet ASEAN’s growing electricity demand and gas energy needs. Regional electricity trade and exchanges have helped some ASEAN Member States establish industrial estates and bring electricity to remote areas that otherwise would face significant development challenges. A more physically connected ASEAN will increase further the competitiveness of the region and improve the region’s FDI environment. It also generates spillover benefits for downstream infrastructure-enabled business development such as in logistics, business process outsourcing and e-commerce, all of which have implications for business-to-business and regional connectivity.
In regional economic connectivity, increasing intra-regional investment, contract manufacturer linkages, and intra- and inter-firm operations by foreign and local companies

Chapter 4: Infrastructure and economic connectivity in ASEAN
185
based in ASEAN are further strengthening regional integration. Regional expansion by MNEs and further growth in intra-ASEAN investment is expected to continue with the imminent realization of the AEC, as these firms position themselves as regional players in the industries they serve – and through them, in a greater connected ASEAN.
The future landscape of ASEAN connectivity will be more densely connected in physical and economic contexts in the next decade. In both contexts and at different levels, the private sector – both foreign and local companies – will play an important role in the region’s connectivity.
Notes
1 “Thailand/Vietnam R10 route to be developed”, World Highways, 11 June 2013 (http://www.worldhighways.com/sections/general/news/thailand-vietnam-r10-route-to-be-developed/).
2 The numbers for 2014 are preliminary and exclude data for Indwonesia.3 http://pr.huawei.com/en/news/hw-433846-mct.htm#.Ve2rJrQ7P2w4 https://www.alcatel-lucent.com/press/2014/alcatel-lucent-starts-construction-sea-me-we-5-undersea-
cable-system-linking-singapore-and-france5 Asian Development Bank “Greater Mekong Subregion Regional Investment Framework Implementation
Plan (2014-2018)” (http://www.adb.org/documents/gms-regional-investment-framework-implementation-plan-2014-2018).
6 Ross, Kevin (2013). Transmission link will bring hydropower from Malaysia to Indonesia, Power Engineering International, 28 August 2013 (http://www.powerengineeringint.com/articles/2013/08/transmission-link-will-bring-hydropower-from-malaysia-to-indonesia.html).
7 Reuters, ‘Malaysia’s Tenaga inks power plant MOU with Indonesia firms’, 18 June 2012 (http://www.reuters.com/article/2012/06/18/malaysia-tenaga-mou-idUSL3E8HI5GW20120618).
8 See ADB, “Cross-border energy trade powers development in Cambodia,” 4 December 2014 (http://www.adb.org/results/cross-border-energy-trade-power-development-cambodia).
9 A study indicated that if the necessary infrastructure investment is made in upgrading and improving the Asian Highway Network, intraregional trade in 18 of the 32 member countries would increase by 35% or about $89.5 billion a year (Parpiev and Sodikov 2008).
10 http://www.indiatvnews.com/news/world/section-of-india-myanmar-thailand-asian-highway-put-into-service-26163.html, and http://www.dnaindia.com/india/report-india-myanmar-thailand-superhighway-set-to-open-in-november-2121437.
11 http://www.hydroworld.com/articles/2010/08/south-korean-thai.html and http://www.worldconstruction network.com/news/korea-eximbank-adb-to-provide-420-million-for-hydropower-project-in-laos-141212/.
12 http://www.gvk.com/ourbusiness/airports/iiaindonesia.aspx; http://www.vinci-airports.com/; and http://www.reuters.com/article/2013/11/20/us-indonesia-airports-idUSBRE9AJ19520131120.
13 http://www.construction-property.com/index.php/crocontroller/detailNews/350 and http://www.bangkokpost.com/print/221957/.
14 http://www.rfa.org/english/news/laos/rail-04172013165519.html, and http://www.industryweek.com/supply-chain/china-backed-thai-railway-construction-begin-september.


REFERENCES
187
REFERENCES

ASEAN INVESTMENT REPORT 2015: Infrastructure Investment and Connectivity
188

REFERENCES
189
REFERENCES
ADB (Asian Development Bank) (2008). “Regional Projects in ADF: Impacts and Funding Issues”. Paper prepared for Asian Development Fund Donors’ Third Meeting, Manila, 13–14 March.
ADB (2013a). Assessment of the Greater Mekong Subregion Energy Sector Development: Progress, Prospects, and Regional Investment Priorities. Manila.
ADB (2013b). “Greater Mekong Subregion Economic Cooperation Program: Overview of the GMS Regional Investment Framework (2013–2022)”, 19th GMS Ministerial Conference, Vientiane, Lao PDR, 10–11 December.
ADB (2015). Greater Mekong Subregion 20th Ministerial Conference: Regional Investment Framework Implementation Plan - First Progress Report. Manila.
ADB and ADBI (Asian Development Bank Institute) (2009). “Infrastructure for a seamless Asia” (Manila: Asian Development Bank and Tokyo: Asian Development Bank Institute). http://adb.org/sites/default/files/pub/2009/2009.08.31.book.infrastructure.seamless.asia.pdf).
AfDB (African Development Bank) (2010). African Development Report 2010: Ports, Logistics and Trade in Africa. (Oxford: Oxford University Press).
AIR (ASEAN Investment Report) (2013). ASEAN Investment Report 2012: The Changing FDI Landscape. (Jakarta: ASEAN Secretariat).
AIR (ASEAN Investment Report) (2014). ASEAN Investment Report 2013–2014: FDI Development and Regional Value Chain. (Jakarta: ASEAN Secretariat).
AmCham Singapore and United States Chamber of Commerce (2014). “ASEAN Business Outlook Survey 2015”. (https://www.uschamber.com/sites/default/files/asean_business_outlook_survey_2015.pdf).
AmCham Singapore and United States Chamber of Commerce (2015). “ASEAN Business Outlook Survey 2016”.(http://www.amcham.org.sg/wp-content/uploads/2015/08/ABOS-2016-cover-ii.jpg).
Andreasson, Kim (2014). “The Future of Broadband in South-East Asia”. Economist Intelligence Unit. (http://www.economistinsights.com/technology-innovation/analysis/future-broadband-south-east-asia).
ASEAN Secretariat (2012a). “Master Plan on ASEAN Connectivity”. Jakarta.
ASEAN Secretariat (2012b). “ASEAN Connectivity: Project Information Sheets”. Jakarta.

ASEAN INVESTMENT REPORT 2015: Infrastructure Investment and Connectivity
190
Balisacan, A. M., E. M. Pernia, and A. Asra. (2002). “Revisiting Growth and Poverty Reduction in Indonesia: What Do Subnational Data Show?”, EDR Working Paper Series Number 25, Asian Development Bank, Manila.
Bhattacharyay, Biswa Nath (2013). “Strengthening policy, regulation and institutions for effective transport infrastructure development in Asia”, presented at “The Economics of Infrastructure Provisioning: The (Changing) Role of the States” workshop, Venice, 26–27 July.
Bhattacharyay, Biswa Nath, Masahiro Kawai and Rajat M. Nag (Eds.) (2012). Infrastructure for Asian Connectivity. (Cheltenham, UK and Northampton, MA, United States: Edwin Elgar).
Buys P., U. Deichmann, and D. Wheeler (2006). “Road network upgrading and overland trade expansion in sub-Sahara Africa”. Development Research Group, World Bank, Washington, D.C.
Calderon, César and Luis Servén (2010). “Infrastructure in Latin America”, Policy Research Working Paper 5317, World Bank, Washington, D.C., May. (http://www-wds.worldbank.org/servlet/WDSContentServer/WDSP/IB/2010/05/24/000158349_20100524133508/Rendered/PDF/WPS5317.pdf).
Chang, Y. and Y. Li (2012). “Power generation and cross-border grid planning for the integrated ASEAN electricity market: A dynamic linear programming model”, Energy Strategy Reviews, Vol. 2 (2), pp. 153–160. (http://dx.doi.org/10.1016/j.esr.2012.12.004).
Chang, Y. and Y. Li (2015). “Renewable energy and policy options in an integrated ASEAN electricity market: Quantitative assessments and policy implications”, Energy Policy, Vol. 85, October, pp. 39–49. (http://dx.doi.org/10.1016/j.enpol.2015.05.011).
Deliotte LLP (2012). “What is the impact of mobile telephony on economic growth?: A Report for the GSM Association” (http://www.gsma.com/publicpolicy/wp-content/uploads/2012/11/gsma-deloitte-impact-mobile-telephony-economic-growth.pdf)
ERIA (Economic Research Institute for ASEAN and East Asia) (2013). “Study on Effective Investment of Power Infrastructure in East Asia through Power Grid Interconnection”, Ichiro Kutani (Ed.), ERIA Research Project Report 2012, No. 23, June, Jakarta.
The Economist (2014). “Redrawing the ASEAN map: how companies are crafting new strategies in South-east Asia” (http://www.bakermckenzie.com/files/Uploads/Documents/Asia%20Pacific/bk_ap_redrawingaseanmap_15.pdf).
Ericsson (2015). “South East Asia and Oceania: Ericsson Mobility Report Appendix”. (http://www.ericsson.com/au/news/2014_sing_mobility_report_254740125_c).
ESCAP (UN Economic and Social Commission for Asia and the Pacific) (2013). “An In-Depth Study of Broadband Infrastructure in the ASEAN Region”. (http://www.unescap.org/resources/depth-study-broadband-infrastructure-asean-region-0).

REFERENCES
191
EU-ASEAN Business Council (2015). “Business Sentiment Survey 2015”. (http://www.eurocham-cambodia.org/uploads/4ec25-eu-asean-business-sentiment-survey-2015.pdf).
Goldman Sachs (2013). “ASEAN’s half a trillion dollar infrastructure opportunity”, Asia Economics Analyst, No. 13/18, 30 May.
IEA (International Energy Association) (2013). “Southeast Asia Energy Outlook”, September. (https://www.iea.org/publications/freepublications/publication/Southeast AsiaEnergyOutlook_WEO2013SpecialReport.pdf).
Ibrahim, Syaiful B. (2014). “ASEAN Power Grids Interconnection Projects for Energy Efficiency and Security of Supply”, presented at Regional Energy Trade Workshop, Asian Development Bank, Manila, 8–9 September. (http://www.carecprogram.org/uploads/events/2014/Regional-Energy-Trade-Workshop/Presentation-Materials/009_104_209_Session3-3.pdf).
Internet Society (2015). “Unleashing the Potential of the Internet for ASEAN Economies”. (http://www.internetsociety.org/doc/unleashing-potential-internet-asean-economies).
JETRO (Japan External Trade Organization) (2015). “FY2014 Survey on the International Operations of Japanese Firms”. (http://www.jetro.go.jp/ext_images/en/news/releases/142a2191f56e68bc/TJ_en_2014japan_overseas.pdf).
Jones, Tegan (2014). “Projects in the boom ASEAN economy”. Project Management Institute, November. (http://www.pmi.org/learning/PM-Network/2014/infrastructure-projects-booming-asean-economy.aspx).
AT Kearney (2015). “Lifting the Barriers to E-Commerce in ASEAN”. (https://www.atkearney.com/consumer-products-retail/ideas-insights/lifting-the-barriers-to-e-commerce-in-asean).
KPMG (2014a). “An overview of infrastructure opportunities in ASEAN”. (https://www.kpmg.com/SG/en/IssuesAndInsights/ArticlesPublications/Documents/Advisory-INFRA-ASEAN-An-overview-of-infrastructure-opportunities-in-ASEAN.pdf).
KPMG (2014b). “Infrastructure opportunities in ASEAN”. (https://www.kpmg.com/SG/en/IssuesAndInsights/ArticlesPublications/Documents/Advisory-INFRA-ASEAN-An-overview-of-infrastructure-opportunities-in-ASEAN.pdf).
KPMG (2015). “MNCs in Southeast Asia: The view of multinationals in ASEAN”. (https://www.kpmg.com/CN/en/IssuesAndInsights/ArticlesPublications/Documents/MNCs-in-Southeast-Asia-The-view-of-multinationals-in-ASEAN-O-201504.pdf)
Kutani, Ichiro and Yanfei Li (2014). Investing in Power Grid Interconnection in East Asia (Jakarta: ERIA). (http://www.eria.org/RPR-FY2013-23.pdf).

ASEAN INVESTMENT REPORT 2015: Infrastructure Investment and Connectivity
192
Li, Y. (2015). “Challenge the Barriers to Power Grid Interconnection in ASEAN and East Asia Countries”, ERIA Frames, Vol. 2 (2), March–April 2015. (http://www.eria.org/ERIA_FRAMES_VOL_II_MAR_APR.pdf).
Li, Y. and Y. Chang (2015). “Infrastructure investments for power trade and transmission in ASEAN + 2: Costs, benefits, long-term contracts and prioritized developments”, Energy Economics, Vol. 51, September, pp. 484–492, http://dx.doi.org/10.1016/j.eneco.2015.08.008.
Lim, A. (2014). “Malaysia confirms its Singapore-Kuala Lumpur high-speed rail stations”, Straits Times. (http://www.straitstimes.com/singapore/transport/malaysia-confirms-its-singapore-kuala-lumpur-high-speed-rail-stations).
McKinsey Global Institute (2013). “Infrastructure productivity: How to save $1 trillion a year” http://www.mckinsey.com/insights/engineering_construction/infrastructure_productivity)
Naudé, W. and M. Matthee. (2007). “The Significance of Transport Costs in Africa”. United Nations University-World Institute for Development Economics Policy Brief No. 5. United Nations University, Helsinki.
Pew Research Center (2015). “Internet Seen as Positive Influence on Education but Negative on Morality in Emerging and Developing Nations” (http://www.pewglobal.org/2015/03/19/internet-seen-as-positive-influence-on-education-but-negative-influence-on-morality-in-emerging-and-developing-nations/).
PwC (2014). “A summary of South East Asian infrastructure spending: Outlook to 2025” (https://www.pwc.com/sg/en/capital-projects-infrastructure/assets/cpi-sea-infrastructure-spend-summary-201405.pdf).
Rattanatay, L. (2007). “Development Impacts of the East-West Economic Corridor (EWEC) on Savannakhet Province of the Lao PDR”. Asian Development Bank, Manila.
Richards, Christie F. J. (2015). “FDI statistics do not capture the full extent of investments in infrastructure”, presented at the Workshop on Statistics on International Transactions in Services at the National Bank of Cambodia, Phnom Penh, 23–27 March.
Rodrigue, J. P. and T. Notteboom. (2009). “The Corporate Geography of Global Terminal Operators”. (http://people.hofstra.edu/jean-paul_rodrigue/downloads/Notteboom-Rodrigue-GTO-JEG.pdf).
Sobie, Brendan (2014). “Analyst viewpoint: Asian airline industry overview”, presentation at CAPA Airline Distribution 2014, Singapore, 25–27 March. (https://www.uatp.com/files/uploads/PDF/AD2014PPT_CAPA.pdf).
Stone, S. (2008). “Asia’s Infrastructure Challenges: Issues of Institutional Capacity”. ADBI Working Paper No. 126. Asian Development Bank Institute, Tokyo.

REFERENCES
193
Stone, Susan, Anna Strutt and Thomas Hertel (2012). “Socio-economic impact of regional transport infrastructure in the Greater Mekong Subregion”, in Bhattacharyay, Biswa Nath, Masahiro Kawai and Rajat M. Nag (Eds.), Infrastructure for Asian Connectivity. (Cheltenham, UK; Northampton, MA, United States: Edward Elgar).
Tenaga (2014). “Tenaga Nasional, Annual Report 2014”.
UBS (2014). “Is ASEAN at an Inflection Point for e-Commerce?”. (http://simontorring.com/wp-content/uploads/UBS-report-2014.pdf).
UNCTAD (2007). Global Players from Emerging Markets: Strengthening enterprise competitiveness through outward investment. (New York and Geneva: United Nations).
UNCTAD (2013a). Information Economy Report 2013: The Cloud Economy and Developing Countries. (New York and Geneva: United Nations).
UNCTAD (2013b). ASEAN-UNCTAD Review of E-Commerce Legislation Harmonization in ASEAN. (New York and Geneva: United Nations).
UNCTAD (2014a). Economic Development in Africa Report 2014: Catalyzing Investment for Transformative Growth in Africa. (New York and Geneva: United Nations).
UNCTAD (2014b). “Regionalisation, TNCs and Regional Value Chains: The Case of ASEAN”. (Research Notes), DIAE, UNCTAD, Geneva.
UNCTAD (2015a). Information Economy Report 2015: Unlocking the Potential of E-Commerce for Developing Countries. (New York and Geneva: United Nations).
UNCTAD (2015b). “ASEAN Infrastructure Investment and Economic Connectivity”. (Research Notes), DIAE, UNCTAD, Geneva.
UNIDO (2015). “Economic zones in the ASEAN: Industrial parks, special economic zones, eco industrial parks, innovation districts as strategies for industrial competitiveness”, UNIDO Country Office in Viet Nam, August. (https://www.unido.org/fileadmin/user_media_upgrade/Resources/Publications/UCO_Viet_Nam_Study_FINAL.pdf).
UOB (2015). “One in four Asian enterprises keen to be part of Myanmar’s economic transformation”, news release, 1 April. (http://uobgroup.com/assets/pdfs/new-release/NR-06042015-a.pdf).
Wee, Kee Hwee (2007). “Outward foreign direct investment by enterprises from Thailand”, Transnational Corporations Journal, Vol. 16, No. 1, April.
Wenbin, Huang, and Andreas Wilkes (2011). “Analysis of China’s overseas investment policies”, CIFOR Working Paper 79, Center for International Forestry Research. (http://www.cifor.org/publications/pdf_files/WPapers/WP-79CIFOR.pdf).
WIR (2008). World Investment Report 2008: Transnational Corporations and the Infrastructure Challenge. (New York and Geneva: United Nations).

ASEAN INVESTMENT REPORT 2015: Infrastructure Investment and Connectivity
194
WIR (2011). World Investment Report 2011: Non-Equity Modes of International Production and Development. (New York and Geneva: United Nations).
WIR (2013). World Investment Report 2013: Global Value Chains: Investment and Trade for Development. (New York and Geneva: United Nations).
WIR (2014). World Investment Report 2014: Investing in the SDGs: An Action Plan. (Geneva and New York: United Nations).
WIR (2015). World Investment Report 2015: Reforming International Investment Governance. (Geneva and New York: United Nations).
Zhai, F. (2008). “Armington Meets Melitz: Introducing Firm Heterogeneity in a Global CGE Model of Trade”. ADBI Discussion Paper 108, Asian Development Bank Institute, Tokyo.

ANNEXES
195
ANNExES


ANNEXES
197
An
nex t
ab
le 1
.1.
FD
I fl
ow
s i
nto
AS
EA
N,
20
00
–20
14
(M
illio
ns
of
do
llars
)
2000
2001
2002
20
03
20
04
20
05
20
06
20
07
20
08
20
09
2010
2011
2012
2013
2014
Bru
nei D
arus
sala
m55
052
610
3632
9820
628
943
426
033
037
162
512
0886
572
556
8
Cam
bod
ia14
914
914
584
131
381
483
867
815
539
783
892
1,55
71,
275
1,72
7
Ind
ones
ia-4
,550
-2,9
7914
5-5
961,
895
8,33
64,
914
6,92
89,
318
4,87
713
,771
19,2
4219
,138
18,4
4422
,276
Lao
PD
R
3424
2520
1728
187
324
228
319
333
467
294
427
913
Mal
aysi
a3,
788
,554
3,20
32,
473
4,62
44,
064
6,07
28,
538
7,24
81,
405
9,15
612
,001
9,40
012
,297
10,7
14
Mya
nmar
208
192
191
291
251
236
428
715
976
963
2,24
92,
058
1,35
42,
621
946
Phi
lipp
ines
2,24
019
51,
542
491
688
1,85
42,
921
2,91
61,
544
1,96
31,
298
1,81
62,
797
3,86
06,
201
Sin
gap
ore
14,7
5217
,302
8,26
216
,532
24,1
0317
,299
36,6
1346
,338
11,1
1525
,036
55,0
3546
,774
60,9
8056
,138
72,0
98
Thai
land
3,35
05,
061
3,33
55,
235
5,86
28,
048
9,46
011
,330
8,53
94,
853
9,11
23,
861
10,6
9913
,000
11,5
38
Vie
t N
am1,
289
1,30
01,
200
1,45
01,
610
1,95
42,
400
6,70
09,
579
7,60
08,
000
7,51
98,
368
8,90
09,
200
Tota
l21
,809
22,3
2619
,085
29,2
7839
,386
42,4
8963
,912
84,9
1749
,693
47,9
2710
0,36
095
,838
115,
453
117,
687
136,
181
Sou
rce:
AS
EA
N S
ecre
taria
t, A
SE
AN
FD
I Dat
abas
e (a
cces
sed
1 J
uly
2015
).

ASEAN INVESTMENT REPORT 2015: Infrastructure Investment and Connectivity
198
An
nex t
ab
le 1
.2.
FD
I fl
ow
s t
o A
SE
AN
, b
y i
nd
ustr
y a
nd
sele
cte
d e
con
om
ies/r
egio
ns,
20
13
–20
14
(M
illio
ns
of
do
llars
)
Jap
an
Un
ited
S
tate
sE
uro
pean
U
nio
n
Em
erg
ing M
ark
ets
of
East
Asi
a
India
Aust
ralia
AS
EA
NTo
tal FD
I in
AS
EA
N2
01
3K
ore
a,
Rep
ub
lic
of
Hon
g
Kon
g
(Ch
ina)
Taiw
an
P
rovi
nce
of
Ch
ina
Ch
ina
Su
b-t
ota
l
Agr
icul
ture
, for
estr
y, a
nd fi
shin
g
62.2
55.5
472.
637
.01.
41.
088
.212
7.7
4.6
3.1
1,59
9.3
2,34
6.0
Min
ing
and
qua
rryi
ng(6
61.3
)98
2.1
1,58
2.0
25.4
57.8
.955
8.1
642.
3(1
.6)
67.1
479.
38,
042.
2
Man
ufac
turin
g12
,453
.526
9.4
3,56
1.3
2,15
3.0
1,63
5.9
536.
81,
575.
859
01.6
116.
362
0.0
5,80
7.2
33,3
42.1
Ele
ctric
ity, g
as, s
team
and
air
cond
ition
ing
sup
ply
211.
125
.122
7.9
166.
335
.122
.987
.131
1.5
.14.
924
8.1
1,15
6.8
Wat
er s
upp
ly; s
ewer
age
and
was
te
man
agem
ent
420.
35.
310
1.5
4.2
16.5
.6.7
22.0
0.0
.125
.160
2.2
Con
stru
ctio
n40
.916
.415
9.2
68.9
466.
75.
021
.356
1.9
(1.4
)14
5.1
(19.
6)82
5.0
Who
lesa
le a
nd r
etai
l tra
de;
rep
air
of
mot
or v
ehic
les
and
cyc
les
1,94
6.7
279.
85,
661.
159
8.6
(545
.3)
93.4
1,42
4.2
1571
.024
7.8
65.2
655.
013
,946
.6
Tran
spor
tatio
n an
d s
tora
ge30
1.1
163.
5(9
06.7
)(1
15.2
)10
.915
0.8
(145
.1)
(98.
5)24
.810
5.0
271.
12,
802.
5
Acc
omod
atio
n an
d fo
od s
ervi
ce a
ctiv
ities
32.9
107.
420
.135
.1(1
24.7
)3.
415
.8(7
0.4)
.63.
511
4.5
260.
4
Info
rmat
ion
and
com
mun
icat
ion
102.
12.
237
8.4
2.2
(10.
1).6
(1.8
)(9
.1)
(0.0
)12
.938
9.0
2,19
6.5
Fina
ncia
l and
Insu
ranc
e ac
tiviti
es5,
340.
0(2
62.8
)6,
300.
429
7.6
2,23
1.1
327.
223
9.9
3,09
5.8
323.
92,
095.
12,
935.
428
,263
.7
Rea
l est
ate
activ
ities
388.
230
0.6
701.
478
.770
3.5
34.8
1,57
4.5
2,39
1.4
1.0
(9.6
)4,
804.
09,
821.
5
Pro
fess
iona
l, sc
ient
ific
and
tec
hnic
al
activ
ities
123.
922
7.1
22.3
38.9
7.1
5.5
9.7
61.3
(1.2
)4.
676
.271
1.8
Ad
min
istr
ativ
e an
d s
upp
ort
serv
ice
activ
ities
60.1
53.7
65.5
1.4
0.0
.62.
64.
70.
0(4
.2)
104.
529
4.9
Ed
ucat
ion
13.3
.6.3
9.6
1.7
1.3
5.2
17.8
(5.2
).4
14.4
66.5
Hum
an h
ealth
and
soc
ial w
ork
activ
ities
53.1
27.9
1.7
7.4
1.2
4.0
3.9
16.5
0.0
9.6
15.5
127.
7
Art
s, e
nter
tain
men
t an
d r
ecre
atio
n11
.11.
012
.14.
214
.9.6
2.2
21.9
.3.1
(.2)
218.
8
Oth
er s
ervi
ces
830.
72,
649.
63,
598.
522
5.4
516.
510
5.6
523.
41,
370.
818
5.9
273.
558
9.4
9,01
0.3
Oth
ers
3,22
5.0
Mem
oran
dum
:
Lao’
s d
ata
104.
642
6.7
Dat
a su
pp
ress
ed fo
r co
nfid
entia
l rea
son
36.0
8.8
296.
213
.521
0.0
54.9
792.
66.
443
4.8
92.9
1,18
6.8
Tota
l2
1,7
66
.14
,91
3.3
22
,25
5.7
3,6
52
.45
,23
0.2
1,3
49
.96
,77
8.5
15
,946.5
1,3
30.7
3,4
89.2
19,3
99.6
117,6
87.1

ANNEXES
199
An
nex t
ab
le 1
.2.
FD
I fl
ow
s t
o A
SE
AN
, b
y i
nd
ustr
y a
nd
sele
cte
d e
con
om
ies/r
egio
ns,
20
13
–20
14
(M
illio
ns
of
do
llars
) (c
on
clu
de
d)
Jap
an
Unit
ed
S
tate
sE
uro
pean
U
nio
n
Em
erg
ing M
ark
ets
of
East
Asi
a
India
Aust
ralia
AS
EA
NTo
tal FD
I in
AS
EA
N2
01
4K
ore
a,
Rep
ub
lic
of
Hon
g
Kon
g
(Ch
ina)
Taiw
an
P
rovi
nce o
f C
hin
aC
hin
aS
ub
-tota
l
Agr
icul
ture
, for
estr
y, a
nd fi
shin
g
77.7
(27.
1)33
2.6
33.8
19.3
3.1
51.5
107.
74.
710
.13,
928.
94,
492.
6
Min
ing
and
qua
rryi
ng38
8.7
(1,2
73.9
)2,
301.
316
.5(8
0.6)
2.5
1,12
0.0
1,05
8.5
(.1)
137.
41,
213.
47,
295.
1
Man
ufac
turin
g6,
799.
4(8
22.4
)4,
204.
42,
570.
31,
408.
671
8.4
313.
85,
011.
026
.1(2
16.5
)6,
585.
922
,215
.4
Ele
ctric
ity, g
as, s
team
and
air
cond
ition
ing
sup
ply
18.7
.924
3.6
35.5
(18.
0)4.
938
7.5
409.
9.2
.7(5
3.9)
460.
4
Wat
er s
upp
ly; s
ewer
age
and
was
te
man
agem
ent
4.4
1.3
84.6
10.1
1.0
3.4
2.5
17.0
.1.2
8.9
98.2
Con
stru
ctio
n13
1.8
15.2
100.
429
4.6
134.
523
.516
9.6
622.
2(5
.0)
16.4
182.
81,
187.
9
Who
lesa
le a
nd r
etai
l tra
de;
rep
air
of
mot
or v
ehic
les
and
cyc
les
1,99
2.9
6,21
9.1
1,37
2.0
333.
815
4.8
(33.
7)1,
853.
32,
308.
275
.329
5.2
1,07
1.7
17,0
55.2
Tran
spor
tatio
n an
d s
tora
ge32
6.2
(17.
3)49
5.0
5.1
12.7
10.7
57.9
86.4
110.
130
6.2
418.
42,
612.
8
Acc
omod
atio
n an
d fo
od s
ervi
ce a
ctiv
ities
23.9
(57.
2)25
.910
5.9
59.9
13.9
22.4
202.
01.
21.
4(3
5.8)
158.
0
Info
rmat
ion
and
com
mun
icat
ion
94.0
28.5
491.
4(6
.4)
1,00
1.7
1.7
(5.6
)99
1.4
(5.2
)(1
37.1
)43
5.7
2546
.9
Fina
ncia
l and
Insu
ranc
e ac
tiviti
es1,
843.
75,
243.
813
,900
.740
5.8
5,09
6.5
1,71
2.2
1,90
8.9
9,12
3.3
261.
72,
442.
53,
485.
043
,052
.2
Rea
l est
ate
activ
ities
457.
832
2.2
540.
142
3.5
1,04
2.7
93.2
2,00
0.7
3,56
0.1
3.7
140.
24,
567.
510
,040
.0
Pro
fess
iona
l, sc
ient
ific
and
tec
hnic
al
activ
ities
10.2
338.
624
4.6
46.2
(25.
5)6.
721
.649
.01.
3(2
3.6)
124.
71,
048.
3
Ad
min
istr
ativ
e an
d s
upp
ort
serv
ice
activ
ities
34.8
41.7
(13.
6)7.
27.
11.
5.4
16.2
.1.4
65.8
216.
7
Ed
ucat
ion
4.1
.53.
011
.64.
81.
8.7
19.0
(8.2
).2
8.8
61.6
Hum
an h
ealth
and
soc
ial w
ork
activ
ities
22.0
10.6
10.8
64.3
24.5
9.9
4.0
102.
8.3
8.2
39.9
210.
5
Art
s, e
nter
tain
men
t an
d r
ecre
atio
n(2
.9)
(.3)
(9.8
)(1
2.3)
(5.3
)(2
.0)
(.8)
(20.
4)(.1
)(.2
)(5
.1)
(47.
4)
Oth
er s
ervi
ces
998.
51,
839.
44,
736.
410
9.6
162.
611
5.8
849.
012
37.1
(56.
3)2,
694.
41,
572.
619
,311
.3
Oth
ers
4,16
5.3
Mem
oran
dum
:
Dat
a su
pp
ress
ed fo
r co
nfid
entia
l rea
son
155.
21,
178.
520
5.2
13.5
503.
612
6.5
111.
975
5.6
409.
727
.376
2.3
Tota
l1
3,3
81
.11
3,0
42
.32
9,2
68
.54
,46
8.9
9,5
04
.92
,81
4.1
8,8
69
.42
5,6
57.3
,819.5
5,7
03.4
24,3
77.4
136,1
81.3
Sou
rce:
AS
EA
N S
ecre
taria
t, A
SE
AN
FD
I Dat
abas
e (a
cces
sed
1 J
uly
2015
).
Not
e: D
ata
for
cros
s ta
bul
atio
n fo
r 20
13 d
o no
t in
clud
e M
yanm
ar a
nd 2
014
do
not
incl
ude
Phi
lipp
ine’
s d
ata.

ASEAN INVESTMENT REPORT 2015: Infrastructure Investment and Connectivity
200
An
ne
x t
ab
le 1
.3.
AS
EA
N c
om
pan
ies c
on
tin
ue
d t
o m
ake
cro
ss-b
ord
er
me
ga d
eals
exce
ed
ing
$2
50
mil
lio
n
in 2
01
3−
20
14 (
Mill
ion
s o
f d
olla
rs)
Year
Ult
imate
acq
uir
ing c
om
pan
yU
ltim
ate
acq
uir
ing
nati
on
Targ
et
com
pan
yTa
rget
nati
on
Targ
et
indust
ryValu
eS
hare
s acquir
ed
2013
Inve
stor
Gro
upTh
aila
ndP
ing
An
Insu
ranc
eC
hina
Life
insu
ranc
e9,
386
15.6
2013
Thai
Bev
erag
eTh
aila
ndFr
aser
& N
eave
S
inga
por
eB
ottle
d a
nd c
anne
d s
oft
drin
ks6,
896
62
2013
CP
ALL
PC
LTh
aila
ndS
iam
Mak
ro
Thai
land
Gro
cery
sto
res
4,22
064
.4
2013
Sap
uraK
enca
na P
etro
leum
M
alay
sia
Sea
Dril
l Ltd
- A
sian
Ten
der
Rig
s D
ivis
ion
Mal
aysi
aD
rillin
g oi
l and
gas
wel
ls2,
913
100
2013
CP
ALL
Th
aila
ndS
iam
Mak
ro
Thai
land
Gro
cery
sto
res
1,91
231
.7
2013
Ind
ones
ia R
epub
licIn
don
esia
Con
ocoP
hilli
ps
Alg
eria
A
lger
iaC
rud
e p
etro
leum
and
nat
ural
gas
1,75
310
0
2013
Sin
gap
ore
Sin
gap
ore
Gra
nd W
aile
a R
esor
t H
otel
(Haw
aii)
Uni
ted
Sta
tes
Hot
els
and
mot
els
1,50
210
0
2013
Inve
stor
Gro
upM
alay
sia
Sp
ire H
ealth
care
Ltd
- H
osp
itals
Uni
ted
Kin
gdom
Gen
eral
med
ical
and
sur
gica
l hos
pita
ls1,
111
100
2013
Gal
lant
Ven
ture
S
inga
por
eP
T In
dom
obil
Suk
ses
Inte
rnas
iona
l In
don
esia
Mot
or v
ehic
les
and
pas
seng
er c
ar b
odie
s 8
0952
.4
2013
Fort
une
RE
ITS
inga
por
eTi
n S
hui W
ai D
evel
opm
ent
Hon
g K
ong,
Chi
naO
per
ator
s of
non
resi
den
tial b
uild
ings
754
100
2013
CT
Cor
pIn
don
esia
Car
refo
ur In
don
esia
In
don
esia
Gro
cery
sto
res
673
60
2013
Gal
lant
Ven
ture
S
inga
por
eP
T In
dom
obil
Suk
ses
Inte
rnas
iona
l In
don
esia
Mot
or v
ehic
les
and
pas
seng
er c
ar b
odie
s 4
4929
.6
2013
Lip
po
Gro
upS
inga
por
eU
S B
ank
Tow
er (L
os A
ngel
es, C
A)
Uni
ted
Sta
tes
Op
erat
ors
of n
onre
sid
entia
l bui
ldin
gs 3
6810
0
2013
Inte
rnat
iona
l Sp
ort
Cap
ital
Ind
ones
iaFC
Inte
rnaz
iona
le M
ilano
Ita
lyP
rofe
ssio
nal s
por
ts c
lub
s an
d p
rom
oter
s 3
3870
2013
Ind
ofoo
d C
BP
Suk
ses
Mak
mur
Ind
ones
iaC
hina
Min
zhon
g Fo
od C
orp
C
hina
Froz
en fr
uits
, fru
it ju
ices
and
veg
etab
les
320
55.5
2013
Sin
gap
ore
Tele
com
mun
icat
ions
Sin
gap
ore
Bha
rti T
elec
om
Ind
iaTe
lep
hone
and
tel
egra
ph
app
arat
us 3
033.
6
2013
Inve
stor
Gro
upIn
don
esia
Silv
erlin
k R
esor
ts
Sin
gap
ore
Hot
els
and
mot
els
300
100
2013
Sin
gap
ore
Sin
gap
ore
Mat
ahar
i Put
ra P
rima
Ind
ones
iaD
epar
tmen
t st
ores
296
26.1
2013
Tuan
Sin
g H
old
ings
S
inga
por
eR
obin
son
Poi
ntM
aurit
ius
Inve
stm
ent
offic
es, n
ec 2
7210
0
2013
Wilm
ar In
tern
atio
nal
Sin
gap
ore
Cos
umar
M
oroc
coC
ane
suga
r, ex
cep
t re
finin
g 2
7027
.5
2013
Mal
aysi
aM
alay
sia
Aci
bad
em S
aglik
ve
Hay
at S
igor
ta
Turk
eyA
ccid
enta
l and
hea
lth in
sura
nce
252
90
2014
Sin
gap
ore
Sin
gap
ore
AS
Wat
son
Hol
din
gsH
ong
Kon
g, C
hina
Ret
ail s
tore
s, n
ec5,
672
25
2014
Ove
rsea
s-C
hine
se B
anki
ng C
orp
Sin
gap
ore
Win
g H
ang
Ban
k H
ong
Kon
g, C
hina
Ban
ks4,
847
97.8
2014
St
Jam
es H
old
ings
Sin
gap
ore
Per
enni
al R
eal E
stat
e H
old
ings
C
hina
Land
and
rea
l est
ate
2,78
210
0
2014
Fras
ers
Cen
trep
oint
Sin
gap
ore
Aus
tral
and
Pro
per
ty
Aus
tral
iaLa
nd a
nd r
eal e
stat
e2,
406
98.4
2014
Nut
riAsi
aP
hilip
pin
esD
el M
onte
Foo
ds
Uni
ted
Sta
tes
Dog
, cat
and
pet
food
1,67
510
0
2014
Pet
rona
sM
alay
sia
Talis
man
Ene
rgy
Inc-
Mon
tney
Ass
ets
Can
ada
Cru
de
pet
role
um a
nd n
atur
al g
as1,
433
100
2014
Sin
gap
ore
Sin
gap
ore
Blo
cks
(3),
Tanz
ania
Uni
ted
Rep
ublic
of
Tanz
ania
Cru
de
pet
role
um a
nd n
atur
al g
as1,
293
20
2014
Glo
bal
Log
istic
Pro
per
ties
Sin
gap
ore
BR
Pro
per
ties
- P
ortf
olio
of L
ogis
tic A
sset
sB
razi
lG
ener
al w
areh
ousi
ng a
nd s
tora
ge1,
178
100
2014
Rai
nbow
Lig
ht
Sin
gap
ore
Nip
pon
Pai
ntJa
pan
Pai
nts,
var
nish
es, l
acq
uer
pro
duc
ts1,
012
18.7
2014
Inve
stor
Gro
upTh
aila
ndH
ess
Thai
land
Hol
din
gs II
Th
aila
ndP
etro
leum
ref
inin
g1,
000
100
2014
Sap
uraK
enca
na P
etro
leum
Mal
aysi
aN
ewfie
ld M
alay
sia
Hol
din
gsM
alay
sia
Cru
de
pet
role
um a
nd n
atur
al g
as 8
9610
0

ANNEXES
201
Year
Ult
imate
acq
uir
ing c
om
pan
yU
ltim
ate
acq
uir
ing
nati
on
Targ
et
com
pan
yTa
rget
nati
on
Targ
et
indust
ryValu
eS
hare
s acquir
ed
2014
Inve
stor
Gro
upIn
don
esia
Axi
s Te
leko
m In
don
esia
Ind
ones
iaR
adio
tele
pho
ne c
omm
unic
atio
ns 8
6510
0
2014
RG
E
Ind
ones
iaS
ater
i Hol
din
gs L
td -
Vis
cose
fib
er a
sset
sC
hina
Cel
lulo
sic
man
mad
e fib
ers
863
100
2014
Alli
ance
Glo
bal
Gro
upP
hilip
pin
esW
hyte
& M
acka
yU
nite
d K
ingd
omW
ines
, bra
ndy
and
bra
ndy
spiri
ts 7
2510
0
2014
Inve
stor
Gro
upS
inga
por
eB
eijin
g X
iaoj
u Te
chno
logy
Chi
naP
rep
acka
ged
sof
twar
e 7
00..
2014
Inve
stor
Gro
upS
inga
por
eP
acte
ra T
echn
olog
y In
tern
atio
nal
Chi
naC
omp
uter
faci
litie
s m
anag
emen
t se
rvic
es 6
5810
0
2014
JG S
umm
it H
old
ings
P
hilip
pin
esN
Z S
nack
Foo
d H
old
ings
N
ew Z
eala
ndC
ooki
es a
nd c
rack
ers
608
100
2014
Rai
nbow
Lig
ht L
tdS
inga
por
eN
ipp
on P
aint
Ja
pan
Pai
nts,
var
nish
es, l
acq
uer
pro
duc
ts 5
9114
.8
2014
Sol
usi T
unas
Pra
tam
a In
don
esia
XL
Axi
ata
Tbk
PT
- Te
leco
ms
Tow
ers
(700
0)In
don
esia
Rad
iote
lep
hone
com
mun
icat
ions
459
100
2014
Ele
ctric
ity G
ener
atin
g Th
aila
ndM
asin
-AE
S
Sin
gap
ore
Ele
ctric
ser
vice
s 4
5345
2014
Sin
gap
ore
Sin
gap
ore
Em
per
ador
Phi
lipp
ines
Dis
tille
d a
nd b
lend
ed li
quo
rs 3
9110
.7
2014
Mal
aysi
aM
alay
sia
Ista
nbul
Sab
iha
Gok
cen
Ulu
slar
aras
i Hav
alim
ani Y
atiri
m
Yap
im v
e Is
letm
e A
STu
rkey
Airp
orts
and
airp
ort
term
inal
ser
vice
s 3
8840
2014
Pea
k H
otel
s &
Res
orts
Gro
upS
inga
por
eS
ilver
link
Res
orts
S
inga
por
eH
otel
s an
d m
otel
s 3
5810
0
2014
Glo
bal
Log
istic
Pro
per
ties
Sin
gap
ore
Toky
o 2
Logi
stic
Tok
utei
Mok
utek
i Kai
sha
- G
LP T
okyo
II
Jap
anO
per
ator
s of
non
resi
den
tial b
uild
ings
353
100
2014
Sin
gap
ore
Sin
gap
ore
Ron
esan
s G
ayrim
enku
l Yat
irim
Turk
eyR
eal e
stat
e in
vest
men
t tr
usts
317
21.4
2014
LMIR
Tru
stS
inga
por
eLi
pp
o M
all K
eman
gIn
don
esia
Op
erat
ors
of n
onre
sid
entia
l bui
ldin
gs 3
0610
0
2014
Inve
stor
Gro
upIn
don
esia
Am
anR
esor
ts In
tern
atio
nal
Sin
gap
ore
Hot
els
and
mot
els
300
100
2014
IRE
IT G
lob
alS
inga
por
eD
euts
che
Tele
kom
AG
- O
ffice
Bui
ldin
gs P
ortf
olio
(5)
Ger
man
yO
per
ator
s of
non
resi
den
tial b
uild
ings
299
100
2014
Mal
aysi
aM
alay
sia
Intu
dig
ital
Uni
ted
Kin
gdom
Op
erat
ors
of n
onre
sid
entia
l bui
ldin
gs 2
9480
2014
Mal
aysi
aM
alay
sia
Sab
iha
Gok
cen
Ulu
slar
aras
i Hav
aala
niTu
rkey
Airp
orts
and
airp
ort
term
inal
ser
vice
s 2
9040
2014
Sin
gap
ore
Sin
gap
ore
Mid
City
Pla
ce In
vest
men
ts
Uni
ted
Kin
gdom
Rea
l est
ate
inve
stm
ent
trus
ts 2
8550
2014
Hon
g Le
ong
Gro
upS
inga
por
e22
6 W
est
Fift
y-S
econ
d S
tree
t LL
C -
Nov
otel
New
Yor
k Ti
mes
Sq
uare
Uni
ted
Sta
tes
Hot
els
and
mot
els
274
100
2014
Hon
g Le
ong
Gro
up
Sin
gap
ore
Nov
otel
New
Yor
k Ti
mes
Sq
uare
, New
Yor
k, N
ew Y
ork
Uni
ted
Sta
tes
Hot
els
and
mot
els
274
100
2014
Inve
stor
Gro
upS
inga
por
eS
even
Ene
rgy
Inte
rnat
iona
lU
nite
d K
ingd
omO
il an
d g
as fi
eld
exp
lora
tion
serv
ices
255
26
2014
Sin
gap
ore
Tele
com
mun
icat
ions
Sin
gap
ore
Ad
coni
on M
edia
U
nite
d S
tate
sIn
form
atio
n re
trie
val s
ervi
ces
255
100
Sou
rce:
UN
CTA
D, U
NC
TAD
M&
As
Dat
abas
e (a
cces
sed
15
July
201
5).
An
ne
x t
ab
le 1
.3.
AS
EA
N c
om
pan
ies c
on
tin
ue
d t
o m
ake
cro
ss-b
ord
er
me
ga d
eals
exce
ed
ing
$2
50
mil
lio
n
in 2
01
3−
20
14 (
Mill
ion
s o
f d
olla
rs)
(co
nc
lud
ed
)

ASEAN INVESTMENT REPORT 2015: Infrastructure Investment and Connectivity
202
Annex table 2.1. Many banks and financial institutions provide loan facilities for infrastructure projects in ASEAN, 2014 (selected cases) (Millions of dollars)
Banks/ Finance Institution Project/ Company Location Amount
Mitsubishi UFJ Financial (Japan) Sarulla Geothermal Indonesia 54.7Nam Ngiep 1 Power Lao PDR 23.9Trans Thai-Malaysia Malaysia 47.1Donggi Senoro LNG PT Indonesia 175.5Singapore LNG Singapore 172.0Gulf Electric Thailand 560.8
ANZ (Australia) Burgos Wind Power Plant Philippines 37.5SMBC (Japan) Sarulla Geothermal Indonesia 54.7
Nam Ngiep 1 Power Lao PDR 23.9PT Bajradaya Sentranusa Indonesia 26.2Petrofac FPSO 003 Pte Thailand 9.3Petrofac MOPU 005 Pte Malaysia 35.7Bowin Clean Energy Thailand 35.1Donggi Senoro LNG PT Indonesia 175.5Houay Ho Power Lao PDR 84.0Pan Asia Majestic Eagle Myanmar 17.0
NAB (Australia) Sarulla Geothermal,Sumatra Indonesia 54.7KDB (Republic of Korea) PT Bajradaya Sentranusa Indonesia 26.2
PAU Fertilizer Plant Indonesia 103.8Mizuho Financial (Japan) Sarulla Geothermal Indonesia 54.7
Nam Ngiep 1 Power Lao PDR 23.9Energy Equity Epic [Sengkang] Indonesia 41.7Bang Poo SPP Thailand 134.5PT Rajamandala Electric Power Indonesia 110.0Trans Thai-Malaysia Malaysia 47.1Bowin Clean Energy Thailand 35.1Donggi Senoro LNG PT Indonesia 128.0Singapore LNG Singapore 172.0Gulf Electric PCL Thailand 166.7
HSBC (United Kingdom) Batutua Tembaga Raya PT Indonesia 41.3MEASAT 3b Satellite Malaysia 28.2Trans Thai-Malaysia Malaysia 47.1Petrofac FPSO 003 Pte Thailand 9.3Petrofac MOPU 005 Pte Malaysia 35.7
OCBC (Singapore) Well Harvest Winning Alumina Indonesia 190.0MEASAT 3b Satellite Malaysia 28.2PAU Fertilizer Plant Indonesia 103.8Pan Asia Majestic Eagle Myanmar 17.0Singapore LNG Singapore 172.0
DBS (Singapore) Well Harvest Winning Alumina Indonesia 190.0Pan Asia Majestic Eagle Myanmar 17.0Singapore LNG Singapore 172.0Everet LNG Singapore 53.6
UOB (Singapore) PAU Fertilizer Plant Indonesia 103.8BNP Paribas (France) Batutua Tembaga Raya PT Indonesia 41.3ING (Netherlands) Sarulla Geothermal Indonesia 54.7
Pan Asia Majestic Eagle Myanmar 17.0Burgos Wind Power Plant Philippines 37.5
SG (France) Sarulla Geothermal Indonesia 54.7Batutua Tembaga Raya PT Indonesia 41.3PT Bajradaya Sentranusa Indonesia 26.2Petrofac FPSO 003 Pte Thailand 9.3Petrofac MOPU 005 Pte Malaysia 35.7

ANNEXES
203
Banks/ Finance Institution Project/ Company Location Amount
Banco De Oro Unibank (Philippines) Pagbilao Power Plant Philippines 253.3GMR-Megawide Cebu Airport Philippines 521.0Burgos Wind Power Plant Philippines 33.5
Kasikornbank (Thailand) Nam Ngiep 1 Power Lao PDR 107.7Serm Sang Palang Ngan Thailand 83.5Lopburi Solar Thailand 8.7Gulf Electric PCL Thailand 394.1
Bangkok Bank (Thailand) Nam Ngiep 1 Power Lao PDR 107.7Bang Poo SPP Thailand 134.5Bowin Clean Energy Thailand 35.1Gulf Electric PCL Thailand 261.7
Siam Commercial Bank (Thailand) Nam Ngiep 1 Power Lao PDR 107.7Gulf Electric PCL Thailand 394.1
Standard Chartered (United Kingdom) Energy Equity Epic Indonesia 41.7MEASAT 3b Satellite Malaysia 28.2Pan Asia Majestic Eagle Myanmar 17.0
Citibank (United States) Singapore LNG Singapore 172.0KfW IPEX-Bank (Germany) First NatGas Power Philippines 265.0DZ Bank (New Zealand) Burgos Wind Power Plant Philippines 37.5Bank of Philippine Islands Pagbilao Power Plant Philippines 253.3
SaCaSol Philippines 11.5LH Financial (Thailand) Gulf Electric PCL Thailand 261.7Natixis (France) Energy Equity Epic Indonesia 41.7
MEASAT 3b Satellite Malaysia 28.2PT Bajradaya Sentranusa Indonesia 26.2Petrofac FPSO 003 Pte Thailand 9.3Petrofac MOPU 005 Pte Malaysia 35.7
Metropolitan Bank & Trust (Philippines) Pagbilao Power Plant Philippines 253.3CIMB (Malaysia) Gulf Electric PCL Thailand 166.7Maybank (Malaysia) MEASAT 3b Satellite Malaysia 28.2
PT Bajradaya Sentranusa Indonesia 26.2Burgos Wind Power Plant Philippines 37.5Trans Thai-Malaysia Malaysia 47.1
NongHyup Financial (Republic of Korea) Donggi Senoro LNG PT Indonesia 47.5Korea Exchange Bank (Republic of Korea) Donggi Senoro LNG PT Indonesia 47.5TMB Bank (Thailand) Lopburi Solar Thailand 8.7
Bowin Clean Energy Thailand 35.1RHB (Malaysia) MEASAT 3b Satellite Malaysia 28.2Saigon-Hanoi Bank (Viet Nam) San Hydropower Viet Nam 23.0Indonesia Infrastructure Finance (Indonesia) PT Bajradaya Sentranusa Indonesia 17.9Land Bank of the Philippines Burgos Wind Power Plant Philippines 33.5Philippine National Bank Burgos Wind Power Plant Philippines 33.5Security Bank & Trust (Philippines) Burgos Wind Power Plant Philippines 33.5Total loans by banks and financial institutions for infrastructure projects in ASEAN in 2014 8,697.0
Source: Thomson Reuters, based on Project Finance International.
Annex table 2.1. Many banks and financial institutions provide loan facilities for infrastructure projects in ASEAN, 2014 (selected cases) (Millions of dollars) (concluded)

ASEAN INVESTMENT REPORT 2015: Infrastructure Investment and Connectivity
204
Countr
yS
ecto
rN
am
e o
f p
roje
ct
Desc
rip
tion
Subse
ctor
Cost
est
imate
s ($
mill
ion)
Just
ific
ati
on/a
ddit
ional
info
rmati
on
Cam
bod
iaTr
ansp
ort
Sih
anou
kvill
e P
ort
Acc
ess
Roa
d
Imp
rove
men
ts
The
pro
ject
will
imp
rove
the
fina
l 9.5
kilo
met
ers
(km
) (ap
pro
xim
atel
y)
of N
R4
lead
ing
to t
he p
ort
of S
ihan
oukv
ille.
Thi
s m
ay b
e in
clud
ed in
th
e S
ihan
oukv
ille
Por
t S
pec
ial E
cono
mic
Zon
e P
roje
ct fi
nanc
ed b
y th
e Ja
pan
Inte
rnat
iona
l Coo
per
atio
n A
genc
y.
Roa
d40
.0G
reat
er M
ekon
g S
ubre
gion
p
roje
ct.
Reg
iona
l Inv
estm
ent
Imp
lem
enta
tion
Pla
n (2
014-
2018
)
Cam
bod
iaTr
ansp
ort
Dee
pen
ing
Con
nect
ivity
of G
MS
S
outh
ern
Eco
nom
ic
Cor
ridor
The
maj
or o
bje
ctiv
es o
f the
pro
ject
are
to
upgr
ade
a co
nnec
ting
road
se
ctio
n in
Cam
bod
ia fr
om B
atta
mb
ang
to S
iem
Rea
p, a
nd t
o im
pro
ve
the
cros
s-b
ord
er fa
cilit
y (C
BF)
at
Pai
lin. T
he p
roje
ct w
ill r
ehab
ilita
te a
75
km
roa
d s
ectio
n b
etw
een
Bat
tam
ban
g an
d S
iem
Rea
p, c
reat
ing
a st
rong
er li
nk b
etw
een
Pai
lin a
nd S
iem
Rea
p t
o m
eet
tran
spor
t d
eman
d. I
t w
ill a
lso
reha
bili
tate
the
exi
stin
g sm
all C
BF
in P
ailin
, brin
ging
it u
p t
o th
e st
and
ard
of t
he G
reat
er M
ekon
g S
ubre
gion
(GM
S) C
ross
-Bor
der
Tr
ansp
ort
Agr
eem
ent
(CB
TA).
The
pro
ject
will
dee
pen
sub
regi
onal
co
nnec
tivity
in t
he S
outh
ern
Eco
nom
ic C
orrid
or a
mon
g C
amb
odia
, Th
aila
nd, a
nd V
iet
Nam
. Th
e d
esig
n w
ill b
e co
mp
lete
d in
201
5 w
ith t
he fe
asib
ility
stu
dy
final
re
por
t.
Roa
d12
0.0
Gre
ater
Mek
ong
Sub
regi
on
pro
ject
. R
egio
nal I
nves
tmen
t Im
ple
men
tatio
n P
lan
(201
4-20
18)
Cam
bod
iaTr
ansp
ort
Phn
om P
enh–
Sih
anou
kvill
e H
ighw
ay C
orrid
or
Imp
rove
men
ts
The
pro
pos
ed 2
09 k
m e
xpre
ssw
ay p
roje
ct w
ill fo
llow
a n
ew a
lignm
ent
bet
wee
n ro
utes
NR
4 an
d N
R3,
sta
rtin
g al
ong
NR
4, a
nd in
gen
eral
fo
llow
ing
a co
rrid
or t
o th
e w
est
of N
R4.
The
pre
limin
ary
scop
e of
the
p
roje
ct is
a b
uild
-op
erat
e-tr
ansf
er m
odel
with
a 5
0-ye
ar c
once
ssio
n p
erio
d. W
hen
com
ple
ted
, the
hig
hway
will
be
the
first
con
trol
led
-ac
cess
in C
amb
odia
, and
pro
vid
e a
high
-cap
acity
roa
d li
nk t
o th
e p
ort
of S
ihan
oukv
ille
and
to
the
GM
S S
outh
ern
Coa
stal
Cor
ridor
.
Roa
d 1
’000
.0
Gre
ater
Mek
ong
Sub
regi
on
pro
ject
. R
egio
nal I
nves
tmen
t Im
ple
men
tatio
n P
lan
(201
4-20
18).
A fe
asib
ility
stu
dy
is b
eing
un
der
take
n b
y an
inte
rnat
iona
l d
evel
oper
.
Cam
bod
iaTr
ansp
ort
Link
Roa
d b
etw
een
NR
5 an
d N
R6
near
K
amp
ong
Tral
ach
nort
h of
Phn
om P
enh
The
pro
pos
ed li
nk w
ill fa
cilit
ate
traf
fic m
ovem
ent
bet
wee
n th
e m
ajor
hi
ghw
ays
nort
h of
Phn
om P
enh,
and
red
uce
traf
fic c
onge
stio
n w
ithin
P
hnom
Pen
h.
Roa
d65
.0G
reat
er M
ekon
g S
ubre
gion
p
roje
ct.
Reg
iona
l Inv
estm
ent
Imp
lem
enta
tion
Pla
n (2
014-
2018
)
Cam
bod
iaTr
ansp
ort
Con
stru
ctio
n of
P
oip
et (C
amb
odia
)–K
long
Loe
uk
(Tha
iland
) Rai
lway
B
ridge
The
pro
pos
ed b
ridge
will
rep
lace
an
exis
ting
unse
rvic
eab
le r
ail b
ridge
at
the
Poi
pet
–Ara
nyap
rath
et b
ord
er-c
ross
ing
poi
nt b
etw
een
Cam
bod
ia
and
Tha
iland
.
Rai
l0.
5G
reat
er M
ekon
g S
ubre
gion
p
roje
ct.
Reg
iona
l Inv
estm
ent
Imp
lem
enta
tion
Pla
n (2
014-
2018
).
A g
roun
d b
reak
ing
cere
mon
y fo
r th
e co
nstr
uctio
n of
the
brid
ge t
ook
pla
ce in
mid
-201
4.
Lao
PD
RTr
ansp
ort
Vang
Tao
Bor
der
-C
ross
ing
Poi
ntTh
e fa
cilit
ies
are
loca
ted
at
the
Lao
PD
R–T
haila
nd b
ord
er-c
ross
ing
poi
nts
at V
ang
Tao
and
Cho
ng M
ek, o
n N
R16
. The
exi
stin
g b
ord
er-
cros
sing
faci
litie
s d
o no
t m
eet
the
imp
lem
enta
tion
req
uire
men
ts o
f the
G
MS
CB
TA.
Oth
er
Infr
as-
truc
ture
15.0
Gre
ater
Mek
ong
Sub
regi
on
pro
ject
. R
egio
nal I
nves
tmen
t Im
ple
men
tatio
n P
lan
(201
4-20
18).
N
ow u
nder
con
stru
ctio
n.
Lao
PD
RTr
ansp
ort
Up
grad
ing
NR
13N
an
d N
13S
(Por
tion
thro
ugh
Vang
Vie
ng–
Vie
ntia
ne–T
hab
ok);
AS
EA
N H
ighw
ay
AH
11 (N
R13
S)
NR
13N
con
nect
s V
ient
iane
to
the
coun
try’
s no
rthe
rn p
rovi
nces
, and
N
R13
S c
onne
cts
Vie
ntia
ne t
o th
e so
uthe
rn p
rovi
nces
. Pre
sent
and
p
roje
cted
tra
ffic
dem
and
req
uire
s th
e ro
ad t
o b
e ex
pan
ded
to
4 la
nes.
Th
e G
over
nmen
t is
con
sid
erin
g us
ing
a p
ublic
–priv
ate
par
tner
ship
(P
PP
) ap
pro
ach
for
imp
lem
entin
g th
e p
roje
ct.
Roa
d28
0.0
Gre
ater
Mek
ong
Sub
regi
on
pro
ject
. R
egio
nal I
nves
tmen
t Im
ple
men
tatio
n P
lan
(201
4-20
18).
P
ossi
ble
PP
P in
vest
men
t, w
ith
Wor
ld B
ank
sup
por
t. T
he W
orld
is
pro
vid
ing
sup
por
t fo
r th
e fe
asib
ility
st
udy
and
det
aile
d d
esig
n.
An
ne
x t
ab
le 4
.1.
Infr
astr
uctu
re c
on
ne
cti
vit
y:
se
lecte
d s
ub
reg
ion
al
(GM
S)
pro
jects
in
AS
EA
N

ANNEXES
205
Countr
y C
ove
rage
Secto
rN
am
e o
f P
roje
ct
Desc
rip
tion
Subse
ctor
Cost
est
imate
s ($
mill
ion)
Just
ific
ati
on/a
ddit
ional
info
rmati
on
Lao
PD
RTr
ansp
ort
Mek
ong
Brid
ge a
t B
ungk
an–P
aksa
nTh
is w
ill b
e th
e Fi
fth
Lao–
Thai
Inte
rnat
iona
l Frie
ndsh
ip B
ridge
acr
oss
the
Mek
ong
Riv
er, b
etw
een
Muo
ng P
aksa
n, B
olik
ham
xay
Pro
vinc
e (L
ao P
DR
sid
e), a
nd A
mp
hoe
Muo
ng, C
hang
Wat
, and
Bun
gkan
e (T
haila
nd s
ide)
. Thi
s b
ridge
will
faci
litat
e th
e ro
ad t
rans
por
t of
goo
ds
and
pas
seng
ers
from
nor
thea
ster
n Th
aila
nd t
hrou
gh c
entr
al L
ao
PD
R a
nd c
entr
al V
iet
Nam
via
NR
8. T
haila
nd is
con
sid
erin
g p
rovi
din
g as
sist
ance
for
a fe
asib
ility
stu
dy
and
det
aile
d d
esig
n of
the
pro
ject
.
Brid
geTo
be
det
er-
min
ed
Gre
ater
Mek
ong
Sub
regi
on
pro
ject
. R
egio
nal I
nves
tmen
t Im
ple
men
tatio
n P
lan
(201
4-20
18).
Lao
PD
RTr
ansp
ort
Than
alen
g B
ord
er-C
ross
ing
Infr
astr
uctu
re
Imp
rove
men
t
The
Than
alen
g b
ord
er-c
ross
ing
oper
ates
in a
ver
y re
stric
tive
and
in
effic
ient
man
ner
to b
oth
pas
seng
er a
nd fr
eigh
t tr
affic
. Dai
ly fr
eigh
t tr
affic
exc
eed
s 30
0 tr
ucks
; and
pas
seng
er c
ar a
nd b
us t
raffi
c re
por
ted
ly e
xcee
ds
1,00
0 ve
hicl
es p
er d
ay. T
here
is a
nee
d n
ot o
nly
to
sep
arat
e fr
eigh
t tr
affic
from
pas
seng
er t
raffi
c, b
ut a
lso
to s
igni
fican
tly
imp
rove
and
up
grad
e th
e ro
ad a
nd o
ther
infr
astr
uctu
re a
t th
is lo
catio
n.
Oth
er
Infr
as-
truc
ture
25.0
Gre
ater
Mek
ong
Sub
regi
on
pro
ject
. R
egio
nal I
nves
tmen
t Im
ple
men
tatio
n P
lan
(201
4-20
18).
Fi
nanc
ing
sup
por
t is
nee
ded
.
Lao
PD
RTr
ansp
ort
Muo
ng N
geun
e–C
hom
phe
t–Lu
ang
Pra
ban
g
This
tou
rism
cor
ridor
ext
end
s fr
om C
hian
g R
ai–C
hian
g M
ai–L
uang
P
rab
ang
(Chi
ang
Thon
g)–V
ient
iane
. The
sec
tion
from
Muo
ng N
geun
e–C
hom
phe
t–Lu
ang
Pra
ban
g is
par
t of
thi
s in
itiat
ive.
If a
goo
d r
oad
is in
p
lace
, it
will
pro
mot
e tr
ade,
inve
stm
ent,
and
tou
rism
.
Roa
d90
.0G
reat
er M
ekon
g S
ubre
gion
p
roje
ct.
Reg
iona
l Inv
estm
ent
Imp
lem
enta
tion
Pla
n (2
014-
2018
).
The
Gov
ernm
ent
of t
he L
ao P
DR
ha
s re
que
sted
fina
ncin
g su
pp
ort
from
Tha
iland
’s N
ED
A.
Lao
PD
RTr
ansp
ort
Up
grad
ing
of N
R8
Eas
t–W
est
Tran
spor
t R
oute
; AS
EA
N
Hig
hway
AH
15 (V
an
Lao–
Nan
Pha
o)
NR
8 b
ranc
hes
off f
rom
NR
13S
at
Ban
Lao
, pas
sing
thr
ough
the
d
istr
icts
of K
amke
uth
and
Lak
sao
bef
ore
reac
hing
the
Lao
PD
R–V
iet
Nam
bor
der
-cro
ssin
g p
oint
at
Nam
pha
o–C
au T
reo;
and
from
the
re,
it co
nnec
ts t
o C
ua L
o S
eap
ort,
in V
inh,
Vie
t N
am. T
he r
oad
doe
s no
t m
eet
AS
EA
N s
tand
ard
s. T
his
por
tion
of t
he r
oad
is in
clud
ed in
the
A
SE
AN
Mas
ter
Pla
n fo
r C
onne
ctiv
ity fo
r up
grad
ing.
Roa
d80
.0G
reat
er M
ekon
g S
ubre
gion
p
roje
ct. R
egio
nal I
nves
tmen
t Im
ple
men
tatio
n P
lan
(201
4-20
18).
Fi
nanc
ing
sup
por
t is
nee
ded
.
Lao
PD
RTr
ansp
ort
Xie
ngko
k R
iver
Por
tU
nder
the
Qua
dril
ater
al A
gree
men
t on
the
Com
mer
cial
Nav
igat
ion
on
Up
per
Mek
ong–
Lang
cang
Riv
er (P
eop
le’s
Rep
ublic
of C
hina
[PR
C]–
Lao
PD
R–M
yanm
ar–T
haila
nd),
Xie
ngko
k P
ort
(Lao
PD
R) w
ill b
e a
chec
kpoi
nt fo
r d
owns
trea
m r
iver
tra
ffic
from
the
PR
C t
o C
hian
g S
aen
Por
t, in
Tha
iland
. Thi
s p
ort
need
s to
be
cons
truc
ted
to
mee
t gr
owin
g tr
ade
activ
ities
and
pas
seng
er t
raffi
c; a
nd s
houl
d b
e eq
uip
ped
with
ne
cess
ary
hand
ling
equi
pm
ent,
imm
igra
tion
and
cus
tom
s of
fices
, and
w
areh
ouse
s.
Por
t Inf
ras-
truc
ture
15.0
Gre
ater
Mek
ong
Sub
regi
on
pro
ject
. Reg
iona
l Inv
estm
ent
Imp
lem
enta
tion
Pla
n (2
014-
2018
).
Lao
PD
RTr
ansp
ort
Ban
Mom
Riv
er P
ort
Und
er t
he Q
uad
rilat
eral
Agr
eem
ent
on t
he C
omm
erci
al N
avig
atio
n on
U
pp
er M
ekon
g–La
ngca
ng R
iver
(PR
C–L
ao P
DR
–Mya
nmar
–Tha
iland
), B
an M
om P
ort
will
be
a ch
eckp
oint
for
upst
ream
riv
er t
raffi
c fr
om
Chi
ang
Sae
n P
ort,
in T
haila
nd, t
o th
e P
RC
. Thi
s p
ort
need
s to
be
cons
truc
ted
to
mee
t gr
owin
g tr
ade
activ
ities
and
pas
seng
er t
raffi
c;
and
sho
uld
be
equi
pp
ed w
ith n
eces
sary
han
dlin
g eq
uip
men
t,
imm
igra
tion
and
cus
tom
s of
fices
, and
war
ehou
ses.
Por
t Inf
ras-
truc
ture
12.0
Gre
ater
Mek
ong
Sub
regi
on
pro
ject
. Reg
iona
l Inv
estm
ent
Imp
lem
enta
tion
Pla
n (2
014-
2018
).
Lao
PD
RTr
ansp
ort
Lal
ay B
ord
er-
Cro
ssin
g P
oint
(N
R15
)
The
faci
litie
s ar
e lo
cate
d a
t th
e La
o P
DR
–Vie
t N
am b
ord
er-c
ross
ing
poi
nts
on N
R15
in S
alav
an P
rovi
nce.
The
exi
stin
g b
ord
er-c
ross
ing
faci
litie
s d
o no
t m
eet
the
imp
lem
enta
tion
req
uire
men
ts o
f the
GM
S
CB
TA.
Oth
er
Infr
as-
truc
ture
4.0
Gre
ater
Mek
ong
Sub
regi
on
pro
ject
. Reg
iona
l Inv
estm
ent
Imp
lem
enta
tion
Pla
n (2
014-
2018
).
An
ne
x t
ab
le 4
.1.
Infr
astr
uctu
re c
on
ne
cti
vit
y:
se
lecte
d s
ub
reg
ion
al
(GM
S)
pro
jects
in
AS
EA
N (
co
nti
nu
ed
)

ASEAN INVESTMENT REPORT 2015: Infrastructure Investment and Connectivity
206
Countr
y C
ove
rage
Secto
rN
am
e o
f P
roje
ct
Desc
rip
tion
Subse
ctor
Cost
est
imate
s ($
mill
ion)
Just
ific
ati
on/a
ddit
ional
info
rmati
on
Lao
PD
RTr
ansp
ort
Nam
Pha
o B
ord
er-
Cro
ssin
g P
oint
(NR
8)Th
e fa
cilit
ies
are
loca
ted
at
the
Lao
PD
R–V
iet
Nam
bor
der
-cro
ssin
g p
oint
s on
NR
8 in
Bol
ikha
mxa
y P
rovi
nce.
The
exi
stin
g b
ord
er-c
ross
ing
faci
litie
s d
o no
t m
eet
the
imp
lem
enta
tion
req
uire
men
ts o
f the
GM
S
CB
TA.
Oth
er
Infr
as-
truc
ture
8.0
Gre
ater
Mek
ong
Sub
regi
on
pro
ject
. Reg
iona
l Inv
estm
ent
Imp
lem
enta
tion
Pla
n (2
014-
2018
).
Lao
PD
RTr
ansp
ort
Na
Pha
o B
ord
er-
Cro
ssin
g P
oint
(N
R12
)
The
faci
litie
s ar
e lo
cate
d a
t th
e La
o P
DR
–Vie
t N
am b
ord
er-c
ross
ing
poi
nts
on N
R12
in K
ham
mou
ane
Pro
vinc
e. A
fter
the
Thi
rd In
tern
atio
nal
Frie
ndsh
ip B
ridge
op
ens
for
tran
sit
traf
fic t
hrou
gh t
he L
ao P
DR
, Th
aila
nd, a
nd V
iet
Nam
, tra
ffic
will
incr
ease
. The
exi
stin
g b
ord
er-
cros
sing
faci
litie
s d
o no
t m
eet
the
imp
lem
enta
tion
req
uire
men
ts o
f the
G
MS
CB
TA.
Oth
er
Infr
as-
truc
ture
10.0
Gre
ater
Mek
ong
Sub
regi
on
pro
ject
. Reg
iona
l Inv
estm
ent
Imp
lem
enta
tion
Pla
n (2
014-
2018
).
Lao
PD
RTr
ansp
ort
Luan
g N
amth
a–X
ieng
kok–
Lao–
Mya
nmar
Frie
ndsh
ip
Brid
ge (N
R17
)
NR
17 is
loca
ted
in L
uang
Nam
tha
Pro
vinc
e, in
the
Lao
PD
R. T
his
road
st
arts
from
Muo
ng L
uang
Nam
tha,
the
cap
ital c
ity o
f Lua
ng N
amth
a P
rovi
nce;
pas
ses
thro
ugh
Mua
ng S
ing
and
Mua
ng L
ong;
and
the
n co
nnec
ts w
ith t
he L
ao–M
yanm
ar F
riend
ship
Brid
ge. T
his
road
is t
he
por
tion
of t
he A
SE
AN
–Ind
ia c
orrid
or t
hat
pas
ses
thro
ugh
Mya
nmar
, no
rthe
rn L
ao P
DR
, and
Ha
Noi
; and
the
n ru
ns d
own
to H
o C
hi M
inh
City
and
Cam
bod
ia. T
he c
ost
of t
he c
onst
ruct
ion
of t
he L
ao–M
yanm
ar
Frie
ndsh
ip B
ridge
is t
o b
e sh
ared
eq
ually
by
the
Lao
PD
R a
nd
Mya
nmar
.
Roa
d15
0.0
Gre
ater
Mek
ong
Sub
regi
on
pro
ject
. Reg
iona
l Inv
estm
ent
Imp
lem
enta
tion
Pla
n (2
014-
2018
).
Lao
PD
RTr
ansp
ort
Vie
ntia
ne–B
oten
R
ailw
ay
Und
er t
he S
ino–
Lao
Coo
per
atio
n S
chem
e, t
hep
roje
ct is
und
erfin
al
tech
nica
l des
ign
revi
ew. T
he t
rain
sp
eed
was
red
uced
from
hig
h sp
eed
to
abou
t 20
0 km
/h. F
inan
cial
neg
otia
tion
is a
lso
und
erw
ay.
Rai
l 7
’200
.0
Gre
ater
Mek
ong
Sub
regi
on
pro
ject
. R
egio
nal I
nves
tmen
t Im
ple
men
tatio
n P
lan
(201
4-20
18).
D
iscu
ssio
ns w
ith t
he P
eop
le’s
R
epub
lic o
f Chi
na o
n fin
anci
ng
sup
por
t ar
e on
goin
g.
Mya
nmar
Tran
spor
tE
ast–
Wes
t E
cono
mic
C
orrid
or E
ind
u–K
awka
reik
Roa
d
Imp
rove
men
t
The
pro
ject
focu
ses
on a
key
rou
te t
hat
is n
ot o
nly
for
the
GM
S, b
ut
also
for
the
Trila
tera
l Hig
hway
and
the
AS
EA
N a
nd A
sian
hig
hway
s.
It is
on
the
prin
cip
al s
ectio
n of
the
Nat
iona
l Hig
hway
, and
mus
t b
e up
grad
ed t
o A
SE
AN
Cla
ss II
sta
ndar
d.
Roa
d10
0.0
Gre
ater
Mek
ong
Sub
regi
on
pro
ject
. R
egio
nal I
nves
tmen
t Im
ple
men
tatio
n P
lan
(201
4-20
18).
Fe
asib
ility
stu
dy
and
det
aile
d
des
ign
are
ongo
ing.
AD
B lo
an in
th
e 20
15 p
rogr
am is
in t
he p
ipel
ine.
Mya
nmar
Tran
spor
tM
ae S
ot–M
yaw
add
y B
ord
er C
ross
ing
and
Infr
astr
uctu
re
Imp
rove
men
ts (w
ith
Thai
land
)
The
Gov
ernm
ent
of T
haila
nd is
stu
dyi
ng a
new
roa
d b
ypas
s an
d
brid
ge t
o th
e no
rth
of t
he e
xist
ing
bor
der
cro
ssin
g, a
t M
ae S
ot
(Tha
iland
)–M
yaw
add
y (M
yanm
ar),
loca
ted
in c
onge
sted
cen
ters
of t
he
two
bor
der
citi
es. T
his
new
cro
ssin
g w
ill b
e d
edic
ated
to
cros
s-b
ord
er
frei
ght
traf
fic. T
he b
ypas
s w
ill li
nk w
ith a
new
ly e
nvis
ione
d s
pec
ial
trad
e zo
ne o
n th
e M
yanm
ar s
ide.
Th
e p
roje
ct w
ill in
clud
e ab
out
16.9
km
of a
new
four
-lan
e d
ivid
ed
high
way
(13.
3 km
in T
haila
nd; 3
.6 k
m in
Mya
nmar
), a
100
met
er-l
ong
brid
ge a
cros
s th
e M
oei R
iver
at
the
bor
der
, and
ass
ocia
ted
bor
der
-cr
ossi
ng fa
cilit
ies.
Th
e es
timat
ed t
otal
cos
t is
ab
out
$60
mill
ion
(B1,
750
mill
ion)
for
the
com
bin
ed s
ectio
ns in
bot
h co
untr
ies.
Oth
er
Infr
as-
truc
ture
30.0
Gre
ater
Mek
ong
Sub
regi
on
pro
ject
. R
egio
nal I
nves
tmen
t Im
ple
men
tatio
n P
lan
(201
4-20
18).
Fea
sib
ility
stu
dy
is u
nder
p
rep
arat
ion.
An
ne
x t
ab
le 4
.1.
Infr
astr
uctu
re c
on
ne
cti
vit
y:
se
lecte
d s
ub
reg
ion
al
(GM
S)
pro
jects
in
AS
EA
N (
co
nti
nu
ed
)
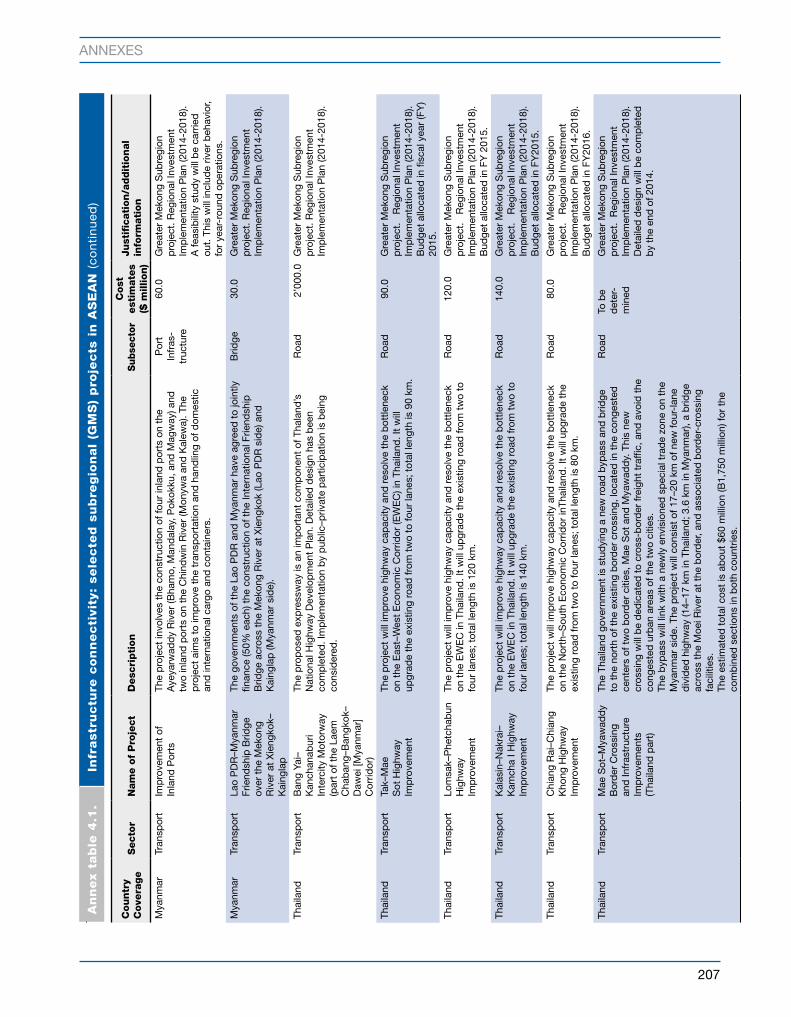
ANNEXES
207
Countr
y C
ove
rage
Secto
rN
am
e o
f P
roje
ct
Desc
rip
tion
Subse
ctor
Cost
est
imate
s ($
mill
ion)
Just
ific
ati
on/a
ddit
ional
info
rmati
on
Mya
nmar
Tran
spor
tIm
pro
vem
ent
of
Inla
nd P
orts
The
pro
ject
invo
lves
the
con
stru
ctio
n of
four
inla
nd p
orts
on
the
Aye
yarw
add
y R
iver
(Bha
mo,
Man
dal
ay, P
okok
ku, a
nd M
agw
ay) a
nd
two
inla
nd p
orts
on
the
Chi
ndw
in R
iver
(Mon
ywa
and
Kal
ewa)
. The
p
roje
ct a
ims
to im
pro
ve t
he t
rans
por
tatio
n an
d h
and
ling
of d
omes
tic
and
inte
rnat
iona
l car
go a
nd c
onta
iner
s.
Por
t
Infr
as-
truc
ture
60.0
Gre
ater
Mek
ong
Sub
regi
on
pro
ject
. Reg
iona
l Inv
estm
ent
Imp
lem
enta
tion
Pla
n (2
014-
2018
).
A fe
asib
ility
stu
dy
will
be
carr
ied
ou
t. T
his
will
incl
ude
river
beh
avio
r, fo
r ye
ar-r
ound
op
erat
ions
.
Mya
nmar
Tran
spor
tLa
o P
DR
–Mya
nmar
Fr
iend
ship
Brid
ge
over
the
Mek
ong
Riv
er a
t X
ieng
kok–
Kai
ngla
p
The
gove
rnm
ents
of t
he L
ao P
DR
and
Mya
nmar
hav
e ag
reed
to
join
tly
finan
ce (5
0% e
ach)
the
con
stru
ctio
n of
the
Inte
rnat
iona
l Frie
ndsh
ip
Brid
ge a
cros
s th
e M
ekon
g R
iver
at
Xie
ngko
k (L
ao P
DR
sid
e) a
nd
Kai
ngla
p (M
yanm
ar s
ide)
.
Brid
ge30
.0G
reat
er M
ekon
g S
ubre
gion
p
roje
ct. R
egio
nal I
nves
tmen
t Im
ple
men
tatio
n P
lan
(201
4-20
18).
Thai
land
Tran
spor
tB
ang
Yai–
Kan
chan
abur
i In
terc
ity M
otor
way
(p
art
of t
he L
aem
C
hab
ang–
Ban
gkok
–D
awei
[Mya
nmar
] C
orrid
or)
The
pro
pos
ed e
xpre
ssw
ay is
an
imp
orta
nt c
omp
onen
t of
Tha
land
’s
Nat
iona
l Hig
hway
Dev
elop
men
t P
lan.
Det
aile
d d
esig
n ha
s b
een
com
ple
ted
. Im
ple
men
tatio
n b
y p
ublic
–priv
ate
par
ticip
atio
n is
bei
ng
cons
ider
ed.
Roa
d 2
’000
.0
Gre
ater
Mek
ong
Sub
regi
on
pro
ject
. Reg
iona
l Inv
estm
ent
Imp
lem
enta
tion
Pla
n (2
014-
2018
).
Thai
land
Tran
spor
tTa
k–M
ae
Sot
Hig
hway
Im
pro
vem
ent
The
pro
ject
will
imp
rove
hig
hway
cap
acity
and
res
olve
the
bot
tlene
ck
on t
he E
ast–
Wes
t E
cono
mic
Cor
ridor
(EW
EC
) in
Thai
land
. It
will
up
grad
e th
e ex
istin
g ro
ad fr
om t
wo
to fo
ur la
nes;
tot
al le
ngth
is 9
0 km
.
Roa
d90
.0G
reat
er M
ekon
g S
ubre
gion
p
roje
ct.
Reg
iona
l Inv
estm
ent
Imp
lem
enta
tion
Pla
n (2
014-
2018
).
Bud
get
allo
cate
d in
fisc
al y
ear
(FY
) 20
15.
Thai
land
Tran
spor
tLo
msa
k–P
hetc
hab
un
Hig
hway
Im
pro
vem
ent
The
pro
ject
will
imp
rove
hig
hway
cap
acity
and
res
olve
the
bot
tlene
ck
on t
he E
WE
C in
Tha
iland
. It
will
up
grad
e th
e ex
istin
g ro
ad fr
om t
wo
to
four
lane
s; t
otal
leng
th is
120
km
.
Roa
d12
0.0
Gre
ater
Mek
ong
Sub
regi
on
pro
ject
. R
egio
nal I
nves
tmen
t Im
ple
men
tatio
n P
lan
(201
4-20
18).
B
udge
t al
loca
ted
in F
Y 2
015.
Thai
land
Tran
spor
tK
alas
in–N
akra
i–K
amch
a I H
ighw
ay
Imp
rove
men
t
The
pro
ject
will
imp
rove
hig
hway
cap
acity
and
res
olve
the
bot
tlene
ck
on t
he E
WE
C in
Tha
iland
. It
will
up
grad
e th
e ex
istin
g ro
ad fr
om t
wo
to
four
lane
s; t
otal
leng
th is
140
km
.
Roa
d14
0.0
Gre
ater
Mek
ong
Sub
regi
on
pro
ject
. R
egio
nal I
nves
tmen
t Im
ple
men
tatio
n P
lan
(201
4-20
18).
Bud
get
allo
cate
d in
FY
2015
.
Thai
land
Tran
spor
tC
hian
g R
ai–C
hian
g K
hong
Hig
hway
Im
pro
vem
ent
The
pro
ject
will
imp
rove
hig
hway
cap
acity
and
res
olve
the
bot
tlene
ck
on t
he N
orth
–Sou
th E
cono
mic
Cor
ridor
inTh
aila
nd. I
t w
ill u
pgr
ade
the
exis
ting
road
from
tw
o to
four
lane
s; t
otal
leng
th is
80
km.
Roa
d80
.0G
reat
er M
ekon
g S
ubre
gion
p
roje
ct.
Reg
iona
l Inv
estm
ent
Imp
lem
enta
tion
Pla
n (2
014-
2018
). B
udge
t al
loca
ted
in F
Y20
16.
Thai
land
Tran
spor
tM
ae S
ot–M
yaw
add
y B
ord
er C
ross
ing
and
Infr
astr
uctu
re
Imp
rove
men
ts
(Tha
iland
par
t)
The
Thai
land
gov
ernm
ent
is s
tud
ying
a n
ew r
oad
byp
ass
and
brid
ge
to t
he n
orth
of t
he e
xist
ing
bor
der
cro
ssin
g, lo
cate
d in
the
con
gest
ed
cent
ers
of t
wo
bor
der
citi
es, M
ae S
ot a
nd M
yaw
add
y. T
his
new
cr
ossi
ng w
ill b
e d
edic
ated
to
cros
s-b
ord
er fr
eigh
t tr
affic
, and
avo
id t
he
cong
este
d u
rban
are
as o
f the
tw
o ci
ties.
Th
e b
ypas
s w
ill li
nk w
ith a
new
ly e
nvis
ione
d s
pec
ial t
rad
e zo
ne o
n th
e M
yanm
ar s
ide.
The
pro
ject
will
con
sist
of 1
7–20
km
of n
ew fo
ur-l
ane
div
ided
hig
hway
(14–
17 k
m in
Tha
iland
; 3.6
km
in M
yanm
ar),
a b
ridge
ac
ross
the
Moe
i Riv
er a
t th
e b
ord
er, a
nd a
ssoc
iate
d b
ord
er-c
ross
ing
faci
litie
s.
The
estim
ated
tot
al c
ost
is a
bou
t $6
0 m
illio
n (B
1,75
0 m
illio
n) fo
r th
e co
mb
ined
sec
tions
in b
oth
coun
trie
s.
Roa
dTo
be
d
eter
-m
ined
Gre
ater
Mek
ong
Sub
regi
on
pro
ject
. R
egio
nal I
nves
tmen
t Im
ple
men
tatio
n P
lan
(201
4-20
18).
D
etai
led
des
ign
will
be
com
ple
ted
b
y th
e en
d o
f 201
4.
An
ne
x t
ab
le 4
.1.
Infr
astr
uctu
re c
on
ne
cti
vit
y:
se
lecte
d s
ub
reg
ion
al
(GM
S)
pro
jects
in
AS
EA
N (
co
nti
nu
ed
)

ASEAN INVESTMENT REPORT 2015: Infrastructure Investment and Connectivity
208
Countr
y C
ove
rage
Secto
rN
am
e o
f P
roje
ct
Desc
rip
tion
Subse
ctor
Cost
est
imate
s ($
mill
ion)
Just
ific
ati
on/a
ddit
ional
info
rmati
on
Thai
land
Tran
spor
tTh
a La
em C
hab
ang
Por
t D
evel
opm
ent,
P
hase
3 -
Fea
sib
ility
S
tud
y
Acc
ord
ing
to t
hrou
ghp
ut fo
reca
stin
g, t
he t
otal
con
tain
ers
acco
mm
odat
ed in
Bas
in I
and
Bas
in II
will
exc
eed
10
mill
ion
twen
ty-
foot
eq
uiva
lent
uni
ts (T
EU
s) p
er y
ear
by
2018
, whi
le t
he m
axim
um
cap
aciti
es o
f Bas
in I
and
Bas
in II
are
ap
pro
xim
atel
y 11
mill
ion
TEU
s p
er y
ear.
Giv
en t
heir
cap
aciti
es, t
he d
evel
opm
ent
of B
asin
III w
ill
be
nece
ssar
y. T
he L
aem
Cha
ban
g P
ort
(LC
P) w
ill d
evel
op t
he m
ain
infr
astr
uctu
re, s
uch
as d
red
ging
, lan
d r
ecla
mat
ion,
bre
akw
ater
, etc
. Th
e ob
ject
ive
of t
he p
roje
ct i
s to
acc
omm
odat
e th
e in
crea
sing
th
roug
hput
and
str
engt
hen
the
LCP
’s r
ole
as a
gat
eway
por
t to
the
G
MS
.
Por
t
Infr
as-
truc
ture
5.0
Gre
ater
Mek
ong
Sub
regi
on
pro
ject
. P
ort
cont
aine
r th
ough
put
p
roje
ctio
ns in
dic
ate
that
the
ex
istin
g P
hase
I an
d II
faci
litie
s w
ill
soon
rea
ch c
apac
ity. T
he p
rop
osed
fe
asib
ility
stu
dy
will
pre
sent
te
chni
cal a
nd o
ther
op
tions
for
exp
and
ing
the
por
t.
Thai
land
Tran
spor
tS
ingl
e R
ail
Tran
sfer
Op
erat
or
Dev
elop
men
t of
La
em C
hab
ang
Por
t
Ap
pro
xim
atel
y 88
% o
f tra
nsp
ort
from
LC
P t
o th
e hi
nter
land
is v
ia t
he
road
sys
tem
, whi
le 9
.5%
is b
y ra
il an
d 2
.5%
by
wat
erw
ay.
The
pro
ject
will
dev
elop
the
infr
astr
uctu
re a
nd n
eces
sary
faci
litie
s to
se
rve
the
dis
char
ging
and
load
ing
cont
aine
rs t
rans
por
ted
by
rail
to t
he
por
t ar
ea.
The
pro
ject
will
larg
ely
help
faci
litat
e ra
il tr
ansf
er in
the
futu
re, i
n re
spon
se t
o th
e co
mp
letio
n of
the
sin
gle
rail
tran
sfer
dou
ble
-tra
ck
cons
truc
tion.
It w
ill in
crea
se t
he h
and
ling
cap
acity
of r
ail t
rans
por
t at
th
e LC
P fr
om t
he c
urre
nt 5
00,0
00 T
EU
s p
er y
ear
to 1
–2 m
illio
n TE
Us
per
yea
r. To
enh
ance
the
logi
stic
s ne
twor
k sy
stem
in t
he c
ount
ry, t
he
gove
rnm
ent
is fo
cusi
ng o
n sh
iftin
g LC
P-l
inke
d t
rans
por
t of
co
ntai
neriz
ed c
argo
from
roa
d t
o ra
il an
d w
ater
way
.
Rai
l90
.0G
reat
er M
ekon
g S
ubre
gion
pro
ject
. Th
e p
roje
ct a
ims
to in
crea
se
the
pro
por
tion
of c
onta
iner
tr
affic
mov
ed b
y ra
il fr
om 9
%
of p
ort
thro
ughp
ut t
o 20
% o
f p
ort
thro
ughp
ut, i
n lin
e w
ith t
he
gove
rnm
ent’s
pol
icy
to r
educ
e lo
gist
ics
cost
s.
Vie
t N
amTr
ansp
ort
GM
S B
en L
uc–L
ong
Than
h E
xpre
ssw
ay
(Sta
ge 2
)
The
pro
ject
will
con
stru
ct a
57.
1km
exp
ress
way
bet
wee
n B
en L
uc a
nd
Long
Tha
nh, s
outh
of H
o C
hi M
inh
City
. Thi
s is
a s
ectio
n of
the
GM
S
Sou
ther
n E
cono
mic
Cor
ridor
.
Roa
d62
3.0
Gre
ater
Mek
ong
Sub
regi
on p
roje
ct.
Sta
ge 1
is u
nder
con
stru
ctio
n.
Vie
t N
amTr
ansp
ort
GM
S H
a N
oi–L
ang
Son
Exp
ress
way
The
pro
ject
will
con
stru
ct a
156
.6 k
m e
xpre
ssw
ay b
etw
een
Ha
Noi
an
d H
uu N
ghi,
in L
ang
Son
Pro
vinc
e, o
n th
e b
ord
er w
ith G
uang
xi
Zhu
ang
Aut
onom
ous
Reg
ion
in t
he P
RC
.
Roa
d 1
’400
.0
Gre
ater
Mek
ong
Sub
regi
on
pro
ject
. F
inan
cing
from
AD
B a
nd
the
Exp
ort-
Imp
ort
Ban
k of
Chi
na is
b
eing
con
sid
ered
.
Vie
t N
amTr
ansp
ort
Sec
ond
GM
S
Sou
ther
n C
oast
al
Cor
ridor
The
pro
ject
will
con
stru
ct t
he m
issi
ng s
ectio
ns o
f the
GM
S r
oad
co
rrid
or in
the
sou
ther
n co
asta
l reg
ion
of V
iet
Nam
.R
oad
373.
0G
reat
er M
ekon
g S
ubre
gion
p
roje
ct.
Reg
iona
l Inv
estm
ent
Imp
lem
enta
tion
Pla
n (2
014-
2018
). T
he fe
asib
ility
stu
dy
is
com
ple
te. A
DB
fina
ncin
g is
und
er
cons
ider
atio
n.
Vie
t N
amTr
ansp
ort
Sec
ond
GM
S
Nor
ther
n Tr
ansp
ort
Net
wor
k Im
pro
vem
ent
(Lua
ng
Pra
ban
g–Th
anh
Hoa
) (a
dd
ition
al fi
nanc
ing)
The
pro
ject
will
up
grad
e V
ietn
ames
e N
atio
nal H
ighw
ay 2
17 fr
om D
o Le
n to
Na
Meo
bor
der
gat
e (in
Tha
nh H
oa P
rovi
nce)
; and
the
Lao
P
DR
’s n
atio
nal h
ighw
ays
6, 6
A, a
nd 6
B.
Roa
d14
5.0
Gre
ater
Mek
ong
Sub
regi
on
pro
ject
. R
egio
nal I
nves
tmen
t Im
ple
men
tatio
n P
lan
(201
4-20
18).
AD
B fi
nanc
ing
in 2
015
is p
rop
osed
.
An
ne
x t
ab
le 4
.1.
Infr
astr
uctu
re c
on
ne
cti
vit
y:
se
lecte
d s
ub
reg
ion
al
(GM
S)
pro
jects
in
AS
EA
N (
co
nti
nu
ed
)

ANNEXES
209
Countr
y C
ove
rage
Secto
rN
am
e o
f P
roje
ct
Desc
rip
tion
Subse
ctor
Cost
est
imate
s ($
mill
ion)
Just
ific
ati
on/a
ddit
ional
info
rmati
on
Vie
t N
amTr
ansp
ort
Nat
iona
l Hig
hway
14
D Im
pro
vem
ent
The
pro
ject
will
imp
rove
the
hig
hway
sec
tion
(72
km) f
rom
Tha
nh M
y to
the
bor
der
with
the
Lao
PD
R in
Qua
ng N
am P
rovi
nce.
Nat
iona
l H
ighw
ay 1
4D is
a p
art
of t
he m
inim
um d
ista
nce
rout
e fo
r fr
eigh
t tr
ansp
orta
tion
amon
g B
angk
ok, P
akse
(Lao
PD
R),
and
Da
Nan
g (V
iet
Nam
).
Roa
d13
0.0
Gre
ater
Mek
ong
Sub
regi
on
pro
ject
. R
egio
nal I
nves
tmen
t Im
ple
men
tatio
n P
lan
(201
4-20
18).
A
DB
fina
ncin
g in
201
6–20
17 is
b
eing
con
sid
ered
.
Vie
t N
amTr
ansp
ort
Nor
ther
n E
ast–
Wes
t C
orrid
or: S
on L
a–D
ien
Bie
n–Ta
y Tr
ang
Bor
der
Gat
e (V
iet
Nam
and
the
Lao
P
DR
) sec
tion,
to
conn
ect
with
Lua
ng
Nam
tha
(Lao
PD
R) t
o th
e Fr
iend
ship
Brid
ge
(Lao
PD
R–M
yanm
ar)
at X
ieng
kok–
Kai
ngla
p
This
is t
he s
hort
est
rout
e to
con
nect
nor
ther
n La
o P
DR
, and
the
no
rthe
ast
of M
yanm
ar, t
hrou
gh t
he n
orth
wes
t of
Vie
t N
am t
o th
e H
ai
Pho
ng in
tern
atio
nal g
atew
ay p
ort.
Oth
er
Infr
as-
truc
ture
To b
e
det
er-
min
ed
Gre
ater
Mek
ong
Sub
regi
on
pro
ject
. R
egio
nal I
nves
tmen
t Im
ple
men
tatio
n P
lan
(201
4-20
18).
Th
e co
ncep
t p
aper
is u
nder
p
rep
arat
ion.
The
Lua
ng N
amth
a (L
ao P
DR
) to
the
Frie
ndsh
ip
Brid
ge (L
ao P
DR
–Mya
nmar
) at
Xie
ngko
k–K
aing
lap
sec
tion
is li
sted
in
the
GM
S R
egio
nal I
nves
tmen
t Fr
amew
ork.
Lao
PD
R,
Vie
t N
amE
nerg
yLa
o P
DR
–Vie
t N
am
Pow
er T
rans
mis
sion
In
terc
onne
ctio
n (H
atxa
n–P
leik
u)
This
pro
ject
will
(i) c
onst
ruct
a 5
9- k
ilom
eter
500
kilo
volt
(kV
) tr
ansm
issi
on li
ne a
nd a
230
kV
/500
kV
sub
stat
ion
in H
atxa
n (L
ao
PD
R);
and
(ii)
cons
truc
t a
94-k
ilom
eter
500
kV
tra
nsm
issi
on li
ne a
nd
exp
and
the
exi
stin
g 22
0 kV
/500
kV P
leik
u S
ubst
atio
n, in
Vie
t N
am.
The
pro
ject
will
ena
ble
the
tra
nsm
issi
on o
f 3,1
57 g
igaw
att-
hour
s/ye
ar
of e
lect
ricity
to
be
pro
duc
ed b
y ei
ght
smal
l hyd
rop
ower
pla
nts
(with
a
tota
l cap
acity
of 1
,013
MW
) in
sou
ther
n La
o P
DR
, whi
ch w
ill b
e d
evel
oped
by
ind
epen
den
t p
ower
pro
duc
ers.
Ele
ctric
ity
tran
s-m
issi
on
and
d
istr
ibut
ion
218.
0G
reat
er M
ekon
g S
ubre
gion
p
roje
ct.
Reg
iona
l Inv
estm
ent
Imp
lem
enta
tion
Pla
n (2
014-
2018
).
Lao
PD
RE
nerg
yN
abon
g 50
0 kV
Sub
stat
ion
Tran
smis
sion
Fac
ility
The
pro
ject
aim
s to
con
stru
ct a
500
kV
line
from
Ud
on T
hani
(T
haila
nd) t
o N
abon
g (L
ao P
DR
), to
tra
nsfe
r p
ower
from
sev
eral
hy
dro
pow
er p
roje
cts
in t
he C
entr
al-1
are
a of
the
Lao
PD
R t
o Th
aila
nd.
Thes
e in
clud
e th
e N
am N
gum
2, N
am T
heun
1, a
nd N
am N
giep
1
hyd
rop
ower
pro
ject
s, w
hich
hav
e a
tota
l ins
talle
d c
apac
ity o
f ove
r 1,
500
MW
, la
rgel
y fo
r ex
por
t to
Tha
iland
.
Ele
ctric
ity
tran
s-m
issi
on
and
d
istr
ibut
ion
106.
0G
reat
er M
ekon
g S
ubre
gion
p
roje
ct.
Reg
iona
l Inv
estm
ent
Imp
lem
enta
tion
Pla
n (2
014-
2018
).
Chi
na,
Lao
PD
R,
Thai
land
Ene
rgy
PR
C–L
ao P
DR
–Th
aila
nd 6
00 H
VD
C
Inte
rcon
nect
ion
The
pro
ject
aim
s to
sup
ply
ele
ctric
ity t
o Th
aila
nd fr
om C
hina
. P
relim
inar
y st
udie
s ha
ve b
een
und
erta
ken,
suc
h as
a jo
int
feas
ibili
ty
stud
y to
ass
ess
the
pro
ject
’s t
echn
ical
and
eco
nom
ic v
iab
ility
, a
stud
y on
ow
ners
hip
mod
els
and
on
the
prin
cip
les
of b
enef
it sh
arin
g, a
nd a
stu
dy
on t
echn
ical
alte
rnat
ives
. It
also
the
con
duc
t of
pro
ject
pre
par
atio
n; d
etai
led
eng
inee
ring;
con
stru
ctio
n of
the
tr
ansm
issi
on li
ne, i
nclu
din
g su
bst
atio
ns; a
nd p
ossi
bly
the
dis
trib
utio
n of
com
pon
ents
.
Ele
ctric
ity
tran
s-m
issi
on
and
d
istr
ibut
ion
600.
0–80
0.0
Gre
ater
Mek
ong
Sub
regi
on
pro
ject
. R
egio
nal I
nves
tmen
t Im
ple
men
tatio
n P
lan
(201
4-20
18).
Lao
PD
R,
Thai
land
, V
iet
Nam
Ene
rgy
Rei
nves
tigat
ion
of T
haila
nd–L
ao
PD
R–V
iet
Nam
In
terc
onne
ctio
n
The
pro
ject
will
invo
lve
reco
nsid
erin
g an
inte
rcon
nect
ion
bet
wee
n Th
aila
nd a
nd V
iet
Nam
via
the
Lao
PD
R, a
nd t
he L
ao P
DR
–Vie
t N
am
sect
ion.
It w
ill in
trod
uce
a st
ep c
hang
e in
the
dev
elop
men
t of
the
re
gion
al p
ower
mar
ket;
and
lead
to
red
uced
res
erve
req
uire
men
ts,
low
er c
osts
, and
enh
ance
d c
onfid
ence
in t
he r
egio
nal p
ower
mar
ket.
Ele
ctric
ity
tran
s-m
issi
on
and
d
istr
ibut
ion
278.
0G
reat
er M
ekon
g S
ubre
gion
p
roje
ct.
Reg
iona
l Inv
estm
ent
Imp
lem
enta
tion
Pla
n (2
014-
2018
).
An
ne
x t
ab
le 4
.1.
Infr
astr
uctu
re c
on
ne
cti
vit
y:
se
lecte
d s
ub
reg
ion
al
(GM
S)
pro
jects
in
AS
EA
N (
co
nti
nu
ed
)

ASEAN INVESTMENT REPORT 2015: Infrastructure Investment and Connectivity
210
Countr
y C
ove
rage
Secto
rN
am
e o
f P
roje
ct
Desc
rip
tion
Subse
ctor
Cost
est
imate
s ($
mill
ion)
Just
ific
ati
on/a
ddit
ional
Info
rmati
on
Chi
na/L
ao
PD
RIn
form
atio
n an
d
com
mun
i-ca
tion
Tech
nolo
gy
Tim
e-D
ivis
ion
Long
-Ter
m E
volu
tion
Dem
onst
ratio
n N
etw
ork
in L
ao P
DR
In J
une
2011
, at
the
Gre
ater
Mek
ong
Sub
regi
on (G
MS
) Inf
orm
atio
n an
d C
omm
unic
atio
n Te
chno
logy
(IC
T) M
inis
teria
l Mee
ting,
the
Min
istr
y of
Ind
ustr
y an
d In
form
atio
n Te
chno
logy
of C
hina
and
the
Min
istr
y of
P
osts
and
Tel
ecom
mun
icat
ions
of L
ao P
DR
sig
ned
the
Mem
oran
dum
of
Und
erst
and
ing
on C
ontin
uing
with
Dem
onst
ratio
n P
roje
cts
of
Ap
plic
able
Com
mun
icat
ion
Tech
nolo
gies
in R
ural
Are
as.
Priv
ate
sect
or in
Chi
na a
nd t
he L
ao P
DR
pre
limin
arily
inte
nded
to
coo
per
ate
with
eac
h ot
her
in b
uild
ing
a tim
e-d
ivis
ion
long
-te
rm e
volu
tion
dem
onst
ratio
n ne
twor
k in
Vie
ntia
ne, i
n th
e La
o P
DR
, to
pro
vid
e hi
gh-s
pee
d m
obile
dat
a se
rvic
es fo
r p
rom
otin
g co
mm
unic
atio
ns d
evel
opm
ent
in r
ural
are
as a
nd r
educ
ing
the
dig
ital
gap
.
ICT
infr
as-
truc
ture
5.0
Gre
ater
Mek
ong
Sub
regi
on
pro
ject
. R
egio
nal I
nves
tmen
t Im
ple
men
tatio
n P
lan
(201
4-20
18).
Chi
na/V
iet
Nam
Cro
ss-
bor
der
E
cono
mic
Z
ones
(C
BE
Z)
Join
t C
hina
–Vie
t N
am C
ross
-Bor
der
E
cono
mic
Zon
es
(CB
EZ
s)
The
pro
ject
will
cov
er t
hree
cro
ss-b
ord
er e
cono
mic
zon
es (C
BE
Zs)
lo
cate
d a
t C
hina
–Vie
t N
am b
ord
ers
as fo
llow
s: (i
) P
ingx
iang
(Gua
ngxi
Z
huan
g A
uton
omou
s R
egio
n, C
hina
); an
d D
ong
Dan
g (L
ang
Son
P
rovi
nce,
Vie
t N
am),
(ii) D
ongx
ing
(Gua
ngxi
Zhu
ang
Aut
onom
ous
Reg
ion,
Chi
na) a
nd M
ong
Cai
(Qua
ng N
inh
Pro
vinc
e, V
iet
Nam
), an
d
(iii)
Long
ban
g–B
aise
(Gua
ngxi
Zhu
ang
Aut
onom
ous
Reg
ion,
Chi
na)
and
Tra
Lin
h (C
ao B
ang
Pro
vinc
e, V
iet
Nam
). Th
e co
mp
onen
ts o
f the
CB
EZ
s ar
e as
follo
ws:
(i)
Pin
gxia
ng–D
ong
Dan
g.
The
pla
nned
are
a is
17
squa
re
kilo
met
ers
(km
2), w
ith t
he C
hina
and
Vie
t N
am e
ach
allo
catin
g 8.
5 km
2. T
he C
hina
sec
tion
will
be
cons
truc
ted
bas
ed o
n th
e G
uang
xi
Pin
gxia
ng C
omp
rehe
nsiv
e B
ond
ed Z
one,
whi
ch w
as a
pp
rove
d b
y th
e S
tate
Cou
ncil.
The
CB
EZ
is a
pilo
t cr
oss-
bor
der
coo
per
atio
n zo
ne
und
er t
he fr
amew
ork
of A
SE
AN
-Chi
na F
ree
Trad
e A
gree
men
t. It
is a
lso
an im
por
tant
eco
nom
ic z
one
situ
ated
in a
nod
e ci
ty o
f the
Gre
ater
M
ekon
g S
ubre
gion
eco
nom
ic c
orrid
or, w
hich
will
con
trib
ute
to t
he
tran
sfor
mat
ion
of a
tra
nsp
orta
tion
corr
idor
into
an
econ
omic
cor
ridor
an
d s
erve
eco
nom
ic d
evel
opm
ent
alon
g th
e co
rrid
or.
Oth
er
omfr
as-
truc
ture
150.
0G
reat
er M
ekon
g S
ubre
gion
p
roje
ct.
Reg
iona
l Inv
estm
ent
Imp
lem
enta
tion
Pla
n (2
014-
2018
).
An
ne
x t
ab
le 4
.1.
Infr
astr
uctu
re c
on
ne
cti
vit
y:
se
lecte
d s
ub
reg
ion
al
(GM
S)
pro
jects
in
AS
EA
N (
co
nti
nu
ed
)

ANNEXES
211
Countr
y C
ove
rage
Secto
rN
am
e o
f P
roje
ct
Desc
rip
tion
Subse
ctor
Cost
est
imate
s ($
mill
ion)
Just
ific
ati
on/a
ddit
ional
info
rmati
on
The
pro
pos
ed p
roje
ct is
inte
nded
to
sup
por
t th
e se
cond
pha
se o
f in
fras
truc
ture
con
stru
ctio
n of
Chi
na s
ectio
n.
(ii) D
ongx
ing–
Mon
g C
ai.
This
CB
EZ
is lo
cate
d a
t th
e C
hina
–Vie
t N
am b
ord
er, t
o b
e co
nnec
ted
b
y th
e S
econ
d In
tern
atio
nal B
ridge
of B
eilu
n R
iver
, whi
ch is
ab
out
to
be
cons
truc
ted
. The
pla
nned
Chi
na s
ectio
n in
clud
es 9
71.8
5 he
ctar
es,
and
Vie
t N
am p
lans
to
allo
cate
an
area
as
larg
e as
tha
t of
Chi
na
sect
ion
for
this
zon
e. T
his
CB
EZ
will
be
bui
lt as
an
exp
erim
enta
l zon
e to
dee
pen
the
Chi
na–V
iet
Nam
coo
per
atio
n, a
nd is
a p
riorit
y p
roje
ct
of t
he D
ongx
ing
Nat
iona
l Exp
erim
enta
l Zon
e of
Dev
elop
men
t an
d
Op
enin
g-U
p.
The
CB
EZ
is a
lso
an im
por
tant
eco
nom
ic z
one
situ
ated
in a
nod
e ci
ty o
f the
GM
S e
cono
mic
cor
ridor
tha
t w
ill c
ontr
ibut
e to
the
tr
ansf
orm
atio
n of
a t
rans
por
tatio
n co
rrid
or in
to a
n ec
onom
ic c
orrid
or
and
ser
ve t
he e
cono
mic
dev
elop
men
t al
ong
the
corr
idor
. Th
e p
rop
osed
pro
ject
is in
tend
ed t
o su
pp
ort
the
infr
astr
uctu
re
cons
truc
tion
of t
he C
hina
sec
tion.
Cam
bod
iaC
ross
-b
ord
er
Eco
nom
ic
Zon
es
(CB
EZ
)
Con
stru
ctio
n of
P
hnom
Pen
h N
ew P
ort
Sp
ecia
l E
cono
mic
Zon
e
The
pro
ject
will
be
the
first
pac
kage
of d
evel
opm
ent
in t
he P
hnom
P
enh
New
Por
t S
pec
ial E
cono
mic
Zon
e (S
EZ
). It
will
invo
lve
an a
rea
of 1
43 h
ecta
res,
in w
hich
106
hec
tare
s (h
a) a
re fo
r lo
ng-t
erm
leas
e to
m
anuf
actu
rers
, 3.0
ha
for
apar
tmen
ts a
nd s
hop
s, 2
.7 h
a fo
r a
logi
stic
ce
nter
, and
the
rem
aini
ng a
rea
for
serv
ice
faci
litie
s.
The
pilo
t p
acka
ge is
inte
nded
to
ind
uce
furt
her
SE
Z d
evel
opm
ent
(mor
e th
an 6
00 h
a) t
o at
trac
t p
rivat
e se
ctor
inve
stm
ents
.
60.0
Sou
rce:
A
DB
, G
reat
er M
ekon
g S
ubre
gion
Reg
iona
l In
vest
men
t Fr
amew
ork
Imp
lem
enta
tion
Pla
n (2
014-
2018
) (h
ttp
://w
ww
.ad
b.o
rg/d
ocum
ents
/gm
s-re
gion
al-i
nves
tmen
t-fr
amew
ork-
imp
lem
enta
tion-
pla
n-20
14-2
018)
.
An
ne
x t
ab
le 4
.1.
Infr
astr
uctu
re c
on
ne
cti
vit
y:
se
lecte
d s
ub
reg
ion
al
(GM
S)
pro
jects
in
AS
EA
N (
co
nc
lud
ed
)

ASEAN INVESTMENT REPORT 2015: Infrastructure Investment and Connectivity
212
Goals/projects Objectives and strategies Sector Specific activities and impacts
Component 1: Development of priority infrastructure projects focusing on priority EAGA economic corridorsWest Borneo Economic Corridor
Pontianak Port (West Kalimantan, Indonesia) to Kuching Port (Sarawak, Malaysia)
The objective of developing this sub-corridor is to improve connectivity between Indonesia and Malaysia via the West Borneo Economic Corridor, which is expected to generate increased economic activity between West Kalimantan and Sarawak.
Transport - Port
Pontianak to Entikong Transport LinkThe two subprojects of the Link are: (i) Tayan–Serawak Road Rehabilitation, and (ii) Entikong Border Crossing Facility.
Tayan–Serawak Road. The improvement of the road from Pontianak to the Sarawak border shortens the route by 100 kilometer (km), in addition to substantial savings in vehicle operating costs and time.
Bandar Seri Begawan–Kota Kinabalu (Sabah, Malaysia) subcorridor [along the road through Limbang (Sarawak), Temburong (Brunei Darussalam) and Lawas (Sarawak) before reaching the State of Sabah near Sitipang]
The improvements along this route aims to facilitate travel which is currently complex, involving travel by road with two ferry crossings, four border crossings, and then eight controls at checkpoints (total travel time takes 4 and a half hours or up to 10 hours on weekend, school holidays, and festivities). The improvements involve constructing a new border crossing facility at Kuala Lurah that is compatible with the new border post-facility at Tedungan, Malaysia; and the construction of the Pandaruan Bridge to replace the two ferry crossings.
Transport and bridges
Kuala Lurah Border Crossing FacilityThe construction of the Kuala Lurah Border Crossing Facility will replace old facilities to make it compatible with the border facility at Tedungan. The new facility will provide significant time savings for road users, and improve connectivity in the subregion.
Pandaruan Bridge•ThePandaruanBridgewillimproveconnectivity
between Brunei Darussalam and Malaysia via the Trans Borneo Highway. The project involves the construction of a 60-meter bridge to replace the ferry over Pandaruan River.
Greater Sulu Sulawesi Corridor
Palawan (Philippines)–Sabah (Malaysia) Subcorridor
The objective of this subcorridor is to develop the capacity of Palawan ports to accommodate greater trade and passenger flow which are currently limited, and to develop a connection with Kudat in Sabah in the case of Brooke’s Point port. Kudat has the potential to become the gateway from southwestern Philippines with tourism being a driving force.
Transport - Ports
Palawan Ports Development ProgramThe objective of the project is to improve the ports in order to increase their capacity to handle BIMP-EAGA traffic in the future, and potentially to develop a connection with Kudat in Sabah, Malaysia.
The project involves rehabilitation and improvement of two ports, namely, Brooke’s Point and Puerto Princesa. Brooke’s Point is the second largest port in Palawan, while Puerto Princesa serves as the main port. Both ports serve as links to Sabah, Malaysia.
•Brooke’sPointPort.Therehabilitationoftheportwill involve repair of (i) RC Pier and Roll-on Roll-of (RoRo) Ramp; (ii) the Philippine Ports Authority (PPA) building; and (iii) RC Pier Approach. It includes four additional subprojects, namely: (i) relocation of existing breakwater, (ii) repair of passenger terminal building, (iii) expansion of TMO building; and (iv) widening of causeway and pier approach.
•ExpansionofPuertoPrincesaPort.Thisprojectwill involve the construction of a new 228-meter berth, warehouses, and passenger terminal. Puerto Princesa Port is being planned to serve as an alternative to Brooke’s Point Port. Currently, Puerto Princesa Port is experiencing increasing passenger traffic volumes.
Annex table 4.2. BIMP-EAGA: Enhanced connectivity (selected infrastructure projects), 2012–2016

ANNEXES
213
Goals/projects Objectives and strategies Sector Specific activities and impacts
Zamboanga Peninsula (Mindanao, Philippines)–Sabah (Malaysia) Subcorridor
Both Zamboanga and Davao provide connectivity in the Greater Sulu Sulawesi Sea, while Tawi-Tawi facilitates connectivity along the Zamboanga–Sabah subcorridor of BIMP-EAGA. Ports located in these provinces are key factors in maritime connectivity in the BIMP-EAGA subregion. Ports improvement in Zamboanga and Davao will be needed to address serious deficiencies in infrastructure and facilities that are hindering growth in traffic potential of the subcorridor.
Port Zamboanga Port Expansion (Philippines) — a component of Mindanao Ports Program IThe improvement of the port will first involve repaving the container marshalling area, and fixing the drainage system which has been damaged resulting in both surface and underground flooding. Second, a new ramp will also be constructed in the ferry basin, consisting of a standard fixed concrete ramp, and the ISPS container barrier will be replaced with a fence to address congestion. Last, the shoal will be removed to allow deeper drafted vessels to berth directly alongside the quay. The project is scheduled for 2011–2015.Davao Port Expansion (Phase 1)Phase 1 will involve constructing 113 meters of the 270-meter container berth. It will construct a new RoRo ramp and passenger terminal and associated works in order that the next component of the new quay extension can be constructed and that passenger and freight activities can be segregated.
Zamboanga Peninsula–Sabah Subcorridor through the island provinces in the Autonomous Region in Muslim Mindanao (ARMM)
Economic development of the island provinces in ARMM relies on improved connectivity with, on one side Zamboanga, and, on the other side, Sabah. This requires infrastructure improvements and rehabilitations at Jolo, Bongao, and Sitangkai since these serve as major local hubs for the region. The improvements will provide more reliable and frequent shipping services along the subcorridor.
Port Zamboanga Port Expansion (Philippines) — a component of Mindanao Ports Program IThe project includes the expansion of the back-up area and new berthing facilities after land reclamation for Bongao Port. For Sitangkai Port, the project will improve the berth space to accommodate larger cargo vessels; and provide a segregated stair handling for small wooden hulled vessels, a new passenger terminal, and a reconstructed causeway.
Davao–General Santos (Mindanao, Philippines)–North Sulawesi (Indonesia) Subcorridor
The objective of further developing this subcorridor is to establish proper synergy between Davao and General Santos, on one hand, and Manado and Bitung, on the other hand, for both shipping and air services. Developing connectivity among these four points will improvethe movement of goods and people along the subcorridor.
Port
Port
Port
Davao Port Expansion (Phase 2) (Philippines)—a component of Mindanao Ports Program IIThe project involves the (i) widening of RC wharf and installation of Quay Crane Rail; (ii) concrete paving of new back-up area; (iii) rehabilitating the passenger terminal building, allied facilities, and RoRo ramp; and (iv) expanding the north end of the port.General Santos Port (Makar Wharf) (Philippine)—a component of Mindanao Ports Program IIThe project involves (i) port expansion and reclamation with open storage (3.4 hectares), (ii) construction of a warehouse, (iii) installation of Quay Crane Rail, and (iv) construction of passenger terminal building. Projects are included in the approved Medium-Term Public Investment Program of PPA as new proposed projects.Glan Port Expansion Project—a component of Mindanao Ports Program IIThe project involves construction of a RoRo facility.
Manado-Bitung Link EnhancementThe project is located in North Sulawesi and is composed of two subprojects:(i) Manado Port Expansion, and (ii) Manado–Bitung Toll Road.
•TheManadoPortExpansioninvolvesthedevelopment of southern berth, central piers, and northern pier.
•TheManado–BitungTollRoadinvolvestheconstruction of a toll road between Manado and Bitung to improve synergy and economic growth.
Annex table 4.2. BIMP-EAGA: Enhanced connectivity (selected infrastructure projects), 2012–2016 (continued)

ASEAN INVESTMENT REPORT 2015: Infrastructure Investment and Connectivity
214
Goals/projects Objectives and strategies Sector Specific activities and impacts
Port and Road
Road
Davao–General Santos Toll Road RehabilitationThis project involves improvements and expansion of the ring road in General Santos to support the ports and bring the road up to international standard.
Rehabilitation of the Davao–Digos road segment will include conversion of the roads to four-lanes while the Digos–General Santos City road segment will include construction of climbing lanes at the three locations between Davao and General Santos City.
Other Priority Infrastructure Projects
Road Tanjung Selor Border Road (East Kalimantan, Indonesia)The project involves the construction of about 191 km of roads from Tanjung Selor to the Malaysian border.
Component 2: Improvement of Air, Sea and Land Transport Linkages
This component aims to strengthen transport links for a number of important routes through more effective implementation and expansion of connectivity measures.
The second component also aims to promote integrated sea linkages through better linkages between hub and feeder systems; and address the present lack of guidelines in the operations of non-conventional-sized ships (NCSSs).
Another objective of the component is to strengthen air linkages, including outside the BIMP-EAGA subregion.
Component 3: Power Interconnection and development of renewable energy
Development of the Sarawak Subcorridor
One of the major economic development initiatives that has been launched in this segment is the Sarawak Corridor of Renewable Energy (SCORE) project1 located in the central region of Sarawak covering 57% of the state or 70,700 square kilometers. This major 20- to 30-year development scheme is built around energy-intensive industry investments to provide a triggering effect, and form the early anchor for an advanced base of industrial development.
Electricity Trans Borneo Power Grid: Sarawak–West Kalimantan Power Interconnection
The project involves construction of a 275 kilo-volt (kV) transmission line that will allow low-cost electricity generated by hydropower plants in Sarawak to be exported to West Kalimantan, where the entire power generation is based on oil. The power generation capacity in Sarawak is expected to be more than doubled by 2013 as new hydropower plants [3,500 megawatts (MW)] are commissioned.
The Term Sheet for Power Exchange Agreement (PEA) to enable the export of bulk electricity from Sarawak to West Kalimantan was signed on 18 July 2011 between Sarawak Energy Berhad (SEB) and the Indonesian power utility PT PLN PESERO (PLN).
Annex table 4.2. BIMP-EAGA: Enhanced connectivity (selected infrastructure projects), 2012–2016 (continued)

ANNEXES
215
Goals/projects Objectives and strategies Sector Specific activities and impactsComponent 4: Improvements in ICT facilities and services
As a means to narrow the digital divide, information communication technology (ICT) literacy of the people in the subregion will be promoted, especially those in the rural areas.
ICT ICT Rural Outreach Program (iROP)
The ICT rural outreach program (iROP) caters to the rural community aimed at improving the ICT literacy of the people, especially those in the rural areas. It includes the setting up of an ICT community center, undertaking human capacity ICT literacy and entrepreneur development, and establishing a portal for local products to be marketed regionally.
iROP also provides employment opportunities in the rural areas and serves as a portal for marketing local products and services, which will contribute to the economic growth of BIMP-EAGA.
The project is led by the private sector, the Infocom Federation Brunei (IFB). A similar project will be introduced by EA Trilink of the Philippines.
•Thepilotprojectof iROPhasbeen implementedsuccessfully in Bangar Mukim of Temburong District. The first phase of the project includes the setting up of a one-stop community center for training of candidate users, to be followed by a second phase which will involve the development of the iROP framework content.
ICT connectivity in BIMP-EAGA needs to be developed further to enhance the subregion’s attraction as an investment hub. Enhanced ICT connectivity can also positively impact on other priority subsectors, including supply chain development and ecotourism.
ICT BIMP-EAGA Rink (BIMP-EAGA Submarine Cable)
The project will link all BIMP-EAGA member countries using a Hybrid Communications Platform either through sub-sea cable, satellite, or terrestrial systems. The project, which is estimated to cost $150 million, has a potential high impact to support the various priority initiatives under the BIMP-EAGA, specifically ecotourism, and can also potentially contribute to the planned establishment of the ASEAN Broadband Corridor under the Master Plan of ASEAN Connectivity.
The implementation of this project can address the digital divide and can positively influence telecommunication tariffs to make BIMP-EAGA a more conducive and competitive region for food basket chain link and ecotourism.
Source: BIMP-EAGA Implementation Blueprint, March 2012 (http://bimp-eaga.org/Documents/ef4b1b8e-7291-40a5-9a0a-2d0250543801.pdf)
1 The project was officially launched in February 2008 in Bintulu by the Prime Minister of Malaysia. SCORE is basically a private-sector-driven project with an estimated cost of RM334 billion.
Annex table 4.2. BIMP-EAGA: Enhanced connectivity (selected infrastructure projects), 2012–2016 (concluded)


one visionone identity
one community
ASEAN Investment Report
2015Infrastructure Investment and Connectivity
Association of S
outheast Asian N
ationsA
SE
AN
INV
ES
TM
EN
T R
EP
OR
T 2015: ASEAN
: @ASEAN
: www.asean.org
www.unctad.org
Invest in ASEAN