Assets Heath Indexing Model. Implementation in a Process...
30
Assets Heath Indexing Model. Implementation in a Process Pumps Fleet. Adolfo Crespo Márquez Full Prof. of Industrial management . University of Seville. Spain President of INGEMAN
Transcript of Assets Heath Indexing Model. Implementation in a Process...
Assets Heath Indexing Model. Implementation in a Process Pumps Fleet.
Adolfo Crespo MárquezFull Prof. of Industrial management . University of Seville. Spain
President of INGEMAN
Content
1. Concept of Asset Health Index
2. Requirements for the AHI method and model
3. Conceptual basis
4. Review of relevant international models
5. Spanish Network AHI Model
6. Implementation
The Concept
Phase 1:Definition of the
maintenance objectives and
KPI’s
Phase 2:Assets priority
and maintenance strategy definition
Phase 3:Immediate
intervention on high impact
weak points
Phase 4:Design of
the preventive maintenance
plans and resources
Phase 5:Preventive plan,
scheduleand resourcesoptimization
Phase 7:Asset life cycle
analysis and replacement
optimization
Phase 6:Maintenance
executionassessment and control
Phase 8:Continuous
Improvement and new
techniquesutilization
Assessment Efficiency
Effectiveness
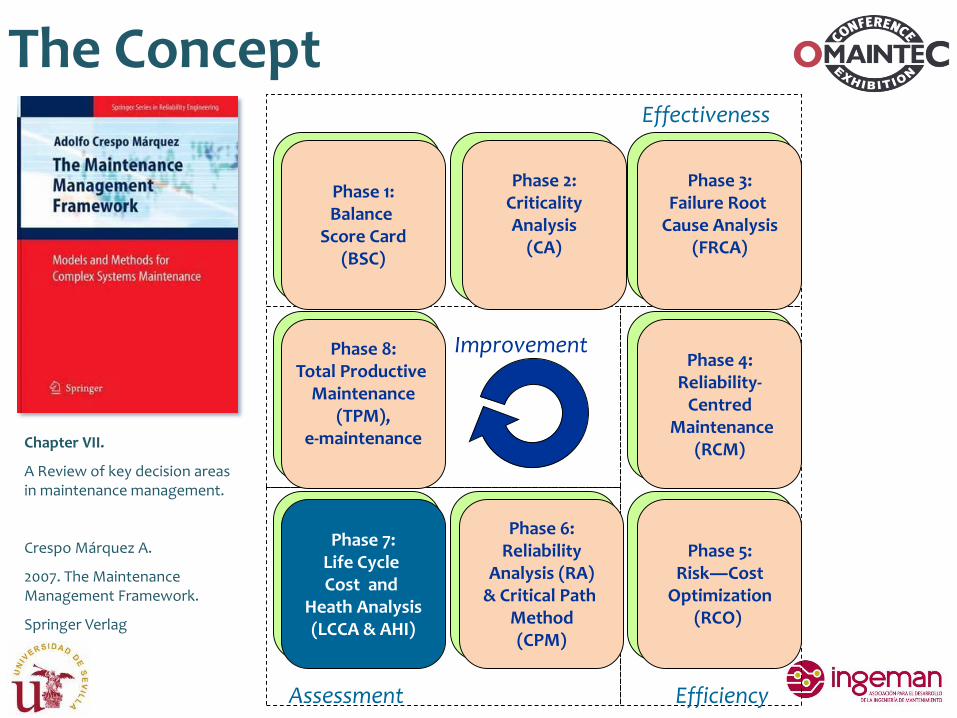
Chapter VII.
A Review of key decision areas in maintenance management.
Crespo Márquez A.
2007. The Maintenance Management Framework.
Springer Verlag
Improvement
Phase 1:Balance
Score Card(BSC)
Phase 2:CriticalityAnalysis
(CA)
Phase 3:Failure Root
Cause Analysis(FRCA)
Phase 4:Reliability-
CentredMaintenance
(RCM)
Phase 5:Risk―Cost
Optimization(RCO)
Phase 7:Life Cycle Cost and
Heath Analysis(LCCA & AHI)
Phase 6:Reliability
Analysis (RA)& Critical Path
Method(CPM)
Phase 8:Total Productive
Maintenance(TPM),
e-maintenance
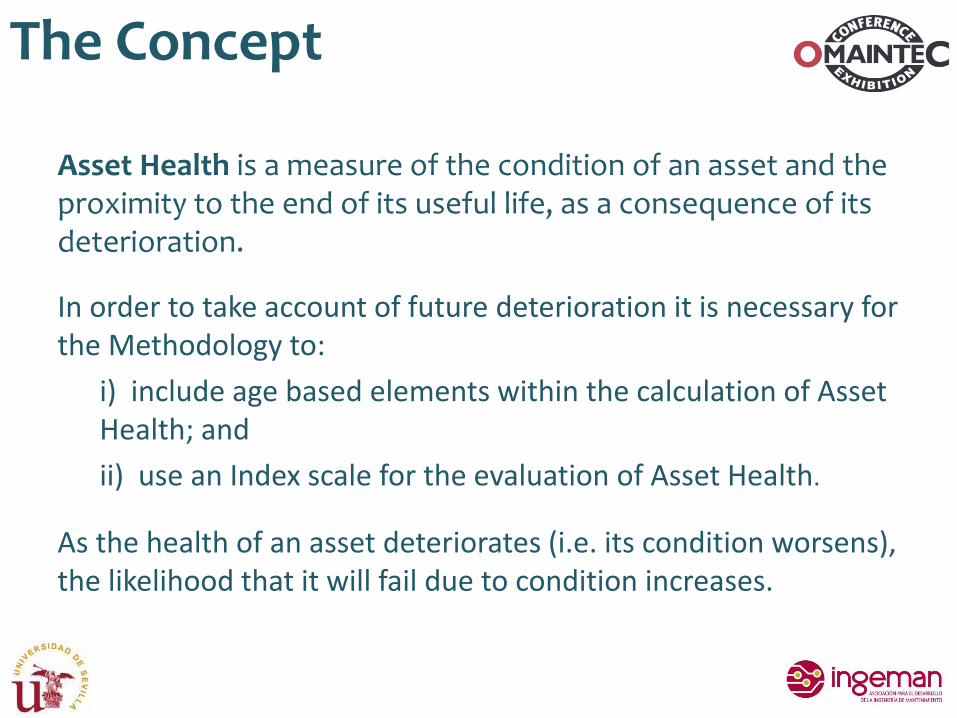
Asset Health is a measure of the condition of an asset and the proximity to the end of its useful life, as a consequence of its deterioration.
In order to take account of future deterioration it is necessary for the Methodology to:
i) include age based elements within the calculation of Asset Health; and
ii) use an Index scale for the evaluation of Asset Health.
As the health of an asset deteriorates (i.e. its condition worsens), the likelihood that it will fail due to condition increases.
The Concept

It is important to understand the differences between the study of functional failures and corrective maintenance versus long-term asset degradation and asset replacement.
Functional failures are associated with failure modes in the ancillary systems that affect operation and reliability of the asset well before its end-of-life.
These failures do not normally affect the life of the asset itself, if detected early and corrected. Defects are routinely identified during inspection and dealt with by corrective maintenance activities to ensure continued operation of the asset.
The Concept
Long-term degradation is generally less well defined and it is not easily determined by routine inspections.
The purpose of asset health assessment is to detect and quantify long-term degradation and to provide a means of quantifying remaining asset life.
This includes identifying assets that are at or near end-of-life and assets that are at high risk of generalized failure that will require major capital expenditures to either refurbish or replace the assets.
The Concept
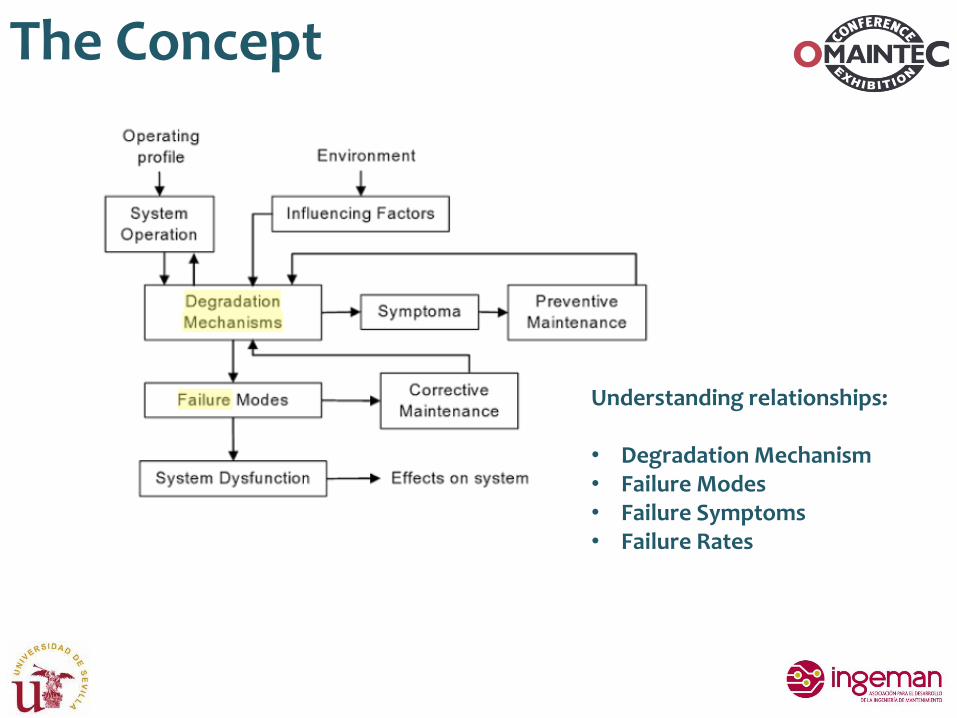
Understanding relationships:
• Degradation Mechanism• Failure Modes• Failure Symptoms• Failure Rates
Base conceptualThe Concept
The Concept
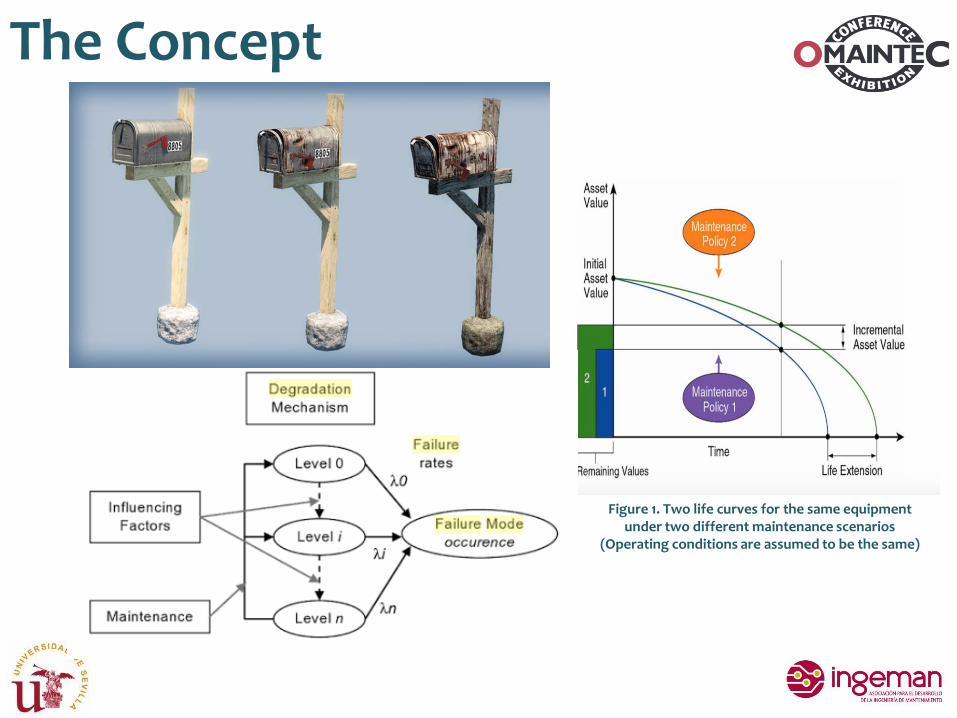
Figure 1. Two life curves for the same equipment under two different maintenance scenarios
(Operating conditions are assumed to be the same)
The Concept
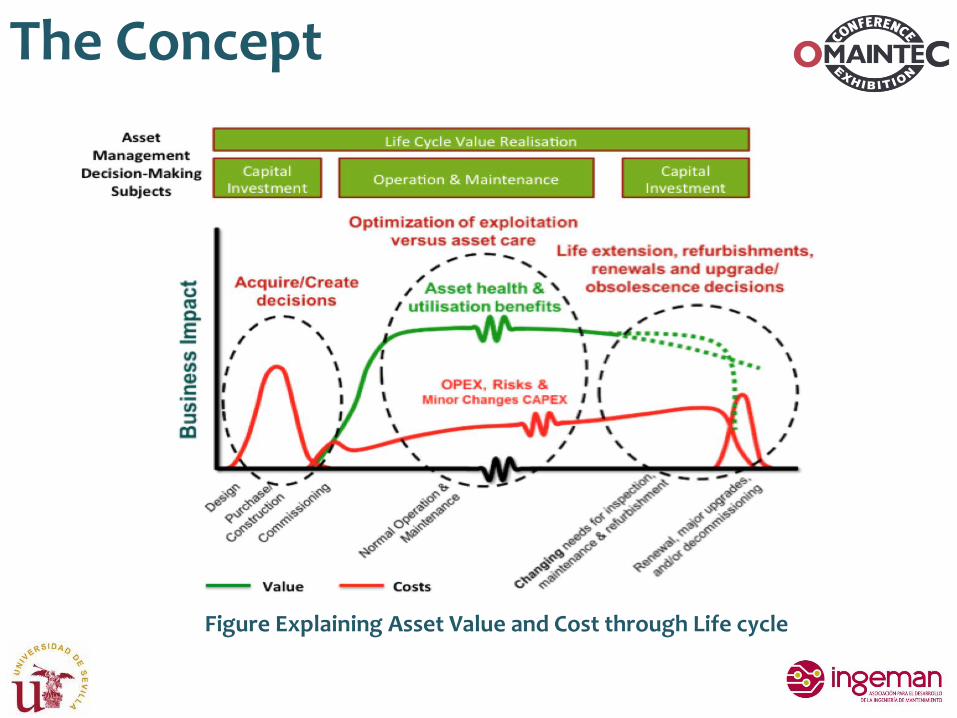
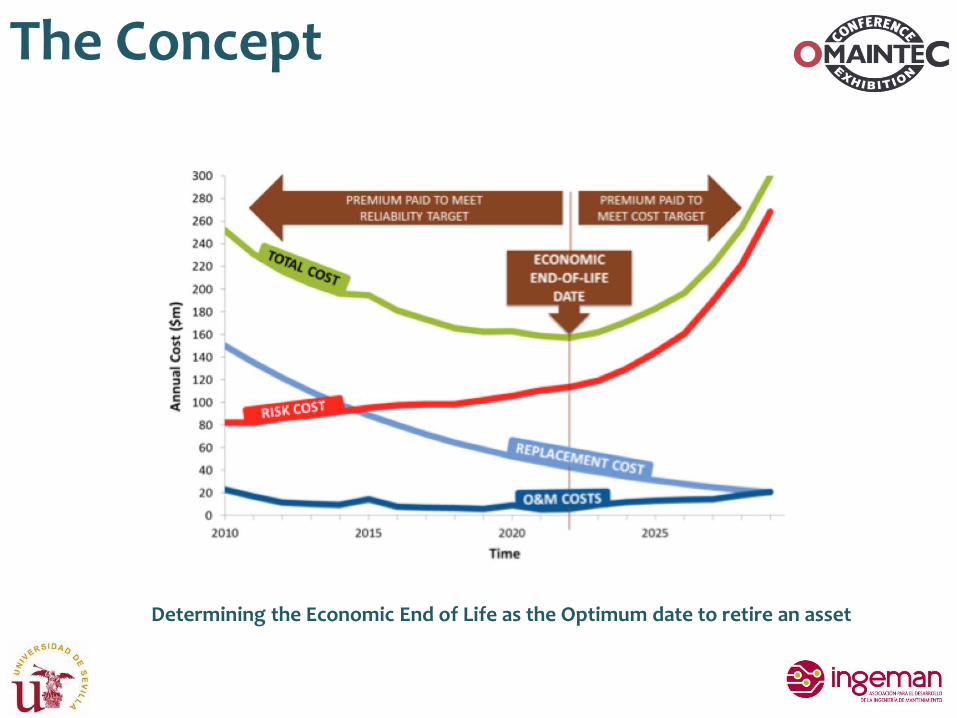
Figure Explaining Asset Value and Cost through Life cycle

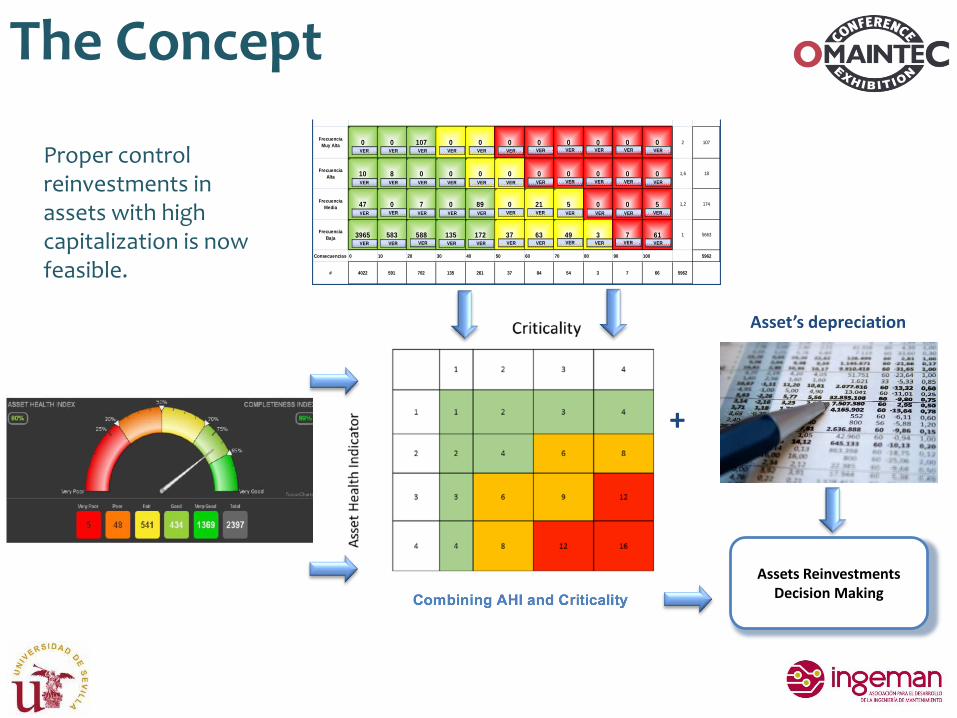
In the Spanish gas network the Network Asset Indices comprise two components:
i. Criticality Index - which relates to Consequences of Failure (risk); and
ii. Health Index - which relates to Asset Health and Probability of Failure;
The Concept

The ConceptCommon practice for maintenance and assets management excellence
#
Frecuencia
Muy Alta 0 0 107 0 0 0 0 0 0 0 0 2 107
Frecuencia
Alta 10 8 0 0 0 0 0 0 0 0 0 1,6 18
Frecuencia
Media 47 0 7 0 89 0 21 5 0 0 5 1,2 174
Frecuencia
Baja 3965 583 588 135 172 37 63 49 3 7 61 1 5663
Consecuencias 0 10 20 30 40 50 60 70 80 90 100 5962
# 4022 591 702 135 261 37 84 54 3 7 66 5962
MATRIZ DE CRITICIDAD AASS SERRABLO
VER VER
VER VER VER
VER VER
VER VER VER VER VER VER VER VER
VER VER VER VER VER VER VER
VER VER VER VER VER VER VER VER VER VER VER
VER VER VER VER VER VER VER VER VER VER VER
Asset’s depreciation
+
Assets ReinvestmentsDecision Making
Proper control reinvestments in assets with high capitalization is now feasible.
The Concept
The Concept
Determining the Economic End of Life as the Optimum date to retire an asset
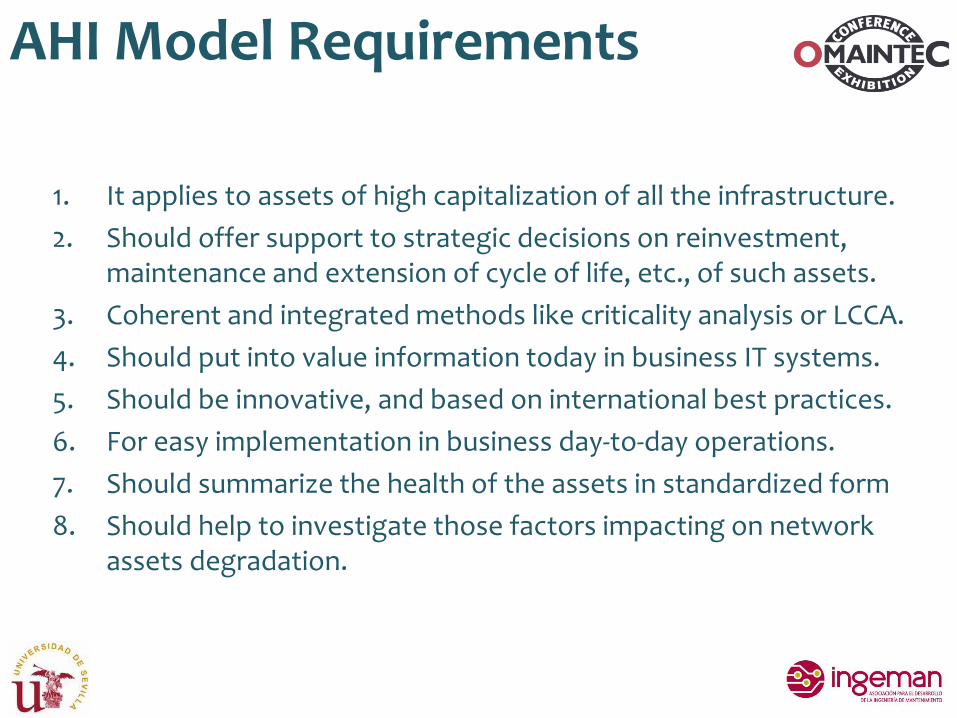
1. It applies to assets of high capitalization of all the infrastructure.
2. Should offer support to strategic decisions on reinvestment, maintenance and extension of cycle of life, etc., of such assets.
3. Coherent and integrated methods like criticality analysis or LCCA.
4. Should put into value information today in business IT systems.
5. Should be innovative, and based on international best practices.
6. For easy implementation in business day-to-day operations.
7. Should summarize the health of the assets in standardized form
8. Should help to investigate those factors impacting on network assets degradation.
AHI Model Requirements

In the simplest case a generic AHI model contains:
• Details of the condition of the asset (Data).• Data is processed with a function resulting scores.• These scores are weighted relatively together, and• They are summarized to calculate the AHI.
Base conceptualRelevant Models
Relevant Models
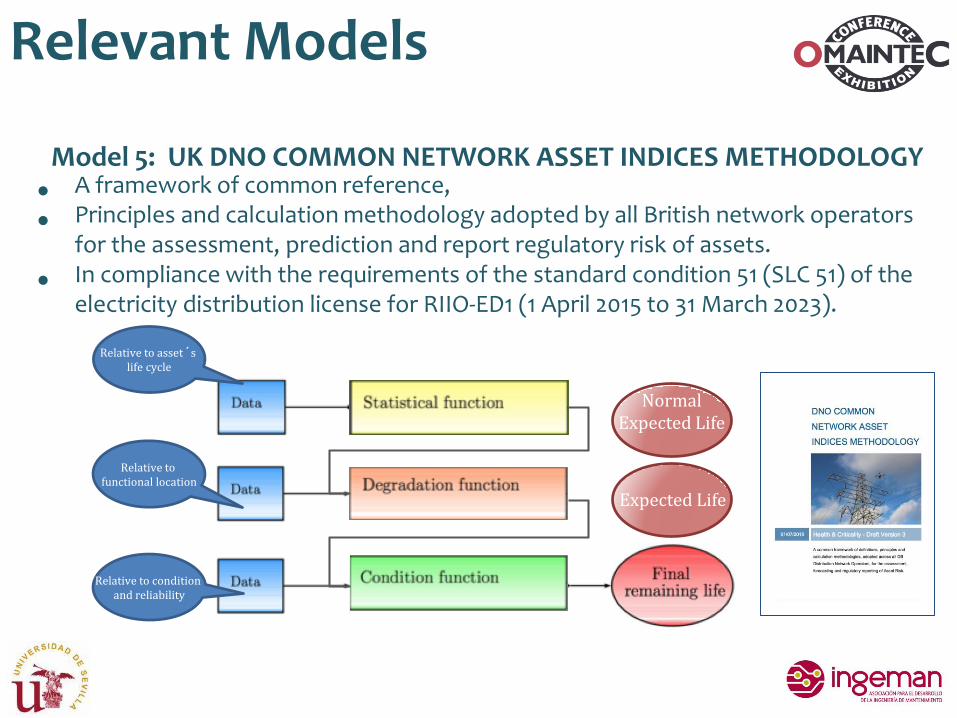
Normal Expected Life
Expected Life
Relative to asset´s life cycle
Relative to functional location
Relative to condition and reliability
Model 5: UK DNO COMMON NETWORK ASSET INDICES METHODOLOGY
• A framework of common reference,
• Principles and calculation methodology adopted by all British network operators for the assessment, prediction and report regulatory risk of assets.
• In compliance with the requirements of the standard condition 51 (SLC 51) of the electricity distribution license for RIIO-ED1 (1 April 2015 to 31 March 2023).

Spanish Network AHI Model
Normal Expected Life
Expected Life
Concerning the Condition and
reliability of the asset. It causes irreversible
deterioration
• Departs from model of the UK DNO • Reorders the introduction of data in degradation and condition models• Considers the impact of changes in Functional Locations duty• Changes in the condition of the equipment only accelerate its deterioration • Distinction is made between indications or evidence on the health of the assets
is changing calculation algorithms
Real Operational data of FL
Change to adjust real degradation
Model changes to include generic calculation rules
Relative to asset´s life cycle
Relative to functional location
Categoría de equipo
Sub-categoria de equipo
Edad
Vida Normal esperada
Categoría de equipo
Vida normal esperada
(Contable)
Vida Esperada
Factores de localización
Factores de operación
Tasa de envejecimiento
Salud inicial del activo
Salud actual del activo
Modificador de la Salud
Modificador de la fiabilidad
1
2
3
4
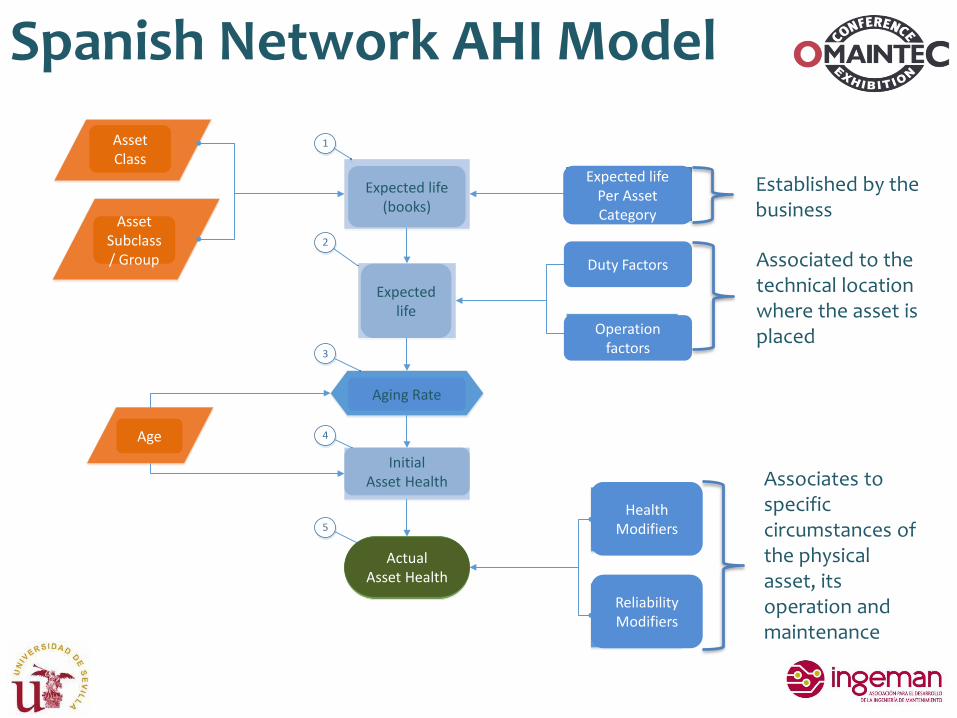
5
Associated to the technical location where the asset is placed
Associates to specific circumstances of the physical asset, its operation and maintenance
Established by the business
Spanish Network AHI Model
Asset Class
AssetSubclass/ Group
Expected life(books)
Expected life
Aging Rate
InitialAsset Health
Age
ActualAsset Health
Expected lifePer Asset Category
Duty Factors
Operation factors
HealthModifiers
ReliabilityModifiers
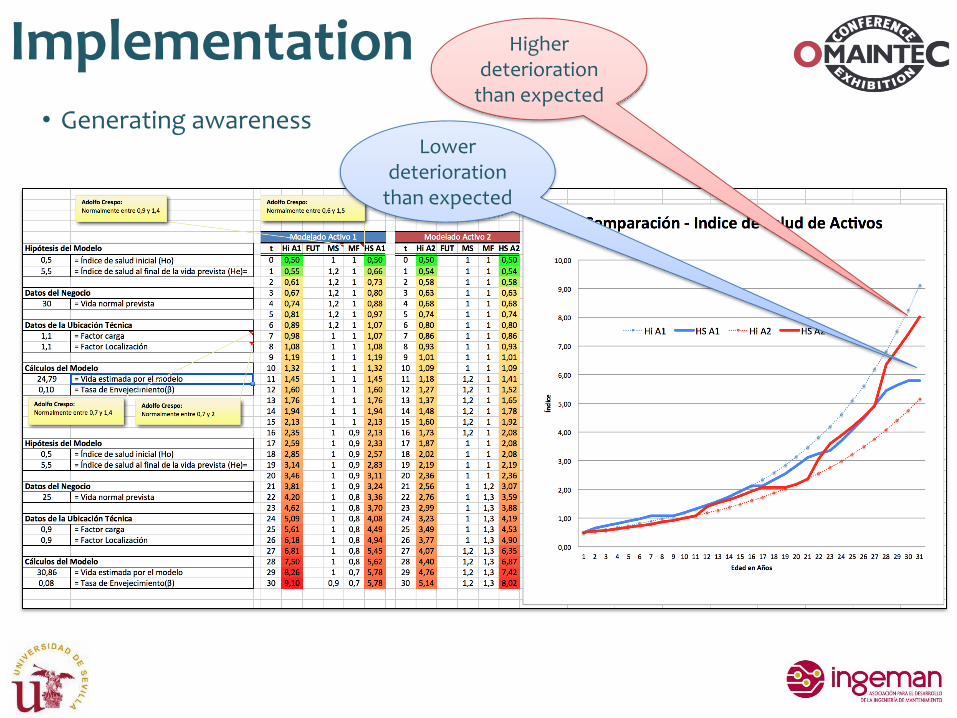
Implementation• Generating awareness
Higherdeterioration
than expected
Lowerdeterioration
than expected

Spanish Network AHI Model
• Relationship between the asset’s health (AHI or HI) and the Probability of Failure (PoF).
Implementation
21
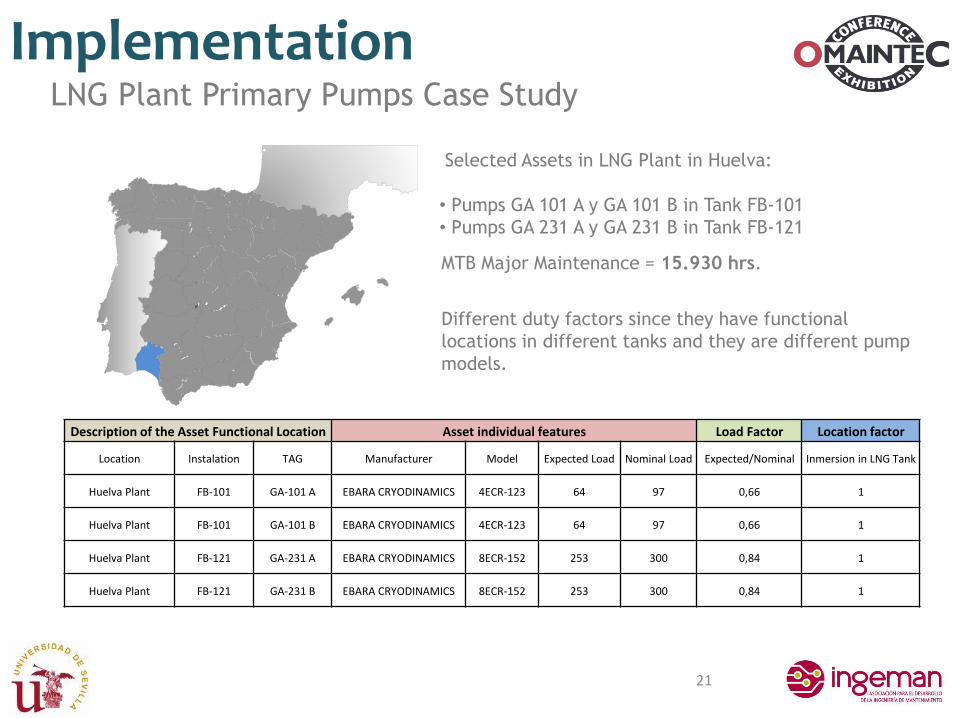
LNG Plant Primary Pumps Case Study
Selected Assets in LNG Plant in Huelva:
• Pumps GA 101 A y GA 101 B in Tank FB-101
• Pumps GA 231 A y GA 231 B in Tank FB-121
Different duty factors since they have functional
locations in different tanks and they are different pump
models.
Description of the Asset Functional Location Asset individual features Load Factor Location factor
Location Instalation TAG Manufacturer Model Expected Load Nominal Load Expected/Nominal Inmersion in LNG Tank
Huelva Plant FB-101 GA-101 A EBARA CRYODINAMICS 4ECR-123 64 97 0,66 1
Huelva Plant FB-101 GA-101 B EBARA CRYODINAMICS 4ECR-123 64 97 0,66 1
Huelva Plant FB-121 GA-231 A EBARA CRYODINAMICS 8ECR-152 253 300 0,84 1
Huelva Plant FB-121 GA-231 B EBARA CRYODINAMICS 8ECR-152 253 300 0,84 1
MTB Major Maintenance = 15.930 hrs.

Implementation
22
Pumps data compilation & input to the model
1. Manufacturer specifications:
• Recommended pump flow ranges for expected operation y selected location
• Recommended operation temperature.
2. Warning and Alarm levels in the plant control system :
• For operation temperature ranges.
• Warning and shutdown levels in LNG Tanks.
3. Data coming from the business “health matrix” information:
• Equipment operating time.
• Operating time since last major maintenance.
• Nº of pump Start-Ups.
4. Equipment Hr-meter:
• Nº of major maintenance.
5. PI extracted data:
• Evolution of Variables: flow, impulsion temperature, tank level, power & hrs.
Implementation
23
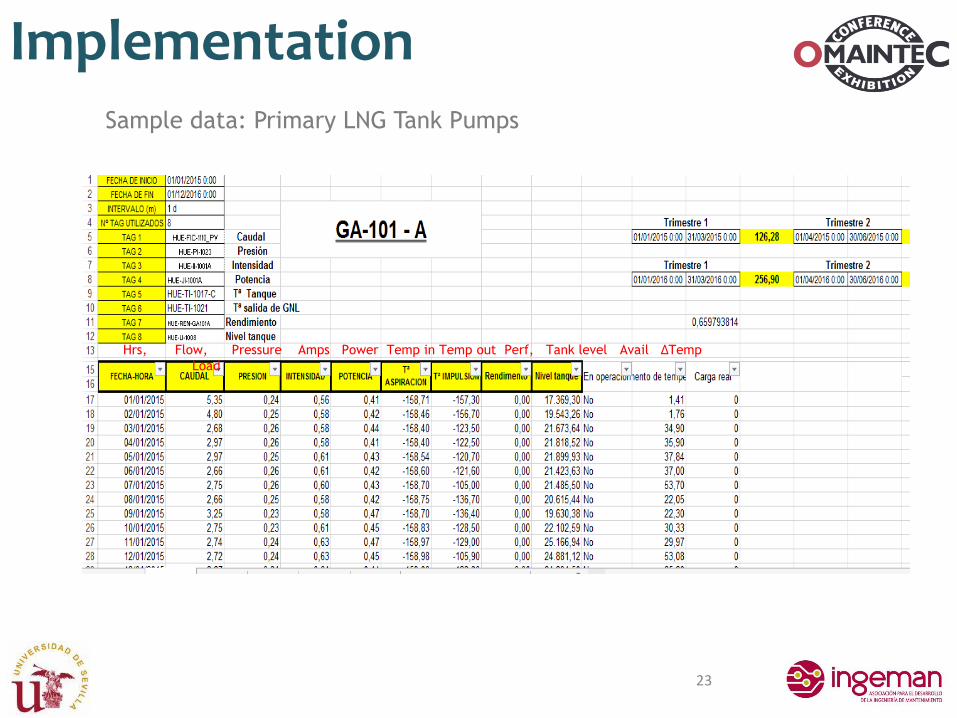
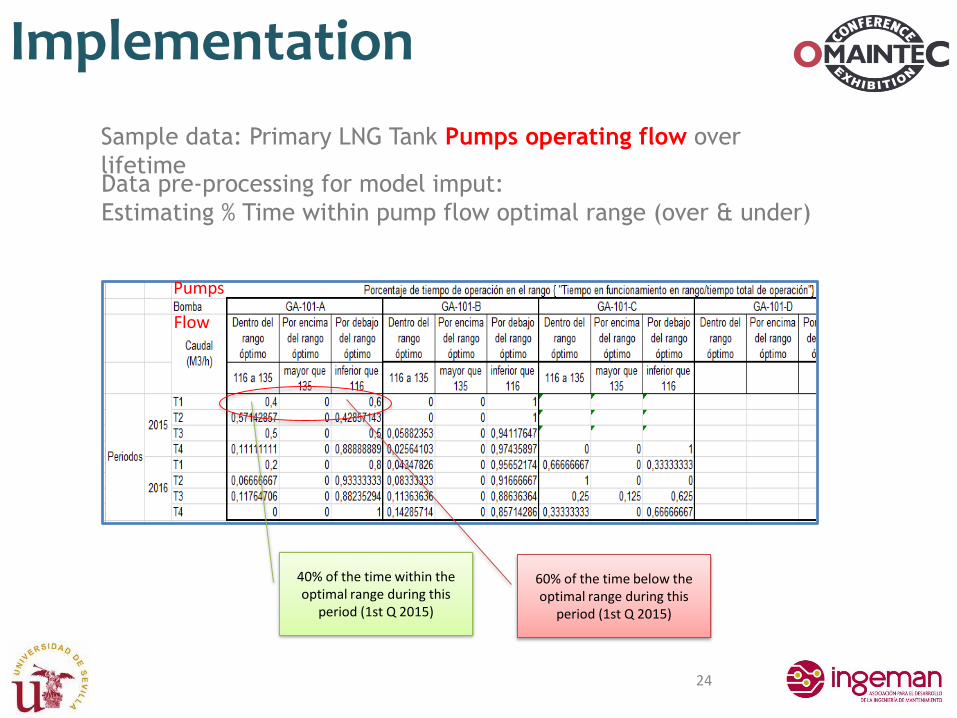
Sample data: Primary LNG Tank Pumps
Hrs, Flow, Pressure Amps Power Temp in Temp out Perf, Tank level Avail ΔTemp
Load
24
Data pre-processing for model imput:
Estimating % Time within pump flow optimal range (over & under)
Implementation
Sample data: Primary LNG Tank Pumps operating flow over
lifetime
40% of the time within the optimal range during this
period (1st Q 2015)
60% of the time below the optimal range during this
period (1st Q 2015)
Flow
Pumps

25
I Health Modifiers Reliability Modifiers
Periods:(Year/Quarter)
FLOW[1-1,4]
INTAKETEMPERATURE
[1-1,4]
INCREMENT inTEMPERATURE
[1-1,5]
TANK LEVEL[1-1,2]
Nº START-UPS
[1-1,5]
NO ACTIVITY[1-1,1]
MANUFACTURER
[0,95-1,05]
MAJORMAINTENANCES
[1-1,1]
2015
T1 1,24 1,00 1,00 1,00 1,10 1,10 0,95 1,10
T2 1,17 1,00 1,00 1,00 1,10 1,10 0,95 1,10
T3 1,20 1,00 1,00 1,00 1,10 1,10 0,95 1,10
T4 1,36 1,00 1,00 1,00 1,10 1,10 0,95 1,10
2016
T1 1,32 1,00 1,00 1,00 1,10 1,10 0,95 1,10
T2 1,37 1,00 1,00 1,00 1,10 1,10 0,95 1,10
T3 1,35 1,00 1,00 1,00 1,10 1,10 0,95 1,10
T4 1,40 1,00 1,00 1,00 1,10 1,10 0,95 1,10
Full data prepared for model input:
Estimating impact/weight intervals of each health modifier over time
ImplementationSample data: Primary LNG Tank Pumps
Flow without optimal limits may have a weight of [1-1.4]
as impact on asset degradation over time
Low tank level may have a weight of [1-1.2] as impact on asset degradation over
time. Half the impact of wrong flow.
Number of major maintenances has a weight of [1-1.1] as impact on asset degradation over time. 25% the impact of wrong flow.
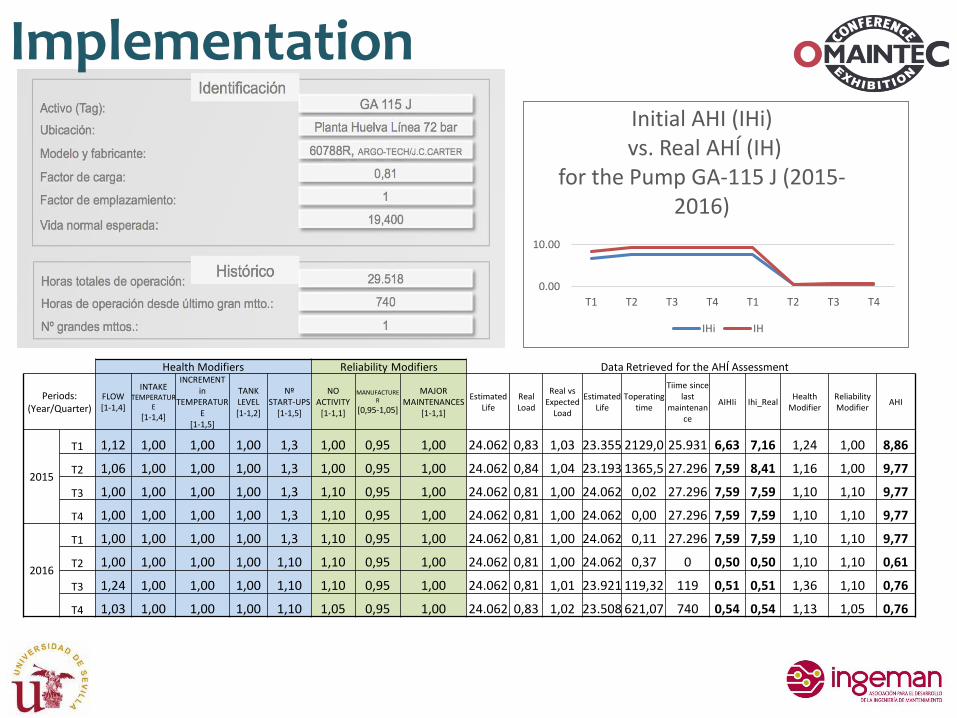
Health Modifiers Reliability Modifiers Data Retrieved for the AHÍ Assessment
Periods: (Year/Quarter)
FLOW[1-1,4]
INTAKETEMPERATUR
E
[1-1,4]
INCREMENT in
TEMPERATURE
[1-1,5]
TANK LEVEL[1-1,2]
Nº START-UPS
[1-1,5]
NO ACTIVITY
[1-1,1]
MANUFACTURER
[0,95-1,05]
MAJORMAINTENANCES
[1-1,1]
Estimated Life
Real Load
Real vsExpected
Load
Estimated Life
Toperatingtime
Tiime since last
maintenance
AIHIi Ihi_RealHealth
ModifierReliability Modifier
AHI
2015
T1 1,12 1,00 1,00 1,00 1,3 1,00 0,95 1,00 24.062 0,83 1,03 23.355 2129,0 25.931 6,63 7,16 1,24 1,00 8,86
T2 1,06 1,00 1,00 1,00 1,3 1,00 0,95 1,00 24.062 0,84 1,04 23.193 1365,5 27.296 7,59 8,41 1,16 1,00 9,77
T3 1,00 1,00 1,00 1,00 1,3 1,10 0,95 1,00 24.062 0,81 1,00 24.062 0,02 27.296 7,59 7,59 1,10 1,10 9,77
T4 1,00 1,00 1,00 1,00 1,3 1,10 0,95 1,00 24.062 0,81 1,00 24.062 0,00 27.296 7,59 7,59 1,10 1,10 9,77
2016
T1 1,00 1,00 1,00 1,00 1,3 1,10 0,95 1,00 24.062 0,81 1,00 24.062 0,11 27.296 7,59 7,59 1,10 1,10 9,77
T2 1,00 1,00 1,00 1,00 1,10 1,10 0,95 1,00 24.062 0,81 1,00 24.062 0,37 0 0,50 0,50 1,10 1,10 0,61
T3 1,24 1,00 1,00 1,00 1,10 1,10 0,95 1,00 24.062 0,81 1,01 23.921 119,32 119 0,51 0,51 1,36 1,10 0,76
T4 1,03 1,00 1,00 1,00 1,10 1,05 0,95 1,00 24.062 0,83 1,02 23.508 621,07 740 0,54 0,54 1,13 1,05 0,76
0.00
10.00
T1 T2 T3 T4 T1 T2 T3 T4
Initial AHI (IHi)vs. Real AHÍ (IH)
for the Pump GA-115 J (2015-2016)
IHi IH
Implementation
27
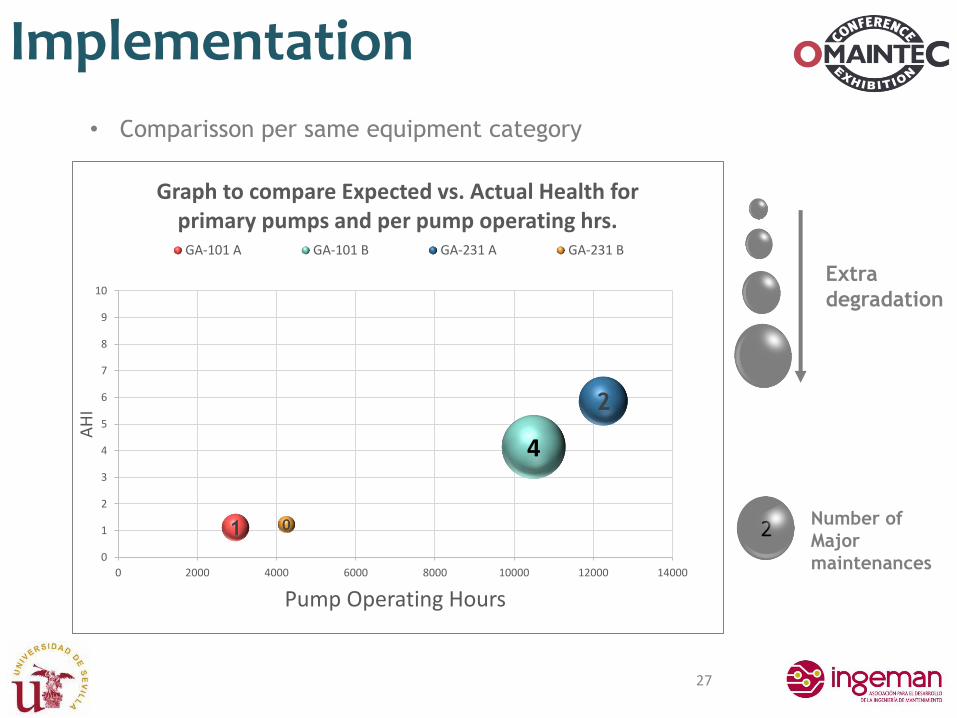
• Comparisson per same equipment category
1
4
2
0
0
1
2
3
4
5
6
7
8
9
10
0 2000 4000 6000 8000 10000 12000 14000
AH
I
Pump Operating Hours
Graph to compare Expected vs. Actual Health for primary pumps and per pump operating hrs.
GA-101 A GA-101 B GA-231 A GA-231 B
Extra
degradation
2 Number of
Major
maintenances
Implementation

Implementation
• Global Comparison for all equipment

New book release in Arabic:
Celebrating
a 6 years of Partnership
2012-2017 ✔
Thanks