
Assessment Run H13 2018 HER2 (BRISH or FISH) · Nordic Immunohistochemical Quality Control, HER2...
9
Nordic Immunohistochemical Quality Control, HER2 ISH run H13 2018 Page 1 of 9 Assessment Run H13 2018 HER2 (BRISH or FISH) Material Table 1. Content of the multi-block used for the NordiQC HER2 ISH assessment, run H13 HER2 IHC* Dual - SISH** FISH*** FISH*** IHC score HER2/chr17 ratio¤ HER2/chr17 ratio¤ HER2 copies 1. Breast carcinoma 0 0.8 0.8 – 1.0 < 4 2. Breast carcinoma 2+ 1.1 1.0 – 1.2 ≥ 4 and < 6 3. Breast carcinoma Core no. 3 was not assessed in run H13, due to suboptimal tissue quality. 4. Breast carcinoma 2+ 2.3 2.8 – 3.3 > 6 5. Breast carcinoma 3+ 8.0 6.5 – 8.5 > 6 * PATHWAY ® (Ventana/Roche), data from two reference labs. ** Inform HER2 Dual ISH kit (Ventana/Roche), range of data from one reference lab. *** HER2 FISH (Zytovision), range of data from one reference lab. ¤HER2/chr17: HER2 gene/chromosome 17 ratio All tissues were fixed for 24-48 hours in 10% neutral buffered formalin according to the ASCO/CAP 2013 guidelines for tissue preparation of breast tissue for HER2 ISH analysis. Unfortunately, many laboratories reported technical problems with core no. 3. Both lifting of tissue and poor morphology were reported. Consequently, core no. 3 was, as previously communicated to the participating laboratories, excluded from the current HER2 ISH assessment, Run H13. HER2 BRISH, Technical assessment The main criteria for assessing a BRISH HER2 analysis as technically optimal were the ability to interpret the signals and thus evaluate the HER2/chr17 ratios in all four tissues. Staining was assessed as good, if the HER2/chr17 ratios could be evaluated in all four tissues, but the interpretation was slightly compromised e.g. due to excessive retrieval, weak or excessive counterstaining or focal negative areas. Staining was assessed as borderline if one of the tissues could not be evaluated properly e.g. due to weak signals, large negative areas with no signals (> 25% of the core) or a low signal-to-noise ratio due to excessive background staining. Staining was assessed as poor if two or more of the tissue cores could not be evaluated properly e.g. due to weak signals, large negative areas with no signals (> 25% of the core) or a low signal-to-noise ratio due to excessive background staining. HER2 BRISH and FISH interpretation For both BRISH and FISH, participating laboratories were asked to submit a scoring sheet with their interpretation of the HER2/chr17 ratio. Results were compared to NordiQC FISH data from reference laboratories to analyze scoring consensus. Consensus scores from the NordiQC FISH reference laboratories Breast ductal carcinomas, no. 1: non-amplified Breast ductal carcinomas, no. 2: non-amplified or equivocal Breast ductal carcinoma no. 4 and 5: amplified Breast ductal carcinoma no. 3: not assessed The ASCO/CAP 2013 guidelines were applied for the interpretation of the HER2 status Unamplified: HER2/chr17 ratio < 2.0 using a dual probe assay or an average < 4 HER2 gene copies per cell/nucleus (both dual and single probe assay)
-
Upload
trinhthuan -
Category
Documents
-
view
214 -
download
0
Transcript of Assessment Run H13 2018 HER2 (BRISH or FISH) · Nordic Immunohistochemical Quality Control, HER2...

Nordic Immunohistochemical Quality Control, HER2 ISH run H13 2018 Page 1 of 9
Assessment Run H13 2018
HER2 (BRISH or FISH) Material Table 1. Content of the multi-block used for the NordiQC HER2 ISH assessment, run H13
HER2 IHC*
Dual - SISH** FISH*** FISH***
IHC
score HER2/chr17
ratio¤ HER2/chr17
ratio¤ HER2 copies
1. Breast carcinoma 0 0.8 0.8 – 1.0 < 4
2. Breast carcinoma 2+ 1.1 1.0 – 1.2 ≥ 4 and < 6
3. Breast carcinoma Core no. 3 was not assessed in run H13, due to suboptimal tissue
quality.
4. Breast carcinoma 2+ 2.3 2.8 – 3.3 > 6
5. Breast carcinoma 3+ 8.0 6.5 – 8.5 > 6
* PATHWAY® (Ventana/Roche), data from two reference labs.
** Inform HER2 Dual ISH kit (Ventana/Roche), range of data from one reference lab.
*** HER2 FISH (Zytovision), range of data from one reference lab.
¤HER2/chr17: HER2 gene/chromosome 17 ratio
All tissues were fixed for 24-48 hours in 10% neutral buffered formalin according to the ASCO/CAP 2013 guidelines for tissue preparation of breast tissue for HER2 ISH analysis. Unfortunately, many laboratories reported technical problems with core no. 3. Both lifting of tissue and poor morphology were reported. Consequently, core no. 3 was, as previously communicated to the participating laboratories, excluded from the current HER2 ISH assessment, Run H13.
HER2 BRISH, Technical assessment The main criteria for assessing a BRISH HER2 analysis as technically optimal were the ability to interpret the signals and thus evaluate the HER2/chr17 ratios in all four tissues.
Staining was assessed as good, if the HER2/chr17 ratios could be evaluated in all four tissues, but the
interpretation was slightly compromised e.g. due to excessive retrieval, weak or excessive counterstaining or focal negative areas.
Staining was assessed as borderline if one of the tissues could not be evaluated properly e.g. due to
weak signals, large negative areas with no signals (> 25% of the core) or a low signal-to-noise ratio due to excessive background staining.
Staining was assessed as poor if two or more of the tissue cores could not be evaluated properly e.g. due
to weak signals, large negative areas with no signals (> 25% of the core) or a low signal-to-noise ratio due to excessive background staining.
HER2 BRISH and FISH interpretation
For both BRISH and FISH, participating laboratories were asked to submit a scoring sheet with their interpretation of the HER2/chr17 ratio. Results were compared to NordiQC FISH data from reference laboratories to analyze scoring consensus.
Consensus scores from the NordiQC FISH reference laboratories
Breast ductal carcinomas, no. 1: non-amplified
Breast ductal carcinomas, no. 2: non-amplified or equivocal
Breast ductal carcinoma no. 4 and 5: amplified
Breast ductal carcinoma no. 3: not assessed
The ASCO/CAP 2013 guidelines were applied for the interpretation of the HER2 status
Unamplified: HER2/chr17 ratio < 2.0 using a dual probe assay or an average < 4 HER2 gene copies per cell/nucleus (both dual and single probe assay)
Nordic Immunohistochemical Quality Control, HER2 ISH run H13 2018 Page 2 of 9
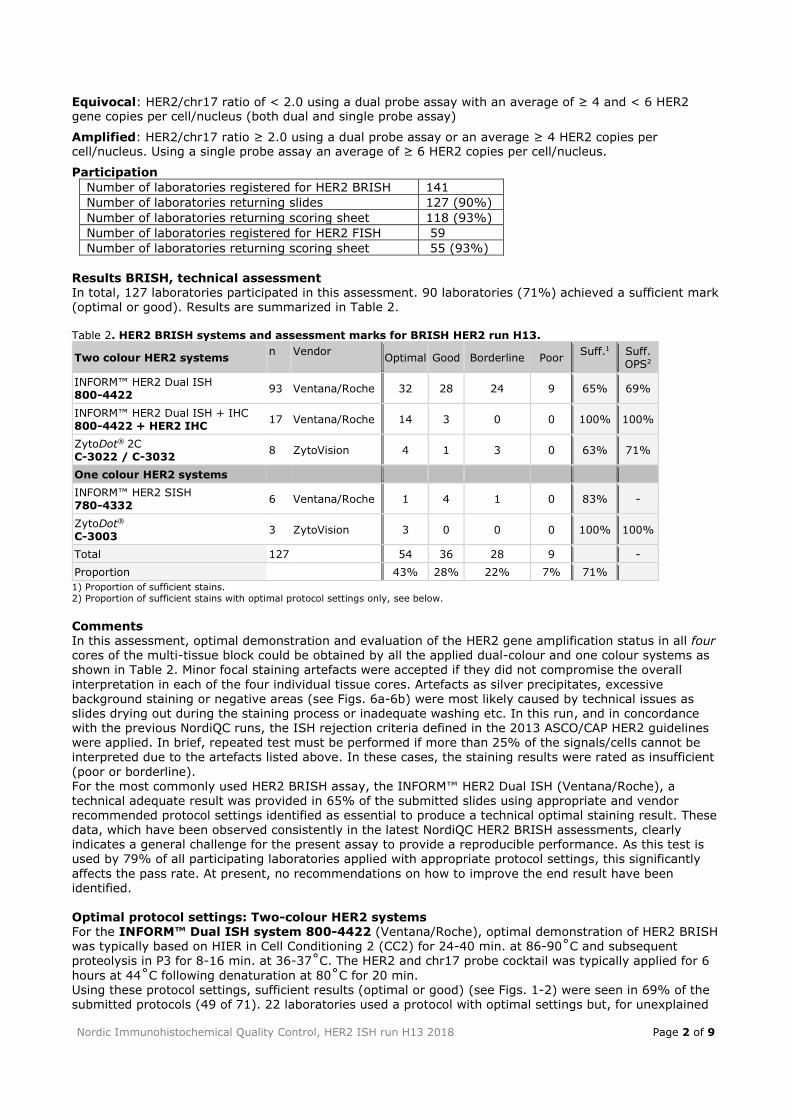
Equivocal: HER2/chr17 ratio of < 2.0 using a dual probe assay with an average of ≥ 4 and < 6 HER2 gene copies per cell/nucleus (both dual and single probe assay)
Amplified: HER2/chr17 ratio ≥ 2.0 using a dual probe assay or an average ≥ 4 HER2 copies per cell/nucleus. Using a single probe assay an average of ≥ 6 HER2 copies per cell/nucleus.
Participation
Number of laboratories registered for HER2 BRISH 141
Number of laboratories returning slides 127 (90%)
Number of laboratories returning scoring sheet 118 (93%)
Number of laboratories registered for HER2 FISH 59
Number of laboratories returning scoring sheet 55 (93%)
Results BRISH, technical assessment In total, 127 laboratories participated in this assessment. 90 laboratories (71%) achieved a sufficient mark (optimal or good). Results are summarized in Table 2. Table 2. HER2 BRISH systems and assessment marks for BRISH HER2 run H13.
Two colour HER2 systems n Vendor
Optimal Good Borderline Poor Suff.1 Suff.
OPS2
INFORM™ HER2 Dual ISH 800-4422 93 Ventana/Roche 32 28 24 9 65% 69%
INFORM™ HER2 Dual ISH + IHC 800-4422 + HER2 IHC
17 Ventana/Roche 14 3 0 0 100% 100%
ZytoDot® 2C C-3022 / C-3032
8 ZytoVision 4 1 3 0 63% 71%
One colour HER2 systems
INFORM™ HER2 SISH 780-4332
6 Ventana/Roche 1 4 1 0 83% -
ZytoDot®
C-3003 3 ZytoVision 3 0 0 0 100% 100%
Total 127 54 36 28 9 -
Proportion 43% 28% 22% 7% 71%
1) Proportion of sufficient stains.
2) Proportion of sufficient stains with optimal protocol settings only, see below.
Comments In this assessment, optimal demonstration and evaluation of the HER2 gene amplification status in all four cores of the multi-tissue block could be obtained by all the applied dual-colour and one colour systems as shown in Table 2. Minor focal staining artefacts were accepted if they did not compromise the overall
interpretation in each of the four individual tissue cores. Artefacts as silver precipitates, excessive background staining or negative areas (see Figs. 6a-6b) were most likely caused by technical issues as slides drying out during the staining process or inadequate washing etc. In this run, and in concordance with the previous NordiQC runs, the ISH rejection criteria defined in the 2013 ASCO/CAP HER2 guidelines were applied. In brief, repeated test must be performed if more than 25% of the signals/cells cannot be interpreted due to the artefacts listed above. In these cases, the staining results were rated as insufficient
(poor or borderline). For the most commonly used HER2 BRISH assay, the INFORM™ HER2 Dual ISH (Ventana/Roche), a technical adequate result was provided in 65% of the submitted slides using appropriate and vendor recommended protocol settings identified as essential to produce a technical optimal staining result. These data, which have been observed consistently in the latest NordiQC HER2 BRISH assessments, clearly indicates a general challenge for the present assay to provide a reproducible performance. As this test is used by 79% of all participating laboratories applied with appropriate protocol settings, this significantly
affects the pass rate. At present, no recommendations on how to improve the end result have been identified. Optimal protocol settings: Two-colour HER2 systems For the INFORM™ Dual ISH system 800-4422 (Ventana/Roche), optimal demonstration of HER2 BRISH was typically based on HIER in Cell Conditioning 2 (CC2) for 24-40 min. at 86-90˚C and subsequent proteolysis in P3 for 8-16 min. at 36-37˚C. The HER2 and chr17 probe cocktail was typically applied for 6
hours at 44˚C following denaturation at 80˚C for 20 min. Using these protocol settings, sufficient results (optimal or good) (see Figs. 1-2) were seen in 69% of the submitted protocols (49 of 71). 22 laboratories used a protocol with optimal settings but, for unexplained

Nordic Immunohistochemical Quality Control, HER2 ISH run H13 2018 Page 3 of 9
reasons, completely false negative staining or excessive background staining (e.g. due to silver precipitates) in the entire slide or large areas comprising >25% of the neoplastic cells in one or more of
the tissue cores (see Figs. 6a-6b). No reason for these insufficient results could be related to the applied protocols, reagents, platforms (BenchMark XT, GX or Ultra) or any other protocol parameter. This
observation has been seen in the latest runs and might indicate a less robust and reproducible performance of the protocols on the used instruments. The “negative spot artefact” (large negative areas comprising >25% of the neoplastic cells in one or more of the tissue cores) was seen in 59% (13 of 22) of the laboratories. The “silver precipitate artefact” (large areas with silver precipitates comprising >25% of the neoplastic cells in one or more of the tissue cores) was seen 23% (5 of 22) of the laboratories. The remaining insufficient results were characterized by impaired morphology hampering interpretation of the signals. This pattern was typically caused by excessive retrieval in e.g. P3 for 24–28 min. (or use of P1
and P2) and/or prolonged HIER in CC2 or Cell Conditioning 1 (CC1). Consequently, nuclei were almost totally digested and virtually no counterstaining could be seen (see Fig 5b). 17 laboratories used the INFORM™ Dual ISH systems 800-4422 (Ventana/Roche) in combination with immunohistochemical demonstration for HER2 PATHWAY® (Ventana/Roche). Optimal demonstration of HER2 BRISH using this assay was typically based on HIER in CC2 for 28-32 min. at 75-90˚C and
subsequent proteolysis in P2 for 8-20 min. at 36-37˚C. The HER2 and chr17 probe cocktail was typically applied for 6 hours at 44˚C following a denaturation at 80˚C for 4 or 20 min. HER2 PATHWAY® was
typically performed with iVIEW as detection system. Both BenchMark ULTRA and XT could be used as stainer platform. Using these protocol settings, sufficient results were seen in 100% of the submitted protocols (17 of 17) (see Figs. 3a-3b). Since the introduction of this combined HER2 Dual ISH / HER2 IHC assay (also known as HER2 gene protein assay / GPA) in 2014, a total of 82 protocols have been submitted for assessment. 82% (67 of 82)
have obtained sufficient staining results. In the same period, 720 protocols based on the INFORM™ Dual ISH systems 800-4422 have been submitted and 65% (469 of 720) obtained sufficient staining results. These data suggest that the combined HER2 Dual ISH / HER2 IHC assay is somewhat more robust compared to the “classic” INFORM™ Dual ISH system 800-4422. At present, the reason for this difference is unknown.
For the ZytoDot® 2C system C-3022 / C-3032 (ZytoVision), two protocols gave optimal results (see Fig. 4a). Protocols were based on HIER in EDTA pH 8 in a waterbath or MES buffer pH 6.55 in waterbath for 10-15 min. at 95-98˚C, proteolysis in pepsin for 3-5 min. at room temperature or at 37˚C, hybridization at 37˚C for 18-20 hours and visualization with the ZytoVision detection kit C-3022. Using
these protocol settings, sufficient results were seen in 71% of the submitted protocols (5 of 7).
One-colour HER2 systems For the ZytoDot® CISH system C-3003 (ZytoVision), three protocols gave an optimal result (see Fig. 4b). The protocols were based on HIER in EDTA pH 8 in a waterbath for 15 min. at 95-100˚C, proteolysis in pepsin for 2-3 min. at room temperature, hybridization at 37˚C overnight and visualization with the ZytoVision detection kit C-3003. Using these protocol settings, optimal results were seen in 100% of the
submitted protocols (3 of 3). For the INFORM™ SISH system 780-4332 (Ventana/Roche), one protocol gave an optimal result. The protocol was based on HIER in CC2 for 32 min. at 90˚C and subsequent proteolysis in P3 for 8 min. at 36˚C. The HER2 SISH probe was applied for 6 hours at 50˚C. Only one laboratory used these protocol settings.
Performance history This was the nineteenth assessment of HER2 BRISH in NordiQC and a consistent pass rate at a relatively low level has been observed in the latest runs. Data is shown in Graph 1.

Nordic Immunohistochemical Quality Control, HER2 ISH run H13 2018 Page 4 of 9
Graph 1. Proportion of sufficient results for HER2 BRISH in the NordiQC assessment
HER2 ISH interpretation and scoring consensus: Table 3. NordiQC FISH amplification data*
NordiQC
FISH HER2/chr17 ratio
NordiQC
FISH HER2 copies
NordiQC
HER2 amplification status
1. Breast ductal carcinoma 0.8 – 1.0 < 4 Non-amplified
2. Breast ductal carcinoma 1.0 – 1.2 ≥ 4 and < 6 Non-amplified / Equivocal
3. Breast ductal carcinoma Not assessed Not assessed Not assessed
4. Breast ductal carcinoma 2.8 – 3.3 > 6 Amplified
5. Breast ductal carcinoma 6.5 – 8.5 > 6 Amplified
* data from 2 different NordiQC reference laboratories.
173 of the 186 (93%) participating laboratories completed scoring sheets on the NordiQC homepage. These evaluations were compared to the HER2 FISH amplification status obtained by the NordiQC
reference laboratories, summarized in Graph 2 and 3. For the laboratories performing FISH, the consensus rate was 85% (47 of 55) and 82% (97 of 118) for laboratories using BRISH. This is a small decline compared to the previous assessment, where the consensus rates were 93% and 90%, respectively.
In general, for both BRISH and FISH, high consensus rates were observed between participants and NordiQC regarding the HER2 amplification status in all cores. The most challenges in interpretation of
HER2 amplification status were seen in tissue core no. 2 and 4. For both BRISH and FISH, disagreement of the interpretation of the HER2 amplification status between the participants and NordiQC data were both related to “overrating” and “underrating” the HER2 status and thus an aberrant classification compared to the NordiQC reference data and the majority of other participants.
15
23 38 4141
59 68 6983 84 85
72 79 73 7972 73 74
90
2
11 15 1624
12 1622
19 26 2637 33 30 37
46 48 4137
0%
10%
20%
30%
40%
50%
60%
70%
80%
90%
100%
Pas
s ra
te
Run
C1 C2 B9 B10 B11 B12 H1 H2 H3 H4 H5 H6 H7 H8 H9 H10 H11 H12 H13
Insufficient
Sufficient

Nordic Immunohistochemical Quality Control, HER2 ISH run H13 2018 Page 5 of 9
Tumour no. 2 was by the NordiQC reference laboratories classified as non-amplified with a HER2 ratio of 1.0– 1.2 and ≥ 4 and < 6 HER2 gene copies. This tumour was, by some laboratories using either FISH (6
of 55 laboratories) or BRISH (19 of 118 laboratories) classified as amplified or indeterminable.
Tumour no. 4 was by the NordiQC reference laboratories characterized to be amplified. The tumour showed HER2 ratio in the range of 2.8-3.3 and > 6 HER2 gene copies were identified. This tumour was, by some laboratories using either FISH (3 of 52) or BRISH (5 of 113) classified as non-amplified (n=5) or equivocal (n=3). In this assessment participants using either FISH or BRISH had the same level of consensus on the individual core. This is a change compared to the previous assessment, where participants using FISH
tended to have a higher level of consensus on the individual cores. However, it was observed that the consensus rates of the individual cores among laboratories that produced staining reaction assessed as technically sufficient (BRISH only) were marginally higher than laboratories with an insufficient mark (95% and 91%, respectively). Despite insufficient staining, laboratories were still able to correctly evaluate the slide. The ISH rejection criteria are applied In NordiQC assessments. The criteria (defined in the 2013 ASCO/CAP HER2 guidelines) require retest, if more than 25% of the signals/cells cannot be interpreted
due to artefacts such as silver precipitate, excessive background or negative areas. The material in the assessment consisted of breast tumours with relatively homogenous HER2 expression, which permitted
correct evaluation even in slides with large negative areas. This is not always the case in diagnostic settings with heterogeneous tumours or evaluation in specific “hot-spot areas” identified by HER2 IHC. Participants overall interpretation of amplification ratios and consensus rates are shown in Graph 2 and 3.
Graph 2
NordiQC HER2 ISH run H13: participants interpretation of amplification status
(core 3 excluded)
●
●
●
●
●
●●
●
●
●
●
●
●
●
●
●
●
●
●
●
●
●
2
4
6
8
10
1 2 4 5
Core
HE
R−
2 / C
hro
mosom
e 1
7 r
atio
Method
BRISH
FISH

Nordic Immunohistochemical Quality Control, HER2 ISH run H13 2018 Page 6 of 9
Graph 3
NordiQC HER2 ISH run H13: consensus between participants and NordiQC
(core 3 excluded)
No technical evaluation of FISH protocols was performed. Table 4 shows the FISH assay used by the participants and concordance level to the NordiQC data observed. In this matter, it has to be emphasized that it was not possible to identify the cause of an aberrant interpretation of the HER2 status whether this was related to the technical performance of the FISH assay or the interpretation by the observer(s). Table 4. FISH assays used and level of consensus HER2 status to NordiQC reference data, H13
Assay Number Consensus rate
Pathvysion/Abbot, 6N4630 / 30-161060 17 88% (15/17)
ZytoVision, Z2015 / Z2020/ Z2077 11 100% (11/11)
Dako, K5731 11 73% (8/11)
Leica, TA9217 4 100% (4/4)
Other 12 75% (9/12)
Conclusion In this assessment and in concordance with previous NordiQC HER2 ISH runs, technical optimal demonstration of HER2 BRISH could be obtained by the commercially available two-colour HER2 systems INFORM™ HER2 Dual ISH (Ventana/Roche) and ZytoDot® 2C (ZytoVision). The single-colour HER2 systems INFORM™ SISH system (Ventana/Roche) and ZytoDot® (ZytoVision)
could also be used to produce a technical optimal HER2 demonstration. For all systems, retrieval settings – HIER and proteolysis - must be carefully balanced to provide sufficient demonstration of HER2 (and chr17 signals) and preserved morphology. Despite optimal protocol settings being applied, a high proportion of technical insufficient results were seen, indicating that other issues are influencing the quality of the BRISH assays. Especially the capability of present instrumentation and associated HER2 ISH assays to provide reproducible performance of the protocols might be a central factor. It was observed that the most commonly used HER2 BRISH assay,
INFORM™ HER2 Dual ISH (Ventana/Roche), only provided a pass rate of 65% despite using appropriate
and well characterized protocol settings. In contrast 100% of laboratories using the combined HER2 Dual ISH / HER2 IHC assay (Ventana/Roche) produced sufficient staining results. Laboratories performing FISH achieved a slightly higher consensus rate for the interpretation of HER2 amplification status compared to laboratories performing BRISH.
0
25
50
75
100
1 2 4 5
Core
Co
nsen
su
s (
%)
Method
BRISH
FISH

Nordic Immunohistochemical Quality Control, HER2 ISH run H13 2018 Page 7 of 9
Fig. 1a
Optimal demonstration of the HER2 gene status using the INFORM™ Dual ISH kit cat. no. 800-4422, Ventana/Roche, of the breast carcinoma no. 1 without HER2 gene amplification: HER2/chr17 ratio 0.8-1.0*. The HER2 genes are stained black and chr17 red. The signals are distinctively demonstrated. A minor fraction of cells shows polysomia and in areas a level of ≥ 4 but less < 6 HER2 gene copies are identified. NordiQC and the vast majority of participants interpreted this tumour as non-amplified.
Fig. 1b
Optimal demonstration of the HER2 gene status using the INFORM™ Dual ISH kit cat. no. 800-4422, Ventana/Roche, of the breast carcinoma no. 2 without HER2 gene amplification: HER2/chr17 ratio > 1.0-1.2*. The HER2 genes are stained black and chr17 red. Many cells show polysomia and in areas a level of ≥ 4 but less < 6 HER2 gene copies are identified. NordiQC and the vast majority of participants interpreted this tumour as non-amplified or equivocal.
Fig. 2a
Optimal demonstration of the HER2 gene status using the INFORM™ Dual ISH kit cat. no. 800-4422,
Ventana/Roche, of the breast carcinoma no. 4 with HER2 gene amplification: HER2/chr17 ratio 2.8-3.3*. The HER2 genes are stained black and chr17 red. The HER2 signals are distinctively demonstrated. NordiQC and virtually all participants interpreted this tumour as positive, low to moderately amplified.
Fig. 2b
Optimal demonstration of the HER2 gene status using the INFORM™ Dual ISH kit cat. no. 800-4422,
Ventana/Roche, of the breast carcinoma no. 5 with high level HER2 gene amplification: HER2/chr17 ratio > 6.5-8.5*. The HER2 genes are stained black and chr17 red. The signals are distinctively demonstrated, and many HER2 signals are located in large clusters. NordiQC and all but one participant interpreted this tumour as positive, highly amplified.

Nordic Immunohistochemical Quality Control, HER2 ISH run H13 2018 Page 8 of 9
Fig. 3a
Optimal demonstration of the HER2 gene status using the INFORM™ Dual ISH kit cat. no. 800-4422, Ventana/Roche, in combination with HER2 IHC using PATHWAY, Ventana/Roche, of the breast carcinoma no. 2 without HER2 gene amplification: HER2/chr17 ratio 1.0-1.2*. The gene protein assay (GPA) labels the HER2 genes black, chr17 red and HER2 protein brown. The IHC level is interpreted as 2+ and the GPA assay visualizes IHC hot-spots to evaluate the HER2 gene status precisely. Many cells show polysomia and in areas a level of ≥ 4 but less < 6 HER2 gene copies are identified. The participant interpreted this tumour as non-amplified. NordiQC and the vast majority of participants interpreted also this tumour as non-amplified or equivocal.
Fig. 3b
Optimal demonstration of the HER2 gene status using the INFORM™ Dual ISH kit cat. no. 800-4422, Ventana/Roche, in combination with HER2 IHC using PATHWAY, Ventana/Roche, of the breast carcinoma no. 4 with HER2 gene amplification: HER2/chr17 ratio > 2.8-3.3*. The gene protein assay (GPA) labels the HER2 genes black, chr17 red and HER2 protein brown. The IHC level is interpreted as 2+ and the GPA assay visualizes the HER2 IHC overexpression and the HER2 gene status simultaneously. The participant interpreted this tumour as positive, low level amplified. NordiQC and virtually all participants interpreted also this tumour as positive, low to moderately amplified.
Fig. 4a
Optimal demonstration of the HER2 gene status using the ZytoDot® 2C C-3022/C-3032, ZytoVision, of the breast carcinoma no. 1 without HER2 gene amplification: HER2/chr17 ratio 0.8-1.0*. The HER2 genes are stained green and chr17 red. HER2 and chr17 signals are distinctively demonstrated. The participant interpreted this tumour as non-amplified. NordiQC and the vast majority of participants interpreted also this tumour as non-amplified.
Fig. 4b
Optimal demonstration of the HER2 gene status using the ZytoDot® C-3003, ZytoVision, of the breast carcinoma no. 1 without HER2 gene amplification: HER2/chr17 ratio 0.8-1.0*. The HER2 genes are stained brown and signals are distinctively demonstrated. The participant interpreted this tumour as non-amplified. NordiQC and the vast majority of participants interpreted also this tumour as non-amplified.

Nordic Immunohistochemical Quality Control, HER2 ISH run H13 2018 Page 9 of 9
Fig. 5a
Optimal demonstration of the HER2 gene status using the INFORM™ Dual ISH kit cat. no. 800-4422, Ventana/Roche, of the breast carcinoma no. 2 without HER2 gene amplification: HER2/chr17 ratio > 1.0-1.2*. The HER2 genes are stained black and chr17 red. Many cells show polysomia and in areas a level of ≥ 4 but less < 6 HER2 gene copies are identified. NordiQC and the vast majority of participants interpreted this tumour as negative or equivocal. Same protocol settings were applied as used in Figs. 1 and Fig. 2. Notice the well-preserved morphology of the tumour cells and the optimally balanced nuclear counterstain, facilitating counting of HER2 and chr17 signals. Compare with Fig. 5b.
Fig. 5b
Insufficient staining for the HER2 gene using the INFORM™ Dual ISH kit cat. no. 800-4422, Ventana/Roche, of the breast carcinoma no. 2 without gene amplification: HER2/chr17 ratio 1.0-1.2*. Impaired morphology hampering interpretation of the signals is seen. The use of prolonged retrieval in Protease 3, 24 min. compared to 16 min. in Fig. 5a, results in over digestion of nuclei and consequently, no counterstaining can be seen. Compare with Fig. 5a – same field.
Fig. 6a
Insufficient staining for the HER2 gene using the INFORM™ Dual ISH kit cat. no. 800-4422, Ventana/Roche, of the breast carcinoma no. 1 without gene amplification: HER2/chr17 ratio 0.8-1.0*. Large areas (> 25% of the neoplastic cells) of core no. 1 are totally negative. This aberrant staining reaction / “negative spot artefact” was most likely caused by a technical problem during the staining process in the BenchMark instrument. Same protocol settings were applied as used in Fig. 1, Fig. 2 and Fig. 5a.
Fig. 6b
Insufficient staining for the HER2 gene using the INFORM™ Dual ISH kit cat. no. 800-4422, Ventana/Roche, of the breast carcinoma no. 4 with HER2 gene amplification: HER2/chr17 ratio 2.8-3.3*. The HER2 genes are stained black but the chr17 red signals are missing in large areas (> 25% of the neoplastic cells). Additional, weak silver precipitates are seen in the same areas. This aberrant staining reaction was most likely caused by a technical problem during the staining process in the BenchMark instrument. Compare with Fig. 2a. Same protocol settings were applied as used in Fig. 1, Fig 2 and Fig 5a.
* HER2 FISH, Zytovision (range of data from one reference lab.)
ON/LE/RR 16.04.18


![[H13] honlapkészítés, csináld magad!](https://static.fdocuments.net/doc/165x107/587677231a28abd0018b7277/h13-honlapkeszites-csinald-magad.jpg)