Vulnerability Assessment, Physical Security, and Nuclear Safeguards

Assessment of the physical vulnerability to erosion and floodingin a sheltered coastal sector: Florianópolis Bay, Brazil
Yasmim Garcia da Silveira1 & Jarbas Bonetti1
Received: 15 March 2018 /Revised: 11 July 2018 /Accepted: 5 September 2018# Springer Nature B.V. 2018
AbstractThis study aims to characterize the physical vulnerability of the western coast of Santa Catarina Island by applying the Smartlinemethodology. Erosion and flooding processes can endanger the installed human infrastructure in the coastal zone, with the degreeof vulnerability of a given site being dependent on its natural characteristics, or even due to changes induced by human action.The methodology applied in this research adopts a multiscale approach and considers, using coastline segmentation, the spec-ificities of the analyzed coastal sectors. Each identified segment receives a classification regarding its physical vulnerability,resulting from the integration of several attributes, which must be selected according to the coastal hazard that one wishes torepresent. In the analysis, three distinct levels of physical support and behavior of the coastal processes are considered. The first-order attributes are structural, and their characteristics are broad; the second-order ones are transitional between structural anddynamic and, the third-order attributes are dynamic, with specific characteristics. Themethodology was applied on the west coastof Santa Catarina Island, a sector sheltered from oceanic waves, characterizing a low energy environment. Eight descriptors wereselected for erosion and coastal flooding, these being: Bgeology^ having two classes, distributed along 12 segments andBgeomorphology ,̂ three classes in eight segments, both of which were considered first-order variables. BAverage astronomicaltide current speed^ (five classes in 15 segments), Baverage backshore height^ (four classes in 20 segments), and Bdegree ofexposure to wind waves^ (five classes in 28 segments) compose the second order, while Bbackshore features^ (seven classes in28 segments), Bgrain size^ (five classes in 26 segments) and Bbeach face slope^ (three classes in 30 segments) describe third-order processes. By the integration of first-order attributes an Indicative Map of Vulnerability to Erosion and Flooding wasgenerated, which classified the coast into Bvery Low ,̂ Blow ,̂ Bmoderate^, and Bhigh^ vulnerability classes. As a final result ofthe analytical process the coastline, first-, second-, and third-order attributes were mathematically integrated by means of spatialanalysis techniques, with the studied coastline represented as a segmented line according to the different classes of attributedphysical vulnerability, highlighting the sectors with the most propensity to erosion and flooding. This Map of PhysicalVulnerability to Erosion and Flood indicated that the west coast of Santa Catarina Island can be divided into sectors of lowand moderate vulnerability in similar proportions, with occasional occurrences of high vulnerability in specific sectors.
Keywords Coastal erosion . Coastal flooding . Coastline change . Spatial analysis
Introduction
Coastal erosion and the consequent retreat of the coastline de-pend on natural and anthropic factors and their interactions.Rangel-Buitrago et al. (2018) mention that this process includesa broad range of factors which result in a net sediment imbalanceand subsequent coastal retreat. Among them are: the reductionof sediment supply, sea level rise, destruction of coastal ecosys-tems, and placement of hard engineering structures.
The intense urban occupation of the coastal zones has gen-erated a series of environmental impacts over the last fewdecades, from the intensification of urban infrastructure tothe alteration of physical and natural properties of the
* Yasmim Garcia da [email protected]
Jarbas [email protected]
1 Coastal Oceanography Laboratory (LOC), Federal University ofSanta Catarina, OCN/CFM Campus Universitário - Trindade,Florianópolis 88040-900, Santa Catarina, Brazil
Journal of Coastal Conservationhttps://doi.org/10.1007/s11852-018-0659-0

environment (Lins de Barros and Muehe 2013). According toSnoussi et al. (2008), about 60% of the population and 90% ofthe world’s industrial activity are located less than 100 kmfrom the sea.
The Intergovernmental Panel on Climate Change estimatesthat sea level rise will reach rates of 0.26 to 0.55 mm/year by2100 in a rigorous mitigation scenario (IPCC 2014). On thecoast of Santa Catarina, where the Florianópolis Bay is locat-ed, a linear historical trend of sea level is observed, with apositive variation of 2.11 mm/year, resulting in an increaseof 4.6 cm over the last 22 years (CEPAL 2015).
Thus, as the occupation of the coastal zone increased, occa-sional inundation and erosive effects previously considered lesssignificant began to be seen as risk factors, as suggested by thegrowth in the number of emergency events associated with ex-treme high sea levels, mostly related to large storms (Bonetti andWoodroffe 2017). The consequent relevant socioeconomic is-sues conferred importance on the investigation of the environ-mental sensitivity of these zones, most of them based on numer-ical modeling, spatial analysis, and index/indicator-based ap-proaches (Bonetti et al. 2013a; Nguyen et al. 2016).
Several methodological proposals for the determination ofcoastal vulnerability have been developed in the last few de-cades, as detailed by Rangel-Buitrago and Anfuso (2015), andBonetti and Woodroffe (2017). However, there are still fewstudies (National Research Council 2007, Jallow et al. 1999,Bayani-Arias et al. 2012) that consider the particular character-istics of the coastal sectors which are sheltered from direct oceanwave action. In such sectors, there is a degree of interaction withthe continental systems that are not observed on exposedbeaches, so that the processes that regulate the behavior of thephysical environment cannot be assessed in the same way.
The morphodynamic classification of beaches is based onthe recognition of the hydrodynamic and morphological pro-cesses that act on them. Authors such as Wright and Short(1984), Masselink and Short (1993), and Hegge et al. (1996)studied attributes such as the degree of beach exposure, coast-al hydrodynamics, declivity, grain size, tidal variation, height,and wave period which, when incorporated in equations, candescribe the characteristics of the beach system (Short 1999).Most research on beach dynamics, however, relies on the ap-plication of this approach on exposed beaches.
Hegge et al. (1996) studied beaches considered to be shel-tered. According to these authors, this specific class ofbeaches has many similarities to those that are exposed, suchas evolution processes and oceanographic forcing, but theydiffer from them because they are protected from the directimpact of high energy swells. Sheltered systems can, thus, beconsidered as low energy, taking into account the degree ofenergetic transfer and the low or null degree of exposure of thecoast to the waves generated in the oceans (Goodfellow andStephenson 2005). The waves acting on sheltered beaches areof small amplitude (Hs <0.25 m) and short period (T < 5 s)
(Jackson et al. 2002), being commonly generated locally inlimited wind fetch conditions.
According to Jackson and Nordstrom (1992), themorphodynamics of sheltered beaches are largely related tothe characteristics of those waves, and to the periodic varia-tions of the water level that rework the beachface. In addition,the geological framework is important in the configuration ofthe beach, as are the sedimentary supply and inherited mor-phological features along its upper profile.
Physical processes in sheltered systems are not necessarilyeasy to quantify and model, since many interactions occur in arelatively narrow zone and frequently in a nonlinear way.However, the often-adopted approach of integration of a setof themes and multivariate descriptors, so that they can becombined to spatially represent the characteristics of a portionof coastal space (Bonetti et al. 2013b, Merlotto et al. 2016, DiPaola et al. 2017), is perfectly applicable to the assessment ofthe physical vulnerability of sheltered areas. For this, the se-lection of variables that better express the behavior of suchenvironments is a key factor. Also, the adoption of amultiscale approach can be an efficient strategy to better dis-tinguish the roles of structural and dynamic factors that inducesusceptibility.
In this sense, this work aims to analyze a set of coastalvulnerability descriptors in a sheltered system, adopting theSmartline methodology. This methodology, developed bySharples (2006), uses a multi-scalar approach to representthe specificities and interrelations of a given coastal sectorby means of coastline segmentation.
Florianópolis Bay
The coastal province of the state of Santa Catarina, located insouthern Brazil, trends from south then southwest for about922 km of open coasts and bay shorelines, and consists of twomajor geological units: Precambrian bedrocks and Quaternarysediments (Klein et al. 2016).
Florianópolis Bay, which separates Santa Catarina islandfrom the mainland (Fig. 1), is located in the central sector ofthe state. It presents morphological features resulting from strongindentation (peninsulas, coves, bays, etc.) and typical beachmor-phology of discontinuous coastlines (Horn Filho 2003).
This bay forms a semi-confined body of water,physiographically divided into the North and South bays,which are connected in the central portion of the systemthrough a constriction of approximately 400 m wide at itsnarrowest point (Bonetti et al. 1998).
North Bay
North Bay has a longitudinal length of approximately 19 km, amaximum width of 12 km, and an average depth of 3.30 m. It
Y. G. da Silveira, J. Bonetti
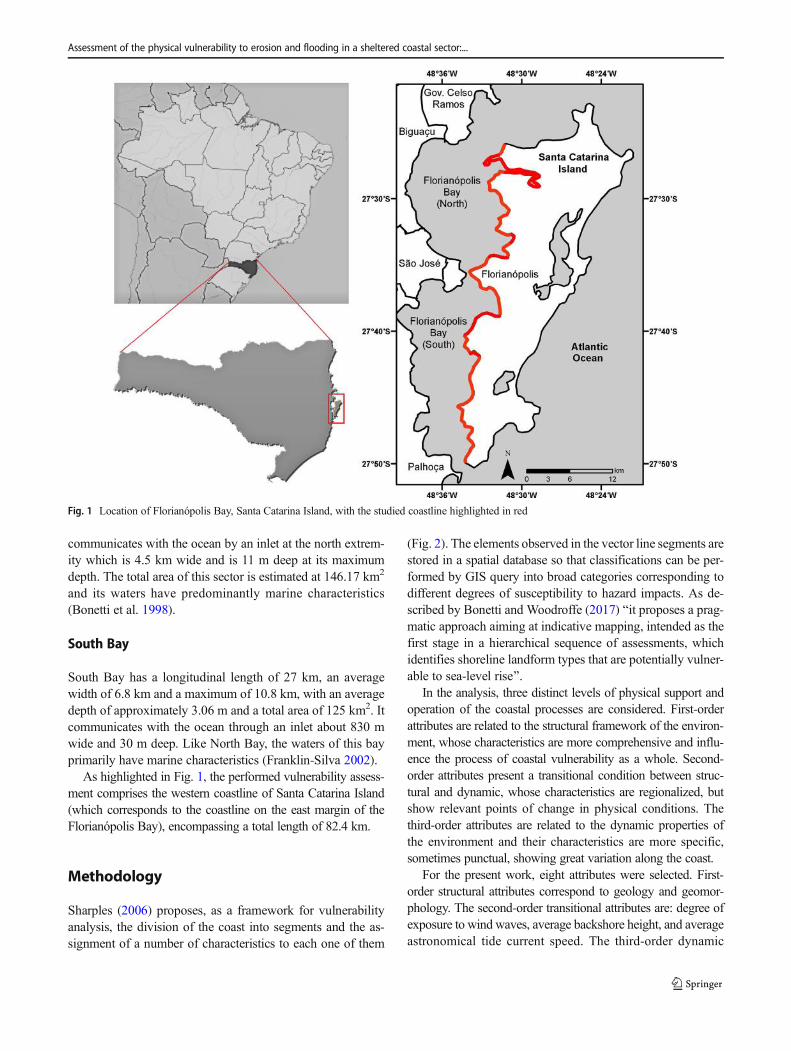
communicates with the ocean by an inlet at the north extrem-ity which is 4.5 km wide and is 11 m deep at its maximumdepth. The total area of this sector is estimated at 146.17 km2
and its waters have predominantly marine characteristics(Bonetti et al. 1998).
South Bay
South Bay has a longitudinal length of 27 km, an averagewidth of 6.8 km and a maximum of 10.8 km, with an averagedepth of approximately 3.06 m and a total area of 125 km2. Itcommunicates with the ocean through an inlet about 830 mwide and 30 m deep. Like North Bay, the waters of this bayprimarily have marine characteristics (Franklin-Silva 2002).
As highlighted in Fig. 1, the performed vulnerability assess-ment comprises the western coastline of Santa Catarina Island(which corresponds to the coastline on the east margin of theFlorianópolis Bay), encompassing a total length of 82.4 km.
Methodology
Sharples (2006) proposes, as a framework for vulnerabilityanalysis, the division of the coast into segments and the as-signment of a number of characteristics to each one of them
(Fig. 2). The elements observed in the vector line segments arestored in a spatial database so that classifications can be per-formed by GIS query into broad categories corresponding todifferent degrees of susceptibility to hazard impacts. As de-scribed by Bonetti and Woodroffe (2017) Bit proposes a prag-matic approach aiming at indicative mapping, intended as thefirst stage in a hierarchical sequence of assessments, whichidentifies shoreline landform types that are potentially vulner-able to sea-level rise^.
In the analysis, three distinct levels of physical support andoperation of the coastal processes are considered. First-orderattributes are related to the structural framework of the environ-ment, whose characteristics are more comprehensive and influ-ence the process of coastal vulnerability as a whole. Second-order attributes present a transitional condition between struc-tural and dynamic, whose characteristics are regionalized, butshow relevant points of change in physical conditions. Thethird-order attributes are related to the dynamic properties ofthe environment and their characteristics are more specific,sometimes punctual, showing great variation along the coast.
For the present work, eight attributes were selected. First-order structural attributes correspond to geology and geomor-phology. The second-order transitional attributes are: degree ofexposure to wind waves, average backshore height, and averageastronomical tide current speed. The third-order dynamic
Fig. 1 Location of Florianópolis Bay, Santa Catarina Island, with the studied coastline highlighted in red
Assessment of the physical vulnerability to erosion and flooding in a sheltered coastal sector:...

attributes are represented by the backshore features, grain size,and beach face slope. The relation between the selected attri-butes and their sources are listed in Table 1 below:
The first step in the application of the Smartline meth-odology is the extraction of information regarding theselected attributes, to which weights have been assigned.Each identified feature (class) of these attributes was clas-sified according to its minor or major influence on theoccurrence of erosion and flooding processes. Afterextracting the information from the variables, they were
integrated and standardized, and through a multicriteriaevaluation the physical vulnerability of each segmentwas assigned to an overall vulnerability score.
The used data integration method was based on theelaboration of a vulnerability index as originally proposedby Gornitz et al. (1992), known as the CVI - CoastalVulnerability Index. This index was adapted to assesscoastal vulnerability to the erosion and flooding of shel-tered systems, resulting in the Weighted CoastalVulnerability Index (WCVI) bellow.
WCVI ¼
�G*0:1ð Þ þ GM*0:1ð Þ þ C*0:2ð Þ þ BH*0:3ð Þ þ E*0:2ð Þ þ BF*0:3ð Þ þ GS*0:1ð Þ þ D*0:3ð Þ
1:6
Where:
G geologyGM geomorphologyC average astronomical tide current speedBH average backshore heightE degree of exposure to wind wavesBF backshore features
GS grain sizeD beach face slope
The weights of the features of each attribute were dis-tributed within the range of 0 to 3, where values that tendtowards 0 represent low vulnerability and values that tendtowards 3 represent high vulnerability (Table 2). Values
Fig. 2 Schematic representationof the methodological procedurefor coastline segmentation.Adapted from Sharples et al.(2009)
Table 1 Data previously available to build the attribute layers, those produced, and their sources
First-order attributes Source
Geology Horn Filho and Livi (2013)
Geomorphology IPUF (1992)
Second-order Attributes Source
Average astronomical tide current speed Reprocessing of numerical modeling developed by Czizeweski (2016)
Average backshore height Digital Elevation Model processing obtained by SRTM, 90 m resolution
Degree of exposure to wind waves Application of the Wind Fetch Model (USGS)
Third-order Attributes Source
Backshore features Mussi et al. (2018)
Grain size Horn Filho (2006)
Beach face slope Mussi et al. (2018)
Y. G. da Silveira, J. Bonetti
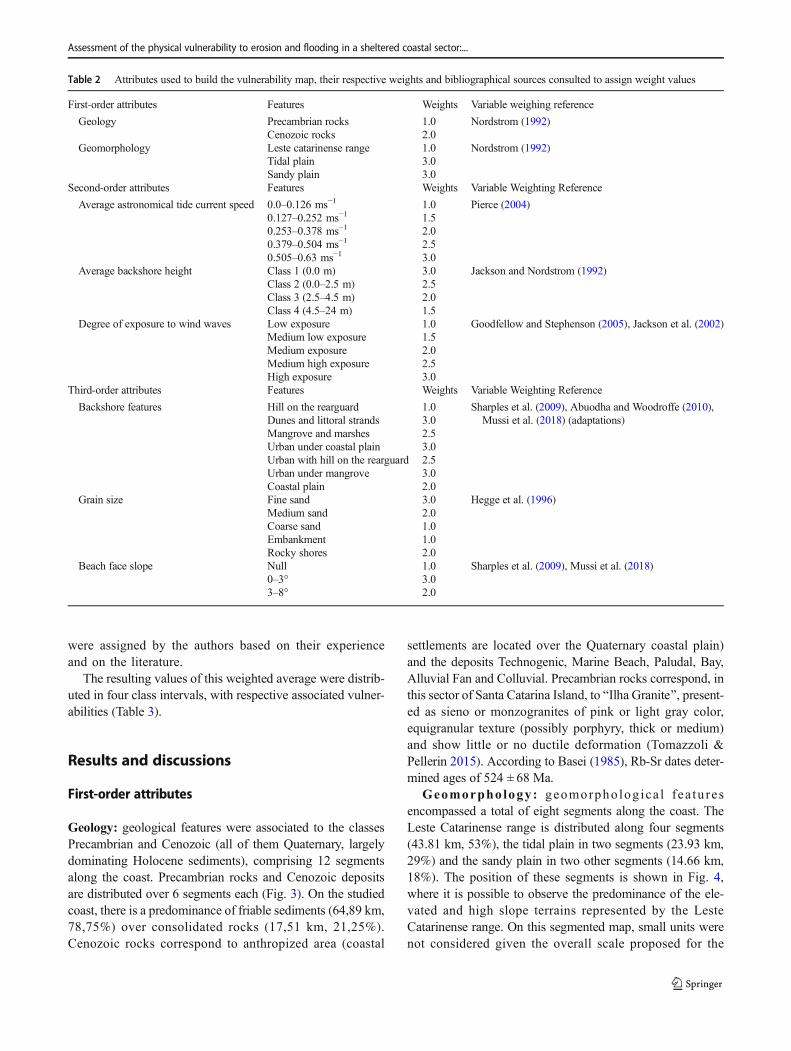
were assigned by the authors based on their experienceand on the literature.
The resulting values of this weighted average were distrib-uted in four class intervals, with respective associated vulner-abilities (Table 3).
Results and discussions
First-order attributes
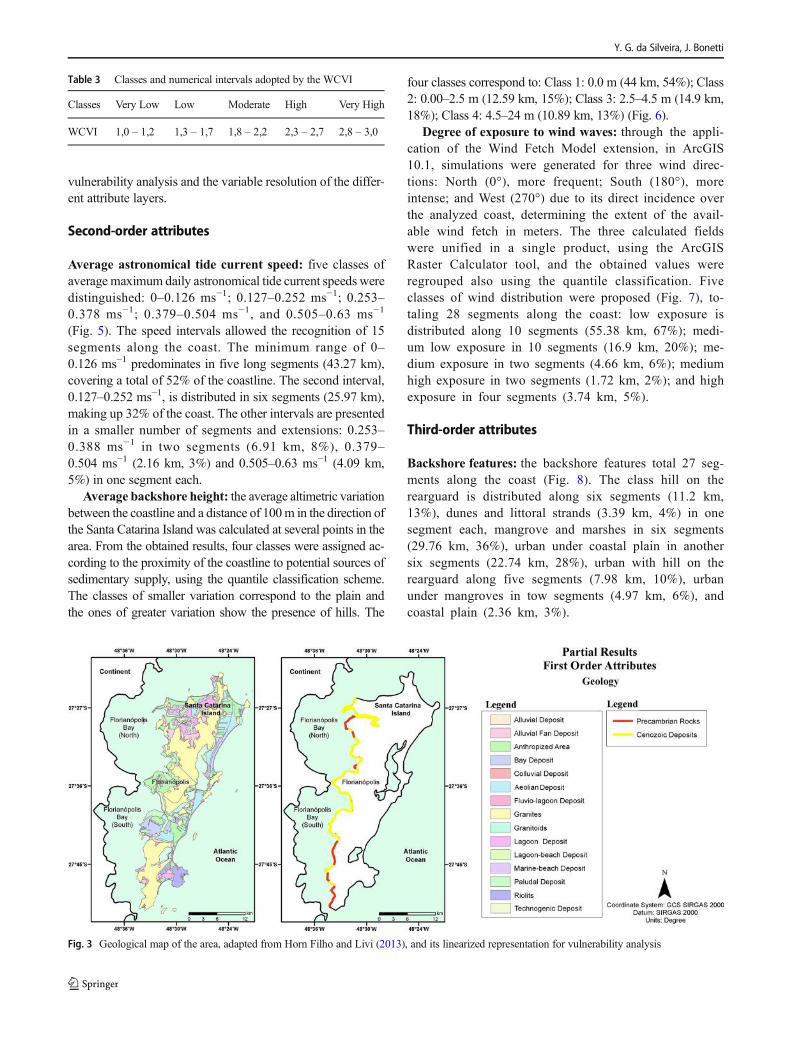
Geology: geological features were associated to the classesPrecambrian and Cenozoic (all of them Quaternary, largelydominating Holocene sediments), comprising 12 segmentsalong the coast. Precambrian rocks and Cenozoic depositsare distributed over 6 segments each (Fig. 3). On the studiedcoast, there is a predominance of friable sediments (64,89 km,78,75%) over consolidated rocks (17,51 km, 21,25%).Cenozoic rocks correspond to anthropized area (coastal
settlements are located over the Quaternary coastal plain)and the deposits Technogenic, Marine Beach, Paludal, Bay,Alluvial Fan and Colluvial. Precambrian rocks correspond, inthis sector of Santa Catarina Island, to BIlha Granite^, present-ed as sieno or monzogranites of pink or light gray color,equigranular texture (possibly porphyry, thick or medium)and show little or no ductile deformation (Tomazzoli &Pellerin 2015). According to Basei (1985), Rb-Sr dates deter-mined ages of 524 ± 68 Ma.
Geomorpho logy: geomorpho log ica l fea tu resencompassed a total of eight segments along the coast. TheLeste Catarinense range is distributed along four segments(43.81 km, 53%), the tidal plain in two segments (23.93 km,29%) and the sandy plain in two other segments (14.66 km,18%). The position of these segments is shown in Fig. 4,where it is possible to observe the predominance of the ele-vated and high slope terrains represented by the LesteCatarinense range. On this segmented map, small units werenot considered given the overall scale proposed for the
Table 2 Attributes used to build the vulnerability map, their respective weights and bibliographical sources consulted to assign weight values
First-order attributes Features Weights Variable weighing reference
Geology Precambrian rocksCenozoic rocks
1.02.0
Nordstrom (1992)
Geomorphology Leste catarinense rangeTidal plainSandy plain
1.03.03.0
Nordstrom (1992)
Second-order attributes Features Weights Variable Weighting Reference
Average astronomical tide current speed 0.0–0.126 ms−1
0.127–0.252 ms−1
0.253–0.378 ms−1
0.379–0.504 ms−1
0.505–0.63 ms−1
1.01.52.02.53.0
Pierce (2004)
Average backshore height Class 1 (0.0 m)Class 2 (0.0–2.5 m)Class 3 (2.5–4.5 m)Class 4 (4.5–24 m)
3.02.52.01.5
Jackson and Nordstrom (1992)
Degree of exposure to wind waves Low exposureMedium low exposureMedium exposureMedium high exposureHigh exposure
1.01.52.02.53.0
Goodfellow and Stephenson (2005), Jackson et al. (2002)
Third-order attributes Features Weights Variable Weighting Reference
Backshore features Hill on the rearguardDunes and littoral strandsMangrove and marshesUrban under coastal plainUrban with hill on the rearguardUrban under mangroveCoastal plain
1.03.02.53.02.53.02.0
Sharples et al. (2009), Abuodha and Woodroffe (2010),Mussi et al. (2018) (adaptations)
Grain size Fine sandMedium sandCoarse sandEmbankmentRocky shores
3.02.01.01.02.0
Hegge et al. (1996)
Beach face slope Null0–3°3–8°
1.03.02.0
Sharples et al. (2009), Mussi et al. (2018)
Assessment of the physical vulnerability to erosion and flooding in a sheltered coastal sector:...
vulnerability analysis and the variable resolution of the differ-ent attribute layers.
Second-order attributes
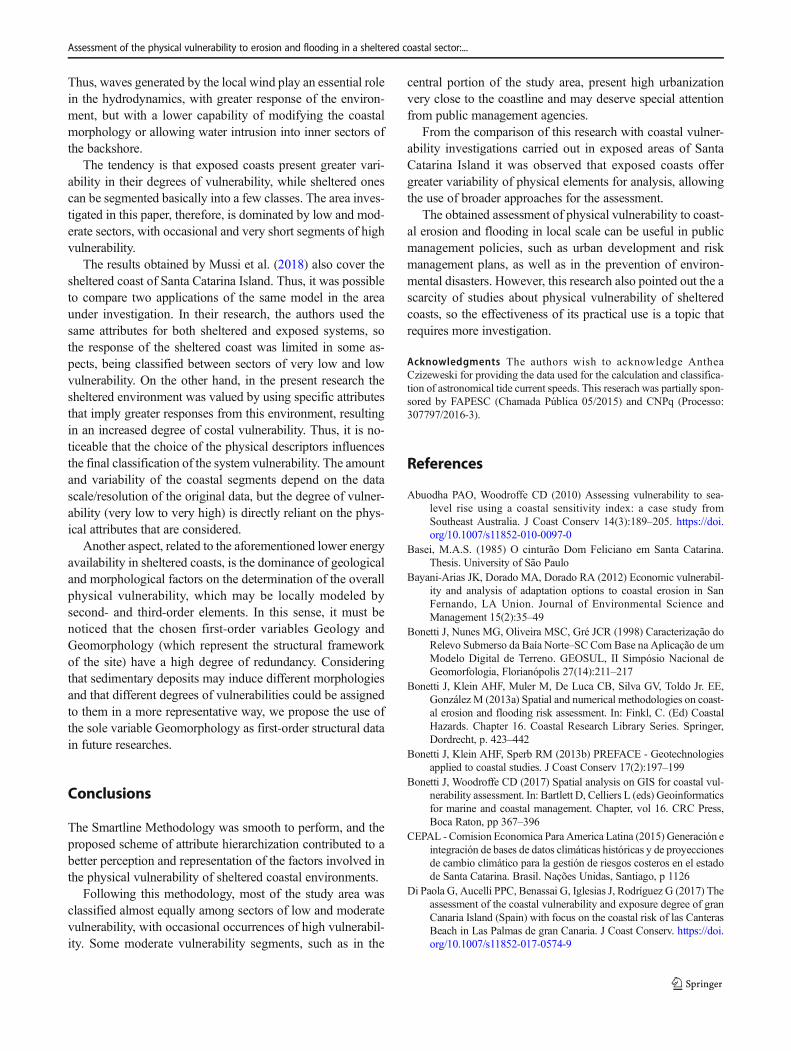
Average astronomical tide current speed: five classes ofaverage maximum daily astronomical tide current speeds weredistinguished: 0–0.126 ms−1; 0.127–0.252 ms−1; 0.253–0.378 ms−1; 0.379–0.504 ms−1, and 0.505–0.63 ms−1
(Fig. 5). The speed intervals allowed the recognition of 15segments along the coast. The minimum range of 0–0.126 ms−1 predominates in five long segments (43.27 km),covering a total of 52% of the coastline. The second interval,0.127–0.252 ms−1, is distributed in six segments (25.97 km),making up 32% of the coast. The other intervals are presentedin a smaller number of segments and extensions: 0.253–0.388 ms−1 in two segments (6.91 km, 8%), 0.379–0.504 ms−1 (2.16 km, 3%) and 0.505–0.63 ms−1 (4.09 km,5%) in one segment each.
Average backshore height: the average altimetric variationbetween the coastline and a distance of 100m in the direction ofthe Santa Catarina Island was calculated at several points in thearea. From the obtained results, four classes were assigned ac-cording to the proximity of the coastline to potential sources ofsedimentary supply, using the quantile classification scheme.The classes of smaller variation correspond to the plain andthe ones of greater variation show the presence of hills. The
four classes correspond to: Class 1: 0.0 m (44 km, 54%); Class2: 0.00–2.5 m (12.59 km, 15%); Class 3: 2.5–4.5 m (14.9 km,18%); Class 4: 4.5–24 m (10.89 km, 13%) (Fig. 6).
Degree of exposure to wind waves: through the appli-cation of the Wind Fetch Model extension, in ArcGIS10.1, simulations were generated for three wind direc-tions: North (0°), more frequent; South (180°), moreintense; and West (270°) due to its direct incidence overthe analyzed coast, determining the extent of the avail-able wind fetch in meters. The three calculated fieldswere unified in a single product, using the ArcGISRaster Calculator tool, and the obtained values wereregrouped also using the quantile classification. Fiveclasses of wind distribution were proposed (Fig. 7), to-taling 28 segments along the coast: low exposure isdistributed along 10 segments (55.38 km, 67%); medi-um low exposure in 10 segments (16.9 km, 20%); me-dium exposure in two segments (4.66 km, 6%); mediumhigh exposure in two segments (1.72 km, 2%); and highexposure in four segments (3.74 km, 5%).
Third-order attributes
Backshore features: the backshore features total 27 seg-ments along the coast (Fig. 8). The class hill on therearguard is distributed along six segments (11.2 km,13%), dunes and littoral strands (3.39 km, 4%) in onesegment each, mangrove and marshes in six segments(29.76 km, 36%), urban under coastal plain in anothersix segments (22.74 km, 28%), urban with hill on therearguard along five segments (7.98 km, 10%), urbanunder mangroves in tow segments (4.97 km, 6%), andcoastal plain (2.36 km, 3%).
Table 3 Classes and numerical intervals adopted by the WCVI
Classes Very Low Low Moderate High Very High
WCVI 1,0 – 1,2 1,3 – 1,7 1,8 – 2,2 2,3 – 2,7 2,8 – 3,0
Fig. 3 Geological map of the area, adapted from Horn Filho and Livi (2013), and its linearized representation for vulnerability analysis
Y. G. da Silveira, J. Bonetti
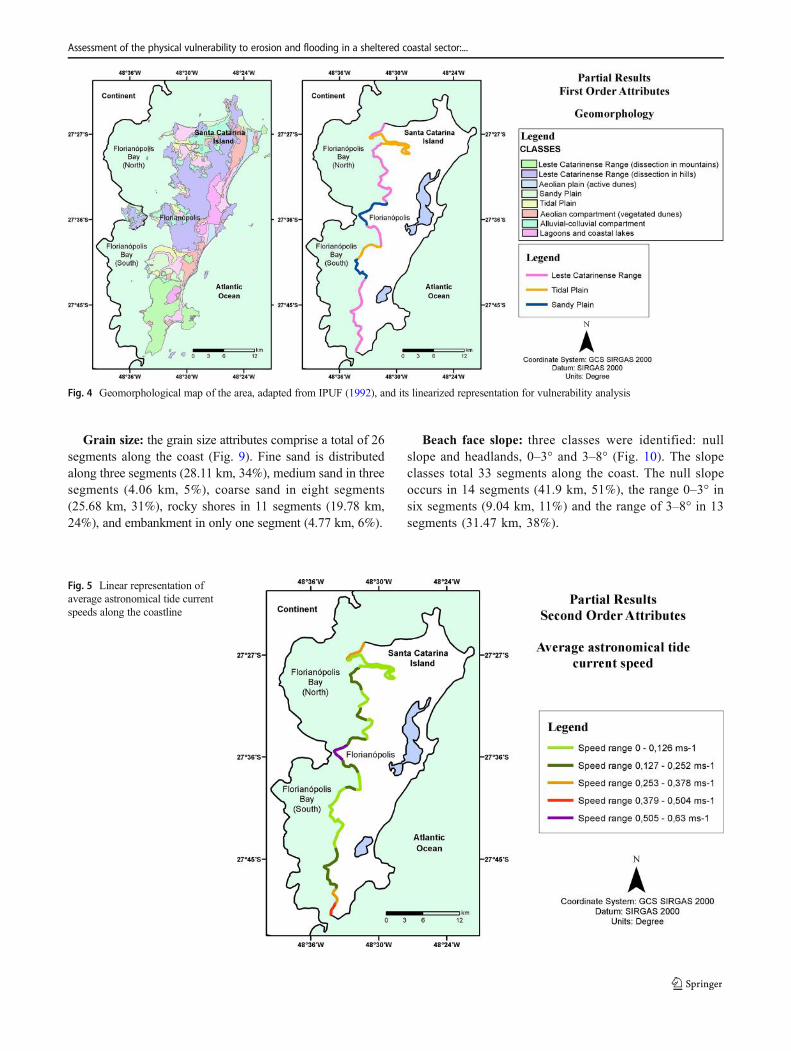
Grain size: the grain size attributes comprise a total of 26segments along the coast (Fig. 9). Fine sand is distributedalong three segments (28.11 km, 34%), medium sand in threesegments (4.06 km, 5%), coarse sand in eight segments(25.68 km, 31%), rocky shores in 11 segments (19.78 km,24%), and embankment in only one segment (4.77 km, 6%).
Beach face slope: three classes were identified: nullslope and headlands, 0–3° and 3–8° (Fig. 10). The slopeclasses total 33 segments along the coast. The null slopeoccurs in 14 segments (41.9 km, 51%), the range 0–3° insix segments (9.04 km, 11%) and the range of 3–8° in 13segments (31.47 km, 38%).
Fig. 4 Geomorphological map of the area, adapted from IPUF (1992), and its linearized representation for vulnerability analysis
Fig. 5 Linear representation ofaverage astronomical tide currentspeeds along the coastline
Assessment of the physical vulnerability to erosion and flooding in a sheltered coastal sector:...

Map of physical vulnerability to erosion and flood
The integration of the proposed attributes resulted in low to veryhigh vulnerability, showing a predominance of the moderate(49.42 km, 60,1%) and low (25.83 km, 31,3%) classes. Thetwo most vulnerable classes occur at low frequencies, namely:high with 7,6% (6.3 km) and very high 1% (0.85 km) (Fig. 11).
The occurrence of low vulnerability sectors is mainly dueto the presence of weak tidal current speeds, low or medium-low exposure to wind-generated waves, and of non-urbanizedor urbanized areas with a backshore whose terrain character-istics promote resistance to erosion and flooding. Where mod-erate vulnerability is observed, astronomical tidal currentspeed increases, the beach face presents a steeper slope, and
Fig. 6 Linear representation of average backshore height along the coastline
Fig. 7 Linear representation of the degree of exposure to wind waves along the coastline
Y. G. da Silveira, J. Bonetti

urbanized or non-urbanized sectors with low resistance to thelocal physical conditions occur, such as coastal plain andmangrove-marshes environments. High vulnerability is pres-ent in a segment at the north of Pontal de Daniela, in thecentral area and in a small extension of Sambaqui Beach andTapera da Base Beach. In these three locations, strong astro-nomical tidal current speeds and a high degree of exposure towind-generated waves are observed and, in the central area,dense urbanization and the susceptible coastal plain classes
dominate. The Pontal de Daniela is the only sector that pre-sents very high vulnerability, mainly due to its high exposureto the waves generated by the wind and the presence of thebackshore feature dunes and littoral strands, highly suscepti-ble to erosion.
These results can complement, to a certain extent, thoseobtained by Ruddorf and Bonetti (2010), Muler and Bonetti(2014) andMussi et al. (2018); authors that assessed the coast-al vulnerability of exposed environments over Santa Catarina
Fig. 8 Linear representation of the backshore features along the coastline
Fig. 9 Linear representation ofthe grain size distribution alongthe coastline, based onHorn Filho(2006)
Assessment of the physical vulnerability to erosion and flooding in a sheltered coastal sector:...

Island. In their physical vulnerability assessments, Rudorffand Bonetti (2010) used Geoindicators, Muler and Bonetti(2014) the Coastal Vulnerability Index (CVI), while Mussiet al. (2018) applied a modified Smartline methodology.
Due to the greater variability in the morpho- and hydrody-namic behavior of the open coastal environments, they presenta greater range of physical attributes and vulnerability levels,such as degrees of exposure to different wave heights anddirectional energies, meteorological tide amplitude exposures,dune configurations (height and state of frontal and interior
dunes), and beach state morphology (reflective, dissipative, orintermediate; for example). Thus, the vulnerabilities obtainedby the mentioned authors are, accordingly, more comprehen-sive, being usually adopted of a wider range of variables,research approaches and classification schemes.
The lower exposure of the sheltered environments to phys-ical hazards forcing is the main difference between shelteredand the exposed environments. For example, in sheltered en-vironments while astronomical tidal currents may be moreeffective, there is limited response ocean wave incidence.
Fig. 10 Linear representation ofthe beach face slope along thecoastline
Fig. 11 Map of physicalvulnerability to erosion andflooding along the studiedcoastline
Y. G. da Silveira, J. Bonetti
Thus, waves generated by the local wind play an essential rolein the hydrodynamics, with greater response of the environ-ment, but with a lower capability of modifying the coastalmorphology or allowing water intrusion into inner sectors ofthe backshore.
The tendency is that exposed coasts present greater vari-ability in their degrees of vulnerability, while sheltered onescan be segmented basically into a few classes. The area inves-tigated in this paper, therefore, is dominated by low and mod-erate sectors, with occasional and very short segments of highvulnerability.
The results obtained by Mussi et al. (2018) also cover thesheltered coast of Santa Catarina Island. Thus, it was possibleto compare two applications of the same model in the areaunder investigation. In their research, the authors used thesame attributes for both sheltered and exposed systems, sothe response of the sheltered coast was limited in some as-pects, being classified between sectors of very low and lowvulnerability. On the other hand, in the present research thesheltered environment was valued by using specific attributesthat imply greater responses from this environment, resultingin an increased degree of costal vulnerability. Thus, it is no-ticeable that the choice of the physical descriptors influencesthe final classification of the system vulnerability. The amountand variability of the coastal segments depend on the datascale/resolution of the original data, but the degree of vulner-ability (very low to very high) is directly reliant on the phys-ical attributes that are considered.
Another aspect, related to the aforementioned lower energyavailability in sheltered coasts, is the dominance of geologicaland morphological factors on the determination of the overallphysical vulnerability, which may be locally modeled bysecond- and third-order elements. In this sense, it must benoticed that the chosen first-order variables Geology andGeomorphology (which represent the structural frameworkof the site) have a high degree of redundancy. Consideringthat sedimentary deposits may induce different morphologiesand that different degrees of vulnerabilities could be assignedto them in a more representative way, we propose the use ofthe sole variable Geomorphology as first-order structural datain future researches.
Conclusions
The Smartline Methodology was smooth to perform, and theproposed scheme of attribute hierarchization contributed to abetter perception and representation of the factors involved inthe physical vulnerability of sheltered coastal environments.
Following this methodology, most of the study area wasclassified almost equally among sectors of low and moderatevulnerability, with occasional occurrences of high vulnerabil-ity. Some moderate vulnerability segments, such as in the
central portion of the study area, present high urbanizationvery close to the coastline and may deserve special attentionfrom public management agencies.
From the comparison of this research with coastal vulner-ability investigations carried out in exposed areas of SantaCatarina Island it was observed that exposed coasts offergreater variability of physical elements for analysis, allowingthe use of broader approaches for the assessment.
The obtained assessment of physical vulnerability to coast-al erosion and flooding in local scale can be useful in publicmanagement policies, such as urban development and riskmanagement plans, as well as in the prevention of environ-mental disasters. However, this research also pointed out the ascarcity of studies about physical vulnerability of shelteredcoasts, so the effectiveness of its practical use is a topic thatrequires more investigation.
Acknowledgments The authors wish to acknowledge AntheaCzizeweski for providing the data used for the calculation and classifica-tion of astronomical tide current speeds. This reserach was partially spon-sored by FAPESC (Chamada Pública 05/2015) and CNPq (Processo:307797/2016-3).
References
Abuodha PAO, Woodroffe CD (2010) Assessing vulnerability to sea-level rise using a coastal sensitivity index: a case study fromSoutheast Australia. J Coast Conserv 14(3):189–205. https://doi.org/10.1007/s11852-010-0097-0
Basei, M.A.S. (1985) O cinturão Dom Feliciano em Santa Catarina.Thesis. University of São Paulo
Bayani-Arias JK, Dorado MA, Dorado RA (2012) Economic vulnerabil-ity and analysis of adaptation options to coastal erosion in SanFernando, LA Union. Journal of Environmental Science andManagement 15(2):35–49
Bonetti J, Nunes MG, Oliveira MSC, Gré JCR (1998) Caracterização doRelevo Submerso da Baía Norte–SC Com Base na Aplicação de umModelo Digital de Terreno. GEOSUL, II Simpósio Nacional deGeomorfologia, Florianópolis 27(14):211–217
Bonetti J, Klein AHF, Muler M, De Luca CB, Silva GV, Toldo Jr. EE,González M (2013a) Spatial and numerical methodologies on coast-al erosion and flooding risk assessment. In: Finkl, C. (Ed) CoastalHazards. Chapter 16. Coastal Research Library Series. Springer,Dordrecht, p. 423–442
Bonetti J, Klein AHF, Sperb RM (2013b) PREFACE - Geotechnologiesapplied to coastal studies. J Coast Conserv 17(2):197–199
Bonetti J, Woodroffe CD (2017) Spatial analysis on GIS for coastal vul-nerability assessment. In: Bartlett D, Celliers L (eds) Geoinformaticsfor marine and coastal management. Chapter, vol 16. CRC Press,Boca Raton, pp 367–396
CEPAL - Comision Economica Para America Latina (2015) Generación eintegración de bases de datos climáticas históricas y de proyeccionesde cambio climático para la gestión de riesgos costeros en el estadode Santa Catarina. Brasil. Nações Unidas, Santiago, p 1126
Di Paola G, Aucelli PPC, Benassai G, Iglesias J, Rodríguez G (2017) Theassessment of the coastal vulnerability and exposure degree of granCanaria Island (Spain) with focus on the coastal risk of las CanterasBeach in Las Palmas de gran Canaria. J Coast Conserv. https://doi.org/10.1007/s11852-017-0574-9
Assessment of the physical vulnerability to erosion and flooding in a sheltered coastal sector:...
Franklin-Silva L (2002) Identificação de Sub-ambientes na Baía Sul (SC)com Base na Análise de Variáveis Oceanográfico-Sedimentares.Federal University of Santa Catarina, Dissertation
Goodfellow BW, Stephenson WJ (2005) Beach morphodynamics in astrong-wind bay: a low-energy environment? Mar Geol 214:101–116. https://doi.org/10.1016/j.margeo.2004.10.022
Gornitz VM, Daniels RC, White TW, Birdwell KR (1992) The develop-ment of a costal risk assessment database: vulnerability to sea levelrise in U.S. southeast. Journal of coastal research. Special Issue 12:327–338
Hegge BJ, Eliot I, Hsu J (1996) Sheltered sandy beaches of southwesternAustralia. J Coast Res 12:748–760
Horn Filho NO (2003) Setorização da província costeira de SantaCatarina em base aos aspectos geológicos, geomorfológicos egeográficos. GEOSUL 18(35):284–288
Horn Filho NO (2006) Granulometria das praias arenosas da ilha de SantaCatarina, SC. Gravel 4:1–21
Horn Filho NO, Livi NS (2013) Mapa geoevolutivo da planície costeirada ilha de Santa Catarina, SC, Brasil. In: Horn Filho NO (ed) Atlasgeológico das praias arenosas da ilha de Santa Catarina, SC. FederalUniversity of Santa Catarina, Brasil, p 228
IPUF - Instituto de Planejamento Urbano de Florianópolis (1992)Mapeamento temático do Município de Florianópolis. Geologia,Geomorfologia, Solos e Vegetação. Síntese Temática, DOI: https://doi.org/10.17226/2022
IPCC - Intergovernmental panel on climate change (2014) Climatechange 2014: synthesis report. Contribution of working groups i, iiand iii to the fifth assessment report of the intergovernmental panelon climate change (Core writing team, R.K. Pachauri and L.a.Meyer [Eds.]). IPCC, Geneva, Switzerland
Jackson NL, Nordstrom KF (1992) Site-specific controls on wind andwave processes and beach mobility on estuarine beaches. J CoastRes 8:88–98
Jackson NL, Nordstrom KF, Eliot I, Masselink G (2002) Low energysandy beaches in marine and estuarine environments: a review.Geomorphology 48:147–162. https://doi.org/10.1016/S0169-555X(02)00179-4
Jallow BP, Toure S, Barrow MMK, Mathieu AA (1999) Coastal zone ofthe Gambia and the Abidjan region on Côte d’Ivore: sea level risevulnerability, response strategies, and adaptation options. Clim Res12:129–136. https://doi.org/10.3354/cr012129
Klein AHF, Short AD, Bonetti J (2016) Santa Catarina beach systems. In:Short AD, Klein AHF (eds) Brazilian beach systems, coastal re-search library, vol 17. Springer, Switzerland, pp 465–506
Lins de Barros FM, Muehe D (2013) The smartline approach to coastalvulnerability and social risk assessment applied to a segment of theeast coast of Rio de Janeiro state, Brazil. J Coast Conserv 17(2):211–223. https://doi.org/10.1007/s11852-011-0175-y
Masselink GA, Short AD (1993) The effect of tide range on beachmorphodynamics and morphology: a conceptual beach model. JCoast Res 9(3):785–800
Merlotto A, Bértola GR, Piccolo MC (2016) Hazard, vulnerability andcoastal erosion risk assessment in Necochea municipality, Buenos
Aires Province. Argentina. J Coast Conserv 20(5):351–362. https://doi.org/10.1007/s11852-016-0447-7
Muler M, Bonetti J (2014) An integrated approach to assess wave expo-sure in coastal areas for vulnerability analysis.Mar Geod 37(2):220–237. https://doi.org/10.1080/01490419.2014.902886
Mussi CS, Bonetti J, Sperb RM (2018) Coastal sensitivity and populationexposure to sea level rise: a case study on Santa Catarina Island,Brazil. J Coast Conserv. https://doi.org/10.1007/s11852-018-0619-8
National Research Council (2007) Mitigating shore erosion along shel-tered coasts. The National Academies Press, 188p,Washington, DC.https://doi.org/10.17226/11764
Nguyen TTX, Bonetti J, Rogers K, Woodroffe CD (2016) Indicator-based assessment of climate-change impacts on coasts: a review ofconcepts approaches and vulnerability indices. Ocean Coast Manag123:18–43. https://doi.org/10.1016/j.ocecoaman.2015.11.022
Nordstrom KF (1992) Estuarine Beaches. Elsevier Applied Science, n.67, 225p
Pierce LR (2004) Lake waves, coarse clastic beach variability and man-agement implications, Loch Lomond, Scotland,UK. J Coast Res 20:562–585
Rangel-Buitrago N, Anfuso G (2015) Review of the existing risk man-agement methods. In: Rangel-Buitrago and Anfuso (Eds.) Risk as-sessment of storms in coastal zones: case studies from Cartagena(Colombia) and Cadiz (Spain). Springer, Dordrecht, theNetherlands, pp 7–13
Rangel-Buitrago N, Jonge VN, Neal W (2018) How to make integratedcoastal Erosion management a reality. Ocean & CoastalManagement 156:290–299. https://doi.org/10.1016/j.ocecoaman.2018.01.027
Ruddorf FM, Bonetti J (2010) Avaliação da suscetibilidade à erosãocosteira de praias da Ilha de Santa Catarina. Brazilian Journal ofAquatic Science and Technology 14(1):9–20. https://doi.org/10.14210/bjast.v14n1.p9-20
Sharples C (2006) Indicative mapping of tasmanian coastal geomorphicvulnerability to sea-level rise using gis line map of coastal geomor-phic attributes. Explanatory report (first edition). Consultant reportto Department of Primary Industries and Water. Tasmania
Sharples C,Mount R, Pedersen T (2009) The Australian coastal smartlinegeomorphic and stability map. Version 1: manual and data dictio-nary. V. 1.0. Report for Geoscience Australia and the Department ofClimate Change, by School of Geography and EnvironmentalStudies, University of Tasmania. Hobart, Australia
Short AD (1999) Handbook of beach and shoreface morphodynamics.Wiley, England. https://doi.org/10.1080/095530099139908
Snoussi M, Ouchani T, Niazi S (2008) Vulnerability assessment of theimpacto f sea-level rise and flooding on theMoroccan coast: the caseof the Mediterranean eastern zone. Estaurine, Coastal and ShelfScience 77:206–213
Tomazzoli EE, Pellerin JM (2015) Unidades do mapa geológico da Ilhade Santa Catarina: as rochas. GEOSUL 30(60):225–247. https://doi.org/10.5007/2177-5230.2015v30n60p225
Wright LD, Short AD (1984) Morphodynamics variability of surf zonesand beaches: a synthesis. Mar Geol 56:93–118. https://doi.org/10.1016/0025-3227(84)90008-2
Y. G. da Silveira, J. Bonetti