
Assessment of Smolt Condition for Travel Time Analysis …/67531/metadc628178/m2/1/high... · the...
146
Assessment of Smolt Condition for Travel Time Analysis Annual Report 1993-1994 U. S. Department of the Interior U. S. Geological Survey Biological Resources Division Columbia River Research Laboratory U. S. Department of Energy Bonneville Power Administration Division of Fish and Wildlife February 1999
Transcript of Assessment of Smolt Condition for Travel Time Analysis …/67531/metadc628178/m2/1/high... · the...
Assessment of Smolt Condition for TravelTime Analysis
Annual Report 1993-1994
U. S. Department of the InteriorU. S. Geological SurveyBiological Resources DivisionColumbia River Research Laboratory
U. S. Department of EnergyBonneville Power AdministrationDivision of Fish and Wildlife
February 1999

Assessment of Smolt Condition for Travel Time Analysis
Annual Report 1993-1994
Prepared By
Robin M. SchrockPhilip V. HanerKaren M. Hans
John W. BeemanScott P. VanderKooi
Jack D. HotchkissPamela A. PetrussoStanley G. SmithAlec G. Maule
U. S. Geological SurveyBiological Resources Division
Columbia River Research Laboratory5501A Cook-Underwood Rd.
Cook, Washington 98605
Prepared For
U. S. Department of EnergyBonneville Power Administration
Division of Fish and WildlifeP.O. Box 3621
Portland, Oregon 97028Project No. 87-401
Contract No. DE-A179-87BP35245
February 1999

i
ABSTRACT
The Assessment of Smolt Condition for Travel Time Analysis (ASCTTA) projectprovided information on the level of smoltification in Columbia River hatchery and wild salmonidstocks to the Fish Passage Center (FPC), for the primary purpose of in-river management offlows. The objective of the project was to evaluate smoltification of index hatchery releasegroups at traps on tributaries and at dams. A non-lethal microassay for gill sodium, potassiumATPase developed by the project was incorporated into the assessment program, and healthmonitoring for the severity of bacterial kidney disease (BKD) of index fish stocks continued as inprevious years.
Changes in management approaches in the basin were reflected in modifications ofASCTTA project objectives in 1993 and 1994, including: 1) use of additional reference stocks formonitoring and evaluation, at the request of regional fish managers; 2) changes in markingmethods and technology, with a shift from freeze-branded groups to passive integratedtransponder (PIT)-tagged individuals; and 3) monitoring of the migration with species groups inthe run-at-large rather than individual stocks.
Seasonal patterns of smolt development in wild and hatchery salmonids were evaluatedand compared. Intensive sampling of single hatchery stocks of known origin was replaced by agreater interest in the total migration and identification of specific migration reaches wheremortality occurred. In this capacity, the project participated in the Lower Granite Survival Studyin cooperation with the National Marine Fisheries Service. Further cooperation and technicalassistance was provided to the U. S. Fish and Wildlife Service (USFWS), Idaho Fishery ResourceOffice and Dworshak National Fish Hatchery, to study the effects of release time on juvenilemigration performance and adult returns.
Travel time analysis for the two-year period was delayed by the absence of specificmarked reference groups for the determination of migration rates through specific reaches. Although measures of smoltification were made on PIT-tagged individuals and run-at-large fish,several years of data were considered necessary to accommodate the change in the markingprogram and the large differences in flows and temperatures seen between 1993 and 1994.
Results of run-at-large comparisons between years showed that differences in ATPaselevels were marked at different flows and temperatures. Comparisons of fish collected fromLower Granite Reservoir to fish collected at Lower Granite Dam and Little Goose Damsuggested that collection, sampling and release was more stressful at dams than in the reservoir. Mucus lysozyme analysis, investigated as a potential method of determining the level ofsmoltification, provided the first reference mucus lysozyme levels for the index stocks.

ii
EXECUTIVE SUMMARY
The physiological assessment of juvenile salmonid migrants, summarized in weekly reportsto the Fish Passage Center for use in Water Budget management, remained the primary activity ofthe Assessment of Smolt Condition for Travel Time Analysis (ASCTTA) project during 1993 and1994. The Water Budget is a procedure for implementing flow augmentation and reservoiroperations measures to assist juvenile salmonid downstream emigration. The Water Budget isimplemented through a Coordinated Plan of Operation (CPO) developed by the U.S. Army Corpsof Engineers (COE) in cooperation with the Northwest Power Planning Council (NWPPC), FishPassage Center (FPC), Bonneville Power Administration (BPA), U.S. Bureau of Reclamation(USBR), fishery agencies, Indian tribes, utility companies, and others. The FPC makes CPOrequests based upon water supply forecasts and actual smolt passage indices in order to mitigatethe effect of decreasing flows on juvenile downstream passage. The FPC uses historical and real-time data including mark/recaptures, passage indices, fish condition, flows and flow forecasts,dissolved gas saturation, water temperature, spill, and hatchery release information to determinethe extent of CPO requests. In 1993 and 1994, the ASCTTA project provided weekly reports tothe FPC on condition factor (Kfactor) and gill Na+, K+-ATPase from run-at-large yearlingspring/summer chinook salmon (Oncorhynchus tshawytscha), subyearling fall chinook salmon,and steelhead (O. mykiss). The ASCTTA data were among the information used by the FPC todetermine flow augmentation requests to COE and private utilities that operate dams on theColumbia and Snake rivers.
Monitoring of the physiological condition of Columbia River basin juvenile salmonids,including chinook salmon, steelhead, and sockeye salmon (O. nerka), was conducted duringrearing and the annual juvenile migration in the Snake and Columbia rivers. This report providesphysiological data for the seventh and eighth years of the project. Changes in the monitoringprogram included incorporation of data from wild spring chinook salmon and steelhead from therun-at-large, sampling at traps on tributaries of the Columbia River, and evaluations ofsubyearling chinook salmon and sockeye salmon at Rock Island Dam. The use of passiveintegrated transponder (PIT)-tagged individuals rather than freeze-branded hatchery groups fortravel time analysis allowed us to assess the performance of both wild and hatchery fish asindividuals. The change in how fish were marked for identification for monitoring purposesforestalled annual travel time analysis. In addition, large differences between flows andtemperatures in 1993 and 1994 precluded this analysis until a multi-year database was available. A preliminary review of this data was included in the ASCTTA ten-year project review completedin 1998.
Biological monitoring methods developed by the project were applied to monitoring goals,and the results appeared in publications as peer-reviewed articles. The introduction of a new non-lethal method for gill ATPase analysis allowed release of all sampled fish, enabling them tocontinue migrating. Because it was no longer necessary to sacrifice fish for ATPase analysis,kidneys were no longer collected during the migration to determine the severity and prevalence ofbacterial kidney disease (BKD), although BKD screening continued for spring chinook salmon atSnake and mid-Columbia River hatcheries. Mucus lysozyme was determined in Columbia basinsalmonid stocks to determine if lysozyme measurements could be applied as an index of smoltdevelopment. Similar patterns of change in mucus lysozyme concentrations in different stocks

iii
during juvenile salmonid development suggest that stock reference levels may exist that could beused to distinguish different levels of smolt development.
The recognition by regional managers and agencies of the importance of physiologicalmonitoring as an evaluative tool for assessing fish performance under different rearing, release,migration, or passage conditions was evidenced by increased project participation in technicalassistance activities. We provided physiological monitoring assistance to index hatcheries, and toan Army Corps of Engineers (COE)-funded release study at Dworshak National Fish Hatchery, incooperation with the U. S. Fish and Wildlife Service Idaho Fishery Resource Office. Assistancewas also provided to a National Marine Fisheries Service study on survival of juvenile salmonidspassing through dams and reservoirs.

iv
ACKNOWLEDGEMENTS
We thank the Bonneville Power Administration, Fish Passage Center, U. S. Fish andWildlife Service, National Marine Fisheries Service, U. S. Army Corps of Engineers, IdahoDepartment of Fish and Game, Oregon Department of Fish and Wildlife, Washington Departmentof Fish and Wildlife, the Smolt Monitoring Program of the Chelan County Public Utility District,and the Nez Perce Tribe. The cooperation of managers and staff of federal and state hatcheries inthe Columbia and Snake River basins was instrumental to the project. We are also grateful to thestaff of the Columbia River Research Laboratory for their efforts.

v
DISCLAIMER
Although these data have been processed successfully on a computer system at the U.S.Geological Survey, Columbia River Research Laboratory, no warranty, expressed or implied, ismade regarding the accuracy or utility of the data on any other system or for general or scientificpurposes, nor shall the act of distribution constitute any such warranty. This disclaimer applies toboth individual use of the data and aggregate use with other data. It is strongly recommendedthat these data be acquired directly from a U.S. Geological Survey server and not indirectlythrough other sources which may have changed the data in some way. It is also stronglyrecommended that careful attention be paid to the contents of the metadata files associated withthese data. The U.S. Geological Survey shall not be held liable for improper or incorrect use ofthe data described and/or contained herein.
Mention of trade names or commercial products does not constitute endorsement orrecommendation for use by the U.S. Geological Survey, U.S. Department of the Interior.
If you have any questions or comments concerning this data product, please contact RobinSchrock at (509) 538-2299 ext. 231.
vi
TABLE OF CONTENTS
LIST OF TABLES ……………………………………………………………………. ix
LIST OF FIGURES ………………………………………………………………….. xi
LIST OF ASCTTA REPORTS ……………………………………………………… xv
LIST OF RELATED PUBLICATIONS ……………………………………………. xvi
CHAPTER ONE: Profiles of Gill Sodium, Potassium-Activated ATPase as an Index ofSmoltification in Hatchery and Wild Salmonids …………………………………… 1
ABSTRACT …………………………………………………………………… 1INTRODUCTION …………………………………………………………….. 1METHODS …………………………………………………………………….. 2
Sample Sites …………………………………………………………… 2Hatcheries ……………………………………………………… 2Traps …………………………………………………………… 3Dams ……………………………………………………………. 3
Sample Sizes …………………………………………………………… 3Tissue Collection and Analysis ……………………………………….. 3
RESULTS ………………………………………………………………………. 41993 Results ……………………………………………………………. 4
Yearling Chinook Salmon ……………………………………… 4Hatcheries ……………………………………………….. 4Traps …………………………………………………….. 4Snake River Dams ……………………………………….. 5Columbia River Dams …………………………………… 5
Subyearling Chinook Salmon …………………………………. 5Hatcheries ……………………………………………….. 5Columbia River Dams …………………………………… 5
Steelhead ……………………………………………………….. 6Hatcheries ……………………………………………….. 6Traps …………………………………………………….. 6Snake River Dams ……………………………………….. 6Columbia River Dams …………………………………… 6
Sockeye Salmon ………………………………………………… 7 1994 Results …………………………………………………………….. 7
Yearling Chinook Salmon ……………………………………… 7Hatcheries ………………………………………………… 7Traps ……………………………………………………… 7Snake River Dams ………………………………………… 8Columbia River Dams ……………………………………. 8
vii
Subyearling Chinook Salmon ………………………………….. 8Hatcheries ………………………………………………... 8Columbia River Dams ……………………………………. 8
Steelhead ………………………………………………………… 9Hatcheries ………………………………………………… 9Traps ……………………………………………………… 9Snake River Dams ………………………………………… 9Columbia River Dams …………………………………….. 9
Sockeye Salmon ………………………………………………….. 10DISCUSSION ……………………………………………………………………. 10CHAPTER ONE FIGURES ……………………………………………………. 15
CHAPTER TWO : Physiological Measurements in Support of Survival Estimates ofJuvenile Salmonids Passing through Dams and Reservoirs …………………………. 38
ABSTRACT ……………………………………………………………………... 38INTRODUCTION ………………………………………………………………. 38METHODS ………………………………………………………………………. 39
1993 ………………………………………………………………………. 39Reservoir Sampling ……………………………………………… 39Dam Sampling …………………………………………………… 39Statistical Analysis ………………………………………………. 40
1994 ………………………………………………………………………. 40Reservoir Sampling ……………………………………………… 40Dam Sampling …………………………………………………… 40Statistical Analysis ………………………………………………. 40
RESULTS ………………………………………………………………………… 411993 ………………………………………………………………………. 41
Gill Na+, K+-ATPase Activity …………………………………… 41Condition Factor ………………………………………………… 41Plasma Cortisol ………………………………………………….. 41Bacterial Kidney Disease ……………………………………….. 41Disease Screening ………………………………………………… 42
1994 ……………………………………………………………………….. 42Gill Na+, K+-ATPase Activity …………………………………… 42
DISCUSSION …………………………………………………………………… 42CHAPTER TWO TABLES ……………………………………………………. 44
CHAPTER THREE: Mucus Lysozyme as a Non-Lethal Measure of Health in PacificSalmon …………………………………………………………………………………… 48
ABSTRACT ……………………………………………………………………… 48INTRODUCTION ………………………………………………………………. 48METHODS ………………………………………………………………………. 50
Fish Collection Procedures ……………………………………………… 50Baseline Levels in Hatchery Reference Stocks …………………… 50

viii
Experimental Fish from Covered and Uncovered HatcheryRaceways ………………………………………………… 51
Disease Challenge Experiments …………………………………. 51Lysozyme Sample Collection …………………………………………… 52Lysozyme Analysis ………………………………………………………. 53Statistical Analysis ………………………………………………………. 53
RESULTS ………………………………………………………………………… 53Baseline Levels in Hatchery Reference Stocks ………………………… 53
Hatchery Release Groups …………………………………………. 53Adult Salmon ……………………………………………………… 53
Experimental Fish from Covered and Uncovered Hatchery Raceways 54Disease Challenge Experiments ………………………………………… 55
1993 Results ………………………………………………………. 551994 Results ………………………………………………………. 56
DISCUSSION ……………………………………………………………………. 56Baseline Levels in Hatchery Reference Stocks ………………………… 57
Juvenile Salmon …………………………………………………… 57Adult Salmon ……………………………………………………… 58
Experimental Fish from Covered and Uncovered Hatchery Raceways 58Disease Challenge Experiments ………………………………………… 58Conclusions ………………………………………………………………. 59
CHAPTER THREE TABLES ………………………………………………….. 61CHAPTER THREE FIGURES ………………………………………………… 68
REFERENCES ……………………………………………………………………………77
APPENDICES ……………………………………………………………………………. 85
ix
LIST OF TABLES
CHAPTER TWO :Table 1. Mean (±SE) gill Na+, K+-ATPase, condition factor (Kfactor), and plasma cortisol ofhatchery spring chinook salmon sampled during the Lower Granite Survival Study in 1993. Dataare arranged by releases within a site and by site. Mean values with letters in common differsignificantly from others within that group based on an F-test of differences between releaseswithin a site, or between sites (P � 0.05) (LRS = Lower Granite Reservoir; LGR = LowerGranite Dam; LGS = Little Goose Dam) …………………………………………………. 45
Table 2. Presence of bacterial kidney disease as percent positive (%Pos) and sample sizes ofhatchery spring chinook salmon sampled during the Lower Granite Survival Study in 1993. Achi-squared test was used to determine significant differences (P � 0.05) between releases from arelease site, or between release sites (LRS = Lower Granite Reservoir; LGR = Lower GraniteDam; LGS = Little Goose Dam) ………………………………………………………….. 46
Table 3. Mean (±SE) gill Na+, K+-ATPase in hatchery spring chinook salmon (HSPC) andhatchery steelhead (HSTH) sampled during the Lower Granite Survival Study in 1994. Meanvalues with letters in common differ significantly from others within that group based on an F-testof differences between releases within a site, or between sites (P � 0.05) (LRS = Lower GraniteReservoir; LGR = Lower Granite Dam; LGS = Little Goose Dam; LMN = LowerMonumental Dam) ………………………………………………………………………… 47
CHAPTER THREE :Table 1. Mean (±SE) nare mucus lysozyme concentration (µg ⋅ mL-1), release date, and samplesize (N) of juvenile chinook salmon released from Columbia and Snake River basin hatcheries in1994. Means with the same letter differ significantly (P � 0.05) (SPCH = spring chinook salmon;SUCH = summer chinook salmon; NFH = National Fish Hatchery; SFH = State FishHatchery) ………………………………………………………………………………….. 62
Table 2. Mean (±SE) plasma and secondary circulation lysozyme concentrations in adult chinooksalmon returning to Carson National Fish Hatchery in 1993 (N = sample size). Meanswith the same letter differ significantly (P � 0.05) ……………………………………….. 63
Table 3. Mean (±SE) serum, secondary circulation, skin mucus, and vent mucus lysozymeconcentrations in adult chinook salmon returning to Carson National Fish Hatchery in 1994 (N =sample size). Means with the same letter differ significantly (P � 0.05) ………………… 64
x
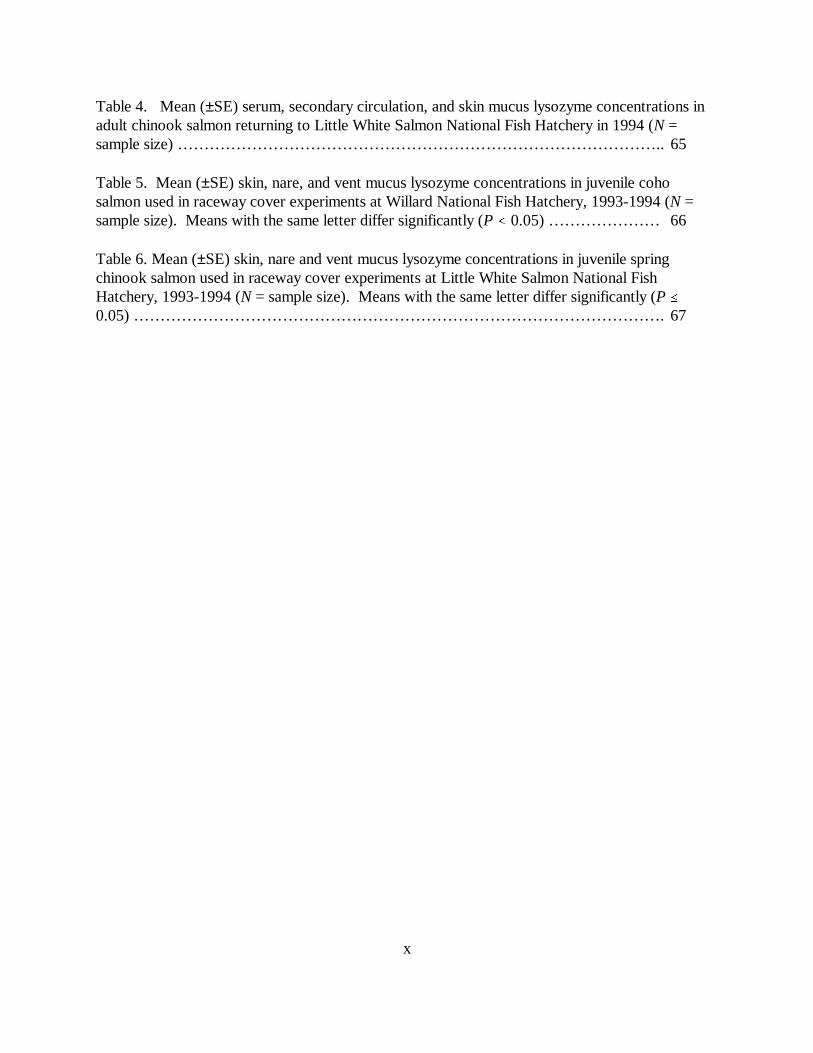
Table 4. Mean (±SE) serum, secondary circulation, and skin mucus lysozyme concentrations inadult chinook salmon returning to Little White Salmon National Fish Hatchery in 1994 (N =sample size) ……………………………………………………………………………….. 65
Table 5. Mean (±SE) skin, nare, and vent mucus lysozyme concentrations in juvenile cohosalmon used in raceway cover experiments at Willard National Fish Hatchery, 1993-1994 (N =sample size). Means with the same letter differ significantly (P � 0.05) ………………… 66
Table 6. Mean (±SE) skin, nare and vent mucus lysozyme concentrations in juvenile springchinook salmon used in raceway cover experiments at Little White Salmon National FishHatchery, 1993-1994 (N = sample size). Means with the same letter differ significantly (P �0.05) ………………………………………………………………………………………. 67

xi
LIST OF FIGURES
CHAPTER ONE:Figure 1. Mean (±SE) gill Na+, K+-ATPase activity (µmol Pi ⋅ mg protein-1 ⋅ h-1) for yearlingspring/summer chinook salmon sampled before release in 1993 from (a) Snake River basinhatcheries, and (b) Columbia River basin hatcheries; (c) subyearling chinook salmon beforerelease at Priest Rapids and Turtle Rock State Fish Hatcheries (SFH); and (d) steelhead sampledbefore release at Dworshak National Fish Hatchery (NFH) and Irrigon SFH. Data are listed inAppendices A.1, A.2, and A.3 ……………………………………………………………. 16
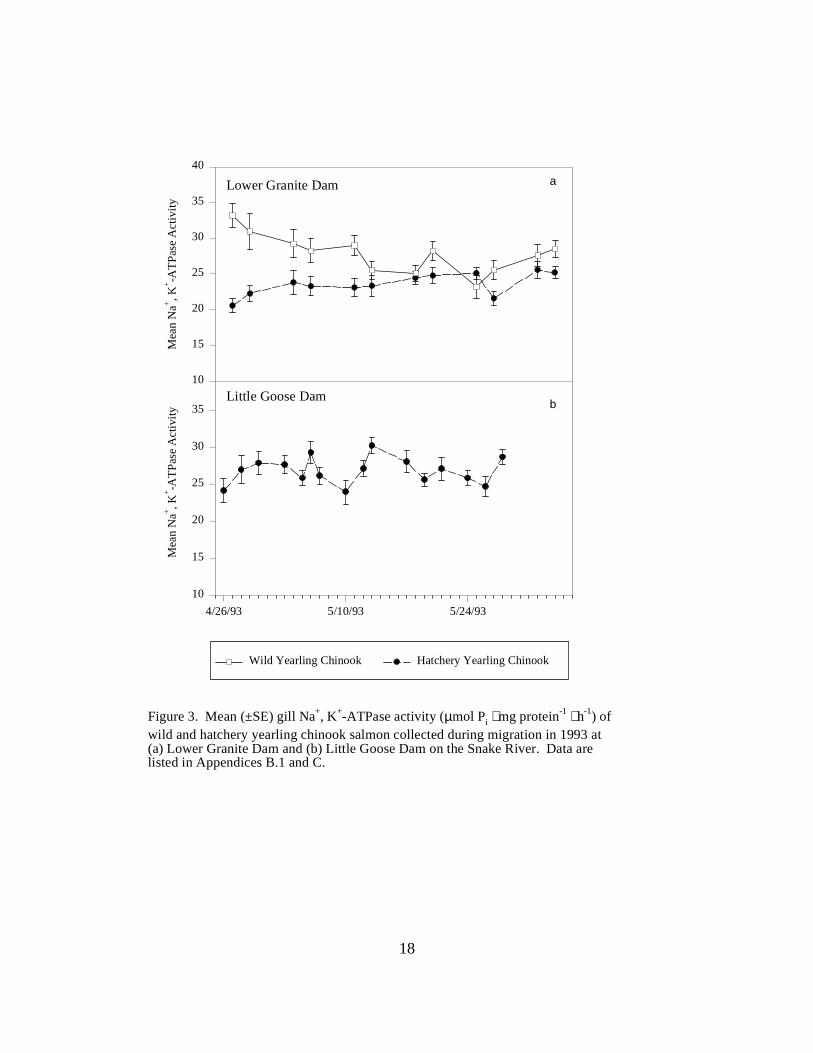
Figure 2. Mean (±SE) gill Na+, K+-ATPase activity (µmol Pi ⋅ mg protein-1 ⋅ h-1) of wild andhatchery yearling chinook salmon collected during migration in 1993 at (a) the Clearwater RiverTrap, (b) the Salmon River Trap, and (c) the Snake River Trap. Data are listed in AppendicesB.1 and C …………………………………………………………………………………. 17 Figure 3. Mean (±SE) gill Na+, K+-ATPase activity (µmol Pi ⋅ mg protein-1 ⋅ h-1) of wild andhatchery yearling chinook salmon collected during migration in 1993 at (a) Lower Granite Damand (b) Little Goose Dam on the Snake River. Data are listed in Appendices B.1 and C .. 18
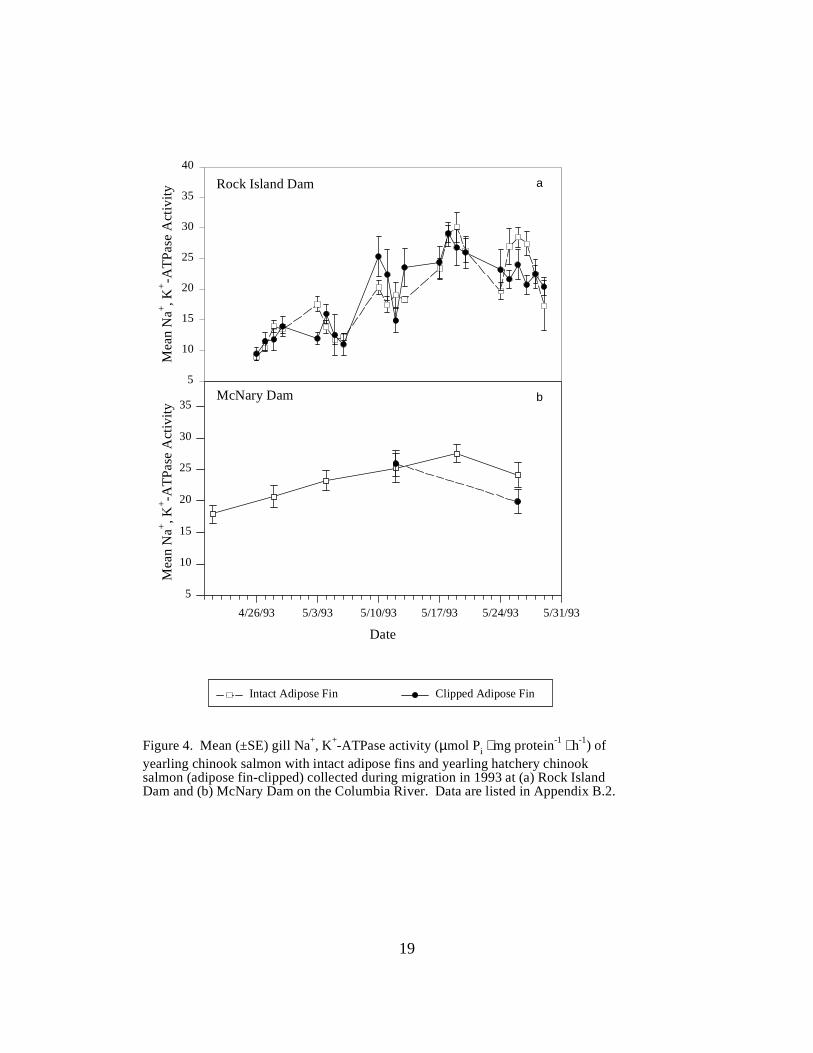
Figure 4. Mean (±SE) gill Na+, K+-ATPase activity (µmol Pi ⋅ mg protein-1 ⋅ h-1) of yearlingchinook salmon with intact adipose fins and yearling hatchery chinook salmon (adipose fin-clipped) collected during migration in 1993 at (a) Rock Island Dam and (b) McNary Dam on theColumbia River. Data are listed in Appendix B.2 ……………………………………….. 19 Figure 5. Mean (±SE) gill Na+, K+-ATPase activity (µmol Pi ⋅ mg protein-1 ⋅ h-1) of subyearlingfall chinook salmon collected during migration in 1993 at (a) Rock Island Dam, (b) McNary Dam,and (c) John Day Dam and Bonneville Dam, on the Columbia River. Data are listed inAppendix D ………………………………………………………………………………. 20
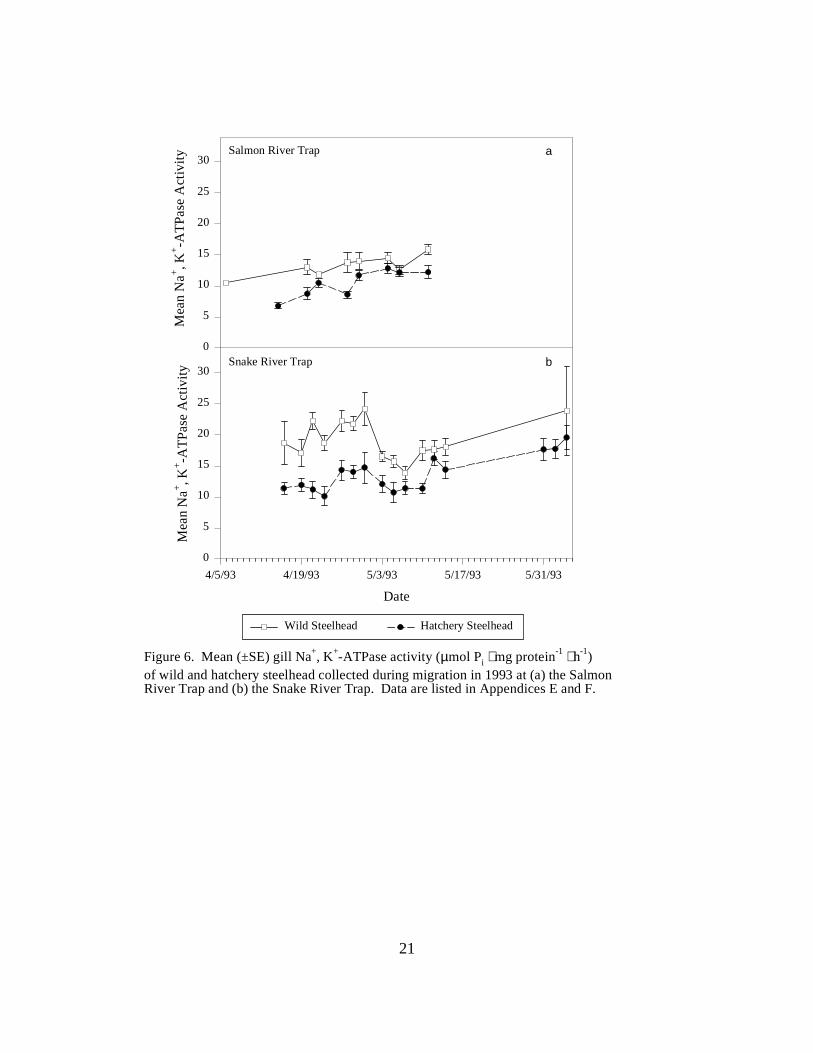
Figure 6. Mean (±SE) gill Na+, K+-ATPase activity (µmol Pi ⋅ mg protein-1 ⋅ h-1) of wild andhatchery steelhead collected during migration in 1993 at (a) the Salmon River Trap and (b) theSnake River Trap. Data are listed in Appendices E and F ………………………………. 21
Figure 7. Mean (±SE) gill Na+, K+-ATPase activity (µmol Pi ⋅ mg protein-1 ⋅ h-1) of wild andhatchery steelhead collected during migration in 1993 at (a) Lower Granite Dam, and (b) LittleGoose Dam on the Snake River. Data are listed in Appendices E and F ………………… 22
Figure 8. Mean (±SE) gill Na+, K+-ATPase activity (µmol Pi ⋅ mg protein-1 ⋅ h-1) of wild andhatchery steelhead collected during migration in 1993 at (a) Rock Island Dam and (b) McNaryDam on the Columbia River. Data are listed in Appendices E and F ……………………. 23
xii
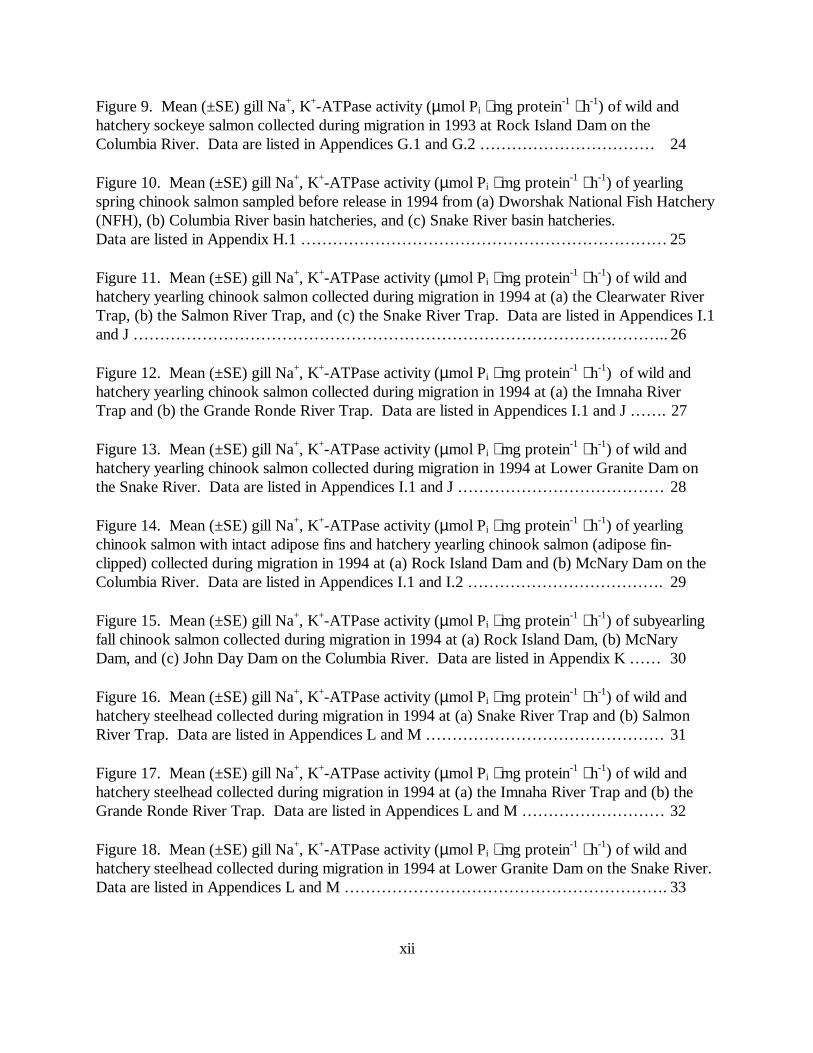
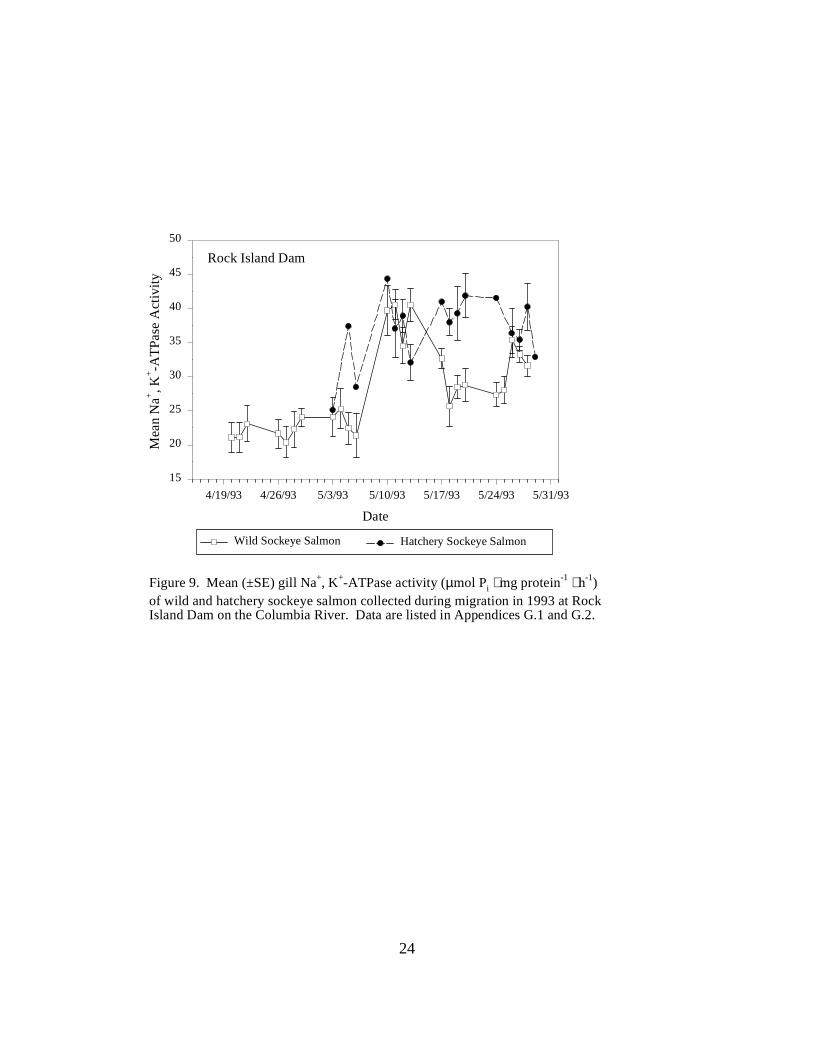
Figure 9. Mean (±SE) gill Na+, K+-ATPase activity (µmol Pi ⋅ mg protein-1 ⋅ h-1) of wild andhatchery sockeye salmon collected during migration in 1993 at Rock Island Dam on theColumbia River. Data are listed in Appendices G.1 and G.2 …………………………… 24
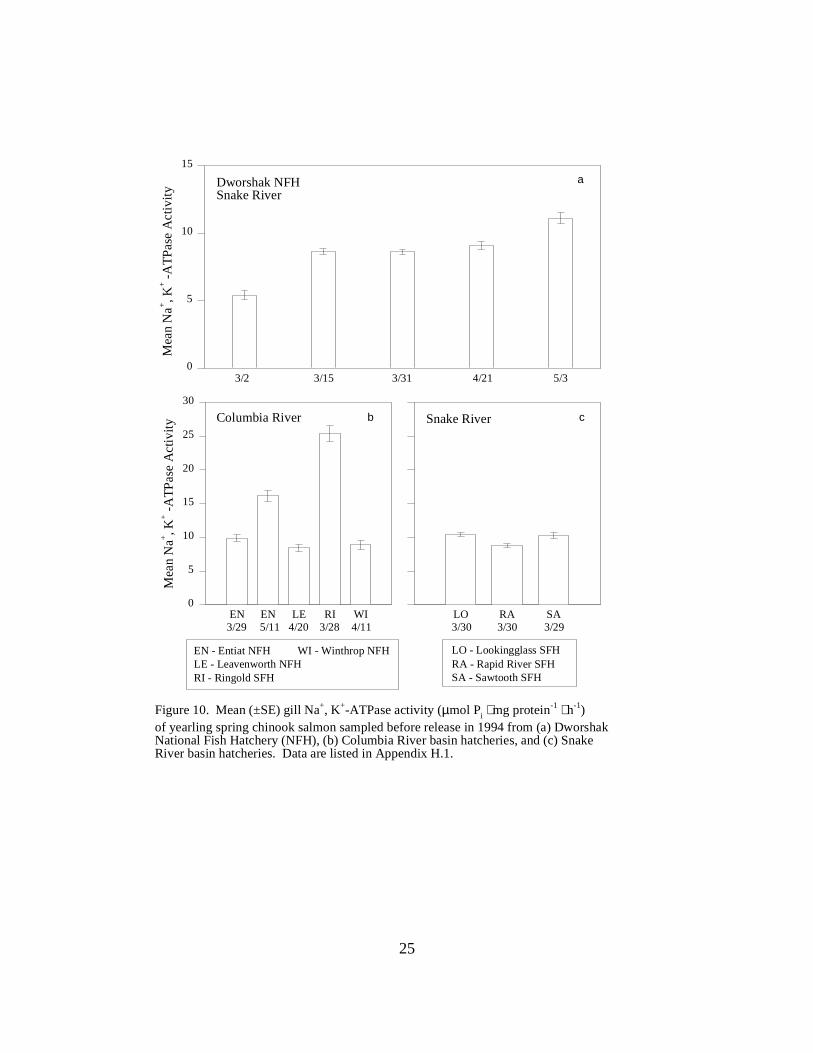
Figure 10. Mean (±SE) gill Na+, K+-ATPase activity (µmol Pi ⋅ mg protein-1 ⋅ h-1) of yearlingspring chinook salmon sampled before release in 1994 from (a) Dworshak National Fish Hatchery(NFH), (b) Columbia River basin hatcheries, and (c) Snake River basin hatcheries.Data are listed in Appendix H.1 …………………………………………………………… 25
Figure 11. Mean (±SE) gill Na+, K+-ATPase activity (µmol Pi ⋅ mg protein-1 ⋅ h-1) of wild andhatchery yearling chinook salmon collected during migration in 1994 at (a) the Clearwater RiverTrap, (b) the Salmon River Trap, and (c) the Snake River Trap. Data are listed in Appendices I.1and J ……………………………………………………………………………………….. 26 Figure 12. Mean (±SE) gill Na+, K+-ATPase activity (µmol Pi ⋅ mg protein-1 ⋅ h-1) of wild andhatchery yearling chinook salmon collected during migration in 1994 at (a) the Imnaha RiverTrap and (b) the Grande Ronde River Trap. Data are listed in Appendices I.1 and J ……. 27
Figure 13. Mean (±SE) gill Na+, K+-ATPase activity (µmol Pi ⋅ mg protein-1 ⋅ h-1) of wild andhatchery yearling chinook salmon collected during migration in 1994 at Lower Granite Dam onthe Snake River. Data are listed in Appendices I.1 and J ………………………………… 28
Figure 14. Mean (±SE) gill Na+, K+-ATPase activity (µmol Pi ⋅ mg protein-1 ⋅ h-1) of yearlingchinook salmon with intact adipose fins and hatchery yearling chinook salmon (adipose fin-clipped) collected during migration in 1994 at (a) Rock Island Dam and (b) McNary Dam on theColumbia River. Data are listed in Appendices I.1 and I.2 ………………………………. 29
Figure 15. Mean (±SE) gill Na+, K+-ATPase activity (µmol Pi ⋅ mg protein-1 ⋅ h-1) of subyearlingfall chinook salmon collected during migration in 1994 at (a) Rock Island Dam, (b) McNaryDam, and (c) John Day Dam on the Columbia River. Data are listed in Appendix K …… 30
Figure 16. Mean (±SE) gill Na+, K+-ATPase activity (µmol Pi ⋅ mg protein-1 ⋅ h-1) of wild andhatchery steelhead collected during migration in 1994 at (a) Snake River Trap and (b) SalmonRiver Trap. Data are listed in Appendices L and M ……………………………………… 31
Figure 17. Mean (±SE) gill Na+, K+-ATPase activity (µmol Pi ⋅ mg protein-1 ⋅ h-1) of wild andhatchery steelhead collected during migration in 1994 at (a) the Imnaha River Trap and (b) theGrande Ronde River Trap. Data are listed in Appendices L and M ……………………… 32
Figure 18. Mean (±SE) gill Na+, K+-ATPase activity (µmol Pi ⋅ mg protein-1 ⋅ h-1) of wild andhatchery steelhead collected during migration in 1994 at Lower Granite Dam on the Snake River.Data are listed in Appendices L and M ……………………………………………………. 33
xiii
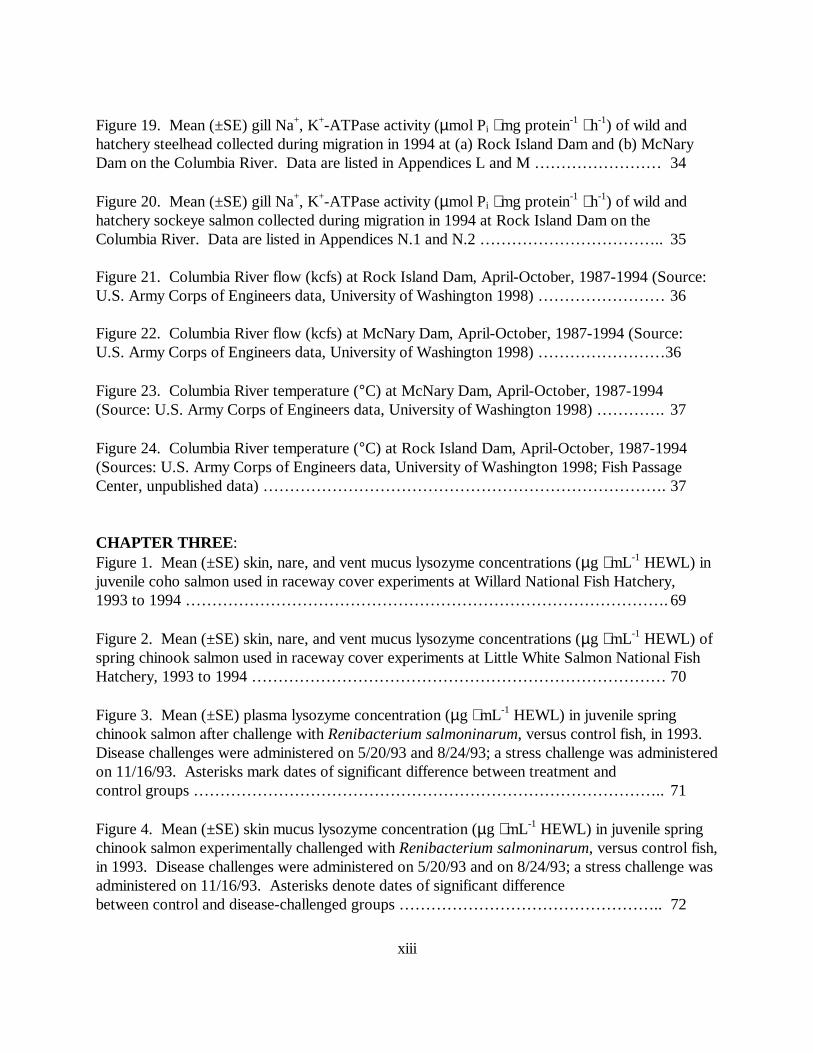
Figure 19. Mean (±SE) gill Na+, K+-ATPase activity (µmol Pi ⋅ mg protein-1 ⋅ h-1) of wild andhatchery steelhead collected during migration in 1994 at (a) Rock Island Dam and (b) McNaryDam on the Columbia River. Data are listed in Appendices L and M …………………… 34
Figure 20. Mean (±SE) gill Na+, K+-ATPase activity (µmol Pi ⋅ mg protein-1 ⋅ h-1) of wild andhatchery sockeye salmon collected during migration in 1994 at Rock Island Dam on theColumbia River. Data are listed in Appendices N.1 and N.2 …………………………….. 35
Figure 21. Columbia River flow (kcfs) at Rock Island Dam, April-October, 1987-1994 (Source:U.S. Army Corps of Engineers data, University of Washington 1998) …………………… 36
Figure 22. Columbia River flow (kcfs) at McNary Dam, April-October, 1987-1994 (Source:U.S. Army Corps of Engineers data, University of Washington 1998) ……………………36
Figure 23. Columbia River temperature (°C) at McNary Dam, April-October, 1987-1994(Source: U.S. Army Corps of Engineers data, University of Washington 1998) …………. 37
Figure 24. Columbia River temperature (°C) at Rock Island Dam, April-October, 1987-1994(Sources: U.S. Army Corps of Engineers data, University of Washington 1998; Fish PassageCenter, unpublished data) …………………………………………………………………. 37
CHAPTER THREE :Figure 1. Mean (±SE) skin, nare, and vent mucus lysozyme concentrations (µg ⋅ mL-1 HEWL) injuvenile coho salmon used in raceway cover experiments at Willard National Fish Hatchery,1993 to 1994 ………………………………………………………………………………. 69
Figure 2. Mean (±SE) skin, nare, and vent mucus lysozyme concentrations (µg ⋅ mL-1 HEWL) ofspring chinook salmon used in raceway cover experiments at Little White Salmon National FishHatchery, 1993 to 1994 …………………………………………………………………… 70
Figure 3. Mean (±SE) plasma lysozyme concentration (µg ⋅ mL-1 HEWL) in juvenile springchinook salmon after challenge with Renibacterium salmoninarum, versus control fish, in 1993. Disease challenges were administered on 5/20/93 and 8/24/93; a stress challenge was administeredon 11/16/93. Asterisks mark dates of significant difference between treatment andcontrol groups …………………………………………………………………………….. 71
Figure 4. Mean (±SE) skin mucus lysozyme concentration (µg ⋅ mL-1 HEWL) in juvenile springchinook salmon experimentally challenged with Renibacterium salmoninarum, versus control fish,in 1993. Disease challenges were administered on 5/20/93 and on 8/24/93; a stress challenge wasadministered on 11/16/93. Asterisks denote dates of significant differencebetween control and disease-challenged groups ………………………………………….. 72

xiv
Figure 5. Mean (±SE) vent mucus lysozyme concentration (µg ⋅ mL-1 HEWL) in juvenile springchinook salmon challenged with exposure to Renibacterium salmoninarum, versus control fish, in1993. Disease challenges were administered on 5/20/93 and 8/24/93; a stress challenge wasadministered on 11/16/93. Asterisks mark dates of significant difference between control andtreatment groups …………………………………………………………………………. 73
Figure 6. Mean (±SE) skin mucus lysozyme concentrations (µg ⋅ mL-1 HEWL) in juvenilespring chinook salmon challenged with exposure to Renibacterium salmoninarum, versuscontrol fish, in 1994. The disease challenge was administered on 6/1/94. Asterisks markdates of significant difference between values for treatment and control fish …………… 74
Figure 7. Mean (±SE) nare mucus lysozyme concentrations (µg ⋅ mL-1 HEWL) in juvenilespring chinook salmon challenged with Renibacterium salmoninarum, versus control fish,in 1994. The disease challenge was administered on 6/1/94. Asterisks denote significantdifference between control and treatment groups ………………………………………… 75
Figure 8. Mean (±SE) vent mucus lysozyme concentration (µg ⋅ mL-1 HEWL) in juvenilespring chinook salmon challenged with exposure to Renibacterium salmoninarum, versuscontrol fish, in 1994. The disease challenge was administered on 6/1/94 ……………….. 76
xv
LIST OF ASCTTA REPORTS
Beeman, J. W., D. W. Rondorf, J. C. Faler, M. E. Free, and P. V. Haner. 1990. Assessment ofsmolt condition for travel time analysis. Annual report 1989 (Contract DE-A179-87BP35245) to Bonneville Power Administration, Portland, Oregon.
Beeman, J. W., D. W. Rondorf, J. C. Faler, M. E. Free, P. V. Haner, S. T. Sauter, and D. A.Venditti. 1991. Assessment of smolt condition for travel time analysis. Annual Report1990 (Contract DE-A179-87BP35245) to Bonneville Power Administration, Portland,Oregon.
Maule, A. G., J. W. Beeman, R. M. Schrock, and P. V. Haner. 1994. Assessment of smoltcondition for travel time analysis. Annual report 1991-1992 (Contract DE-A179-87BP35245) to Bonneville Power Administration, Portland, Oregon.
Rondorf, D. W., J. W. Beeman, M. E. Free, and D. E. Liljegren. 1988. Correlation of biologicalcharacteristics of smolts with survival and travel time. Annual report 1987 (Contract DE-A179-87BP35245) to Bonneville Power Administration, Portland, Oregon.
Rondorf, D. W., J. W. Beeman, J. C. Faler, M. E. Free, and E. J. Wagner. 1989. Assessment ofsmolt condition for travel time analysis. Annual report 1988 (Contract DE-A179-87BP35245) to Bonneville Power Administration, Portland, Oregon.
Schrock, R. M., J. W. Beeman, P. V. Haner, K. M. Hans, J. D. Hotchkiss, S. T. Sauter, S. P.VanderKooi, W. L. Gale, P. A. Petrusso, and A. G. Maule. 1998. Assessment of smoltcondition for travel time analysis. Project review 1987-1997. Report (Contract DE-A179-87BP35245) to Bonneville Power Administration, Portland, Oregon. Internetpublication at http://www.efw.bpa.gov/Environment/EW/EWP/DOCS/REPORTS/DOWNSTRM/withpdf.htm.
xvi
LIST OF RELATED PUBLICATIONS
Beeman, J. W., D. W. Rondorf, and M. E. Tilson. 1994. Assessing smoltification of juvenilespring chinook salmon (Oncorhynchus tshawytscha) using changes in body morphology.Canadian Journal of Fisheries and Aquatic Sciences 51:836-844.
Beeman, J. W., D. W. Rondorf, M. E. Tilson, and D. A. Venditti. 1995. A non-lethal measureof smolt status of juvenile steelhead based on body morphology. Transactions of theAmerican Fisheries Society 124:764-769.
Haner, P. V., J. C. Faler, R. M. Schrock, D. W. Rondorf, and A. G. Maule. 1995. Skinreflectance as a non-lethal measure of smoltification for juvenile salmonids. NorthAmerican Journal of Fisheries Management 15:814-822.
Jones, R. N., and H. L. Burge. 1993. An evaluation of the effects of release time on the post-release performance and adult returns of spring chinook salmon at Dworshak and KooskiaNational Fish Hatcheries in 1993. Progress Report to Lower Snake River CompensationPlan Office, Idaho Fishery Resource Office, U. S. Fish and Wildlife Service, Ahsahka,Idaho.
Jones, R. N., and H. L. Burge. 1994. An evaluation of the effects of release time on the post-release performance and adult returns of spring chinook salmon at Dworshak and KooskiaNational Fish Hatcheries in 1994. Progress Report to Lower Snake River CompensationPlan Office, Idaho Fishery Resource Office, U. S. Fish and Wildlife Service, Ahsahka,Idaho.
Muir, W. D., S. G. Smith, R. N. Iwamoto, D. J. Kamikawa, K. W. McIntyre, E. E. Hockersmith,B. P. Sandford, P. A. Ocker, T. E. Reuhle, J. G. Williams, and J. R. Skalski. 1995.Survival estimates for the passage of yearling salmonids through Snake River dams andreservoirs, 1994. Annual report (Project Number 93-29) to Bonneville PowerAdministration, Portland, Oregon, and U.S. Army Corps of Engineers, Walla WallaDistrict, Walla Walla, Washington.
Schrock, R. M., J. W. Beeman, D. W. Rondorf, and P. V. Haner. 1994. A microassay for gillsodium, potassium-activated ATPase in juvenile Pacific salmonids. Transactions of theAmerican Fisheries Society 123:223-229.

1
CHAPTER ONE
Profiles of Gill Sodium, Potassium-Activated ATPase as anIndex of Smoltification in Hatchery and Wild Salmonids
Karen M. HansAlec G. Maule
John W. BeemanPhilip V. Haner
Jack D. HotchkissRobin M. Schrock
Scott P. VanderKooi
ABSTRACT
Seasonal profiles of smoltification of run-at-large groups of hatchery and wild stocks ofchinook salmon, steelhead, and sockeye salmon were determined by monitoring of gill Na+, K+-ATPase at hatcheries, traps, and dams on the Snake and Columbia rivers. A general increase ingill ATPase activity occurred over the migration season, and as fish moved downstream. Theeffect of annual differences in flow and temperature on the observed range of ATPase activities isdiscussed.
INTRODUCTION
Many agencies with biological and economic interests in water resource distribution in theColumbia River basin cooperate to ensure the successful seaward migration of juvenile Pacificsalmonids (Oncorhynchus spp.). Recent extensive modifications to fish passage facilities andhydrosystem configurations were designed to reduce delays in juvenile salmonid migration causedby river impoundment, which is believed to contribute to declines in adult returns. The delays arethought to arise from the interactions between fish physiological development and environmentalfactors, especially water flow and temperature, which alter migration behavior. We monitored gillsodium, potassium-activated adenosine triphosphatase (Na+, K+-ATPase) activity in juvenilesalmonids to assess smoltification level and migratory readiness prior to release from hatcheriesand during smolt emigration. Such information can be used to guide water managementdecisions, particularly flow regulation, so as to minimize travel time by consideration of thephysiological status of juvenile salmonids in the river. Weekly reports of ATPase results to theFish Passage Center were used to determine allotments from the Water Budget to increase flowsduring critical periods of the juvenile migration.
Sodium, potassium-activated ATPase is an enzyme involved in the absorption of NaClacross the gill epithelium of freshwater teleosts. In anadromous juvenile salmonids, ATPase isalso involved in excretion of NaCl upon entry into saltwater, when the flow of salts across the
2
gills is reversed (Hoar and Randall 1984; Borgatti et al. 1992). The determination of gill ATPaseactivity is an established method of assessing level of smoltification in juvenile salmon (Folmarand Dickhoff 1981; Zaugg 1982a; Dickhoff et al. 1985). Gill ATPase is often used incombination with other morphological, physiological and environmental variables as an indicatorof smoltification (Wedemeyer et al. 1980; Folmar and Dickhoff 1981; Zaugg 1982a; Dickhoff etal. 1985; Sower and Fawcett 1991). Reporting of gill ATPase activity on a weekly basis has beena routine part of smolt monitoring programs in the Columbia River basin (Beeman et al. 1991;Maule et al. 1994).
Absolute concentrations of gill ATPase vary among species and stocks, but there is acharacteristic profile of enzyme activity common to seaward-migrating salmonids. Duringhatchery residence, juvenile salmon exhibit low ATPase activity, with only a gradual increase overtime (Beeman et al. 1991; Maule et al. 1994). A rapid rise in ATPase activity occurs after the fishare released into the river, and the increase in activity continues until late in the migration(Beeman et al. 1991). If release from hatcheries is delayed, fish may experience decreasedATPase activity, followed by rapid increases upon release and during migration (Zaugg 1982a). Monitoring of annual smoltification profiles of salmonid stocks and evaluation of changes relatedto environmental factors allows identification of sources of variation among years. The objectivesof this study were to: 1) determine the level of smoltification, as indicated by gill ATPase activity,in juvenile yearling (spring/summer) chinook salmon (O. tshawytscha), subyearling (fall) chinooksalmon, sockeye salmon (O. nerka), and steelhead (O. mykiss) prior to release from hatcheries;and 2) describe ATPase activity in hatchery and wild fish from the run-at-large during seawardemigration. Results were provided to the Fish Passage Center for in-season management ofWater Budget flows to promote juvenile salmonid migration.
METHODS
Sample Sites
HatcheriesIn 1993 and 1994, spring chinook salmon were sampled at Sawtooth Hatchery and Rapid
River Hatchery (Idaho Department of Fish and Game, IDFG), and Dworshak National FishHatchery (NFH) in Idaho; and Ringold Hatchery (Washington Department of Fish and Wildlife,WDFW), Entiat NFH, Leavenworth NFH, and Winthrop NFH in Washington. Dworshak NFHspring chinook salmon were sampled three times before release as part of a study designed todetermine how release time affected migration rates (Jones and Burge 1993, 1994). Summerchinook salmon were sampled at McCall Hatchery (IDFG) in 1993 and 1994, and at WellsHatchery (WDFW) in Washington in 1994 only. Steelhead were sampled at Dworshak NFH, andat Irrigon Hatchery (Oregon Department of Fish and Wildlife, ODFW) during 1993 only. Subyearling fall chinook salmon were sampled at Priest Rapids Hatchery and Turtle RockHatchery (WDFW) in Washington. Five release groups of fall chinook salmon from Priest RapidsHatchery were also sampled at the 50th percentile of passage of the group through McNary Dameach year to determine travel times of marked groups of serially-released fish.
3
TrapsIn 1993, we sampled fish at traps operated by IDFG on the Salmon River, Clearwater
River and Snake River. Fish collected at these traps were held up to 24 h, anaesthetized andtagged with passive integrated transponder (PIT)-tags, then sampled for ATPase with a small,non-lethal gill clip. The Columbia and Snake rivers experienced above-normal precipitation andriver flow rates during spring 1993. Because of high flows, sampling was terminated earlier thanplanned at the Clearwater River and Salmon River traps, and was suspended at the Snake RiverTrap for a period of 17 days. In 1994, sampling was conducted at the Salmon, Clearwater, andSnake River traps and at two additional sites: the Imnaha River Trap, operated by the Nez PerceIndian Nation, and the Grande Ronde River Trap, operated by ODFW.
DamsSampling of chinook salmon and steelhead was conducted at juvenile bypass facilities at
Rock Island, McNary, John Day and Bonneville dams on the Columbia River, and at LowerGranite and Little Goose dams on the Snake River in 1993 and 1994. Sockeye salmon ofhatchery and wild origin were sampled at Rock Island Dam.
At smolt traps and dam collection facilities, we sampled both adipose fin-clipped and non-adipose fin-clipped chinook salmon and steelhead. Adipose fins of all hatchery steelhead in theColumbia River basin were removed by clipping before release, therefore all migrating steelheadwith intact adipose fins were assumed to be of wild origin. Snake River hatchery chinook salmonwere also adipose fin-clipped, and could be distinguished from wild fish at Snake River dams. However, chinook salmon with intact adipose fins captured from the Columbia River could havebeen of wild or hatchery origin due to release of unmarked fish from mid-Columbia basinhatcheries. Thus a comparison of wild and hatchery chinook salmon at mainstem Columbia Riverdams was not possible.
Sample Sizes
Our objective at hatcheries was to obtain 30 fish per sample. The sample size athatcheries was determined by power analysis to allow differentiation between parr and smoltsbased on ATPase values. At traps and dams, the sampling goal was to collect 20 to 40 springchinook salmon and 12 to 25 steelhead per site per day; sample sizes were determined by thenumber of PIT-tagged fish we expected to detect at downstream collection sites. Frequently,sample sizes at traps and dams were not attained on a given day, and more fish were sampled insubsequent days to reach weekly goals.
Tissue Collection and Analysis
Fish collected at hatcheries, traps, or dams were anaesthetized in 50 to 80 mg ⋅ L-1 tricainemethanesulfonate (MS-222), weighed to the nearest 0.1 g, and measured to the nearest millimeterfork length. A small piece of gill filament (about 2 × 3 mm; wet weight about 10 mg) was clipped
4
from the center third of the first gill arch on the left side of the fish. After fish were gill-clipped,they were allowed to recover in aerated water for 15 to 120 min and were then returned to thehatchery pond, river or juvenile bypass system. Gill tissue samples were placed in 1.5 mLmicrocentrifuge tubes and preserved in 0.5 mL chilled ATPase buffer solution. Samples wereshaken to break up filaments, set in an ice water bath for at least 5 min, frozen in liquid nitrogenfor transport, and later stored at −80 °C. At the time of each sampling, we recorded watertemperature and noted the external condition of each fish (e.g., descaling, lesions, and parasites).The microassay method developed by Schrock et al. (1994) was used for sampling and analysis todetermine ATPase levels in gill tissue. Gill ATPase activity is reported here in units ofmicromoles inorganic phosphate per milligram protein per hour (µmol Pi ⋅ mg protein -1 ⋅ h-1).
RESULTS
1993 Results
The Assessment of Smolt Condition for Travel Time Analysis project collected 8,512 gillsamples in 1993 using the non-lethal gill ATPase microassay. Sampling of 16 release groups wascompleted at 12 hatcheries in the Snake and Columbia River basins. Wild and hatchery steelhead,yearling chinook salmon, subyearling chinook salmon, and sockeye salmon were also sampled at 3smolt traps and 6 hydropower dams in the region.
Yearling Chinook SalmonHatcheries
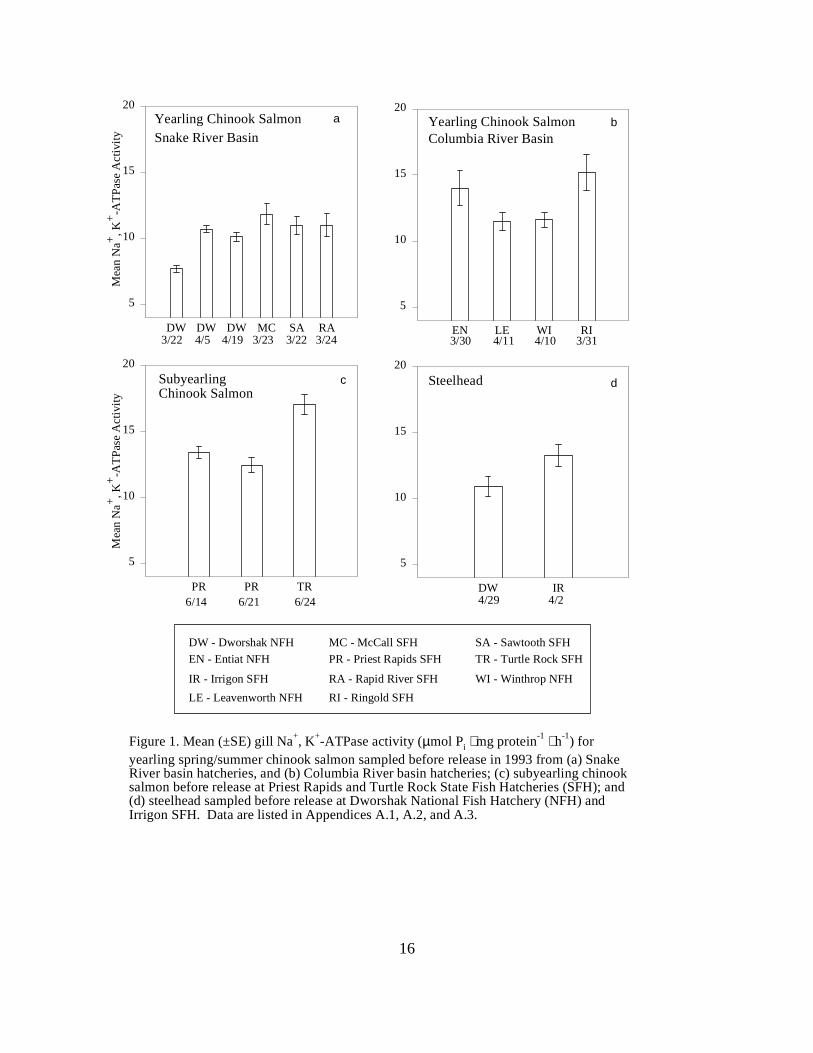
In 1993, yearling spring chinook salmon at Dworshak NFH showed an increase in meanATPase levels from 7.7 to 10.7 units between March 22 and April 19 (Figure 1a). Yearlingspring and summer chinook salmon in other Snake River and Columbia River basin hatcheriesshowed similar mean ATPase levels, ranging between 10.0 and 14.0 units, except for springchinook salmon from Ringold Hatchery, which had the highest mean ATPase value (15.2 units)(Figure 1b). Water temperature at Ringold was 13 °C at the time of sampling, compared to 5 to 6°C at the other hatcheries.
Traps Clearwater River Trap. The mean ATPase levels for hatchery chinook salmon at the ClearwaterRiver Trap started at 9.5 units, then gradually increased to 17.9 units by May, when the trap wasclosed due to high river flows. Mean ATPase levels for wild fish ranged between 13.6 and 18.2before the first week of May, when the mean activity reached 22.9 units (Figure 2a).
Salmon River Trap. Mean ATPase levels for hatchery chinook salmon at the Salmon River Trapranged between 9.1 and 17.4 units. ATPase levels of wild fish had a higher range, from 16.2 to20.5 units, throughout the sampling season (Figure 2b).
Snake River Trap. For the first three weeks of the 1993 sampling season, mean ATPase levels ofhatchery chinook salmon at the Snake River Trap ranged between 10.9 and 16.3 units (Figure 2c).
5
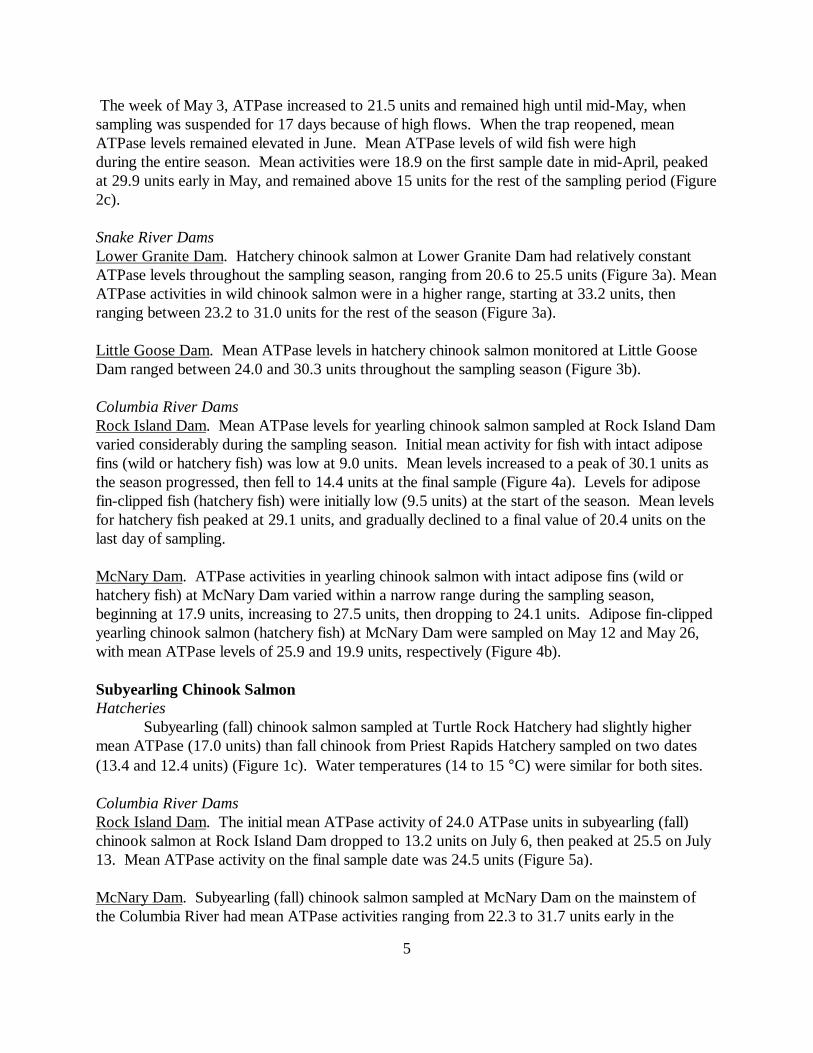
The week of May 3, ATPase increased to 21.5 units and remained high until mid-May, whensampling was suspended for 17 days because of high flows. When the trap reopened, meanATPase levels remained elevated in June. Mean ATPase levels of wild fish were highduring the entire season. Mean activities were 18.9 on the first sample date in mid-April, peakedat 29.9 units early in May, and remained above 15 units for the rest of the sampling period (Figure2c).
Snake River DamsLower Granite Dam. Hatchery chinook salmon at Lower Granite Dam had relatively constantATPase levels throughout the sampling season, ranging from 20.6 to 25.5 units (Figure 3a). MeanATPase activities in wild chinook salmon were in a higher range, starting at 33.2 units, thenranging between 23.2 to 31.0 units for the rest of the season (Figure 3a).
Little Goose Dam. Mean ATPase levels in hatchery chinook salmon monitored at Little GooseDam ranged between 24.0 and 30.3 units throughout the sampling season (Figure 3b).
Columbia River DamsRock Island Dam. Mean ATPase levels for yearling chinook salmon sampled at Rock Island Damvaried considerably during the sampling season. Initial mean activity for fish with intact adiposefins (wild or hatchery fish) was low at 9.0 units. Mean levels increased to a peak of 30.1 units asthe season progressed, then fell to 14.4 units at the final sample (Figure 4a). Levels for adiposefin-clipped fish (hatchery fish) were initially low (9.5 units) at the start of the season. Mean levelsfor hatchery fish peaked at 29.1 units, and gradually declined to a final value of 20.4 units on thelast day of sampling.
McNary Dam. ATPase activities in yearling chinook salmon with intact adipose fins (wild orhatchery fish) at McNary Dam varied within a narrow range during the sampling season,beginning at 17.9 units, increasing to 27.5 units, then dropping to 24.1 units. Adipose fin-clippedyearling chinook salmon (hatchery fish) at McNary Dam were sampled on May 12 and May 26,with mean ATPase levels of 25.9 and 19.9 units, respectively (Figure 4b).
Subyearling Chinook SalmonHatcheries
Subyearling (fall) chinook salmon sampled at Turtle Rock Hatchery had slightly highermean ATPase (17.0 units) than fall chinook from Priest Rapids Hatchery sampled on two dates(13.4 and 12.4 units) (Figure 1c). Water temperatures (14 to 15 °C) were similar for both sites.
Columbia River DamsRock Island Dam. The initial mean ATPase activity of 24.0 ATPase units in subyearling (fall)chinook salmon at Rock Island Dam dropped to 13.2 units on July 6, then peaked at 25.5 on July13. Mean ATPase activity on the final sample date was 24.5 units (Figure 5a).
McNary Dam. Subyearling (fall) chinook salmon sampled at McNary Dam on the mainstem ofthe Columbia River had mean ATPase activities ranging from 22.3 to 31.7 units early in the

6
migration season, in June and July. Beyond mid-July, mean ATPase levels slowly decreased, withminor fluctuations, to a low of 15.2 units in October (Figure 5b).
John Day Dam. Mean ATPase levels for fish at John Day Dam was 20.7 units on the first day ofsampling, increasing to 29.5 units as the season progressed, and declining to means of about 20units or less on the final three sampling dates (Figure 5c).
Bonneville Dam. From an initial mean of 22.0 units for subyearling (fall) chinook salmon atBonneville Dam, ATPase activity increased sharply to 31.5 a week later, and was 25.1 units whensampling ceased in September (Figure 5c).
SteelheadHatcheries
Steelhead from Irrigon Hatchery had a higher mean ATPase activity (13.3 units) thansteelhead sampled at Dworshak NFH (10.9 units) (Figure 1d). Water temperature at Irrigon (10°C) was higher than at Dworshak NFH (5 °C) at the time of sampling.
TrapsSalmon River Trap. Mean ATPase activities in both hatchery and wild steelhead at the SalmonRiver Trap gradually increased during the season. Hatchery fish had a lower range of meanactivities (6.8 to 12.8 units) than wild fish (10.5 to 15.9 units) (Figure 6a).
Snake River Trap. Mean ATPase activity in wild and hatchery steelhead captured in the SnakeRiver Trap differed throughout the 1993 sampling season. Mean ATPase activities were generallyhigher in wild fish, ranging between 13.9 and 24.2 units, whereas mean activities for hatchery fishwere between 10.1 and 19.6 units (Figure 6b).
Snake River DamsLower Granite Dam. The range of mean ATPase activities for wild steelhead (20.0 to 26.1) atLower Granite Dam was higher than for hatchery steelhead (12.9 to 20.3) (Figure 7a).
Little Goose Dam. At Little Goose Dam, mean ATPase levels for steelhead were consistentlyhigher in wild fish (19.4 to 28.2 units) than in hatchery fish (16.0 to 23.2 units) (Figure 7b).
Columbia River DamsRock Island Dam. Hatchery and wild steelhead at Rock Island Dam had similar mean ATPaseactivities throughout the season, with an approximate range of 14 to 20 for hatchery fish and 13to 23 units for wild fish. Mean levels in hatchery fish were generally lower on a given sample date(Figure 8a). McNary Dam. Differences in ATPase levels between hatchery and wild steelhead were seen earlyin 1993, when the mean ATPase activity was 28.9 units for wild fish and 17.7 units for hatcheryfish. Activities of wild and hatchery fish converged during May, and values for both wild andhatchery fish decreased from mid-May through the last sample date (Figure 8b).

7
Sockeye SalmonRock Island Dam. Wild sockeye salmon sampled at Rock Island Dam had moderately high meanATPase values, ranging between 21.1 and 25.0 units in April. Activity peaked in mid-May, with amean value of 40.5 units, then decreased to range between 25.6 and 35.4 units for the rest of theseason. The range of mean ATPase activities in hatchery sockeye salmon (25.1 to 44.3 units) wassimilar to the range in wild sockeye throughout May, but changes in activity levels occurred ondifferent dates (Figure 9).
1994 Results
In 1994, sampling of 15 release groups was completed at 11 hatcheries. Migrants of wildand hatchery origin were sampled at 5 traps on the Snake River and its tributaries, and 6hydropower dams on the Snake and Columbia rivers.
Yearling Chinook SalmonHatcheries
Mean ATPase levels in yearling spring chinook salmon at Dworshak NFH ranged from 5.4to 11.1 units between March 2 and May 3 (Figure 10a). Yearling spring chinook salmon at otherhatcheries showed similar mean ATPase ranges, between 8.0 and 16.2 units. As in 1993, RingoldHatchery yearling chinook salmon had the highest ATPase activity (25.4 units) of all hatcheriesstudied (Figure 10b). Water temperature at Ringold was 13 °C at the time of sampling, comparedwith 5 to 6 °C at the other hatcheries.
The mean ATPase activity for yearling summer chinook salmon sampled at McCallHatchery on March 30 was 11.2 units (Appendix H.4). Summer chinook salmon at WellsHatchery had mean ATPase activities of 9.4 on April 12 and 10.4 on June 14 (Appendix H.4).
TrapsClearwater River Trap. Mean ATPase levels for hatchery chinook salmon at the Clearwater RiverTrap varied between 8.0 and 15.3 units during sampling from early April to mid-May (Figure11a). Mean ATPase levels for wild fish were higher and ranged between 10.6 and 21.0 unitsduring the same period (Figure 11a).
Salmon River Trap. During 1994, mean ATPase levels for hatchery chinook salmon at theSalmon River Trap increased from 8.1 units in mid-April, to 15.9 units in late May when samplingwas completed (Figure 11b). The mean ATPase activity of wild fish fluctuated between 12.0 and18.2 units during the sampling season (Figure 11b).
Snake River Trap. Mean ATPase levels of hatchery chinook salmon at the Snake River Trapslowly rose from 8.5 to 24.8 units during trap operation from April 13 to May 27 (Figure 11c). Mean ATPase levels for wild fish were between 11.5 and 15.8 units in April, and between 11.2and 22.1 units in May (Figure 11c).
8
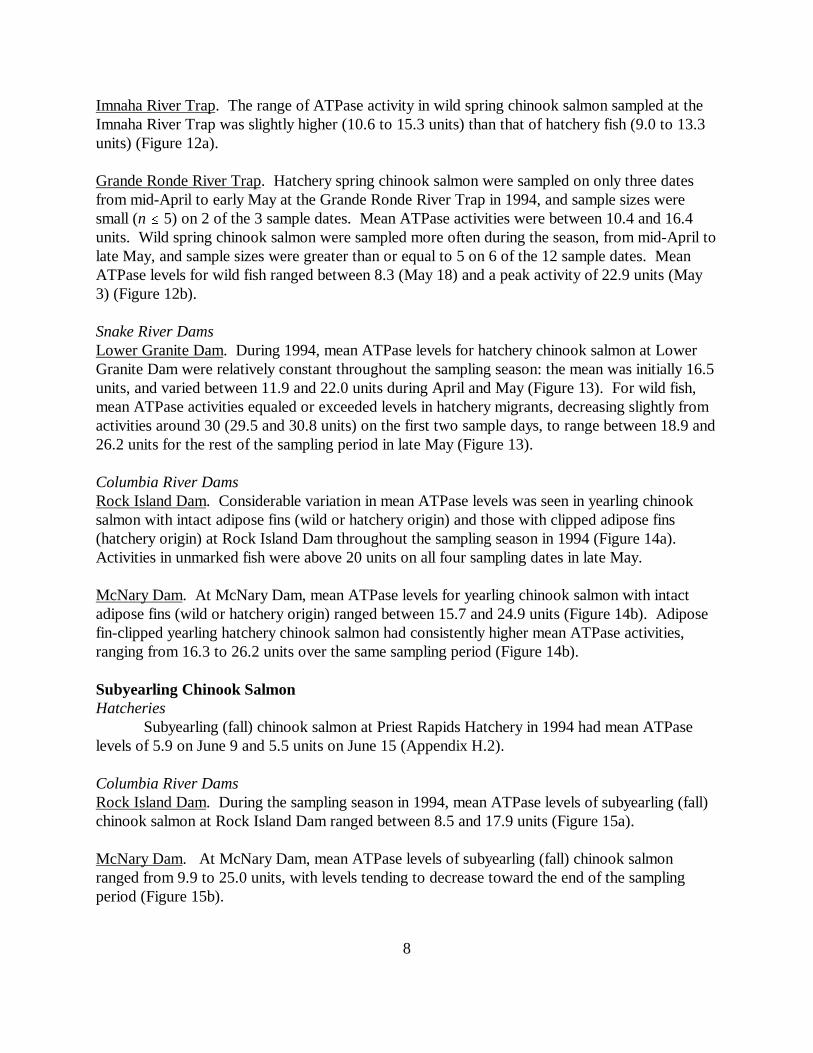
Imnaha River Trap. The range of ATPase activity in wild spring chinook salmon sampled at theImnaha River Trap was slightly higher (10.6 to 15.3 units) than that of hatchery fish (9.0 to 13.3units) (Figure 12a).
Grande Ronde River Trap. Hatchery spring chinook salmon were sampled on only three datesfrom mid-April to early May at the Grande Ronde River Trap in 1994, and sample sizes weresmall (n � 5) on 2 of the 3 sample dates. Mean ATPase activities were between 10.4 and 16.4units. Wild spring chinook salmon were sampled more often during the season, from mid-April tolate May, and sample sizes were greater than or equal to 5 on 6 of the 12 sample dates. MeanATPase levels for wild fish ranged between 8.3 (May 18) and a peak activity of 22.9 units (May3) (Figure 12b).
Snake River DamsLower Granite Dam. During 1994, mean ATPase levels for hatchery chinook salmon at LowerGranite Dam were relatively constant throughout the sampling season: the mean was initially 16.5units, and varied between 11.9 and 22.0 units during April and May (Figure 13). For wild fish,mean ATPase activities equaled or exceeded levels in hatchery migrants, decreasing slightly fromactivities around 30 (29.5 and 30.8 units) on the first two sample days, to range between 18.9 and26.2 units for the rest of the sampling period in late May (Figure 13).
Columbia River DamsRock Island Dam. Considerable variation in mean ATPase levels was seen in yearling chinooksalmon with intact adipose fins (wild or hatchery origin) and those with clipped adipose fins(hatchery origin) at Rock Island Dam throughout the sampling season in 1994 (Figure 14a). Activities in unmarked fish were above 20 units on all four sampling dates in late May.
McNary Dam. At McNary Dam, mean ATPase levels for yearling chinook salmon with intactadipose fins (wild or hatchery origin) ranged between 15.7 and 24.9 units (Figure 14b). Adiposefin-clipped yearling hatchery chinook salmon had consistently higher mean ATPase activities,ranging from 16.3 to 26.2 units over the same sampling period (Figure 14b).
Subyearling Chinook SalmonHatcheries
Subyearling (fall) chinook salmon at Priest Rapids Hatchery in 1994 had mean ATPaselevels of 5.9 on June 9 and 5.5 units on June 15 (Appendix H.2).
Columbia River DamsRock Island Dam. During the sampling season in 1994, mean ATPase levels of subyearling (fall)chinook salmon at Rock Island Dam ranged between 8.5 and 17.9 units (Figure 15a).
McNary Dam. At McNary Dam, mean ATPase levels of subyearling (fall) chinook salmonranged from 9.9 to 25.0 units, with levels tending to decrease toward the end of the samplingperiod (Figure 15b).

9
John Day Dam. Mean ATPase levels for subyearling chinook salmon collected at John Day Dambetween late June and early September ranged from 11.5 to 22.8 units (Figure 15c).
SteelheadHatcheries
Steelhead sampled at Dworshak NFH on a single date before release (April 28) had amean ATPase activity of 8.9 units (Appendix H.3).
TrapsSalmon River Trap. Mean ATPase levels in hatchery steelhead at the Salmon River Trap showedlittle variation in April and May, and declined during the season from a mean of 9.7 to 7.0 units(Figure 16a). Wild steelhead, captured in much fewer numbers, had higher mean ATPaseactivities and demonstrated more variability throughout the season than hatchery fish. Meanactivities of wild steelhead ranged from 6.2 to the peak in early May of 13.7 units (Figure 16a).
Snake River Trap. During 1994, mean ATPase levels of hatchery steelhead at the Snake RiverTrap, remained low over the course of the season, between 7.2 and 13.2 units, with activitiesbeing more consistent in May (Figure 16b). Levels for wild fish were generally higher than levelsin hatchery fish, except for the first and last sample dates. Mean activities ranged from 6.9 to 16.1units, with higher activities recorded during the first month of the sampling season, April 5 to May5 (Figure 16b).
Imnaha River Trap. Hatchery steelhead were sampled at the Imnaha River Trap for only twoweeks in 1994. Mean ATPase levels in hatchery steelhead were low, ranging from only 7.6 to10.4 units (Figure 17a). Mean ATPase levels were higher in wild steelhead than hatchery fish,peaking at 16.2 units during the same sampling period (Figure 17a).
Grande Ronde River Trap. Mean ATPase levels for wild steelhead were higher than levels forhatchery fish, with a peak activity of 14.1 units, compared to 9.5 units in hatchery steelhead(Figure 17b).
Snake River DamsLower Granite Dam. In 1994, mean ATPase levels for hatchery steelhead at Lower Granite Damranged between 10.7 and the season peak of 16.3 units on May 13 (Figure 18). Wild steelheadATPase activity ranged from 12.7 to the peak of 19.1 units on May 6; the peak occurred a weekearlier than the peak for hatchery fish (Figure 18).
Columbia River Dams Rock Island Dam. In 1994, mean ATPase levels in hatchery steelhead rose from 13.8 units inApril, peaked at 19.1 units, and remained at approximately 15 units through the end of sampling(Figure 19a). Wild fish initially had similar levels--rising from 13.1 ATPase units to the peakmean activity of 19.4 units--but showed a higher mean activity, than hatchery fish for the rest ofthe sampling season (Figure 19a).
10
McNary Dam. Wild steelhead displayed mean ATPase activities that were slightly higher thanthat of hatchery fish during sampling from late April to early June (Figure 19b).
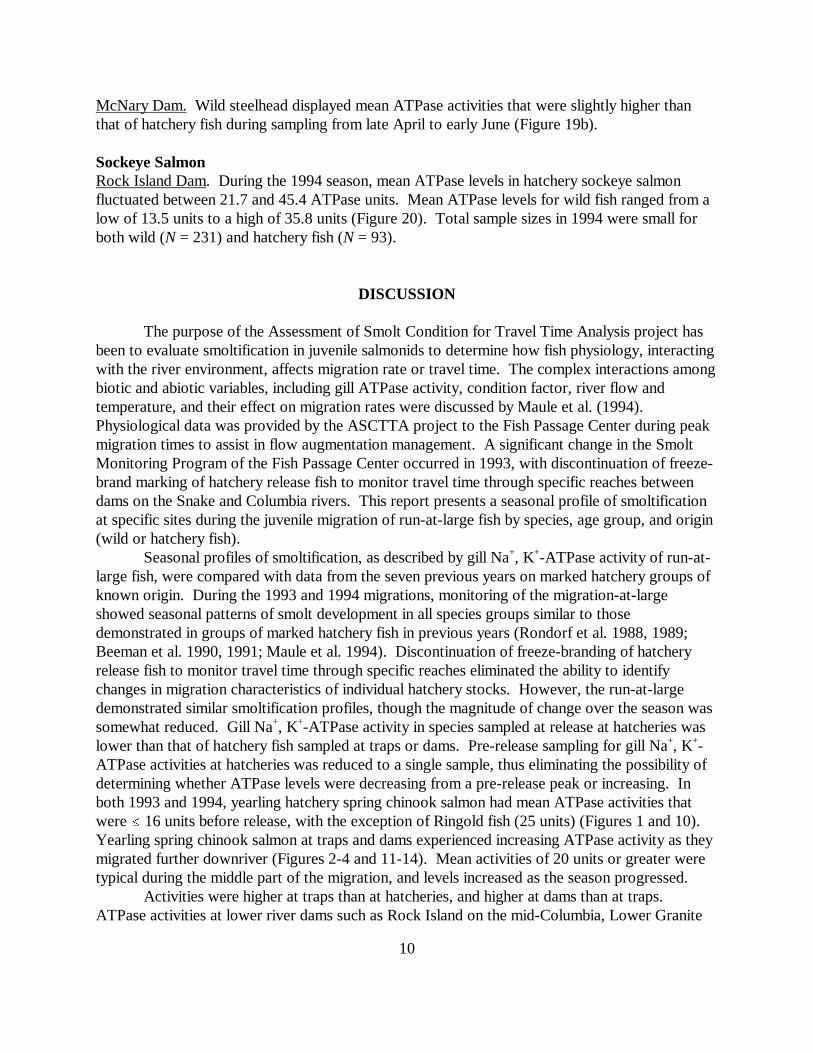
Sockeye SalmonRock Island Dam. During the 1994 season, mean ATPase levels in hatchery sockeye salmonfluctuated between 21.7 and 45.4 ATPase units. Mean ATPase levels for wild fish ranged from alow of 13.5 units to a high of 35.8 units (Figure 20). Total sample sizes in 1994 were small forboth wild (N = 231) and hatchery fish (N = 93).
DISCUSSION
The purpose of the Assessment of Smolt Condition for Travel Time Analysis project hasbeen to evaluate smoltification in juvenile salmonids to determine how fish physiology, interactingwith the river environment, affects migration rate or travel time. The complex interactions amongbiotic and abiotic variables, including gill ATPase activity, condition factor, river flow andtemperature, and their effect on migration rates were discussed by Maule et al. (1994). Physiological data was provided by the ASCTTA project to the Fish Passage Center during peakmigration times to assist in flow augmentation management. A significant change in the SmoltMonitoring Program of the Fish Passage Center occurred in 1993, with discontinuation of freeze-brand marking of hatchery release fish to monitor travel time through specific reaches betweendams on the Snake and Columbia rivers. This report presents a seasonal profile of smoltificationat specific sites during the juvenile migration of run-at-large fish by species, age group, and origin(wild or hatchery fish).
Seasonal profiles of smoltification, as described by gill Na+, K+-ATPase activity of run-at-large fish, were compared with data from the seven previous years on marked hatchery groups ofknown origin. During the 1993 and 1994 migrations, monitoring of the migration-at-largeshowed seasonal patterns of smolt development in all species groups similar to thosedemonstrated in groups of marked hatchery fish in previous years (Rondorf et al. 1988, 1989;Beeman et al. 1990, 1991; Maule et al. 1994). Discontinuation of freeze-branding of hatcheryrelease fish to monitor travel time through specific reaches eliminated the ability to identifychanges in migration characteristics of individual hatchery stocks. However, the run-at-largedemonstrated similar smoltification profiles, though the magnitude of change over the season wassomewhat reduced. Gill Na+, K+-ATPase activity in species sampled at release at hatcheries waslower than that of hatchery fish sampled at traps or dams. Pre-release sampling for gill Na+, K+-ATPase activities at hatcheries was reduced to a single sample, thus eliminating the possibility ofdetermining whether ATPase levels were decreasing from a pre-release peak or increasing. Inboth 1993 and 1994, yearling hatchery spring chinook salmon had mean ATPase activities thatwere � 16 units before release, with the exception of Ringold fish (25 units) (Figures 1 and 10). Yearling spring chinook salmon at traps and dams experienced increasing ATPase activity as theymigrated further downriver (Figures 2-4 and 11-14). Mean activities of 20 units or greater weretypical during the middle part of the migration, and levels increased as the season progressed.
Activities were higher at traps than at hatcheries, and higher at dams than at traps. ATPase activities at lower river dams such as Rock Island on the mid-Columbia, Lower Granite

11
on the Snake River, and McNary on the mainstem Columbia, were generally higher than at thehatcheries and traps. However, levels in run-at-large yearling chinook salmon of unknownhatchery origin did not reach the high levels (� 30 units) reported for individual hatchery groupsin previous years (Rondorf et al. 1989; Beeman et al. 1990, 1991; Maule et al. 1994). MeanATPase activities in late migrants showed a decrease, in some cases late in the season when flowwas decreasing. The decrease in ATPase may have been the result of sampling fish that migratedmore slowly as the result of slower physiological development. Because the origin and stockcomposition of a group of run-at-large fish is unknown at a given site on a particular sample date,comparison with previous data on marked groups of known origin is complicated by possiblemoderation of mean peak activities by the mixing of stocks at different levels of development. ATPase activities by date for yearling spring chinook of known hatchery origin, documented inearlier reports for 1988 and 1989 (Rondorf et al. 1989; Beeman et al. 1990), were much higher(30 to 40 units) at Rock Island and McNary Dams, than activities seen in the general run-at-largegroups in 1993 and 1994 at those dams.
In 1993, an increase in ATPase activity in both hatchery and run-at-large (non-adipose fin-clipped) fish in late May at Rock Island Dam (Figure 4) corresponded to a peak in flow duringthat time (Figure 21) (University of Washington 1998). Flows at Rock Island Dam were higher in1994 than in 1993 during April through July, except for the period May 7 through June 1. Overall lower ATPase activities were seen in 1994 than in 1993 at Rock Island Dam (Figures 4and 14). Gill ATPase activities at Rock Island Dam during 1993 and 1994 were much lower thanin 1990, when fish were released with relatively high ATPase activities (e.g., Entiat NFH meanATPase was 33 units at release) (Beeman et al. 1991), and flows were generally higher (Figure21) (University of Washington 1998).
Peak flows in the Snake River at Lower Granite Dam in late May 1993 corresponding tothe time of peak flows at Rock Island Dam, and flows in the Snake River in 1994 were almostuniformly lower than in 1993. With few exceptions, ATPase activities of both wild and hatcheryyearling spring chinook salmon were lower in 1994 than in 1993 when sample site and date wereconsidered.
Although flows at McNary Dam were almost twice as high in 1993 as in 1994 duringMay (Figure 22) (University of Washington 1998), and were the highest seen in late May duringthe previous 8 years, ATPase activities of yearling spring chinook during 1993 and 1994 werevery similar and ranged from 15 to 25 units for the duration of the sampling season. Gill ATPaseactivities were higher at Rock Island Dam than at McNary Dam. Flows at McNary Dam in 1990were similar to 1993 flows, but the duration of the peak flow in 1990 was longer and the peakoccurred later.
Wild and hatchery yearling spring chinook salmon displayed similar seasonal profiles ofATPase activity, but the phasing of smoltification in wild and hatchery salmon differed, asmeasured by increases, peaks, and decreases in ATPase activity during the season and atindividual sites. In almost every case, activities were higher in wild yearling chinook salmon thanhatchery fish on all sample dates and at all sites. This was true for yearling chinook salmonsampled at the Salmon, Clearwater, and Snake River traps and at Rock Island and Lower Granitedams in 1993 and 1994. At McNary Dam, the difference in ATPase activities between wild andhatchery fish was negligible. Because yearling chinook salmon without adipose fin clips sampledin the mid-Columbia River could have been either wild or hatchery fish, true differences between

12
wild and hatchery chinook salmon at Rock Island and McNary dams could not be determined. AtRock Island, the difference in mean ATPase activities between hatchery fish and fish with intactadipose fins, therefore of mixed origin, was not as marked as at traps and dams on the SnakeRiver, where hatchery and wild fish were distinguishable. The presence of hatchery fish, whichoften have lower ATPase activities than wild fish, in the unmarked group may have reduced meanATPase levels. Variation in the proportion of hatchery fish in the unmarked group passing asampling site on a particular date would account for variation in the magnitude of differencesbetween fin-clipped hatchery fish and those of unknown origin.
Mean ATPase activities of subyearling fall chinook salmon were higher in 1993 than in1994 at Rock Island, McNary, and John Day dams. Fall chinook salmon migrate later thanyearling spring chinook salmon, and therefore are exposed to different flow patterns duringemigration. Mean ATPase activities in subyearling chinook salmon barely reached 20 units in1994, whereas they ranged between 15 and 25 units in 1993. At McNary Dam, mean activities in1993 exceeded 30 units in mid-July, but were only slightly above 20 units at any time in 1994. AtJohn Day Dam, activities also approached 30 units in 1993, but remained below 25 in 1994 whenflows at McNary Dam were low.
Steelhead exhibited a similar seasonal profile of ATPase activity as compared to chinooksalmon. Activities were consistently higher in wild steelhead than in hatchery steelhead. In 1993,ATPase activities in both hatchery and wild steelhead were higher than in 1994. In steelhead, asin chinook salmon, the overall higher Snake River flows in 1993 were accompanied by overallhigher ATPase activities. Flow is especially important to steelhead in determining migration rates(Maule et al. 1994). Zaugg et al. (1985) described the importance of in-river residence for gillATPase levels and migration rates, and Maule et al. (1994) evaluated the relationship betweenflow and migration rates in marked groups of spring chinook salmon and steelhead. We havedocumented the same changes in run-at-large spring and fall chinook salmon in the Snake River.
Temperature has been shown to stimulate smoltification and higher ATPase levels insalmonids when increased within specific ranges (Zaugg 1981; Jonsson 1991). We comparedtemperature profiles at the sample sites to explain between-year differences. Water temperatureswere consistently higher in 1994 than in 1993 at McNary Dam (Figure 23) (University ofWashington 1998), but at Rock Island Dam, temperatures in 1993 exceeded those of 1994 duringshort periods within each month from June to September (Figure 24) (University of Washington1998; Fish Passage Center, unpublished data). The overall higher temperatures in 1994,approaching temperatures known to adversely affect condition and health of migrating smolts, incombination with lower flows, may partially explain the system-wide lower ATPase activityprofile of 1994.
An exception to the finding of higher ATPase activity in hatchery fish than in wild fish wassockeye salmon outmigrating from Lake Wenatchee. Fish of hatchery origin had higher meanATPase levels than wild fish on most sample dates in both years, under the temperature and flowconditions described earlier. All hatchery fish sampled at Rock Island Dam in 1993 and 1994came from a net pen operation in Lake Wenatchee. Hatchery sockeye salmon were transferred tothe net pens as fry in April, and were released into the lake in late October. The hatchery fishmigrated volitionally the following spring at the same time as the wild fish. Studies by Shrimptonet al. (1994) found that colonized hatchery Atlantic salmon (Salmo salar), released early tooverwinter, were physiologically equivalent to wild fish with respect to ATPase level and

13
seawater tolerance at the time of migration. Differences between mean ATPase levels of wild andhatchery salmon on specific sampling dates may be the result of differences in the time of peakmigration between hatchery and wild fish. Wild spring chinook salmon tend to begin migratingthrough upriver sampling sites earlier than hatchery fish, which cannot migrate until they arereleased. For example, in 1994, wild fish were first collected at the Salmon River Trap on April2, while the first hatchery fish reached the trap eight days later (April 10) (Fish Passage Center1993, 1994). The difference in mean ATPase levels between wild and hatchery fish was mostpronounced early in the season, and at upper-river sampling sites. In-river migration is known topromote smoltification and the disposition to migrate in hatchery-reared fish (Zaugg et al. 1985). As the season progressed, mean ATPase levels of wild and hatchery fish were more similar,suggesting that late-migrating hatchery fish had reached the same physiological level as late-emerging or late-migrating wild fish.
Differences in ATPase levels between wild and hatchery fish were not as pronounced in1994 as in 1993. This may be related to the differences in river flow between the two years, aspreviously described. Beeman and Rondorf (1992) found travel time of juvenile salmonidsdecreased as flow increased. In a study of chinook salmon, Ewing et al. (1980) speculated thathigh flows could move fish downstream without a corresponding increase in ATPase level. Ourdata suggests that wild fish may migrate earlier than hatchery fish. Hatchery fish may be releasedwhen their ATPase levels are lower compared to wild fish, which migrate volitionally. Hatcheryfish may require time after release to develop physiologically to a level equivalent to wild fish. Distances that wild and hatchery fish travel from their rearing site would also determine theirphysiological development level on the date and at the site of sampling. The hatchery stock ofsockeye salmon we monitored, when allowed the opportunity to overwinter in the wild,developed ATPase activities equal to and exceeding those seen in the wild sockeye of the sameregion. It was beyond the scope of our evaluation to locate rearing areas to determine if thedifferences we saw between mean ATPase in the wild and colonized fish on specific dates weredue to differences in rearing areas, emergence times or developmental stage.
Wild and hatchery fish sampled at dams and traps can come from many sources and residein-river for varying lengths of time. The diversity of origins and natural variation among stockswithin a species make it difficult to apply the smoltification levels of unmarked run-at-large fish tospecific management goals. Data from earlier reports using marked groups of fish allowed fordetermination of travel times of known groups, in specific time periods, through individual riverreaches. The travel times could be evaluated using the smolt indices, condition factor and gillATPase, in combination with recorded flow and temperature, as groups of marked fish wereidentified at several locations during the migration.
Data collected on hatchery salmonids for this report suggests that the mean level ofsmoltification for run-at-large groups in 1993 and 1994 was similar to levels reported in previousyears. In 1993, the mean ATPase activity for spring chinook salmon at Rock Island Damcorresponded to levels reported for mid-May 1989 (25 to 39 units), at approximately the sameflow (175 kcfs) (Beeman et al. 1990). Gill ATPase results for hatchery and wild steelhead atRock Island Dam in mid-May were also very similar to results in 1989, when flows were in thesame range as in May 1993. The necessity of sampling fish from several hatcheries as a single

14
group in the run-at-large may result in the reporting of mean ATPase activities different fromwhat was found in previous years, when specific hatchery stocks were sampled at the same time inthe migration.

15
CHAPTER ONE FIGURES
16
DW DW DW MC SA RA
Mea
n N
a+,
K+
-AT
Pas
e A
ctiv
ity
5
10
15
20aYearling Chinook Salmon
Snake River Basin
EN LE WI RI
5
10
15
20bYearling Chinook Salmon
Columbia River Basin
3/30 4/11 4/10 3/31
PR PR TR
Mea
n N
a+ , K
+-A
TP
ase
Act
ivity
5
10
15
20
cChinook SalmonSubyearling
6/14 6/21 6/24 DW IR
5
10
15
20
d
4/29 4/2
Steelhead
3/22 4/5 4/19 3/23 3/22 3/24
Figure 1. Mean (±SE) gill Na+, K+-ATPase activity (µmol Pi ⋅ mg protein-1 ⋅ h-1) for yearling spring/summer chinook salmon sampled before release in 1993 from (a) Snake River basin hatcheries, and (b) Columbia River basin hatcheries; (c) subyearling chinooksalmon before release at Priest Rapids and Turtle Rock State Fish Hatcheries (SFH); and (d) steelhead sampled before release at Dworshak National Fish Hatchery (NFH) and Irrigon SFH. Data are listed in Appendices A.1, A.2, and A.3.
RA - Rapid River SFH
RI - Ringold SFH
WI - Winthrop NFH
LE - Leavenworth NFH
IR - Irrigon SFH
MC - McCall SFH
PR - Priest Rapids SFH
SA - Sawtooth SFH
TR - Turtle Rock SFHEN - Entiat NFH
DW - Dworshak NFH

17
4/5/93 4/19/93 5/3/93 5/17/93 5/31/930
5
10
15
20
25
30 c
b
aClearwater River Trap
0
5
10
15
20
25
30
35
Mea
n N
a+, K
+-A
TP
ase
Act
ivity
0
5
10
15
20
25
30 Salmon River Trap
Snake River Trap
Wild Spring Chinook Hatchery Spring Chinook
Figure 2. Mean (±SE) gill Na+, K+-ATPase activity (µmol Pi ⋅ mg protein-1 ⋅ h-1)of wild and hatchery yearling chinook salmon collected during migration in1993 at (a) the Clearwater River Trap, (b) the Salmon River Trap, and (c) the Snake River Trap. Data are listed in Appendices B.1 and C.
18
bLittle Goose Dam
aLower Granite Dam
4/26/93 5/10/93 5/24/93
Mea
n N
a+,
K+-A
TP
ase
Act
ivity
10
15
20
25
30
35
Mea
n N
a+,
K+-A
TP
ase
Act
ivity
10
15
20
25
30
35
40
Figure 3. Mean (±SE) gill Na+, K+-ATPase activity (µmol Pi ⋅ mg protein-1 ⋅ h-1) of wild and hatchery yearling chinook salmon collected during migration in 1993 at (a) Lower Granite Dam and (b) Little Goose Dam on the Snake River. Data are listed in Appendices B.1 and C.
Wild Yearling Chinook Hatchery Yearling Chinook
19
Rock Island DamM
ean
Na+ , K
+-A
TP
ase
Act
ivity
5
10
15
20
25
30
35
40
Date
4/26/93 5/3/93 5/10/93 5/17/93 5/24/93 5/31/93
Mea
n N
a+, K
+ -AT
Pa
se A
ctiv
ity
5
10
15
20
25
30
35McNary Dam b
a
Figure 4. Mean (±SE) gill Na+, K+-ATPase activity (µmol Pi ⋅ mg protein-1 ⋅ h-1) of yearling chinook salmon with intact adipose fins and yearling hatchery chinook salmon (adipose fin-clipped) collected during migration in 1993 at (a) Rock Island Dam and (b) McNary Dam on the Columbia River. Data are listed in Appendix B.2.
Clipped Adipose FinIntact Adipose Fin

20
Date
6/1/93 7/1/93 8/1/93 9/1/93 10/1/93 11/1/93
5
10
15
20
25
30
35John Day and Bonneville Dams
Mea
n N
a+, K
+-A
TP
ase
Act
ivity
5
10
15
20
25
30
35McNary Dam
5
10
15
20
25
30
35
40
Rock Island Dam a
b
c
John Day Dam
Bonneville Dam
Figure 5. Mean (±SE) gill Na+, K+-ATPase activity (µmol Pi ⋅ mg protein-1 ⋅ h-1) of subyearling fall chinook salmon collected during migration in 1993 at (a) Rock Island Dam, (b) McNary Dam, and (c) John Day Dam and Bonneville Dam, on theColumbia River. Data are listed in Appendix D.
21
b
aSalmon River Trap
Snake River Trap
Figure 6. Mean (±SE) gill Na+, K+-ATPase activity (µmol Pi ⋅ mg protein-1 ⋅ h-1)of wild and hatchery steelhead collected during migration in 1993 at (a) the Salmon River Trap and (b) the Snake River Trap. Data are listed in Appendices E and F.
Date
4/5/93 4/19/93 5/3/93 5/17/93 5/31/93
Mea
n N
a+ , K+ -A
TP
ase
Act
ivity
0
5
10
15
20
25
30
Mea
n N
a+ , K+ -A
TP
ase
Act
ivity
0
5
10
15
20
25
30
Hatchery SteelheadWild Steelhead

22
b
aM
ean
Na+ , K
+-A
TP
ase
Act
ivity
5
10
15
20
25
30
35Lower Granite Dam
Date
4/26/93 5/3/93 5/10/93 5/17/93 5/24/93 5/31/93
Mea
n N
a+ , K+ -A
TP
ase
Act
ivity
10
15
20
25
30
Little Goose Dam
Figure 7. Mean (±SE) gill Na+, K+-ATPase activity (µmol Pi ⋅ mg protein-1 ⋅ h-1)of wild and hatchery steelhead collected during migration in 1993 at (a) Lower Granite Dam, and (b) Little Goose Dam on the Snake River. Data are listed in Appendices E and F.
Wild Steelhead Hatchery Steelhead

23
b
aRock Island Dam
McNary Dam
Mea
n N
a+ , K+ -A
TP
ase
Act
ivity
0
5
10
15
20
25
30
35
Date
4/19/93 5/3/93 5/17/93 5/31/93
Mea
n N
a+, K
+ -AT
Pa
se A
ctiv
ity
5
10
15
20
25
30
Hatchery SteelheadWild steelhead
Figure 8. Mean (±SE) gill Na+, K+-ATPase activity (µmol Pi ⋅ mg protein-1 ⋅ h-1) of wild and hatchery steelhead collected during migration in 1993 at (a) Rock Island Dam and (b) McNary Dam on the Columbia River. Data are listed in Appendices E and F.
24
Date
4/19/93 4/26/93 5/3/93 5/10/93 5/17/93 5/24/93 5/31/93
Mea
n N
a+, K
+ -AT
Pa
se A
ctiv
ity
15
20
25
30
35
40
45
50
Rock Island Dam
Wild Sockeye Salmon Hatchery Sockeye Salmon
Figure 9. Mean (±SE) gill Na+, K+-ATPase activity (µmol Pi ⋅ mg protein-1 ⋅ h-1)of wild and hatchery sockeye salmon collected during migration in 1993 at Rock Island Dam on the Columbia River. Data are listed in Appendices G.1 and G.2.
25
Mea
n N
a+, K
+ -A
TP
ase
Act
ivity
0
5
10
15
Dworshak NFH a
Snake River
WI - Winthrop NFH
RI - Ringold SFH
EN - Entiat NFHLE - Leavenworth NFH
EN EN LE RI WI
Mea
n N
a+, K
+ -
AT
Pa
se A
ctiv
ity
0
5
10
15
20
25
30
Columbia River b
LO RA SA
Snake River c
RA - Rapid River SFHSA - Sawtooth SFH
LO - Lookingglass SFH
Figure 10. Mean (±SE) gill Na+, K+-ATPase activity (µmol Pi ⋅ mg protein-1 ⋅ h-1)of yearling spring chinook salmon sampled before release in 1994 from (a) DworshakNational Fish Hatchery (NFH), (b) Columbia River basin hatcheries, and (c) SnakeRiver basin hatcheries. Data are listed in Appendix H.1.
3/2 3/15 3/31 4/21 5/3
3/29 5/11 4/20 3/28 4/11 3/30 3/30 3/29

26
0
5
10
15
20
25
30
Mea
n N
a+, K
+-A
TP
ase
Act
ivity
0
5
10
15
20
25
Date
4/4/94 4/18/94 5/2/94 5/16/94 5/30/94
0
5
10
15
20
25
Clearwater River Trap
Salmon River Trap
Snake River Trap
a
b
c
Hatchery Spring ChinookWild Spring Chinook
Figure 11. Mean (±SE) gill Na+, K+-ATPase activity (µmol Pi ⋅ mg protein-1 ⋅ h-1)of wild and hatchery yearling chinook salmon collected during migration in 1994 at (a) the Clearwater River Trap, (b) the Salmon River Trap, and (c) the Snake River Trap. Data are listed in Appendices I.1 and J.

27
Mea
n N
a+, K
+-A
TP
ase
Act
ivity
0
5
10
15
20
25
30
Date
4/4/94 4/18/94 5/2/94 5/16/94 5/30/94
Mea
n N
a+ , K+-A
TP
ase
Act
ivity
0
5
10
15
20
25 Grande Ronde River Trap
Imnaha River Trap a
b
Hatchery Spring ChinookWild Spring Chinook
Figure 12. Mean (±SE) gill Na+, K+-ATPase activity (µmol Pi ⋅ mg protein-1 ⋅ h-1) of wild and hatchery yearling chinook salmon collected during migration in 1994 at (a) the Imnaha River Trap and (b) the Grande Ronde River Trap. Data are listed in Appendices I.1 and J.
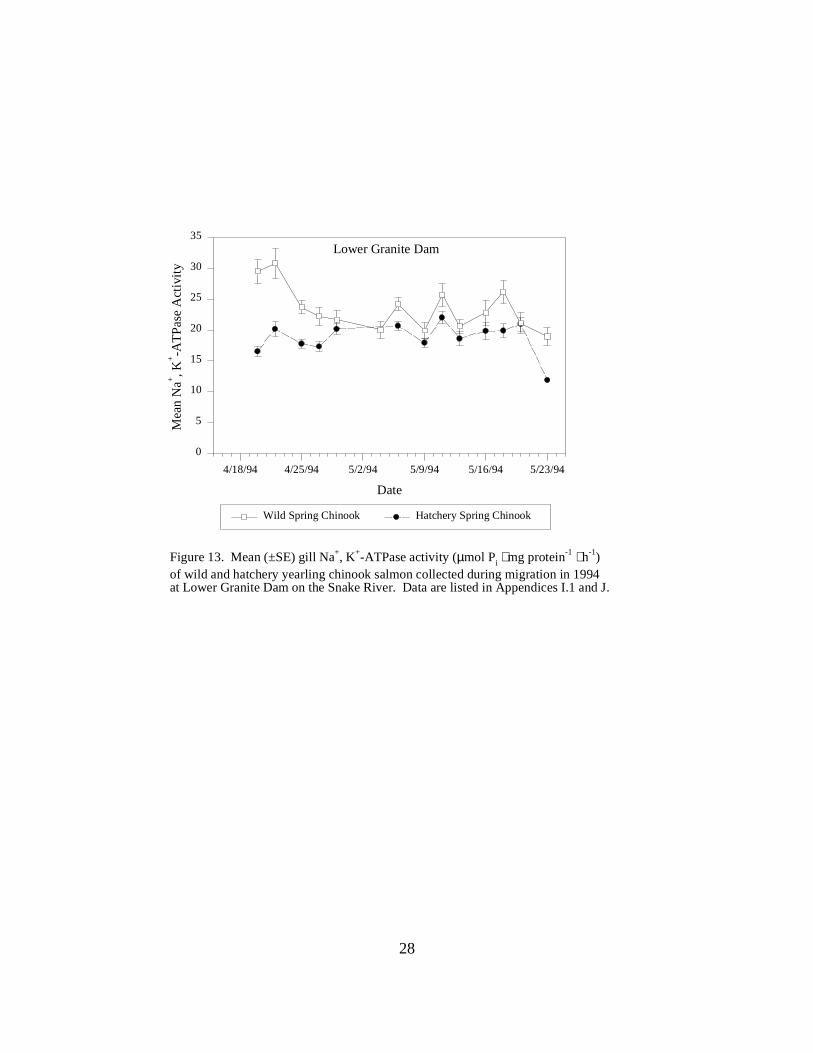
28
Date
4/18/94 4/25/94 5/2/94 5/9/94 5/16/94 5/23/94
Mea
n N
a+, K
+-A
TP
ase
Act
ivity
0
5
10
15
20
25
30
35Lower Granite Dam
Wild Spring Chinook Hatchery Spring Chinook
Figure 13. Mean (±SE) gill Na+, K+-ATPase activity (µmol Pi ⋅ mg protein-1 ⋅ h-1) of wild and hatchery yearling chinook salmon collected during migration in 1994 at Lower Granite Dam on the Snake River. Data are listed in Appendices I.1 and J.
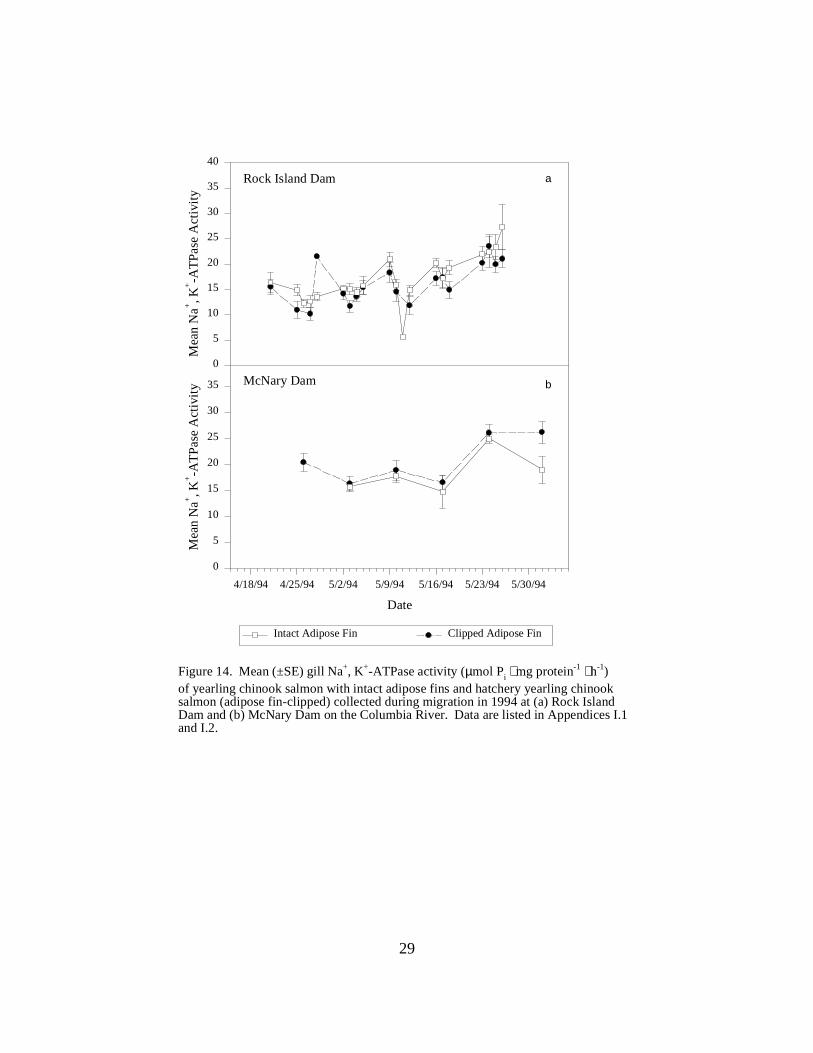
29
Date
4/18/94 4/25/94 5/2/94 5/9/94 5/16/94 5/23/94 5/30/94
Mea
n N
a+, K
+-A
TP
ase
Act
ivity
0
5
10
15
20
25
30
35 McNary Dam
Mea
n N
a+, K
+-A
TP
ase
Act
ivity
0
5
10
15
20
25
30
35
40
Rock Island Dam a
b
Figure 14. Mean (±SE) gill Na+, K+-ATPase activity (µmol Pi ⋅ mg protein-1 ⋅ h-1)of yearling chinook salmon with intact adipose fins and hatchery yearling chinook salmon (adipose fin-clipped) collected during migration in 1994 at (a) Rock Island Dam and (b) McNary Dam on the Columbia River. Data are listed in Appendices I.1and I.2.
Intact Adipose Fin Clipped Adipose Fin

30
0
5
10
15
20
25
30
35
Mea
n N
a+ , K+-A
TP
ase
Act
ivity
0
5
10
15
20
25
30
Date6/1/94 7/1/94 8/1/94 9/1/94 10/1/94
0
5
10
15
20
25
30 John Day Dam
McNary Dam
Rock Island Dam a
b
c
Figure 15. Mean (±SE) gill Na+, K+-ATPase activity (µmol Pi ⋅ mg protein-1 ⋅ h-1)of subyearling fall chinook salmon collected during migration in 1994 at (a) RockIsland Dam, (b) McNary Dam, and (c) John Day Dam on the Columbia River. Dataare listed in Appendix K.
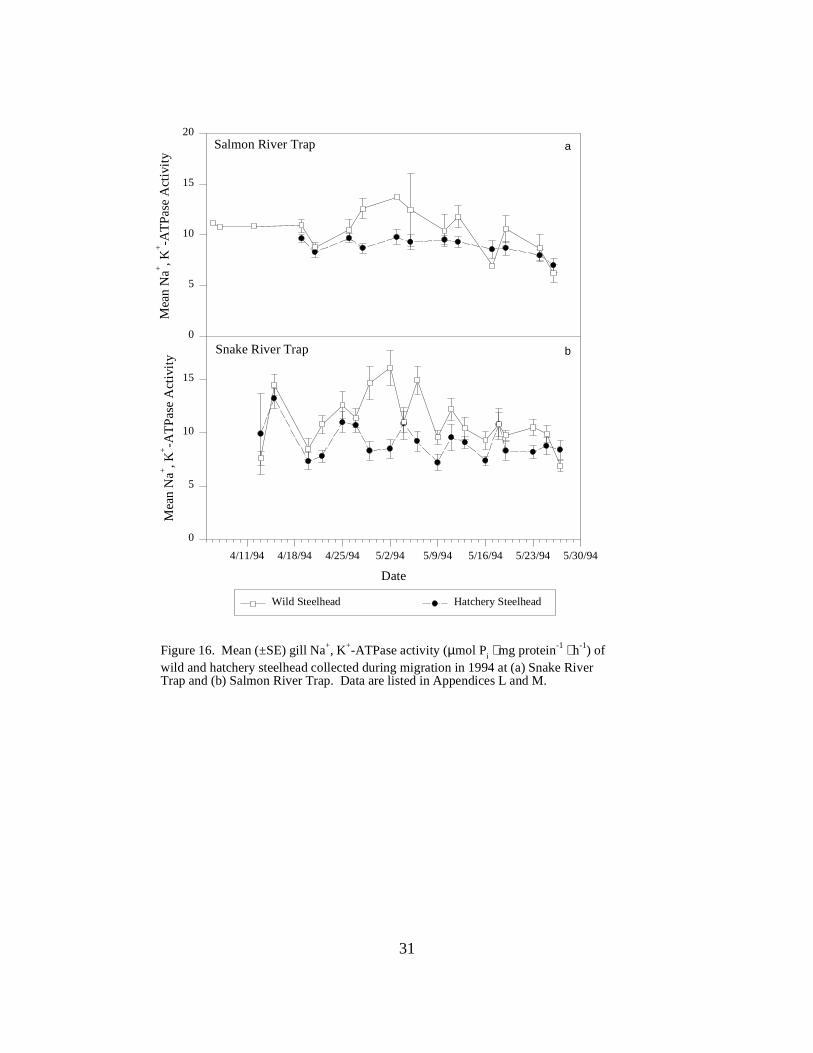
31
Mea
n N
a+, K
+ -AT
Pa
se A
ctiv
ity
0
5
10
15
20
Date
4/11/94 4/18/94 4/25/94 5/2/94 5/9/94 5/16/94 5/23/94 5/30/94
Mea
n N
a+, K
+-A
TP
ase
Act
ivity
0
5
10
15
Salmon River Trap a
b
Figure 16. Mean (±SE) gill Na+, K+-ATPase activity (µmol Pi ⋅ mg protein-1 ⋅ h-1) of wild and hatchery steelhead collected during migration in 1994 at (a) Snake River Trap and (b) Salmon River Trap. Data are listed in Appendices L and M.
Wild Steelhead Hatchery Steelhead
Snake River Trap

32
Mea
n N
a+, K
+-A
TP
ase
Act
ivity
0
5
10
15
20
Date
4/18/94 4/25/94 5/2/94 5/9/94 5/16/94 5/23/94 5/30/94
Mea
n N
a+ , K+-A
TP
ase
Act
ivity
0
5
10
15
Grande Ronde River Trap
Imnaha River Trap a
b
Figure 17. Mean (±SE) gill Na+, K+-ATPase activity (µmol Pi ⋅ mg protein-1 ⋅ h-1) of wild and hatchery steelhead collected during migration in 1994 at (a) the Imnaha River Trap and (b) the Grande Ronde River Trap. Data are listed in Appendices L and M.
Wild Steelhead Hatchery Steelhead
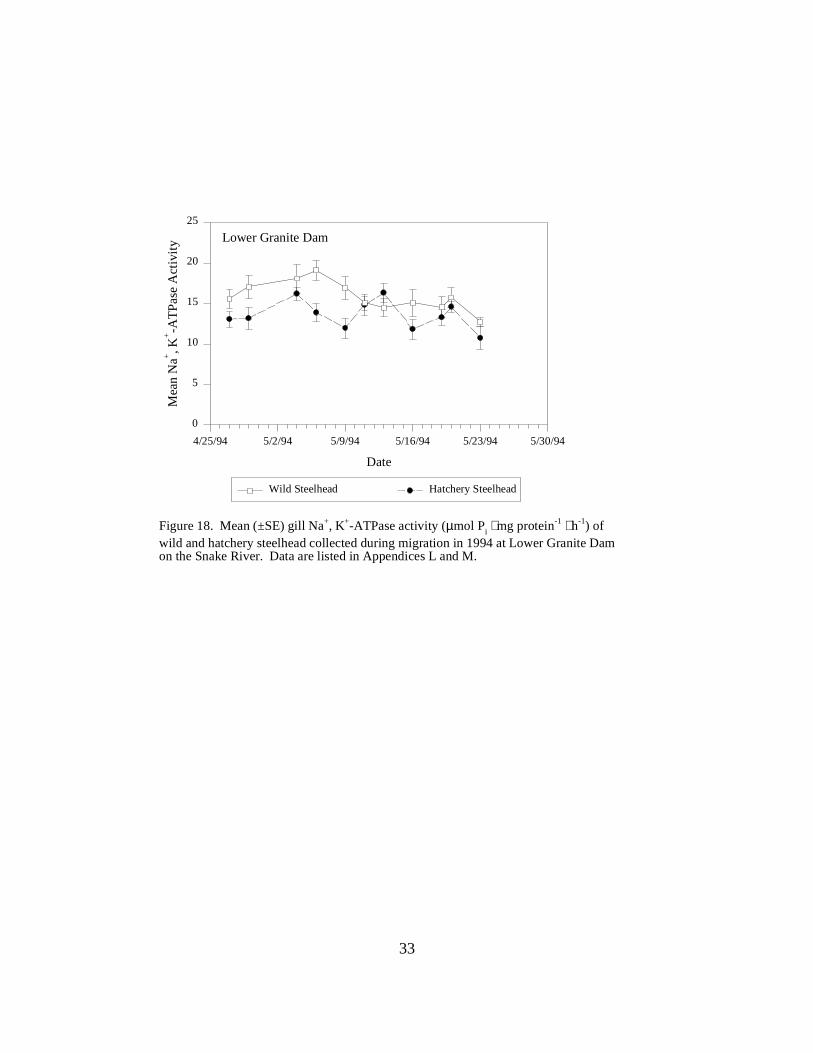
33
Date
4/25/94 5/2/94 5/9/94 5/16/94 5/23/94 5/30/94
Mea
n N
a+, K
+-A
TP
ase
Act
ivity
0
5
10
15
20
25
Lower Granite Dam
Figure 18. Mean (±SE) gill Na+, K+-ATPase activity (µmol Pi ⋅ mg protein-1 ⋅ h-1) of wild and hatchery steelhead collected during migration in 1994 at Lower Granite Damon the Snake River. Data are listed in Appendices L and M.
Wild Steelhead Hatchery Steelhead
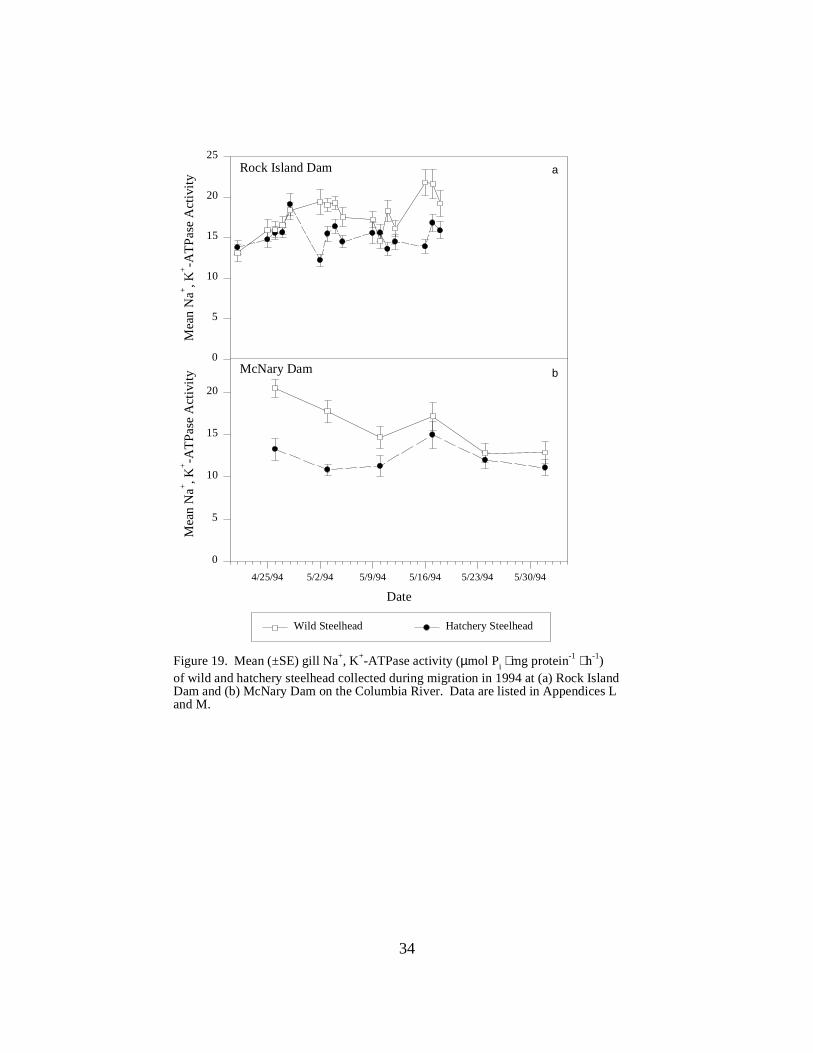
34
Mea
n N
a+, K
+-A
TP
ase
Act
ivity
0
5
10
15
20
25
Date
4/25/94 5/2/94 5/9/94 5/16/94 5/23/94 5/30/94
Mea
n N
a+, K
+-A
TP
ase
Act
ivity
0
5
10
15
20
McNary Dam
Rock Island Dam a
b
Figure 19. Mean (±SE) gill Na+, K+-ATPase activity (µmol Pi ⋅ mg protein-1 ⋅ h-1)of wild and hatchery steelhead collected during migration in 1994 at (a) Rock Island Dam and (b) McNary Dam on the Columbia River. Data are listed in Appendices L and M.
Wild Steelhead Hatchery Steelhead
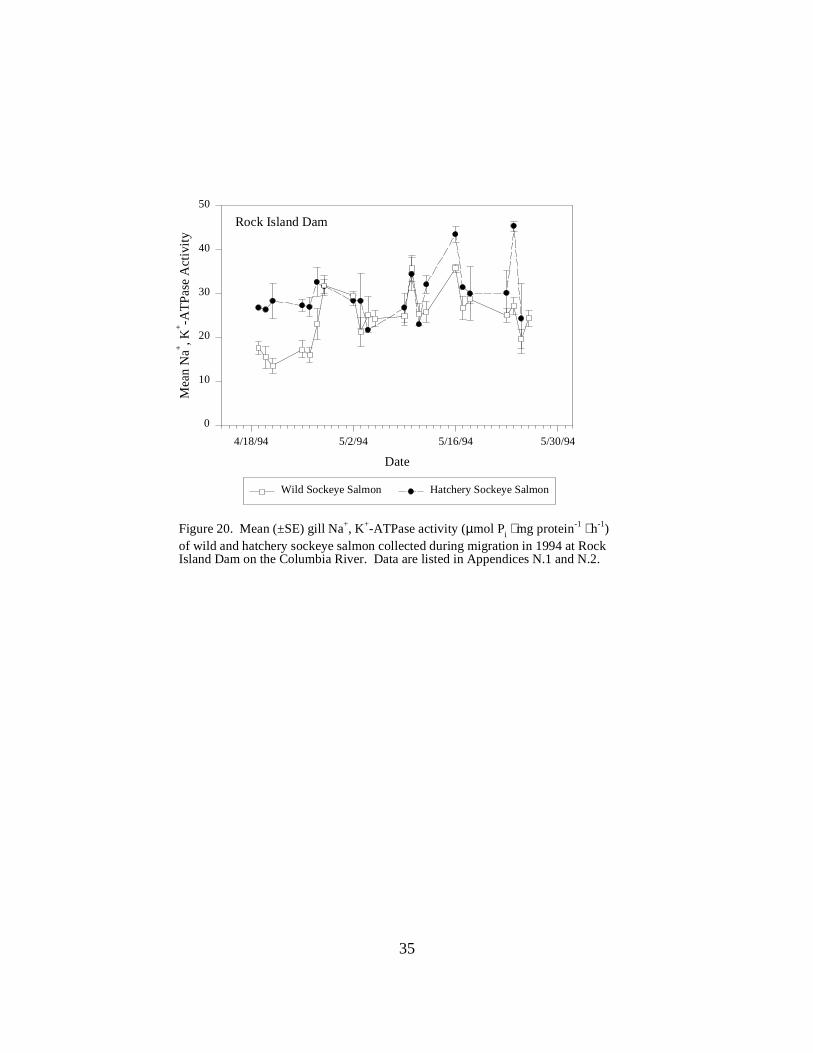
35
Date
4/18/94 5/2/94 5/16/94 5/30/94
Mea
n N
a+, K
+ -AT
Pa
se A
ctiv
ity
0
10
20
30
40
50
Rock Island Dam
Figure 20. Mean (±SE) gill Na+, K+-ATPase activity (µmol Pi ⋅ mg protein-1 ⋅ h-1)of wild and hatchery sockeye salmon collected during migration in 1994 at Rock Island Dam on the Columbia River. Data are listed in Appendices N.1 and N.2.
Wild Sockeye Salmon Hatchery Sockeye Salmon

36
Date
4/1 5/1 6/1 7/1 8/1 9/1 10/1 11/1
Flo
w (
kcfs
)
0
50
100
150
200
250
300
350
400
450
Rock Island Dam
Figure 21. Columbia River flow (kcfs) at Rock Island Dam, April-October, 1987-1994 (Source: U.S. Army Corps of Engineers data, University of Washington 1998).
1987 1988 1989 1990 1991 1992 1993 1994
Date4/1 5/1 6/1 7/1 8/1 9/1 10/1 11/1
Flo
w (
kcfs
)
0
50
100
150
200
250
300
350
400
450
1987 1988 1989 1990 1991 1992 1993 1994
Figure 22. Columbia River flow (kcfs) at McNary Dam, April-October, 1987-1994 (Source:U.S. Army Corps of Engineers data, University of Washington 1998).
McNary Dam

37
Date
4/1 5/1 6/1 7/1 8/1 9/1 10/1 11/1
Tem
per
atu
re (
°C)
0
5
10
15
20
25
Figure 23. Columbia River temperature (°C) at McNary Dam, April-October, 1987-1994 (Source: U.S. Army Corps of Engineers data, University of Washington 1998).
1987 1988
1989 1990 1991 1992 1993 1994
McNary Dam
Date
4/1 5/1 6/1 7/1 8/1 9/1 10/1 11/1
Tem
per
atu
re (
°C)
0
5
10
15
20
25
Rock Island Dam
Figure 24. Columbia River temperature (°C) at Rock Island Dam, April-October, 1987-1994 (Sources: U.S. Army Corps of Engineers data, University of Washington 1998; Fish Passage Center, unpublished data).
1987
1988
1989
1990
1991
1992
1993
1994
38
CHAPTER TWO
Physiological Measurements in Support of Survival Estimates forJuvenile Salmonids Passing through Dams and Reservoirs
Philip V. HanerAlec G. Maule
Robin M. SchrockJack D. Hotchkiss
ABSTRACT
Spring chinook salmon used as part of the National Marine Fisheries Service LowerGranite Survival Study in 1993 and 1994 were sampled at sites on the Snake River to determinewhether physiological or morphological differences between groups from multiple releases at asample site related to differences in survival. Fish were purse-seined at Lower Granite Reservoirand sampled from the collection facilities at Lower Granite and Little Goose dams. Informationon gill sodium, potassium-activated adenosine triphosphatase (Na+, K+-ATPase) activity,condition factor (Kfactor), plasma cortisol, and prevalence of bacterial kidney disease and otherdiseases, were tested for differences between release groups within sample sites and betweensites. Results showed that fish collected at dams were more stressed than fish collected from thereservoirs. Survival did not appear to be affected by differences in physiological attributes ofsalmonids in release groups.
INTRODUCTION
In the spring of 1993 and 1994, we monitored the health and condition of fish that werecaptured, passive integrated transponder (PIT)-tagged, and released as part of the NationalMarine Fisheries Service (NMFS) Lower Granite Survival Study (Iwamoto et al. 1994; Muir et al.1995). In 1993, hatchery spring chinook salmon (Oncorhynchus tshawytscha) were collected atLower Granite Reservoir, Lower Granite Dam, and Little Goose Dam, PIT-tagged, and releasedafter a 24-hour recovery period. All hatchery chinook salmon released into the Snake River wereadipose fin-clipped for the first time in 1993, allowing differentiation of wild and hatchery chinooksalmon. In 1994, yearling hatchery steelhead (O. mykiss) and hatchery spring chinook salmonwere collected in Lower Granite Reservoir, Lower Granite Dam, Little Goose Dam, and LowerMonumental Dam, PIT-tagged, and released. The objective of this study was to collectphysiological data that could help explain any observed differences in survival estimates betweengroups of PIT-tagged fish released at the different sites.

39
METHODS
1993
Reservoir SamplingSeven groups of PIT-tagged hatchery chinook salmon were released between April 13 and
April 21. Fish were purse-seined from Lower Granite Reservoir approximately 32 kilometersupstream from Lower Granite Dam at Nisqually John's Landing (rkm 726). Hatchery chinooksalmon were sorted from other species, and up to 1500 were PIT-tagged by NMFS for eachrelease. While the fish were being PIT-tagged (Day 1 of each release), a subsample of 100 PIT-tagged fish were non-lethally sampled for gill sodium, potassium-activated adenosinetriphosphatase (Na+, K+-ATPase) activity using the microassay method described by Schrock etal. (1994). All fish PIT-tagged by NMFS, including those we sampled, were placed into two netpens set in the river. The following evening (Day 2), just prior to release, 30 fish were removedfrom each of the two net pens and sacrificed with a lethal dose (105 ppm) of tricainemethanesulfonate (MS-222). Fifteen fish from each subsample were sampled for plasma cortisol,and kidney and spleen tissue was collected for BKD analysis. The other 15 fish from eachsubsample were used only for BKD analysis. All sacrificed fish were measured for fork length(mm) and weight (g), and were scanned for PIT-tags. Tag numbers were reported to NMFS. Lengths and weights were used to calculate condition factor (K or Kfactor) with the equation:
Kfactor = 105 ⋅ (weight ⋅ (length3)-1)
The 30 fish sacrificed for BKD analysis only (15 from each of the two net pens) from releases 1,3, and 7, were individually bagged, frozen, and sent to the U. S. Fish and Wildlife Service, LowerColumbia River Fish Health Center (LCRFHC), Underwood, Washington, for disease screening. The LCRFHC screened fish for the presence of Yersinia ruckeri (the bacterial agent of entericredmouth disease), Aeromonas salmonicida (the bacterial agent of furunculosis), infectioushematopoietic necrosis (IHN) virus, and infectious pancreatic necrosis (IPN) virus. AfterLCRFHC processing, the fish were sent back to the Columbia River Research Laboratory forBKD analysis using an enzyme-linked immunosorbant assay (ELISA) method described byPascho et al. (1991).
Dam SamplingPassive integrated transponder (PIT)-tagging was done at Lower Granite Dam and Little
Goose Dam by NMFS to test survival rates from the reservoir releases to and through thedifferent dam bypass and collection facilities. Hatchery chinook salmon were removed from thejuvenile collection systems at each dam, PIT-tagged (Day 1), held in holding tanks supplied withflow-through river water, and released at various locations within the dam system the followingday (Day 2). Releases of PIT-tagged fish were made into the dam spillway, juvenile collectionbypass, and turbines at each of the two dams. A control release was made just below the dam atthe confluence of water from the spillways, turbines, and bypass. Three sets of releases occurredat each dam to correspond to the approximate timing of the 10%, 50%, and 90% passage at thedam of all the fish released at Lower Granite Reservoir.

40
On Day 1 of each set of releases, we subsampled 30 PIT-tagged fish from the controlrelease group for gill ATPase and sacrificed 45 untagged fish for BKD samples. When the fishwere released on Day 2, we sacrificed 15 PIT-tagged fish from the control group for plasmacortisol and sent the carcasses to the LCRFHC for disease screening as previously described. Werecorded fork lengths, weights, and PIT-tag numbers of all fish sampled. At Lower Granite Dam,releases were made on April 28, April 30, and May 12. The first and third releases at LittleGoose Dam were made over two days because insufficient numbers of hatchery chinook salmonwere collected. We sampled fish from all five days of collection: May 6 and 7 (release 1), May 8(release 2), and May 13 and 14 (release 3). Fish from the turbine or bypass control groups weresampled immediately before they were released from the transport containers at the confluence ofwater from the spillways, powerhouse, and bypass.
Statistical AnalysisStatistical analyses were conducted using SAS (SAS Institute 1989). Gill Na+, K+-ATPase
activity and condition factor within and between release sites were compared with an F-test. Achi-squared test was used to detect significant differences between the numbers of fish with andwithout BKD. A significance level of α = 0.05 was used in statistical tests.
1994Our collection of physiological samples for the 1994 NMFS survival study was much
reduced from the 1993 sampling. Only non-lethal gill ATPase samples were collected, betweenApril 20 and May 23, at Lower Granite Reservoir, Lower Granite Dam, Little Goose Dam, andLower Monumental Dam.
Reservoir Sampling
One to three samples were taken at each site from both hatchery spring chinook salmonand hatchery steelhead. Both species of fish were collected from Lower Granite Reservoir atSilcott Island, where the fish were purse-seined, PIT-tagged, held for up to 50 hours to recoverfrom handling, and released by NMFS.
Dam SamplingThe fish sampled from collection facilities at Lower Granite, Little Goose, and Lower
Monumental dams were PIT-tagged, and released the following day. Gill samples were removedfrom the PIT-tagged fish during the tagging process or during the holding time using the sameATPase sampling protocol as in 1993.
Statistical Analysis Statistical analysis of the gill ATPase values was performed using an F-test (SAS Institute
1989).

41
RESULTS
1993Gill Na+, K+-ATPase Activity
Mean values for gill Na+, K+-ATPase, reported in units of micromoles inorganic phosphateper milligram protein per hour (µmol Pi ⋅ mg protein-1 ⋅ h-1), were similar between releases at agiven sample site, but differed significantly between sites. The mean ATPase activity for releasegroup 3 at Lower Granite Reservoir was significantly higher (� = 10.81 ATPase units) thanmeans for the other six release groups, which ranged from 9.47 to 10.40 (Table 1). However, thereproducibility of the microassay for ATPase is 4 µmol Pi
. mg protein-1 . h-1, therefore differencesless than 4 units are not considered biologically significant. No other significant differences inmean ATPase values were found between releases from either Lower Granite Dam or LittleGoose Dam. Comparison between the three sample sites revealed significant differences in meanATPase values that were biologically significant. Mean gill ATPase activity in fish from LowerGranite Reservoir was significantly lower (� = 10.08) than in fish from Lower Granite Dam (� =16.79), and gill ATPase activity in fish from Little Goose Dam was significantly higher (� =21.35) than in fish from the other two sites (Table 1).
Condition FactorPatterns in condition factor were similar to patterns in gill ATPase. At Lower Granite
Reservoir, the seven releases fell into three significantly different groups, with condition factorsranging from 1.0342 to 1.0804 (Table 1). The other two sample sites showed no significantdifferences in condition factor between releases. Again, when comparisons were made betweenmean values from the three sites, significantly different values were found. The highest meancondition factor, 1.0595, was found at Lower Granite Reservoir, while fish at Little Goose Damhad a mean value of 0.9719, and fish collected at Lower Granite Dam had the lowest meancondition factor (� = 0.9582; see Table 1).
Plasma CortisolMean values were calculated for plasma cortisol (ng ⋅ mL-1) from each release in the
reservoir and dams. The only site with significantly different values between releases was LowerGranite Reservoir (Table 1). Fish from release 7 in the reservoir had significantly higher plasmacortisol (� = 95.05) than did the prior six releases (ranging from 55.45 to 83.97). Neither LowerGranite Dam (with a range of 184.14 to 273.45) nor Little Goose Dam (ranging from 198.98 to259.30) had significantly different plasma cortisol levels between release groups. Between-sitecomparisons of mean plasma cortisol did show significant differences (Table 1). Mean cortisolconcentration from fish collected at Lower Granite Reservoir (� = 68.88) was significantly lowerthan mean cortisol from fish collected at Lower Granite Dam (� = 232.29) and Little Goose Dam(� = 231.98).
Bacterial Kidney DiseaseThe percentage of fish with BKD did not differ significantly between any of the release
groups within a sample site. Between 33% and 68% of fish in each group were diagnosed withBKD (Table 2). No significant differences in BKD prevalence between sample sites were found.
42
Disease ScreeningAll 195 fish sent to the LCRFHC for disease analysis tested negative for Y. ruckeri, A.
salmonicida, IHN, and IPN.
1994
Gill Na+, K+-ATPase ActivityTable 3 gives the mean gill ATPase, standard errors, and statistically significant differences
for fish collected at each site and sampling date in 1994. Gill ATPase increased over time at agiven site in both hatchery spring chinook salmon and hatchery steelhead, and tended to increaseas the fish traveled downstream.
DISCUSSION
Spring chinook salmon monitored as part of the National Marine Fisheries Service LowerGranite Survival Study were sampled in 1993, and both yearling hatchery steelhead and springchinook salmon were sampled in 1994. Physiological measurements were made to test fordifferences among individuals from multiple releases from single sites, and between releases fromdifferent sites. Fish collected in Lower Granite Reservoir or at Snake River dams below thereservoir displayed different levels of smoltification.
Mean gill Na+, K+-ATPase, condition factor, and plasma cortisol values differedsignificantly between multiple releases at several of the release sites. However, based on previouswork at hatcheries and dams in the Columbia Basin, we believe the relatively small differencesbetween release groups within a site were not biologically significant, but the differences betweenupriver and downriver sampling locations were biologically significant (Beeman et. al. 1991;Maule et al. 1994). Smolt development progressed as the fish traveled further downstream, asevidenced by the increase in gill ATPase from one site to the next, and the general trend ofdecreasing condition factor from Lower Granite Reservoir to Little Goose Dam. The increases ingill ATPase over time and from upstream to downstream sites in 1993 and 1994 conformed to theresults of previous studies (Maule et al. 1994; Zaugg and McLain 1972).
The fish in this study were not severely incapacitated by disease, as evidenced by lowmortality. Bacterial kidney disease was fairly prevalent, but not acute (Maule et al. 1996a). Muiret al. (1995) reported no difference between survival of any of the groups released from aparticular site. Disease screening by the LCRFHC revealed no Y. ruckeri, A. salmonicida, IHN orIPN in fish from each release.
Analysis of blood plasma cortisol showed that fish sampled at dams were more stressedthan fish collected in the reservoir. No dam imposed greater stress than any other, but the overallexperience of being collected, held in tanks, and released at the dams was more stressful thanbeing purse-seined, held in net pens, and released into the reservoir.
This study was originally designed to detect physiological and morphological differencesbetween groups of fish from multiple releases at a particular sample site. These data would thenbe used to help explain possible differences in travel time and survival. The data collected suggest

43
no biological differences when comparing releases from a single site, which supports the findingsof Iwamoto et al. (1994) and Muir et al. (1995), who found no differences in travel time orsurvival between multiple releases of fish from an individual site. The most significant finding wasthe increased stress, as measured by cortisol levels, associated with release at a dam.

44
CHAPTER TWO TABLES
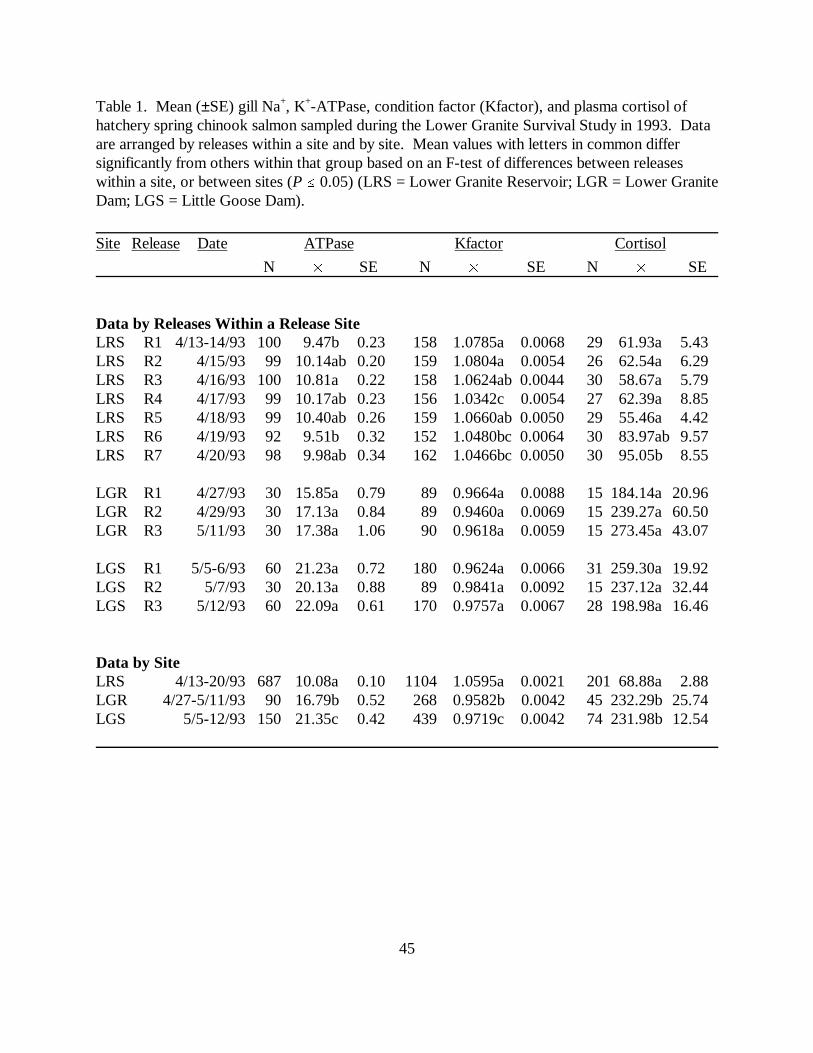
45
Table 1. Mean (±SE) gill Na+, K+-ATPase, condition factor (Kfactor), and plasma cortisol ofhatchery spring chinook salmon sampled during the Lower Granite Survival Study in 1993. Dataare arranged by releases within a site and by site. Mean values with letters in common differsignificantly from others within that group based on an F-test of differences between releaseswithin a site, or between sites (P � 0.05) (LRS = Lower Granite Reservoir; LGR = Lower GraniteDam; LGS = Little Goose Dam).
Site Release Date ATPase Kfactor Cortisol
N � SE N � SE N � SE
Data by Releases Within a Release SiteLRS R1 4/13-14/93 100 9.47b 0.23 158 1.0785a 0.0068 29 61.93a 5.43LRS R2 4/15/93 99 10.14ab 0.20 159 1.0804a 0.0054 26 62.54a 6.29LRS R3 4/16/93 100 10.81a 0.22 158 1.0624ab 0.0044 30 58.67a 5.79LRS R4 4/17/93 99 10.17ab 0.23 156 1.0342c 0.0054 27 62.39a 8.85LRS R5 4/18/93 99 10.40ab 0.26 159 1.0660ab 0.0050 29 55.46a 4.42LRS R6 4/19/93 92 9.51b 0.32 152 1.0480bc 0.0064 30 83.97ab 9.57LRS R7 4/20/93 98 9.98ab 0.34 162 1.0466bc 0.0050 30 95.05b 8.55
LGR R1 4/27/93 30 15.85a 0.79 89 0.9664a 0.0088 15 184.14a 20.96LGR R2 4/29/93 30 17.13a 0.84 89 0.9460a 0.0069 15 239.27a 60.50LGR R3 5/11/93 30 17.38a 1.06 90 0.9618a 0.0059 15 273.45a 43.07
LGS R1 5/5-6/93 60 21.23a 0.72 180 0.9624a 0.0066 31 259.30a 19.92LGS R2 5/7/93 30 20.13a 0.88 89 0.9841a 0.0092 15 237.12a 32.44LGS R3 5/12/93 60 22.09a 0.61 170 0.9757a 0.0067 28 198.98a 16.46
Data by SiteLRS 4/13-20/93 687 10.08a 0.10 1104 1.0595a 0.0021 201 68.88a 2.88LGR 4/27-5/11/93 90 16.79b 0.52 268 0.9582b 0.0042 45 232.29b 25.74LGS 5/5-12/93 150 21.35c 0.42 439 0.9719c 0.0042 74 231.98b 12.54
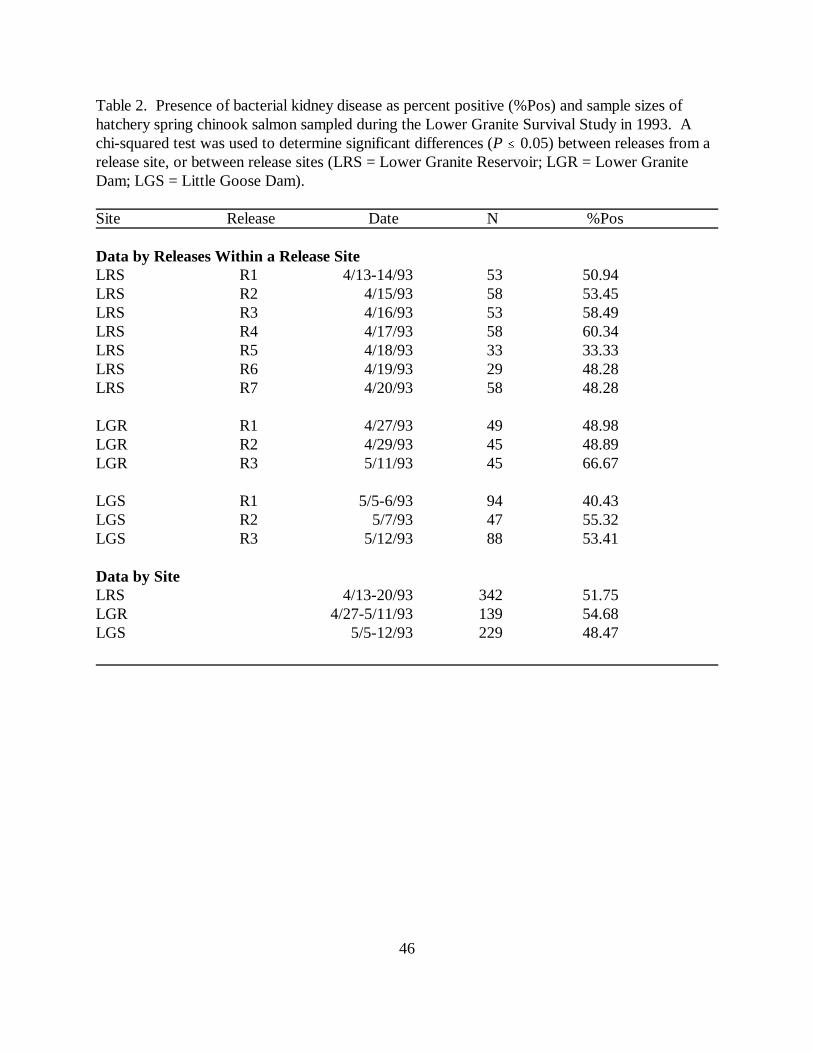
46
Table 2. Presence of bacterial kidney disease as percent positive (%Pos) and sample sizes ofhatchery spring chinook salmon sampled during the Lower Granite Survival Study in 1993. Achi-squared test was used to determine significant differences (P � 0.05) between releases from arelease site, or between release sites (LRS = Lower Granite Reservoir; LGR = Lower GraniteDam; LGS = Little Goose Dam).
Site Release Date N %Pos
Data by Releases Within a Release SiteLRS R1 4/13-14/93 53 50.94LRS R2 4/15/93 58 53.45LRS R3 4/16/93 53 58.49LRS R4 4/17/93 58 60.34LRS R5 4/18/93 33 33.33LRS R6 4/19/93 29 48.28LRS R7 4/20/93 58 48.28
LGR R1 4/27/93 49 48.98LGR R2 4/29/93 45 48.89LGR R3 5/11/93 45 66.67
LGS R1 5/5-6/93 94 40.43LGS R2 5/7/93 47 55.32LGS R3 5/12/93 88 53.41
Data by SiteLRS 4/13-20/93 342 51.75LGR 4/27-5/11/93 139 54.68LGS 5/5-12/93 229 48.47

47
Table 3. Mean (±SE) gill Na+, K+-ATPase in hatchery spring chinook salmon (HSPC) andhatchery steelhead (HSTH) sampled during the Lower Granite Survival Study in 1994. Meanvalues with letters in common differ significantly from others within that group based on an F-testof differences between releases within a site, or between sites (P � 0.05) (LRS = Lower GraniteReservoir; LGR = Lower Granite Dam; LGS = Little Goose Dam; LMN = Lower MonumentalDam).
Species Site Date N � SEWithin Sites, by DateHSPC LRS 4/28/94 29 14.15a 0.64
LRS 5/10/94 30 15.50a 0.98
LGR 4/20/94 28 16.52b 0.77LGR 4/27/94 30 17.30b 0.81LGR 5/11/94 27 22.42a 1.12
LGS 4/27/94 30 18.51b 0.75LGS 5/05/94 30 22.06a 0.72
LMN 5/05/94 30 22.94a 0.59LMN 5/12/94 30 22.88a 0.80LMN 5/17/94 30 19.62b 1.17
HSTH LRS 4/28/94 30 10.79b 0.52LRS 5/10/94 30 12.50ba 0.77LRS 5/19/94 30 14.09a 0.78
LGR 5/19/94 29 13.28 0.96
LGS 5/13/94 30 16.38a 0.78LGS 5/17/94 30 15.80a 1.00
LMN 5/23/94 30 14.42 0.71Between SitesHSPC LRS 4/28-5/10 59 14.83c 0.59
LGR 4/20-5/11 85 18.67b 0.59LGS 4/27-5/05 60 20.28ba 0.56LMN 5/05-5/17 90 21.81a 0.53
HSTH LRS 4/28-5/19 90 12.46b 0.43LGR 5/19 29 13.28b 0.96LGS 5/13-5/17 60 16.09a 0.63LMN 5/23 30 14.42ba 0.71

48
CHAPTER THREE
Mucus Lysozyme as a Non-Lethal Measure of Health in Pacific Salmon
Robin M. SchrockStanley G. SmithJack D. Hotchkiss
Alec G. Maule
ABSTRACT
Mucus lysozyme reference levels were established for juvenile coho salmon(Oncorhynchus kisutch), and juvenile and adult chinook salmon (O. tshawytscha) to identifypatterns of change in lysozyme concentrations during smoltification and disease episodes. Theobjectives of the study were to establish a reproducible method of sampling and analysis formucus lysozyme, to determine baseline lysozyme concentrations in hatchery reference stocks, andto determine if mucus lysozyme levels could be used as an index of smolt condition and health. One µL of mucus provided a meaningful measurement of lysozyme for comparison among groupsof juvenile and adult salmon. A notable decrease in mucus lysozyme levels occurred duringsmoltification. Significant differences in mucus lysozyme levels were found between healthy andinfected fish in disease challenge experiments. Mucus lysozyme levels in juvenile coho salmonwere in the same range as levels in spring chinook salmon, when health and condition weresimilar. Stress may affect indicators of non-specific immune response such as lysozyme byinitiating an acute disease episode in fish suffering a chronic infection.
INTRODUCTION
The successful adaptation of juvenile salmon for life in the marine environment involvescomplex changes in their morphology, physiology, and behavior (Hoar 1976; Wedemeyer et al.1980; Folmar and Dickhoff 1981) within constraints of the environment (Wedemeyer et al. 1980;Zaugg 1982b; McCormick et al. 1987; Pagliarani et al. 1991). During the parr-to-smolttransformation, marked changes occur in length and weight (Zaugg and Beckman 1990),condition factor, and growth rate (Wedemeyer et al. 1980). Associated physiological changesinclude increases in enzymes such as gill sodium, potassium-activated adenosine triphosphatase(Na+, K+-ATPase) (Saunders and Henderson 1978; Zaugg and McLain 1972; Rondorf et al. 1988,1989; McCormick et al. 1989; Beeman et al. 1990, 1991; Maule et al. 1994) and changes in theamount of guanine deposited in the skin (Staley and Ewing 1992). Several stocks of ColumbiaRiver salmonids are threatened with extinction, and the Assessment of Smolt Condition for TravelTime Analysis project of the Columbia River Research Laboratory has worked to develop non-lethal methods of evaluating fish health and condition, including a microassay for gill Na+, K+-ATPase activity (Schrock et al. 1994), a method of determining smoltification using body

49
morphometric indices (Beeman et al. 1994, 1995), and quantification of smolt silvering using skinreflectance (Haner et al. 1995).
No single factor evaluating smolt condition or health has been shown to adequately predictjuvenile migration success or numbers of returning adults, although gill Na+, K+-ATPase levelshave long been used as an indicator of smoltification and predictor of migration success (Zauggand McLain 1970; McCartney 1976; Giles and Vanstone 1976). Interactions of hormonal andimmunological factors, along with environmental factors such as river flow (Beeman et al. 1991),contribute to the complex suite of changes necessary to ensure adaptation to the marineenvironment. We investigated lysozyme, a non-specific immune enzyme found in mucus, as apotential indicator of smolt condition and health in salmon.
Lysozyme has been detected in tissues such as gill cartilage, spleen, kidney, epithelium,and skin (Murray and Fletcher 1976). Tissues rich in leucocytes, monocytes, macrophages andpolymorphonucleated granulocytes are thought to be the sites of lysozyme production (Lie et al.1989). Lysozyme has also been localized in the eosinophilic granule cells of the intestines ofAtlantic salmon Salmo salar (Sveinbj�rnsson et al. 1996). The distribution of lysozyme in skinand intestinal mucus allows for a non-invasive means of assessing fish health and condition.
Plasma lysozyme has been shown to decrease in salmonids during the parr-to-smolttransformation, corresponding to a decrease in blood leucocytes and lymphocyte numbers (Muonaand Soivio 1992). These changes are associated with reduced disease resistance (Maule et al.1987). Numerous other blood constituents change in concentration during smoltification andcooperate to allow for successful entry into seawater (Folmar and Dickhoff 1981; Maule et al.1987; Bradley and Rourke 1988; Borgatti et al. 1992; Franklin et al. 1992). Endocrine control ofsmoltification involves pituitary, thyroid, and inter-renal hormones that steer many of the adaptivechanges necessary for smoltification (see Barron 1986 for a review). Cortisol, a corticosteroidproduced in the inter-renal tissue in teleosts, is involved in osmoregulation and has been found toexhibit seasonal changes in concentration associated with smoltification (Specker and Schreck1982; Redding et al. 1984; Barton et al. 1985; Maule et al. 1987). Increases in cortisol mayindicate impairment of general immune competence, as evidenced by an accompanying decrease insplenic lymphocytes and circulating leucocytes (Maule et al. 1987, 1993).
Lysozyme has been proposed as a more phenotypically stable stress indicator than cortisol,based on significant differences in lysozyme levels in salmonids selectively bred to produce stockswith high- and low-cortisol stress response (Fevolden et al. 1991). Lysozyme has been found tohave a higher heritability index than cortisol (Fevolden et al. 1994) and may, therefore, be a usefulreference measurement for assessing the health status of fish during smoltification if heritablebaseline levels of mucus lysozyme are found. Extensive selection programs for cortisol responseto stress have revealed significant differences in stock lysozyme levels and varied resistance tospecific pathogens (Fevolden et al. 1991, 1992).
Lysozyme is known to cause lysis of Gram-positive bacteria (Chipman and Sharon 1969).The antibacterial effects of lysozyme against Gram-negative bacteria common in farmed fish havebeen investigated in Norway (Grinde 1989). Blood lysozyme levels in both rainbow troutOncorhynchus mykiss (Dautigny et al. 1991) and Atlantic salmon (Grinde 1989) are known tovary by pathogen, level of infection, and time course of the disease (Chu and LaPeyre 1989). Lysozyme in salmonid eggs was found to be antibacterial (Yousif et al. 1994).
50
Significant genetic variation in blood lysozyme in rainbow trout has been documented(R�ed et al. 1993), and recent studies have found a negative genetic correlation between lysozymeactivity and the resistance of Atlantic salmon to bacterial kidney disease (BKD) (Fevolden et al.1994). We have monitored infection levels of Renibacterium salmoninarum, the causative agentof BKD, in hatchery juvenile chinook salmon (O. tshawytscha) in the Pacific Northwest. Levelsof infection differ among hatcheries, and increase in migrating fish over time and as they traveldownstream (Beeman et al. 1991; Maule et al. 1996b). Because enzyme-linked immunosorbentassay (ELISA) methods for BKD require lethal sampling of kidneys to determine severity ofinfection, development of mucus lysozyme concentration as an indicator of fish health would beimportant for non-lethal monitoring of declining salmonid stocks.
The characterization of two distinct rainbow trout lysozymes with different specificactivities (Grinde et al. 1988a; Dautigny et al. 1991) suggests that multiple lysozymes may bepresent in Pacific salmon. The higher activity of Type I lysozyme than Type II in rainbow trout(Grinde 1988a) raises questions about the possible function of the two types, and about how thepredominance of each type might change as juvenile salmon develop osmoregulatory competence. Identification of lysozymes with different pH optima in freshwater and marine fish (Sankaran andGurnani 1972) raised speculation about potential changes in the localization and concentration ofdistinct lysozymes at different stages in the development of anadromous fish. We investigatedchanges in mucus lysozyme associated with smoltification.
The focus of our research was to develop a quantitative method of sampling mucuslysozyme, and to determine mucus lysozyme concentrations in juvenile and adult salmon undervarying conditions. We evaluated the applicability of mucus lysozyme concentration as anindicator of salmon health. Preliminary investigations, in conjunction with other establishedresearch projects, allowed for broad-based monitoring of conditions that might affect mucuslysozyme concentrations. We sampled fish from ongoing experiments to determine the following:1) baseline levels of skin, nare, and vent mucus lysozyme in juvenile salmon held in hatcheries; 2)differences among species or hatchery stocks held under similar conditions; 3) the effect ofspecific hatchery practices on lysozyme levels; 4) changes in mucus lysozyme levels occurringseasonally or over the period associated with smoltification; 5) differences in mucus lysozymelevels between healthy and diseased fish; 6) baseline lysozyme levels in returning adult salmon;and 7) comparisons among the three kinds of mucus (skin, nare, vent) to find the best indicator ofchanges in lysozyme levels. Holding conditions in each experiment were considered for possibleeffects on lysozyme levels.
METHODS
Fish Collection ProceduresBaseline Levels in Hatchery Reference Stocks
Spring and summer chinook salmon released from hatcheries in 1994 were assayed fornare mucus lysozyme levels to determine baseline lysozyme levels at release, and to determine ifstock differences might exist. Snake River basin hatcheries included Sawtooth Hatchery (IdahoDepartment of Fish and Game, IDFG), Rapid River Hatchery (IDFG), McCall Hatchery (IDFG),and Dworshak National Fish Hatchery (NFH) (USFWS) in Idaho, and Lookingglass Hatchery

51
(Oregon Department of Fish and Wildlife, ODFW) in Oregon. Columbia River hatcheriesincluded Entiat NFH, Winthrop NFH, Ringold Hatchery (Washington Department of Fish andWildlife, WDFW) and Wells Hatchery (WDFW) in Washington. Juvenile fish were sampledapproximately one week before release as part of the annual Smolt Monitoring Program.
Lysozyme samples from adult salmon were obtained from returning adults at twohatcheries, Carson NFH and Little White Salmon NFH in Washington. Spring chinook salmon atCarson NFH were sampled twice during holding in 1993: once on June 17, near the end of the runto the hatchery, and later on August 10, when the fish were spawned. Fish were anaesthetizedwith 0.1 g ⋅ L-1 tricaine methanesulfonate (MS-222), and euthanized by a sharp blow to the head. Females were bled by severing the caudal peduncle, and all fish were spawned, followed by kidneybiopsy for health screening by the U.S. Fish and Wildlife Service Lower Columbia River FishHealth Center, Underwood, Washington. We received fish for sampling 15 to 30 minutes afterthey were anaesthetized. Skin mucus, plasma and secondary circulation fluid were collected. In1994, we sampled for serum and secondary circulation fluid, and skin and vent mucus. Samplingconditions at Carson in 1994 were the same as in 1993. In 1994 only, Little White Salmon NFHadult spring chinook salmon were tested for serum, secondary circulation fluid, and skin mucuslysozyme once per week during two consecutive weeks. Sampling conditions at Little WhiteSalmon NFH were similar to those at Carson NFH. The length of time between fish capture andlysozyme sampling varied greatly among individual fish at both hatcheries.
Experimental Fish from Covered and Uncovered Hatchery RacewaysJuvenile coho salmon (O. kisutch) were sampled at Willard National Fish Hatchery
(WNFH) and juvenile spring chinook salmon (O. tshawytscha) were sampled at Little WhiteSalmon NFH (LWSNFH), in 1993 and 1994. Fish were part of a covered raceway experiment,and both the control (uncovered) and covered groups were sampled to determine how thispractice might affect lysozyme levels. Fish were kept in flow-through raceways at WNFH (24.4 ×2.4 × 0.7 m) and at LWSNFH (22.4 × 2.4 × 1.0 m). River water from the Little White SalmonRiver supplied both hatcheries, and water temperature varied from 3 to 9 °C during the samplingperiod. For covered treatment groups, camouflage netting was mounted 45 cm above the watersurface in late July or early August and was left in place until the release date in April. Mucuslysozyme levels from skin, nare, and vent were determined monthly from December throughApril, which included the period associated with smoltification in these stocks. Coho salmonweighed about 2 g (220 fish ⋅ lb-1) when stocked (approximately 65,000 fish per raceway), andweighed about 28 g (16 fish ⋅ lb-1) at release. Spring chinook salmon weighed about 4 g (113 fish⋅ lb-1) when stocked (approximately 47,000 fish per raceway), and were about 28 g (16 fish ⋅ lb-1)at release.
Disease Challenge ExperimentsSpring chinook salmon from Entiat NFH, held at the Columbia River Research
Laboratory, Cook, Washington, were sampled in 1993 to compare lysozyme levels in a controlgroup of fish of low-BKD parentage to levels in fish of the same parentage exposed to R.salmoninarum. Plasma and mucus lysozyme levels were compared to determine ranges andseasonal changes. Fish were sampled 3 and 6 weeks after an initial challenge with R.salmoninarum on May 20, 1993, then at 6, 9, 12, 15, and 17 weeks after a second exposure on

52
August 24, 1993. Experimental fish were held at 500 fish per 1.5-m circular tank (6 g ⋅ L-1) undernatural photoperiod. Temperature in experimental tanks was between 12 and 13 °C. Fish weredisease-challenged by crowding them for 24 h into 78 L aerated water containing 9.8 ⋅ 106
bacteria ⋅ mL-1. Control fish were challenged with the same sterile peptone-saline solution used tosuspend the bacteria for the disease challenge. Fish were monitored over a prolonged period todetermine if the time course and severity of the infection would be detected as differences inlysozyme levels between control and disease-challenged fish, distinct from seasonal changes thatmight occur during the experiment. After the fish were sampled at week 12, they were stress-challenged as follows: the experimental tanks were drained completely, and the fish were allowedto struggle on the bottom of the tanks for 1 min, then the tanks were filled as quickly as possible. The exercise was repeated two additional times, with three-hour recovery periods interveningbetween stress challenges.
The disease challenge experiment was repeated in 1994. Skin, nare, and vent mucuslysozyme samples were collected before the challenge, and at 2, 4, 6, 8, and 10 weeks post-challenge. Fish were reared at 12 °C in 1.5-m circular tanks at 12 g ⋅ L-1 (about 500 fish per 1.5 mcircular tank) under natural photoperiod. The fish were challenged with 1.27 ⋅ 107 bacteria ⋅ mL-1
in 75 L aerated water for 24 hours. Control fish were peptone-saline challenged as in 1993.
Lysozyme Sample CollectionPreliminary studies of mucus lysozyme in smolts were used to determine reproducible and
quantitative sampling and analysis techniques. We optimized the composition, molarity, and pHof buffers for sampling and analysis by modifying buffers previously used by Davies et al. (1969),Ellis (1990), Muona and Soivio (1992), and Sankaran and Gurnani (1972). All mucus sampleswere collected with a 1-µL inoculation loop, and were immediately extracted into 50 µL of 0.04M Sorenson’s phosphate buffer at pH 6.2, by vigorous mixing. Samples were stored at–80 °C until analyzed.
To collect skin mucus, both sides of the loop were rubbed against the fish in an areabetween the vent and lateral line, the loop was removed in a perpendicular fashion to ensureconsistent filling of the aperture, and the sample was immediately extracted. Mucus was scrapedfrom the roof of the mouth in a similar procedure. Nare samples were collected by inserting theloop into the nare, turning the loop one-quarter, then removing it. Vent mucus was collected byinserting the loop into the vent for a distance twice the length of the loop, then withdrawing italong the intestinal wall against gently applied external pressure.
In fish that were sacrificed, plasma or serum was collected to provide reference levels forcomparison with mucus lysozyme. Plasma from the caudal artery, obtained by severing the caudalfin, was initially collected in heparinized Natelson tubes. Lysozyme concentrations wereextremely low, and although results from heparinized plasma do appear in the literature, heparin isknown to bind lysozyme (Schultz 1987). We therefore discontinued use of heparinized tubes. Subsequent plasma samples were collected in ethylenediaminetetraacetic acid (EDTA)-coatedNatelson tubes, or serum was collected in untreated tubes. Serum from adult chinook salmon wascollected from the caudal artery using a 22-gauge needle and syringe. Plasma was immediatelyseparated from the cells by centrifugation, while serum samples were allowed to clot over aperiod of several hours, then separated by centrifugation.
53
Secondary circulation fluid was collected from adult salmon by making a shallow incisionperpendicular to the lateral line, and inserting a Natelson tube into the lateral subcutaneous vesselthat runs parallel to the lateral line. Fluid was forced into the tube by gently pressing along thelateral line toward the tube.
Lysozyme AnalysisLysozyme concentrations were determined by a microplate adaptation of Sankaran and
Gurnani's (1972), and Muona and Soivio's (1992) adaptations of Litwack's turbidimetric method(1955). The decrease in absorbance of a 0.025% weight per unit volume Micrococcuslysodeikticus solution in 0.02 M sodium acetate buffer (pH 5.5) was measured at 450 nm after a20-min incubation at 37 °C. Results were calculated from the decrease in absorbance as measuredagainst a hen egg white lysozyme (HEWL) standard, and were reported as µg ⋅ mL-1 HEWL. Ascites fluid from one juvenile spring chinook salmon was diluted, frozen in small aliquots, andused as a control for inter-assay variability.
Statistical AnalysisData were analyzed using a one-way analysis of variance of lysozyme concentration by
treatment group, among sample dates, and between species. Scheffé’s test was used to adjust forvaried sample sizes caused by sample loss due to sample vial failure during storage in liquidnitrogen. Comparisons were made by multiple range pairwise analysis, with a significance level ofα = 0.05.
RESULTS
Baseline Levels in Hatchery Reference StocksHatchery Release Groups
Analysis of variance of nare mucus lysozyme concentrations from hatchery release groupssampled between March 2 and April 12, 1994, showed significant differences in mean narelysozyme (P � 0.05) (Table 1). Summer chinook from Wells Hatchery had the lowest mean narelysozyme levels (276 µg ⋅ mL-1), while spring chinook from Lookingglass Hatchery had thehighest mean nare mucus lysozyme levels (588 µg ⋅ mL-1). Mean levels for all the hatcheriesagreed with the ranges exhibited by coho salmon and spring chinook salmon at Willard NFH andLittle White Salmon NFH during the same season.
Adult SalmonPreliminary samples from adult chinook salmon included two sample dates in 1993 at
Carson NFH when fish were being held for spawning. Mean plasma lysozyme decreasedsignificantly (P � 0.05) from 24.8 µg ⋅ mL-1 (June 17, 1993) to 13.6 µg ⋅ mL-1 (August 10, 1993),and secondary circulation fluid decreased from 26.3 to 24.6 µg ⋅ mL-1 (Table 2).
Sampling at Carson NFH was repeated in 1994, including serum and secondary circulationfluid, with the addition of skin and vent mucus lysozyme (Table 3). Serum lysozyme levels werecomparable to those of plasma from the August sample in 1993, with a mean of 11.4 ± 0.4 µg ⋅mL-1 (N = 236). Secondary circulation lysozyme concentrations, 16.0 ± 0.2 µg ⋅ mL-1 (N = 231),

54
paralleled serum lysozyme concentrations. Both serum and secondary circulation lysozyme variedsignificantly during the sampling period, with serum levels always lower than secondarycirculation levels. Neither skin nor vent mucus lysozyme concentrations differed significantlyamong the three sample dates. Mean vent mucus lysozyme concentrations were over ten timesgreater than skin mucus lysozyme concentrations.
Adult spring chinook salmon at Little White Salmon NFH in 1994 had a mean serumlysozyme concentration of 6.2 ± 0.6 µg ⋅ mL-1 (N = 59) and secondary circulation lysozyme of17.9 ± 0.5 µg ⋅ mL-1 (N = 74) (Table 4). The mean skin mucus lysozyme concentration was 67 ±7 µg ⋅ mL-1 (N = 76). There was a slight increase in serum lysozyme between sample dates. Skinmucus and secondary circulation lysozyme remained constant. Lysozyme levels of Little WhiteSalmon NFH spring chinook salmon in 1994 were comparable to levels for chinook salmon atCarson NFH in 1994, with serum levels being within the lower part of the range found at Carson.Early serum and secondary circulation lysozyme levels at Carson NFH in 1993 were higher thanserum and secondary circulation at Little White Salmon NFH in 1994. Skin mucus lysozymeconcentration was lower at Carson NFH than at Little White Salmon NFH.
Experimental Fish from Covered and Uncovered Hatchery RacewaysPlasma lysozyme concentrations were compared between coho salmon reared in open and
covered raceways at Willard NFH immediately before release (April 7, 1993). There was nosignificant difference in mean plasma lysozyme concentrations between control and coveredgroups, or between replicate groups within the individual treatments (Appendix O1); therefore,data from both groups were pooled. The mean plasma lysozyme concentration was 7.0 ± 0.5 µg ⋅mL-1 (N = 45).
A continuation of the covered raceway study in fall 1993 and spring 1994 allowed forsampling of mouth, skin, nare, and vent mucus lysozyme from coho salmon at Willard NFH andspring chinook salmon at Little White Salmon NFH. Mouth mucus samples were difficult tocollect and were discontinued after the initial sampling attempt. Because mean mouth mucuslysozyme concentrations did not differ between control and covered groups in either Willard cohosalmon or Little White Salmon spring chinook salmon (Appendix L2), data were pooled bysample date. There was no significant difference between mean mouth mucus lysozyme in cohosalmon (86 ± 9 µg ⋅ mL-1) and spring chinook salmon (106 ± 9 µg ⋅ mL-1).
Skin, nare, and vent mucus lysozyme concentrations were determined on five dates priorto release of coho salmon from Willard NFH (Figure 1). There were no significant differencesbetween control and covered treatment groups on a particular date for any of the mucus typessampled (Appendices O2, O3, O4, and O5), and control and covered lysozyme values werepooled by date to determine mean concentrations for reference levels. Lysozyme activity for allthree mucus types decreased significantly from February to early March (P � 0.05), with a furtherdecrease in nare mucus in mid-April when the fish were released (Table 5).
Skin mucus lysozyme levels in juvenile spring chinook salmon from Little White SalmonNFH declined significantly between February and March (P � 0.05), and remained low until therelease date in April (Figure 2, Table 6, Appendix O6). Nare mucus lysozyme concentrationsdiffered significantly between February and March (P � 0.05), and between early and late March(P � 0.05), and continued to decline through the release in April (Figure 2, Table 6, AppendixO7). Vent mucus lysozyme levels decreased steadily from December through April, the difference

55
between December and April concentrations being significant (P � 0.05) (Figure 2, Table 6,Appendix O8).
Coho salmon and spring chinook salmon mucus lysozyme levels were compared by sampledate. There was no significant difference between skin lysozyme concentrations on any sampledate, although in January the mean for spring chinook salmon (127 µg ⋅ mL-1) was twice that ofcoho salmon (66 µg ⋅ mL-1). Nare mucus lysozyme concentrations differed significantly (P �0.05), on a single date, March 3, 1994, when levels for spring chinook levels were higher thanlevels for coho salmon. Mean vent mucus lysozyme levels did not differ between the species atany time during the study.
Disease Challenge Experiments1993 Results
Plasma lysozyme concentrations from BKD-challenged fish in 1993 differed significantlyfrom control fish in the 9th week after the second challenge (P � 0.05) (Appendix O9). At thistime, plasma lysozyme concentrations had reached their lowest levels in both control and disease-challenged fish (Figure 3), with disease-challenged fish having lower concentrations. Theprecipitous drop in concentration 9 weeks after the challenge (October 26, 1993) was experiencedby both groups of fish, with a mean of 7.4 µg ⋅ mL-1 for the control group, and 2.3 µg ⋅ mL-1 forthe challenged group. No significant difference was found in plasma concentrations between thecontrol and challenged groups on the other sample dates. Mean plasma lysozyme concentrationsranged from 19.7 to 24.3 µg ⋅ mL-1 in the 6th (October 5, 1993), 12th (November 16, 1993), and15th week (December 9, 1993). At 15 weeks after the disease challenge and five weeks after thestress treatment, the mean plasma lysozyme concentration was higher in the disease-challengedfish.
Changes in skin mucus lysozyme concentrations varied in tandem for the control anddisease-challenged fish (Figure 4, Appendix O10). Significant differences between the twogroups were found in the 9th (October 26, 1993) and 17th (December 21, 1993) weeks after thesecond challenge (P � 0.05). As with plasma lysozyme, skin mucus lysozyme in control fish wassignificantly higher than that of diseased fish in the 9th week (P � 0.05). By the 17th week, skinmucus lysozyme in the disease group (1520 ± 164 µg ⋅ mL-1) was twice that of the controls (771± 68 µg ⋅ mL-1). Wide variation in mean skin mucus lysozyme was seen during the experiment,with values ranging from a low of 35 µg ⋅ mL-1 to a high of 1520 µg ⋅ mL-1.
A significant difference between vent mucus lysozyme in the two treatments was seen oneweek after the first challenge (June 10, 1993), when the level in disease-challenged fish was overthree times as high as the level in control fish (P � 0.05). By 6 weeks (July 1, 1993), lysozyme inboth groups was almost equal. Vent mucus lysozyme levels declined in both groups, with nofurther differences being found between the two groups on any date (Figure 5, Appendix O11). Mean vent mucus lysozyme ranged from the peak at 6 weeks after the first challenge, at 1473 ±64 µg ⋅ mL-1 (N = 9), to a low of 258 ± 38 µg ⋅ mL-1 (N = 20) in the final sample, 17 weeks afterthe second challenge. Vent mucus lysozyme continued to decline, while both plasma and skinmucus lysozyme levels increased to their highest levels after the stress treatment.

56
1994 ResultsIn 1994, fish were disease-challenged once after an initial sample was taken (May 31,
1994). Skin mucus lysozyme levels showed a general increase, with significantly higherconcentrations in August than in May and June (P � 0.05) (Figure 6) (Appendix O12). There wasno significant difference in skin mucus lysozyme levels until ten weeks after the challenge, whenthe level in disease-challenged fish was three times that of the controls. Mean skin mucuslysozyme of the challenged group was higher on every date with the exception of the last sample,the difference becoming more marked as the disease progressed.
Nare mucus lysozyme levels were the same in the two groups prior to the challenge, butpost-challenge levels in control fish remained constant until week 4, then declined. Levels in bothgroups declined between weeks 4 and 6 post-challenge. The challenged group experienced adecline soon after the challenge, but lysozyme increased to levels exceeding that of controls, andthe two groups were significantly different at week 10 (P � 0.05). By week 12, levels inchallenged fish were similar to those of the controls (Figure 7, Appendix O13).
Vent mucus lysozyme showed a gradual increase over the course of the experiment, withlevels in disease-challenged fish being higher in the 8th and 10th week of the infection, as was thecase with both skin and nare levels (Figure 8, Appendix O14). Vent mucus lysozymeconcentrations of challenged fish were significantly higher (P � 0.05), in August than in May orJune.
Eight weeks after the challenge, mucus lysozyme concentrations were significantly higherin challenged fish than in control fish for all three mucus types. By 12 weeks, lysozyme levels ofcontrols and treatments were equal.
DISCUSSION
Mucus lysozyme concentrations in juvenile Pacific salmon revealed consistency amongspecies and hatchery groups. Plasma and serum lysozyme concentrations were low (� 25 µg ⋅mL-1) compared to mucus lysozyme levels, an observation consistent with the literature (Lie et al.1989). Skin, vent, and nare lysozyme concentrations of control or healthy fish varied withinmarked ranges. Skin lysozyme was the lowest of the mucus lysozymes, usually under 100 µg ⋅mL-1. Vent mucus lysozyme ranged from 100 to 400 µg ⋅ mL-1, and nare mucus lysozyme rangedfrom 300 to 600 µg ⋅ mL-1. Previously reported levels for blood and tissue lysozyme wereperformed by a lysoplate method (Ellis 1990). We found this method unsuitable for assayingsmall mucus lysozyme samples, and established a microassay plate turbidimetric method.
Skin mucus levels in our study were less than or equal to kidney lysozyme in other marinefish species determined using another turbidimetric method (Grinde et al. 1988b). The highestmucus lysozyme levels we observed in any mucus, even in diseased fish, did not reachconcentrations reported in the kidney of other salmonids (Lie et al. 1989). Ranges of plasma,serum, skin, nare, and vent mucus lysozyme were consistent among the species we considered,and were comparable to previous studies assaying lysozyme in tissues of marine fishes (Fange etal. 1976). The interspecies comparisons we made revealed that juvenile spring and summerchinook salmon and coho salmon appeared to have similar mucus lysozyme concentration ranges.

57
Baseline Levels in Hatchery Reference StocksJuvenile Salmon
Uniformity of nare lysozyme levels among hatcheries comparing spring and summerchinook salmon suggests that the mean nare lysozyme levels sampled at release may representbasal concentrations for the reference hatchery populations at that time of year. Rearingtemperature did not appear to affect lysozyme level (Appendix O15). Mean nare mucus lysozymelevels ranged from 327 µg ⋅ mL-1 in Wells Hatchery summer chinook, to 588 µg ⋅ mL-1 inLookingglass Hatchery spring chinook salmon.
The similarity of lysozyme ranges in groups of fish reared in close geographic proximitysuggests that environmental factors may influence basal lysozyme concentrations. The highestlevels of lysozyme (> 480 µg ⋅ mL-1) were found in the lower Snake River tributaries atLookingglass, Rapid River, and Dworshak hatcheries. Mid-Columbia River spring chinooksalmon showed intermediate mean levels of 420 µg ⋅ mL-1 and 459 µg ⋅ mL-1 at Winthrop NFHand Entiat NFH, respectively. Hatcheries at or below the confluence of the Columbia and Snakerivers had low mean nare mucus lysozyme levels � 360 µg ⋅ mL-1 (Ringold Hatchery, WillardNFH, and Little White Salmon NFH). Summer chinook salmon had nare mucus lysozyme levelsin the low range (< 400 µg ⋅ mL-1). If the assumption is made that all spring chinook salmongroups were at the same level of smoltification when released, then geographic differences mayreflect either stock-specific differences, or differences in environmental factors associated withhatchery rearing practices. Summer chinook salmon were released at the same time of year astheir spring chinook salmon counterparts, but did not have comparable lysozyme levels at release. Because rearing conditions were not as uniform across reference hatcheries as in the comparisonbetween Willard NFH coho and Little White Salmon NFH spring chinook salmon, observeddifferences could conceivably be attributed to variation in rearing environment.
Few conclusions may be drawn from a single sample at release. The two hatcheries withthe highest mucus lysozyme levels, Lookingglass and Rapid River, were both stocked with RapidRiver spring chinook salmon in 1994. The uniformity of results between hatcheries with the samefish stock, and within geographic regions, consistent with ranges of nare mucus lysozyme weobserved in the experiments, suggests that baseline levels of lysozyme may exist in Pacific salmonstocks. A more detailed evaluation of rearing conditions may help to distinguish genetic fromenvironmental determinants of mucus lysozyme levels.
Adult SalmonAgreement of the various lysozyme levels in juvenile salmon between stocks, species,
hatcheries and years renders them useful as a reference for results from returning adults. Adultserum and secondary circulation lysozyme levels were within cited literature ranges for plasmaand serum lysozyme. Inconsistent changes in serum, secondary circulation, skin mucus lysozyme,and vent mucus lysozyme during holding require more extensive investigation. Decreases inmucus cell concentrations during spawning have been reported in brown trout for adult males, butnot females (Pickering and Richards 1980). We saw no significant difference in mucus lysozymeconcentrations between male and female spring chinook salmon. More frequent and uniformsampling would be necessary to determine if the ranges of serum, secondary circulation, andmucus lysozyme we observed in two groups of adult hatchery spring chinook salmon are

58
representative of levels for other returning adults. Changes in lysozyme levels of adult salmonduring holding indicate that physiological changes during life history events such as spawning maybe accompanied by concurrent changes in lysozyme concentration.
Experimental Fish from Covered and Uncovered Hatchery RacewaysWe documented seasonal changes in lysozyme concentration in skin, nare, and vent mucus
in both spring chinook salmon and coho salmon, and observed a decrease at the time the stocksare reported to smolt. The periodic changes we observed were compatible with a previous studydocumenting reduced lysozyme concentrations in winter and during smoltification in Atlanticsalmon and sea trout Salmo trutta (Muona and Soivio 1992). Significant differences were foundamong mean mucus lysozyme concentrations, by sample date, between December and April in ourstudy. Levels were tested at a time of year when juvenile salmon may have experiencedsuppressed immune competence (Maule et al. 1987), and we associate the decline in lysozymelevels with smoltification.
A comparison of coho salmon and spring chinook salmon held at Willard NFH and LittleWhite Salmon NFH suggests no difference in baseline levels of mucus lysozyme between the twospecies. The hatcheries were fed by the same river, and were stocked under loading densities of 3kg ⋅ m-3, therefore important rearing variables were the same. On one sample date a significantdifference was found between nare lysozyme concentrations of coho salmon and spring chinooksalmon, but the difference did not persist over the season. In general, mean mucus lysozymelevels of spring chinook salmon were slightly higher than those of coho salmon in the springbefore release. Differences on individual sample dates may be a reflection of differences in thelevel of physiological development of the two species at the time of sampling. The decline inmucus lysozyme levels in juvenile salmon, at the time associated with the parr-to-smolttransformation, is consistent with previously documented changes in lysozyme and physiologicaland non-specific immune factors during smoltification (Muona and Soivio 1992; Folmar andDickhoff 1981; Barron 1986; Bradley and Rourke 1988; Maule et al. 1993). Ranges of plasmalysozyme in juvenile coho salmon and chinook salmon were comparable to levels found in Atlanticsalmon and sea trout (Muona and Soivio 1992).
Disease Challenge ExperimentsMucus lysozyme concentrations changed during disease episodes of BKD following
challenge with R. salmoninarum. The dramatic rise in skin lysozyme levels after exposure to R.salmoninarum has not been previously reported, but increases in lysozyme have been documentedin fish challenged with Aeromonas salmonicida (Moyner et al. 1993).
The BKD-challenged group experienced a five-fold increase in skin mucus lysozymebetween the 12th and 17th week of the disease challenge in 1993, a change that did not manifestitself until after the stress exposure. The stress exercise may have initiated a more severemanifestation of the disease in fish that were in a chronic state of infection prior to the stressepisode. Vent mucus lysozyme was significantly different between the groups shortly afterdisease challenge, but the difference did not persist. Differences in the timing of peaks inlysozyme activity during disease episodes may result from differences in mode of infection ofspecific pathogens.

59
In 1994, skin mucus lysozyme increased between the 8th and the 10th week, when thedisease-challenged group had significantly higher levels than control fish. The evident, thoughless pronounced, increase in lysozyme of the control group indicated the onset of a diseaseepisode in a stock of fish that routinely experiences outbreaks of BKD (Matt Mesa, ColumbiaRiver Research Laboratory, personal communication). Nare lysozyme results were significantlydifferent at 8 and 10 weeks post-challenge, with levels in the disease-challenged group higher thanin the control group. Vent mucus lysozyme levels were also higher in the 8th and 10th week inthe disease-challenged group. Results in 1994 were not complicated by a second diseasechallenge or by the additional stress treatment. A disease outbreak in the control group in 1994was evidenced by an increase in mucus lysozyme levels of all three mucus types in the controls tothe same levels found in the disease-challenged fish.
The difference in timing of significant increases in lysozyme concentration after diseasechallenge between the two experiments may be due to differences in time of year when theexperiments took place. Our results from spring chinook salmon at Little White Salmon NFHsuggest that we must consider the influence of seasonal changes in lysozyme levels on thecomparison of experiments conducted at different times of year. Differences in skin, nare, andvent mucus lysozyme levels at different times after the BKD challenge may therefore be attributedto the effects of the experimental disease challenge, superimposed upon seasonal patterns oflysozyme concentration. Differences in lysozyme levels between the two treatment groupsoccurred at a time consistent with reports of the onset of signs of BKD and mortality afterchallenge with R. salmoninarum (Fryer and Sanders 1981). Rainbow trout lysozyme has beenfound to be bactericidal to Yersinia ruckeri, Vibrio anguillarum, Vibrio salmonicida, and A.salmonicida (Grinde 1989), but lysozyme has not been found to lyse R. salmoninarum. Increasesin mucus lysozyme levels during bacterial kidney disease episodes may be the result of local tissueinvolvement during initial exposure to the pathogen, compromise of the kidney during advancedstages of the disease, or localized production of lysozyme when the disease progresses to thestage of tissue involvement and lesions. Previous studies, identifying eosinophilic cells in theepidermis (Pickering and Richards 1980) and eosinophilic granule cells in the intestines of Atlanticsalmon as sites where lysozyme has been localized (Sveinbj�rnsson et al. 1996), help to explainthe dynamics of lysozyme concentration changes as pathogens invade the fish and infectionspreads. Differences in the time of year would presuppose seasonal differences in lysozyme levels(Muona and Soivio 1992), differences in the immune competence of the fish (Maule et al. 1987),and differences in pathogenicity of the bacteria (Chavessus and Dorson 1990). The determinationof baseline annual profiles of mucus lysozyme activity in the reference stocks would be desirableto allow comparisons with and evaluations of mucus lysozyme levels under different rearing orexperimental conditions.
ConclusionsMucus lysozyme determination has the potential to be a useful, non-lethal measurement of
the health and physiological status of both juvenile and adult Pacific salmon. The consistency ofconcentration ranges of skin, nare, and vent mucus lysozyme levels supports evidence for thegenetic basis of lysozyme variation seen in other species (R�ed et al. 1990, 1993). Repetitiveseasonal patterns of change in lysozyme concentrations, especially during the period associatedwith smoltification, provide strong physiological evidence of changing patterns of disease

60
resistance and immunity during life history events. Because mucus lysozyme has not beenextensively studied, our results provide a valuable reference for future studies of both juvenile andadult salmon. We determined that mucus levels in both adults and juveniles were comparable tolevels found in rainbow trout and Atlantic salmon (Grinde et al. 1988b). Mucus lysozyme levelsusually exceeded plasma or serum lysozyme levels, with concentrations ranging from 10 to 2000µg ⋅ mL-1 (HEWL).
Mucus lysozyme level may prove to be a useful tool for assessing the health of juvenileand adult salmon during smoltification, spawning, and disease episodes. Mucus samples collectedby inoculation loop provided concentrations appropriate for analysis by a turbidimetric method. In fish considered healthy (controls or hatchery stocks), nare mucus lysozyme concentrationswere the highest, followed by vent mucus, skin mucus, and serum or plasma mucus.
The effects of stress on lysozyme concentrations have been noted (Murray and Fletcher1976; Mock and Peters 1990), and stress may have been the source of some variability inlysozyme concentrations for adult salmon. Stress has been implicated as the initiator of moreacute infection, with an accompanying increase in mucus lysozyme levels. A significant increasein skin mucus lysozyme in disease-challenged fish in 1993 may have been promoted by stressacting to transform a chronic infection into an acute infection.
Uniform sampling of juvenile Pacific salmon provided mucus lysozyme results with a levelof consistency that promises to prove useful in assessing fish health. With the establishment ofbaseline levels for specific stocks, and an understanding of the effects of genetics, environment,stress, and physiology on lysozyme levels, a clearer understanding of disease resistance and itscontribution to fish health may be realized.

61
CHAPTER THREE TABLES
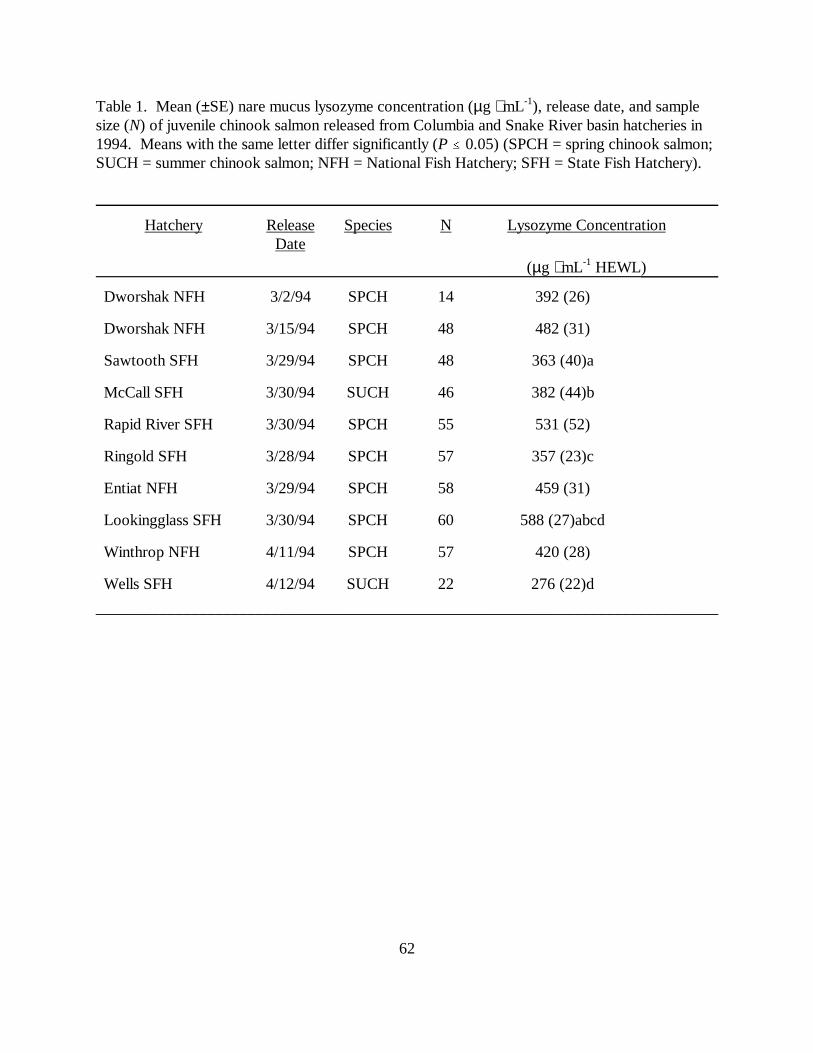
62
Table 1. Mean (±SE) nare mucus lysozyme concentration (µg ⋅ mL-1), release date, and samplesize (N) of juvenile chinook salmon released from Columbia and Snake River basin hatcheries in1994. Means with the same letter differ significantly (P � 0.05) (SPCH = spring chinook salmon;SUCH = summer chinook salmon; NFH = National Fish Hatchery; SFH = State Fish Hatchery).
Hatchery ReleaseDate
Species N Lysozyme Concentration
(µg ⋅ mL-1 HEWL)
Dworshak NFH 3/2/94 SPCH 14 392 (26)
Dworshak NFH 3/15/94 SPCH 48 482 (31)
Sawtooth SFH 3/29/94 SPCH 48 363 (40)a
McCall SFH 3/30/94 SUCH 46 382 (44)b
Rapid River SFH 3/30/94 SPCH 55 531 (52)
Ringold SFH 3/28/94 SPCH 57 357 (23)c
Entiat NFH 3/29/94 SPCH 58 459 (31)
Lookingglass SFH 3/30/94 SPCH 60 588 (27)abcd
Winthrop NFH 4/11/94 SPCH 57 420 (28)
Wells SFH 4/12/94 SUCH 22 276 (22)d
______________________________________________________________________________

63
Table 2. Mean (±SE) plasma and secondary circulation lysozyme concentrations in adult chinooksalmon returning to Carson National Fish Hatchery in 1993 (N = sample size). Means with thesame letter differ significantly (P � 0.05).
Tissue Sample Date N LysozymeConcentration
(µg ⋅ mL-1 HEWL)
Plasma 6/17/93 8 24.8 (2.7)a
8/10/93 14 13.6 (0.8)a
Secondary Circulation 6/17/93 14 26.3 (0.6)
8/10/93 17 24.6 (1.2)

64
Table 3. Mean (±SE) serum, secondary circulation, skin mucus, and vent mucus lysozymeconcentrations in adult chinook salmon returning to Carson National Fish Hatchery in 1994 (N =sample size). Means with the same letter differ significantly (P � 0.05).
______________________________________________________________________________
Tissue Sample date N LysozymeConcentration
(µg mL-1 HEWL)
Serum 8/8/94 35 13.0 (1.4)ab
8/15/94 40 14.5 (1.2)cd
8/22/94 40 13.5 (1.1)ef
8/29/94 41 6.9 (0.7)aceg
9/2/94 40 15.3 (0.4)bgh
9/7/94 40 5.6 (0.6)bdfh
Secondary Circulation 8/8/94 34 20.1 (0.6)ij
8/15/94 40 18.4 (0.4)kl
8/22/94 39 20.2 (0.4)mn
8/29/94 39 10.4 (0.8)ikmo
9/2/94 39 19.1 (0.4)op
9/7/94 40 8.1 (0.8)jlnp
Skin 8/8/94 36 58 (4)
8/15/94 40 59 (6)
8/29/94 41 52 (2)
Vent 8/15/94 26 785 (82)
8/22/94 27 701 (40)
9/2/94 27 759 (30)

65
Table 4. Mean (±SE) serum, secondary circulation, and skin mucus lysozyme concentrations inadult chinook salmon returning to Little White Salmon National Fish Hatchery in 1994 (N =sample size).
______________________________________________________________________________
Tissue Sample Date N LysozymeConcentration
(µg ⋅ mL-1 HEWL)
Serum 7/27/94 33 5.2 (0.8)
8/3/94 26 7.4 (1.0)
Secondary Circulation 7/27/94 36 17.8 (1.0)
8/3/94 38 17.8 (0.4)
Skin 7/27/94 36 74 (15)
8/3/94 40 60 (4)
_________________________________________________________________

66
Table 5. Mean (±SE) skin, nare, and vent mucus lysozyme concentrations in juvenile cohosalmon used in raceway cover experiments at Willard National Fish Hatchery, 1993-1994 (N =sample size). Means with the same letter differ significantly (P � 0.05).
Tissue Sample Date N LysozymeConcentration
(µg ⋅ mL-1 HEWL)
Skin 2/2/94 60 66 (3)abc
3/3/94 59 30 (2)ad
3/24/94 59 18 (3)bd
4/18/94 58 26 (3)c
Nare 12/21/93 9 364 (61)e
2/2/94 59 584 (25)efgh
3/3/94 59 421 (18)f
3/24/94 37 371 (26)g
4/18/94 56 331 (16)h
Vent 12/21/93 31 319 (35)ijk
2/2/94 59 245 (16)lm
3/3/94 56 213 (18)in
3/24/94 59 141 (10)jln
4/18/94 58 151 (11)km
______________________________________________________________________________

67
Table 6. Mean (±SE) skin, nare and vent mucus lysozyme concentrations in juvenile springchinook salmon used in raceway cover experiments at Little White Salmon National FishHatchery, 1993-1994 (N = sample size). Means with the same letter differ significantly (P �0.05).
Tissue Sample Date N LysozymeConcentration
(µg mL-1 HEWL)
Skin 12/21/93 29 47 (3)
2/2/94 60 127 (37)abc
3/3/94 58 20 (2)a
3/24/94 60 32 (3)b
4/18/94 59 29 (3)c
Nare 12/21/93 - -
2/2/94 60 726 (45)def
3/3/94 60 584 (35)dgh
3/24/94 59 387 (25)eg
4/18/94 59 319 (24)fh
Vent 12/21/93 28 293 (18)
2/2/94 60 287 (20)i
3/3/94 58 247 (43)
3/24/94 60 200 (14)
4/18/94 58 164 (10)i
______________________________________________________________________________

68
CHAPTER THREE FIGURES

69
Figure 1. Mean (±SE) skin, nare, and vent mucus lysozyme concentrations (µg ⋅ mL-1 HEWL) in juvenile coho salmon used in raceway cover experiments at Willard National Fish Hatchery, 1993 to 1994.
Date
12/1/93 1/1/94 2/1/94 3/1/94 4/1/94 5/1/94
Muc
us L
yso
zym
e C
onc
entr
atio
n (µ
g ⋅ m
L-1 H
EW
L)
0
100
200
300
400
500
600
700
800
skinnarevent
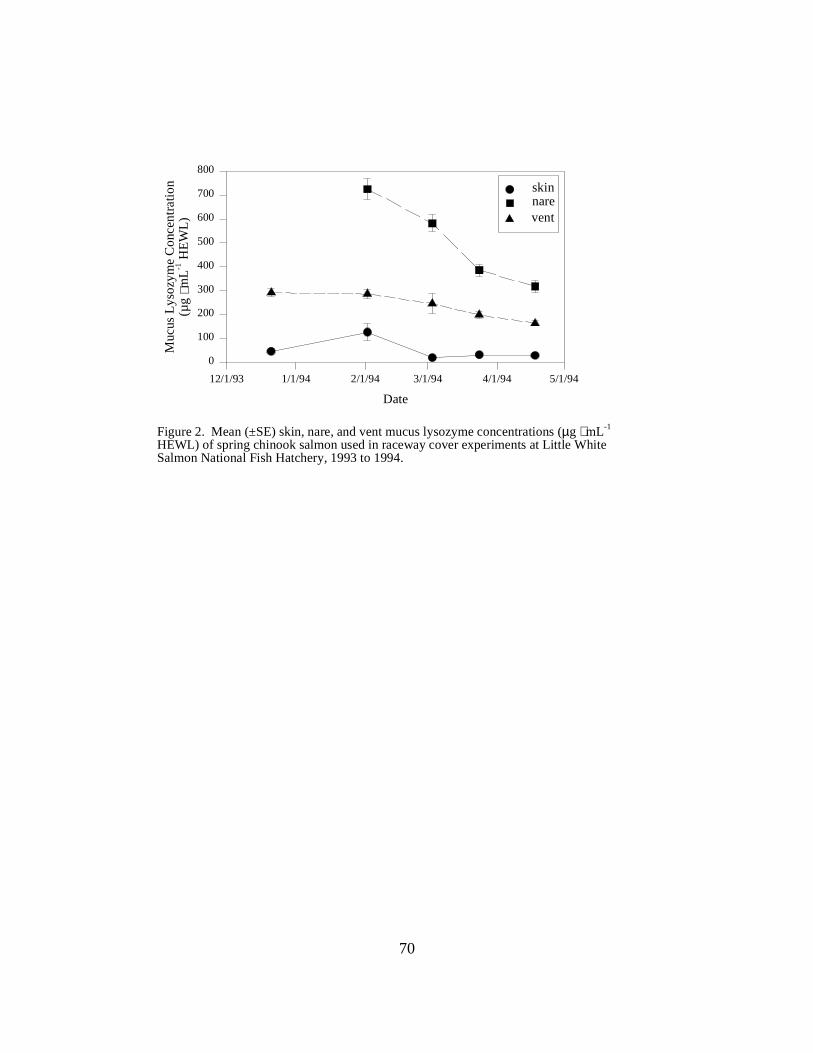
70
Figure 2. Mean (±SE) skin, nare, and vent mucus lysozyme concentrations (µg ⋅ mL-1
HEWL) of spring chinook salmon used in raceway cover experiments at Little White Salmon National Fish Hatchery, 1993 to 1994.
Date
12/1/93 1/1/94 2/1/94 3/1/94 4/1/94 5/1/94
Muc
us L
yso
zym
e C
onc
entr
atio
n(µ
g ⋅ m
L-1 H
EW
L)
0
100
200
300
400
500
600
700
800
skinnarevent
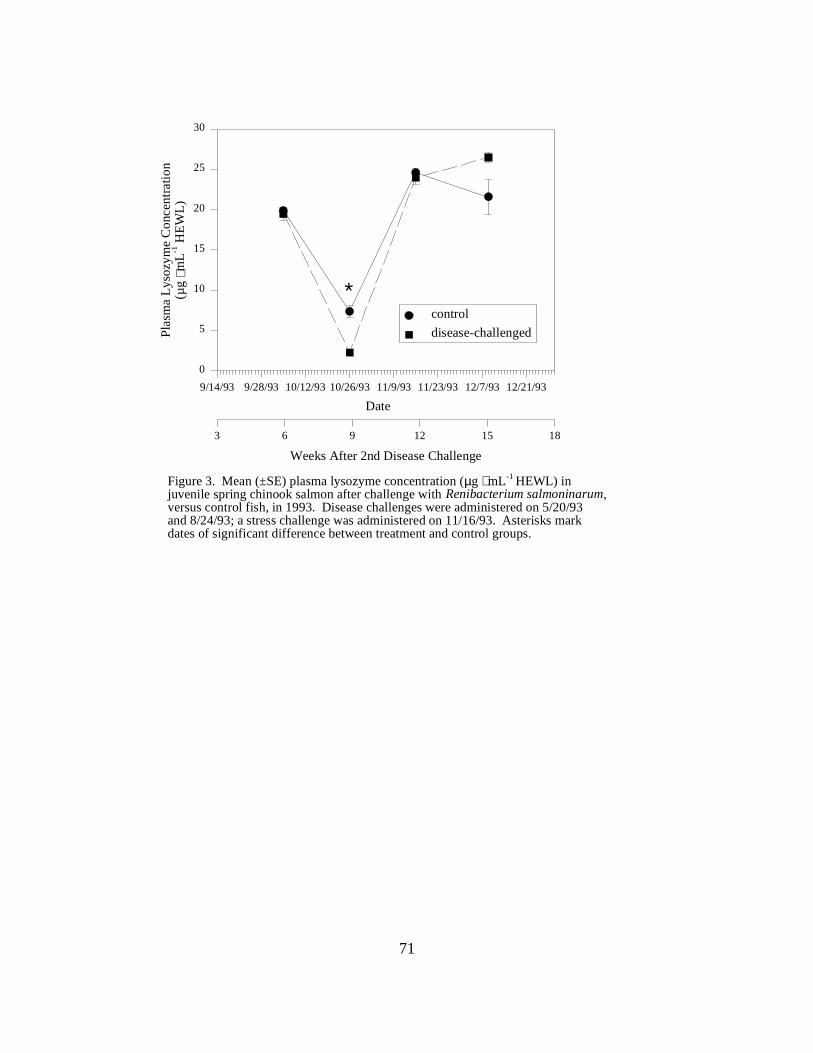
71
Figure 3. Mean (±SE) plasma lysozyme concentration (µg ⋅ mL-1 HEWL) in juvenile spring chinook salmon after challenge with Renibacterium salmoninarum, versus control fish, in 1993. Disease challenges were administered on 5/20/93 and 8/24/93; a stress challenge was administered on 11/16/93. Asterisks mark dates of significant difference between treatment and control groups.
Date
9/14/93 9/28/93 10/12/93 10/26/93 11/9/93 11/23/93 12/7/93 12/21/93
Pla
sma
Lys
ozy
me
Co
ncen
tra
tion
(µg
⋅ mL-1
HE
WL)
0
5
10
15
20
25
30
Weeks After 2nd Disease Challenge
3 6 9 12 15 18
*
disease-challenged
control

72
Figure 4. Mean (±SE) skin mucus lysozyme concentration (µg ⋅ mL-1 HEWL) in juvenile spring chinook salmon experimentally challenged with Renibacterium salmoninarum, versus control fish, in 1993. Disease challenges were administered on 5/20/93 and on 8/24/93; a stress challenge was administered on 11/16/93. Asterisks denote dates of significant difference between control and disease-challenged groups.
Date
7/1/93 8/1/93 9/1/93 10/1/93 11/1/93 12/1/93
Ski
n M
ucu
s L
yso
zym
e C
onc
entr
atio
n
(µ
g ⋅ m
L-1 H
EW
L)
0
200
400
600
800
1000
1200
1400
1600
Weeks After 2nd Disease Challenge
-9 -6 -3 0 3 6 9 12 15 18
*
*
Disease-challengedControl
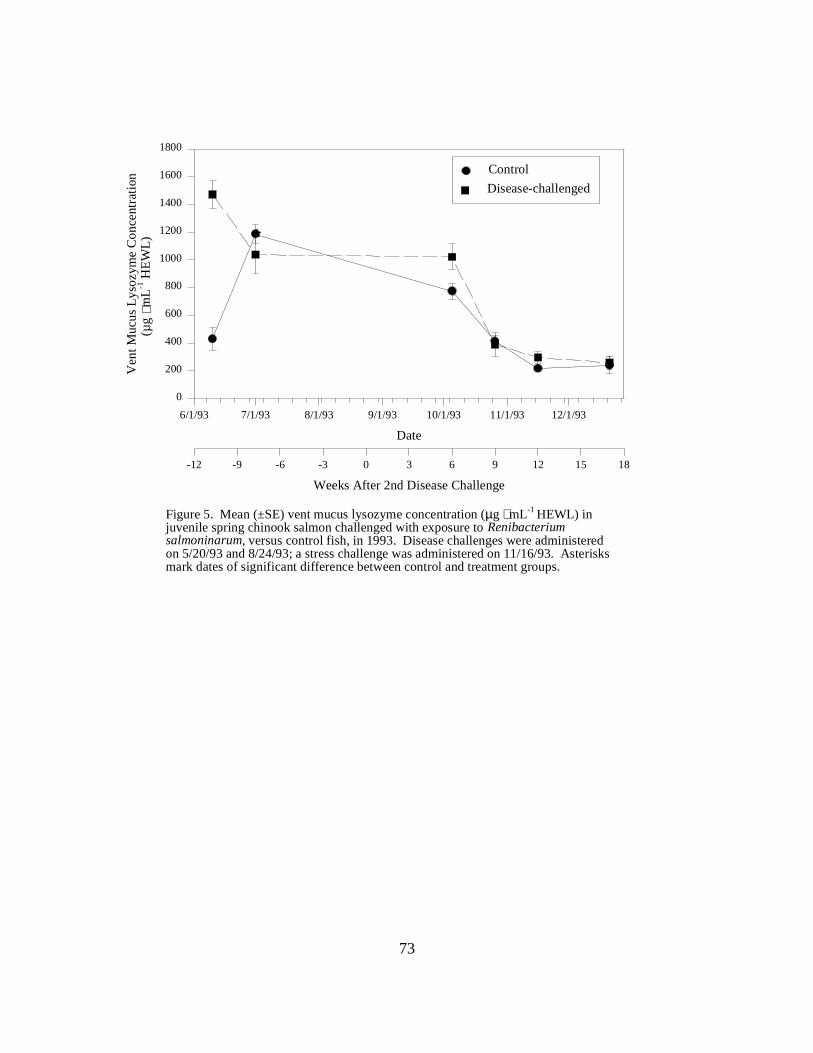
73
Figure 5. Mean (±SE) vent mucus lysozyme concentration (µg ⋅ mL-1 HEWL) in juvenile spring chinook salmon challenged with exposure to Renibacterium salmoninarum, versus control fish, in 1993. Disease challenges were administered on 5/20/93 and 8/24/93; a stress challenge was administered on 11/16/93. Asterisks mark dates of significant difference between control and treatment groups.
Date
6/1/93 7/1/93 8/1/93 9/1/93 10/1/93 11/1/93 12/1/93
Ven
t M
ucu
s Ly
sozy
me
Co
nce
ntra
tion
(µg
⋅ mL-1
HE
WL)
0
200
400
600
800
1000
1200
1400
1600
1800
Weeks After 2nd Disease Challenge
-12 -9 -6 -3 0 3 6 9 12 15 18
*
Control
Disease-challenged

74
Figure 6. Mean (±SE) skin mucus lysozyme concentrations (µg ⋅ mL-1 HEWL) in juvenile spring chinook salmon challenged with exposure to Renibacterium salmoninarum, versus control fish, in 1994. The disease challenge was administered on 6/1/94. Asterisks mark dates of significant difference between values for treatment and control fish.
Date
5/18/94 6/1/94 6/15/94 6/29/94 7/13/94 7/27/94 8/10/94 8/24/94 9/7/94
Ski
n M
ucu
s L
yso
zym
e(µ
g ⋅ m
L-1 H
EW
L)
0
20
40
60
80
100
120
140
160
180
200
Weeks Post-challenge
-2 0 2 4 6 8 10 12 14
*
Control
Disease-challenged

75
Figure 7. Mean (±SE) nare mucus lysozyme concentrations (µg ⋅ mL-1 HEWL) in juvenile spring chinook salmon challenged with Renibacterium salmoninarum, versus control fish, in 1994. The disease challenge was administered on 6/1/94. Asterisks denote significant difference between control and treatment groups.
Date
5/18/94 6/1/94 6/15/94 6/29/94 7/13/94 7/27/94 8/10/94 8/24/94 9/7/94
Nar
e M
ucu
s Ly
sozy
me
Co
nce
ntra
tion
(µg
⋅ mL-1
HE
WL)
200
300
400
500
600
700
Weeks Post-challenge
-2 0 2 4 6 8 10 12 14
*
Control
Disease-challenged

76
Figure 8. Mean (±SE) vent mucus lysozyme concentration (µg ⋅ mL-1 HEWL) in juvenile spring chinook salmon challenged with exposure to Renibacterium salmoninarum, versus control fish, in 1994. The disease challenge was administered on 6/1/94.
Date
5/18/94 6/1/94 6/15/94 6/29/94 7/13/94 7/27/94 8/10/94 8/24/94 9/7/94
Ven
t M
ucu
s Ly
sozy
me
Co
nce
ntra
tion
(µg
⋅ mL-1
HE
WL)
100
200
300
400
500
600
700
Weeks Post-challenge
-2 0 2 4 6 8 10 12 14
Control
Disease-challenged
77
REFERENCES
Barron, M. G. 1986. Endocrine control of smoltification in anadromous salmonids. Journal ofEndocrinology 108:313-319.
Barton, B. A., C. B. Schreck, R. D. Ewing, A. R. Hemmingsen, and R. Patino. 1985. Changes inplasma cortisol during stress and smoltification in coho salmon, Oncorhynchus kisutch.General and Comparative Endocrinology 59:468-471.
Beeman, J. W., and D. W. Rondorf. 1992. Effects of flow and smoltification on the migrationrates of spring chinook salmon and steelhead. Pages 77-83 in Proceedings of the AtlanticSalmon Workshop. U.S. Fish and Wildlife Service, Lamar, Pennsylvania.
Beeman, J. W., D. W. Rondorf, J. C. Faler, M. E. Free, and P. V. Haner. 1990. Assessment ofsmolt condition for travel time analysis. Annual report 1989 (Contract DE-A179-87BP35245) to Bonneville Power Administration, Portland, Oregon.
Beeman, J. W., D. W. Rondorf, J. C. Faler, M. E. Free, P. V. Haner, S. T. Sauter, and D. A.Venditti. 1991. Assessment of smolt condition for travel time analysis. Annual Report1990 (Contract DE-A179-87BP35245) to Bonneville Power Administration, Portland,Oregon.
Beeman, J. W., D. W. Rondorf, and M. E. Tilson. 1994. Assessing smoltification of juvenilespring chinook salmon (Oncorhynchus tshawytscha) using changes in body morphology.Canadian Journal of Fisheries and Aquatic Sciences 51:836-844.
Beeman, J. W., D. W. Rondorf, M. E. Tilson, and D. A. Venditti. 1995. A non-lethal measure ofsmolt status of juvenile steelhead based on body morphology. Transactions of theAmerican Fisheries Society 124:764-769.
Borgatti, A. R., A. Pagliari, and V. Ventrella. 1992. Gill (Na+, K+)-ATPase involvement andregulation during salmonid adaptation to salt water. Comparative Biochemistry andPhysiology 102A:637-643.
Bradley, T. M. and A. W. Rourke. 1988. Smoltification in steelhead trout (Salmo gairdneri):developmental aspects of plasma constituents. Fish Physiology and Biochemistry 5(1):39-47.
Chevassus, B. and M. Dorson. 1990. Genetics of resistance to disease in fishes. Aquaculture85:83-107.
Chipman, D. M. and N. Sharon. 1969. Mechanism of lysozyme action. Science 165:454-465.

78
Chu, F-L. E. and J. F. LaPeyre. 1989. Effect of environmental factors and parasitism onhemolymph lysozyme and protein of American lobsters (Crassostrea virginica). Journalof Invertebrate Pathology 54:224-232.
Dautigny, A., E. M. Prager, D. Pham-Dinh, J. Jolles, F. Pakdel, B. Grinde, and P. Jolles. 1991. cDNA and amino acid sequences of rainbow trout (Oncorhynchus mykiss) lysozymes andtheir implications for the evolution of lysozyme and lactalbumin. Journal of MolecularEvolution 32:187-198.
Davies, R. C., A. Neuberger, and B. M. Wilson. 1969. The dependence of lysozyme activity onpH and ionic strength. Biochimica et Biophysica Acta 178:294-503.
Dickhoff, W. W., C. Sullivan, and C. V. W. Mahnken. 1985. Methods of measuring andcontrolling the parr to smolt transformation (smoltification) of juvenile salmon. Pages 5-9in C. J. Sniderman (ed.), Proceedings of the Eleventh U.S.-Japan Meeting on Aquaculture. U. S. Department of Commerce, National Marine Fisheries Service Technical Report 27,Seattle, Washington.
Ellis, A. E. 1990. Lysozyme Assays. Pages 101-103 in J. S. Stolen, T. C. Fletcher, D. P.Anderson, B. S. Robertson, and W. B. van Muiswinkel (eds.), Techniques in FishImmunology. SOS Publications, Fair Haven, New Jersey.
Ewing, R. D., C. A. Fustish, S. L. Johnson, and H. J. Pribble. 1980. Seaward migration ofjuvenile chinook salmon without elevated (Na+, K+)-ATPase activities. Transactions ofthe American Fisheries Society 109:349-356.
Fange, R., G. Lundblad, and J. Lind. 1976. Lysozyme and chitinase in blood and lymphomyeloidtissues of marine fish. Marine Biology 36:277-282.
Fevolden, S. E., T. Refstie, and K. H. R�ed. 1991. Selection for high and low cortisol stressresponse in Atlantic salmon (Salmo salar) and rainbow trout (Oncorhynchus mykiss).Aquaculture 95:53-65.
Fevolden, S. E., T. Refstie, and K. H. R�ed. 1992. Disease resistance in rainbow trout(Oncorhynchus mykiss) selected for stress response. Aquaculture 104:19-29.
Fevolden, S. E., K. H. R�ed, and B. Gjerde. 1994. Genetic components of post-stress cortisoland lysozyme activity in Atlantic salmon; correlations to disease resistance. Fish andShellfish Immunology 4:507-519.
Fish Passage Center. 1993. 1992 Annual report to Bonneville Power Administration (ProjectNo. 87-127), Portland, Oregon.
79
Fish Passage Center. 1994. 1993 Annual report to Bonneville Power Administration (ProjectNo. 87-127), Portland, Oregon.
Folmar, L. C. and W. W. Dickhoff. 1981. Evaluation of some physiological parameters aspredictive of smoltification. Aquaculture 23:309-324.
Franklin, C. E., W. Davison, and M. E. Forster. 1992. Seawater adaptability of New Zealand'ssockeye (Oncorhynchus nerka) and chinook salmon (O. tshawytscha): physiologicalcorrelates of smoltification and seawater survival. Aquaculture 102:127-142.
Fryer, J. L. and J. E. Sanders. 1981. Bacterial kidney disease of salmonid fish. Annual Reviewof Microbiology 35:273-298.
Giles, M. A. and W. E. Vanstone. 1976. Changes in ouabain-sensitive adenosine triphosphateactivity in gills of coho salmon (Oncorhynchus kisutch) during parr-smolt transformation.Journal of the Fisheries Research Board of Canada 33:54-62.
Grinde, B., J. Jolles, and P. Jolles. 1988a. Purification and characterization of two lysozymesfrom rainbow trout (Salmo gairdneri). European Journal of Biochemistry 173:269-273.
Grinde, B., �. Lie, T. Poppe, and R. Salte. 1988b. Species and individual variation in lysozymeactivity in fish of interest in aquaculture. Aquaculture 68:299-304.
Grinde, B. 1989. Lysozyme from rainbow trout, Salmo gairdneri Richardson, as an antibacterialagent against fish pathogens. Journal of Fish Diseases 12:95-104.
Haner, P. V., J. C. Faler, R. M. Schrock, D. W. Rondorf, and A. G. Maule. 1995. Skinreflectance as a non-lethal measure of smoltification for juvenile salmonids. NorthAmerican Journal of Fisheries Management 15:814-822.
Hoar, W. S. 1976. Smolt transformation: evolution, behavior, and physiology. Journal of theFisheries Research Board of Canada 33:1233-1252.
Hoar, W. S., and D. J. Randall, eds. 1984. Fish Physiology, Volume X, Part B. New York:Academic Press.
Iwamoto, R. N., W. D. Muir, B. P. Sanford, K. W. McIntyre, D. A. Frost, J. G. Williams, S. G.Smith, and J. R. Skalski. 1994. Survival estimates for the passage of juvenile chinooksalmon through Snake River dams and reservoirs, 1993. Annual report (Project No. 93-29) to Bonneville Power Administration, Portland, Oregon.

80
Jones, R. N., and H. L. Burge. 1993. An evaluation of the effects of release time on the post-release performance and adult returns of spring chinook salmon at Dworshak and KooskiaNational Fish Hatcheries in 1993. Progress Report to Lower Snake River CompensationPlan Office, Idaho Fishery Resource Office, U. S. Fish and Wildlife Service, Ahsahka,Idaho.
Jones, R. N., and H. L. Burge. 1994. An evaluation of the effects of release time on the post-release performance and adult returns of spring chinook salmon at Dworshak and KooskiaNational Fish Hatcheries in 1994. Progress Report to Lower Snake River CompensationPlan Office, Idaho Fishery Resource Office, U. S. Fish and Wildlife Service, Ahsahka,Idaho.
Jonsson, N. 1991. Influence of water flow, water temperature, and light on fish migration inrivers. Nordic Journal of Freshwater Research 66:20-35.
Lie, �., O. Evensen, A. Sorensen, and E. Froysadal. 1989. Study on lysozyme activity in somefish species. Diseases of Aquatic Organisms 6:1-5.
Litwack, G. 1955. Photometric determination of lysozyme activity. Proceedings of the Societyof Experimental Biology and Medicine 89:401-403.
Maule, A. G., C. B. Schreck, and S. L. Kaattari. 1987. Changes in the immune system of cohosalmon (Oncorhynchus kisutch) during the parr-to-smolt transformation and afterimplantation of cortisol. Canadian Journal of Fisheries and Aquatic Sciences 44:161-166.
Maule, A. G., C. B. Schreck, and C. Sharpe. 1993. Seasonal changes in cortisol sensitivity andglucocorticoid receptor affinity and number in leukocytes of coho salmon. FishPhysiology and Biochemistry 10(6):497-506.
Maule, A. G., J. W. Beeman, R. M. Schrock, and P. V. Haner. 1994. Assessment of smoltcondition for travel time analysis. Annual report 1991-1992 (Contract DE-A179-87BP35245) to Bonneville Power Administration, Portland, Oregon.
Maule, A. G., D. W. Rondorf, J. W. Beeman, and P. V. Haner. 1996a. Incidence ofRenibacterium salmoninarum infections in juvenile hatchery spring chinook salmon in theColumbia and Snake Rivers. Journal of Aquatic Animal Health 8:37-46.
Maule, A. G., R. M. Schrock, C. Slater, M. S. Fitzpatrick, and C. B. Schreck. 1996b. Immuneand endocrine responses of adult chinook salmon during freshwater immigration andsexual maturation. Fish and Shellfish Immunology 6:221-233.

81
McCartney, T. H. 1976. Sodium-potassium dependent adenosine triphosphatase activity in gillsand kidneys of Atlantic salmon (Salmo salar). Comparative Biochemistry and Physiology53A:351-353.
McCormick, S. D., R. L.Saunders, E. B. Henderson, and P. R. Harmon. 1987. Photoperiodcontrol of parr-smolt transformation in Atlantic salmon (Salmo salar): changes in salinitytolerance, gill Na+ , K+-ATPase activity, and plasma thyroid hormones. Canadian Journalof Fisheries and Aquatic Sciences 44:1462-1468.
McCormick, S. D., R. L.Saunders, and A. D. MacIntyre. 1989. Mitochondrial enzyme and Na+,K+-ATPase activity, and ion regulation during parr-smolt transformation of Atlanticsalmon (Salmo salar). Fish Physiology and Biochemistry 6(4):231-241.
Mock, A., and G. Peters. 1990. Lysozyme activity in rainbow trout, Oncorhynchus mykiss(Walbaum), stressed by handling, transport and water pollution. Journal of Fish Biology37:873-885.
Moyner, K., K. H. R�ed, S. Sevatdal, and M. Heum. 1993. Changes in non-specific immuneparameters in Atlantic salmon, Salmo salar L., induced by Aeromonas salmonicida. Fishand Shellfish Immunology 3:253-265.
Muir, W. D., S. G. Smith, R. N. Iwamoto, D. J. Kamikawa, K. W. McIntyre, E. E. Hockersmith,B. P. Sandford, P. A. Ocker, T. E. Reuhle, J. G. Williams, and J. R. Skalski. 1995.Survival estimates for the passage of yearling salmonids through Snake River dams andreservoirs, 1994. Annual report (Project No. 93-29) to Bonneville Power Administration,Portland, Oregon, and U.S. Army Corps of Engineers, Walla Walla District, Walla Walla,Washington.
Muona, M., and A. Soivio. 1992. Changes in plasma lysozyme and blood leucocyte levels ofhatchery-reared Atlantic salmon (Salmo salar L.) and sea trout (Salmo trutta L.) duringparr-smolt transformation. Aquaculture 106:75-87.
Murray, C. K., and T. C. Fletcher. 1976. The immunohistological localization of lysozyme inplaice (Pleuronectes platessa L.) tissues. Journal of Fish Biology 9:329-334.
Pagliarani, A., V. Ventrella, R. Ballestrazzi, F. Trombetti, M. Pirini, and G. Trigari. 1991. Salinity-dependence of the properties of gill (Na+ +K+)-ATPase in rainbow trout(Oncorhynchus mykiss). Comparative Biochemistry and Physiology 100B(2):229-236.
82
Pascho, R. J., D. G. Elliott, and J. M. Streufert. 1991. Brood stock segregation of springchinook salmon Oncorhynchus tshawytscha by use of the enzyme-linked immunosorbentassay (ELISA) and the fluorescent antibody technique (FAT) affects the prevalence andlevels of Renibacterium salmoninarum infection in progeny. Diseases of AquaticOrganisms 12:25-40.
Pickering, A. D., and R. H. Richards. 1980. Factors influencing the structure, function and biotaof the salmonid epidermis. Proceedings of the Royal Society of Edinburgh 79B:93-104.
Redding, J. M., C. B. Schreck, E. K. Birks, and R. D. Ewing. 1984. Cortisol and its effects onplasma thyroid hormone and electrolyte concentrations in fresh water and during seawateracclimation in yearling coho salmon, Oncorhynchus kisutch. General and ComparativeEndocrinology 56:146-155.
R�ed, K. H., E. Brun, H. J. Larsen, and T. Refstie. 1990. The genetic influence on serumhaemolytic activity in rainbow trout. Aquaculture 85:109-117.
R�ed, K. H., H. J. S. Larsen, R. D. Linder and T. Refstie. 1993. Genetic variation in lysozymeactivity in rainbow trout (Oncorhynchus mykiss). Aquaculture 109:237-244.
Rondorf, D. W., J. W. Beeman, M. E. Free, and D. E. Liljegren. 1988. Correlation of biologicalcharacteristics of smolts with survival and travel time. Annual report 1987 (Contract DE-A179-87BP35245) to Bonneville Power Administration, Portland, Oregon.
Rondorf, D. W., J. W. Beeman, J. C. Faler, M. E. Free, and E. J. Wagner. 1989. Assessment ofsmolt condition for travel time analysis. Annual report 1988 (Contract DE-A179-87BP35245) to Bonneville Power Administration, Portland, Oregon.
Sankaran, K., and S. Gurnani. 1972. On the variation in the catalytic activity of lysozyme in fish. Indian Journal of Biochemistry and Biophysics 9:162-165.
Saunders, R. L. and E. B. Henderson. 1978. Changes in gill ATPase activity and smolt status ofAtlantic salmon (Salmo salar). Journal of the Fisheries Research Board of Canada35:1542-1546.
Schrock, R. M., J. W. Beeman, D. W. Rondorf, and P. V. Haner. 1994. A microassay for gillsodium, potassium-activated ATPase in juvenile Pacific salmon. Transactions of theAmerican Fisheries Society 123:223-229.
Schultz. A. L. 1987. Lysozyme. Pages 742-746 in A. J. Pesce and L. A. Kaplan (eds.), Methodsin Clinical Chemistry. The C.V. Mosby Company, St. Louis, Missouri.
83
Shrimpton, J. M., N. J. Bernier, G. K. Iwama, and D. J. Randall. 1994. Differences inmeasurements of smolt development between wild and hatchery-reared juvenile cohosalmon (Oncorhynchus kisutch) before and after saltwater exposure. Canadian Journal ofFisheries and Aquatic Sciences 51:2170-2178.
Sower, S. A., and R. S. Fawcett. 1991. Changes in gill Na+, K+-ATPase, thyroxine andtriiodothyronine of coho salmon held in two different rearing densities duringsmoltification. Comparative Biochemistry and Physiology 99A:85-89.
Specker, J. L. and C. B. Schreck. 1982. Changes in corticosteroids during smoltification of cohosalmon, Oncorhynchus kisutch. General and Comparative Endocrinology 46:53-58.
Staley, K. B. and R. D. Ewing. 1992. Purine levels in the skin of juvenile coho salmon(Oncorhynchus kisutch) during parr-smolt transformation and adaptation to seawater. Comparative Biochemistry and Physiology 101B(3):447-452.
Sveinbj�rnsson, B., R. Olsen, and S. Paulsen. 1996. Immunocytochemical localization oflysozyme in intestinal eosinophilic granule cells (EGCs) of Atlantic salmon, Salmo salar L. Journal of Fish Diseases 19:349-355.
University of Washington. 1998. Columbia River Data Access in Real Time (DART), RiverEnvironment (U. S. Army Corps of Engineers data). Internet address:http://www.cqs.washington.edu/dart/river.html.
Wedemeyer, G. A., R. L. Saunders, and W. C. Clarke. 1980. Environmental factors affectingsmoltification and early marine survival of anadromous salmonids. National MarineFisheries Service Marine Fisheries Review 42:1-14.
Yousif, A. N., L. J. Albright, and T. P. T. Evelyn. 1994. In vitro evidence for the antibacterialrole of lysozyme in salmonid eggs. Diseases of Aquatic Organisms 19:15-19.
Zaugg, W. S. 1981. Advanced photoperiod and water temperature effects on gill Na+, K+
adenosine triphosphatase activity and migration of juvenile steelhead (Salmo gairdneri). Canadian Journal of Fisheries and Aquatic Sciences 38:758-764.
Zaugg, W. S. 1982a. A simplified preparation for adenosine triphosphatase determination in gilltissue. Canadian Journal of Fisheries and Aquatic Sciences 39:215-217.
Zaugg, W. S. 1982b. Some changes in smoltification and seawater adaptability of salmonidsresulting from environmental and other factors. Aquaculture 28:143-151.

84
Zaugg, W. S., and L. R. McLain. 1970. Adenosine triphosphatase activity in gills of salmonids:seasonal variations and salt water influence in coho salmon, Oncorhynchus kisutch.Comparative Biochemistry and Physiology 35:587-596.
Zaugg, W. S., and L. R. McLain. 1972. Changes in gill adenosine triphosphatase activityassociated with parr-smolt transformation in steelhead trout, coho, and spring chinooksalmon. Journal of the Fisheries Research Board of Canada 29:167-171.
Zaugg, W. S., and B. R. Beckman. 1990. Saltwater-induced decreases in weight and lengthrelative to seasonal gill Na+ -K+ ATPase changes in coho salmon (Oncorhynchus kisutch):a test for seawater adaptability. Aquaculture 86:19-23.
Zaugg, W. S., E. F. Prentice, and F. W. Waknitz. 1985. Importance of river migration to thedevelopment of seawater tolerance in Columbia River anadromous salmonids.Aquaculture 51(1):33-47.

85
APPENDICES

86
Appendix A.1. Summary of selected data from yearling spring/summer chinook salmon sampled at Dworshak NFH(DW), Entiat NFH (EN), Leavenworth NFH (LE), Little White Salmon NFH (LW), McCall SFH (MC), Rapid RiverSFH (RA), Ringold SFH (RI), Sawtooth SFH (SA), and Winthrop NFH (WI) during spring 1993. Data includes samplesize (N), mean (MEAN), and standard error (STDERR) of fork length in millimeters, wet weight in grams, conditionfactor (KFACTOR), and gill Na+, K+-ATPase activity (ATPase) in µmol Pi ⋅ mg protein-1 ⋅ h-1.
���������������������������������������������������������������������������������������������������
� � � � ���� � ����� �� � �� � ������ � ������ ���������������������������������� ������������������������������������ � ����� � � ����� �� � � � ��� ����� � � ���� ����� � � ���� � � � � ���� � � ��������������������������������������������������������������������������������������������������������� ��� � � � � � � � � � � � � ���� � !""# �! $� ! "%$� %! � $� %� %� $� %� %�!!&� '%'� $% (�� $(� !""# �!)$� !#(%$� !%&$� $� %� %� $� %� %�!((� !$%'� $% (�� !"� !""# � &$� !#(%!� %#(� $� %� %� $� %� %� '(� !$%!� $%##���� #$� !""# � #$� !#'%'� %'!� #$� #$%(� !%''� #$� !%!#� $%$!� (� !*%$� !%# ���� !!� !""# � #$� !#!%#� #%$$� #$� )%#� !%"*� #$� !%!!� $%$!� "� !!%(� $%)'���� $'+,�!""# � "� &'%$� !%)#� "� &% � $%*)� "� !% � $%$ � "� !$%*� $%*&��� #� !""# � #$� ! '%(� !%('� #$� *%(� $%" � #$� !%!)� $%$!� #$� !!%&� $%&$�� *� !""# � #$� !!*%(� !%#"� #$� !)%*� $%)#� #$� !%$&� $%$!� #$� !!%$� $%&)�� � #!� !""# � "� &%&� (%$&� "�!('%!� !$%&&� "� !% (� $%$ � "� !(% � !%#(��� � !""# � #$� !!(%'� !%(!� #$� !'%*� $%)'� #$� !%!$� $%$!� #$� !!%$� $%)'���� !$� !""# � #$� !#'% � %&#� #$� "%&� !%&&� #$� !%!!� $%$ � "� !!%)� $%('�-������������������������������.���.������.������.���.�����.������.���.�����.�����.���.�����.�����/
Appendix A.2. Summary of selected data from subyearling chinook salmon sampled at Priest Rapids SFH (PR) andTurtle Rock SFH (TR). Data includes sample size (N), mean (MEAN), and standard error (STDERR) of fork length inmillimeters, wet weight in grams, condition factor (KFACTOR), and gill Na+, K+-ATPase activity (ATPase) in µmol Pi ⋅mg protein-1 ⋅ h-1. ���������������������������������������������������������������������������������������������������� � � � ���� � ����� �� � �� � ������ � ������ ���������������������������������� ������������������������������������ � ����� � � ����� �� � � � ��� ����� � � ���� ����� � � ���� � � � � ���� � � ��������������������������������������������������������������������������������������������������������� ��� � � � � � � � � � � � � ��� !*+,�!""# � "$� "$%&� $%&(� "$� &%!� $% #� "$� !%$(� $%$!� "$� !#%*� $%*(�� !+,�!""# � )$� "#% � $%&)� )$� &%)� $% *� )$� !%$(� $%$!� )$� ! %*� $%('��� *+,�!""# � #$� " %&� !%#)� #$� "% � $%* � #$� !%!#� $%$ � #$� !'%$� $%' �-������������������������������.���.������.������.���.�����.������.���.�����.�����.���.�����.�����/
Appendix A.3. Summary of selected data from steelhead sampled at Dworshak NFH (DW) and Irrigon SFH(IR) during spring 1993. Data includes sample size (N), mean (MEAN), and standard error (STDERR) of forklength in millimeters, wet weight in grams, condition factor (KFACTOR), and gill Na+, K+-ATPase activity(ATPase) in µmol Pi ⋅ mg protein-1 ⋅ h-1.
���������������������������������������������������������������������������������������������������� � � � ���� � ����� �� � �� � ������ � ������ ���������������������������������� ������������������������������������ � ����� � � ����� �� � � � ��� ����� � � ���� ����� � � ���� � � � � ���� � � ��������������������������������������������������������������������������������������������������������� ��� � � � � � � � � � � � � ���� "� !""# � #$� !&'%(� (% $� #$� )(%"� *%''� #$� $%"(� $%$!� #$� !$%"� $%'#��� $ � !""# � #$� $#%&� %& � #$� " %#� #%*(� #$� !%$&� $%$ � #$� !#%#� $%&!�-������������������������������.���.������.������.���.�����.������.���.�����.�����.���.�����.�����/
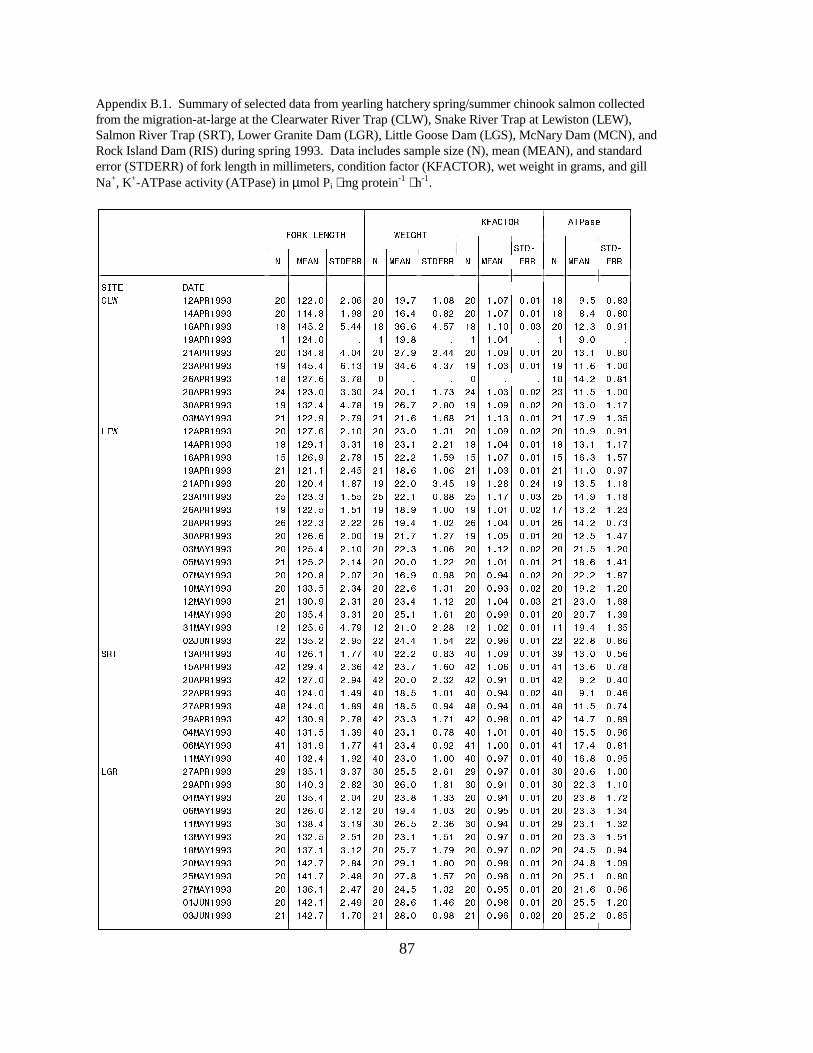
87
Appendix B.1. Summary of selected data from yearling hatchery spring/summer chinook salmon collectedfrom the migration-at-large at the Clearwater River Trap (CLW), Snake River Trap at Lewiston (LEW),Salmon River Trap (SRT), Lower Granite Dam (LGR), Little Goose Dam (LGS), McNary Dam (MCN), andRock Island Dam (RIS) during spring 1993. Data includes sample size (N), mean (MEAN), and standarderror (STDERR) of fork length in millimeters, condition factor (KFACTOR), wet weight in grams, and gillNa+, K+-ATPase activity (ATPase) in µmol Pi ⋅ mg protein-1 ⋅ h-1.
���������������������������������������������������������������������������������������������������� � � � ���� � ����� �� � �� � ������ � ������ ���������������������������������� ������������������������������������ � ����� � � ����� �� � � � ��� ����� � � ���� ����� � � ���� � � � � ���� � � ��������������������������������������������������������������������������������������������������������� ��� � � � � � � � � � � � � ���� ! � !""# � $� ! %$� %$)� $� !"%'� !%$&� $� !%$'� $%$!� !&� "%(� $%&#�� !*� !""# � $� !!*%&� !%"&� $� !)%*� $%& � $� !%$'� $%$!� !&� &%*� $%&$�� !)� !""# � !&� !*(% � (%**� !&� #)%)� *%('� !&� !%!$� $%$#� $� ! %#� $%"!�� !"� !""# � !� ! *%$� %� !� !"%&� %� !� !%$*� %� !� "%$� %�� !� !""# � $� !#*%&� *%$*� $� '%"� %**� $� !%$"� $%$!� $� !#%!� $%&$�� #� !""# � !"� !*(%*� )%!#� !"� #*%)� *%#'� !"� !%$#� $%$!� !"� !!%)� !%$$�� )� !""# � !&� ! '%)� #%'&� $� %� %� $� %� %� !&� !*% � $%&!�� &� !""# � *� ! #%$� #%#$� *� $%!� !%'#� *� !%$#� $%$ � #� !!%(� !%$$�� #$� !""# � !"� !# %*� *%'&� !"� )%'� %&$� !"� !%$"� $%$ � $� !#%$� !%!'�� $#�0!""# � !� ! %"� %'"� !� !%)� !%)&� !� !%!#� $%$!� !� !'%"� !%#(����� ! � !""# � $� ! '%)� %!$� $� #%$� !%#!� $� !%$"� $%$ � $� !$%"� $%"!�� !*� !""# � !&� ! "%!� #%#!� !&� #%!� % !� !&� !%$*� $%$!� !&� !#%!� !%!'�� !)� !""# � !(� ! )%"� %'&� !(� % � !%("� !(� !%$'� $%$!� !(� !)%#� !%('�� !"� !""# � !� ! !%!� %*(� !� !&%)� !%$)� !� !%$#� $%$!� !� !!%$� $%"'�� !� !""# � $� ! $%*� !%&'� !"� %$� #%*(� !"� !% &� $% *� !"� !#%(� !%!&�� #� !""# � (� ! #%#� !%((� (� %!� $%&&� (� !%!'� $%$#� (� !*%"� !%!&�� )� !""# � !"� ! %(� !%(!� !"� !&%"� !%$$� !"� !%$!� $%$ � !'� !#% � !% #�� &� !""# � )� ! %#� % � )� !"%*� !%$ � )� !%$*� $%$!� )� !*% � $%'#�� #$� !""# � $� ! )%)� %$$� !"� !%'� !% '� !"� !%$(� $%$!� $� ! %(� !%*'�� $#�0!""# � $� ! (%*� %!$� $� %#� !%$)� $� !%! � $%$ � $� !%(� !% $�� $(�0!""# � !� ! (% � %!*� $� $%$� !% � $� !%$!� $%$!� !� !&%)� !%*!�� $'�0!""# � $� ! $%&� %$'� $� !)%"� $%"&� $� $%"*� $%$ � $� % � !%&'�� !$�0!""# � $� !##%(� %#*� $� %)� !%#!� $� $%"#� $%$ � $� !"% � !% $�� ! �0!""# � !� !#$%"� %#!� $� #%*� !%! � $� !%$*� $%$#� !� #%$� !%)&�� !*�0!""# � $� !#(%*� #%#!� $� (%!� !%)!� $� $%""� $%$!� $� $%'� !%#"�� #!�0!""# � ! � ! (%)� *%'"� ! � !%$� % &� ! � !%$ � $%$!� !!� !"%*� !%#(�� $ +,�!""# � � !#(% � %"(� � *%*� !%(*� � $%")� $%$!� � %&� $%&)��� � !#� !""# � *$� ! )%!� !%''� *$� % � $%&#� *$� !%$"� $%$!� #"� !#%$� $%()�� !(� !""# � * � ! "%*� %#)� * � #%'� !%)$� * � !%$)� $%$!� *!� !#%)� $%'&�� $� !""# � * � ! '%$� %"*� * � $%$� %# � * � $%"!� $%$!� * � "% � $%*$�� � !""# � *$� ! *%$� !%*"� *$� !&%(� !%$!� *$� $%"*� $%$ � *$� "%!� $%*)�� '� !""# � *&� ! *%$� !%&"� *&� !&%(� $%"*� *&� $%"*� $%$!� *&� !!%(� $%'*�� "� !""# � * � !#$%"� %'&� * � #%#� !%'!� * � $%"&� $%$!� * � !*%'� $%&"�� $*�0!""# � *$� !#!%(� !%#"� *$� #%!� $%'&� *$� !%$!� $%$!� *$� !(%(� $%")�� $)�0!""# � *!� !#!%"� !%''� *!� #%*� $%" � *!� !%$$� $%$!� *!� !'%*� $%&!�� !!�0!""# � *$� !# %*� !%" � *$� #%$� !%$$� *$� $%"'� $%$!� *$� !)%&� $%"(���� '� !""# � "� !#(%!� #%#'� #$� (%(� %)!� "� $%"'� $%$!� #$� $%)� !%$$�� "� !""# � #$� !*$%#� %& � #$� )%$� !%&!� #$� $%"!� $%$!� #$� %#� !%!$�� $*�0!""# � $� !#(%*� %$*� $� #%&� !%##� $� $%"*� $%$!� $� #%&� !%' �� $)�0!""# � $� ! )%$� %! � $� !"%*� !%$#� $� $%"(� $%$!� $� #%#� !%#*�� !!�0!""# � #$� !#&%*� #%!"� #$� )%(� %#)� #$� $%"*� $%$!� "� #%!� !%# �� !#�0!""# � $� !# %(� %(!� $� #%!� !%(!� $� $%"'� $%$!� $� #%#� !%(!�� !&�0!""# � $� !#'%!� #%! � $� (%'� !%'"� $� $%"'� $%$ � $� *%(� $%"*�� $�0!""# � $� !* %'� %&*� $� "%!� !%&$� $� $%"&� $%$!� $� *%&� !%$"�� (�0!""# � $� !*!%'� %*&� $� '%&� !%('� $� $%")� $%$!� $� (%!� $%&$�� '�0!""# � $� !#)%!� %*'� $� *%(� !%# � $� $%"(� $%$!� $� !%)� $%")�� $!+,�!""# � $� !* %!� %*"� $� &%)� !%*)� $� $%"&� $%$!� $� (%(� !% $�� $#+,�!""# � !� !* %'� !%'$� !� &%$� $%"&� !� $%")� $%$ � $� (% � $%&(�-������������������������������.���.������.������.���.�����.������.���.�����.�����.���.�����.�����/

88
Appendix B.1 (continued)���������������������������������������������������������������������������������������������������� � � � ���� � ����� �� � �� � ������ � ������ ���������������������������������� ������������������������������������ � ����� � � ����� �� � � � ��� ����� � � ���� ����� � � ���� � � � � ���� � � ��������������������������������������������������������������������������������������������������������� ��� � � � � � � � � � � � � ����� )� !""# � !&� !*&%"� (%((� !)� #*%"� )%) � !)� $%")� $%$ � !'� *% � !%('�� &� !""# � � !#&%'� %(&� � (%'� !%&'� � $%"#� $%$!� � '%$� !%"$�� #$� !""# � $� !#"%'� %(&� $� )%!� !%)'� $� $%"#� $%$!� $� '%"� !%(&�� $#�0!""# � $� !#"%*� *% � $� (%*� #% *� $� $%&&� $%$!� $� '%'� !%!&�� $(�0!""# � #$� !# %#� !%(&� #$� $%"� $%"!� #$� $%&"� $%$!� #$� (%"� !%$ �� $)�0!""# � #$� ! &%)� !%" � "� %)� !%!(� "� !%$*� $%$ � #$� "%#� !%(!�� $'�0!""# � #$� ! (%&� !% *� #$� !% � $%'$� #$� !%$)� $%$!� #$� )% � !%!(�� !$�0!""# � $� !#$%'� %$"� $� !"% � $%"$� $� $%&(� $%$!� $� *%$� !%) �� ! �0!""# � !� ! "%&� %(&� #$� *%#� !%$$� !� !%!!� $%$ � #$� '% � !%$)�� !#�0!""# � #$� !# %)� !%*&� #$� %&� $%&*� #$� $%"'� $%$!� #$� #$%#� !%! �� !'�0!""# � $� !*#% � %"$� $� '%*� !%"*� $� $%"!� $%$ � $� &%!� !%($�� !"�0!""# � $� !#'%&� %!$� $� #%*� !%!)� $� $%&&� $%$!� $� (%'� $%&&�� !�0!""# � $� !*(% � %'*� $� "%*� %$#� $� $%"#� $%$ � $� '%!� !%((�� *�0!""# � $� !*(%"� %&!� $� &%*� !%"$� $� $%&&� $%$ � $� (%"� !%$&�� )�0!""# � $� !*(% � %$&� $� &%$� !%*#� $� $%"$� $%$!� $� *%'� !%#)�� &�0!""# � $� !*'%#� %$$� $� "%!� !% "� $� $%"$� $%$!� $� &%'� $%"&���� ! �0!""# � "� !* %*� #%"#� "� '%$� %!&� "� $%" � $%$#� "� (%"� %!!�� )�0!""# � "� !('%!� )%'!� "� #&%(� (%) � "� $%"*� $%$ � "� !"%"� !%" �� �� )� !""# � (� !# %&� &%!#� (� )%#� *%&'� (� !%$&� $%$#� (� "%(� !%!#�� '� !""# � #� ! "%$� #%(!� #� #%&� !%#!� #� !%!!� $%$#� #� !!%(� !%*&�� &� !""# � '� !*(%#� "%$"� '� #)%$� )%#"� '� !%$&� $%$#� '� !!%&� !%&$�� "� !""# � (� !# %&� "%"#� (� (%&� (% *� (� !%$)� $%$&� (� !#%"� !%)&�� $#�0!""# � (� !*)%$� (% !� (� #$% � %'&� (� $%")� $%$#� (� ! %$� !%$)�� $*�0!""# � !!� !*#%)� (%##� !!� "%!� %"&� !!� $%"(� $%$ � !!� !(%"� !%(*�� $(�0!""# � (� !#(% � ! %)"� (� (%&� )%!'� (� $%")� $%$#� (� ! %(� #%#'�� $)�0!""# � )� !*&%$� *%"!� )� # %$� %&)� )� $%"'� $%$ � )� !!%$� !%')�� !$�0!""# � '� !)'%*� '%&(� '� **%!� (%"*� '� $%"$� $%$ � '� (%*� #% (�� !!�0!""# � &� !* %$� )%"!� &� "%*� #%"#� &� $%""� $%$ � &� %*� *%!&�� ! �0!""# � !#� !((%&� (%&(� !#� *!%$� *%(#� !#� !%$*� $%$#� !#� !*%"� !%"*�� !#�0!""# � !#� !(#%'� &%($� !#� * %'� '%#(� !#� !%$)� $%$ � !#� #%)� #%$"�� !'�0!""# � ! � !*(% � *%&!� ! � # %!� %"!� ! � !%$ � $%$ � ! � *%*� %)"�� !&�0!""# � !$� !*!%#� (% *� !$� #$%"� #%)*� !$� !%$)� $%$ � !$� "%!� !%#"�� !"�0!""# � !!� !(*%!� &%$*� !!� *$%(� (%' � !!� !%$*� $%$ � !!� )%&� %"$�� $�0!""# � !$� !*)%'� '%!(� !$� ##%'� *%"(� !$� !%$ � $%$ � !$� )%$� %)*�� *�0!""# � "� !*$%$� )%(#� "� *%&� #%&!� "� $%&)� $%$ � "� #% � #%* �� (�0!""# � "� !((% � &%()� "� #&%)� '% #� "� $%")� $%$#� "� !%)� !%( �� )�0!""# � ! � !#'% � (%"'� ! � (%)� #%# � ! � $%"(� $%$#� ! � *%$� %#"�� '�0!""# � !$� !*)%*� *%&'� !$� # %(� %"$� !$� !%$ � $%$#� !$� $%'� !%*&�� &�0!""# � &� !(&%*� "%(&� &� *(%(� &%'#� &� !%$)� $%$#� &� %(� %* �� "�0!""# � !"� !(#% � #%"#� !"� #)%&� #% (� !"� $%"&� $%$!� !&� $%*� !%*'�-������������������������������.���.������.������.���.�����.������.���.�����.�����.���.�����.�����/
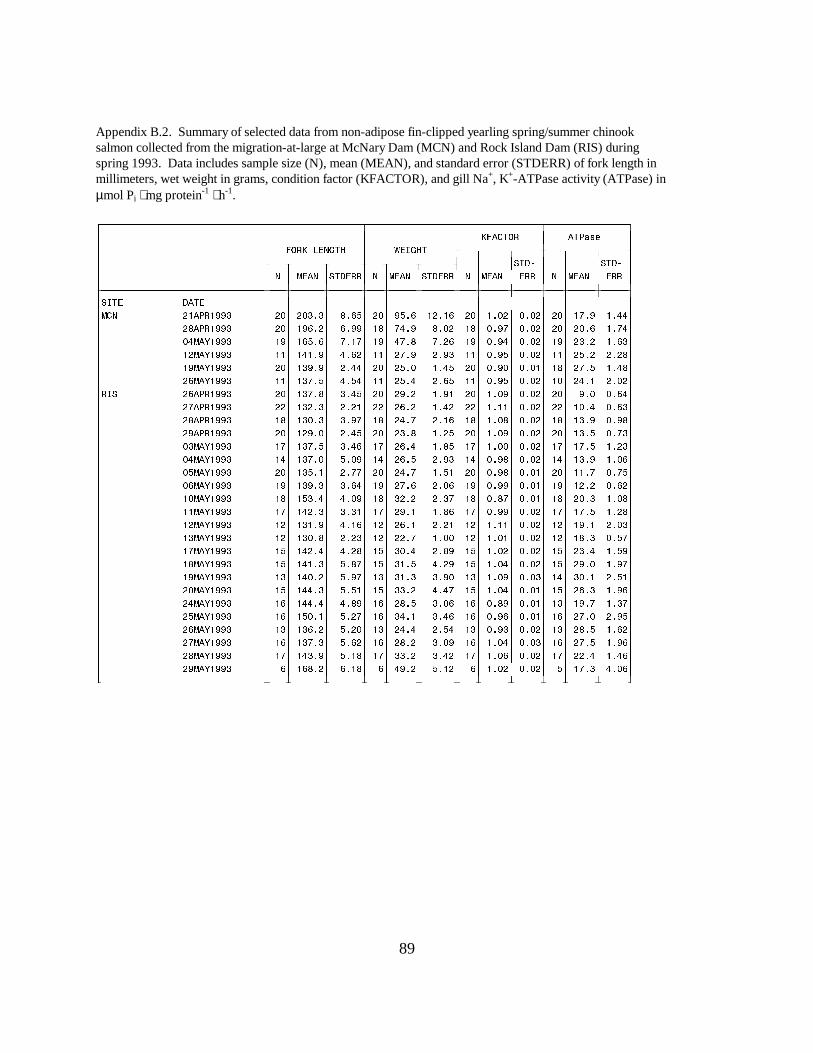
89
Appendix B.2. Summary of selected data from non-adipose fin-clipped yearling spring/summer chinooksalmon collected from the migration-at-large at McNary Dam (MCN) and Rock Island Dam (RIS) duringspring 1993. Data includes sample size (N), mean (MEAN), and standard error (STDERR) of fork length inmillimeters, wet weight in grams, condition factor (KFACTOR), and gill Na+, K+-ATPase activity (ATPase) inµmol Pi ⋅ mg protein-1 ⋅ h-1.
���������������������������������������������������������������������������������������������������� � � � ���� � ����� �� � �� � ������ � ������ ���������������������������������� ������������������������������������ � ����� � � ����� �� � � � ��� ����� � � ���� ����� � � ���� � � � � ���� � � ��������������������������������������������������������������������������������������������������������� ��� � � � � � � � � � � � � ���� !� !""# � $� $#%#� &%)(� $� "(%)� ! %!)� $� !%$ � $%$ � $� !'%"� !%**�� &� !""# � $� !")% � )%""� !&� '*%"� &%$ � !&� $%"'� $%$ � $� $%)� !%'*�� $*�0!""# � !"� !)(%)� '%!'� !"� *'%&� '% )� !"� $%"*� $%$ � !"� #% � !%)#�� ! �0!""# � !!� !*!%"� *%) � !!� '%"� %"#� !!� $%"(� $%$ � !!� (% � % &�� !"�0!""# � $� !#"%"� %**� $� (%$� !%*(� $� $%"$� $%$!� !&� '%(� !%*&�� )�0!""# � !!� !#'%(� *%(*� !!� (%*� %)(� !!� $%"(� $%$ � !$� *%!� %$ �� �� )� !""# � $� !#'%&� #%*(� $� "% � !%"!� $� !%$"� $%$ � $� "%$� $%)*�� '� !""# � � !# %#� % !� � )% � !%* � � !%!!� $%$ � � !$%*� $%)#�� &� !""# � !&� !#$%#� #%"'� !&� *%'� %!)� !&� !%$&� $%$ � !&� !#%"� $%"&�� "� !""# � $� ! "%$� %*(� $� #%&� !% (� $� !%$"� $%$ � $� !#%(� $%'#�� $#�0!""# � !'� !#'%(� #%*)� !'� )%*� !%&(� !'� !%$$� $%$ � !'� !'%(� !% #�� $*�0!""# � !*� !#'%$� (%$"� !*� )%(� %"#� !*� $%"&� $%$ � !*� !#%"� !%$)�� $(�0!""# � $� !#(%!� %''� $� *%'� !%(!� $� $%"&� $%$!� $� !!%'� $%'(�� $)�0!""# � !"� !#"%#� #%)*� !"� '%)� %$)� !"� $%""� $%$!� !"� ! % � $%) �� !$�0!""# � !&� !(#%*� *%$"� !&� # % � %#'� !&� $%&'� $%$!� !&� $%#� !%$&�� !!�0!""# � !'� !* %#� #%#!� !'� "%!� !%&)� !'� $%""� $%$ � !'� !'%(� !% &�� ! �0!""# � ! � !#!%"� *%!)� ! � )%!� % !� ! � !%!!� $%$ � ! � !"%!� %$#�� !#�0!""# � ! � !#$%&� % #� ! � %'� !%$$� ! � !%$!� $%$ � ! � !&%#� $%('�� !'�0!""# � !(� !* %*� *% &� !(� #$%*� %&"� !(� !%$ � $%$ � !(� #%*� !%("�� !&�0!""# � !(� !*!%#� (%&'� !(� #!%(� *% "� !(� !%$*� $%$ � !(� "%$� !%"'�� !"�0!""# � !#� !*$% � (%"'� !#� #!%#� #%"$� !#� !%$"� $%$#� !*� #$%!� %(!�� $�0!""# � !(� !**%#� (%(!� !(� ##% � *%*'� !(� !%$*� $%$!� !(� )%#� !%")�� *�0!""# � !)� !**%*� *%&"� !)� &%(� #%$)� !)� $%&"� $%$!� !#� !"%'� !%#'�� (�0!""# � !)� !($%!� (% '� !)� #*%!� #%*)� !)� $%")� $%$!� !)� '%$� %"(�� )�0!""# � !#� !#)% � (% $� !#� *%*� %(*� !#� $%"#� $%$ � !#� &%(� !%) �� '�0!""# � !)� !#'%#� (%) � !)� &% � #%$"� !)� !%$*� $%$#� !)� '%(� !%")�� &�0!""# � !'� !*#%"� (%!&� !'� ##% � #%* � !'� !%$)� $%$ � !'� %*� !%*)�� "�0!""# � )� !)&% � )%!&� )� *"% � (%! � )� !%$ � $%$ � (� !'%#� *%$)�-������������������������������.���.������.������.���.�����.������.���.�����.�����.���.�����.�����/

90
Appendix C. Summary of selected data from yearling wild spring/summer chinook salmon collected from themigration-at-large at the Clearwater River Trap (CLW), Snake River Trap at Lewiston (LEW), Salmon RiverTrap (SRT), and Lower Granite Dam (LGR) during spring 1993. Data includes sample size (N), mean(MEAN), and standard error (STDERR) of fork length in millimeters, wet weight in grams, condition factor(KFACTOR), and gill Na+, K+-ATPase activity (ATPASE) in µmol Pi ⋅ mg protein-1 ⋅ h-1.
���������������������������������������������������������������������������������������������������� � � � ���� � ����� �� � �� � ������ � ������ ���������������������������������� ������������������������������������ � ����� � � ����� �� � � � ��� ����� � � ���� ����� � � ���� � � � � ���� � � ��������������������������������������������������������������������������������������������������������� ��� � � � � � � � � � � � � ���� ! � !""# � !!� !!!% � %!)� !$� !(%*� !%$)� !$� !%!#� $%$*� !!� !#%&� !%*)�� !*� !""# � � !$#%$� !%$$� � !#%!� $%$(� � !% $� $%$#� � !(%*� (%#*�� !)� !""# � *� !!*%(� !%&"� *� !)%*� $%'*� *� !%$"� $%$'� *� !)%$� !%$(�� !"� !""# � &� !$#%!� #%"(� &� ! %#� !%*&� &� !%$&� $%$ � )� !#%)� !%*'�� !� !""# � � !$"%$� (%$$� � !(%&� #% (� � !% $� $%$"� � !&% � $%#'�� #� !""# � '� !! %)� #%$!� '� !'%)� !%($� '� !% � $%$#� '� !(%*� !%' �� )� !""# � $� !!#%$� %( � $� %� %� $� %� %� $� !)%"� !%!'�� &� !""# � &� !!#%)� #%()� &� !(%&� !%!"� &� !%$'� $%$ � &� !)%)� !%&'�� #$� !""# � ! � !$&%*� %$'� ! � !(%*� $%'&� ! � !% $� $%$#� ! � !)%!� !%**�� $#�0!""# � )� !$*%'� %(&� )� !*%&� $%"(� )� !% &� $%$ � )� %"� !%&!����� ! � !""# � $� !!'%'� % '� $� !&%$� !%!(� $� !%$&� $%$!� $� !&%"� !%$#�� !*� !""# � &� !$&%*� #%!)� &� !#%&� !% )� &� !%$)� $%$ � &� !#%'� %*(�� !)� !""# � *� !$)%$� *%)$� *� !#% � !%('� *� !%$"� $%$#� *� %)� %&'�� !"� !""# � (� !$&% � *%$"� (� !*%(� !%)"� (� !%!#� $%$#� *� #%'� %$ �� !� !""# � !!� !!"%*� (%#$� !!� !&%*� %("� !!� !%$(� $%$*� !$� !'%&� % !�� #� !""# � '� !$(%'� #%)!� '� !*%!� !%(!� '� !%!"� $%$"� '� (%$� !%($�� )� !""# � &� !$!%!� !%(#� &� !!% � $%#'� &� !%$&� $%$ � &� $%&� !%()�� &� !""# � !!� !$*%)� %)(� !!� ! %"� !%$'� !!� !%!$� $%$ � ! � (%*� %#&�� #$� !""# � !"� !$&%*� #% � !"� !*%)� !%()� !"� !%$&� $%$*� !"� !%)� !%!'�� $#�0!""# � !*� !$ %)� !%"'� !*� ! %#� $%)$� !*� !%!*� $%$)� !*� '%#� %#*�� $(�0!""# � (� !$&%'� !%#'� (� !*%*� $%( � (� !%!!� $%$!� *� '%)� !%'(�� $'�0!""# � $� !$&%"� !%&"� !"� !#%)� $%&"� !"� !%$#� $%$#� $� "%"� !%)$�� !$�0!""# � $� !$)%#� !%(&� $� ! %!� $%(!� $� !%$$� $%$ � $� !% � !%('�� ! �0!""# � !"� !$*%"� !%("� !&� ! % � $%((� !&� !%$(� $%$ � !&� *%#� !%)#�� !*�0!""# � $� !$ %)� !%"'� $� !!%)� $%'(� $� !%$*� $%$ � !'� $%'� !%)"�� #!�0!""# � !'� !$ %#� #%##� !'� ! %)� !% *� !'� !%!*� $%$ � !'� !% � !%!"�� $ +,�!""# � !&� !$#%)� %)(� !&� ! %*� !%$'� !&� !%$'� $%$ � !)� #%$� !%"*�� $*+,�!""# � *� !$*%$� #%!!� *� ! %*� !%!*� *� !%$"� $%$ � *� !(%#� %'*��� � $)� !""# � *$� !$'%$� !%**� *$� !*%#� $%(*� *$� !%!(� $%$!� #"� !&%'� !%$(�� $'� !""# � *$� !$)% � !%$&� *$� !#%&� $%*)� *$� !%!*� $%$!� #"� !'%$� $%&*�� !#� !""# � *$� !$#%*� !%#!� *$� ! %"� $%( � *$� !%!(� $%$ � *$� !)% � $%"'�� !(� !""# � #"� !$)%*� !%( � #"� !*% � $%' � #"� !%!(� $%$ � #"� !&% � $%&'�� $� !""# � *$� !$'%'� !%#$� #"� ! %(� $%( � #"� $%""� $%$!� #"� !"%*� $%&#�� � !""# � !(� !$&%!� %)$� !(� ! %"� $%"#� !(� !%$$� $%$ � !(� $%(� !%$&�� '� !""# � *"� !$*%*� !%( � *"� ! %$� $%(#� *"� !%$#� $%$!� *"� !'%$� $%"$�� "� !""# � #"� !$'%)� !%('� #"� !#%'� $%("� #"� !%$&� $%$!� #&� !'%!� !%$"�� $*�0!""# � *$� !! %*� !%)'� *$� !(%*� $%'!� *$� !%$)� $%$ � #"� $% � $%&(�� $)�0!""# � #&� !!$%)� !%#$� #&� !*%&� $%(&� #&� !%$&� $%$!� #'� !"%#� $%''�� !!�0!""# � *$� !$&%&� !%$)� *$� !#% � $%*#� *$� !%$!� $%$!� #&� !'%(� $%&&�-������������������������������.���.������.������.���.�����.������.���.�����.�����.���.�����.�����/

91
Appendix C (continued)���������������������������������������������������������������������������������������������������� � � � ���� � ����� �� � �� � ������ � ������ ���������������������������������� ������������������������������������ � ����� � � ����� �� � � � ��� ����� � � ���� ����� � � ���� � � � � ���� � � ��������������������������������������������������������������������������������������������������������� ��� � � � � � � � � � � � � ���� '� !""# � � ! %&� #%((� � !'%&� $%"&� � $%"'� $%$#� � ##% � !%'(�� "� !""# � $� !!(%)� %# � $� !(%(� $%"&� $� $%"&� $%$!� $� #!%$� %((�� $*�0!""# � $� !!&%#� %!*� $� !)%(� $%&*� $� $%""� $%$!� $� "% � !%"&�� $)�0!""# � $� !!*%'� !%#"� $� !(% � $%('� $� !%$$� $%$!� $� &%#� !%)"�� !!�0!""# � !� !!#%)� !%&(� $� !(% � $%'$� $� !%$#� $%$ � $� "%$� !%#&�� !#�0!""# � $� !!!%'� !%&)� $� !*%(� $%)&� $� !%$#� $%$!� $� (%(� !% )�� !&�0!""# � !&� !! %"� !%&)� !&� !*%"� $%)&� !&� !%$#� $%$ � !&� (%!� !%!!�� $�0!""# � $� !$&%&� !% '� $� !#%#� $%((� $� !%$ � $%$ � $� &% � !%#)�� (�0!""# � $� !$)% � %&'� $� ! %"� !%!"� $� !%$*� $%$ � $� #% � !%)$�� '�0!""# � !"� !!!%!� !%(&� !"� !*% � $%'!� !"� !%$ � $%$ � !"� (%(� !% "�� $!+,�!""# � !"� !!#%&� !%)"� !"� !(%'� $%' � !"� !%$(� $%$!� !"� '%)� !%*&�� $#+,�!""# � !&� !!#%)� %$'� !&� !(%)� $%'&� !&� !%$(� $%$!� !&� &%(� !%!"�-������������������������������.���.������.������.���.�����.������.���.�����.�����.���.�����.�����/

92
Appendix D. Summary of selected data from subyearling fall chinook salmon collected from the migration-at-large at Bonneville Dam first powerhouse (BON), John Day Dam (JDA), McNary Dam (MCN), and RockIsland Dam (RIS) during spring 1993. Data includes sample size (N), mean (MEAN), and standard error(STDERR) of fork length in millimeters, wet weight in grams, condition factor (KFACTOR), and gill Na+, K+-ATPase activity (ATPase) in µmol Pi ⋅ mg protein-1 ⋅ h-1.
���������������������������������������������������������������������������������������������������� � � � ���� � ����� �� � �� � ������ � ������ ���������������������������������� ������������������������������������ � ����� � � ����� �� � � � ��� ����� � � ���� ����� � � ���� � � � � ���� � � ��������������������������������������������������������������������������������������������������������� ��� � � � � � � � � � � � � ��1�� !(+,�!""# � $� !!!% � !%' � $� !*%#� $%&'� $� !%$ � $%$ � !"� %$� !%'(�� +,�!""# � $� !!*%$� %"$� $� !(%&� !%!'� $� !%$#� $%$ � $� "%#� %$$�� &+,�!""# � $� !$"%#� %*!� $� !*%)� !%$*� $� !%$"� $%$#� $� #$%#� %$ �� $*,�!""# � $� ! %'� #%##� $� !%"� % #� $� !%! � $%$ � $� #!%(� %!*�� !!,�!""# � $� !! %(� %! � $� !(%"� !%$!� $� !%$"� $%$ � !"� &%)� !%)&�� !&,�!""# � $� !!"%$� %'$� $� !"%$� !%#'� $� !%!$� $%$ � $� *%!� !%#)�� (,�!""# � $� !!'%$� %!!� $� !&%)� !%!$� $� !%!*� $%$!� $� *% � !% #�� $ ���!""# � $� !#!%)� %$(� $� )%!� !%#$� $� !%!#� $%$ � $� %(� !%(!�� $&���!""# � $� !#!%"� %))� $� )%)� !%('� $� !%!#� $%$ � $� (%!� !%'!��+� +,�!""# � $� !!!%(� !%#(� !"� !*%"� $%(*� !"� !%$&� $%$!� !"� $%'� !%!&�� "+,�!""# � $� !$&%&� !%))� $� !#%)� $%' � $� !%$#� $%$ � !"� (%!� !%)&�� $)+,�!""# � $� !$$%'� !%*)� $� !$%!� $%*!� $� $%"&� $%$!� $� &%)� !%**�� !#+,�!""# � $� !$ %#� !%*#� $� ! %)� $%()� $� !%!)� $%$ � $� )% � !%'(�� $+,�!""# � $� !$&% � !%( � $� !*%#� $%'*� $� !%!!� $%$ � !"� &%"� !%)'�� '+,�!""# � $� !!&%&� !%&$� $� !%*� !% $� $� !% (� $%$#� $� '%$� %$'�� $#,�!""# � $� ! (%"� !%##� $� (%"� $%&)� $� !% "� $%$!� $� "%(� !%'!�� !$,�!""# � $� ! (%'� !% )� $� *%'� $%&!� $� !% *� $%$!� $� &%(� !%#"�� !',�!""# � $� ! "%&� !%#)� $� (%!� $%"&� $� !%!*� $%$ � $� !'%'� !%'"�� *,�!""# � $� !#$%&� !%##� $� '%#� !%$!� $� !% !� $%$ � $� $% � !%$(�� #!,�!""# � !$� !# %$� #% � !$� )%"� %'(� !$� !%!#� $%$*� !$� !'%(� %(*���� !)+,�!""# � $� !$)%$� #%("� $� !#%'� !%#*� $� !%$'� $%$!� $� &%#� !%('�� #+,�!""# � $� !$)% � $%" � $� ! %(� $%*$� $� !%$*� $%$!� $� )%*� !%( �� #$+,�!""# � *$� ""% � $%"*� *$� "%(� $% )� *$� $%")� $%$!� #&� (%#� $%&#�� $*+,�!""# � � "'%$� $%&#� � &%'� $% *� � $%"(� $%$!� � #%!� $%&#�� $)+,�!""# � !� "'%$� !%#"� !� "%$� $%* � !� $%"'� $%$!� !� (%!� !%)*�� $'+,�!""# � #!� "'% � !%$(� #!� "% � $%#(� #!� $%""� $%$!� &� %#� $%'#�� $&+,�!""# � !'� ")%&� !%!"� !'� &%'� $%# � !'� $%"(� $%$!� !'� #!%'� !%'*�� $"+,�!""# � "� ")%!� !%'&� "� &%(� $%(!� "� $%"(� $%$ � "� #$%&� #%##�� !*+,�!""# � $� !$$%(� !%')� $� !$%#� $%*"� $� !%$$� $%$!� $� &%"� !% '�� !+,�!""# � $� !$(%)� !%)#� $� !#%#� $%)#� $� !%! � $%$!� $� '% � %$"�� &+,�!""# � $� !!*%"� !% *� $� !'%)� $%("� $� !%!(� $%$!� !"� )%!� !%)#�� $*,�!""# � $� ! !%$� $%'!� $� !%!� $%*"� $� !%!"� $%$!� !"� "%!� !%&&�� !!,�!""# � $� ! $%!� $%&*� $� !%!� $%*(� $� !% !� $%$!� $� #%'� !%*$�� !&,�!""# � $� !#$%$� !%'*� $� '%(� !%#$� $� !% *� $%$!� $� %(� !% &�� (,�!""# � $� ! "% � !%)&� $� )%"� !%!)� $� !% #� $%$ � $� !&%'� !%!*�� $!���!""# � $� !#)%"� % '� $� #$%)� !%)"� $� !%!'� $%$ � $� %"� !%'"�� ! ��!""# � $� !(!%)� %)&� $� #"%'� %''� $� !%!!� $%$ � $� !(% � !% $�� !"��2!""# � $� !))%)� %" � (� *(%!� (%#&� (� !%$&� $%$ � !!� !&%)� %!"�� �� (+,�!""# � !$� &'%&� "%$)� !$� "%(� #%#&� !$� !%$*� $%$#� '� *%$� $%")�� &+,�!""# � !$� "*%(� '%' � !$� !!% � %))� !$� !%!!� $%$ � !$� !% � !%&(�� "+,�!""# � !$� " %*� '% &� !$� !$%$� #%$$� !$� !%$*� $%$ � !$� *%)� !%$(�� #$+,�!""# � !$� !!!%#� "%)'� !$� !&% � *% (� !$� !%$&� $%$ � !$� !"%$� !%'!�� $)+,�!""# � "� "(%&� #%*!� "� !$% � $%" � "� !%!*� $%$#� "� !#% � !%!*�� $'+,�!""# � !$� !$)%#� '%#*� !$� !*%"� #% "� !$� !%!!� $%$ � !$� !"%"� %*"�� $&+,�!""# � !$� "$%)� #%(#� !$� &%(� $%"#� !$� !%! � $%$#� !$� !&%"� !%$ �� ! +,�!""# � !$� &)%*� *%#&� !$� &%$� !% *� !$� !%!)� $%$*� "� %"� !%( �� !#+,�!""# � !$� &(%!� %&'� !$� )%(� $%'$� !$� !%$#� $%$ � !$� (%(� %)!�� !*+,�!""# � !$� &(%$� !%()� !$� )%)� $%*)� !$� !%$)� $%$ � !$� $%'� !%)!�-������������������������������.���.������.������.���.�����.������.���.�����.�����.���.�����.�����/

93
Appendix D (continued)���������������������������������������������������������������������������������������������������� � � � ���� � ����� �� � �� � ������ � ������ ���������������������������������� ������������������������������������ � ����� � � ����� �� � � � ��� ����� � � ���� ����� � � ���� � � � � ���� � � ��������������������������������������������������������������������������������������������������������� ��� � � � � � � � � � � � � �� �� !"+,�!""# � !$� "*%$� *%()� !$� "%*� !%*$� !$� !%$'� $%$ � !$� !%)� %$$�� $+,�!""# � !$� !$!%#� %($� !$� !!%#� $%"$� !$� !%$'� $%$ � !$� $%)� %(&�� !+,�!""# � !$� "#%(� *%!'� !$� "% � !%*&� !$� !%$*� $%$*� !$� #%$� !%#(�� )+,�!""# � !$� "(%$� #%)*� !$� "%&� !% (� !$� !%!$� $%$ � !$� *%(� !%)'�-������������������������������.���.������.������.���.�����.������.���.�����.�����.���.�����.�����/
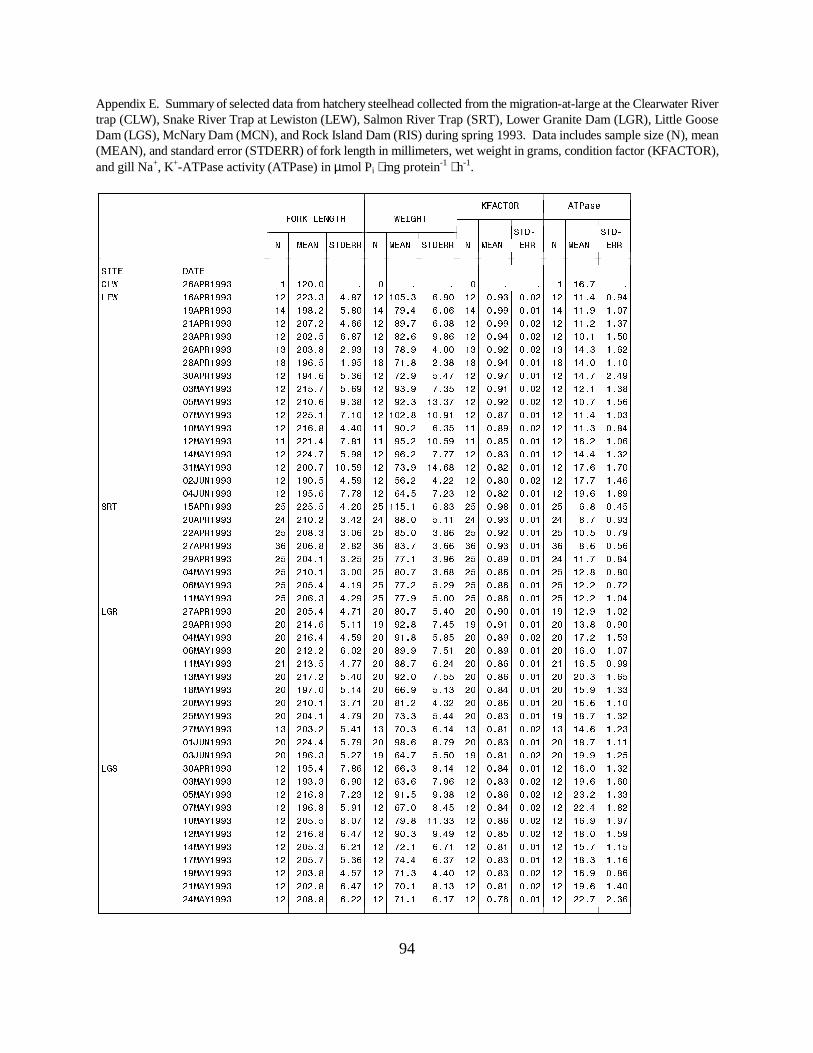
94
Appendix E. Summary of selected data from hatchery steelhead collected from the migration-at-large at the Clearwater Rivertrap (CLW), Snake River Trap at Lewiston (LEW), Salmon River Trap (SRT), Lower Granite Dam (LGR), Little GooseDam (LGS), McNary Dam (MCN), and Rock Island Dam (RIS) during spring 1993. Data includes sample size (N), mean(MEAN), and standard error (STDERR) of fork length in millimeters, wet weight in grams, condition factor (KFACTOR),and gill Na+, K+-ATPase activity (ATPase) in µmol Pi ⋅ mg protein-1 ⋅ h-1.
���������������������������������������������������������������������������������������������������� � � � ���� � ����� �� � �� � ������ � ������ ���������������������������������� ������������������������������������ � ����� � � ����� �� � � � ��� ����� � � ���� ����� � � ���� � � � � ���� � � ��������������������������������������������������������������������������������������������������������� ��� � � � � � � � � � � � � ���� )� !""# � !� ! $%$� %� $� %� %� $� %� %� !� !)%'� %����� !)� !""# � ! � #%#� *%&'� ! �!$(%#� )%"$� ! � $%"#� $%$ � ! � !!%*� $%"*�� !"� !""# � !*� !"&% � (%&$� !*� '"%*� )%$)� !*� $%""� $%$!� !*� !!%"� !%$'�� !� !""# � ! � $'% � *%))� ! � &"%'� )%#&� ! � $%""� $%$ � ! � !!% � !%#'�� #� !""# � ! � $ %(� )%&'� ! � & %)� "%&)� ! � $%"*� $%$ � ! � !$%!� !%($�� )� !""# � !#� $#%&� %"#� !#� '&%"� *%$$� !#� $%" � $%$ � !#� !*%#� !%) �� &� !""# � !&� !")%(� !%"(� !&� '!%&� %#&� !&� $%"*� $%$!� !&� !*%$� !%!$�� #$� !""# � ! � !"*%)� (%#)� ! � ' %"� (%*'� ! � $%"'� $%$!� ! � !*%'� %*"�� $#�0!""# � ! � !(%'� (%)"� ! � "#%"� '%#(� ! � $%"!� $%$ � ! � ! %!� !%#&�� $(�0!""# � ! � !$%)� "%#&� ! � " %#� !#%#'� ! � $%" � $%$ � ! � !$%'� !%()�� $'�0!""# � ! � (%!� '%!$� ! �!$ %&� !$%"!� ! � $%&'� $%$!� ! � !!%*� !%$#�� !$�0!""# � ! � !)%&� *%*$� !!� "$% � )%#(� !!� $%&"� $%$ � ! � !!%#� $%&*�� ! �0!""# � !!� !%*� '%&!� !!� "(% � !$%("� !!� $%&(� $%$!� ! � !)% � !%$)�� !*�0!""# � ! � *%'� (%"&� ! � ")% � '%''� ! � $%&#� $%$!� ! � !*%*� !%# �� #!�0!""# � ! � $$%'� !$%("� ! � '#%"� !*%)&� ! � $%& � $%$!� ! � !'%)� !%'$�� $ +,�!""# � ! � !"$%(� *%("� ! � ()% � *% � ! � $%&$� $%$ � ! � !'%'� !%*)�� $*+,�!""# � ! � !"(%)� '%'&� ! � )*%(� '% #� ! � $%& � $%$!� ! � !"%)� !%&"��� � !(� !""# � (� (%(� *% $� (�!!(%!� )%&#� (� $%"&� $%$!� (� )%&� $%*(�� $� !""# � *� !$% � #%* � *� &&%$� (%!!� *� $%"#� $%$!� *� &%'� $%"#�� � !""# � (� $&%#� #%$)� (� &(%$� #%&)� (� $%" � $%$!� (� !$%(� $%'"�� '� !""# � #)� $)%&� %& � #)� &#%'� #%))� #)� $%"#� $%$!� #)� &%)� $%()�� "� !""# � (� $*%!� #% (� (� ''%!� #%")� (� $%&"� $%$!� *� !!%'� $%&*�� $*�0!""# � (� !$%!� #%$$� (� &$%'� #%)&� (� $%&)� $%$!� (� ! %&� $%&$�� $)�0!""# � (� $(%*� *%!"� (� ''% � (% "� (� $%&)� $%$!� (� ! % � $%' �� !!�0!""# � (� $)%#� *% "� (� ''%"� (%$$� (� $%&)� $%$!� (� ! % � !%$*���� '� !""# � $� $(%*� *%'!� $� &$%'� (%*$� $� $%"$� $%$!� !"� ! %"� !%$ �� "� !""# � $� !*%)� (%!!� !"� " %&� '%*(� !"� $%"!� $%$!� $� !#%&� $%"$�� $*�0!""# � $� !)%*� *%("� $� "!%&� (%&(� $� $%&"� $%$ � $� !'% � !%(#�� $)�0!""# � $� ! % � )%$ � $� &"%"� '%(!� $� $%&"� $%$!� $� !)%$� !%$'�� !!�0!""# � !� !#%(� *%''� $� &&%'� )% *� $� $%&)� $%$!� !� !)%(� $%""�� !#�0!""# � $� !'% � (%*$� $� " %$� '%((� $� $%&)� $%$!� $� $%#� !%)(�� !&�0!""# � $� !"'%$� (%!*� $� ))%"� (%!#� $� $%&*� $%$!� $� !(%"� !%##�� $�0!""# � $� !$%!� #%'!� $� &!% � *%# � $� $%&)� $%$!� $� !)%)� !%!$�� (�0!""# � $� $*%!� *%'"� $� '#%#� (%**� $� $%&#� $%$!� !"� !&%'� !%# �� '�0!""# � !#� $#% � (%*!� !#� '$%#� )%!*� !#� $%&!� $%$ � !#� !*%)� !% #�� $!+,�!""# � $� *%*� (%'"� $� "&%)� &%'"� $� $%&#� $%$!� $� !&%'� !%!!�� $#+,�!""# � $� !")%#� (% '� !"� )*%'� (%($� !"� $%&!� $%$ � $� !"%"� !% (����� #$� !""# � ! � !"(%*� '%&)� ! � ))%#� &%!*� ! � $%&*� $%$!� ! � !)%$� !%# �� $#�0!""# � ! � !"#%#� )%"$� ! � )#%)� '%")� ! � $%&#� $%$ � ! � !"%)� !%)$�� $(�0!""# � ! � !)%&� '% #� ! � "!%(� "%#&� ! � $%&)� $%$ � ! � #% � !%##�� $'�0!""# � ! � !")%&� (%"!� ! � )'%$� &%*(� ! � $%&*� $%$ � ! � %*� !%& �� !$�0!""# � ! � $(%(� &%$'� ! � '"%&� !!%##� ! � $%&)� $%$ � ! � !)%"� !%"'�� ! �0!""# � ! � !)%&� )%*'� ! � "$%#� "%*"� ! � $%&(� $%$ � ! � !&%$� !%("�� !*�0!""# � ! � $(%#� )% !� ! � ' %!� )%'!� ! � $%&!� $%$!� ! � !(%'� !%!(�� !'�0!""# � ! � $(%'� (%#)� ! � '*%*� )%#'� ! � $%&#� $%$!� ! � !&%#� !%!)�� !"�0!""# � ! � $#%&� *%('� ! � '!%#� *%*$� ! � $%&#� $%$ � ! � !)%"� $%&)�� !�0!""# � ! � $ %&� )%*'� ! � '$%!� &%!#� ! � $%&!� $%$ � ! � !"%)� !%*$�� *�0!""# � ! � $&%&� )% � ! � '!%!� )%!'� ! � $%')� $%$!� ! � %'� %#)�-������������������������������.���.������.������.���.�����.������.���.�����.�����.���.�����.�����/
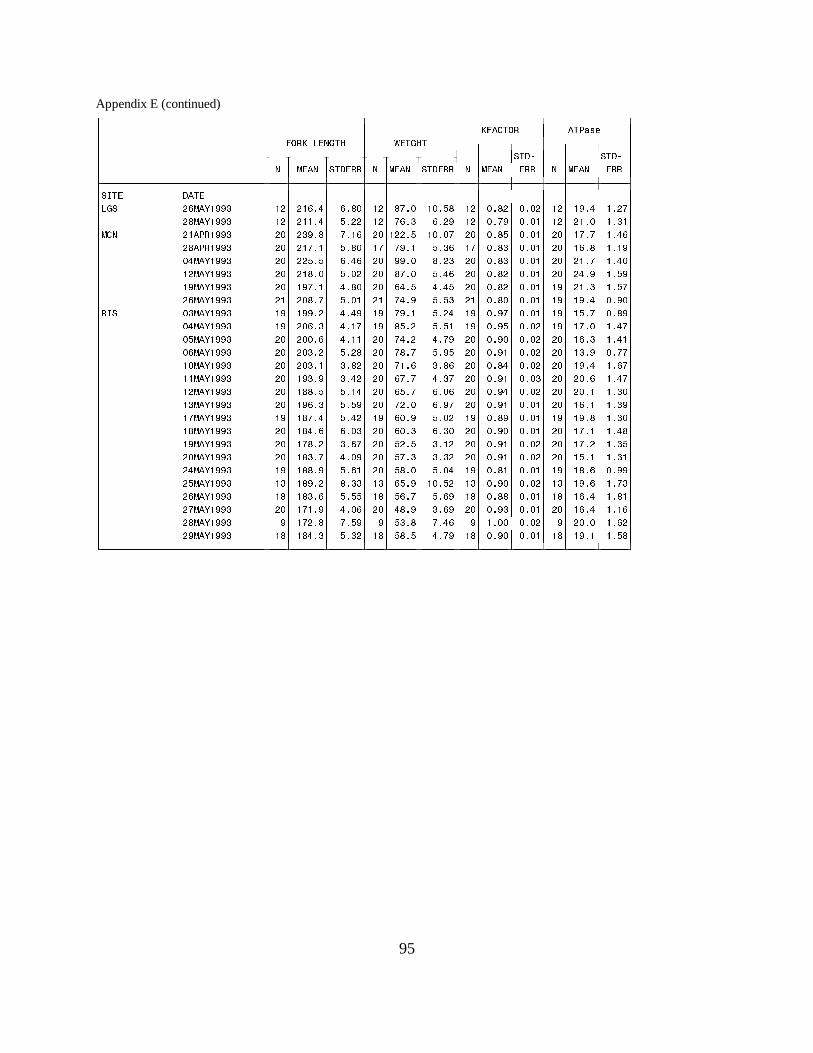
95
Appendix E (continued)���������������������������������������������������������������������������������������������������� � � � ���� � ����� �� � �� � ������ � ������ ���������������������������������� ������������������������������������ � ����� � � ����� �� � � � ��� ����� � � ���� ����� � � ���� � � � � ���� � � ��������������������������������������������������������������������������������������������������������� ��� � � � � � � � � � � � � ����� )�0!""# � ! � !)%*� )%&$� ! � &'%$� !$%(&� ! � $%& � $%$ � ! � !"%*� !% '�� &�0!""# � ! � !!%*� (% � ! � ')%#� )% "� ! � $%'"� $%$!� ! � !%$� !%#!���� !� !""# � $� #"%&� '%!)� $�! %(� !$%$'� $� $%&(� $%$!� $� !'%'� !%*)�� &� !""# � $� !'%!� (%&$� !'� '"%!� (%#)� !'� $%&#� $%$!� $� !)%&� !%!"�� $*�0!""# � $� (%(� )%*)� $� ""%$� &% #� $� $%&#� $%$!� $� !%'� !%*$�� ! �0!""# � $� !&%$� (%$ � $� &'%$� (%*)� $� $%& � $%$!� $� *%"� !%("�� !"�0!""# � $� !"'%!� *%&$� $� )*%(� *%*(� $� $%& � $%$!� !"� !%#� !%('�� )�0!""# � !� $&%'� (%$!� !� '*%"� (%(#� !� $%&$� $%$!� !"� !"%*� $%"$�� �� $#�0!""# � !"� !""% � *%*"� !"� '"%!� (% *� !"� $%"'� $%$!� !"� !(%'� $%&"�� $*�0!""# � !"� $)%#� *%!'� !"� &(% � (%(!� !"� $%"(� $%$ � !"� !'%$� !%*'�� $(�0!""# � $� $$%)� *%!!� $� '*% � *%'"� $� $%"$� $%$ � $� !)%#� !%*!�� $)�0!""# � $� $#% � (% &� $� '&%'� (%"(� $� $%"!� $%$ � $� !#%"� $%''�� !$�0!""# � $� $#%!� #%& � $� '!%)� #%&)� $� $%&*� $%$ � $� !"%*� !%)'�� !!�0!""# � $� !"#%"� #%* � $� )'%'� *%#'� $� $%"!� $%$#� $� $%)� !%*'�� ! �0!""# � $� !&&%(� (%!*� $� )(%'� )%$)� $� $%"*� $%$ � $� $%!� !%#$�� !#�0!""# � $� !")%#� (%("� $� ' %$� )%"'� $� $%"!� $%$!� $� !)%!� !%#"�� !'�0!""# � !"� !&'%*� (%* � !"� )$%"� (%$ � !"� $%&"� $%$!� !"� !"%&� !%#$�� !&�0!""# � $� !&*%)� )%$#� $� )$%#� )%#$� $� $%"$� $%$!� $� !'%!� !%*&�� !"�0!""# � $� !'&% � #%)'� $� ( %(� #%! � $� $%"!� $%$ � $� !'% � !%#(�� $�0!""# � $� !&#%'� *%$"� $� ('%#� #%# � $� $%"!� $%$ � $� !(%!� !%#!�� *�0!""# � !"� !&&%"� (%)!� $� (&%$� (%$*� !"� $%&!� $%$!� !"� !&%)� $%""�� (�0!""# � !#� !&"% � &%##� !#� )(%"� !$%( � !#� $%"$� $%$ � !#� !"%)� !%'#�� )�0!""# � !&� !&#%)� (%((� !&� ()%'� (%)"� !&� $%&&� $%$!� !&� !)%*� !%&!�� '�0!""# � $� !'!%"� *%$)� $� *&%"� #%)"� $� $%"#� $%$!� $� !)%*� !%!)�� &�0!""# � "� !' %&� '%("� "� (#%&� '%*)� "� !%$$� $%$ � "� $%$� !%) �� "�0!""# � !&� !&*%#� (%# � !&� (&%(� *%'"� !&� $%"$� $%$!� !&� !"%!� !%(&�-������������������������������.���.������.������.���.�����.������.���.�����.�����.���.�����.�����/

96
Appendix F. Summary of selected data from wild steelhead collected from the migration-at-large at the Clearwater RiverTrap (CLW), Snake River Trap at Lewiston (LEW), Salmon River Trap (SRT), Lower Granite Dam (LGR), Little GooseDam (LGS), McNary Dam (MCN), and Rock Island Dam (RIS) during spring 1993. Data includes sample size (N), mean(MEAN), and standard error (STDERR) of fork length in millimeters, wet weight in grams, condition factor (KFACTOR),and gill Na+, K+-ATPase activity (ATPase) in µmol Pi ⋅ mg protein-1 ⋅ h-1.
���������������������������������������������������������������������������������������������������� � � � ���� � ����� �� � �� � ������ � ������ ���������������������������������� ������������������������������������ � ����� � � ����� �� � � � ��� ����� � � ���� ����� � � ���� � � � � ���� � � ��������������������������������������������������������������������������������������������������������� ��� � � � � � � � � � � � � ���� &� !""# � !� !('%$� %� !� #'%$� %� !� $%")� %� !� !(%#� %����� !)� !""# � '� !" %$� !#%&$� '� '!%'� !)%&"� '� $%"!� $%$ � '� !&%'� #%**�� !"� !""# � !$� !" %#� "%&"� !$� )&%(� "% � !$� $%" � $%$ � !$� !'%!� % $�� !� !""# � ! � !&$% � #%"&� !!� ((%!� #%*!� !!� $%" � $%$!� ! � %#� !%#(�� #� !""# � !$� !)!%)� (% )� !$� #&%#� #%*#� !$� $%&"� $%$!� !$� !&%'� !% $�� )� !""# � !)� !')%)� (%*#� !)� ( %!� (%)"� !)� $%"!� $%$!� !)� % � !%'$�� &� !""# � !&� !)*%#� #%'$� !&� * %!� %*'� !&� $%"#� $%$ � !&� !%&� !%!$�� #$� !""# � ! � !'&%*� *%$#� ! � (#%!� #%"!� ! � $%" � $%$#� ! � *% � %)'�� $#�0!""# � ! � !''%#� #%" � !!� *&%$� #% &� !!� $%&'� $%$ � ! � !)%(� $%&*�� $(�0!""# � !)� !&!%(� )%)'� !)� ('%#� '% � !)� $%"$� $%$!� !)� !(%'� $%""�� $'�0!""# � !'� !'*% � *%((� !'� *'%'� #%)(� !'� $%&&� $%$!� !'� !#%"� !%$#�� !$�0!""# � ! � !''%#� *%"(� ! � *&%'� *%*(� ! � $%&(� $%$ � ! � !'%(� !%))�� ! �0!""# � ! � !)"%&� *%"$� ! � **%&� #% *� ! � $%"$� $%$ � ! � !'%)� !%(#�� !*�0!""# � ! � !)"%)� *%))� ! � *!%*� %' � ! � $%&*� $%$ � ! � !&%!� !%#*�� $*+,�!""# � #� !))%#� !#%$"� #� *)% � ! %('� #� $%"(� $%$#� #� #%"� '%!*��� � $)� !""# � !� !*(%$� %� !� "%!� %� !� $%")� %� !� !$%(� %�� $� !""# � !#� !&(% � &%)#� !#� )#%(� !!%#"� !#� $%"!� $%$ � !#� !#%$� !%!&�� � !""# � !� !'!%$� %� !� *&%!� %� !� $%")� %� !� !!%"� %�� '� !""# � ! � !'$%"� %&!� ! � * %!� % !� ! � $%&#� $%$ � ! � !#%&� !%) �� "� !""# � '� !'#%'� (%*$� '� *#%(� #%'$� '� $%& � $%$!� '� !*%$� !%#*�� $*�0!""# � (� !'&%#� #%)'� (� ($%)� #%##� (� $%&'� $%$ � (� !*%(� $%&&�� $)�0!""# � #*� !'#%&� %)*� #*� *)%"� %!'� #*� $%&&� $%$!� #*� ! %)� $%'*�� !!�0!""# � (� !'*%)� #%$"� (� *'%"� %($� (� $%&&� $%$!� (� !(%"� $%&!���� '� !""# � $� !&#%'� (%(#� $� ('%(� (%*&� $� $%&&� $%$!� $� $%$� !% '�� "� !""# � $� !&!%)� *%)!� $� (#%(� *%)(� $� $%&(� $%$!� $� #%)� !%& �� $*�0!""# � $� !& % � *%" � $� ( %'� *%#(� $� $%&*� $%$!� $� *%&� !%#(�� $)�0!""# � $� !&!%$� %'#� !"� (!%'� %'#� !"� $%&)� $%$!� $� %"� !%#!�� !!�0!""# � $� !'&%$� *%"#� $� ( %!� *%*!� $� $%&&� $%$ � $� $%(� !%*)�� !#�0!""# � $� !'*% � #%!#� $� *'%*� %)&� $� $%&&� $%$!� $� )%!� !%((�� !&�0!""# � $� !)#%!� #%($� $� #"%$� %)$� $� $%&&� $%$ � $� $%$� !% &�� $�0!""# � $� !))% � %( � $� * % � !%")� $� $%"!� $%$ � $� !%"� !% &�� (�0!""# � $� !)$%*� #%$ � $� #&%(� %#*� $� $%" � $%$!� !"� $%)� !%*#�� '�0!""# � $� !))%)� *%!!� $� *#%'� #% "� $� $%"!� $%$!� $� %$� !%#!�� $!+,�!""# � $� !'#%'� *%$!� $� *&%'� #%)#� $� $%"$� $%$!� $� *%(� !%(*�� $#+,�!""# � $� !))%#� %'#� $� *!%'� %$"� $� $%&"� $%$!� !"� *%)� !%*(����� )� !""# � ! � !''%$� (%)*� !!� *'%!� *%&"� !!� $%& � $%$!� ! � (%$� %##�� &� !""# � ! � !'#%!� (%##� ! � *#%#� *% � ! � $%&!� $%$!� ! � *%!� %& �� #$� !""# � ! � !&*%#� *%$ � ! � (!%'� #%'(� ! � $%&!� $%$!� ! � *%&� !%((�� $#�0!""# � ! � !'(%'� *%&"� ! � *(%"� #%'(� ! � $%&#� $%$ � ! � &% � !%&#�� $(�0!""# � ! � !"*%!� '%"$� ! � )*% � "%**� ! � $%&#� $%$ � ! � (%)� !%'"�� $'�0!""# � ! � !&#%!� )%)'� ! � (*% � )%#)� ! � $%&(� $%$ � ! � '%)� !%(&�� !$�0!""# � ! � !'!%&� *%!"� ! � *#%*� #%(!� ! � $%&*� $%$ � ! � !%&� !%'#�� ! �0!""# � ! � !''%$� *%$)� ! � *'%)� #%((� ! � $%&*� $%$!� ! � !%"� !%('�� !*�0!""# � ! � !'*%&� )% $� ! � *#%"� (%!*� ! � $%'"� $%$!� ! � #%*� !%#*�� !'�0!""# � ! � !)'%!� *%$&� ! � *$%"� #%!(� ! � $%&)� $%$!� ! � %(� !% '�� !"�0!""# � ! � !'$%!� #%) � ! � * %*� %' � ! � $%&(� $%$!� ! � !%)� !%'!�� !�0!""# � ! � !))%$� (%"*� ! � #'%&� #%*"� ! � $%&!� $%$ � ! � #%'� !%#'�� *�0!""# � ! � !'#%#� *%"&� ! � **%#� #%"(� ! � $%&#� $%$!� ! � #%'� %( �-������������������������������.���.������.������.���.�����.������.���.�����.�����.���.�����.�����/
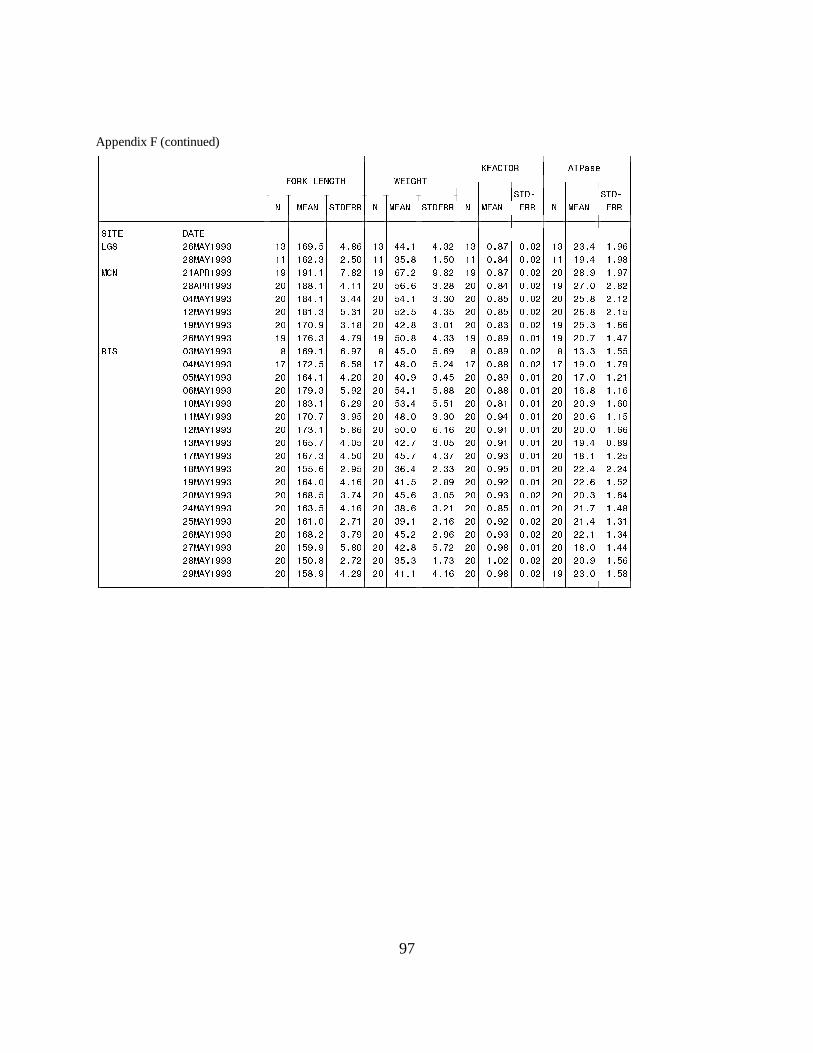
97
Appendix F (continued)���������������������������������������������������������������������������������������������������� � � � ���� � ����� �� � �� � ������ � ������ ���������������������������������� ������������������������������������ � ����� � � ����� �� � � � ��� ����� � � ���� ����� � � ���� � � � � ���� � � ��������������������������������������������������������������������������������������������������������� ��� � � � � � � � � � � � � ����� )�0!""# � !#� !)"%(� *%&)� !#� **%!� *%# � !#� $%&'� $%$ � !#� #%*� !%")�� &�0!""# � !!� !) %#� %($� !!� #(%&� !%($� !!� $%&*� $%$ � !!� !"%*� !%"&���� !� !""# � !"� !"!%!� '%& � !"� )'% � "%& � !"� $%&'� $%$ � $� &%"� !%"'�� &� !""# � $� !&&%!� *%!!� $� ()%)� #% &� $� $%&*� $%$ � !"� '%$� %& �� $*�0!""# � $� !&*%!� #%**� $� (*%!� #%#$� $� $%&(� $%$ � $� (%&� %! �� ! �0!""# � $� !&!%#� (%#!� $� ( %(� *%#(� $� $%&(� $%$ � $� )%&� %!(�� !"�0!""# � $� !'$%"� #%!&� $� * %&� #%$!� $� $%&#� $%$ � !"� (%#� !%))�� )�0!""# � !"� !')%#� *%'"� !"� ($%&� *%##� !"� $%&"� $%$!� !"� $%'� !%*'�� �� $#�0!""# � &� !)"%!� )%"'� &� *(%$� (%)"� &� $%&"� $%$ � &� !#%#� !%((�� $*�0!""# � !'� !' %(� )%(&� !'� *&%$� (% *� !'� $%&&� $%$ � !'� !"%$� !%'"�� $(�0!""# � $� !)*%!� *% $� $� *$%"� #%*(� $� $%&"� $%$!� $� !'%$� !% !�� $)�0!""# � $� !'"%#� (%" � $� (*%!� (%&&� $� $%&&� $%$!� $� !)%&� !%!)�� !$�0!""# � $� !&#%!� )% "� $� (#%*� (%(!� $� $%&!� $%$!� $� $%"� !%)$�� !!�0!""# � $� !'$%'� #%"(� $� *&%$� #%#$� $� $%"*� $%$!� $� $%)� !%!(�� ! �0!""# � $� !'#%!� (%&)� $� ($%$� )%!)� $� $%"!� $%$!� $� $%$� !%))�� !#�0!""# � $� !)(%'� *%$(� $� * %'� #%$(� $� $%"!� $%$!� $� !"%*� $%&"�� !'�0!""# � $� !)'%#� *%($� $� *(%'� *%#'� $� $%"#� $%$!� $� !&%!� !% (�� !&�0!""# � $� !((%)� %"(� $� #)%*� %##� $� $%"(� $%$!� $� %*� % *�� !"�0!""# � $� !)*%$� *%!)� $� *!%(� %&"� $� $%" � $%$!� $� %)� !%( �� $�0!""# � $� !)&%(� #%'*� $� *(%)� #%$(� $� $%"#� $%$ � $� $%#� !%)*�� *�0!""# � $� !)#%(� *%!)� $� #&%)� #% !� $� $%&(� $%$!� $� !%'� !%*&�� (�0!""# � $� !)!%$� %'!� $� #"%!� %!)� $� $%" � $%$ � $� !%*� !%#!�� )�0!""# � $� !)&% � #%'"� $� *(% � %")� $� $%"#� $%$ � $� %!� !%#*�� '�0!""# � $� !("%"� (%&$� $� * %&� (%' � $� $%"&� $%$!� $� !&%$� !%**�� &�0!""# � $� !($%&� %' � $� #(%#� !%'#� $� !%$ � $%$ � $� $%"� !%()�� "�0!""# � $� !(&%"� *% "� $� *!%!� *%!)� $� $%"&� $%$ � !"� #%$� !%(&�-������������������������������.���.������.������.���.�����.������.���.�����.�����.���.�����.�����/
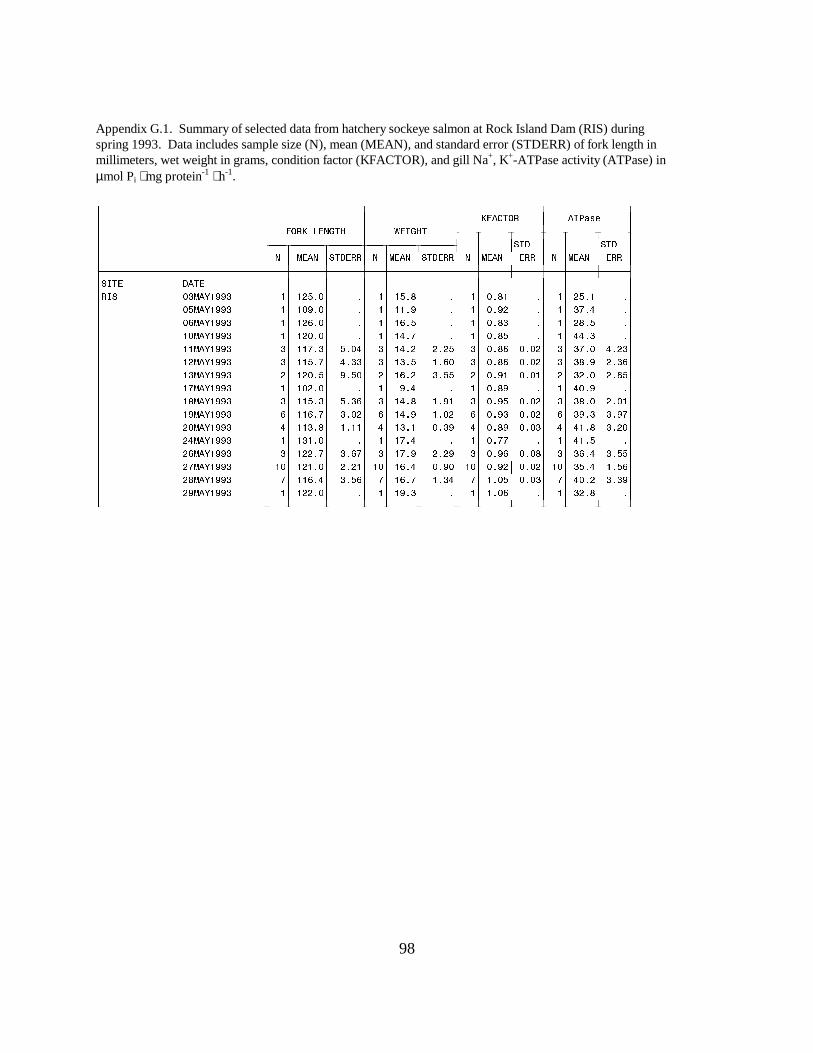
98
Appendix G.1. Summary of selected data from hatchery sockeye salmon at Rock Island Dam (RIS) duringspring 1993. Data includes sample size (N), mean (MEAN), and standard error (STDERR) of fork length inmillimeters, wet weight in grams, condition factor (KFACTOR), and gill Na+, K+-ATPase activity (ATPase) inµmol Pi ⋅ mg protein-1 ⋅ h-1.
���������������������������������������������������������������������������������������������������� � � � ���� � ����� �� � �� � ������ � ������ ���������������������������������� ������������������������������������ � ����� � � ����� �� � � � ��� ����� � � ���� ����� � � ���� � � � � ���� � � ��������������������������������������������������������������������������������������������������������� ��� � � � � � � � � � � � � �� �� $#�0!""# � !� ! (%$� %� !� !(%&� %� !� $%&!� %� !� (%!� %�� $(�0!""# � !� !$"%$� %� !� !!%"� %� !� $%" � %� !� #'%*� %�� $)�0!""# � !� ! )%$� %� !� !)%(� %� !� $%&#� %� !� &%(� %�� !$�0!""# � !� ! $%$� %� !� !*%'� %� !� $%&(� %� !� **%#� %�� !!�0!""# � #� !!'%#� (%$*� #� !*% � % (� #� $%&)� $%$ � #� #'%$� *% #�� ! �0!""# � #� !!(%'� *%##� #� !#%(� !%)$� #� $%&)� $%$ � #� #&%"� %#)�� !#�0!""# � � ! $%(� "%($� � !)% � #%((� � $%"!� $%$!� � # %$� %)(�� !'�0!""# � !� !$ %$� %� !� "%*� %� !� $%&"� %� !� *$%"� %�� !&�0!""# � #� !!(%#� (%#)� #� !*%&� !%"!� #� $%"(� $%$ � #� #&%$� %$!�� !"�0!""# � )� !!)%'� #%$ � )� !*%"� !%$ � )� $%"#� $%$ � )� #"%#� #%"'�� $�0!""# � *� !!#%&� !%!!� *� !#%!� $%#"� *� $%&"� $%$#� *� *!%&� #% $�� *�0!""# � !� !#!%$� %� !� !'%*� %� !� $%''� %� !� *!%(� %�� )�0!""# � #� ! %'� #%)'� #� !'%"� % "� #� $%")� $%$&� #� #)%*� #%((�� '�0!""# � !$� ! !%$� % !� !$� !)%*� $%"$� !$� $%" � $%$ � !$� #(%*� !%()�� &�0!""# � '� !!)%*� #%()� '� !)%'� !%#*� '� !%$(� $%$#� '� *$% � #%#"�� "�0!""# � !� ! %$� %� !� !"%#� %� !� !%$)� %� !� # %&� %�-������������������������������.���.������.������.���.�����.������.���.�����.�����.���.�����.�����/
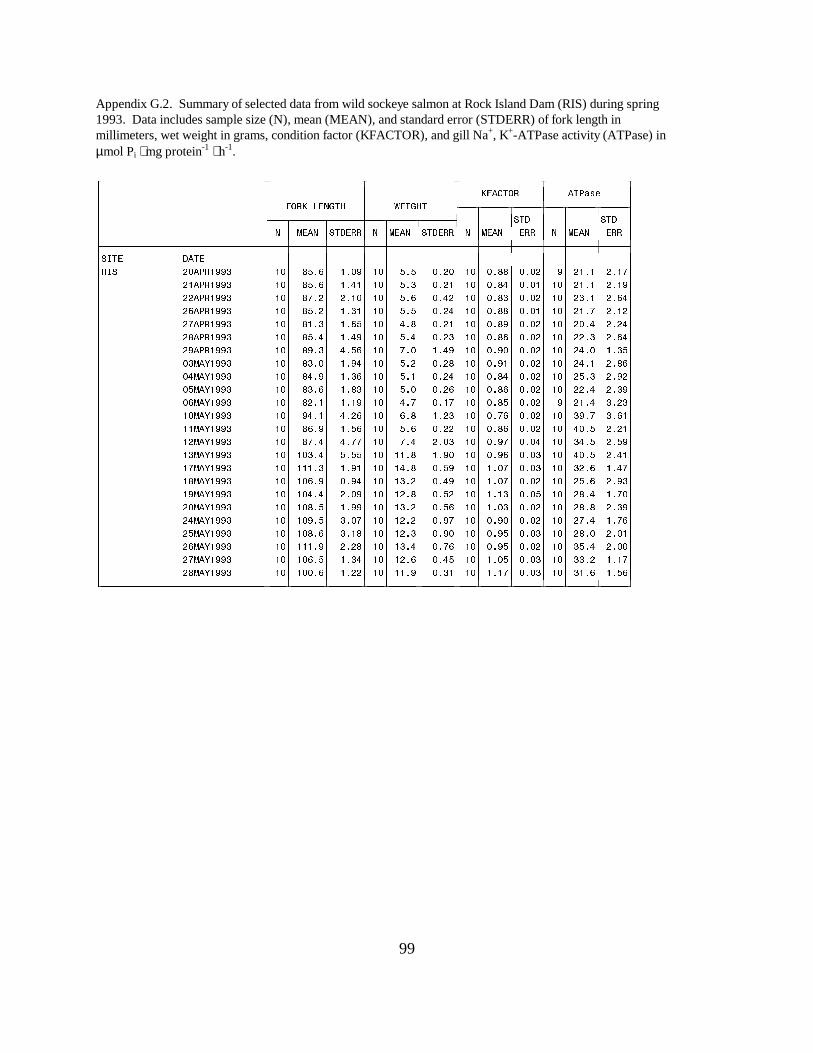
99
Appendix G.2. Summary of selected data from wild sockeye salmon at Rock Island Dam (RIS) during spring1993. Data includes sample size (N), mean (MEAN), and standard error (STDERR) of fork length inmillimeters, wet weight in grams, condition factor (KFACTOR), and gill Na+, K+-ATPase activity (ATPase) inµmol Pi ⋅ mg protein-1 ⋅ h-1.
���������������������������������������������������������������������������������������������������� � � � ���� � ����� �� � �� � ������ � ������ ���������������������������������� ������������������������������������ � ����� � � ����� �� � � � ��� ����� � � ���� ����� � � ���� � � � � ���� � � ��������������������������������������������������������������������������������������������������������� ��� � � � � � � � � � � � � �� �� $� !""# � !$� &(%)� !%$"� !$� (%(� $% $� !$� $%&&� $%$ � "� !%!� %!'�� !� !""# � !$� &(%)� !%*!� !$� (%#� $% !� !$� $%&*� $%$!� !$� !%!� %!"�� � !""# � !$� &'% � %!$� !$� (%)� $%* � !$� $%&#� $%$ � !$� #%!� %)*�� )� !""# � !$� &(% � !%#!� !$� (%(� $% *� !$� $%&&� $%$!� !$� !%'� %! �� '� !""# � !$� &!%#� !%)(� !$� *%&� $% !� !$� $%&"� $%$ � !$� $%*� % *�� &� !""# � !$� &(%*� !%*"� !$� (%*� $% #� !$� $%&)� $%$ � !$� %#� %)*�� "� !""# � !$� &"%#� *%()� !$� '%$� !%*"� !$� $%"$� $%$ � !$� *%$� !%#(�� $#�0!""# � !$� &#%$� !%"*� !$� (% � $% &� !$� $%"!� $%$ � !$� *%!� %&)�� $*�0!""# � !$� &*%"� !%#)� !$� (%!� $% *� !$� $%&*� $%$ � !$� (%#� %" �� $(�0!""# � !$� &#%)� !%&#� !$� (%$� $% )� !$� $%&)� $%$ � !$� %*� %#"�� $)�0!""# � !$� & %!� !%!"� !$� *%'� $%!'� !$� $%&(� $%$ � "� !%*� #% #�� !$�0!""# � !$� "*%!� *% )� !$� )%&� !% #� !$� $%')� $%$ � !$� #"%'� #%)!�� !!�0!""# � !$� &)%"� !%()� !$� (%)� $% � !$� $%&)� $%$ � !$� *$%(� % !�� ! �0!""# � !$� &'%*� *%''� !$� '%*� %$#� !$� $%"'� $%$*� !$� #*%(� %("�� !#�0!""# � !$� !$#%*� (%((� !$� !!%&� !%"$� !$� $%")� $%$#� !$� *$%(� %*!�� !'�0!""# � !$� !!!%#� !%"!� !$� !*%&� $%("� !$� !%$'� $%$#� !$� # %)� !%*'�� !&�0!""# � !$� !$)%"� $%"*� !$� !#% � $%*"� !$� !%$'� $%$ � !$� (%)� %"#�� !"�0!""# � !$� !$*%*� %$"� !$� ! %&� $%( � !$� !%!#� $%$(� !$� &%*� !%'$�� $�0!""# � !$� !$&%(� !%""� !$� !#% � $%()� !$� !%$#� $%$ � !$� &%&� %#"�� *�0!""# � !$� !$"%(� #%$'� !$� ! % � $%"'� !$� $%"$� $%$ � !$� '%*� !%')�� (�0!""# � !$� !$&%)� #%!&� !$� ! %#� $%"$� !$� $%"(� $%$#� !$� &%$� %$!�� )�0!""# � !$� !!!%"� % &� !$� !#%*� $%')� !$� $%"(� $%$ � !$� #(%*� %$$�� '�0!""# � !$� !$)%(� !%#*� !$� ! %)� $%*(� !$� !%$(� $%$#� !$� ##% � !%!'�� &�0!""# � !$� !$$%)� !% � !$� !!%"� $%#!� !$� !%!'� $%$#� !$� #!%)� !%()�-������������������������������.���.������.������.���.�����.������.���.�����.�����.���.�����.�����/
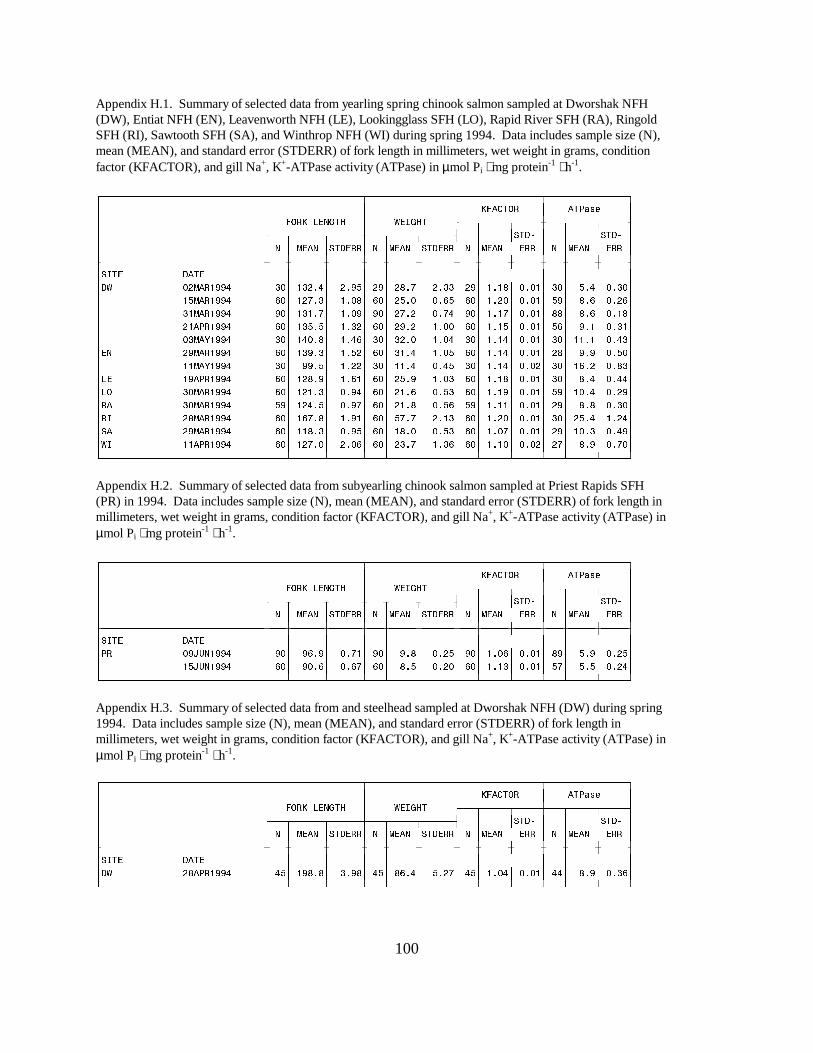
100
Appendix H.1. Summary of selected data from yearling spring chinook salmon sampled at Dworshak NFH(DW), Entiat NFH (EN), Leavenworth NFH (LE), Lookingglass SFH (LO), Rapid River SFH (RA), RingoldSFH (RI), Sawtooth SFH (SA), and Winthrop NFH (WI) during spring 1994. Data includes sample size (N),mean (MEAN), and standard error (STDERR) of fork length in millimeters, wet weight in grams, conditionfactor (KFACTOR), and gill Na+, K+-ATPase activity (ATPase) in µmol Pi ⋅ mg protein-1 ⋅ h-1.
���������������������������������������������������������������������������������������������������� � � � ���� � ����� �� � �� � ������ � ������ ���������������������������������� ������������������������������������ � ����� � � ����� �� � � � ��� ����� � � ���� ����� � � ���� � � � � ���� � � ��������������������������������������������������������������������������������������������������������� ��� � � � � � � � � � � � � ���� $ � !""* � #$� !# %*� %"(� "� &%'� %##� "� !%!&� $%$!� #$� (%*� $%#$�� !(� !""* � )$� ! '%#� !%$&� )$� (%$� $%)(� )$� !% $� $%$!� ("� &%)� $% )�� #!� !""* � "$� !#!%'� !%$"� "$� '% � $%'*� "$� !%!'� $%$!� &&� &%)� $%!&�� !� !""* � )$� !#(%(� !%# � )$� "% � !%$$� )$� !%!(� $%$!� ()� "%!� $%#!�� $#�0!""* � #$� !*$%&� !%*)� #$� # %$� !%$*� #$� !%!*� $%$!� #$� !!%!� $%*#���� "� !""* � )$� !#"%#� !%( � )$� #!%*� !%$(� )$� !%!*� $%$!� &� "%"� $%($�� !!�0!""* � #$� ""%(� !% � #$� !!%*� $%*(� #$� !%!*� $%$ � #$� !)% � $%&#���� !"� !""* � )$� ! &%"� !%)!� )$� (%"� !%$#� )$� !%!&� $%$!� #$� &%*� $%**���� #$� !""* � )$� ! !%#� $%"*� )$� !%)� $%(#� )$� !%!"� $%$!� ("� !$%*� $% "�� #$� !""* � ("� ! *%(� $%"'� )$� !%&� $%()� ("� !%!!� $%$!� "� &%&� $%#$�� � &� !""* � )$� !)'%&� !%"!� )$� ('%'� %!#� )$� !% $� $%$!� #$� (%*� !% *��� "� !""* � )$� !!&%#� $%"(� )$� !&%$� $%(#� )$� !%$'� $%$!� "� !$%#� $%*"���� !!� !""* � )$� ! '%$� %$)� )$� #%'� !%#)� )$� !%!$� $%$ � '� &%"� $%'$�-������������������������������.���.������.������.���.�����.������.���.�����.�����.���.�����.�����/
Appendix H.2. Summary of selected data from subyearling chinook salmon sampled at Priest Rapids SFH(PR) in 1994. Data includes sample size (N), mean (MEAN), and standard error (STDERR) of fork length inmillimeters, wet weight in grams, condition factor (KFACTOR), and gill Na+, K+-ATPase activity (ATPase) inµmol Pi ⋅ mg protein-1 ⋅ h-1.
���������������������������������������������������������������������������������������������������� � � � ���� � ����� �� � �� � ������ � ������ ���������������������������������� ������������������������������������ � ����� � � ����� �� � � � ��� ����� � � ���� ����� � � ���� � � � � ���� � � ��������������������������������������������������������������������������������������������������������� ��� � � � � � � � � � � � � ��� $"+,�!""* � "$� ")%"� $%'!� "$� "%&� $% (� "$� !%$)� $%$!� &"� (%"� $% (�� !(+,�!""* � )$� "$%)� $%)'� )$� &%(� $% $� )$� !%!#� $%$!� ('� (%(� $% *�-������������������������������.���.������.������.���.�����.������.���.�����.�����.���.�����.�����/
Appendix H.3. Summary of selected data from and steelhead sampled at Dworshak NFH (DW) during spring1994. Data includes sample size (N), mean (MEAN), and standard error (STDERR) of fork length inmillimeters, wet weight in grams, condition factor (KFACTOR), and gill Na+, K+-ATPase activity (ATPase) inµmol Pi ⋅ mg protein-1 ⋅ h-1.
���������������������������������������������������������������������������������������������������� � � � ���� � ����� �� � �� � ������ � ������ ���������������������������������� ������������������������������������ � ����� � � ����� �� � � � ��� ����� � � ���� ����� � � ���� � � � � ���� � � ��������������������������������������������������������������������������������������������������������� ��� � � � � � � � � � � � � ���� &� !""* � *(� !"&%&� #%"&� *(� &)%*� (% '� *(� !%$*� $%$!� **� &%"� $%#)�-������������������������������.���.������.������.���.�����.������.���.�����.�����.���.�����.�����/
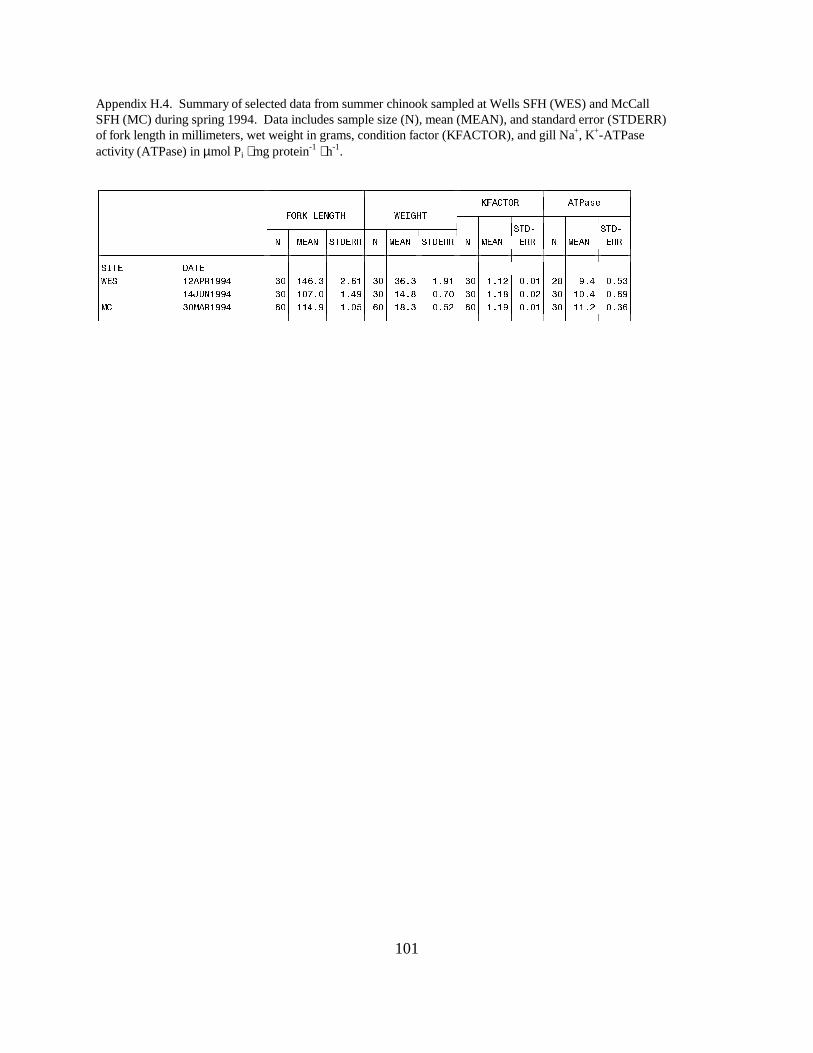
101
Appendix H.4. Summary of selected data from summer chinook sampled at Wells SFH (WES) and McCallSFH (MC) during spring 1994. Data includes sample size (N), mean (MEAN), and standard error (STDERR)of fork length in millimeters, wet weight in grams, condition factor (KFACTOR), and gill Na+, K+-ATPaseactivity (ATPase) in µmol Pi ⋅ mg protein-1 ⋅ h-1.
���������������������������������������������������������������������������������������������������
� � � � ���� � ����� �� � �� � ������ � ������ ���������������������������������� ������������������������������������ � ����� � � ����� �� � � � ��� ����� � � ���� ����� � � ���� � � � � ���� � � ��������������������������������������������������������������������������������������������������������� ��� � � � � � � � � � � � � ����� ! � !""* � #$� !*)%#� %)!� #$� #)%#� !%"!� #$� !%! � $%$!� &� "%*� $%(#�� !*+,�!""* � #$� !$'%$� !%*"� #$� !*%&� $%'$� #$� !%!&� $%$ � #$� !$%*� $%)"��� #$� !""* � )$� !!*%"� !%$(� )$� !&%#� $%( � )$� !%!"� $%$!� #$� !!% � $%#)�-������������������������������.���.������.������.���.�����.������.���.�����.�����.���.�����.�����/

102
Appendix I.1. Summary of selected data from yearling hatchery spring/summer chinook salmon collected from themigration-at-large at the Clearwater River trap (CLW), Snake River Trap at Lewiston (LEW), Salmon River Trap (SRT),Imnaha River Trap (IMT), Grande Ronde River Trap (GRT), Lower Granite Dam (LGR), McNary Dam (MCN), and RockIsland Dam (RIS) during spring 1994. Data includes sample size (N), mean (MEAN), and standard error (STDERR) offork length in millimeters, wet weight in grams, condition factor (KFACTOR), and gill Na+, K+-ATPase activity (ATPase)in µmol Pi ⋅ mg protein-1 ⋅ h-1.
���������������������������������������������������������������������������������������������������� � � � ���� � ����� �� � �� � ������ � ������ ���������������������������������� ������������������������������������ � ����� � � ����� �� � � � ��� ����� � � ���� ����� � � ���� � � � � ���� � � ��������������������������������������������������������������������������������������������������������� ��� � � � � � � � � � � � � ���� $&� !""* � !� "'%$� %� !� "%(� %� !� !%$*� %� !� !(%#� %�� !!� !""* � !� !##%*� %"#� !� (%'� !%#*� !� !%$'� $%$#� !� "%(� $%( �� !#� !""* � (� !#*%*� !%&#� (� (%)� !%$&� (� !%$*� $%$ � #� !!% � $%(&�� !(� !""* � #$� !#*%$� %$ � #$� '%*� !%#&� #$� !%!!� $%$!� #$� !!%#� $%($�� !&� !""* � !"� !#"%&� #%#$� !"� #$%)� %&'� !"� !%$&� $%$!� $� ! %!� !% !�� $� !""* � #$� ! !%&� !%)"� #$� % � !%$#� #$� !% !� $%$ � *� &%$� $%#(�� � !""* � $� ! '%(� %&)� $� %(� !%")� $� !%$(� $%$ � $� !!%*� !% )�� '� !""* � !� !#$%(� #%(*� !� )%*� !%&'� !� !%!(� $%$#� !"� "%'� $%)"�� "� !""* � $� !#$%*� #% "� $� #%"� !%)&� $� !%$(� $%$ � !&� !$%#� $%"$�� $ �0!""* � &� ! '%)� (%&)� &� %(� %'(� &� !%$)� $%$(� &� !!%)� !%$!�� $*�0!""* � !#� !##%!� %(&� !#� *% � !%)&� !#� !%$!� $%$ � !#� ! %!� $%'*�� $)�0!""* � #� !##%$� #%)!� #� )%$� !%&)� #� !%!$� $%$!� #� !*%)� $%" �� !!�0!""* � *� !#'% � %()� *� &%$� !%) � *� !%$)� $%$ � � !!%)� $%''����� !#� !""* � #$� ! )%(� !%*"� #$� !%#� $%)'� #$� !%$(� $%$ � #$� &%(� $%#&�� !(� !""* � � !#*%"� (%'(� � &%!� *%& � � !%$ � $%$!� !� !!%*� $%*)�� $� !""* � !� !#!% � *%*(� !� *%#� #%$&� !� !%$#� $%$ � !� !!%(� $%&*�� � !""* � #!� ! #% � !%)&� #!� %*� $%"*� #!� !%!&� $%$ � "� !$%(� $%'"�� (� !""* � #$� ! '%&� !%*(� #$� % � $%)"� #$� !%$)� $%$!� "� !$%*� $%' �� '� !""* � !� ! "%)� *%!$� !� *%*� %'&� !� !%$'� $%$ � !)� !$%*� $%))�� "� !""* � !� ! (%*� $%" � !� $%$� $%'*� !� !%$!� $%$ � !&� ! %)� $%" �� $ �0!""* � !� ! '% � !%"$� !� !%&� $%&&� !� !%$(� $%$ � $� !)%$� $%&'�� $*�0!""* � !� !#$%"� %'#� !� #%&� !%)!� !� !%$#� $%$!� $� !(%"� !%$$�� $)�0!""* � !� ! (%*� !%''� !� !%!� $%&"� !� !%$)� $%$!� !"� !'%'� $%" �� $"�0!""* � � !#!%!� %(*� !� !% � !% &� !� $%"*� $%$#� � !#% � !%$#�� !!�0!""* � #� ! "%)� !%'#� #� %*� !%$!� #� !%$!� $%$ � $� !)%!� $%""�� !#�0!""* � � ! %$� !%&!� � !"%#� $%"&� � !%$(� $%$!� !� !*%!� !%$)�� !)�0!""* � !#� ! (%!� %*&� !#� $%$� !%#*� !#� !%$!� $%$ � !#� !#%"� $%")�� !&�0!""* � '� !##%"� (%((� '� (%!� #%*!� '� !%$!� $%$ � '� !*%*� !%*"�� !"�0!""* � "� !#*% � "%&&� "� '%(� )%& � "� !%$*� $%$*� "� !#%$� !%$!�� #�0!""* � � !#!%$� *%$$� � *%&� #%($� � !%!$� $%$)� � !#%)� $%*#�� (�0!""* � � !!"%(� '%($� � !&%&� #%($� � !%$"� $%$$� � !)% � #%$&�� '�0!""* � !� !#"%$� %� !� "%&� %� !� !%!!� %� !� *%&� %��� � ! � !""* � *$� ! '%#� !%!(� *$� !%(� $%)$� *$� !%$#� $%$!� #"� &%!� $%#!�� !*� !""* � ($� !#!% � !%$!� ($� %"� $%*'� ($� !%$!� $%$!� ($� "% � $%**�� !"� !""* � *$� !##%$� !%!"� *$� %'� $%)$� *$� $%")� $%$!� #'� !$%!� $%&)�� !� !""* � ($� ! #%*� !%!'� ($� !&%'� $%**� ($� $%""� $%$!� * � !$%$� $%)"�� )� !""* � *$� ! !%#� !%$#� *$� !&%'� $%*'� *$� !%$*� $%$!� *$� !!%(� $%*)�� &� !""* � ($� ! $%!� !%$"� ($� !&%)� $%(!� ($� !%$'� $%$!� *'� ! % � $%(#�� $#�0!""* � *$� ! '%$� !%!$� *$� $%*� $%*"� *$� $%""� $%$!� #"� ! %'� $%(*�� $(�0!""* � (!� ! (%'� !%#(� (!� !%!� $%)"� (!� !%$(� $%$!� (!� !*%)� $%('�� !$�0!""* � *$� ! !%'� !%(*� *$� !&%&� $%'#� *$� !%$ � $%$!� #"� !#% � $%''�� ! �0!""* � #'� ! !% � !%*!� #'� !&%)� $%'!� #'� !%$#� $%$!� #(� !#%(� $%'(�� !'�0!""* � (� ! % � % '� (� !'%"� !%#)� (� $%"&� $%$*� (� ! %(� !%$*�� !"�0!""* � !!� !!&%&� #%#(� !!� !&% � !% '� !!� !%$'� $%$#� !!� !*%'� !%!*�� *�0!""* � !� !#!% � !%'"� !� !%'� $%"(� !� $%"(� $%$ � !� !(%)� !%$!�� )�0!""* � *$� ! )%&� !%#&� *$� !"%!� $%'(� *$� $%" � $%$!� *$� !(%"� $%)!�-������������������������������.���.������.������.���.�����.������.���.�����.�����.���.�����.�����/
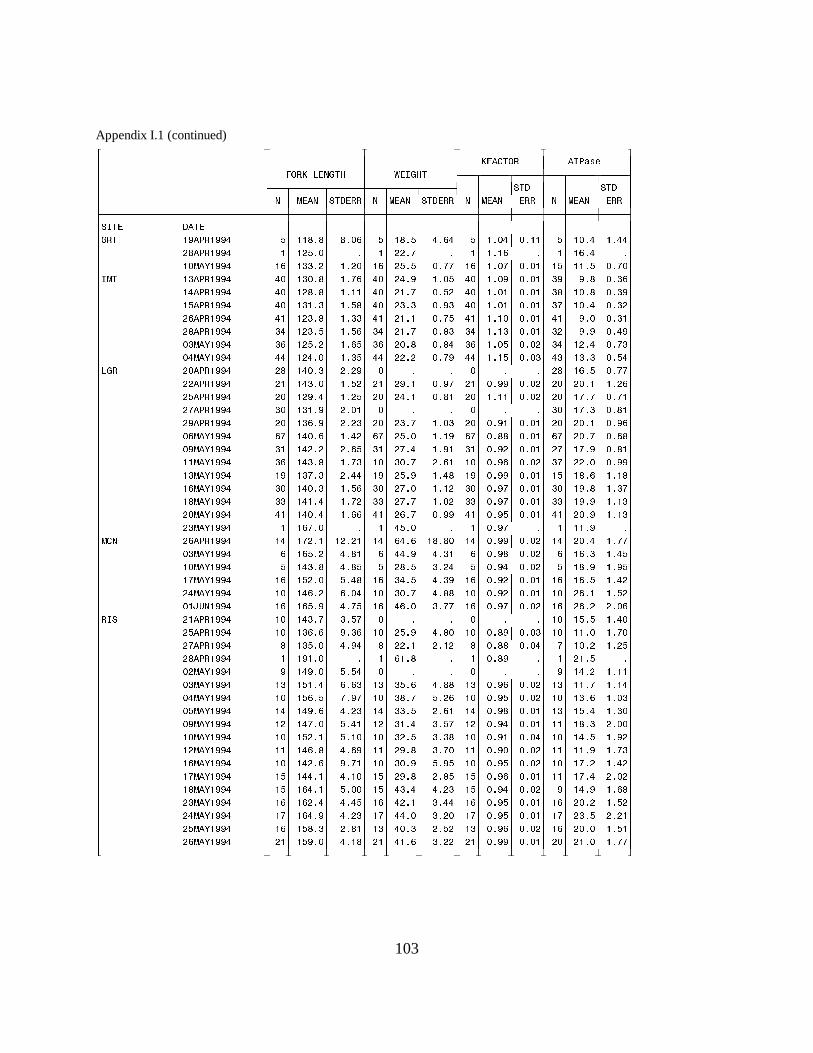
103
Appendix I.1 (continued)���������������������������������������������������������������������������������������������������� � � � ���� � ����� �� � �� � ������ � ������ ���������������������������������� ������������������������������������ � ����� � � ����� �� � � � ��� ����� � � ���� ����� � � ���� � � � � ���� � � ��������������������������������������������������������������������������������������������������������� ��� � � � � � � � � � � � � ��� � !"� !""* � (� !!&%&� &%$)� (� !&%(� *%)*� (� !%$*� $%!!� (� !$%*� !%**�� &� !""* � !� ! (%$� %� !� %'� %� !� !%!)� %� !� !)%*� %�� !$�0!""* � !)� !##% � !% $� !)� (%(� $%''� !)� !%$'� $%$!� !(� !!%(� $%'$����� !#� !""* � *$� !#$%&� !%')� *$� *%"� !%$(� *$� !%$"� $%$!� #"� "%&� $%#)�� !*� !""* � *$� ! &%&� !%!!� *$� !%'� $%( � *$� !%$!� $%$!� #&� !$%&� $%#"�� !(� !""* � *$� !#!%#� !%(&� *$� #%#� $%"#� *$� !%$!� $%$!� #'� !$%*� $%# �� )� !""* � *!� ! #%&� !%##� *!� !%!� $%'(� *!� !%!$� $%$!� *!� "%$� $%#!�� &� !""* � #*� ! #%(� !%()� #*� !%'� $%&#� #*� !%!#� $%$!� # � "%"� $%*"�� $#�0!""* � #)� ! (% � !%)(� #)� $%&� $%&*� #)� !%$(� $%$ � #*� ! %*� $%'#�� $*�0!""* � **� ! *%$� !%#(� **� % � $%'"� **� !%!(� $%$#� *#� !#%#� $%(*���� $� !""* � &� !*$%#� % "� $� %� %� $� %� %� &� !)%(� $%''�� � !""* � !� !*#%$� !%( � !� "%!� $%"'� !� $%""� $%$ � $� $%!� !% )�� (� !""* � $� ! "%*� !% (� $� *%!� $%&!� $� !%!!� $%$ � $� !'%'� $%'!�� '� !""* � #$� !#!%"� %$!� $� %� %� $� %� %� #$� !'%#� $%&!�� "� !""* � $� !#)%"� % #� $� #%'� !%$#� $� $%"!� $%$!� $� $%!� $%")�� $)�0!""* � )'� !*$%)� !%* � )'� (%$� !%!"� )'� $%&&� $%$!� )'� $%'� $%)&�� $"�0!""* � #!� !* % � %)(� #!� '%*� !%"!� #!� $%" � $%$!� '� !'%"� $%&!�� !!�0!""* � #)� !*#%&� !%'#� !$� #$%'� %)!� !$� $%")� $%$ � #'� %$� $%""�� !#�0!""* � !"� !#'%#� %**� !"� (%"� !%*&� !"� $%""� $%$!� !(� !&%)� !%!&�� !)�0!""* � #$� !*$%#� !%()� #$� '%$� !%! � #$� $%"'� $%$!� #$� !"%&� !%#'�� !&�0!""* � ##� !*!%*� !%' � ##� '%'� !%$ � ##� $%"'� $%$!� ##� !"%"� !%!#�� $�0!""* � *!� !*$%*� !%))� *!� )%'� $%""� *!� $%"(� $%$!� *!� $%"� !%!#�� #�0!""* � !� !)'%$� %� !� *(%$� %� !� $%"'� %� !� !!%"� %���� )� !""* � !*� !' %!� ! % !� !*� )*%)� !&%&$� !*� $%""� $%$ � !*� $%*� !%''�� $#�0!""* � )� !)(% � *%&!� )� **%"� *%#!� )� $%"&� $%$ � )� !)%#� !%*(�� !$�0!""* � (� !*#%&� *%&(� (� &%(� #% *� (� $%"*� $%$ � (� !&%"� !%"(�� !'�0!""* � !)� !( %$� (%*&� !)� #*%(� *%#"� !)� $%" � $%$!� !)� !)%(� !%* �� *�0!""* � !$� !*)% � )%$*� !$� #$%'� *%&&� !$� $%" � $%$!� !$� )%!� !%( �� $!+,�!""* � !)� !)(%"� *%'(� !)� *)%$� #%''� !)� $%"'� $%$ � !)� )% � %$)�� �� !� !""* � !$� !*#%'� #%('� $� %� %� $� %� %� !$� !(%(� !%*$�� (� !""* � !$� !#)%)� "%#)� !$� (%"� *%&$� !$� $%&"� $%$#� !$� !!%$� !%'$�� '� !""* � &� !#(%$� *%"*� &� %!� %! � &� $%&&� $%$*� '� !$% � !% (�� &� !""* � !� !"!%$� %� !� )!%&� %� !� $%&"� %� !� !%(� %�� $ �0!""* � "� !*"%$� (%(*� $� %� %� $� %� %� "� !*% � !%!!�� $#�0!""* � !#� !(!%*� )%)#� !#� #(%)� *%&&� !#� $%")� $%$ � !#� !!%'� !%!*�� $*�0!""* � !$� !()%(� '%"'� !$� #&%'� (% )� !$� $%"(� $%$ � !$� !#%)� !%$#�� $(�0!""* � !*� !*"%)� *% #� !*� ##%(� %)!� !*� $%"&� $%$!� !#� !(%*� !%#$�� $"�0!""* � ! � !*'%$� (%*!� ! � #!%*� #%('� ! � $%"*� $%$!� !!� !&%#� %$$�� !$�0!""* � !$� !( %!� (%!$� !$� # %(� #%#&� !$� $%"!� $%$*� !$� !*%(� !%" �� ! �0!""* � !!� !*)%&� *%)"� !!� "%&� #%'$� !!� $%"$� $%$ � !!� !!%"� !%'#�� !)�0!""* � !$� !* %)� "%'!� !$� #$%"� (%"(� !$� $%"(� $%$ � !$� !'% � !%* �� !'�0!""* � !(� !**%!� *%!$� !(� "%&� %&(� !(� $%")� $%$!� !!� !'%*� %$ �� !&�0!""* � !(� !)*%!� (%$$� !(� *#%*� *% #� !(� $%"*� $%$ � "� !*%"� !%)&�� #�0!""* � !)� !) %*� *%*(� !)� * %!� #%**� !)� $%"(� $%$!� !)� $% � !%( �� *�0!""* � !'� !)*%"� *% #� !'� **%$� #% $� !'� $%"(� $%$!� !'� #%(� % !�� (�0!""* � !)� !(&%#� %&!� !#� *$%#� %( � !#� $%")� $%$ � !)� $%$� !%(!�� )�0!""* � !� !("%$� *%!&� !� *!%)� #% � !� $%""� $%$!� $� !%$� !%''�-������������������������������.���.������.������.���.�����.������.���.�����.�����.���.�����.�����/
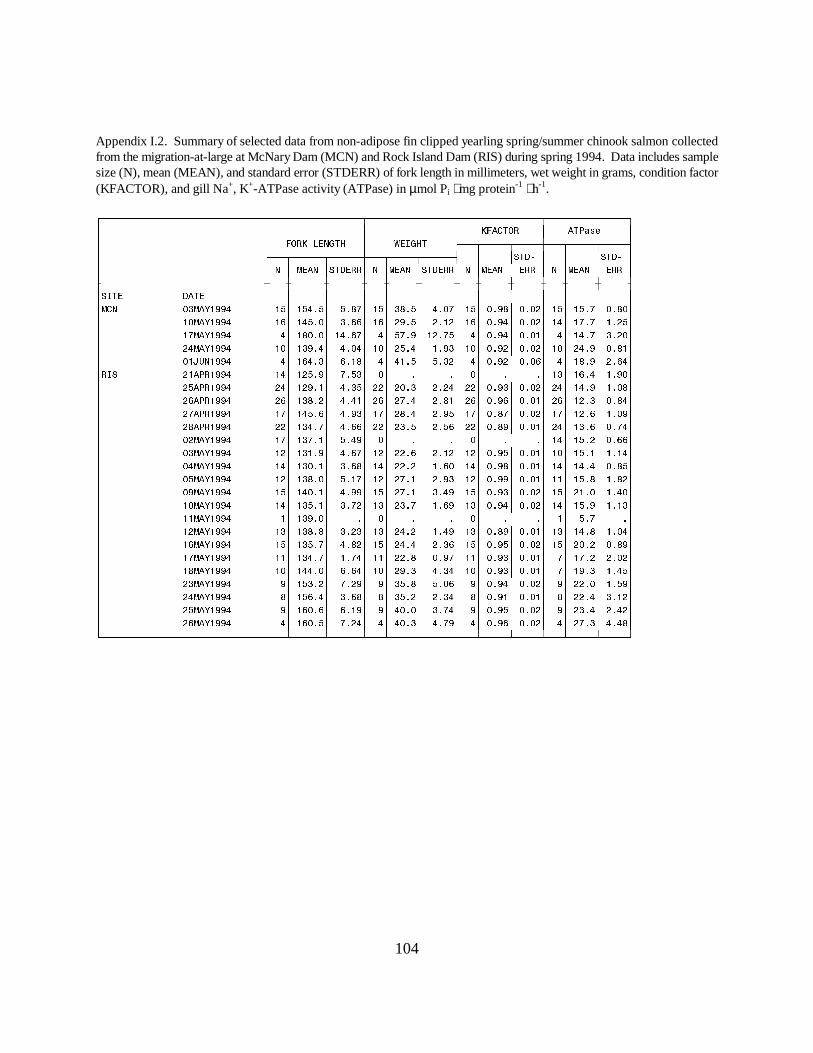
104
Appendix I.2. Summary of selected data from non-adipose fin clipped yearling spring/summer chinook salmon collectedfrom the migration-at-large at McNary Dam (MCN) and Rock Island Dam (RIS) during spring 1994. Data includes samplesize (N), mean (MEAN), and standard error (STDERR) of fork length in millimeters, wet weight in grams, condition factor(KFACTOR), and gill Na+, K+-ATPase activity (ATPase) in µmol Pi ⋅ mg protein-1 ⋅ h-1.
���������������������������������������������������������������������������������������������������� � � � ���� � ����� �� � �� � ������ � ������ ���������������������������������� ������������������������������������ � ����� � � ����� �� � � � ��� ����� � � ���� ����� � � ���� � � � � ���� � � ��������������������������������������������������������������������������������������������������������� ��� � � � � � � � � � � � � ���� $#�0!""* � !(� !(*%(� (%&'� !(� #&%(� *%$'� !(� $%"&� $%$ � !(� !(%'� $%&$�� !$�0!""* � !)� !*(%$� #%))� !)� "%(� %! � !)� $%"*� $%$ � !*� !'%'� !% (�� !'�0!""* � *� !&$%$� !*%)'� *� ('%"� ! %'(� *� $%"*� $%$!� *� !*%'� #% $�� *�0!""* � !$� !#"%*� *%$*� !$� (%*� !%"#� !$� $%" � $%$ � !$� *%"� $%&!�� $!+,�!""* � *� !)*%#� )%!&� *� *!%(� (%# � *� $%" � $%$)� *� !&%"� %)*�� �� !� !""* � !*� ! (%"� '%(#� $� %� %� $� %� %� !#� !)%*� !%"$�� (� !""* � *� ! "%!� *%#(� � $%#� % *� � $%"#� $%$ � *� !*%"� !%$&�� )� !""* � )� !#&% � *%*!� )� '%*� %&!� )� $%")� $%$!� )� ! %#� $%&*�� '� !""* � !'� !*(%)� *%"#� !'� &%*� %"(� !'� $%&'� $%$ � !'� ! %)� !%$"�� &� !""* � � !#*%'� *%))� � #%(� %()� � $%&"� $%$!� *� !#%)� $%'*�� $ �0!""* � !'� !#'%!� (%*"� $� %� %� $� %� %� !*� !(% � $%))�� $#�0!""* � ! � !#!%"� *%)'� ! � %)� %! � ! � $%"(� $%$!� !$� !(%!� !%!*�� $*�0!""* � !*� !#$%!� #%)&� !*� % � !%)$� !*� $%"&� $%$!� !*� !*%*� $%&(�� $(�0!""* � ! � !#&%$� (%!'� ! � '%!� %"#� ! � $%""� $%$!� !!� !(%&� !%& �� $"�0!""* � !(� !*$%!� *%""� !(� '%!� #%*"� !(� $%"#� $%$ � !(� !%$� !%*$�� !$�0!""* � !*� !#(%!� #%' � !#� #%'� !%)"� !#� $%"*� $%$ � !*� !(%"� !%!#�� !!�0!""* � !� !#"%$� %� $� %� %� $� %� %� !� (%'� %�� ! �0!""* � !#� !#&%&� #% #� !#� *% � !%*"� !#� $%&"� $%$!� !#� !*%&� !%$*�� !)�0!""* � !(� !#(%'� *%& � !(� *%*� %#)� !(� $%"(� $%$ � !(� $% � $%&"�� !'�0!""* � !!� !#*%'� !%'*� !!� %&� $%"'� !!� $%"#� $%$!� '� !'% � %$ �� !&�0!""* � !$� !**%$� )%)*� !$� "%#� *%#*� !$� $%"#� $%$!� '� !"%#� !%*(�� #�0!""* � "� !(#% � '% "� "� #(%&� (%$)� "� $%"*� $%$ � "� %$� !%("�� *�0!""* � &� !()%*� #%)&� &� #(% � %#*� &� $%"!� $%$!� &� %*� #%! �� (�0!""* � "� !)$%)� )%!"� "� *$%$� #%'*� "� $%"(� $%$ � "� #%*� %* �� )�0!""* � *� !)$%(� '% *� *� *$%#� *%'"� *� $%")� $%$ � *� '%#� *%*&�-������������������������������.���.������.������.���.�����.������.���.�����.�����.���.�����.�����/

105
Appendix J. Summary of selected data from yearling wild spring/summer chinook salmon collected from themigration-at-large at the Clearwater River Trap (CLW), Snake River Trap at Lewiston (LEW), Salmon RiverTrap (SRT), Imnaha River Trap (IMT), Grande Ronde River Trap (GRT), and Lower Granite Dam (LGR)during spring 1994. Data includes sample size (N), mean (MEAN), and standard error (STDERR) of forklength in millimeters, wet weight in grams, condition factor (KFACTOR), and gill Na+, K+-ATPase activity(ATPase) in µmol Pi ⋅ mg protein-1 ⋅ h-1.
���������������������������������������������������������������������������������������������������� � � � ���� � ����� �� � �� � ������ � ������ ���������������������������������� ������������������������������������ � ����� � � ����� �� � � � ��� ����� � � ���� ����� � � ���� � � � � ���� � � ��������������������������������������������������������������������������������������������������������� ��� � � � � � � � � � � � � ���� $&� !""* � (� !! %)� *%')� (� !*%#� !%)$� (� $%""� $%$)� (� !&%'� $%"'�� !!� !""* � !&� !$"%*� #%$ � !'� ! %#� $%'"� !'� $%")� $%$#� !&� !*%!� $%&*�� !#� !""* � )� !!(%$� *%")� )� !(%"� !%"(� )� !%$ � $%$#� )� !*%!� % *�� !(� !""* � "� !$)% � #%((� "� !#%!� !%##� "� !%$)� $%$ � "� !*%"� !%#(�� !&� !""* � (� !$'% � !%!!� (� !#%'� $%&*� (� !%!!� $%$(� (� !'%'� *%)#�� $� !""* � #$� !$ %*� !%((� #$� !!%'� $%($� #$� !%$&� $%$ � &� !#%*� !%)"�� � !""* � $� !$*%'� % � $� ! %!� $%")� $� !%$#� $%$(� $� !!%*� $%")�� '� !""* � '� ""%$� %#'� '� !!%$� $%'"� '� !%!#� $%$#� '� !$%)� !%$$�� "� !""* � &� !$)%#� )%$(� &� !#%)� % (� &� !%$&� $%$ � '� ! %(� !%! �� $ �0!""* � #� !$'%'� !)%*&� #� !'%$� '% � #� !% #� $%$(� � !'%#� !%""�� $*�0!""* � #� ""%'� %")� #� "% � !%!"� #� $%" � $%$(� #� !*%'� #%# �� $)�0!""* � � !$'%(� $%($� � !(%'� $%)(� � !% )� $%$#� � !%$� %$#�� !!�0!""* � !$� !$'%'� *%&"� !$� !(% � %'$� !$� !%!*� $%$ � &� !#%$� !%'&����� !#� !""* � *� !$#%&� )%'*� *� ! %!� %$&� *� !%$*� $%$!� *� !!%(� $%&&�� !(� !""* � #� !!$%'� *%&*� #� !#%(� !%((� #� $%""� $%$#� #� !"%*� %"'�� $� !""* � $� !!$%'� %!*� $� !#%)� $%)#� $� !%$$� $%$ � !'� !#%*� %!)�� � !""* � "� !!$%(� %# � '� !)%!� !%#'� '� !%!(� $%$!� '� !(%&� !%!(�� (� !""* � '� !$(%$� !%( � '� ! %'� $%()� '� !%$&� $%$ � $� !*%#� $%" �� '� !""* � !"� !$*%'� !%("� !"� ! %&� $%("� !"� !%!!� $%$ � !'� !*%(� !%*!�� "� !""* � !!� !$)% � #%#$� !!� !#% � !% !� !!� !%$&� $%$ � !!� !#%)� $%"(�� $ �0!""* � *� !$#%&� !%"#� *� !$%"� $%(!� *� $%"'� $%$(� *� !!% � %**�� $*�0!""* � )� !!!%$� #%!#� )� !*%!� !% (� )� !%$ � $%$ � (� %!� !%&)�� $)�0!""* � )� !$)%$� %$ � )� !#%*� $%""� )� !%!!� $%$#� )� !'%"� % �� $"�0!""* � !&� !$)%&� !%)"� !'� ! % � $%(!� !'� !%$ � $%$*� !&� !*%)� !%# �� !!�0!""* � !&� !$"%$� !%('� !&� !#%!� $%()� !&� !%$!� $%$ � !&� !#%!� !%!)�� !#�0!""* � !'� !$#%)� !% (� !)� ! %)� $%*)� !)� !%!$� $%$ � !)� !(%"� !% �� !)�0!""* � � !$)%$� $%$$� � !#% � $%#$� � !%!!� $%$#� � !$%)� %()�� !&�0!""* � "� !!!%*� %()� "� !*%(� !%$!� "� !%$*� $%$#� "� !*%&� !%$$�� !"�0!""* � � !!&%$� "%$$� � !&%)� *%!(� � !%!!� $%$$� � !&%#� !%"'�� #�0!""* � !� !!!%$� %� !� !*%)� %� !� !%$'� %� !� !"%"� %�� (�0!""* � &� !#*%)� #%&"� &� !)%$� %')� &� !%$!� $%!*� &� !%*� !%'&�� '�0!""* � '� !$(%#� %&'� '� !#%$� !%!$� '� !%!$� $%$(� '� !&%$� !%")��� � $(� !""* � *$� !!!% � !%(&� $� %� %� $� %� %� #"� !)%"� $%'!�� $)� !""* � #!� !$"%&� !%'#� #!� !*%(� $%'!� #!� !%$'� $%$!� #&� !*%'� $%'$�� $'� !""* � *$� !! %*� !%# � *$� !(%&� $%((� *$� !%!$� $%$ � *$� !(%#� $%)$�� ! � !""* � #&� !$*%'� !% *� #&� ! %'� $%**� #&� !%$"� $%$!� #&� !#%"� $%)'�� !*� !""* � *$� !$)%*� !%#$� *$� ! %&� $%()� *$� !%$(� $%$!� #"� !(%"� $%&'�� !"� !""* � *$� !$'%&� !%*)� *$� !#%!� $%((� *$� !%$#� $%$!� #)� !(% � !% �� !� !""* � *$� !$(%)� !%("� *$� ! %!� $%)'� *$� !%$!� $%$#� #&� !(%*� !%# �� )� !""* � ##� !$$%#� !% !� ##� !!%$� $%*$� ##� !%$&� $%$!� #$� !#%&� !%$ �� &� !""* � *$� !$$%"� $%"(� *$� !!%#� $%##� *$� !%$"� $%$!� #"� !#%&� $%&)�� $#�0!""* � !&� !$(%)� %*)� !&� ! %&� $%&"� !&� !%$)� $%$ � !&� !*%&� $%"*�� $(�0!""* � #"� !$(%'� !%$'� #"� !#% � $%*$� #"� !%!!� $%$!� #&� !)%*� $%'!�� !$�0!""* � *$� !$ %*� !%)#� *$� ! %$� $%(&� *$� !%$&� $%$!� #"� !*%*� $%"!�� ! �0!""* � $� "&%*� !%&$� $� !$%(� $%))� $� !%$&� $%$ � !"� ! %$� !%$!�� !'�0!""* � '� !$#%*� !%' � '� !!% � $%((� '� !%$!� $%$#� '� !#% � !%#(�� !"�0!""* � *� !$(%$� #%&"� *� !#%&� !%'(� *� !%!&� $%$)� *� !&% � #%$*�-������������������������������.���.������.������.���.�����.������.���.�����.�����.���.�����.�����/

106
Appendix J (continued)���������������������������������������������������������������������������������������������������� � � � ���� � ����� �� � �� � ������ � ������ ���������������������������������� ������������������������������������ � ����� � � ����� �� � � � ��� ����� � � ���� ����� � � ���� � � � � ���� � � ��������������������������������������������������������������������������������������������������������� ��� � � � � � � � � � � � � ��� � *�0!""* � !'� !!!% � %# � !'� !*%"� $%"(� !'� !%$)� $%$#� !'� !'%)� !%##�� )�0!""* � $� !! %&� !%#&� $� !(% � $%) � $� !%$(� $%$ � $� !&%$� !%!'��� � !"� !""* � $� !$(%"� %($� $� !#%$� $%&*� $� !%$&� $%$ � $� !!%&� !%!$�� !� !""* � #� !!$%#� %")� #� !*%(� !% (� #� !%$'� $%$)� #� ! %"� *% !�� )� !""* � (� !$)%*� #%))� (� !#%$� !%*)� (� !%$)� $%$#� (� !)%$� !%"&�� &� !""* � #� !$'%'� !%')� #� !#%(� $%" � #� !%$&� $%$*� #� !#%)� %#'�� $#�0!""* � '� !!#%#� *%!"� '� !(%!� #%! � '� !%$$� $%!)� '� %"� %#"�� $(�0!""* � !(� !$"% � %$!� !(� !*%)� $%)'� !(� !%!!� $%$ � !(� $%'� !%*$�� !$�0!""* � !!� !$#%#� %$'� !!� ! %(� $%'&� !!� !%! � $%$!� !$� !$%&� !% !�� ! �0!""* � *� !$ %&� '%# � *� !#%$� %'$� *� !%!*� $%$(� #� $% � $%&)�� !'�0!""* � !� "'%$� %� !� "%"� %� !� !%$&� %� $� %� %�� !&�0!""* � *� !$#%#� !$%'!� *� !#%*� #%!)� *� !%! � $%$)� � &%#� $% &�� *�0!""* � )� !$#%#� *%!&� )� !#%*� !%(!� )� !%!"� $%$ � (� !*%'� $%" �� )�0!""* � #� "(%#� %##� #� !$% � $%" � #� !%!&� $%$(� #� &%&� $%'$����� $(� !""* � $� !$(%*� !%! � !"� !!%"� $%#"� !"� !%$ � $%$ � !� !!%$� $%"&�� ! � !""* � ')� !$"%'� $%""� ')� !#%(� $%#'� ')� !%$$� $%$!� ')� !(%#� $%($�� )� !""* � ( � !$ %&� !% $� ( � ! %'� $%*(� ( � !%!*� $%$!� ($� !$%)� $%(*�� $#�0!""* � )� !$!%&� !%**� )� !!%(� $%(!� )� !%$'� $%$ � (� !*%'� $%''�� $*�0!""* � (*� !$*%$� !%&(� (*� !!%*� $% "� (*� !%$(� $%$#� (!� !*%(� $%("���� $� !""* � $� !* %&� (% *� $� #$%(� (%#"� $� $%")� $%$ � !"� "%(� !%")�� � !""* � $� ! *%(� !%))� $� !"%!� $%&*� $� $%"&� $%$!� $� #$%&� %**�� (� !""* � $� !!&%*� %!'� $� !"%$� !%$!� $� !%!#� $%$#� $� #%'� !%!$�� '� !""* � $� !!)%'� %* � $� !*%&� $%&&� $� $%"!� $%$!� $� % � !%(#�� "� !""* � $� !!)%#� %!*� $� !*%)� $%"!� $� $%"!� $%$ � $� !%'� !%*(�� $*�0!""* � &� !!*%(� %$)� &� !*%&� $%&$� &� $%"'� $%$ � &� $%$� !%# �� $)�0!""* � #!� !!)%&� !%"&� #!� !*%&� $%'*� #!� $%"!� $%$ � #!� *% � !%$#�� $"�0!""* � $� !!)%(� #% #� $� !*% � !%$'� $� $%&&� $%$ � !)� !"%"� !% '�� !!�0!""* � $� !! %!� !%&&� $� !*%!� $%'(� $� $%"&� $%$ � !'� (%'� !%&*�� !#�0!""* � !� !$)%'� %$ � !� !#%!� $%'*� !� !%$)� $%$!� !*� $%)� !%!)�� !)�0!""* � $� !!$%'� !%"'� $� !#%)� $%'!� $� $%""� $%$!� $� %&� %$!�� !&�0!""* � $� !!$%(� !%""� $� !#%#� $%&$� $� $%"'� $%$!� $� )% � !%"$�� $�0!""* � $� !!#% � !%''� $� !*%(� $%) � $� $%""� $%$!� $� !%!� !%)'�� #�0!""* � $� !!#%!� !%*(� $� !*%#� $%*)� $� $%""� $%$ � $� !&%"� !%( �-������������������������������.���.������.������.���.�����.������.���.�����.�����.���.�����.�����/
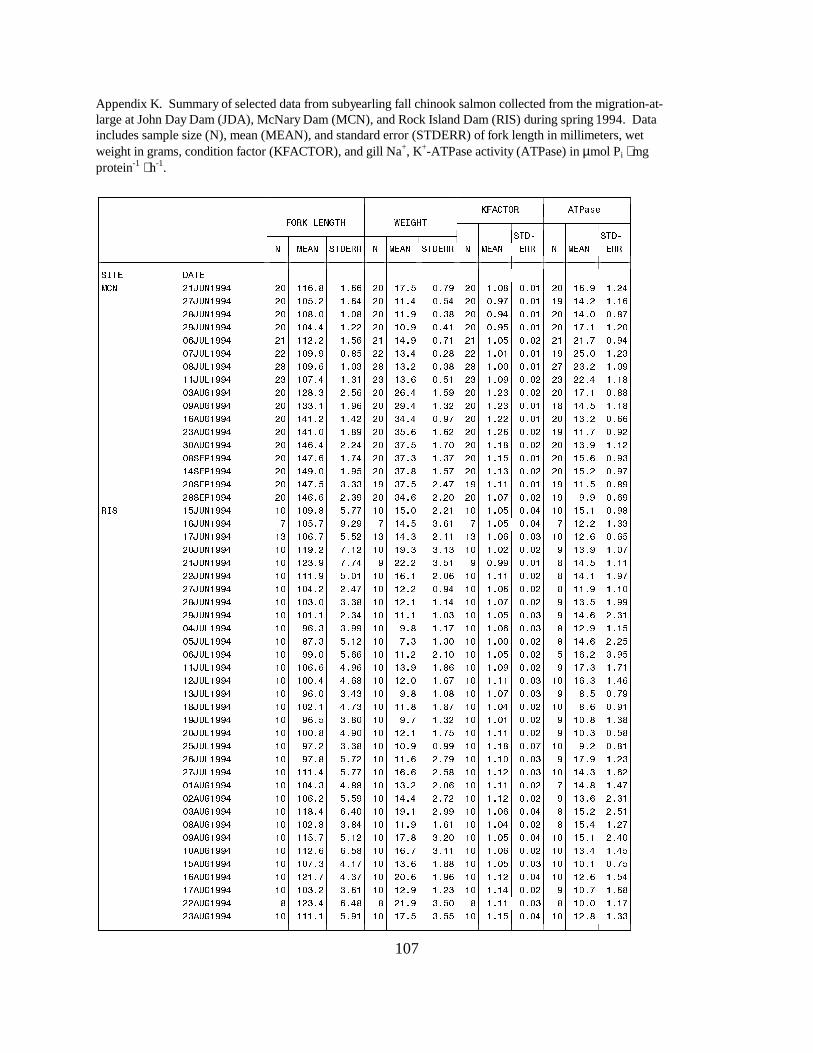
107
Appendix K. Summary of selected data from subyearling fall chinook salmon collected from the migration-at-large at John Day Dam (JDA), McNary Dam (MCN), and Rock Island Dam (RIS) during spring 1994. Dataincludes sample size (N), mean (MEAN), and standard error (STDERR) of fork length in millimeters, wetweight in grams, condition factor (KFACTOR), and gill Na+, K+-ATPase activity (ATPase) in µmol Pi ⋅ mgprotein-1 ⋅ h-1.
���������������������������������������������������������������������������������������������������� � � � ���� � ����� �� � �� � ������ � ������ ���������������������������������� ������������������������������������ � ����� � � ����� �� � � � ��� ����� � � ���� ����� � � ���� � � � � ���� � � ��������������������������������������������������������������������������������������������������������� ��� � � � � � � � � � � � � ���� !+,�!""* � $� !!)%&� !%))� $� !'%(� $%'"� $� !%$&� $%$!� $� !)%"� !% *�� '+,�!""* � $� !$(% � !%)*� $� !!%*� $%(*� $� $%"'� $%$!� !"� !*% � !%!)�� &+,�!""* � $� !$&%$� !%$&� $� !!%"� $%#&� $� $%"*� $%$!� $� !*%$� $%&'�� "+,�!""* � $� !$*%*� !% � $� !$%"� $%*!� $� $%"(� $%$!� $� !'%!� !% $�� $)+,�!""* � !� !! % � !%()� !� !*%"� $%'!� !� !%$(� $%$ � !� !%'� $%"*�� $'+,�!""* � � !$"%"� $%&(� � !#%*� $% &� � !%$!� $%$!� !"� (%$� !% #�� $&+,�!""* � &� !$"%)� !%$#� &� !#% � $%#&� &� !%$$� $%$!� '� #% � !%$"�� !!+,�!""* � #� !$'%*� !%#!� #� !#%)� $%(!� #� !%$"� $%$ � #� %*� !%!&�� $#,�!""* � $� ! &%#� %()� $� )%*� !%("� $� !% #� $%$ � $� !'%!� $%&&�� $",�!""* � $� !##%!� !%")� $� "%*� !%# � $� !% #� $%$!� !&� !*%(� !%!&�� !),�!""* � $� !*!% � !%* � $� #*%*� $%"'� $� !% � $%$!� $� !#% � $%))�� #,�!""* � $� !*!%$� !%&"� $� #(%)� !%) � $� !% )� $%$ � !"� !!%'� $%" �� #$,�!""* � $� !*)%*� % *� $� #'%(� !%'$� $� !%!&� $%$ � $� !#%"� !%! �� $&���!""* � $� !*'%)� !%'*� $� #'%#� !%#'� $� !%!(� $%$!� $� !(%)� $%"#�� !*���!""* � $� !*"%$� !%"(� $� #'%&� !%('� $� !%!#� $%$ � $� !(% � $%"'�� $���!""* � $� !*'%(� #%##� !"� #'%(� %*'� !"� !%!!� $%$!� !"� !!%(� $%&"�� &���!""* � $� !*)%)� %#"� $� #*%)� % $� $� !%$'� $%$ � !"� "%"� $%)"�� �� !(+,�!""* � !$� !$"%&� (%''� !$� !(%$� % !� !$� !%$(� $%$*� !$� !(%!� $%"&�� !)+,�!""* � '� !$(%'� "% "� '� !*%(� #%)!� '� !%$(� $%$*� '� ! % � !%##�� !'+,�!""* � !#� !$)%'� (%( � !#� !*%#� %!!� !#� !%$)� $%$#� !$� ! %)� $%)(�� $+,�!""* � !$� !!"% � '%! � !$� !"%#� #%!#� !$� !%$ � $%$ � "� !#%"� !%$'�� !+,�!""* � !$� ! #%"� '%'*� "� % � #%(!� "� $%""� $%$!� &� !*%(� !%!!�� +,�!""* � !$� !!!%"� (%$!� !$� !)%!� %$)� !$� !%!!� $%$ � &� !*%!� !%"'�� '+,�!""* � !$� !$*% � %*'� !$� ! % � $%"*� !$� !%$)� $%$ � &� !!%"� !%!$�� &+,�!""* � !$� !$#%$� #%#&� !$� ! %!� !%!*� !$� !%$'� $%$ � "� !#%(� !%""�� "+,�!""* � !$� !$!%!� %#*� !$� !!%!� !%$#� !$� !%$(� $%$#� "� !*%)� %#!�� $*+,�!""* � !$� ")%#� #%""� !$� "%&� !%!'� !$� !%$)� $%$#� &� ! %"� !%!(�� $(+,�!""* � !$� &'%#� (%! � !$� '%#� !%#$� !$� !%$$� $%$ � &� !*%)� % (�� $)+,�!""* � !$� ""%$� (%))� !$� !!% � %!$� !$� !%$(� $%$ � (� !)% � #%"(�� !!+,�!""* � !$� !$)%)� *%")� !$� !#%"� !%&)� !$� !%$"� $%$ � "� !'%#� !%'!�� ! +,�!""* � !$� !$$%*� *%)&� !$� ! %$� !%)'� !$� !%!!� $%$#� !$� !)%#� !%*)�� !#+,�!""* � !$� ")%$� #%*#� !$� "%&� !%$&� !$� !%$'� $%$#� "� &%(� $%'"�� !&+,�!""* � !$� !$ %!� *%'#� !$� !!%&� !%&'� !$� !%$*� $%$ � !$� &%)� $%"!�� !"+,�!""* � !$� ")%(� #%&$� !$� "%'� !%# � !$� !%$!� $%$ � "� !$%&� !%#&�� $+,�!""* � !$� !$$%&� *%"$� !$� ! %!� !%'(� !$� !%!!� $%$ � "� !$%#� $%(&�� (+,�!""* � !$� "'% � #%#&� !$� !$%"� $%""� !$� !%!&� $%$'� !$� "% � $%&!�� )+,�!""* � !$� "'%&� (%' � !$� !!%)� %'"� !$� !%!$� $%$#� "� !'%"� !% #�� '+,�!""* � !$� !!!%*� (%''� !$� !)%)� %(&� !$� !%! � $%$#� !$� !*%#� !%) �� $!,�!""* � !$� !$*%#� *%&&� !$� !#% � %$)� !$� !%!!� $%$ � '� !*%&� !%*'�� $ ,�!""* � !$� !$)% � (%("� !$� !*%*� %' � !$� !%! � $%$ � "� !#%)� %#!�� $#,�!""* � !$� !!&%*� )%*$� !$� !"%!� %""� !$� !%$)� $%$*� &� !(% � %(!�� $&,�!""* � !$� !$ %&� #%&*� !$� !!%"� !%)!� !$� !%$*� $%$ � &� !(%*� !% '�� $",�!""* � !$� !!(%'� (%! � !$� !'%&� #% $� !$� !%$(� $%$*� !$� !(%!� %*$�� !$,�!""* � !$� !! %)� )%(&� !$� !)%'� #%!!� !$� !%$)� $%$ � !$� !#%*� !%*(�� !(,�!""* � !$� !$'%#� *%!'� !$� !#%)� !%&&� !$� !%$(� $%$#� !$� !$%!� $%'(�� !),�!""* � !$� ! !%'� *%#'� !$� $%)� !%")� !$� !%! � $%$*� !$� ! %)� !%(*�� !',�!""* � !$� !$#% � #%)!� !$� ! %"� !% #� !$� !%!*� $%$ � "� !$%'� !%)&�� ,�!""* � &� ! #%*� )%*&� &� !%"� #%($� &� !%!!� $%$#� &� !$%$� !%!'�� #,�!""* � !$� !!!%!� (%"!� !$� !'%(� #%((� !$� !%!(� $%$*� !$� ! %&� !%##�-������������������������������.���.������.������.���.�����.������.���.�����.�����.���.�����.�����/
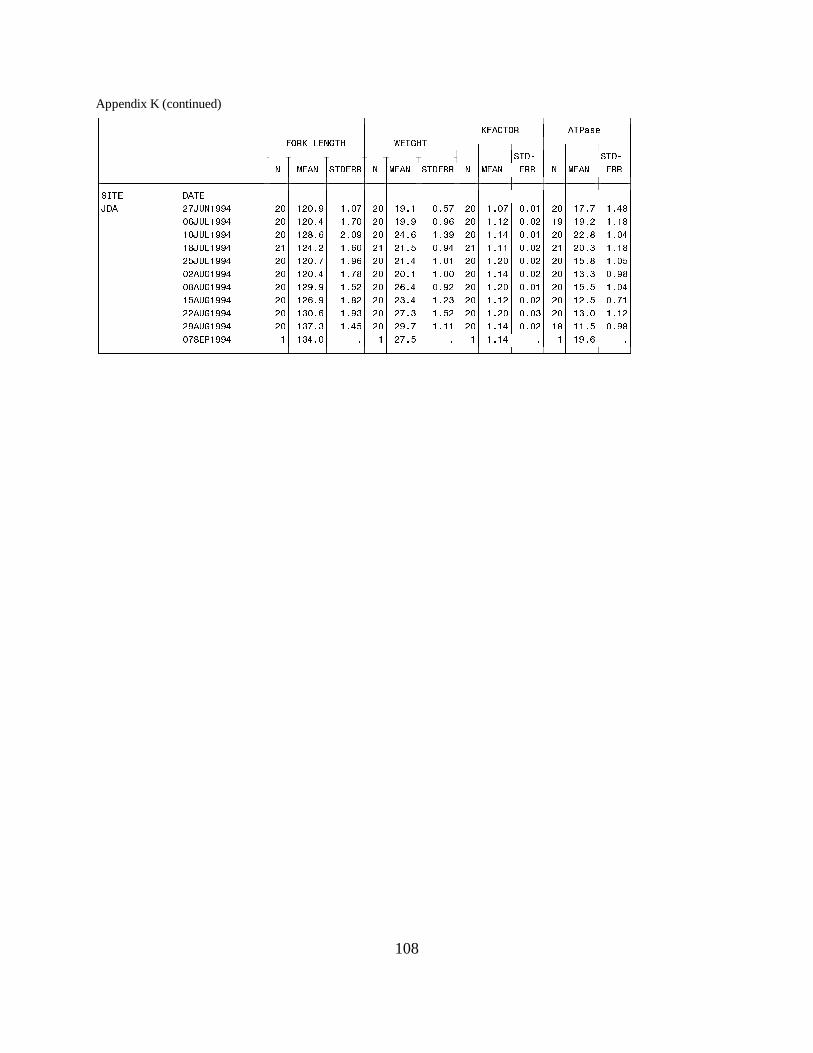
108
Appendix K (continued)���������������������������������������������������������������������������������������������������� � � � ���� � ����� �� � �� � ������ � ������ ���������������������������������� ������������������������������������ � ����� � � ����� �� � � � ��� ����� � � ���� ����� � � ���� � � � � ���� � � ��������������������������������������������������������������������������������������������������������� ��� � � � � � � � � � � � � ��+� '+,�!""* � $� ! $%"� !%$'� $� !"%!� $%('� $� !%$'� $%$!� $� !'%'� !%*&�� $)+,�!""* � $� ! $%*� !%'$� $� !"%"� $%")� $� !%! � $%$ � !"� !"% � !%!&�� !$+,�!""* � $� ! &%)� %$"� $� *%)� !%#"� $� !%!*� $%$!� $� %&� !%$*�� !&+,�!""* � !� ! *% � !%)$� !� !%(� $%"*� !� !%!!� $%$ � !� $%#� !%!&�� (+,�!""* � $� ! $%'� !%")� $� !%*� !%$!� $� !% $� $%$ � $� !(%&� !%$(�� $ ,�!""* � $� ! $%*� !%'&� $� $%!� !%$$� $� !%!*� $%$ � $� !#%#� $%"&�� $&,�!""* � $� ! "%"� !%( � $� )%*� $%" � $� !% $� $%$!� $� !(%(� !%$*�� !(,�!""* � $� ! )%"� !%& � $� #%*� !% #� $� !%! � $%$ � $� ! %(� $%'!�� ,�!""* � $� !#$%)� !%"#� $� '%#� !%( � $� !% $� $%$#� $� !#%$� !%! �� ",�!""* � $� !#'%#� !%*(� $� "%'� !%!!� $� !%!*� $%$ � !&� !!%(� $%"&�� $'���!""* � !� !#*%$� %� !� '%(� %� !� !%!*� %� !� !"%)� %�-������������������������������.���.������.������.���.�����.������.���.�����.�����.���.�����.�����/

109
Appendix L. Summary of selected data from hatchery steelhead collected from the migration-at-large at theSnake River Trap at Lewiston (LEW), Salmon River Trap (SRT), Imnaha River Trap (IMT), Grande RondeRiver Trap (GRT), Lower Granite Dam (LGR), McNary Dam (MCN), and Rock Island Dam (RIS) duringspring 1994. Data includes sample size (N), mean (MEAN), and standard error (STDERR) of fork length inmillimeters, wet weight in grams, condition factor (KFACTOR), and gill Na+, K+-ATPase activity (ATPase) inµmol Pi ⋅ mg protein-1 ⋅ h-1.
���������������������������������������������������������������������������������������������������� � � � ���� � ����� �� � �� � ������ � ������ ���������������������������������� ������������������������������������ � ����� � � ����� �� � � � ��� ����� � � ���� ����� � � ���� � � � � ���� � � ��������������������������������������������������������������������������������������������������������� ��� � � � � � � � � � � � � ����� !#� !""* � *� $ %&� (%*(� *� &*%*� (%*&� *� !%$!� $%$ � *� "%"� #%&*�� !(� !""* � (� # %)� ! % $� (�!!!% � !(%# � (� $%&)� $%$ � (� !#% � $%" �� $� !""* � !!� !#%#� )%#&� !!� "!%(� "%& � !!� $%"!� $%$!� !$� '%#� $%&$�� � !""* � !'� $)%*� *%!*� !'� &*% � (%!"� !'� $%"*� $%$!� !'� '%&� $%('�� (� !""* � !'� !!%(� #%*'� !'� &#%'� )%& � !'� $%&&� $%$(� !'� !!%$� $%"'�� '� !""* � !!� $&%&� *%#*� !!� &'%)� (%)$� !!� $%"(� $%$!� !!� !$%'� $%)'�� "� !""* � ! � $(%(� *%" � ! � '(% � '%&#� ! � $%&&� $%$'� !!� &%#� $%&(�� $ �0!""* � !#� !'% � &%#*� !#� ""%&� !$%# � !#� $%" � $%$!� ! � &%(� $%"$�� $*�0!""* � !!� !(%(� '%!*� !!� "&%*� &%""� !!� $%"(� $%$!� !!� !$%"� !%($�� $)�0!""* � ! � !)%(� (%"!� !!� "*%(� )%$(� !!� $%"'� $%$!� !!� "% � $%"*�� $"�0!""* � ! � !)%'� )%& � ! � "*%!� "%! � ! � $%"$� $%$!� ! � '% � $%'(�� !!�0!""* � ! � $"%#� '%#$� ! � &!%'� &%#*� ! � $%&(� $%$!� ! � "%)� !% (�� !#�0!""* � ! � *%$� '%*#� ! �!$*%)� "%)!� ! � $%"!� $%$ � ! � "%!� $%("�� !)�0!""* � ! � $'%&� )% )� ! � ''%'� '% &� ! � $%&*� $%$!� ! � '%*� $%**�� !&�0!""* � ! � !% � &%()� ! � " %(� !#% '� ! � $%&$� $%$!� "� !$%&� !%*(�� !"�0!""* � ! � !)%&� )%*!� !!� "$%!� "%$'� !!� $%&(� $%$!� !!� &%#� $%"$�� #�0!""* � !!� ! %#� (%")� !!� &"%!� "%#&� !!� $%"$� $%$ � !$� &% � $%)*�� (�0!""* � ! � !"%(� '%$)� ! � ")%(� ! %''� ! � $%&'� $%$ � ! � &%'� $%'&�� '�0!""* � ! � "%$� '%"*� ! �!$"%(� ! %#&� ! � $%&'� $%$ � ! � &%*� $%"!��� � !"� !""* � (� !%(� *% "� (�!$#% � )%*)� (� $%"#� $%$!� (� "%'� $%#"�� !� !""* � (� !!%&� (%#*� (� "#%$� "%)$� (� $%" � $%$ � *� &%#� $%*"�� )� !""* � #$� !#%)� #% '� #$� &)%(� *%$$� #$� $%&'� $%$!� #$� "%'� $%*"�� &� !""* � #$� $&% � *% )� #$� "!%*� (%*#� #$� $%"&� $%$!� "� &%'� $%*&�� $#�0!""* � #!� %"� #% � #!�!$$%(� *%()� #!� $%&"� $%$!� #!� "%&� $%'#�� $(�0!""* � #$� !)%&� #%( � #$� ""%$� *%)#� #$� $%"(� $%$!� &� "%#� $%')�� !$�0!""* � (� !$%(� #%"(� (� &)%&� (%$!� (� $%"!� $%$!� (� "%(� $%* �� ! �0!""* � #$� $(%*� #%#"� #$� '"%*� *%!)� #$� $%"$� $%$!� #$� "%#� $%(!�� !'�0!""* � !"� !!%'� (%'*� !"� & %!� )%'!� !"� $%&#� $%$!� !)� &%)� $%"$�� !"�0!""* � #� $"%!� (%&)� #� &#%$� )%)'� #� $%&'� $%$ � !"� &%'� $%'!�� *�0!""* � (� $"% � #%&#� (� ''%*� *%##� (� $%& � $%$!� *� &%$� $%()�� )�0!""* � (� $$%!� *%"&� (� )&%$� (% )� (� $%&!� $%$!� !� '%$� $%)'��� � !"� !""* � (� ! %!� %"!� (� "*%'� *%$(� (� $%"&� $%$!� *� "%(� $%)&�� )� !""* � (� !*%$� (%$)� (� "'% � '%!!� (� $%"(� $%$!� *� )%&� $%(&�� &� !""* � #� *%#� )%('� #�!!&%)� !*%$"� #� !%$*� $%$#� #� &%(� !%'"�� $#�0!""* � � !"%*� *%'"� �!$(%)� '%!#� � $%"'� $%$!� � '%)� $%*#�� $(�0!""* � (� $% � *%$*� (�!$&%)� )% !� (� $%""� $%$!� (� (%&� $%*$�� !$�0!""* � (� $%)� *%' � (�!$'%!� )%'&� (� $%"'� $%$!� !� )%#� $%)*�� ! �0!""* � (� !(%$� *%$$� (� ""%#� )%$'� (� $%"'� $%$!� *� '%&� $%('�� !'�0!""* � )� !(%'� *%$'� (�!$ %!� )%*#� (� $%"&� $%$!� *� )%#� $%* �� !&�0!""* � (� $&%'� #%! � (� &'%!� #%&'� (� $%"(� $%$!� #� (%'� $%*$�� *�0!""* � !� !"%$� *%!)� !�!$*%&� (%&'� !� $%"&� $%$ � !� &%'� $%()�� )�0!""* � (� '%)� *%')� (�!!&%$� &%$*� (� $%"'� $%$!� *� &%&� $%*"����� )� !""* � #$� !)%"� %''� #$�!$(%)� *%)&� #$� !%$ � $%$!� &� '%)� $%#*�� '� !""* � #$� $"%$� *%$$� #$�!$ %*� )%!#� #$� !%$"� $%$!� #$� '%'� $%'(�� &� !""* � #$� !!%&� #%('� !"� ""%*� (%"(� !"� !%$ � $%$!� #$� '%"� $%(!�� $#�0!""* � !#� !*%!� *%("� !#�!$*%(� &%#(� !#� !%$*� $%$ � !#� !$%*� $%"(�� $*�0!""* � )� !)%'� *%#!� )�!!!%)� '%#(� )� !%$)� $%$!� )� "%(� $%)*�-������������������������������.���.������.������.���.�����.������.���.�����.�����.���.�����.�����/

110
Appendix L (continued)���������������������������������������������������������������������������������������������������� � � � ���� � ����� �� � �� � ������ � ������ ���������������������������������� ������������������������������������ � ����� � � ����� �� � � � ��� ����� � � ���� ����� � � ���� � � � � ���� � � ��������������������������������������������������������������������������������������������������������� ��� � � � � � � � � � � � � ���� '� !""* � !!� ! % � '%!)� !!� & %"� "%""� !!� $%&#� $%$!� !!� !#%$� $%""�� "� !""* � ! � !$%"� (%!!� ! � &#%$� (%(*� ! � $%&'� $%$!� ! � !#% � !%#&�� $*�0!""* � !&� $&%*� )%!(� !&� &*%&� '%* � !&� $%"$� $%$ � !'� !)% � $%&#�� $)�0!""* � ! � !&%*� (% &� ! � " %!� (%)(� ! � $%&&� $%$ � ! � !#%"� !%!$�� $"�0!""* � ! � ! %#� )% '� ! � &!%'� '%&(� ! � $%&#� $%$!� ! � !!%"� !% !�� !!�0!""* � ! � !'% � (%"$� ! � " %)� '%""� ! � $%&&� $%$!� ! � !*%&� !% "�� !#�0!""* � !!� $&% � '%$*� !!� &!%&� &%*)� !!� $%&&� $%$!� !!� !)%#� !%!#�� !)�0!""* � ! � !'%&� )%*(� ! � &&%!� )%*'� ! � $%&*� $%$ � ! � !!%&� !% !�� !"�0!""* � #$� $'%&� #%&(� $� %� %� $� %� %� "� !#%#� $%"'�� $�0!""* � ! � !&%!� (% !� ! � &&%#� '%!"� ! � $%&#� $%$ � !!� !*%)� $%'!�� #�0!""* � *� $%(� % (� *� &*%)� #%!(� *� $%'"� $%$ � *� !$%'� !%*#���� )� !""* � !$� #(%#� !#%$'� !$�! )%"� !#%(&� !$� $%" � $%$ � !$� !#%#� !%#$�� $#�0!""* � $� !&%'� )%!*� $� &)%)� &%*$� $� $%'&� $%$!� $� !$%"� $%)(�� !$�0!""* � $� !'%!� )%*"� $� " %*� &%&#� $� $%&)� $%$ � !"� !!%#� !% )�� !'�0!""* � $� '%(� (%")� $� ""%!� '%&#� $� $%&!� $%$!� !"� !(%$� !%)$�� *�0!""* � $� *%'� (%$"� $� "!% � )% "� $� $%'&� $%$!� $� ! %$� $%" �� $!+,�!""* � $� #$%)� )%**� $� ")%)� &%$#� $� $%'(� $%$!� !)� !!%!� $%"'�� �� !� !""* � #� $"%$� %)(� $� %� %� $� %� %� #� !#%&� $%&&�� (� !""* � $� $"%*� *%"!� !!� &!%*� )%"*� !!� $%"$� $%$ � $� !*%&� $%"&�� )� !""* � $� %&� %'*� !"� "&%*� *%#*� !"� $%&&� $%$!� $� !(%)� $%&#�� '� !""* � !� *%"� *%*!� !�!$$%*� )% &� !� $%&)� $%$!� $� !(%)� $%)$�� &� !""* � $� #% � #%()� $� "#%"� *% (� $� $%&*� $%$ � !"� !"%!� !%#"�� $ �0!""* � !� *!%!� (%"'� $� %� %� $� %� %� $� ! % � $%')�� $#�0!""* � !"� !)%$� (%!&� !"� "#% � )%#"� !"� $%"$� $%$!� !"� !(%(� $%")�� $*�0!""* � !"� %"� *%)"� !"�!$$% � )%' � !"� $%&&� $%$!� !"� !)%*� $%&"�� $(�0!""* � $� !)%$� %("� $� &'%"� #%( � $� $%&)� $%$!� $� !*%(� $%'#�� $"�0!""* � $� !'%#� #%#!� $� &)%(� *% (� $� $%&#� $%$!� $� !(%)� !% &�� !$�0!""* � $� ! %"� *%*!� $� &)%#� (%*$� $� $%&'� $%$!� !&� !(%)� !%$)�� !!�0!""* � $� !'%*� *%#'� !"� " %$� (%('� !"� $%&)� $%$!� $� !#%)� $%&!�� ! �0!""* � !� !'%(� #%'"� !� &"%"� (%((� !� $%&(� $%$ � !� !*%(� $%"!�� !)�0!""* � $� !'%*� '%&*� !"� "*%!� !!%((� !"� $%&*� $%$!� !"� !#%"� $%&"�� !'�0!""* � $� %'� (%()� $� "'%#� '%&$� $� $%&(� $%$!� !&� !)%&� !%$!�� !&�0!""* � $� *%&� )%)&� $�!$#%!� &%"!� $� $%&)� $%$!� !"� !(%"� !%$*�-������������������������������.���.������.������.���.�����.������.���.�����.�����.���.�����.�����/

111
Appendix M. Summary of selected data from wild steelhead collected from the migration-at-large at the SnakeRiver Trap at Lewiston (LEW), Salmon River Trap (SRT), Imnaha River Trap (IMT), Grande Ronde RiverTrap (GRT), Lower Granite Dam (LGR), McNary Dam (MCN), and Rock Island Dam (RIS) during spring1994. Data includes sample size (N), mean (MEAN), and standard error (STDERR) of fork length inmillimeters, wet weight in grams, condition factor (KFACTOR), and gill Na+, K+-ATPase activity (ATPase) inµmol Pi ⋅ mg protein-1 ⋅ h-1.
���������������������������������������������������������������������������������������������������� � � � ���� � ����� �� � �� � ������ � ������ ���������������������������������� ������������������������������������ � ����� � � ����� �� � � � ��� ����� � � ���� ����� � � ���� � � � � ���� � � ��������������������������������������������������������������������������������������������������������� ��� � � � � � � � � � � � � ����� !#� !""* � *� $*%$� !$%*$� *� '(%)� !!%()� *� $%&)� $%$#� *� '%)� $%)(�� !(� !""* � � !'#%(� "%($� � * %$� '%)(� � $%'"� $%$ � � !*%(� !%$$�� $� !""* � ! � !)*%"� (%(#� ! � *$%'� *%)'� ! � $%&)� $%$ � !!� &%(� $%")�� � !""* � !'� !)"%"� #%&$� !'� *(%"� #%$!� !'� $%" � $%$ � !'� !$%&� $%&'�� (� !""* � !'� !&#%!� (%##� !'� (*% � *%"(� !'� $%&(� $%$ � !'� ! %)� !% (�� '� !""* � ! � !)*%&� (%(*� ! � *#%$� *%("� ! � $%"#� $%$ � ! � !!%*� $%&'�� "� !""* � ! � !)'% � #%) � ! � **%#� %"*� ! � $%"*� $%$ � ! � !*%'� !%((�� $ �0!""* � ! � !'$%&� *% )� ! � *)%(� #%('� ! � $%"!� $%$ � ! � !)%!� !%) �� $*�0!""* � ! � !'(%)� )%$'� ! � (!%#� (%#*� ! � $%"!� $%$!� ! � !!%$� !%$ �� $)�0!""* � ! � !'"%!� #%)'� ! � (#%*� #%( � ! � $%" � $%$ � ! � !*%"� !%##�� $"�0!""* � ! � !'*%!� (%((� ! � *&%&� *%&#� ! � $%&"� $%$ � ! � "%)� $%)#�� !!�0!""* � ! � !'$%*� #%&'� ! � *)%!� #%*$� ! � $%"!� $%$ � !!� ! % � !%$(�� !#�0!""* � !!� !)"%)� (%('� !!� *'%)� *% (� !!� $%"(� $%$ � !$� !$%*� !%$$�� !)�0!""* � ! � !'#% � #%)&� ! � *&%$� %&"� ! � $%"!� $%$ � !!� "%#� $%&(�� !&�0!""* � ! � !'$%&� #%("� ! � *(%)� #%!(� ! � $%"$� $%$ � !$� !$%&� !%!!�� !"�0!""* � ! � !)'%*� *%"(� ! � *"%(� (%$#� ! � !%$ � $%$ � ! � "%&� $%*&�� #�0!""* � ! � !)"%&� (%*$� ! � *&%$� *%)*� ! � $%"(� $%$!� "� !$%(� $%' �� (�0!""* � ! � !)&%#� #%*(� ! � *'%$� %" � ! � $%"'� $%$!� !!� "%"� $%'&�� '�0!""* � ! � !)'%#� (% !� ! � *)%&� *%$#� ! � $%"'� $%$ � !$� )%"� $%(#��� � $)� !""* � !� !*&%$� %� !� "%)� %� !� $%"!� %� !� !!% � %�� $'� !""* � !� !)$%$� %� !� #(%(� %� !� $%&'� %� !� !$%&� %�� ! � !""* � !� !'*%$� %� !� *)%)� %� !� $%&&� %� !� !$%"� %�� !"� !""* � (� !&#%"� *%$&� (� (*% � *%! � (� $%&)� $%$#� (� !$%"� $%)(�� !� !""* � (� !'(%&� #%*"� (� *'%#� %*$� (� $%&)� $%$ � (� &%&� $%**�� )� !""* � !$� !')%(� (%$'� !$� *&%)� *%*$� !$� $%&'� $%$ � !$� !$%(� !%$*�� &� !""* � !)� !')%)� *%! � !(� *"% � #%(#� !(� $%&&� $%$ � !)� ! %)� $%"(�� $#�0!""* � !� !" %$� %� !� )!%#� %� !� $%&'� %� !� !#%'� %�� $(�0!""* � � !)$%(� #%($� � * %"� #%!$� � !%$*� $%$!� � ! %(� #%("�� !$�0!""* � )� !)*%&� *%'*� )� *)%$� *%($� )� !%$!� $%$ � )� !$%*� !%(*�� ! �0!""* � !*� !)*%$� #%&&� !*� *(%)� %"!� !*� !%$ � $%$ � !*� !!%&� !%$)�� !'�0!""* � !� !'*%$� %� !� (#%'� %� !� !%$ � %� !� )%"� %�� !"�0!""* � *� !)"%$� (%#(� *� *'%&� #%*&� *� $%""� $%$#� *� !$%)� !%#(�� *�0!""* � "� !' %*� (%$'� "� *&%(� *%$"� "� $%"#� $%$#� &� &%'� !%# �� )�0!""* � )� !' %#� (%*'� )� *)%!� *% #� )� $%&"� $%$#� )� )% � $%"$��� � !"� !""* � #� !&$%&� (%"#� #� (&%"� )%('� #� $%"#� $%$!� #� "%#� $%))�� !� !""* � $� !))%!� (%!&� $� *)%)� *%"'� $� $%")� $%$!� !"� "%(� $%&(�� )� !""* � #� !*(%#� (%#)� #� "%!� #%!$� #� $%"*� $%$!� #� !#%$� #%!"�� &� !""* � &� ! "%)� !*%'(� &� )%'� )%"&� &� !%$)� $%$)� &� ! % � !%) �� $#�0!""* � #� !((%'� (% )� #� #"% � #%$(� #� $%"&� $%$!� � !#%'� !%!&�� $(�0!""* � (� !)*%'� #%($� (� **%"� %)(� (� $%"&� $%$!� (� !*%!� !%!!�� !$�0!""* � (� !*!%!� '%$#� (� # %(� *%$"� (� $%"&� $%$!� !� !$%(� $%"(�� ! �0!""* � (� !# %"� )%)!� (� "%!� *%$ � (� !%$)� $%$ � !'� !!%*� $%&!�� !'�0!""* � *� !(*%&� (%((� *� *$%&� #%'&� *� !%$ � $%$!� � &%#� $%(!�� !&�0!""* � !&� !('%)� (%#"� !&� *!%)� #%((� !&� !%$$� $%$!� !(� '%"� $%('�� *�0!""* � !!� !(#%$� *%!#� !!� #'%$� #%!*� !!� !%$!� $%$!� !!� !!% � $%'(�� )�0!""* � &� !("%(� (%()� &� *#%'� *%)$� &� !%$(� $%$!� '� !#%#� !% (�-������������������������������.���.������.������.���.�����.������.���.�����.�����.���.�����.�����/

112
Appendix M (continued)���������������������������������������������������������������������������������������������������� � � � ���� � ����� �� � �� � ������ � ������ ���������������������������������� ������������������������������������ � ����� � � ����� �� � � � ��� ����� � � ���� ����� � � ���� � � � � ���� � � ��������������������������������������������������������������������������������������������������������� ��� � � � � � � � � � � � � ����� )� !""* � #$� !'*%!� %#'� #$� (!%#� %!"� #$� $%")� $%$!� &� !$% � $%)$�� '� !""* � #$� !''%'� %&'� #$� ("%#� #%$$� #$� !%$#� $%$!� &� !$%)� $%*'�� &� !""* � "� !&$%"� #%)*� "� )#%$� #%'!� "� !%$#� $%$!� "� !!%'� $%))�� $#�0!""* � !#� !)$%'� *%!'� !#� **%'� #%#&� !#� !%$)� $%$ � ! � !)% � !%*)�� $*�0!""* � )� !'$%*� *% )� )� (#%*� *%*(� )� !%$*� $%$ � � !*%#� $%&)���� '� !""* � !#� !""%(� '%"$� !#� ))%$� &%(#� !#� $%'"� $%$!� !#� !(%)� !%!*�� "� !""* � ! � !&*%"� &%!!� ! � ('%&� &%# � ! � $%&(� $%$ � ! � !'%!� !%#"�� $*�0!""* � !)� !'(%'� (%"*� !)� ($%)� (%!"� !)� $%"$� $%$!� !)� !&%!� !%'"�� $)�0!""* � !"� !&"%*� *%&$� !"� ("%&� (%$*� !"� $%&(� $%$!� !"� !"%!� !% $�� $"�0!""* � ! � !&(%#� !$%'(� ! � )#%(� !)%"$� ! � $%&)� $%$ � ! � !)%"� !%*!�� !!�0!""* � ! � !'&%#� (%"!� ! � ( %!� (%* � ! � $%&"� $%$ � ! � !(%$� $%&*�� !#�0!""* � !#� !'#%"� (%*&� !#� ($%&� (%*"� !#� $%"#� $%$ � ! � !*%(� !%!#�� !)�0!""* � ! � !)'%&� *%")� ! � *!%&� #%&!� ! � $%&)� $%$!� ! � !(%!� !%)'�� !&�0!""* � ! � !'"%!� (%*(� ! � ($%"� *%!*� ! � $%&'� $%$ � ! � !*%(� !%#$�� $�0!""* � ! � !'(%)� '%$!� ! � *"%!� )% (� ! � $%&)� $%$ � ! � !(%&� !% #�� #�0!""* � $� !)'%*� #%& � $� *!%)� %"'� $� $%&)� $%$ � $� ! %'� $%(#���� )� !""* � !� !"$%'� *%!*� !� )*%$� *% "� !� $%"$� $%$!� !� $%(� !%$(�� $#�0!""* � !"� !"!%#� (%& � !"� )!%*� '%#'� !"� $%&#� $%$ � !"� !'%&� !% )�� !$�0!""* � !"� !'&%!� *%&*� !"� ( % � (%$"� !"� $%&&� $%$ � !&� !*%'� !% &�� !'�0!""* � !"� !&#%#� *%(*� !"� (*%(� *%(#� !"� $%&(� $%$ � !&� !'% � !%)(�� *�0!""* � $� !&)%*� #%'"� $� ('%"� #%))� $� $%&'� $%$ � $� ! %&� !%!'�� $!+,�!""* � $� !&(%(� (%#)� $� ( %&� (%#)� $� $%'"� $%$!� !)� ! %"� !%#(�� �� !� !""* � !&� !'&%'� *%!*� $� %� %� $� %� %� !&� !#%!� !%$(�� (� !""* � !&� !&)%)� (% )� !#� (*%(� (%)"� !#� $%&(� $%$ � !&� !(%"� !%#)�� )� !""* � $� !'#%!� #%)'� $� * %"� %))� $� $%&!� $%$!� $� !)%$� $%"'�� '� !""* � !"� !'"%*� (%$'� !"� *)%&� *%!'� !"� $%'&� $%$ � !"� !)%(� !%$'�� &� !""* � !� !'"%)� *% '� !� *(%"� #% (� !� $%''� $%$!� !� !&%#� !%$*�� $ �0!""* � !(� !& %"� (%!'� $� %� %� $� %� %� !(� !"%*� !%(*�� $#�0!""* � !� !''%!� #%'!� !� *'%'� %&(� !� $%&*� $%$!� !� !"%$� $%& �� $*�0!""* � !� !&*%&� (%(!� !� ((%"� (%$"� !� $%&*� $%$!� !� !"%#� $%&!�� $(�0!""* � !"� !&*%)� (%$"� !"� (*%'� *%&*� !"� $%&#� $%$!� !"� !'%(� !%!!�� $"�0!""* � !� !')%$� #% !� !� *(%&� %#'� !� $%&#� $%$!� !� !'% � $%"*�� !$�0!""* � !� !'!%&� #%))� !� *!%(� %'(� !� $%&$� $%$!� !� !*%)� $%")�� !!�0!""* � $� !&!%'� *%''� $� (!%"� *%'(� $� $%& � $%$!� !"� !&%#� !%##�� ! �0!""* � !"� !&#%#� (%))� !"� (!%*� *%"!� !"� $%&$� $%$!� !"� !)%!� !%$!�� !)�0!""* � $� !'#% � #%) � $� *)%$� #%$!� $� $%&'� $%$!� !'� !%&� !%("�� !'�0!""* � $� !')%!� #% � $� *'%(� %)&� $� $%&(� $%$!� !'� !%)� !%')�� !&�0!""* � !� !)(%#� #% $� !� #&%&� % "� !� $%&*� $%$!� !"� !"% � !%(&�-������������������������������.���.������.������.���.�����.������.���.�����.�����.���.�����.�����/

113
Appendix N.1. Summary of selected data from hatchery sockeye salmon collected at Rock Island Dam (RIS) duringspring 1994. Data includes sample size (N), mean (MEAN), and standard error (STDERR) of fork length inmillimeters, wet weight in grams, condition factor (KFACTOR), and gill Na+, K+-ATPase activity (ATPase) in µmol Pi ⋅mg protein-1 ⋅ h-1.
���������������������������������������������������������������������������������������������������� � � � ���� � ����� �� � �� � ������ � ������ ���������������������������������� ������������������������������������ � ����� � � ����� �� � � � ��� ����� � � ���� ����� � � ���� � � � � ���� � � ��������������������������������������������������������������������������������������������������������� ��� � � � � � � � � � � � � �� �� !"� !""* � !� !!$%$� %� $� %� %� $� %� %� !� )%'� %�� $� !""* � !� ! $%$� %� $� %� %� $� %� %� !� )%#� %�� !� !""* � )� !$#%&� #%! � $� %� %� $� %� %� )� &%#� *%$)�� (� !""* � &� !$*%#� !%" � &� &%*� $%( � &� $%'#� $%$!� '� '%#� !%#)�� )� !""* � "� !$ % � %' � "� &%#� $%)*� "� $%')� $%$!� "� )%"� %!)�� '� !""* � #� !!$%#� '%$)� #� "%"� !%"!� #� $%' � $%$ � #� # %)� #% '�� &� !""* � #� !$*%#� %!"� #� &%!� $%($� #� $%'!� $%$!� #� #!%)� !%(*�� $ �0!""* � )� !!(% � %*!� $� %� %� $� %� %� )� &%*� !%!)�� $#�0!""* � � !!'%$� ! %$$� � !#% � #%"(� � $%&$� $%$$� � &%#� )% *�� $*�0!""* � !� !&'%$� %� !� ("%&� %� !� $%"!� %� !� !%'� %�� $"�0!""* � "� !!(%'� #% !� "� ! %&� !%$$� "� $%&!� $%$!� "� )%'� #%*$�� !$�0!""* � !!� !!'%(� !%' � !!� !#%$� $%'$� !!� $%'"� $%$ � !!� #*%*� #%&!�� !!�0!""* � � "'%(� $%($� � '%*� $%*(� � $%'"� $%$*� !� #%$� %�� ! �0!""* � "� !!'%&� #%! � &� !#%"� !%$&� &� $%&)� $%$ � "� # %!� %$ �� !)�0!""* � )� !!"%(� #%'&� (� !#%#� !%*#� (� $%&$� $%$!� )� *#%(� !%&"�� !'�0!""* � !� ! !%$� %� !� !#%#� %� !� $%'(� %� !� #!%*� %�� !&�0!""* � )� ! *% � %)$� )� !(%(� $%&)� )� $%&!� $%$ � (� #$%$� )%$"�� #�0!""* � *� ! #%(� #%"#� *� !(%)� !%!)� *� $%&#� $%$#� *� #$%!� (% $�� *�0!""* � #� ! (%$� %#!� #� !'%$� $%()� #� $%&'� $%$ � #� *(%*� !%!#�� (�0!""* � � !#(%(� #%($� � $%#� $%)$� � $%& � $%$"� � *%#� &%$!�-������������������������������.���.������.������.���.�����.������.���.�����.�����.���.�����.�����/

114
Appendix N.2. Summary of selected data from wild sockeye salmon collected at Rock Island Dam (RIS)during spring 1994. Data includes sample size (N), mean (MEAN), and standard error (STDERR) of forklength in millimeters, wet weight in grams, condition factor (KFACTOR), and gill Na+, K+-ATPase activity(ATPase) in µmol Pi ⋅ mg protein-1 ⋅ h-1.
���������������������������������������������������������������������������������������������������� � � � ���� � ����� �� � �� � ������ � ������ ���������������������������������� ������������������������������������ � ����� � � ����� �� � � � ��� ����� � � ���� ����� � � ���� � � � � ���� � � ��������������������������������������������������������������������������������������������������������� ��� � � � � � � � � � � � � �� �� !"� !""* � "� ""%!� #%#!� $� %� %� $� %� %� "� !'%)� !%*&�� $� !""* � !$� !$$%$� #%)&� $� %� %� $� %� %� !$� !(%(� %($�� !� !""* � ! � "#%)� %'$� $� %� %� $� %� %� ! � !#%(� !%)(�� (� !""* � !&� "&%'� *%!(� !)� )%)� $% )� !)� $%'(� $%$(� !&� !'%#� !%"(�� )� !""* � !$� " % � !%($� !$� )% � $%#!� !$� $%'&� $%$!� "� !(%"� !%'*�� '� !""* � "� "(% � %$#� "� )%!� $%#"� "� $%'$� $%$!� "� #%!� #%(*�� &� !""* � !$� !$'%!� %"#� !$� !$%!� !%$&� !$� $%'"� $%$#� !$� #!%&� % #�� $ �0!""* � !$� !! %(� %$#� $� %� %� $� %� %� !$� "%*� !%$#�� $#�0!""* � !$� !$ %#� #%'*� !$� "%"� !%!*� !$� $%&"� $%$ � !$� !%#� #% (�� $*�0!""* � !$� !$)%)� *%)&� !$� !!%#� !%*!� !$� $%&"� $%$!� "� (% � *%$!�� $(�0!""* � ! � !! %(� #%$!� ! � !#% � !%!!� ! � $%"$� $%$ � ! � *% � !%&!�� $"�0!""* � !$� !!#%*� %"$� "� !#%*� $%" � "� $%&)� $%$!� !$� *%"� %$&�� !$�0!""* � !$� !!&%*� !%" � "� !*%(� $%'(� "� $%&'� $%$ � !$� #(%'� %&"�� !!�0!""* � !$� !!(%$� !%!!� !$� !*% � $%(!� !$� $%"#� $%$!� !$� (%#� %( �� ! �0!""* � !!� !$&%$� %&)� !!� !!%)� $%"$� !!� $%"$� $%$ � !!� (%'� %#&�� !)�0!""* � !$� !!)%!� #%("� !$� !*%&� !%*!� !$� $%"!� $%$ � !$� #(%&� $%& �� !'�0!""* � !$� !!)%)� !%#)� !$� !(%$� $%*&� !$� $%"(� $%$!� !$� )%'� %)#�� !&�0!""* � !$� !!"%'� !%*"� !$� !(%(� $%("� !$� $%"$� $%$!� !$� &%'� !%!#�� #�0!""* � !$� !!)%"� %$!� !$� !*%&� $%'#� !$� $%" � $%$!� !$� (%$� !%((�� *�0!""* � !$� !!"%)� %#)� !$� !)%#� !%!'� !$� $%"*� $%$ � "� '% � %$$�� (�0!""* � !$� !!'%)� %(#� !$� !'%$� !%##� !$� !%$#� $%$#� !$� !"%)� % #�� )�0!""* � !$� !!"%!� !%#(� !$� !'%$� $%)*� !$� !%$$� $%$ � !$� *%*� !%&'�-������������������������������.���.������.������.���.�����.������.���.�����.�����.���.�����.�����/
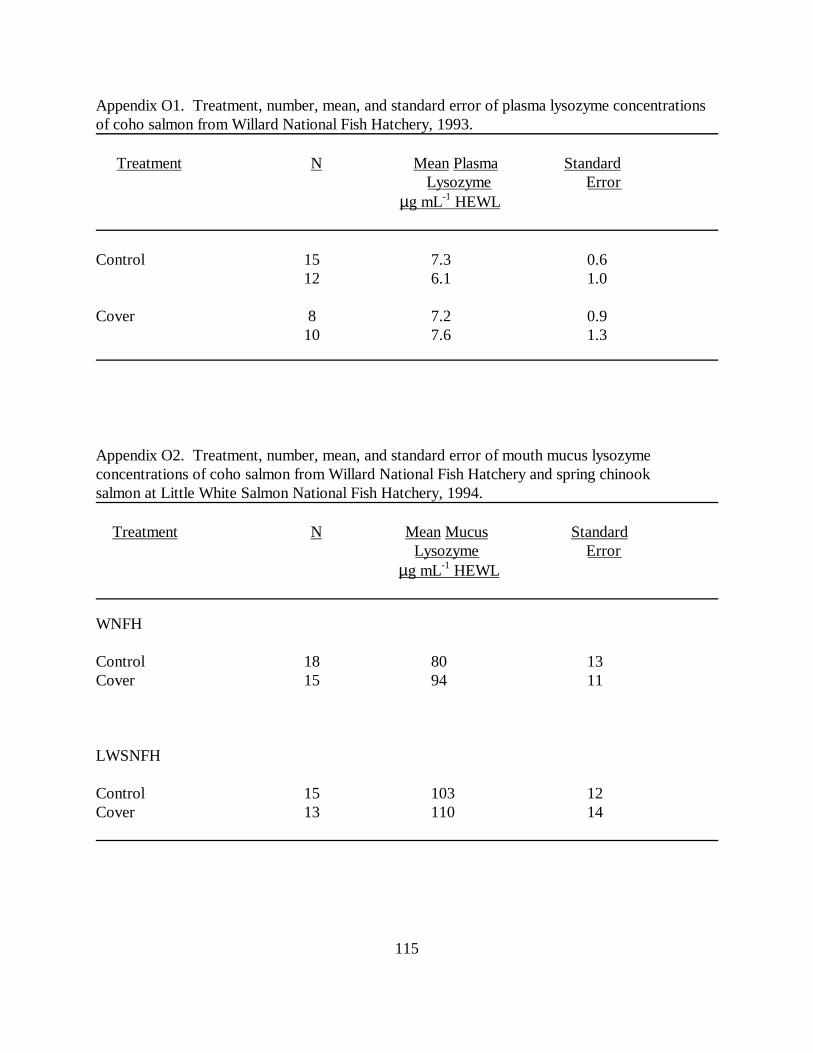
115
Appendix O1. Treatment, number, mean, and standard error of plasma lysozyme concentrationsof coho salmon from Willard National Fish Hatchery, 1993.
Treatment N Mean Plasma Standard Lysozyme Error
µg mL-1 HEWL
Control 15 7.3 0.6 12 6.1 1.0
Cover 8 7.2 0.9 10 7.6 1.3
Appendix O2. Treatment, number, mean, and standard error of mouth mucus lysozymeconcentrations of coho salmon from Willard National Fish Hatchery and spring chinooksalmon at Little White Salmon National Fish Hatchery, 1994.
Treatment N Mean Mucus Standard Lysozyme Error µg mL-1 HEWL
WNFH
Control 18 80 13Cover 15 94 11
LWSNFH
Control 15 103 12Cover 13 110 14
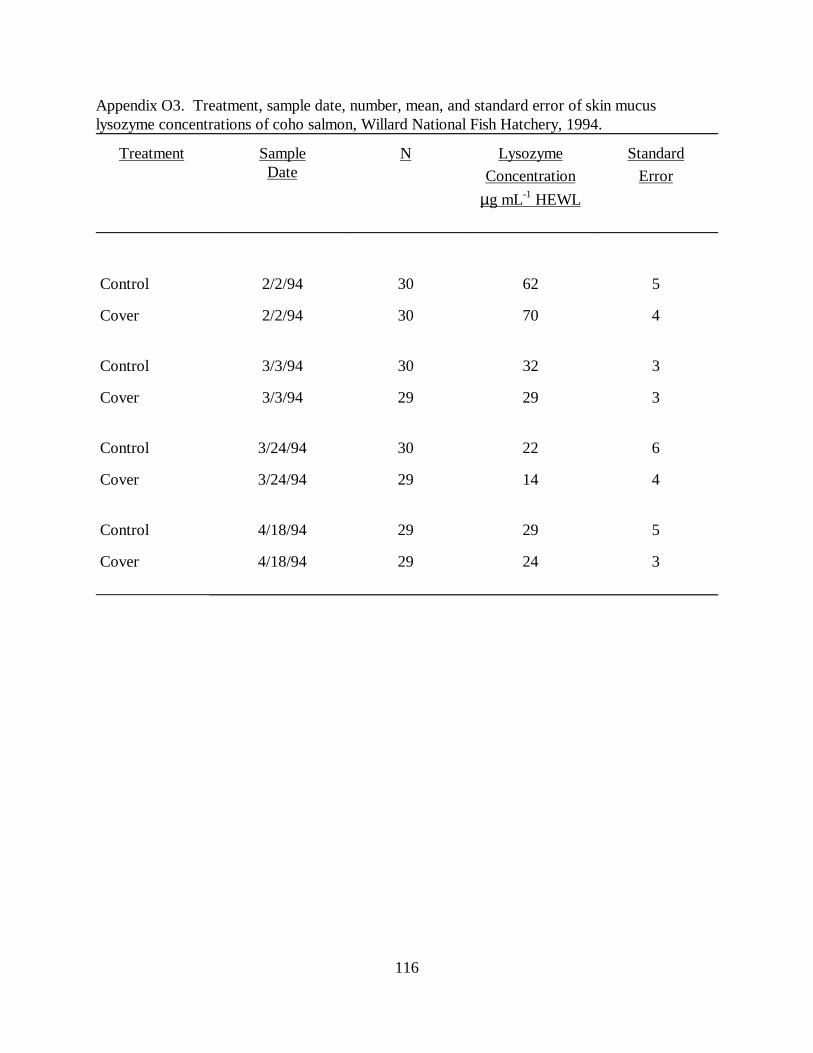
116
Appendix O3. Treatment, sample date, number, mean, and standard error of skin mucuslysozyme concentrations of coho salmon, Willard National Fish Hatchery, 1994.
Treatment SampleDate
N Lysozyme
Concentration
µg mL-1 HEWL
Standard
Error
Control 2/2/94 30 62 5
Cover 2/2/94 30 70 4
Control 3/3/94 30 32 3
Cover 3/3/94 29 29 3
Control 3/24/94 30 22 6
Cover 3/24/94 29 14 4
Control 4/18/94 29 29 5
Cover 4/18/94 29 24 3

117
Appendix O4. Treatment, sample date, number, mean, and standard error of nare mucuslysozyme concentrations of coho salmon, Willard National Fish Hatchery, 1994.
Treatment SampleDate
N Lysozyme
Concentration
µg mL-1 HEWL
Standard
Error
Control 12/21/93 9 364 60
Control 2/2/94 29 616 33
Cover 2/2/94 30 553 37
Control 3/3/94 29 404 30
Cover 3/3/94 30 437 23
Control 3/24/94 18 372 35
Cover 3/24/94 19 371 38
Control 4/18/94 26 324 23
Cover 4/18/94 30 337 24
______________________________________________________________________________

118
Appendix O5. Treatment, sample date, number, mean, and standard error of vent mucuslysozyme concentrations of coho salmon, Willard National Fish Hatchery, 1994.
Treatment SampleDate
N Lysozyme
Concentration
µg mL-1 HEWL
Standard
Error
Control 12/21/93 16 327 57
Cover 12/21/93 15 312 42
Control 2/2/94 30 284 26
Cover 2/2/94 29 204 18
Control 3/3/94 28 223 30
Cover 3/3/94 28 203 22
Control 3/24/94 30 120 9
Cover 3/24/94 29 163 17
Control 4/18/94 28 147 17
Cover 4/18/94 30 154 15
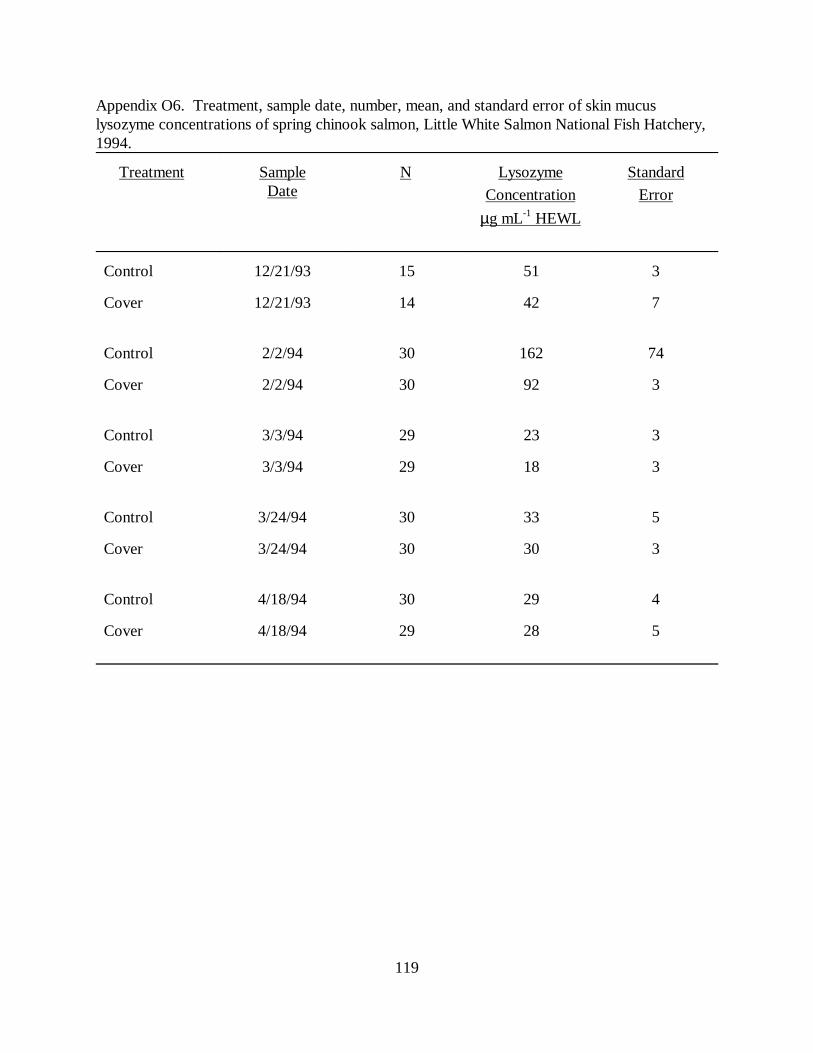
119
Appendix O6. Treatment, sample date, number, mean, and standard error of skin mucuslysozyme concentrations of spring chinook salmon, Little White Salmon National Fish Hatchery,1994.
Treatment SampleDate
N Lysozyme
Concentration
µg mL-1 HEWL
Standard
Error
Control 12/21/93 15 51 3
Cover 12/21/93 14 42 7
Control 2/2/94 30 162 74
Cover 2/2/94 30 92 3
Control 3/3/94 29 23 3
Cover 3/3/94 29 18 3
Control 3/24/94 30 33 5
Cover 3/24/94 30 30 3
Control 4/18/94 30 29 4
Cover 4/18/94 29 28 5

120
Appendix O7. Treatment, sample date, number, mean, and standard error of nare mucus lysozymeconcentrations of spring chinook salmon, Little White Salmon National Fish Hatchery, 1994.
Treatment SampleDate
N Lysozyme
Concentration
µg mL-1 HEWL
Standard
Error
Control 2/2/94 30 739 60.8
Cover 2/2/94 30 712 67.1
Control 3/3/94 30 652 52.1
Cover 3/3/94 30 516 45.6
Control 3/24/94 29 379 33.0
Cover 3/24/94 30 394 37.2
Control 4/18/94 29 291 32.5
Cover 4/18/94 30 347 34.3

121
Appendix O8. Treatment, sample date number, mean, and standard error of vent mucus lysozymeconcentrations of spring chinook salmon, Little White Salmon National Fish Hatchery, 1994.
Treatment SampleDate
N Lysozyme
Concentration
µg mL-1 HEWL
Standard
Error
Control 12/21/93 15 278 31
Cover 12/21/93 13 310 18
Control 2/2/94 30 280 26
Cover 2/2/94 30 293 30
Control 3/3/94 29 265 85
Cover 3/3/94 29 229 18
Control 3/24/94 30 229 21
Cover 3/24/94 30 170 17
Control 4/18/94 28 150 13
Cover 4/18/94 30 176 15

122
Appendix O9. Treatment, sample date, number, mean and standard error of plasma lysozymefrom spring chinook salmon challenged with Renibacterium salmoninarum in 1993.
Treatment SampleDate
N Lysozyme
Concentration
µg mL-1 HEWL
StandardError
Control 10/5/93 20 19.9 0.43
Challenged 10/5/93 20 19.5 0.83
Control 10/26/93 20 7.4 0.76
Challenged 10/26/93 20 2.3 0.14
Control 11/16/93 20 24.5 0.54
Challenged 11/16/93 20 24.5 0.84
Control 12/9/93 11 21.6 2.21
Challenged 12/9/93 9 26.2 0.62

123
Appendix O10. Treatment, sample date, number, mean and standard error of skin mucuslysozyme from spring chinook salmon challenged with Renibacterium salmoninarum in 1993.______________________________________________________________________________
Treatment SampleDate
N Lysozyme
Concentration
µg mL-1 HEWL
Standard
Error
______________________________________________________________________________
Control 7/1/93 10 1017 42
Challenged 7/1/93 13 716 104
Control 10/5/93 19 132 20
Challenged 10/5/93 20 254 46
Control 10/26/93 20 545 61
Challenged 10/26/93 20 140 32
Control 11/16/93 20 51 7
Challenged 11/16/93 20 35 6
Control 12/21/93 11 770 68
Challenged 12/21/93 9 1520 164____________________________________________________________________________________________

124
Appendix O11. Treatment, sample date, number, mean and standard error of vent mucuslysozyme from spring chinook salmon challenged with Renibacterium salmoninarum in 1993.______________________________________________________________________________
Treatment SampleDate
N Lysozyme
Concentration
µg mL-1 HEWL
Standard
Error
_____________________________________________________________________________
Control 6/10/93 20 431 82
Challenged 6/10/93 20 1473 102
Control 7/1/93 6 1187 67
Challenged 7/1/93 3 1038 138
Control 10/5/93 20 775 57
Challenged 10/5/93 19 1023 94
Control 10/26/93 20 413 39
Challenged 10/26/93 20 390 85
Control 11/16/93 20 217 24
Challenged 11/16/93 20 295 44
Control 12/21/93 11 241 60
Challenged 12/21/93 9 258 46
______________________________________________________________________________
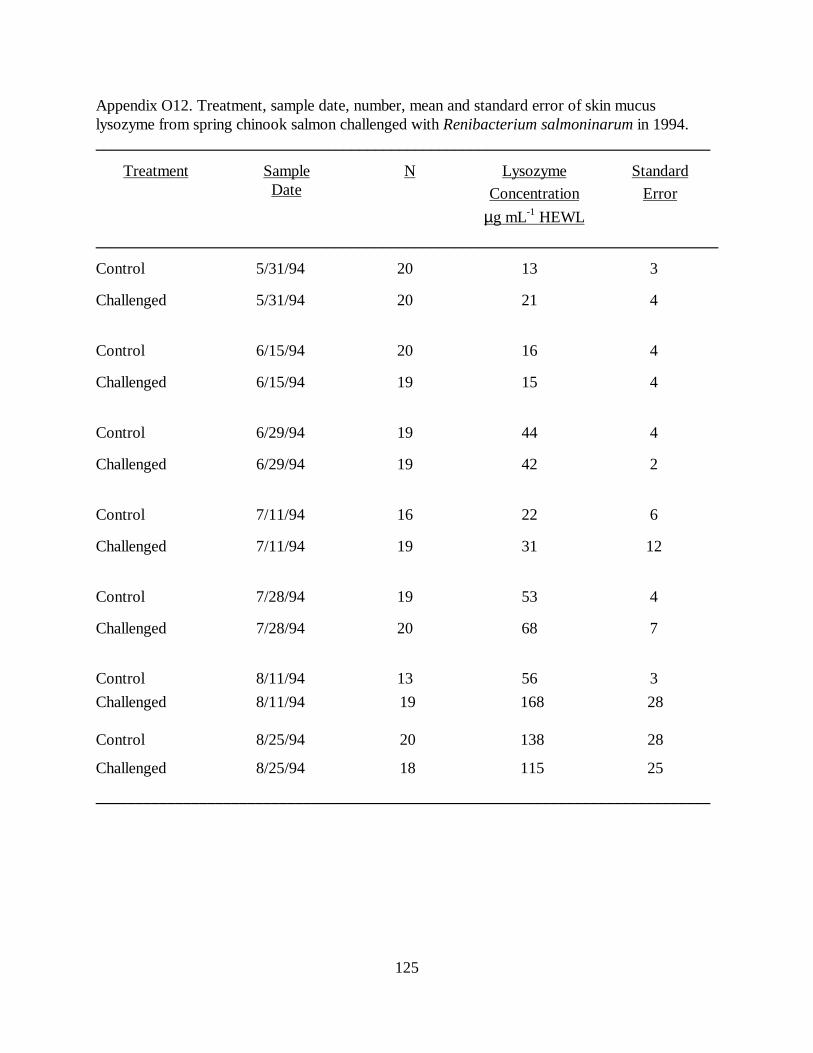
125
Appendix O12. Treatment, sample date, number, mean and standard error of skin mucuslysozyme from spring chinook salmon challenged with Renibacterium salmoninarum in 1994._____________________________________________________________________________
Treatment SampleDate
N Lysozyme
Concentration
µg mL-1 HEWL
Standard
Error
______________________________________________________________________________
Control 5/31/94 20 13 3
Challenged 5/31/94 20 21 4
Control 6/15/94 20 16 4
Challenged 6/15/94 19 15 4
Control 6/29/94 19 44 4
Challenged 6/29/94 19 42 2
Control 7/11/94 16 22 6
Challenged 7/11/94 19 31 12
Control 7/28/94 19 53 4
Challenged 7/28/94 20 68 7
Control 8/11/94 13 56 3
Challenged 8/11/94 19 168 28
Control 8/25/94 20 138 28
Challenged 8/25/94 18 115 25
_____________________________________________________________________________
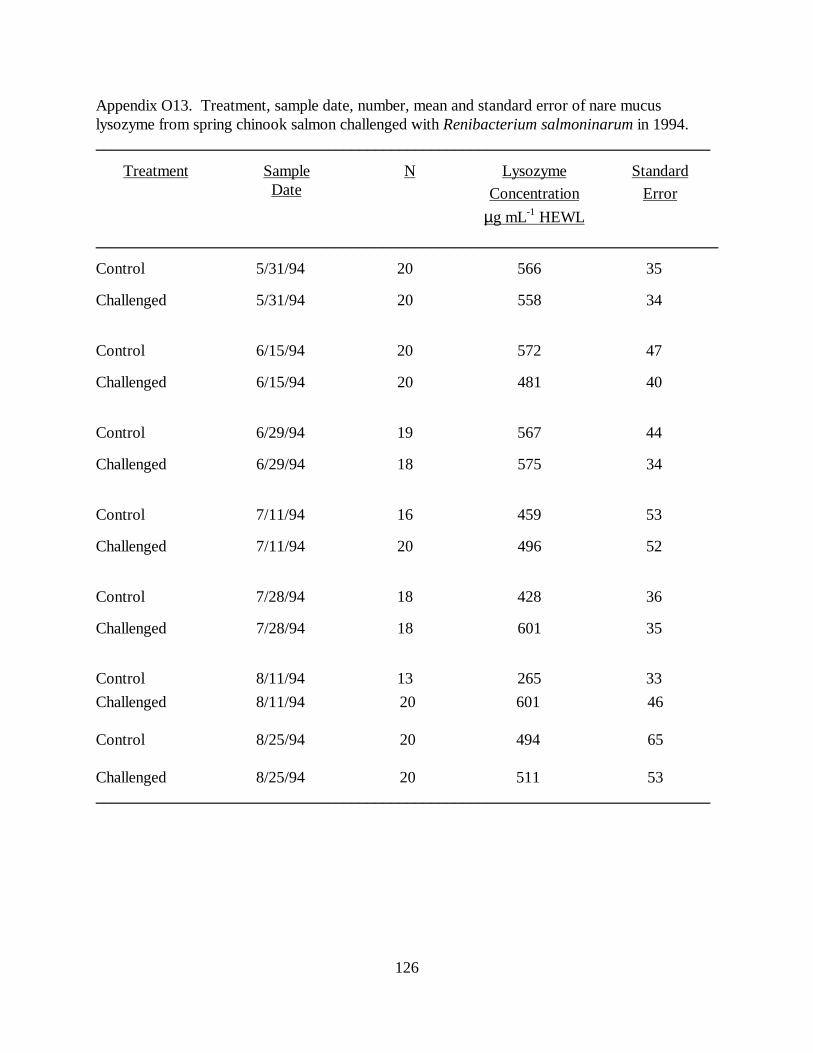
126
Appendix O13. Treatment, sample date, number, mean and standard error of nare mucuslysozyme from spring chinook salmon challenged with Renibacterium salmoninarum in 1994._____________________________________________________________________________
Treatment SampleDate
N Lysozyme
Concentration
µg mL-1 HEWL
Standard
Error
______________________________________________________________________________
Control 5/31/94 20 566 35
Challenged 5/31/94 20 558 34
Control 6/15/94 20 572 47
Challenged 6/15/94 20 481 40
Control 6/29/94 19 567 44
Challenged 6/29/94 18 575 34
Control 7/11/94 16 459 53
Challenged 7/11/94 20 496 52
Control 7/28/94 18 428 36
Challenged 7/28/94 18 601 35
Control 8/11/94 13 265 33
Challenged 8/11/94 20 601 46
Control 8/25/94 20 494 65
Challenged 8/25/94 20 511 53_____________________________________________________________________________

127
Appendix O14. Treatment, sample date, number, mean and standard error of vent mucuslysozyme from spring chinook salmon challenged with Renibacterium salmoninarum in 1994._____________________________________________________________________________
Treatment SampleDate
N Lysozyme
Concentration
µg mL-1 HEWL
Standard
Error
______________________________________________________________________________
Control 5/31/94 20 143 13
Challenged 5/31/94 20 168 20
Control 6/15/94 20 153 20
Challenged 6/15/94 20 159 23
Control 6/29/94 20 189 20
Challenged 6/29/94 20 164 24
Control 7/11/94 16 362 49
Challenged 7/11/94 19 340 46
Control 7/28/94 14 244 37
Challenged 7/28/94 7 410 65
Control 8/11/94 13 263 47
Challenged 8/11/94 20 440 54
Control 8/25/94 20 359 55
Challenged 8/25/94 20 393 44_____________________________________________________________________________

128
Appendix O15. Hatchery survey of rearing conditions for the Smolt Monitoring Programhatcheries, 1994.
Hatchery Antibiotics ChemicalBath
DiseaseEpisodes
Diet WaterSource
WaterTemp.
Dworshak Erythromycin2X21 days4/93, 9/93
100mg/kg/d
None None Reservoir(river), River
water (~1 year)
40 - 54oF
Sawtooth Erythromycin4/5/93-4/24/934.5% GM-50
Salt solution500 ppm, 1 hr
10/18-10/20/93
Saprolegnia6/93-4/94
53% mortality
Bio-productsStarter
& Grower
Well wateras swim-up, at 6 mos.
river water
Well39 - 43oF
River32 - 64oF
McCall Riverwater
38 - 52oF
Rapid River Erythromycin 4/93,7/93
TM-50
5/93, 6/93, 8/93
none fungus 8/93peak
mortality10/93
Biodiet- earlyrearing
Biomoist withEIBS vitamin
pack
Riverwater
36 - 60oF
Ringold GallimycinAquamycin
TM 100
Formalin Entero-cytozoan Biodiet StarterBioDry
BiomoistGrower
58 - 60oF
Entiat Erythromycin21 days
2/94,3/94
Formalin3/93
BKD 12/93 BiomoistStarterGrower
Medicated 4.5%Aquamycin
Spring-water
to 12/93, mixed withsurface water
36 - 50oF
Lookingglass Erythro-mycin 100mg/kg
3X 21 days 3/93,8/93, 3/94
Formalintreatment
2X 1hr/dayfor Costia
Biodiet Starter
Biomoist Grower
33 - 65oF


