Jon Gibb (River Lochy Association) The Lochy Smolt Programme

2010 Annual Report
SMOLT COLLECTION AND TRANSPORTATION AT LOWER GRANITE DAM ON THE SNAKE RIVER, WASHINGTON
Prepared by:
Michael Halter & Ches Brooks U.S. Army Corps of Engineers
and
Fred Mensik, Shawn Rapp, Alan Martin and Charles Morrill
Washington Department of Fish and Wildlife
February 2011
2
TABLE OF CONTENTS
SUMMARY……………………………………………………………………………………….3 INTRODUCTION………………………………………………………………………………...3 RIVER CONDITIONS……………………………………………………………………………3 FACILITY MODIFICATIONS…………………………………………………………………...6 FISH COLLECTION……………………………………………………………………………...6
Migration and Collection………………………………………………………………..6 Adult Fallbacks…………………………………………………………………………10 Sampling……………………………………………………………………………….12 Transportation…………………………………………………………………………14 Bypass…………………………………………………………………………………16 Incidental Species…………………………………………………………………….. 17
FISH CONDITION………………………………………………………………………………18 Descaling………………………………………………………………………………18 Other Injuries and Disease...………………………………………………………….20
Mortality………………………………………………………………………………22 RESEARCH…………...…………………………………………………………………26
FACILITY OPERATIONS AND MAINTENANCE…...………………………………………30 Turbine Operation……………………………………………………………………..30 Forebay Debris/Trashracks……………………………………………………………31 Extended-Length Submersible Bar Screens…………………………………………...31 Vertical Barrier Screens……………………………………………………………….32 Gatewells……………………………………………………………………………...32 Orifices and Collection Channel…...……………………………….…………………32 Primary Dewatering Structure…...…………………………………………………...33
Separator…………………………………………………………...………………...34 Sample System/Pit Tag System…………………………………………..…………..35 Truck/Barge Loading Operations…………………………………...………………..36
RECOMMENDATIONS………………………………………………………………………...36 ACKNOWLEDGEMENTS……………………………………………………………………...37 APPENDIX TABLES……………………………………………………………………………38 Appendix Table 1. Daily Collection and Transportation Numbers and River Conditions at Lower Granite Dam, 2010……………………………………38 Appendix Table 2. Percent Daily Descaling and Daily Facility Mortality Numbers at Lower Granite Dam, 2010………………………………………………...42
Appendix Table 3. Daily Number of Fish Trucked and Barged from Lower Granite Dam, 2010………………………………………………………..46
Appendix Table 4. Daily Number of Fish Bypassed from Lower Granite Dam, 2010……………………………………………………………...50

3
Summary
The 2010 fish collection season at Lower Granite Dam was characterized by higher than expected flow conditions, court mandated summer spill, moderate debris levels, below average water temperatures early in the season, and a below average number of smolts collected and transported. With the continued release of unclipped supplementation Chinook and steelhead above Lower Granite Dam, it is no longer possible to accurately distinguish wild Chinook, steelhead, and sockeye/kokanee in the sample. Consequently, numbers in the report tables designate fish as clipped and unclipped. A total of 3,645,277 juvenile salmonids was collected at Lower Granite Dam during the 2010 season. Of these 3,394,601 were transported to release sites below Bonneville Dam, 3,378,007 by barge and 16,594 by truck. An additional 247,129 smolts were bypassed back to the river during the season.
Introduction
Lower Granite Dam is located on the Snake River, approximately 107.5 miles upstream from the confluence with the Columbia River. Lower Granite is the first of eight dams that migratory juvenile salmonids in the Snake River and its tributaries encounter on their way to the ocean. It has one of the four juvenile fish collection and transportation facilities operated by the Corps of Engineers on the Snake and Columbia Rivers. Most of the juveniles that are collected are transported in barges and trucks to release locations below Bonneville Dam on the Columbia River. From there, they complete the remaining 140-mile journey to the ocean on their own. Other smolts are bypassed to the river by way of spill, turbine passage, or for research purposes to continue their passage to the ocean on their own.
River Conditions
Flows in the Snake River during the 2010 season were considerably better than expected due to late spring moisture making up for a low winter snowpack (Table 3). Flows exceeded the Biological Opinion target of 100 kcfs on 21 dates during 2009 and reached the 200 kcfs level on three dates. River flows for the last few days of March were between 21.9 and 36.8 kcfs – well below the norm. Flows in April averaged 41.2 kcfs and ranged between 23.9 kcfs and 73.8 kcfs. In May, river flows averaged 66.6 kcfs and ranged between 47.0 kcfs and 108.1 kcfs. River flows in June were much higher than May – averaging 128.2 kcfs and ranging between 75.4 kcfs and 208.5 kcfs. The peak average flow of the season occurred on June 6 at 208.5 kcfs. River flows in July averaged 49.8 kcfs and ranged between 38.0 and 76.2 kcfs. August flows averaged 30.6 kcfs and ranged from 24.1 kcfs to 42.7 kcfs. River flows first dropped below 20 kcfs on September 21 and averaged 24.2 kcfs for the month of September. The season’s low flow occurred on October 18 at 14.7 kcfs. Daily flows in October averaged 20.0 kcfs and peaked at 27.7 kcfs. The flow on October 31, the last day of the collection season, was 18.3 kcfs.
During 2010 flows exceeded 80 kcfs on 34 days, 90 kcfs on 27 days, 100 kcfs on 21
days, 110 kcfs on 17 days, 120 kcfs on 15 days, 130 kcfs on 12 days, 140 kcfs on 10 days, 150 kcfs on 8 days, 160 kcfs on 8 days and peaked at 208.5 on June 6 (Table 2). By comparison during 2009 flows exceeded 80 kcfs on 77 days, 90 kcfs on 55 days, 100 kcfs on 40 days, 110 kcfs on 29 days, 120 kcfs on 26 days, 130 kcfs on 25 days, 140 kcfs on 21 days, 150 kcfs on 15

4
days, 160 kcfs on nine days, and peaked at 169.4 kcfs on June 1.
Projected river flows below 65 kcfs at the beginning of the 2010 season would normally have been cause for the Corps to utilize early transport operations for fish passage at the hydroelectric projects on the Snake River. However, a Fish Operations Plan (FOP) ordered by the Court and a regional agreement led to spill operations similar to previous years. Late moisture did in fact increase river flows to a much higher level than anticipated at the beginning of the season. Spill operations at Lower Granite began on April 3 and continued on a continuous basis through the month of August. Water was spilled in excess of powerhouse capacity and court-ordered spill from June 4 to June 19, from June 21 to July 2, and from August 17 to August 20 for Doble Testing of the 500 kv power line. General fish barging operations at Lower Granite began on April 24 and continued through August 16. As directed in the 2010 Corps Fish Passage Plan and consistent with guidance provided by the Technical Management Team, the juvenile fish transportation season will have a variable start date, based on the expected river flows. During years when the average spring seasonal flow is expected to equal or exceed 65 kcfs, transportation operations at the Snake River collector dams will have a staggered start of between April 21 and May 1 at Lower Granite, Little Goose, and Lower Monumental Dams. In years when the average spring seasonal flows are expected to be below 65 kcfs, transportation operations will begin on April 3 at Lower Granite Dam.
As in 2009 formalized spring and summer testing of the RSW did not take place during 2010. Rather, the RSW was operated as an integral part of the normal April 3 through August 31 spill period. Spring spill (from April 3 through June 20) was authorized at the 20 kcfs level. Summer spill (from June 21 through August 31) was authorized at the 18.6 kcfs level with approximately 6 kcfs directed through the RSW and 12 kcfs as training spill.
5
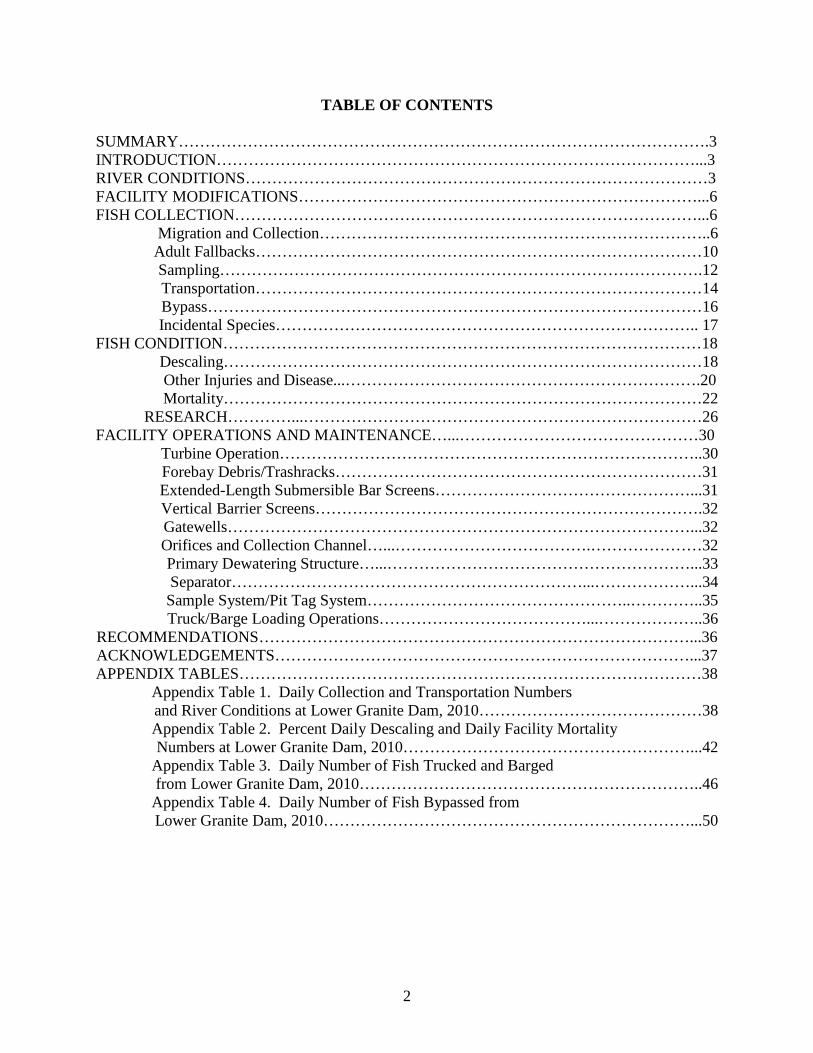
Table 3: Comparison of average monthly river flow and spill at Lower Granite Dam, 2006-2010. ‘06-09
Month 2006 2007 2008 2009 2010 Avg. Flow (kcfs) April* 110.92 48.47 51.12 79.61 39.21 72.53 May 138.13 79.93 114.30 116.45 66.59 112.21 June 91.11 47.01 129.31 116.02 128.17 95.86 July 41.57 31.76 58.76 52.15 49.78 46.06 August 27.45 24.12 37.47 32.85 30.56 30.47 September 21.36 19.53 23.62 23.47 24.17 22.00 October 18.92 19.16 20.18 22.30 19.96 20.14 Spill (kcfs) April1 33.46 16.99 15.43 16.34 13.74 20.56 May 56.06 19.84 49.85 33.25 20.45 39.75 June 30.11 19.30 57.10 30.26 46.89 34.08 July 17.72 17.02 18.66 18.68 18.78 18.02 August 15.90 12.34 18.44 18.63 16.67 16.33 September 0.39 0.21 0.43 0.27 0.27 0.33 October 0.01 0.15 0.00 0.00 0.00 0.04 * Includes March 26-31
Water temperatures in the Snake River were generally favorable for migrating juvenile salmonids during 2010. Flow augmentation and spill during the heat of the summer kept water temperatures moderated during the heat of the summer in July and August. The facility water temperature was 46.2°F at the beginning of the season on March 26 and remained below 50° until April 18 – about two weeks earlier than in 2009. Temperatures during the peak of the juvenile migration in late April and early May were in the high 40° to mid 50° range. Temperatures stayed in the low to mid 50° through the month of May and into June. Temperatures reached 60°F on June 27 – about a week later than in 2009. (Appendix 1, Table 1). Water temperatures first exceeded 65.0°F (65.7°F) on July 12. Despite high air temperatures for a few days in mid and late August, water temperatures did not reach 70º F during 2009. The peak water temperature of the year was 67.6ºF on August 15 – about 2 weeks later than in 2009. The August 15 peak water temperature compares favorably with some recent years when temperature peaks were: 2009 (69.3°F on July 31), 2008 (67.8 ºF on August 15), 2007 (68.9 ºF on July 6), 2006 (70.5°F on July 5), and 2005 (68.4°F on July 12, 15, 24). After water temperatures peaked in mid August, temperatures began to slowly taper off and remained in the low to mid 60 degree range through the rest of August, and into September. Water temperatures in October were on the high side and averaged 61.5ºF. The temperature on October 31 (the last sample day) was 55.4°F.

6
Facility Modifications The following modifications and work were made to the Lower Granite Juvenile Fish Facility and barges prior to the 2010 season: 1. Refurbished the sample diversion slide gates per PSMFC guidelines. 2. Replaced the pneumatic gate valve on raceway #4. 3. Rebuilt the snorkel seals on the barge loading boom and replaced the flexible hose. 4. Replaced the rope and sign at the separator outfall (boater BRZ). 5. Rebuilt the upstream raceway valves. 6. Constructed an aluminum bin, water supply, and pipe to the new kelt holding tanks. 7. Poured a concrete slab for the new kelt tanks. 8. Set the new kelt tanks (from the University of Idaho) into place on the concrete slab. 9. Constructed a security fence around the kelt facility. 10. Changed the orientation of the boom winch so that the bearings get oil. 11. Added fire extinguisher boxes to the outside of the engine house on all barges. 12. Installed new strainer seals on fish barges 2127 and 2817. 13. Repaired the oil filter housing leaks on engines #2 and # 4 on fish barge 8106. 14. Replaced the plunger in the starboard center hold on fish barge 8107. 15. Repaired the deck wash system on fish barge 8107. 16. Replaced the drive line u-joints on all the fish barges.
Fish Collection Migration and Collection The juvenile fish bypass gallery was watered up on March 17. Fish were bypassed through the 72-inch pipe at the base of the separator (primary bypass) until 0700 hours on March 25, when the separator was watered-up and fish sampling (only) activities began. With the exception of sample fish, all fish were bypassed back to the river until late April. Fish barging operations from Lower Granite followed a somewhat different schedule than in recent years. The first research barge departed Lower Granite on April 22. Collection for general transport began on April 23 and every other day barging began on April 24. Every day barging quickly followed on April 26. Collection activities did take place to provide research fish for NOAA-Fisheries marking operations prior to the beginning of collection for transport but only for one trip. Fish were collected for marking for the Skamania Index Barge Study (transport study). Fish were collected 2-3 days before the actual transport date in order to allow the marking crews time to mark and handle the fish. Skamania index barging took place on April 22 (prior to regular barging). When fish were not being collected for research, all fish other than sample fish were returned to the river by way of secondary bypass (bypass through the outfall pipe to the river). Fish were collected for numerous other studies after general collection began but this had no effect on the general operation of the facility. After normal collection activities began, these fish were handled as part of the regular collection and diverted to the upstream raceways for marking operations. Collection

7
ended at 0700 hours October 31. An estimated 3,645,277 juvenile salmonids were collected at Lower Granite Dam during the 2010 operating season. The 2010 species collection included: 1,193,654 clipped yearling chinook, 428,713 unclipped yearling chinook, 176,115 clipped subyearling fall chinook, 454,408 unclipped subyearling chinook, 1,008,668 clipped steelhead, 349,497 unclipped steelhead, 1,925 clipped sockeye/kokanee, 3,932 unclipped sockeye/kokanee and 28,365 coho (Table 8). In general fish collection numbers were well below the 2009 level. Unclipped subyearling chinook was the only species group in which collection was higher than in 2009. Collection numbers decreased significantly for all other species groups. Daily collection and river flow information is provided in Appendix 1, Table 1. Peak collection dates during 2010 were considerably different from previous years with fish numbers for several species peaking out of the norm (Table 9). The peak total daily collection of 183,000 occurred on May 21 – about two weeks later than normal. May 21 was also the peak collection date for unclipped sockeye/kokanee (800), clipped steelhead (81,800), and unclipped steelhead (23,600) . It is the latest peak collection day in five years. Both clipped and unclipped subyearling fall Chinook collections peaked on June 5 and each was the third latest in the last five years. Clipped and unclipped steelhead and clipped and unclipped sockeye collections peaked the latest in the last five years and the combined coho peak collection day was the second latest in the last five years. In 2010 the collections peaked for all species groups before the peak flows of the season on June 6. However clipped sockeye and clipped and unclipped subyearling fall Chinook peak collection coincided with this season's peak flow. In 2009 the peak collection day for all species groups occurred before the peak flows of the season. This is the only year in the last five in which subyearling fall Chinook collection coincides with the peak flows. In 2008 the peak collection day for all species groups except clipped and unclipped subyearling fall Chinook also occurred before the peak flows of the season.

8
Table 8. Annual collection, bypass, and transport at Lower Granite Dam, 2006-2010. Yearling Subyearling1
Chinook Chinook Steelhead Sockeye/Kokanee2 Coho Year Clipped Unclipped Clipped Unclipped Clipped Unclipped Clipped Unclpd All Total Collection 2006 1,934,093 473,625 2 0 7 , 8 8 6 277,287 2,257,334 563,280 7,428 25,272 51,179 5,797,384 2007 1,267,755 310,619 5 9 , 2 0 0 142,039 1,003,671 6 364,127 13,753 2,186 38,308 3,201,658 2008 1,913,873 484,791 1 5 2 , 7 9 2 282,084 1,675,433 0 490,012 10,424 3,934 68,833 5,082,176 2009 1,836,874 515,775 2 6 0 , 4 3 1 450,943 2,673,278 7 756,926 17,767 15,734 65,933 6,593,661 2010 1,193,654 428,713 1 7 6 , 1 1 5 454,408 1,008,668 9 349,497 1,925 3,932 28,365 3,645,277 Bypass 2006 305,031 132,042 8,214 9,280 255,947 96,100 207 6,035 4,214 817,070 2007 335,966 115,143 7,319 37,255 139,532 42,202 1 355 1,432 679,205 2008 326,382 99,567 344 9,040 288,065 89,866 203 249 1,849 815,565 2009 606,548 241,406 207 20,069 1,254,742 333,032 30 7,038 1,951 2,465,023 2010 161,676 30,184 33 6,880 31,194 17,151 0 11 0 247,129 Truck 2006 4 4 215 6,422 7 10 43 34 12 6,751 2007 57 226 189 7,017 6 8 18 1 33 7,555 2008 0 31 62 16,166 6 29 0 851 33 17,178 2009 2 10 329 6,069 1 7 27 22 233 6,700 2010 16 6 72 16,403 2 14 0 64 17 16,594 Barge 2006 1,623,107 340,755 198,693 260,674 2,000,167 467,004 7,122 18,667 46,809 4,962,998 2007 929,994 195,037 51,279 102,186 863,756 321,795 13,720 1,820 36,823 2,509,393 2008 1,582,205 384,695 149,429 252,309 1,386,704 399,905 10,204 2,661 66,905 4,235,017 2009 1,227,039 273,887 258,128 422,152 1,418,158 423,803 17,650 8,519 63,607 4,112,943 2010 1,030,557 398,227 175,667 429,964 977,239 332,244 1,922 3,850 28,337 3,378,007 Total Transported 2006 1,623,111 340,759 198,908 267,096 2,000,174 467,014 7,165 18,701 46,821 4,969,749 2007 930,051 195,263 51,468 95,169 863,762 321,803 13,738 1,821 36,856 2,516,948 2008 1,582,205 384,726 149,491 268,475 1,386,710 399,934 10,204 3,512 66,938 4,252,195 2009 1,227,041 273,897 258,457 428,221 1,418,159 423,810 17,677 8,541 63,840 4,119,643 2010 1,030,573 398,233 175,739 446,367 977,241 332,258 1,922 3,914 28,354 3,394,601
Morts Facilit 1,044 242 343 1,142 225 79 3 7 11 3,096 Res/Sa 361 54 0 19 8 9 0 0 0 451 Note: ‘Res/Sac’ refers to research sacrificed fish and incidental research mortalities (handling and/or tagging). These fish were taken from the general collection only. Additional sacrificed research fish taken from the Sort-By-Code tank are summarized in the research section of this report.

9
Table 9. Annual peak collection days at Lower Granite Dam, 2006-2010.
Yearling Subyearling Chinook Chinook Steelhead Sockeye/Kokanee Coho
Year Clipped Unclipped Clipped Unclipped1 Clipped Unclipped Clipped Unclipped All Total
2006 May 8 May 1 June 4 June 4 May 5 May 5 May 12 May 19 May 19 May 5 (161,800) (23,200) (14,700) (29,700) (142,200) (29,400) (1,400) (1,800) (5,000) (290,200)
2007 May 4 May 4 June 6 June 5 May 3 May 4 May 15 May 13 May 14 May 4 (149,200) (24,800) (6,920) (9,100) (88,800) (32,000) (2,400) (400) (6,400) (286,600)
2008 May 8 May 8 June 16 July 5 May 6 May 10 May 20 May 10 May 8 May 8 (167,000) (39,200) (7,900) (10,680) (92,200) (29,000) (1,800) (400) (11,000) (305,800)
2009 May 15 April 26 May 29 May 30 April 24 April 24 May 20 May 21 May 21 24 April (112,000) (29,000) (13,600) (21,600) (182,000) (68,400) (3,200) (1,200) (8,200) (322,800)
2010 April 28 April 28 June 5 June 5 May 21 May 21 June 6 May 21 May 20 May 21 (73,800) (25,200) (23,700) (40,200) (81,800) (23,600) (400) (800) (4,800) (183,000)
1Includes unmarked (unclipped) hatchery subyearling Chinook from 2006 - 2010. Figure 6. Daily juvenile salmonid collection, all species combined, versus daily average river flow at Lower Granite Dam, 2010.
0
50
100
150
200
250
0
20000
40000
60000
80000
100000
120000
140000
160000
180000
200000
26-Mar 26-Apr 26-May 26-Jun 26-Jul 26-Aug 26-Sep 26-Oct
Rive
r Flo
w
Fish
Col
lect
ion
Fish Collection River Flow

10
Adult Fallbacks
A total of 6,893 adult salmonids were removed from the Lower Granite separator through the morning of October 31 compared to 12,236 in 2009, only about half as many (Table 10). Clipped steelhead were the most abundant adult salmonid removed from the separator and made up 38.9% of the total salmonid fallbacks. Unclipped steelhead were second in abundance and made up 36.7% of the fallbacks. The numbers of fallbacks for all Chinook and steelhead species groups decreased while coho and sockeye fallback numbers increased compared to 2009. Most of the Chinook fallbacks occurred in September and October. Clipped steelhead fallback numbers were highest in May and October while unclipped steelhead fallback counts were highest in May (Table 11). Table 10: Annual totals of adult Chinook, steelhead and coho released into the river from the juvenile fish wet separator at Lower Granite Dam, 2006-2010.
Adult Chinook Jack Chinook Steelhead Coho Clipped Unclipped Clipped Unclipped Clipped Unclipped All Totals
2006 199 114 62 60 2,870 2,465 0 5,770 2007 138 153 160 120 1,449 943 18 2,981 2008 578 447 720 589 1,885 1,396 25 5,6461 2009 1,903 1,495 1,024 617 4,311 2,971 4 12,2361 2010 779 523 226 129 2,683 2,527 15 6,8932
06-09 avg. 705 552 492 347 2,629 1,944 12 6,658 1Includes one sockeye. 2Includes 11 sockeye All adult and jack fallback salmonids were superficially examined for condition before being released from the separator and 87.8% of the salmonids released from the separator were classified as in either good or fair condition compared to 95.2% in 2009, 93.8% in 2008, 83.6% in 2007, 83.0% in 2006 and 86.6 % in 2005 (Table 12).
Adult fallbacks that passed through the separator bars are not counted by COE separator
technicians and are not included in the numbers in these tables. Some fallback salmonids passed into raceways and were transported but not counted, while others entered the sample system and were counted as incidental fish. A total of 221 salmonid fallbacks were counted in the daily samples during 2010 including 80 clipped Chinook jacks, 110 unclipped Chinook jacks, 14 clipped Chinook minijacks, 12 unclipped Chinook minijacks, 2 clipped steelhead and three unclipped coho. This compares to the 323 salmonid fallbacks that were counted in daily samples in 2009 and 1,587 in 2008. The large decrease in salmonids observed in the sample is due to our use of additional separator bars spaced closer together that lay over the regular separator bars from Sept. 28 to the end of the season in 2009. These bars effectively keep the Chinook jack and minijack fallbacks out of the sample collection tank. In 2010 we did not use these bars but due

11
to the lower run size of Chinook jacks, fewer fell back across the separator. It is necessary to remove fallbacks from the sample tank before they are anesthetized with MS-222 due to a sport fishery above and below LGR and the recommended 21 day waiting period for food fish prior to human consumption (as identified in the Argent Chemical Laboratories MS-222 protocols).
Table 11. Monthly totals of adult salmonids released from the juvenile fish separator at Lower Granite Dam, 2010.
Adult Chinook Jack Chinook Steelhead Coho Totals Clipped Unclipped Clipped Unclipped Clipped Unclipped All Month April 7 1 0 0 310 488 0 8061 May 59 16 7 1 640 1,015 0 1,738 June 87 30 2 0 76 434 0 629 July 32 6 5 2 38 30 0 1222 August 4 1 0 1 325 145 0 4773 September 148 169 91 50 560 177 7 1,202 October 442 300 121 75 734 238 8 1,9193 Totals 779 523 226 129 2,683 2,527 15 6,893
1 Includes March 26-March 31 2 Includes nine sockeye. 3 Includes one sockeye. Table 12. Condition of adult salmonids released from the juvenile fish separator at Lower Granite Dam, 2010.
Adult Chinook Jack Chinook Steelhead Coho Clipped Unclipped Clipped Unclipped Clipped Unclipped All Totals Good 672 471 213 120 1,797 1,370 15 4,6692 Fair 55 39 11 6 557 713 0 1,381 Poor 51 10 2 3 298 422 0 786 Dead 1 3 0 0 31 22 0 57 Total1 779 523 226 129 2,683 2,527 15 6,893
1 Includes March 26-March 31. 2 Includes 11 sockeye.

12
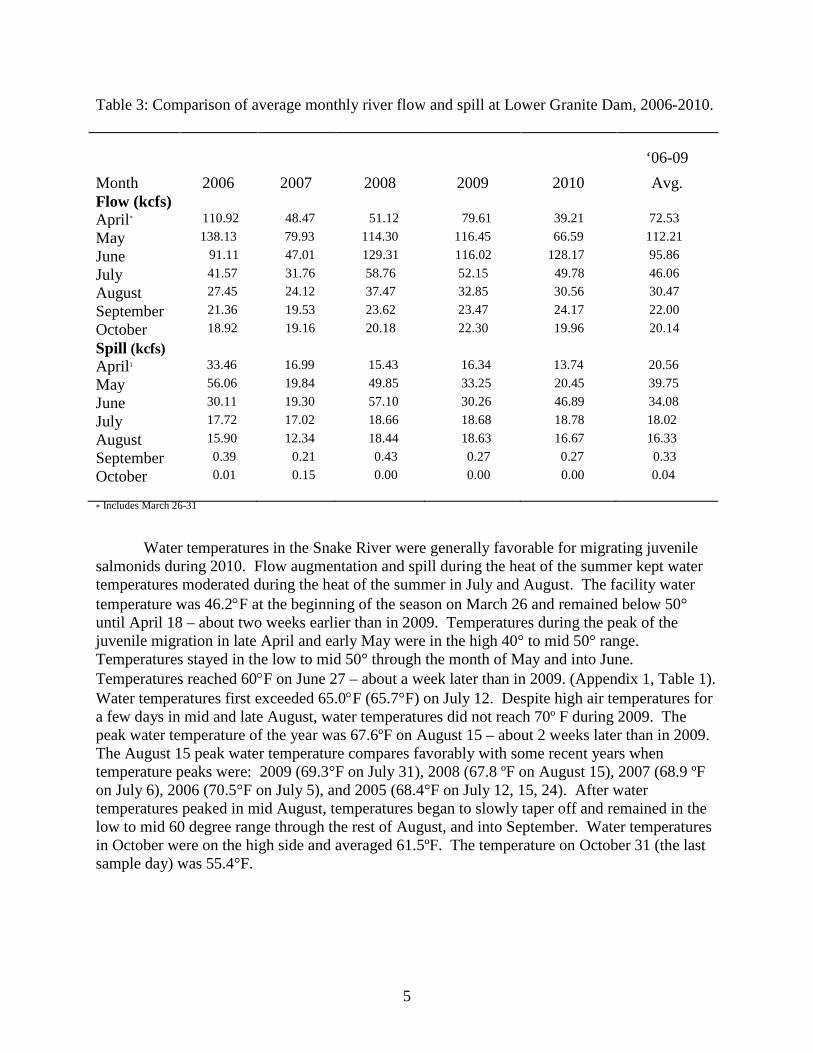
Sampling Sampling at LGR Juvenile Fish Facility (JFF) began at 0700 hours March 26 and ended at 0700 hours on October 31. A total of 220 daily samples were processed by the WDFW smolt monitors this season. The sample rate was set at 10% on March 26, increased to 20% on March 27 and fluctuated throughout the season based on guidelines provided by the Fish Passage Center (FPC) and daily numbers (Table 14). After August 16, the last barge trip of the season, smolts were transported by truck every other day. The sample rate was elevated to 100% on August 17 when fish collection decreased to the point that fish could be transported every other day and working up the samples every other day would not impact fish trucks leaving early enough in the morning to reach Bonneville in a timely manner. Each day’s collection was kept separated in the sample tank and on the day of transport, each day’s collection was sampled separately. Due to increases in collection, the sample rate was dropped to less than 100% on September 21, October 5-9, and October 11-13.
During 2010 the smolt monitors sampled 66,295 smolts, 1.8% of the total collection compared to 70,866 smolts (1.1%) in 2009, 97,421 smolts (1.9%) in 2008, 71,798 smolts (2.2%) in 2007 and 76,119 smolts (1.3%) in 2006 (Table 9). The total number of smolts sampled in 2010 by species included: 9,206 clipped yearling Chinook, 3,398 unclipped yearling Chinook, 3,995 clipped subyearling fall Chinook, 37,890 unclipped subyearling fall Chinook, 8,058 clipped steelhead, 3,304 unclipped steelhead, 30 clipped sockeye, 120 unclipped sockeye/kokanee and 294 coho (Table 10). Table 13. Annual percentage of total juvenile salmonids collected that were sampled at Lower Granite Dam, 2006-2010.
Yearling Subyearling Chinook Chinook Steelhead Sockeye/Kokanee Coho
Year Clipped Unclipped Clipped Unclipped Clipped Unclipped Clipped Unclipped All Total
2006 0.7 1.2 4.9 8.5 0.8 0.9 1.5 1.6 1.2 1.3 2007 1.0 1.8 9.8 22.0 1.1 1.3 1.3 2.4 1.7 2.2 2008 0.8 1.0 4.9 17.4 0.9 1.1 1.2 28.3 0.7 1.9 2009 0.7 0.8 2.5 5.4 0.6 0.8 0.8 1.8 1.7 1.1 2010 0.8 0.8 2.3 8.3 0.8 0.9 1.6 3.1 1.0 1.8 06-09 0.8 1.2 4.4 11.1 0.8 0.9 1.1 4.0 1.3 1.5
13
Table 14. Weekly sample rates in percent and sample totals at Lower Granite Dam, 2010. Weekly Yearling Subyearling Week Rate Chinook Chinook Steelhead Sockeye/Kokanee Coho Ending (%) Clipped2 Unclp’d Clipped2 Unclp’d1 Clipped2 Unclp’d1 Clipped2 Unclp’d1 All Totals
4/01 10.0 3 9 0 2 6 17 0 0 0 37 4/08 20.0 91 54 0 2 45 23 0 1 0 216
4/15 20.0 269 93 0 35 91 105 0 1 0 594 4/22 11.3 570 250 0 28 347 105 0 0 0 1,300 4/29 0.6 2,099 779 0 28 1,368 421 0 0 3 4,698 5/06 0.5 1,634 477 0 3 830 207 0 0 12 3,163 5/13 1.1 1,864 388 0 7 1,075 293 0 0 12 3,639 5/20 1.0 1,917 554 4 10 1,095 408 0 9 93 4,090 5/27 0.6 514 420 17 49 1,231 539 3 9 52 2,834 6/03 2.0 151 200 543 1,129 729 356 14 13 33 3,168 6/10 0.8 33 67 680 1,323 724 212 4 3 22 3,068 6/17 3.7 25 60 820 1,730 247 262 8 8 23 3,183 6/24 4.0 16 34 991 1,972 224 247 1 3 10 3,498 7/01 4.6 3 4 359 1,190 30 67 0 3 6 1,662 7/08 6.4 0 2 260 1,482 8 14 0 0 5 1,771 7/15 10.0 0 0 138 1,992 3 8 0 0 0 2,141 7/22 10.0 1 1 47 1,656 0 1 0 2 1 1,709 7/29 18.6 0 2 14 1,639 2 1 0 1 0 1,659 8/05 37.1 0 0 11 1,495 0 0 0 3 2 1,511 8/12 50.0 1 0 9 1,013 1 3 0 0 0 1,027 8/19 71.4 0 0 7 1,646 1 3 0 2 6 1,665 8/26 100.0 1 0 11 1,552 0 1 0 2 2 1,569 9/02 100.0 0 0 8 966 0 0 0 2 3 979
9/9 100.0 0 0 3 942 0 2 0 5 2 954 9/16 100.0 1 0 7 1,074 0 0 0 2 0 1,084 9/23 100.0 3 2 28 4,780 0 2 0 2 4 4,821 9/30 92.9 1 0 6 1,007 1 0 0 8 1 1,024
10/07 78.6 3 0 15 3,626 0 4 0 8 1 3,657 10/14 65.9 2 2 7 2,368 0 0 0 9 0 2,388 10/21 100.0 1 0 2 900 0 0 0 6 1 910 10/28 100.0 3 0 5 1,161 0 2 0 11 0 1,182 10/31 100.0 0 0 3 1,083 0 1 0 7 0 1,094
Total 9,206 3,398 3,995 37,890 8,058 3,304 30 120 294 66,295 1Wild Chinook, wild steelhead and wild sockeye/kokanee designated in text as unclipped. 2Hatchery Chinook, hatchery steelhead and hatchery sockeye/kokanee designated in text as clipped.

14
Transportation An estimated 3,394,601 juvenile salmonids (93.1% of fish collected) were transported from Lower Granite in 2010. This is proportionately much higher than in 2009 when large numbers of juveniles passed the dam prior to the beginning of fish transportation activities on May 1. The numbers of fish and the percentages transported of each species group in 2010 were: 1,030,573 clipped yearling Chinook (86.3%), 398,233 unclipped yearling Chinook (92.9%), 175,739 clipped subyearling fall Chinook (99.8%), 446,367 unclipped subyearling fall Chinook (98.2%), 977,241 clipped steelhead (96.9%), 332,258 unclipped steelhead (95.1%), 1,922 clipped sockeye (99.8%), 3,914 unclipped sockeye/kokanee (99.5%) and 28,354 coho (100%).
The COE and NMFS transported fish by barge for research purposes only on April 22. Fish collection activities for general transport began at 0700 hours on April 23. The general transportation program began April 24. There was no barging on April 25. We then barged fish every day from April 26 to May 28 and every other day from May 30 to August 16. Trucking was done every other day from August 18 through the end of the season October 31. All trips were made with the 300 gallon pickup mounted tank except for September 19, September 21, October 5, and October 9 when fish numbers increased and on October 3 when Little Goose's fish numbers increased and they had too many fish for their 300 gallon pickup tank.
During 2010 both the 4000 and 2000 series fish barges were direct-loaded at Little
Goose Dam during the month of May. Due to regional concerns over juvenile fish migration times, fish barging operations did not begin at Little Goose until May 2 and not until May 5 at Lower Monumental. Fish barging operations at McNary do not begin until river conditions are “no longer spring like”. In 2010 fish barging at McNary began on July 16. Fish barging operations at all sites continued until mid August. The last barge for all sites left Lower Granite on August 16.
An estimated 3,378,007 (99.9%) of the juvenile salmonids transported were barged from
Lower Granite in 2010 compared to 4,111,943 (99.8%) in 2009, 4,235,017 (99.6%) in 2008, 2,509,393 (99.7%) in 2007, and 4,962,998 (99.9%) in 2006 (Table 8). The number of fish barged and the percentages of the total transported by species group were: 1,030,573 clipped yearling Chinook (99.9), 398,227 unclipped yearling Chinook (99.9%), 175,667 clipped subyearling Chinook (99.9%), 429,964 unclipped subyearling Chinook (96.3%), 977,239 clipped steelhead (99.1%), 332,244 unclipped steelhead (99.9%), 1,922clipped sockeye/kokanee (100.0%), 3,850 unclipped sockeye/kokanee (98.4%) and 28,337 coho (99.9%).
Direct loading of smolts onto waiting fish barges (rather than into raceways) is felt to be
highly beneficial to the fish by eliminating secondary handling and related stress factors. An estimated 44.4% of the smolts (approximately 1,499,663 smolts out of 3,378,007 smolts barged from Lower Granite) were direct loaded onto fish barges at Lower Granite during the 2010 season. This figure has been both higher and lower in previous years and is dependent on a number of factors. As in 2007-2009, a factor limiting direct loading of barges was the need to divert large numbers of smolts to the upstream raceways to accommodate research marking operations during the peak of the juvenile outmigration. Other factors which limited direct barge loading were: a late April start in general barging operations, high river flows in late May

15
and June (which made direct barge loading hazardous), and occasional late arrival times of returning fish barges.
As per previous years, fish collected at Little Goose Dam, Lower Monumental Dam, and
McNary Dam were also loaded onto fish barges that originated from Lower Granite Dam during the 2010 season. The total number of fish barged from these other sites during the 2010 season was: Little Goose Dam (2,712,797), Lower Monumental Dam (1,056,402), and McNary Dam (300,428).
Late season trucking operations at Lower Granite began on August 18 and continued
every other day through October 31. Due to low fish numbers, trucking operations resumed using the pickup-mounted midi-tanker. Fish numbers later increased to the point that it was necessary to utilize the semi for late season fish transport. During 2010 fish transport using the semi took place on September 19, September 21, October 3, October 5, and October 9. The October 3 and 5 trips were piggyback operations with Little Goose. Approximately 16,594 juvenile salmonids, 0.4% of the fish transported from Lower Granite in 2010, were transported by truck (Table 8). In addition, an additional 1,767 juveniles were transported by truck when Lower Granite combined fish trucking operations with Little Goose beginning on October 3 and October 5. During 2009, 6,700 juvenile salmonids, 0.2% of the fish transported in 2009, were transported by truck compared to 17,178 in 2008 (0.4%), 7,555 in 2007 (0.3%), 6,751 (0.1%) in 2006, and 66,396 (0.6%) in 2005. A continuing factor in the low percentage of fish transported by truck in 2010 was an extensive late season transport evaluation by NOAA-Fisheries which removed many fish which would have been transported and put them back into the river. The numbers of fish trucked in 2010 and the percentages of the total transported for each species group were: 16 clipped yearling Chinook (<0.1%), 6 unclipped yearling Chinook (<0.1%), 72 clipped subyearling fall Chinook ((<0.1%), 16,403 unclipped subyearling fall Chinook (3.7%), 2 clipped steelhead (<0.1%), 14 unclipped steelhead (<0.1%), 0 clipped sockeye/kokanee (0.0%), 64 unclipped sockeye/kokanee (1.6%) and 17 coho ((<0.1%).
The physical operation of the transport barges and transport trucks went reasonably well
during the 2010 season. There were no operational problems that prevented the normal transportation and release of fish at the designated release points. (High wind conditions on May 3 did prevent the barge transport of fish from Little Goose Dam.) Nevertheless, as is to be expected of any large-scale operation involving considerable equipment over a lengthy period of time, there were a few minor operational problems. Most of the barge-related problems during 2010 were of a minor mechanical or electrical nature. There were a number of problems with the oil pressure gauge on the #3 engine reading correctly on barge 8108. On July 19 the #4 pump back-flow check valve on barge 8106 did not work properly but finally closed after running a few more hours. There were problems with the #3 engine on barge 8107 overheating on the August 2 and August 6 trips. There was also a problem with the generator on barge 8107 on the August 10 trip. There were some problems with the deckwash system on barge 8105 and barge 4394 at the start of the season. Electrical problems were mostly simple in nature and included replacing navigation lights on barge 8108, engine alarm problems on the #3 engine on barge 2817, and problems with the Point Four oxygen monitoring sensor in a hold on barge 8106. In all cases, the portable YSI oxygen/temperature monitoring systems (used as a backup system on each barge) have proven invaluable and allowed for proper monitoring of oxygen and

16
temperature levels whenever there were problems with the main Point Four system. There were very few problems with the Lower Granite fish trucks during the 2010
season. The one big item was that on the October 3 trip it was found that a hub on the transport trailer was damaged and had a leaking wheel bearing seal. The JFF maintenance crew was able to cannibalize a hub off the trash truck trailer at the dam and replaced the problem hub. The trip was completed on schedule. On the September 21 trip, there were also some problems with the refrigeration unit on the trailer not working properly. There were virtually no problems with the midi-tanker system during the season. Care was taken to add enough ice to keep the temperatures at an acceptable level for the trip to Bonneville and in general very little tempering was required at the release site.
With the exception of the previously mentioned trips, the majority of late season fish
transport took place with the pickup-mounted 300 gallon midi-tanker system. NOAA-Fisheries late season transport evaluation study put quite a few fish back into the river that would have normally been transported and kept transport numbers low enough to use the 1-ton pickup and midi-tanker tank for the majority of the trips. All operational aspects of truck transport went smoothly. Lower Granite received a new 1-ton diesel dual rear wheel pickup for fish transport which worked very well and was much appreciated by the truck drivers.
Bypass The LGR collection gallery was watered up on March 17. All fish were initially diverted out the large pipe at the base of the separator (primary bypass). This operation continued until 0700 hours on March 25 when the separator was watered up and sampling activities began. At that time, all fish were bypassed back to the river through the bypass outfall pipe to the river (secondary bypass). The system was operated in secondary bypass mode with the exception of periods of time when it was necessary to load fish into the upstream raceways to accommodate research marking for an April 22 barge trip. General fish collection (for transportation) began on April 23 and continued until 0700 hours on October 31 when the facility was placed back into secondary bypass mode (smolts diverted out the outfall pipe to mid-river) to monitor for PIT-tagged juvenile fish. On November 22 at 0940 hours the juvenile fish collection system was switched to primary bypass operation because of an extended period of extreme cold weather. The facility returned to secondary bypass mode at 0830 hours on November 26 when temperatures moderated. The juvenile fish collection system was operated in the secondary bypass mode until 0930 hours on December 16, when the system was put into primary bypass mode. The juvenile fish collection gallery and collection/transportation facility were dewatered for the season on the morning of December 21.
In 2010, an estimated 247,129 smolts (6.8% of those collected) were bypassed from the LGR Juvenile Fish Facility compared to 2,465,023 fish in 2009. The number and percentage of smolts bypassed by species group in 2010 (percentage of the total number of fish bypassed) included: 161,676 clipped yearling Chinook (65.4%), 30,184 unclipped yearling Chinook (12.2%), 33 clipped subyearling fall Chinook (<0.1%), 6,880 unclipped subyearling fall Chinook (2.8%), 31,194 clipped steelhead (12.6%), 17,151 unclipped steelhead (6.9%) and 11 unclipped

17
sockeye/kokanee (<0.1%). An estimated 71,789 juvenile salmonids, 2.0% of the total collection were bypassed from March 26 to April 23, before the start of the general transport season. In 2009, an estimated 2,340,376 juvenile salmonids, 35.5% of the total collection were bypassed from March 26 to May 1.
As part of seven research studies, 177,795 smolts were bypassed from LGR in 2010. The
National Marine Fisheries Service (NMFS) Survival Study PIT-tagged and bypassed 47,932 smolts: 309 clipped yearling Chinook, 17,052 unclipped yearling Chinook, five unclipped subyearling fall Chinook, 17,627 clipped steelhead and 12,939 unclipped steelhead. The NMFS Extra Mortality study bypassed 122,563 clipped yearling Chinook smolts. The NMFS Fall Chinook Late Season Transportation Study bypassed 33 clipped and 5,825 unclipped subyearling fall Chinook, 64 clipped yearling Chinook and four clipped steelhead. The United States Fish and Wildlife Service (USFWS), NMFS, Nez Perce Tribe (NPT) and the United States Geological Survey (USGS) Post Release Performance of Subyearling Fall Chinook Study bypassed 663 smolts: 18 clipped yearling Chinook, 25 unclipped yearling Chinook, 249 clipped subyearling fall Chinook, 354 unclipped subyearling fall Chinook, 14 clipped steelhead and three unclipped steelhead. The Kintama acoustic tracking array for studying ocean survival and movements of Columbia River salmon study bypassed 361 clipped yearling Chinook and 13 unclipped yearling Chinook. The United States Geological Survey (USGS), United States Fish and Wildlife Service (USFWS), Pacific Northwest National Laboratory and the University of Washington fall Chinook habitat use study bypassed 337 unclipped subyearling fall Chinook. Smolts were bypassed for one hour on September 19 and September 21 to clean the separator inclined screen (primary dewaterer). During these cleaning events, no estimate can be made of the number of fish bypassed because the fish are bypassed before encountering the sampling system (Primary Bypass). The incline screen seemed to be plugged with bryozoans and various fine debris, rather than pine needles or tumbleweeds as in previous years. Incidental Species An estimated 41,723 non-salmonid incidental fish entered the fish facility in 2010 (Table 11). This is 99.6% more than the 20,902 non-salmonid incidental fish that entered the fish facility in 2009, compared to 35,571 in 2008, 22,919 in 2007 and 34,691 in 2006. Siberian prawns were the most abundant incidental species with 11,711 collected, which is a 900.1% increase over the 2009 total of 1,171. This was the fourth season that the invasive species Siberian Prawns were euthanized, per WDFW instructions, rather than released to the river. Mountain whitefish were the second most abundant incidental species with 8,691 collected compared to 4,962 in 2009. Sucker species were the third most abundant incidental species with 6,648 collected compared to 3,785 in 2009. Peamouth were the fourth most abundant incidental species with 3,639 collected compared to 4,213 in 2009. Pacific lamprey smolts (eyed) were the fifth in abundance with 3,554 collected, a 30.5% increase from the 2,723 collected in 2009.

18
Table 15. Estimated collection of incidental fish species at LGR, 2010. Common Name Scientific Name Separator Expanded Sample Collection Pacific Lamprey (Adult) Entosphenus tridentatus 2 2 Pacific Lamprey (Juvenile) E. tridentatus 3,554 3,554 Pacific Lamprey (Ammocete) E. tridentatus 2,493 2,493 American Shad (Adult) Alosa sapidissima 1 13 14 American Shad (Juvenile) A. sapidissima 488 488 Banded Killifish Fundulus diaphanus 44 44 Smallmouth Bass Micropterus dolomieui 3 1,021 1,024 Largemouth Bass Micropterus salmoides 13 13 Bull Trout Salvelinus Malma 0 0 Bullhead (misc.) Amierus sp. 97 97 Common carp Cyprinus carpio 288 39 327 Channel catfish Ictalurus punctatus 50 189 239 Chiselmouth Acrocheilus alutaceus 424 424 Crappie (misc) Pomoxis sp. 2 169 171 Cutthroat Trout Oncorhynchus clarkii 0 0 Kokanee Oncorhynchus nerka 1 4 5 Longnose dace Rhinichthys cataractae 50 50 Northern Pikeminnow Ptychocheilus oregonensis 3 30 33 Peamouth Mylocheilus caurinus 2 3,637 3,639 Rainbow Trout Oncorhynchus mykiss 163 163 Redside shiner Richardsonius balteatus 0 0 Sand Roller Percopsis transmontana 1,199 1,199 Sculpin Cottus sp. 412 412 Siberian Prawn Exopalaemon modestus 11,711 11,711 Sucker (misc.) Catostomus sp. 1,496 5,152 6,648 Sunfish (misc.) Lepomis sp. 255 255 Whitefish Prosopium sp. 3 8,688 8,691 White sturgeon Acipenser transmontanus 22 0 22 Yellow perch Perca flavescens 3 0 3 Walleye Stizostedion vitreum 0 0 Warmouth Lepomis gulosis 2 2 Total 1,874 39,849 41,723
Fish Condition
Descaling WDFW smolt monitors at Lower Granite began looking at gradations of scale loss in smolts in 1998 to augment the standard descaling data taken from fish sampled. Standard descaling criteria identifies a fish with 20% or greater scale loss on one side of its body as descaled, based on Fish Passage Center guidelines. If scale loss is less than 20% on one side the fish is not considered descaled. Many fish have levels of scale loss that do not fit the standard descaling criteria. Therefore they began noting, in addition to standard descaling, if a smolt was more than 10% but less than 20% descaled or more than 50% descaled. Furthermore, each
19
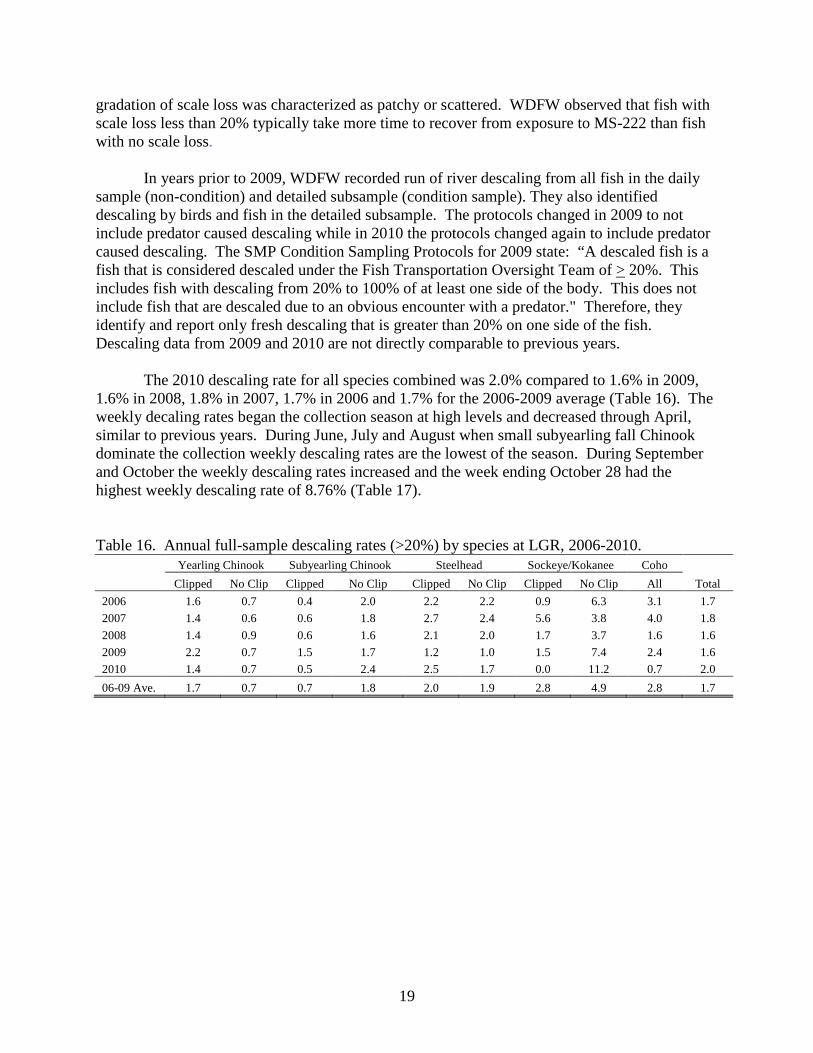
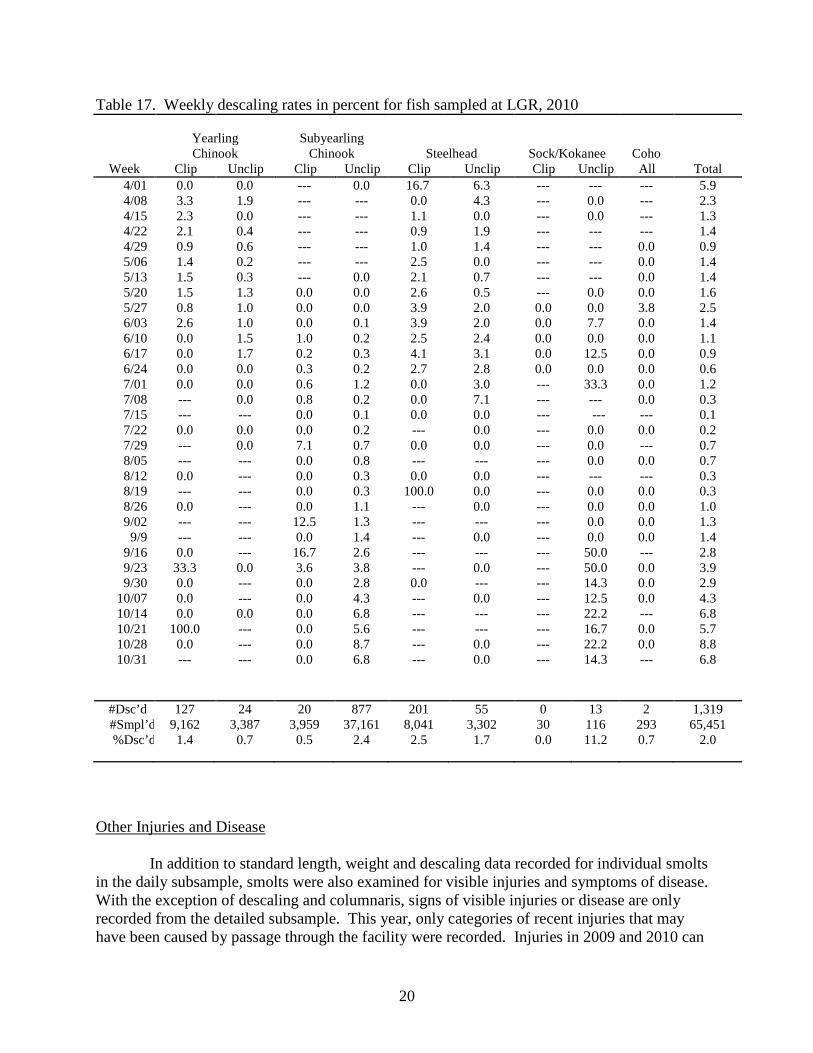
gradation of scale loss was characterized as patchy or scattered. WDFW observed that fish with scale loss less than 20% typically take more time to recover from exposure to MS-222 than fish with no scale loss. In years prior to 2009, WDFW recorded run of river descaling from all fish in the daily sample (non-condition) and detailed subsample (condition sample). They also identified descaling by birds and fish in the detailed subsample. The protocols changed in 2009 to not include predator caused descaling while in 2010 the protocols changed again to include predator caused descaling. The SMP Condition Sampling Protocols for 2009 state: “A descaled fish is a fish that is considered descaled under the Fish Transportation Oversight Team of > 20%. This includes fish with descaling from 20% to 100% of at least one side of the body. This does not include fish that are descaled due to an obvious encounter with a predator." Therefore, they identify and report only fresh descaling that is greater than 20% on one side of the fish. Descaling data from 2009 and 2010 are not directly comparable to previous years. The 2010 descaling rate for all species combined was 2.0% compared to 1.6% in 2009, 1.6% in 2008, 1.8% in 2007, 1.7% in 2006 and 1.7% for the 2006-2009 average (Table 16). The weekly decaling rates began the collection season at high levels and decreased through April, similar to previous years. During June, July and August when small subyearling fall Chinook dominate the collection weekly descaling rates are the lowest of the season. During September and October the weekly descaling rates increased and the week ending October 28 had the highest weekly descaling rate of 8.76% (Table 17).
Table 16. Annual full-sample descaling rates (>20%) by species at LGR, 2006-2010. Yearling Chinook Subyearling Chinook Steelhead Sockeye/Kokanee Coho Clipped No Clip Clipped No Clip Clipped No Clip Clipped No Clip All Total 2006 1.6 0.7 0.4 2.0 2.2 2.2 0.9 6.3 3.1 1.7 2007 1.4 0.6 0.6 1.8 2.7 2.4 5.6 3.8 4.0 1.8 2008 1.4 0.9 0.6 1.6 2.1 2.0 1.7 3.7 1.6 1.6 2009 2.2 0.7 1.5 1.7 1.2 1.0 1.5 7.4 2.4 1.6 2010 1.4 0.7 0.5 2.4 2.5 1.7 0.0 11.2 0.7 2.0 06-09 Ave. 1.7 0.7 0.7 1.8 2.0 1.9 2.8 4.9 2.8 1.7
20
Table 17. Weekly descaling rates in percent for fish sampled at LGR, 2010 Yearling Subyearling Chinook Chinook Steelhead Sock/Kokanee Coho
Week Clip Unclip Clip Unclip Clip Unclip Clip Unclip All Total 4/01 0.0 0.0 --- 0.0 16.7 6.3 --- --- --- 5.9 4/08 3.3 1.9 --- --- 0.0 4.3 --- 0.0 --- 2.3 4/15 2.3 0.0 --- --- 1.1 0.0 --- 0.0 --- 1.3 4/22 2.1 0.4 --- --- 0.9 1.9 --- --- --- 1.4 4/29 0.9 0.6 --- --- 1.0 1.4 --- --- 0.0 0.9 5/06 1.4 0.2 --- --- 2.5 0.0 --- --- 0.0 1.4 5/13 1.5 0.3 --- 0.0 2.1 0.7 --- --- 0.0 1.4 5/20 1.5 1.3 0.0 0.0 2.6 0.5 --- 0.0 0.0 1.6 5/27 0.8 1.0 0.0 0.0 3.9 2.0 0.0 0.0 3.8 2.5 6/03 2.6 1.0 0.0 0.1 3.9 2.0 0.0 7.7 0.0 1.4 6/10 0.0 1.5 1.0 0.2 2.5 2.4 0.0 0.0 0.0 1.1 6/17 0.0 1.7 0.2 0.3 4.1 3.1 0.0 12.5 0.0 0.9 6/24 0.0 0.0 0.3 0.2 2.7 2.8 0.0 0.0 0.0 0.6 7/01 0.0 0.0 0.6 1.2 0.0 3.0 --- 33.3 0.0 1.2 7/08 --- 0.0 0.8 0.2 0.0 7.1 --- --- 0.0 0.3 7/15 --- --- 0.0 0.1 0.0 0.0 --- --- --- 0.1 7/22 0.0 0.0 0.0 0.2 --- 0.0 --- 0.0 0.0 0.2 7/29 --- 0.0 7.1 0.7 0.0 0.0 --- 0.0 --- 0.7 8/05 --- --- 0.0 0.8 --- --- --- 0.0 0.0 0.7 8/12 0.0 --- 0.0 0.3 0.0 0.0 --- --- --- 0.3 8/19 --- --- 0.0 0.3 100.0 0.0 --- 0.0 0.0 0.3 8/26 0.0 --- 0.0 1.1 --- 0.0 --- 0.0 0.0 1.0 9/02 --- --- 12.5 1.3 --- --- --- 0.0 0.0 1.3
9/9 --- --- 0.0 1.4 --- 0.0 --- 0.0 0.0 1.4 9/16 0.0 --- 16.7 2.6 --- --- --- 50.0 --- 2.8 9/23 33.3 0.0 3.6 3.8 --- 0.0 --- 50.0 0.0 3.9 9/30 0.0 --- 0.0 2.8 0.0 --- --- 14.3 0.0 2.9
10/07 0.0 --- 0.0 4.3 --- 0.0 --- 12.5 0.0 4.3 10/14 0.0 0.0 0.0 6.8 --- --- --- 22.2 --- 6.8 10/21 100.0 --- 0.0 5.6 --- --- --- 16.7 0.0 5.7 10/28 0.0 --- 0.0 8.7 --- 0.0 --- 22.2 0.0 8.8 10/31 --- --- 0.0 6.8 --- 0.0 --- 14.3 --- 6.8
#Dsc’d 127 24 20 877 201 55 0 13 2 1,319 #Smpl’d 9,162 3,387 3,959 37,161 8,041 3,302 30 116 293 65,451 %Dsc’d 1.4 0.7 0.5 2.4 2.5 1.7 0.0 11.2 0.7 2.0
Other Injuries and Disease
In addition to standard length, weight and descaling data recorded for individual smolts in the daily subsample, smolts were also examined for visible injuries and symptoms of disease. With the exception of descaling and columnaris, signs of visible injuries or disease are only recorded from the detailed subsample. This year, only categories of recent injuries that may have been caused by passage through the facility were recorded. Injuries in 2009 and 2010 can

21
not be directly compared to injuries prior to 2009. A total of 25,825 smolts were examined in the detailed subsample during 2010 compared to 25,217 in 2009, 25,624 smolts in 2008, 19,808 in 2007 and 20,192 in 2006. This season a total of 3,189 (12.3%) smolts were recorded as having head, body, predator caused injury or symptom of disease compared to 2,944 (11.7%) in 2009, 3,509 (13.7%) in 2008, 2,006 (10.1%) in 2007 and 1,926 (9.5%) in 2006. The actual proportion of injured smolts is less than the rates shown because some fish have more than one visible injury.
Head injuries that were associated with dam passage include generic head injuries, eye
injuries, opercle injuries and “pop” or bulging eye. Mandible and maxillary injuries were not recorded separately from the generic head injury category as in previous years. Head injuries were recorded on 0.5% of the smolts examined in the detailed subsample compared to 0.6% in 2009, 1.0% in 2008, 0.9% in 2007 and 1.2% in 2006. Injuries to the opercula comprised the majority of head injuries (49.2%) followed by eye injuries (31.8%) and eye hemorrhages (10.6%). Of all head injuries, 31.8% were on unclipped subyearling fall Chinook, 25.8% were on clipped yearling Chinook and 25.8% were on clipped steelhead.
The body injuries associated with dam passage that were recorded this season included a generic body injury category and a generic fin injury category. Non-dam passage injuries of body deformity, pink fins and fin discoloration (a distinct line of color differentiation on the caudal fin that may be associated with cold water disease and/or stress) are still recorded while lesions, lacerations and bloated body are not recorded separately. Body injuries were observed on 4.7% of the smolts examined in the detailed subsample compared to 7.4% in 2009, 6.8% in 2008, 4.2% in 2007 and 4.9% in 2006. The majority of body injuries observed were pink fins (40.0%) followed by fin discoloration (37.6%) and fin injuries (11.9%). Of all body injuries, unclipped subyearling fall Chinook had 75.4% of the total body injuries followed by clipped steelhead (8.0%) and clipped yearling Chinook (5.6%). Diseases with external symptoms recorded on the FPC touch screen included fungus, columnaris, fin hemorrhage, bacterial kidney disease and parasites. External symptoms of disease were observed on 3.5% of the smolts examined in the detailed subsample compared to 2.8% in 2009, 5.0% in 2008, 4.3% in 2007 and 2.6% in 2006. Symptoms of disease were highest on unclipped subyearling fall Chinook (57.0%) followed by clipped yearling Chinook (24.1%) and clipped steelhead (8.8%). Columnaris comprised the majority of the disease symptoms (39.4%) followed by fungus (34.6%) and fin hemorrhages (18.4%). The disease columnaris, caused by the bacterium Flavobacterium columnare, mainly infects summer and fall migrants because it becomes more virulent when water temperatures exceed 60º F. Warren Groberg, Fish Pathologist for Oregon Department of Fish and Wildlife, visited the LGR Juvenile Fish Facility September 30, 1998 and provided information on external symptoms characteristic of columnaris. Groberg explained that the snout injuries (loss of protective skin tissue) and yellowish blemishes without broken skin were symptoms of F. columnare infection. Based on this information, we have classified fish exhibiting these symptoms as infected with columnaris.
Lower Granite’s smolt monitors have recorded the incidence of columnaris since 1996

22
and since 1999 they have recorded columnaris symptoms based on the entire sample. The columnaris infection rate for the entire sample of subyearling fall Chinook in 2010 was 1.3% (550 of 41,116) compared to 1.0% (313 of 30,223) in 2009, 1.1% (614 of 55,826) in 2008, 1.6% (566 of 36,577) in 2007 and 0.9% (313 of 33,426) in 2006. The 2010 columnaris rate is slightly higher than the 1.2% observed for the 2006-09 average. In most years they do not see the first incidence of columnaris until July, after the majority of subyearling fall Chinook have already passed the project.
Injuries associated with predators include wounds inflicted by other fish, birds, and lamprey. Predator wounds were observed on 0.8% of the smolts examined in the detailed subsample compared to 1.0% in 2009, 1.0% in 2008, 0.8% in 2007 and 0.9% in 2006. Predator marks were highest on clipped steelhead (32.7%), unclipped subyearling fall Chinook (27.6%) and clipped yearling Chinook (16.1%). Predator marks caused by birds, characterized by a distinct V-shaped descaling pattern on both sides of a fish were the most common predator mark (61.8%) compared to 30.9% for predator marks caused by fish. Similar to previous years the larger clipped and unclipped steelhead smolts had the most bird bites.
Mortality Facility mortality included fish removed from the barges or trucks before departure, sample mortalities, recovery tank mortalities, separator mortalities and raceway mortalities, including the east raceways which are used by NMFS for research. The overall facility mortality rate for 2010 was 0.08% compared to 0.12% in 2009, 0.13% in 2008, 0.11% in 2007 and 0.17% in 2006 (Table 14). In all, 3,096 facility mortalities were recorded from a total collection of 3,645,277 smolts. The number of facility mortalities and the mortality percentage by species group included: 1,044 clipped yearling Chinook (0.09%), 242 unclipped yearling Chinook (0.06%), 343 clipped subyearling fall Chinook (0.19%), 1,142 unclipped subyearling fall Chinook (0.25%), 225 clipped steelhead (0.02%), 79 unclipped steelhead (0.02%), 3 clipped sockeye (0.16%), 7 unclipped sockeye/kokanee (0.18%) and 11 coho (0.04%). Facility mortality rates for all species groups were lower than in 2009 except for clipped and unclipped steelhead. All species group mortality rates were lower than those observed for the 2006-2009 average. Facility mortality rates during the spring migration and the first two weeks of the summer migration rarely exceeded 0.50%. The overall average for the remainder of the season ranged between 0.44% and 2.83%.

23
Table 18. Annual facility mortality in percent at Lower Granite Dam, 2006-2010.
Yearling Subyearling Chinook Chinook Steelhead Sockeye/Kokanee Coho
Year Clipped Unclipped Clipped Unclipped Clipped Unclipped Clipped Unclipped All Total 2006 0.28 0.17 0.36 0.32 0.05 0.03 0.75 2.12 0.28 0.17 2007 0.07 0.07 0.42 1.08 0.04 0.03 0.10 0.46 0.05 0.11 2008 0.13 0.10 0.55 0.51 0.04 0.04 0.16 4.40 0.07 0.13 2009 0.12 0.08 0.68 0.58 0.01 0.01 0.34 0.99 0.22 0.12 2010 0.09 0.06 0.19 0.25 0.02 0.02 0.16 0.18 0.04 0.08 06-09 0.16 0.11 0.48 0.51 0.03 0.03 0.28 1.84 0.15 0.13
Sample mortalities include dead fish removed from the sample tank prior to sampling and
those from the sorting trough in the sample lab. In 2010 a total of 501 sample mortalities were recorded from 66,295 (0.76%) smolts compared to 511 of 70,866 (0.72%) in 2009, 937 of 97,421 (0.96%) in 2008, 502 of 71,798 (0.70%) in 2007 and 696 of 76,119 (0.91%) in 2006 (Table 16). The number of mortalities and percent mortality by species group for 2010 included: 44 clipped yearling Chinook (0.48%), 11 unclipped yearling Chinook (0.32%), 36 clipped subyearling fall Chinook (0.90%), 386 unclipped subyearling fall Chinook (1.02%), 17 clipped steelhead (0.21%), two unclipped steelhead (0.06%), four unclipped sockeye/kokanee (3.33%) and one coho (0.34%). The overall sample mortality of 0.76% is the third lowest in the last five years. Barge mortalities are salmonids removed from barge holds after the barges depart LGR. Barge mortalities include those from fish loaded at Little Goose, Lower Monumental and McNary into barges originating at LGR. The barge mortality rate of 0.04% (2,945 of 7,447,434) in 2010 is lower than the 0.05% barge mortality rate in 2009 and compares to 0.04% in 2008, 0.02% in 2007 and 0.06% in 2006 (Table 17). The total number of smolts barged included 3,378,007 fish from LGR, 2,712,797 from Little Goose Dam, 1,056,202 fish from Lower Monumental Dam and 300,428 from McNary Dam. Barge mortalities by species for 2010 include: 799 clipped yearling Chinook, 245 unclipped yearling Chinook, 889 subyearling fall Chinook, 394 clipped steelhead, 202 unclipped steelhead, 26 clipped sockeye, three unclipped sockeye/kokanee, 25 coho and 362 salmonids classified as others because they were seen at release but could not be identified to species (Table 18).

24
Table 19. Weekly facility mortality in percent by species group at LGR, 2010.
Yearling Chinook Subyearling
Chinook Steelhead Sockeye/Kokanee Coho Week Ending Clipped No Clip Clipped No Clip Clipped No Clip Clipped
No Clip All Total
1-Apr 0.00% 0.00% -- 0.00% 0.00% 1.18% -- -- -- 0.54% 8-Apr 0.00% 0.00% -- 0.00% 0.00% 0.00% -- 0.00% -- 0.00% 15-Apr 0.37% 0.22% -- 0.57% 0.00% 0.00% -- 0.00% -- 0.24% 22-Apr 0.11% 0.10% -- 0.00% 0.00% 0.00% -- -- -- 0.08% 29-Apr 0.08% 0.06% -- 0.33% 0.01% 0.00% -- -- 0.17% 0.05% 6-May 0.09% 0.07% -- 0.00% 0.01% 0.00% -- -- 0.08% 0.06% 13-May 0.07% 0.05% -- 0.50% 0.01% 0.01% -- -- 0.10% 0.05% 20-May 0.11% 0.06% 0.00% 0.60% 0.05% 0.01% -- 0.00% 0.00% 0.07% 27-May 0.12% 0.03% 0.07% 0.10% 0.02% 0.02% 0.00% 0.00% 0.01% 0.04% 3-Jun 0.08% 0.07% 0.07% 0.10% 0.10% 0.09% 0.14% 0.15% 0.06% 0.09% 10-Jun 0.12% 0.04% 0.27% 0.23% 0.03% 0.04% 0.33% 0.00% 0.16% 0.17% 17-Jun 0.00% 0.06% 0.13% 0.11% 0.09% 0.11% 0.00% 0.44% 0.00% 0.11% 24-Jun 0.50% 0.47% 0.13% 0.11% 0.11% 0.11% 0.00% 0.00% 0.00% 0.12% 1-Jul 0.00% 0.00% 0.10% 0.06% 0.00% 0.00% -- 0.00% 0.00% 0.07% 8-Jul -- 0.00% 0.11% 0.16% 0.00% 0.00% -- -- 0.00% 0.15% 15-Jul -- -- 0.29% 0.33% 0.00% 1.25% -- -- -- 0.33% 22-Jul 10.0% 0.00% 1.91% 0.52% -- 10.00% -- 0.00% 0.00% 0.57% 29-Jul -- 0.00% 0.00% 0.57% 30.00% 0.00% -- 0.00% -- 0.60% 5-Aug -- -- 0.00% 0.82% -- -- -- 0.00% 14.29% 0.83% 12-Aug 0.00% -- 5.56% 1.48% 0.00% 0.00% -- -- -- 1.51% 19-Aug -- -- 10.00% 1.25% 0.00% 0.00% -- 0.00% 0.00% 1.28% 26-Aug 0.00% -- 0.00% 1.74% -- 0.00% -- 0.00% 0.00% 1.72% 2-Sep -- -- 0.00% 1.14% -- -- -- 0.00% 0.00% 1.12% 9-Sep -- -- 0.00% 1.06% -- 0.00% -- 20.0% 0.00% 1.15% 16-Sep 0.00% -- 14.29% 0.93% -- -- -- 0.00% -- 1.01% 23-Sep 0.00% 0.00% 0.00% 0.55% -- 0.00% -- 0.00% 0.00% 0.54% 30-Sep 0.00% -- 0.00% 2.68% 0.00% -- -- 25.0% 0.00% 2.83% 7-Oct 0.00% -- 10.00% 1.48% -- 0.00% -- 0.00% 0.00% 1.51% 14-Oct 33.30% 0.00% 0.00% 0.92% -- -- -- 0.00% -- 0.94% 21-Oct 0.00% -- 0.00% 0.44% -- -- -- 0.00% 0.00% 0.44% 28-Oct 0.00% -- 20.00% 0.26% -- 0.00% -- 18.18% -- 0.51% 31-Oct -- -- 0.00% 0.74% -- 0.00% -- 0.00% -- 0.73% # morts 1,044 242 343 1,142 225 79 3 7 11 3,096 # collected 1,193,654 428,713 176,115 454,408 1,008,668 349,497 1,925 3,932 28,365 3,645,277 % mortality 0.09% 0.06% 0.19% 0.25% 0.02% 0.02% 0.16% 0.18% 0.04% 0.08%
-- no fish sampled

25
Table 20. Annual sample mortality in percent at LGR, 2006-2010.
Yearling Subyearling Chinook Chinook Steelhead Sockeye/Kokanee Coho
Year Clip Unclip Clip Unclip Clip Unclip Clip Unclip All Total 2006 1.17 0.98 1.02 1.07 0.48 0.31 0.00 7.99 0.33 0.91 2007 0.38 0.26 0.66 1.16 0.21 0.30 1.12 0.00 0.15 0.70 2008 0.87 0.55 1.24 0.99 0.28 0.23 2.50 13.36 0.39 0.96 2009 0.77 0.61 1.10 1.05 0.18 0.05 2.19 6.92 0.90 0.72 2010 0.48 0.32 0.90 1.02 0.21 0.06 0.00 3.33 0.34 0.76 06-09 0.80 0.60 1.02 1.05 0.30 0.21 1.47 10.81 0.52 0.84 Table II. Total barge mortalities from LGR 2006-2010. (Optional table per Smolt Monitors.) Yearling Chinook Subyearling Steelhead Sockeye/Kokanee Coho Unknown Clipped No Clip Chinook Clipped No Clip Clipped No Clip All Others Total 2006 5,784 782 629 967 132 30 94 95 8,513 2007 465 89 98 308 95 0 1 21 1,077 2008 2,088 369 556 622 173 9 1 12 3,830 2009 1,316 206 1,560 404 103 7 13 8 476 4,093 2010 799 245 889 394 202 26 3 25 362 2,945 06-09 ave 2,413 361 711 575 126 12 27 34 119 4,378
Table III. Barge Mortality Percent from LGR, LGS, LMN AND MCN dams 2006-2010. (Optional Table per Smolt Monitors)
Year Number of Mortalities Number Barged Percent Mortality 2006 8,513 14,466,644 0.01%
20071 1,077 5,342,257 0.02% 2008 3,830 9,095,533 0.04% 2009 4,093 8,637,230 0.05% 2010 2,945 7,447,634 0.04%
06-09 ave. 4,378 9,385,417 0.05% Fish were not barged from McNary Damduring 2007 due to concerns with spill patterns from the temporary spillway weirs.
Table IV. Annual truck mortality at LGR, 2006-2010. (Optional table per Smolt Monitors.)
Yearling Chinook Subyearling
Chinook Steelhead Sockeye/Kokanee Coho
Clipped No Clip Clipped No Clip Clipped No
Clip Clipped No
Clip All Total 2006 25.00 0.00 0.47 0.14 0.00 10.00 0.00 0.00 0.00 0.18 2007 0.00 0.00 1.06 0.83 0.00 0.00 0.00 0.00 0.00 0.79 2008 -- 0.00 0.00 0.58 0.00 0.00 -- 5.05 0.00 0.80 2009 0.00 10.00 0.00 0.31 0.00 0.00 0.00 9.09 0.00 0.33 2010 0.00 0.00 2.78 0.27 0.00 0.00 -- 0.00 0.00 0.28 06-09 Ave. 1.59 0.37 0.38 0.50 0.00 1.85 0.00 4.96 0.00 0.60

26
The overall mortality rate for fish trucked from LGR in 2010 was 0.28% (47 of 16,594) compared to 0.33% (22 of 6,700) in 2009, 0.80% (137 of 17,178) in 2008, 0.75% (57 of 7,555) in 2007 and 0.18% (12 of 6,751) in 2006. There was no early season trucking from LGR for the fourth consecutive year. Every other day (EOD) trucking began August 18 and ended October 31, the last day of the 2010 season. The 2010 trucking mortality numbers and percent by species included: two clipped subyearling Chinook (2.78%) and 45 unclipped subyearling fall Chinook (0.27%) (Table 19).
Gas Bubble Trauma Monitoring Examinations were conducted once each week, on up to 100 fish from April 26 through June 21. Smolts were collected from the wet separator at LGR. GBT staff examined 790 smolts comprised of 109 clipped yearling Chinook, 26 unclipped yearling Chinook, 453 clipped steelhead and 202 unclipped steelhead. Twenty PIT-tagged smolts were handled, not examined and returned to the separator including four clipped yearling Chinook, nine clipped steelhead and seven unclipped steelhead. After examination for GBT, the smolts were placed in raceways and transported after the general transport season began on April 23. No symptoms of gas bubble trauma were observed on smolts examined at Lower Granite Dam this season.
Research
Ten different agencies conducted 10 research projects that impacted 546,340 smolts compared to 750,823 smolts in 2009, 867,442 smolts in 2008, 653,552 smolts in 2007 and 834,736 smolts in 2006. Of the 546,340 smolts taken from the collection in 2010, there were 187,006 clipped yearling Chinook, 45,839 unclipped yearling Chinook, 30,666 clipped subyearling fall Chinook, 72,592 unclipped subyearling fall Chinook, 173,756 clipped steelhead, 30,981 unclipped steelhead, 360 clipped sockeye, 1,000 unclipped sockeye/kokanee and 4,140 coho. In addition, the University of Idaho and the Columbia River Intertribal Fisheries Commission (CRITFC) continued a study on adult steelhead kelt fallbacks which impacted 50 smolts and 921 clipped and 1,989 unclipped steelhead kelts.
National Marine Fisheries Service (NMFS)-Study to Compare the Adult Returns of In-river Migrating versus Barged Juvenile Anadromous Salmonids (Transportation Study) NMFS marking crews handled 232,734 smolts for this study. These fish are part of an ongoing transportation evaluation study and were tagged throughout the spring and summer migration from April 20 to June 12. The NMFS crew PIT-tagged and transported 26,796 smolts; 11,540 unclipped yearling Chinook, 5,267 clipped steelhead and 9,989 unclipped steelhead. Unclipped yearling Chinook less than 124 mm fork length were used for this study to target wild Chinook and unclipped steelhead tagged do not include fin eroded fish to target wild steelhead. Tagged fish were held for at least 24 hours prior to being loaded onto barges for transport. A total of 205,903 smolts were handled, not tagged and transported. These included 44,436 clipped yearling Chinook, 4,555 unclipped yearling Chinook, 30,339 clipped subyearling fall Chinook,

27
59,051 unclipped subyearling fall Chinook, 62,434 clipped steelhead, 835 unclipped steelhead, 351 clipped sockeye, 988 unclipped sockeye/kokanee and 2,914 coho. Thirty-five smolts died before they were tagged including 26 clipped yearling Chinook, two unclipped yearling Chinook, one unclipped subyearling fall Chinook, five clipped steelhead and one unclipped steelhead. All of the smolts handled and tagged for this study were collected in the east raceways and tagged in the NMFS marking trailer adjacent to the east raceways.
NMFS-Study to Estimate Juvenile Reach Survival This is an ongoing study conducted to evaluate the in-river survival of juvenile salmonids bypassed into the tailrace at LGR. This year 47,569 fish were PIT-tagged and bypassed including 17,030 unclipped yearling Chinook, 17,615 clipped steelhead and 12,924 unclipped steelhead. A total of 363 smolts were handled, not tagged and bypassed. This total included 309 clipped yearling Chinook, 22 unclipped yearling Chinook, five unclipped subyearling fall Chinook, 12 clipped steelhead and 15 unclipped steelhead. There were 90 fish that died after being tagged including 56 unclipped yearling Chinook, 22 clipped steelhead and 12 unclipped steelhead. This study was done in conjunction with the NMFS Transportation Evaluation study.
NMFS-Extra Mortality Evaluation This is an ongoing study to evaluate the mortality effects upon fish encountering the collection and bypass facilities at Little Goose, Lower Monumental and Ice Harbor Dams compared to fish that do not encounter these dams. This study was conducted from April 23 to May 15. Clipped yearling Chinook were collected at LGR and divided among three treatment groups. The first treatment group was PIT-tagged, trucked and released below Ice Harbor Dam, the second group was PIT-tagged and trucked for the same period of time as the first group, but released in the tailrace at LGR and the third group was PIT-tagged and bypassed directly into the tailrace at LGR, to evaluate the trucking effects on the first two groups. NMFS tagging crews handled 246,887 smolts during this study. Of these 122,563 clipped yearling Chinook were PIT-tagged and bypassed including 47,999 directly into the tailrace, 45,543 were driven around and released into the tailrace at LGR and 29,021 released into the Ice Harbor Dam tailrace. In addition 123,999 fish were handled, not tagged and transported including 17,165 clipped yearling Chinook, 10,809 unclipped yearling Chinook, 15 clipped subyearling fall Chinook, 559 unclipped subyearling fall Chinook, 88,368 clipped steelhead, 5,836 unclipped steelhead, nine clipped sockeye, 12 unclipped sockeye/kokanee and 1,226 coho. There were 219 clipped yearling Chinook that died after being tagged. There were 106 mortalities recovered from the raceways prior to handling including 83 clipped yearling Chinook, six unclipped yearling Chinook, two unclipped subyearling fall Chinook, 14 clipped steelhead and one unclipped steelhead.
NMFS-Subyearling Fall Chinook Transportation Evaluation Study The objective of this study is to compare the survival and return rate of subyearling fall Chinook that are transported, to those that migrate to the ocean in-river. This study was conducted during the late-season trucking season from September 8 through October 31. Fish were taken from the daily samples and PIT-tagged at the juvenile fish facility three to four times each week. A total of 11,767 subyearling fall Chinook were handled during this study. Of these 5,879 subyearling fall Chinook were taken from daily samples, PIT-tagged and transported by truck and released below Bonneville Dam and 5,858 were taken from daily samples, PIT-tagged
28
and bypassed to the river. There were 30 subyearling fall Chinook that died after tagging. Another part of this study is collecting PIT-tagged yearling fall Chinook holdovers from the 2009 release of Dworshak hatchery fish in the Separation by Code Tank (SBC tank) during their out-migration. This season during March and April, 46 yearling fall Chinook holdovers were sampled and 18 non-target clipped yearling Chinook were handled and bypassed.
United States Fish and Wildlife Service (USFWS), United States Geological Service (USGS), NMFS, Nez Perce Tribe (NPT)-Post Release Performance of Subyearling Fall Chinook Study Subyearling fall Chinook were PIT-tagged at Dworshak Hatchery and released into the Snake River. Subyearling fall Chinook were also caught and PIT-tagged in the Clearwater River and in the reservoir above LGR. These fish were diverted into the SBC tank at LGR from May 21 to August 23 to measure growth. USFWS sampling crews handled 742 smolts from the SBC tanks. A total of 359 PIT-tagged target subyearling fall Chinook were bypassed to the river including 105 clipped subyearling fall Chinook and 254 unclipped subyearling fall Chinook. One clipped and 59 unclipped subyearling fall Chinook smolts were sacrificed. There were eight handling morts including three clipped subyearling fall Chinook and five unclipped subyearling fall Chinook. A total of 304 non target smolts were bypassed to the river including 18 clipped yearling Chinook, 25 unclipped yearling Chinook, 144 clipped subyearling fall Chinook, 100 unclipped subyearling fall Chinook, 14 clipped steelhead and three unclipped steelhead. There were 11 target PIT-tags found in clipped steelhead that were bypassed.
Kintama Research-An Acoustic Tracking Array for Studying Ocean Survival and Movements of Columbia River Salmon The goal of this study is to use Pacific Ocean Survey Tracking (POST) acoustic telemetry array technology to perform direct measurements of the marine survival of Columbia River spring Chinook salmon smolts as compared to their in-river survival and the relative survival of in-river and transported Snake and Yakima River spring Chinook smolts. Four detection arrays are located in the lower river below Bonneville Dam and three ocean detection arrays are located at Willapa Bay (Washington), Vancouver Island and Graves Harbor (Alaska). Study fish, only yearling spring Chinook greater than 130 mm fork length were taken from the sample and tagged from May 15 to May 25. A total of 21 unclipped and 389 clipped yearling Chinook were acoustic tagged and transported, 13 unclipped and 361 clipped yearling Chinook were acoustic tagged and bypassed. A total of 120 smolts were handled and transported including 113 clipped and six unclipped yearling Chinook, and one clipped steelhead. Three clipped yearling Chinook died before being tagged and five clipped yearling Chinook died after being tagged.
Pacific Northwest National Laboratory (PNNL)-Survival and Behavior through the estuary The goal of this study is to estimate juvenile salmonid survival through multiple reaches of the Columbia River downstream of the Federal Columbia River Power System (FCRPS). This study will also examine migratory behavior, and ocean-entry timing of both stream and ocean type juvenile salmonids through the lower Columbia River, and the Columbia River estuary and plume. Information gained from these efforts will be used to identify reaches of greatest juvenile salmonid loss, characterize how salmonids utilize estuarine habitats, explore mechanisms of hydropower system passage-route specific mortality, and evaluate the effect of habitat restoration/enhancement activities on the recovery of listed salmon stocks. Study fish

29
were tagged from April 27 to May 14. Yearling spring/summer Chinook smolts were taken from the sample two or three times a week. A total of 1,397 yearling Chinook were acoustic tagged and transported, including 1,108 clipped and 289 unclipped yearling Chinook. A total of 98 yearling Chinook were acoustic tagged, transported and sacrificed including 82 clipped and 16 unclipped yearling Chinook. A total of 65 Chinook were handled and transported including 53 clipped and 12 unclipped yearling Chinook. Five clipped yearling Chinook died before being tagged and four clipped yearling Chinook died after being tagged.
Idaho Fish and Game (IDFG)-Genetic Stock Identification The goal of this study is to develop fine-scale genetic profiles for natural origin salmon and steelhead, develop genetic stock identification (GSI) techniques to estimate stock-specific escapement over LGR, monitor abundance, productivity and distribution of naturally produced adult and juvenile steelhead and salmon and research and monitor stock-specific life history characteristics. At LGR the goal of the study was to enumerate and characterize the natural production of spring/summer Chinook salmon and steelhead above LGR with regards to age composition and genetic stock identification. This study was done from April 27 to July 8 and all fish were taken from the sample. A total of 1,365 unclipped and not fin eroded steelhead were sampled by taking a scale sample and a couple of fin rays. A couple of fin rays were also taken from another 1,937 smolts including 1,437 unclipped yearling Chinook and 500 unclipped subyearling fall Chinook.
United States Geological Survey (USGS), US Fish and Wildlife Service (USFWS), Pacific Northwest National Laboratory (PNNL) and University of Washington (UW)-Investigating passage of ESA-listed fall Chinook salmon at Lower Granite Dam during winter when the fish bypass system is not operated. This is a cooperative study of the survival and prevalence of the reservoir-type life history of juvenile fall Chinook salmon in the Snake River and the passage of subyearlings and reservoir-type fish through the Snake River. This study was done from October 20 to October 29 and all fish were taken from the sample. The specific goals are to 1) increase understanding of how reservoir water temperature, velocity and migration timing effect juvenile fall Chinook salmon behavior, survival and life history 2) increase understanding of when to spill water and transport fish in the Snake River and 3) determine how to account for the reservoir-type life history in calculations of smolt-to-adult return rates. The goal was to radio and PIT-tag 175 subyearling fall Chinook taken from the sample and release them at Illia Landing approximately three miles downstream of Lower Granite Dam. USGS staff radio and PIT-tagged 179 unclipped subyearling fall Chinook and released them at Illia Landing and rejected 11 fish that were also released at Illia Landing. They modified the original goal and took an extra 147 unclipped subyearling fall Chinook from the sample. Of these extra fish, USGS radio and PIT-tagged 93 fish and released them upriver of LGR at Blyton Landing and 54 were radio and PIT-tagged were released upriver of LGR at Olfield Landing.
Univ. of Idaho/Columbia River Intertribal Fisheries Commission (CRITFC)-Developing Strategies to Improve Survival and Return Recruitment of Steelhead Kelts from Snake River Stocks The goal of this research project is to study the physiology and endocrinology of

30
steelhead kelts to evaluate the feasibility and success of several strategies for rehabilitating and handling of adult steelhead kelts captured at LGR. A total of 2,910 steelhead kelts were impacted by this study including 921 clipped and 1,989 unclipped steelhead kelts. One clipped and 1,412 unclipped kelts were PIT-tagged, blood sampled and returned to the tailrace. A total of 194 unclipped steelhead kelts were PIT-tagged, blood sampled and transported by barge. Fifty-four unclipped steelhead kelts PIT-tagged, blood sampled and transported by truck. Sixty-four clipped steelhead kelts were handled and transported to Dworshak Hatchery. Fifty-one unclipped and 744 clipped steelhead kelts were handled and returned to the tailrace. Thirty-nine unclipped steelhead kelts were blood sampled, PIT and acoustic tagged and trucked below Bonneville Dam. Eighty-five unclipped steelhead kelts were blood sampled, PIT and acoustic tagged and barged below Bonneville Dam. Forty-six clipped and 53 unclipped steelhead kelts were sacrificed. Sixty-two clipped and 82 unclipped steelhead kelts died in the tank before handling by UI personnel. There were four clipped and 19 unclipped steelhead kelts that died after being PIT-tagged and blood sampled. In addition 50 smolts were impacted by this study including 19 clipped yearling Chinook, 17 unclipped yearling Chinook, three clipped subyearling fall Chinook, two unclipped subyearling fall Chinook and nine clipped steelhead.
Facility Operations and Maintenance Turbine Operations
Turbine unit operating priorities at Lower Granite were changed slightly during 2010. Operational guidelines at Lower Granite are now turbine units 1, 2, 3, then 4-6 (in any order), 24 hours per day, from March 1 through December 15. From December 16 to February 28, any unit may be run 24 hours per day without regard to order. Turbine unit operating priority may be coordinated differently to allow for fisheries research activities, construction, or project maintenance activities. The project followed the new normal turbine unit operation as outlined in Table LWG-5 in the Fish Passage Plan during 2010.
During 2010, turbine units 1-6 were unavailable for service 16,263.56 hours out of a possible 52,560 operational hours. This computes to an overall availability factor of 69.06%. This is quite a bit worse than in 2009 when the availability factor was 86.9%. The lowered availability factor was caused largely by the extensive January – December outage on unit 3 which included a stator rewind. Unit 3 was out of service a total of 8,456.8 hours due to this operation. The 2010 availability factor on a per unit basis was: turbine unit 1 (68.9%, turbine unit 2 ( 93.1%), turbine unit 3 (3.5%), turbine unit 4 (61.5%), turbine unit 5 (92.7%), and turbine unit 6 (94.8%). Turbine unit 1 was unavailable for service a total of 2,728.9 hours for various reasons. The biggest outage factor was annual maintenance which required 1,924.1 hours. Turbine unit 2 was unavailable for service 601.4 hours. The biggest outage factor was annual maintenance in October. Turbine unit 3 was unavailable for service nearly the entire year with a total of 8,456.8 hours attributed to a rewind and comprehensive overhaul. Turbine unit 4 was unavailable for service a total of 3,376.1 hours. The biggest outage factor was annual maintenance from August through November which required 2,728.3 hours. Turbine unit 5 was unavailable for service a total of 641.0 hours. The biggest outage factor was annual maintenance in July which required 556.7 hours. Turbine unit 6 was unavailable for service a total of 459.4

31
hours. The biggest outage factor was annual maintenance activities in December which used up 393.8 hours. In general, turbine unit availability was highest during the months of March – June and lowest during August – November.
Fish-related work did not cause much turbine unit unavailability during 2010. Nearly all fish-related outages were due to fish screen installation and removal activities and video inspections of the VBSs and ESBSs. Per the Ombil database sytem there were approximately 95 hours and 42 minutes (95.7 hours) of direct fish-related turbine unit outages during 2010. By comparison during 2009 and 2008 there were a recorded 131.6 hours, and 103.1 hours of outages, respectively. During 2010, there were also approximately 25 hours of unit outages related to trash raking activities in late February which were not included in the fish-related outages. Per Ombil, the following outage hours were directly related to fish work in 2010: Unit 1 (17.8 hours), unit 2 (20.6 hours), unit 3 (none, unit out of service nearly all year), unit 4 (21.4 hours), unit 5 (19 hours) and unit 6 (16.9 hours).
Forebay Debris/Trashracks Tashracks were raked for debris February 22-24, 2010. It initially appeared as if 2010 was going to be a low flow year but late season moisture quickly changed the situation and flows reached 200 kcfs for a few days in early June. The high flows resulted in some accumulation of debris in the forebay. Most of this debris was eventually spilled downstream through the RSW. Although debris levels were problematic at the juvenile fish facility during June, it was not necessary to rake trash racks a second time in 2010. Frequent inspection of the gatewells and hand dipping of debris off the gatewell surfaces helped prevent problems at the fish facility. Extended-length Submersible Bar Screens (ESBSs) All operating turbine units were equipped with ESBSs during the 2010 fish passage season. Winter maintenance on the screens was ongoing in late February and early March and an inspection of the screens was conducted in mid-March - just prior to installation. No significant problems of any kind were detected. Installation of fish screens was completed in all units by March 23. Every attempt was made to coordinate video inspections of the ESBSs during the course of the fish season as outlined in the Fish Passage Plan. While it is possible to get a good view of the VBSs with the existing video equipment, it is more difficult to get an accurate assessment of the ESBSs due to the limited amount of screen area detectable on the camera. Video inspections were conducted in April and May but were postponed on June 25 due to high water turbidity which prevented the camera operator from seeing anything. Rapidly improving conditions allowed for inspection of units 4-6 the following two days Video inspections were conducted jointly with VBS inspections during April, May, June, August, and October and no problems of any kind were detected on the ESBSs.
Operation of the ESBSs was relatively trouble-free during the 2010 season. Due to very high levels of debris passing through the system, it was necessary to increase the brush cycle times to once per hour in early June. This was backed off to once every 3-4 hours after debris

32
levels dropped off. Turbine unit 4 was taken out of operation on July 29 to replace a cleaning brush on an ESBS. There were no other significant problems with ESBSs during the 2010 operational season. All screens were raised and dogged off for the winter maintenance by December 20.
Vertical Barrier Screens (VBSs) New vertical barrier screens (VBSs) were installed in all turbine units during 1996. These screens have panels of plastic mesh on the front and 25% open area perforated plate on the back. In April of 2005, three experimental VBSs were installed in unit 4 and these screens remained in place during the entire 2010 fish season. During 2010, VBSs were inspected with an underwater video camera per FPP guidelines in conjunction with a limited inspection of the ESBSs. A few minor VBS problems were detected on those inspections. On the April 23-25 inspection six rivets were found missing off a retaining strap that secures the screen material on a VBS in slot 6A North. On the May 23 inspection, a small hole was found in a screen in slot 6A south. No new problems were detected on subsequent video inspections. These two items should be repaired during the 2011 winter season. Gatewells Gatewells were inspected during adult fishway inspections throughout the 2010 season for debris buildup, oil, dead fish, unusual concentrations of live fish, or anything else out of the ordinary. As in previous years, extended length bar screens and modified vertical barrier screens noticeably increased the turbulence in the gatewells. This caused debris to tumble around in the gatewells and exit through the orifices, rather than accumulate on the gatewell surfaces. Another factor in the lack of gatewell surface debris buildup was that gatewell drawdown with ESBSs was greater than with the earlier 20 foot traveling screens, putting the orifice closer to the surface, especially under minimum operating pool conditions. As was the case from 1998 - 2009, constant debris movement through the orifices prevented the need for extensive gatewell cleaning during 2010. Some larger debris was removed from individual gatewell surfaces with a small dipping basket when it appeared that it might cause problems with movement through the collection gallery orifices. This operation first took place on March 24 and continued throughout the season as circumstances warranted. Gatewell dipping took place only when the units were shut down for maintenance or were off line due to lack of water for generation. During nearly all of the 2010 collection season, surface debris coverage on the gatewells easily averaged less than 1% . Orifices and Collection Channel The Lower Granite juvenile collection channel was watered up on March 17, 2010 to accommodate fish screen installations. Bulkhead (downstream) slot orifices were operated in the usual manner during 2010 with at least one orifice per gatewell slot opened to divert fish into the

33
collection channel. Upstream (fish screen slot orifices) were operated to provide additional water and fish guidance as hydraulic conditions allowed. During 2007, the upstream gatewells (fish screen slots) were dipped to see if any fish were present (gatewells and Wagner Horns were sealed in the mid 1990s). Very few fish were found with the exception of fish screen slot 5B where approximately 50 steelhead and 50 Chinook were removed. Consequently, an orifice from slot 5B was left open during the entire 2010 fish collection season to ensure fish moved out of it safely. Orifices from the other fish screen slots were operated when hydraulic conditions in the gallery permitted. The air backflush orifice cleaning system worked well during 2010 and there were no significant maintenance issues of any kind. Due to the variability of the debris moving through the system, the project maintained a schedule of backflushing orifices every 3 hours around the clock from late March through the cessation of fish collection activities in late October. After that time orifice flushing activities were slightly reduced but still maintained on a regular basis to ensure no orifices were plugged and impeding fish passage. This operation continued until the system was shut down for the season on December 21, 2010. Primary Dewatering Structure Lower Granite’s primary dewatering structure consists of an inclined screen of stainless steel mesh, supported by heavy bar screen, just upstream from the porosity control perforated plate for the separator. There is no mechanical cleaning device on this screen. It is cleaned with a long handled brush or scraper at periods ranging from every hour to once or twice per day dependent on the amount of debris moving through the system. Debris buildup is usually not a problem. Exceptions are during periods of high wind when tumbleweed and other plant materials are blown into the river or during periods of high river flow when an excessive amount of small woody debris, such as wood chips or pine needles, is in the river. Debris spills can also dislodge fine material which can pass into the juvenile fish system and cause problems. Small invertebrates in the river can also plug the screen and make cleaning very difficult. During early June 2010 , high river flows resulted in the need to clean the screen on an hourly basis to prevent clogging. When the inclined screen on the separator system becomes severely clogged with debris, it is necessary to go into primary bypass mode by closing the dewatering valve below the screen and opening the 72-inch bypass valve. This takes pressure off the top of the inclined screen and allows debris to either float off or be easily brushed off. Typically it takes about 20 - 30 minutes of time to go through the entire cleaning procedure during which time fish are bypassed back to the river through the pipe at the base of the separator (primary bypass). Debris impingement on the inclined screen was not as much of a problem during 2010 as it was during 2009 but a couple dewatering events were still necessary to clear debris from the screen after it became too plugged to function properly. This happened on September 19 and again on September 21. Each cleaning event took almost an hour due to the impingement of fine debris in the screen and the need to powerwash the screen to clean it sufficiently. Separator technicians were able to stay away from having to dewater the inclined screen most of the season by cleaning the screen on an hourly basis when high levels of debris were moving through the

34
system. This was especially problematic during early to mid June when river flows were high. High winds on the evening of November 15 also put a lot of leaves and tumbleweed into the river which required frequent cleaning of the screen. Separator The separator at Lower Granite is a single stage separator and currently has no provision for size separation of juvenile fish. The separator functioned well during the 2010 season with the exception of the few periods of time when high levels of debris became an issue. It was necessary to check the separator exits more frequently than normal during June due to debris blockages. It was not necessary to partially dewater the separator bin (below the bars) to remove debris during 2010. After high debris levels dropped off in June, there were very few problems with the separator and related mechanisms. Both the 72-inch and 42-inch separator controller valves were replaced during the winter of 2003-2004 and they continued to perform flawlessly during the 2010 fish collection season. Operation of the separator in the normal collection/sampling mode took place from 0700 hours on March 25 through 0700 hours on October 31. In 2010 the separator was also operated in the standard mode (water over the bars) to monitor for late season PIT-tagged juveniles passing through the system in November and December. (Unlike other sites, Lower Granite does not have a full flow bypass with PIT-tag detection for juvenile fish. PIT-tag detection of juveniles normally ceases with the end of separation activities on the last of October.) No sampling or handling of juvenile fish took place during the extended separator operations. They were simply routed through the separator and out the long bypass pipe back to the river (secondary bypass) through December 15. The JFF maintenance crew also had electric/diesel heaters available for use under the separator and other exposed areas. Maintenance and separator personnel started the heaters whenever overnight temperatures made frost damage likely. This provided an additional backup tool for freezing temperatures.
A serious clog developed in the separator secondary bypass line on the morning of November 8. JFF maintenance personnel were finally able to clear the line by running an extended length of air hose down the pipe. After several efforts, the clog was finally cleared and a significant amount of material was flushed out the pipe to the river. Secondary bypass operations then continued without issue through the rest of the extended season. Severe cold weather developed in late November and it was necessary to switch the separator system over to primary bypass at 0940 hours on November 22. Temperatures dropped into the zero range and frost damage would probably have occurred had we continued to operate in secondary bypass. The weather moderated enough that the separator was switched back to secondary bypass at 0830 hours on November 26. This interlude was the only interruption to late season monitoring for PIT-tagged juveniles. Weather conditions remained favorable enough to continue monitoring through December 15. During 2010 we continued to observe small chinook jacks in the daily samples in September. Numbers this season did not reach the higher numbers that were observed in 2009

35
when the sample holding tank became crowded with the smaller jacks that managed to fall through the separator bars. When held in a sample tank with the much smaller juvenile fish they can injure the smaller fish – particularly when they thrash around in the anesthetizing bins. In order to alleviate this problem, we installed a set of smaller separator bars over the separator bin in 2009. The smaller bars were installed in September and removed following the end of collection activities in November. The bars measured 1 inch in diameter, were constructed of rigid wall aluminum tubing, and were spaced approximately 1 1/16 to 1 1/8 inches apart. They were built in three full length panels and secured in place overlaying the existing separator bars. Although it was discussed, we did not install them in 2010 due to the lower numbers of jacks crossing the separator and ending up in the sample holding tank. Sample System/PIT Tag System The sample system at Lower Granite consists of two slide gates located in the bottom of the separator exit flumes a few feet downstream of the separator, a large slide gate which separates PIT-tagged fish from sample fish, a PIT-tag tank and routing system to a holding tank or the river, a sample tank with four operational 4-inch counter tunnel exits, an enclosed pipe that carries fish from the sample tank to a sample holding tank which is divided into two equal halves (each with two pre-anesthetizing chambers). The two primary slide gates, which are controlled by a touch pad calibrated to within 0.001%, also act as PIT-tag diversion gates. The system has the capability to send PIT-tagged fish that exit the separator during a sample either to the sample or to the river. Most of the time, the system is set so the sample overrides the PIT-tag diversion system, sending PIT-tagged fish to the sample instead of being diverted back to the river. During 2010 this occurred from startup on March 25 until the morning of August 4. From 0700 hours on August 4 until the end of normal separator operations on October 31, the PIT-tag diversion system was set to divert all PIT-tagged fish and override the sample diversion gate.
At the start of the season on March 25 the sample gates were set to divert 10% of the fish to the sample while the remaining fish were diverted back to the river through the bypass outfall pipe. Samples were taken four to six times per hour during the course of the season until August 16 when the system was switched to a 100% sample rate. The sample rate remained at 100% for most of the extended season but was reduced to less than 100% on September 21, October 5-9, and October 11-13 due to too many fish in the sample and the lab not finishing the sample until late in the morning. This was impacting the departure of fish transport trucks to Bonneville. Weekly sample rates ranged from 0.500% to 50.000% prior to the 100% sample period. During the course of the season, the sample system only needed minor adjustments in air pressure and gate timing by Pacific States Marine Fisheries Commission personnel.
A new slide gate system with PIT-tag detection capabilities was added to the flume
leading to the upstream raceways and bypass outfall pipe during the 2007 winter outage period. This system was installed by NOAA-Fisheries and PSMFC personnel between March 12 and March 21, 2007. The system now has four modes: 1) bypass marking, 2) bypass, 3) general collection, and 4) marking. When the system is in bypass marking mode all fish are diverted to the raceways for marking purposes except sort by code fish which are bypassed back to the river. When the system is in bypass mode all fish are diverted through the bypass outfall pipe (secondary bypass) to the river. When the system is in general collection mode, fish are diverted
36
down the flume to the east raceways for normal collection and marking activities. And finally when the system is set for marking mode, previously PIT-tagged fish (sort by code) are diverted to raceway 10 through an additional pipe to avoid being handled again. Untagged fish are routed down the flume for normal marking activities. This system continued to work well during 2010.
Barge/Truck Loading Operations It has long been the policy at Lower Granite to try and load as many fish as possible directly onto fish barges to avoid raceway loading/holding. This decreases handling a second time and is thought to reduce the overall stress to the fish. During 2010, an estimated 44.4% of the smolts barged from Lower Granite (1,499,663 smolts out of 3,378,007 smolts barged) were direct loaded into barges at Lower Granite. This is somewhat better than in recent years. In 2009 approximately 1,338,413 smolts were direct loaded onto barges at Lower Granite out of a total of 4,112,943 barged (32.5%). Direct load percentages at Lower Granite for other recent years were: 2008 (38.8%), 2007 (24.5%), and 2006 (17.3%). The ability to direct load is dependent a number of factors including time of arrival of fish barges, spill patterns, total river flow and fish marking operations. The increased diversion of fish into the upstream raceways to accommodate NOAA-Fisheries research marking operations has significantly impacted the direct-loading of fish onto barges at Lower Granite in recent years.
Recommendations
1. Install a generator to power the fish facility during electrical outages. 2. Refurbish the existing separator, inclined screen, sampling system, and major pvc pipes (if a
new fish facility is not built in the next few years). 3. Tune up/recondition the Cat engines on barges 8105 and 8106 and develop a plan to
tune/repair/overhaul engines on the remaining barges over a several year period. 4. Pour concrete to serve as ballast in fish barges 4394 and 4382. Paint exterior of both barges
while concrete work is being done. (Try to contract this work in FY 2011). 5. Refurbish the concrete on the raceway interiors based on results from the test strips in
raceway #10 – optional, pending new fish facility construction. 6. Paint exteriors of all fish barges. 7. Replace the lab chiller system. (The chiller for the recirculation system is unable to keep the recirculation water at spring/summer temperatures.) 8. Refurbish the chain drive system for the sample holding tank. 9. Increase size of catch basin which is used to drain water from garbage cans holding research fish from the sample. 10.Install or remove push knees (as needed) on the barges and explore a new bumper system to use in place of the present cable and tire system.
37
Acknowledgements
A total of 22 people were employed in various capacities at the Lower Granite Juvenile Fish Facility during 2010. Corps of Engineers biologists in charge of collection and transportation activities were Mike Halter (project fishery biologist) and Ches Brooks (assistant project fishery biologist). Corps technicians assigned to the barges were: Suzette Frazier, Gene Sprofera, Robert Traufer, and John Dammann. Corps separator technicians were: Robert Horal, Gary Fitzgerald, Randal Loges, and Bill Van Vogt. The Corps maintenance and truck driving staff consisted of Floyd Hunt and Raymond Cooper. Bradley Clarke served as the engineering equipment operator leader. John Richter served as a heavy mobile equipment operator until April. Following his departure, Gary Mellstrom served as a biological technician and filled in on mechanical maintenance on the fish barges. Washington Department of Fish and Wildlife (WDF&W) Biologists in charge of COE Transport Oversight Contract activities and Smolt Monitoring Program activities were Shawn Rapp (Task Order Biologist), Fred Mensik, and Alan Martin. The WDF&W also employed Mona Hacker, and Jessica Young as sample technicians and Kerry Brooks and Serena Bravard as anesthetists.