Assessment of resource efficiency indicators and...
102
Assessment of resource efficiency indicators and targets Final report European Commission, DG Environment 19 June 2012
Transcript of Assessment of resource efficiency indicators and...
Assessment of resource efficiency indicators and targets
Final report
European Commission, DG Environment 19 June 2012
2 | Assessment of resource efficiency indicators and targets
Document information
CLIENT European Commission, DG Environment
CONTRACT NUMBER 07.0307/2010/580623/ETU/C1 implementing Framework Contract number ENV.G.4/FRA/2008/0112
REPORT TITLE Final report
PROJECT NAME Assessment of resource efficiency indicators and targets
PROJECT CODE SP-0058 / CEENV_FWC_SMR1009
PROJECT TEAM BIO Intelligence Service (BIO), Institute for Social Ecology (SEC) and Sustainable Europe Research Institute (SERI)
PROJECT OFFICER Josefina Lindblom & Werner Bosmans
DATE 6 February 2012
AUTHORS Shailendra Mudgal, BIO Intelligence Service Adrian Tan, BIO Intelligence Service Sarah Lockwood, BIO Intelligence Service
Nina Eisenmenger, Institute of Social Ecology Marina Fischer-Kowalski, Institute of Social Ecology
Stefan Giljum, SERI Martin Brucker, SERI
KEY CONTACTS Shailendra Mudgal, [email protected] Adrian Tan, adrian.tan@biois;com
ACKNOWLEDGEMENTS Several experts from the European Commission, DG Environment, Eurostat, JRC, the European Environment Agency and external experts have contributed with comments during the course of the project.
DISCLAIMER The project team does not accept any liability for any direct or indirect damage resulting from the use of this report or its content. This report contains the results of research by the authors and is not to be perceived as the opinion of the European Commission.
Please cite this publication as:
BIO Intelligence Service, Institute for Social Ecology and Sustainable Europe Research Institute
(2012) Assessment of resource efficiency indicators and targets. Final report prepared for the European Commission, DG Environment.
Photo credit: cover @ Per Ola Wiberg
Assessment of resource efficiency indicators and targets | 3
Table of Contents
CHAPTER 1: INTRODUCTION 17
1.1 Background 17
1.2 Objectives of the study 19
1.3 Scope 19
1.4 Methodology 21
1.5 Structure of the report 22
CHAPTER 2: REVIEW OF INDICATORS AND TARGETS 23
2.1 DPSIR framework 23
2.2 Resource efficiency indicators 24
2.3 Existing resource use and resource efficiency targets 26
2.3.1 Resource use related environmental impact indicators 27
2.4 Approaches to proposing targets for policy 27
CHAPTER 3: EVALUATION OF INDICATORS 30
3.1 Methodology 30
3.2 Results from the RACER evaluation 32
3.3 General structure of the basket 35
3.3.1 Two levels: headline indicators and specific indicators 35
3.3.2 Two modules: resource use-oriented and environmental impact-oriented indicators 36
3.3.3 Two perspectives: domestic resource use and global resource demand 36
3.3.4 Other important features of the basket 37
3.4 Suggested basket of indicators 38
3.5 Evaluation of the basket of indicators 44
3.5.1 RACER evaluation of the resource use-oriented module 45
3.5.2 Specific evaluation of the resource use-oriented module 48
3.5.3 RACER evaluation of the environmental impact-oriented module 50
3.5.4 Specific evaluation of the environmental impact-oriented module 54
3.5.5 Assessment of the complementarities of the four main categories of resource use 55
3.6 Empirical results of the indicators included in the basket 58
3.6.1 Resource use-oriented indicators 58
3.6.2 Environmental impact-oriented indicators 61
3.7 Key findings from the evaluation of the proposed basket of indicators 65
4 | Assessment of resource efficiency indicators and targets
CHAPTER 4: EVALUATION OF TARGET SETTING 66
4.1 The approach to target setting 66
4.2 Overview of existing targets in the EU and EU Member States 67
4.3 Proposed set of targets 68
4.4 Analysis of the links between and the plausibility of targets across indicators 70
4.4.1 Climate: GHG emissions 71
4.4.2 Energy Use: Gross Inland Energy Consumption (GIEC) 71
4.4.3 Material Use: Domestic Material Consumption (DMC) 72
4.4.4 Material Use: Environmentally Weighted Material Consumption (EMC) 75
4.4.5 Land Use: Domestic Land Demand 76
4.4.6 Land Use: Human Appropriation of Net Primary Production (HANPP) 77
4.4.7 Water use 78
4.5 Targets and the application on different levels 78
4.6 Focussing on multi-return strategies 79
4.7 Proposal of a range of targets 80
CHAPTER 5: SCENARIO ANALYSIS 82
5.1 Baseline scenario 82
5.1.1 Energy and climate change 83
5.1.2 Material consumption 84
5.1.3 Land use 86
5.1.4 Water use 87
5.2 Scenario with proposed resource use targets 87
5.2.1 Climate change 88
5.2.2 Energy consumption 89
5.2.3 Material consumption 90
5.2.4 Land use 93
5.2.5 Water use 93
5.3 Summary of findings from the target scenario analysis 94
CHAPTER 6: RECOMMENDATIONS: MOVING FORWARD WITH EXISTING
INDICATORS 96
6.1 The next steps for setting targets 96
6.1.1 Further development and implementation of indicators 96
6.1.2 Develop the knowledge base for impact assessments 99
6.1.3 Involve external actors and stakeholders in the process of target setting 100
Assessment of resource efficiency indicators and targets | 5
List of Tables
Table 1: The basket of resource use relevant indicators 8
Table 2: Overview of the assessment of the economic and technical feasibility of achieving the
proposed range of targets 13
Table 3: Overview of targets with clear links to environmental thresholds 27
Table 4: List of indicators covered in the evaluation 31
Table 5: Summary results from RACER evaluation 33
Table 6: The two-level structure of the basket of indicators 35
Table 7: Issues addressed by resource use-oriented and environmental impact-oriented indicators
36
Table 8: The basket of resource use relevant indicators 38
Table 9: Strengths and weaknesses of resource use-oriented indicators in the basket 40
Table 10: Strengths and weaknesses of environmental impact-oriented indicators in the basket 42
Table 11: Summary of existing targets 68
Table 12: Proposed set of targets in relation to 2005 as base year 69
Table 13: Overview of the proposal for resource use targets for different ambition levels 81
Table 14: Scenarios for biomass for renewable energy in the EU in Mtoe 89
Table 15: Overview of the assessment of the economic and technical feasibility of achieving the
proposed range of targets 95
List of Figures
Figure 1: The proposed resource use targets and their links 10
Figure 2: Representation of double decoupling: resource and impact decoupling (UNEP, 2011) 18
Figure 3: Inter-linkages between the use of natural resources and the state of human health and
natural environment 21
Figure 4: The DPSIR framework (EEA, 2003) 24
Figure 5: The three indicator categories needed to measure resource efficiency 25
Figure 6: Examples of the interdependencies of resource use 56
Figure 7: Approximate distribution of the main resource types for the various headline indicators
56
6 | Assessment of resource efficiency indicators and targets
Figure 8: Domestic Material Consumption per capita (Eurostat, 2011) 58
Figure 9: Gross Inland Energy Consumption per capita (Eurostat, 2011) 59
Figure 10: Water Abstraction (only blue water) per capita (Eurostat, 2011) 60
Figure 11: Water Footprint (blue & green water) per capita (Water Footprint Network, 2011) 60
Figure 12: Domestic Land Demand per capita (EEA & ETC LUSI, 2011) 61
Figure 13: Environmentally-weighted Material Consumption per capita (Universiteit Leiden, 2011)
62
Figure 14: Territorial GHG Emissions per capita (Eurostat, 2011) 62
Figure 15: Carbon Footprint per capita, 2001 (Hertwich & Peters, 2009) 63
Figure 16: Water Exploitation Index (EEA, 2011) 64
Figure 17: Human Appropriation of Net Primary Production (Haberl et al., 2007) 64
Figure 18: Links between resource use targets 70
Figure 19: The baseline scenario for Gross Inland Energy Consumption in EU-27 until 2050 83
Figure 20: The baseline scenario for domestic greenhouse gas emissions in EU-27 until 2050 84
Figure 21: The baseline scenario for Domestic Material Consumption in EU-27 until 2050 85
Figure 22: The baseline scenario for Domestic Extraction Used in EU-27 until 2050 85
Figure 23: The baseline scenario for material exports in EU-27 until 2050 86
Figure 24: The baseline scenario for material imports in EU-27 until 2050 86
Figure 25: The baseline scenario for domestic land use in EU-27 until 2050 87
Assessment of resource efficiency indicators and targets | 7
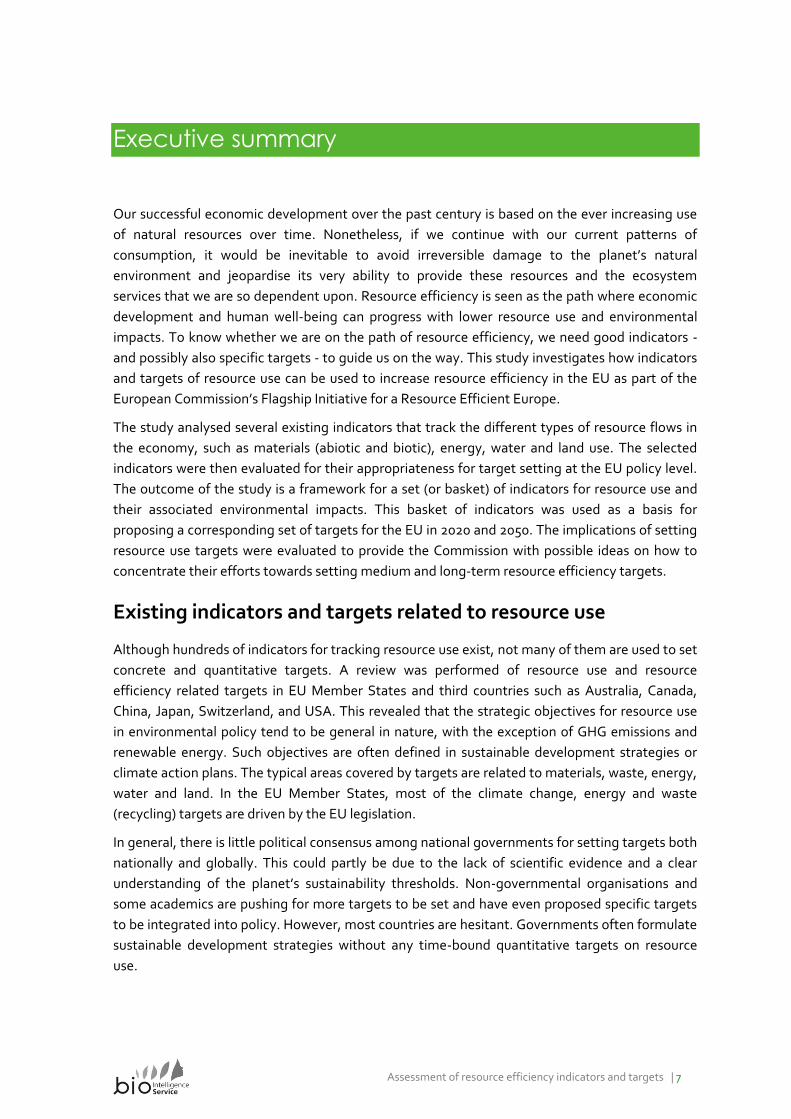
Executive summary
Our successful economic development over the past century is based on the ever increasing use
of natural resources over time. Nonetheless, if we continue with our current patterns of
consumption, it would be inevitable to avoid irreversible damage to the planet’s natural
environment and jeopardise its very ability to provide these resources and the ecosystem
services that we are so dependent upon. Resource efficiency is seen as the path where economic
development and human well-being can progress with lower resource use and environmental
impacts. To know whether we are on the path of resource efficiency, we need good indicators -
and possibly also specific targets - to guide us on the way. This study investigates how indicators
and targets of resource use can be used to increase resource efficiency in the EU as part of the
European Commission’s Flagship Initiative for a Resource Efficient Europe.
The study analysed several existing indicators that track the different types of resource flows in
the economy, such as materials (abiotic and biotic), energy, water and land use. The selected
indicators were then evaluated for their appropriateness for target setting at the EU policy level.
The outcome of the study is a framework for a set (or basket) of indicators for resource use and
their associated environmental impacts. This basket of indicators was used as a basis for
proposing a corresponding set of targets for the EU in 2020 and 2050. The implications of setting
resource use targets were evaluated to provide the Commission with possible ideas on how to
concentrate their efforts towards setting medium and long-term resource efficiency targets.
Existing indicators and targets related to resource use
Although hundreds of indicators for tracking resource use exist, not many of them are used to set
concrete and quantitative targets. A review was performed of resource use and resource
efficiency related targets in EU Member States and third countries such as Australia, Canada,
China, Japan, Switzerland, and USA. This revealed that the strategic objectives for resource use
in environmental policy tend to be general in nature, with the exception of GHG emissions and
renewable energy. Such objectives are often defined in sustainable development strategies or
climate action plans. The typical areas covered by targets are related to materials, waste, energy,
water and land. In the EU Member States, most of the climate change, energy and waste
(recycling) targets are driven by the EU legislation.
In general, there is little political consensus among national governments for setting targets both
nationally and globally. This could partly be due to the lack of scientific evidence and a clear
understanding of the planet’s sustainability thresholds. Non-governmental organisations and
some academics are pushing for more targets to be set and have even proposed specific targets
to be integrated into policy. However, most countries are hesitant. Governments often formulate
sustainable development strategies without any time-bound quantitative targets on resource
use.
8 | Assessment of resource efficiency indicators and targets
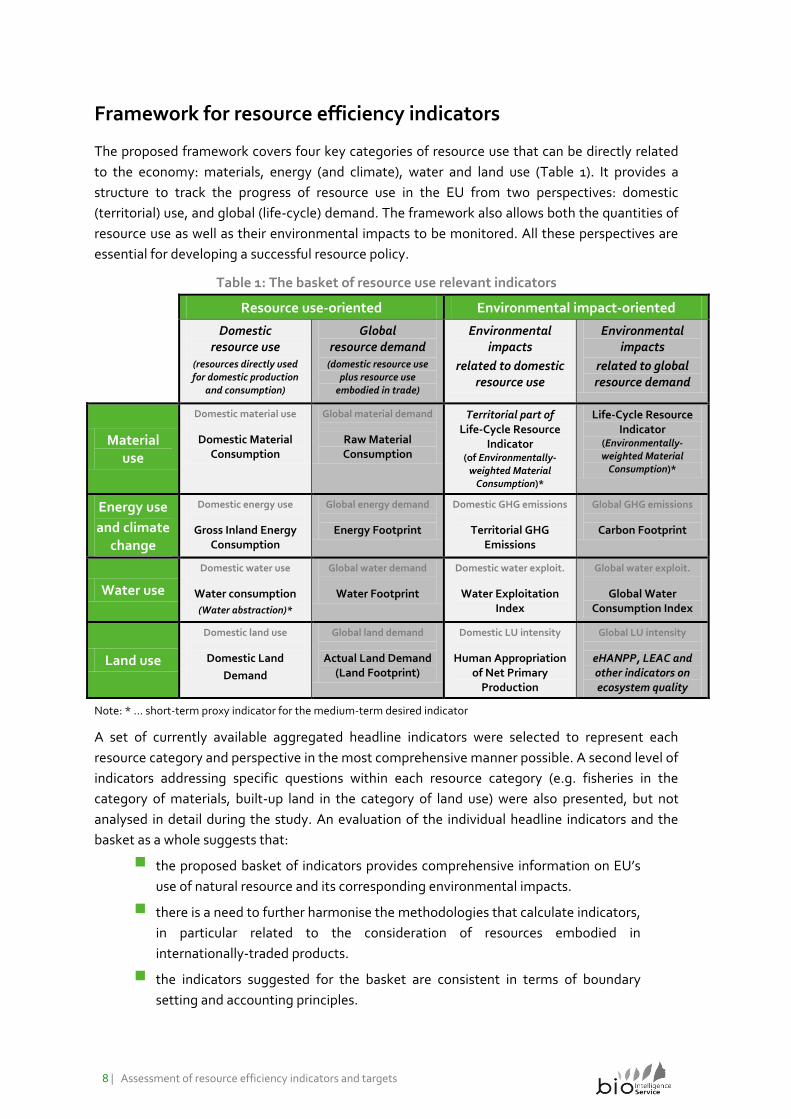
Framework for resource efficiency indicators
The proposed framework covers four key categories of resource use that can be directly related
to the economy: materials, energy (and climate), water and land use (Table 1). It provides a
structure to track the progress of resource use in the EU from two perspectives: domestic
(territorial) use, and global (life-cycle) demand. The framework also allows both the quantities of
resource use as well as their environmental impacts to be monitored. All these perspectives are
essential for developing a successful resource policy.
Table 1: The basket of resource use relevant indicators
Resource use-oriented Environmental impact-oriented
Domestic resource use
(resources directly used for domestic production
and consumption)
Global resource demand
(domestic resource use plus resource use
embodied in trade)
Environmental impacts
related to domestic resource use
Environmental impacts
related to global resource demand
Material use
Domestic material use
Domestic Material Consumption
Global material demand
Raw Material Consumption
Territorial part of Life-Cycle Resource
Indicator (of Environmentally-
weighted Material Consumption)*
Life-Cycle Resource Indicator
(Environmentally-weighted Material
Consumption)*
Energy use
and climate change
Domestic energy use
Gross Inland Energy Consumption
Global energy demand
Energy Footprint
Domestic GHG emissions
Territorial GHG Emissions
Global GHG emissions
Carbon Footprint
Water use
Domestic water use
Water consumption
(Water abstraction)*
Global water demand
Water Footprint
Domestic water exploit.
Water Exploitation Index
Global water exploit.
Global Water Consumption Index
Land use
Domestic land use
Domestic Land
Demand
Global land demand
Actual Land Demand (Land Footprint)
Domestic LU intensity
Human Appropriation of Net Primary
Production
Global LU intensity
eHANPP, LEAC and other indicators on ecosystem quality
Note: * ... short-term proxy indicator for the medium-term desired indicator
A set of currently available aggregated headline indicators were selected to represent each
resource category and perspective in the most comprehensive manner possible. A second level of
indicators addressing specific questions within each resource category (e.g. fisheries in the
category of materials, built-up land in the category of land use) were also presented, but not
analysed in detail during the study. An evaluation of the individual headline indicators and the
basket as a whole suggests that:
the proposed basket of indicators provides comprehensive information on EU’s
use of natural resource and its corresponding environmental impacts.
there is a need to further harmonise the methodologies that calculate indicators,
in particular related to the consideration of resources embodied in
internationally-traded products.
the indicators suggested for the basket are consistent in terms of boundary
setting and accounting principles.
Assessment of resource efficiency indicators and targets | 9
all indicators suggested for the basket can be linked to economic data to
establish indicators on resource efficiency.
the basket of resource use indicators would need to be complemented by other
indicators on natural stocks (e.g. availability of freshwater, resource depletion)
and environmental risks (e.g. consequences of nuclear energy and genetically
modified organisms (GMOs)).
Setting targets related to resource use
A target sets a clear orientation, it provides concrete guidance and helps prioritise actions to
achieve a policy objective. If properly enforced and supported by an appropriate mix of policy
measures to ensure fair global market conditions and a level playing field, it can be a powerful
approach to addressing environmental issues. Long-term objectives provide actors in society,
e.g. governmental organisations and companies, certainty, stability and time to achieve the
target in the most efficient manner.
Scientific knowledge about environmental thresholds and carrying capacity can serve as a
starting point for defining acceptable levels of risk and environmental impact on which a target
could be set. For resources such as fossil fuels, land, water and fish stocks, there is some
understanding of the limits to when long-term depletion and degradation occurs. For other
energy and material resources, the limitation of the resource base is less clear. Instead, the
knowledge of the absorption capacities of nature’s ecosystems could be used for target setting. A
clear example of this is the limit of a maximum 2°C rise in global mean temperature, or 350 ppm
CO2 in the atmosphere, which is used to define EU’s GHG emissions targets.
An important aspect when proposing targets is determining the most appropriate level to set the
target. The majority of indicators in the proposed basket of indicators have strong links to socio-
economic activities and entities, e.g. material consumption and GHG emissions. Some of the
indicators are however more relevant on a specific ecosystem scale rather than a national/
economy-wide level, e.g. river basins are more suitable for water indicators, human harvest or
HANPP (Human Appropriation of Net Primary Production) is more relevant for agro-ecological
zones. Another important consideration is how EU-wide targets could be disaggregated to
Member State level or across different sectors of the economy. Some possible approaches
include disaggregation according to equity of effort sharing, relative ease/difficulty to achieve
the target, demographic characteristics, economic structure and features of the ecosystems
including climate.
The cost-effectiveness of setting a target is an important aspect of any target-setting exercise.
Although the Flagship Initiative recommends a clear vision and objectives to guide resource
efficiency policy in the EU, target oriented policy may not always be the best approach.
Depending on how a target and its associated indicator are defined, the mix of supporting policy
instruments, and how they are implemented, target setting could lead to unintended
consequences. This is of particular importance when considering how the use of resources is
interlinked. For example, the targets set for biofuels in transport can have significant
consequences for global land use.
10 | Assessment of resource efficiency indicators and targets
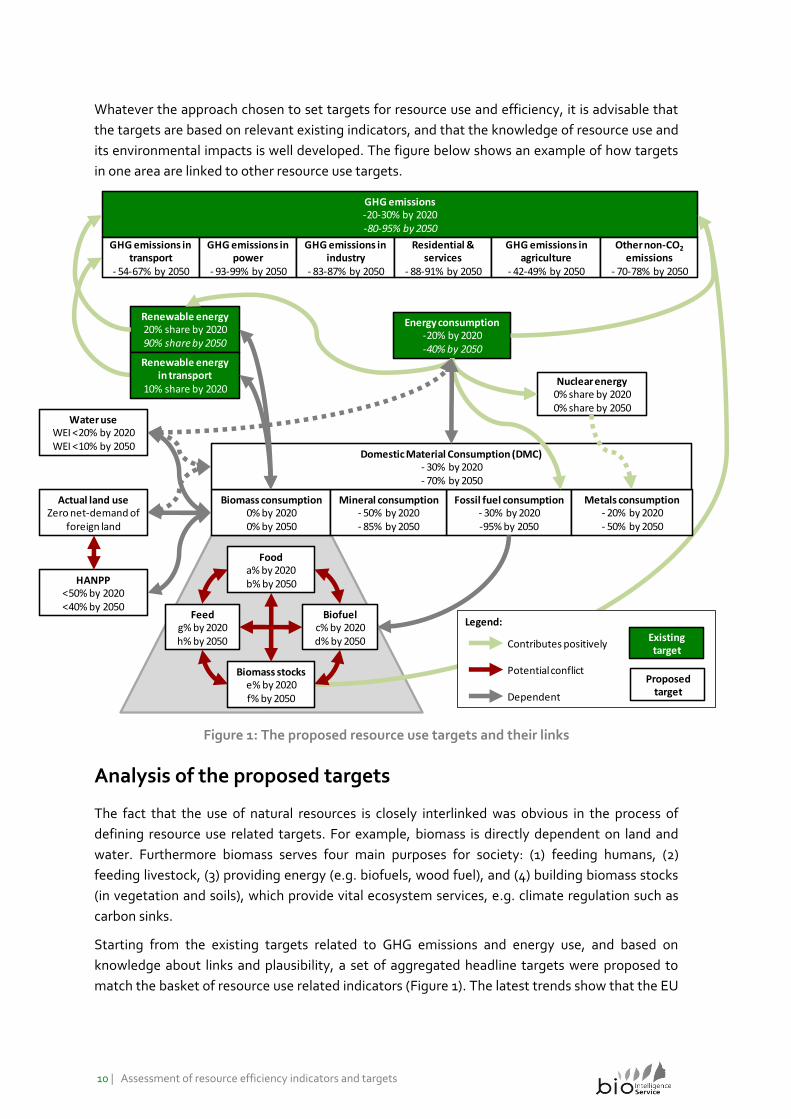
Whatever the approach chosen to set targets for resource use and efficiency, it is advisable that
the targets are based on relevant existing indicators, and that the knowledge of resource use and
its environmental impacts is well developed. The figure below shows an example of how targets
in one area are linked to other resource use targets.
Legend:
Contributes positively
Potential conflict
Dependent
Energy consumption-20% by 2020-40% by 2050
Renewable energy20% share by 202090% share by 2050
GHG emissions-20-30% by 2020-80-95% by 2050
Renewable energy in transport
10% share by 2020
GHG emissions in transport
- 54-67% by 2050
Fossil fuel consumption- 30% by 2020-95% by 2050
Fooda% by 2020b% by 2050
Biomass consumption0% by 20200% by 2050
Metals consumption- 20% by 2020- 50% by 2050
Mineral consumption- 50% by 2020- 85% by 2050
Domestic Material Consumption (DMC)- 30% by 2020- 70% by 2050
GHG emissions in power
- 93-99% by 2050
GHG emissions in industry
- 83-87% by 2050
Residential & services
- 88-91% by 2050
GHG emissions in agriculture
- 42-49% by 2050
Other non-CO2
emissions- 70-78% by 2050
Water useWEI <20% by 2020WEI <10% by 2050
Actual land useZero net-demand of
foreign land
HANPP<50% by 2020<40% by 2050
Nuclear energy0% share by 20200% share by 2050
Existing target
Feedg% by 2020h% by 2050
Biofuelc% by 2020d% by 2050
Biomass stockse% by 2020f% by 2050
Proposed target
Figure 1: The proposed resource use targets and their links
Analysis of the proposed targets
The fact that the use of natural resources is closely interlinked was obvious in the process of
defining resource use related targets. For example, biomass is directly dependent on land and
water. Furthermore biomass serves four main purposes for society: (1) feeding humans, (2)
feeding livestock, (3) providing energy (e.g. biofuels, wood fuel), and (4) building biomass stocks
(in vegetation and soils), which provide vital ecosystem services, e.g. climate regulation such as
carbon sinks.
Starting from the existing targets related to GHG emissions and energy use, and based on
knowledge about links and plausibility, a set of aggregated headline targets were proposed to
match the basket of resource use related indicators (Figure 1). The latest trends show that the EU
Assessment of resource efficiency indicators and targets | 11
is on track in meeting its 2020 target for GHG emissions. It is now considering extending this to a
more ambitious target for 2050. Following are the key findings:
GHG emissions
The Commission has already assessed the impacts of an 80% reduction of GHG emissions by
2050 compared to 1990. It showed that this target could be achieved by maintaining (and in
some cases even increasing) activity levels. Depending on early investment in different (known)
technology assumptions and global action, this could be cost-effective and lead to lowering fuel
costs. High investments are required, but this offers opportunities for economic growth and job
creation. A reduction of domestic GHG emissions would encourage the diffusion of renewable
energy and thereby increase security of energy supply. Furthermore, a reduction of GHG
emissions would also reduce SO2, NOx and PM emissions that would benefit the environment and
human health.
A less ambitious target would increase fuel costs and supply risk, besides aggravating the effects
of climate change. A more ambitious target (e.g. 95% reduction of GHG emissions by 2050
compared to 1990) is technically and economically feasible, but would require greater
infrastructure investments and a lower demand and modal shift in the transport sector.
Energy consumption
A target for GHG emissions would also drive energy efficient technologies and thereby lead to a
reduction in energy consumption. The 80% GHG emission reduction target by 2050, would lead
to a 30% reduction in (gross inland) energy consumption in 2050 (compared to 2000). This GHG
emission target will also require the EU to abandon fossil fuels and instead rely on renewable
energy sources. Biomass would provide about two thirds of the renewable energy until the other
renewable energy technologies establish themselves over the next two decades. The share of
biomass energy will then decrease but remain the principal renewable energy source well into
the future.
Material consumption
Reductions in fossil fuel energy consumption would be proportional to reductions in domestic
material consumption (DMC) and imports. Due to the increase in demand for bioenergy, it would
be difficult to reduce DMC of biomass. However, due to favourable biogeographical conditions
(climate and soils) and a high availability of productive land per capita, the EU has the potential
of being self-sustaining with regard to food and other uses of biomass. There is evidence that
Europe has sufficient sources of domestic ‘environmentally compatible’ bioenergy to cover its
demand. Without adequate policies in place, this would undoubtedly compete against food
production and put pressure on global land use change resulting in unintended negative
environmental and social consequences. A possible response to decreasing the demand of
biomass production is to lower the amount of animal based products in the EU average diet and
thus lower demand for animal fodder.
Although metals only constitute a small share (under 4%) of overall DMC, they contribute
significantly to the EU economy and global environmental impacts. Setting ambitious targets to
encourage more efficient use of metals would be cost-effective, environmental beneficial and
limit dependence on foreign imports (particularly for the critical raw materials). It is possible to
12 | Assessment of resource efficiency indicators and targets
reduce the DMC of metals, but only to a certain extent as they are required for the construction
and production of energy efficient products and infrastructure. Many of the rare earths which
have been identified as critical raw materials for the EU are needed for many low carbon
technologies.
Construction minerals (even excluding sand and gravel) constitute the greatest share of non-
metallic mineral DMC. At present it seems difficult to set very ambitious targets to reduce DMC
as the majority of construction materials are needed to maintain the existing building stock and
infrastructure. The shares of the input flows needed for replacement at end-of-life are estimated
at about 63-90% for the transportation network and 88% for buildings - much larger than the
ones related to infrastructure expansion. Even when applying the full (theoretical) potential of
construction and demolition waste recycling, only 25% of current construction minerals DMC
would be reduced. Given the known technologies and level of (economic) activity, further
reductions of DMC might not be cost effective.
Land use
It is evident that without greater yields, it will not be possible to increase biomass production
without increasing land use. There is evidence to support that it is possible to increase yields in
the EU without putting more pressure on the environment (e.g. without increasing water
abstraction, mineral fertiliser use and nutrient loss). As mentioned, the EU is capable of being
self-sufficient in biomass, but the target for zero net demand of global land should not
compromise the competitive trade advantage of growing crops in the biogeographic regions that
are most productive and best suited. The proposal to halt the (net) increase of artificial land is
feasible and would support the other resource use targets. Densification of existing built-up land
can increase energy efficiency and reduces the demand for construction metals and minerals. It
would further reduce the negative impacts on the environment such as soil sealing and
fragmentation of natural habitats.
Human harvest
HANPP (Human Appropriation of Net Primary Production) – a measure for the amount of
biomass removed from the land - varies across different land use categories. Cropland is typically
characterised by high HANPP levels at or above 85%, whereas forests have low HANPP values
below 30%. Depending on land cover patterns and the intensity of land use, domestic HANPP
across European countries differs widely. The overall target for the EU-27 of stabilising average
HANPP at 50% or reducing it to 40% should not be applied equally to individual Member States.
Countries with less favourable conditions for intensive land use (e.g. Sweden, Finland and
Slovenia) should maintain low levels of HANPP, whereas countries with productive land suitable
for agricultural production (e.g. the Netherlands, Hungary, Denmark and the Czech Republic)
should still engage in agriculture – and thus can have levels above the target level. However,
HANPP in regions with high suitability for intensive cropland agriculture should not exceed 75%
in order to stay within sustainable limits. In other words, stabilising or reducing average HANPP
in Europe may require a stabilisation or increase in extensive land use types, and a sustainable
intensification on the best agricultural land. Although targets for HANPP need to take the
specific agro-ecologic areas into consideration, it can lead the way to more sustainable
agriculture practices by improving soil quality and determining environmental thresholds.
Assessment of resource efficiency indicators and targets | 13
Water use
Major methodological gaps do not allow a target based on water abstraction to be formulated at
the moment. The Commission is currently developing appropriate indicators to set water
efficiency targets. To complete the basket of indicators, the project team referred to the EEA
recommendations that water abstraction should stay below 20% of available renewable
freshwater resources (Water Exploitation index). There are many existing solutions and best
practices that would allow this target to be achieved without compromising agricultural yields
and fulfilling the needs of the economy. But due to a lack of data and understanding of water use
at a river basin level, it is not clear how cost effective such a target would be.
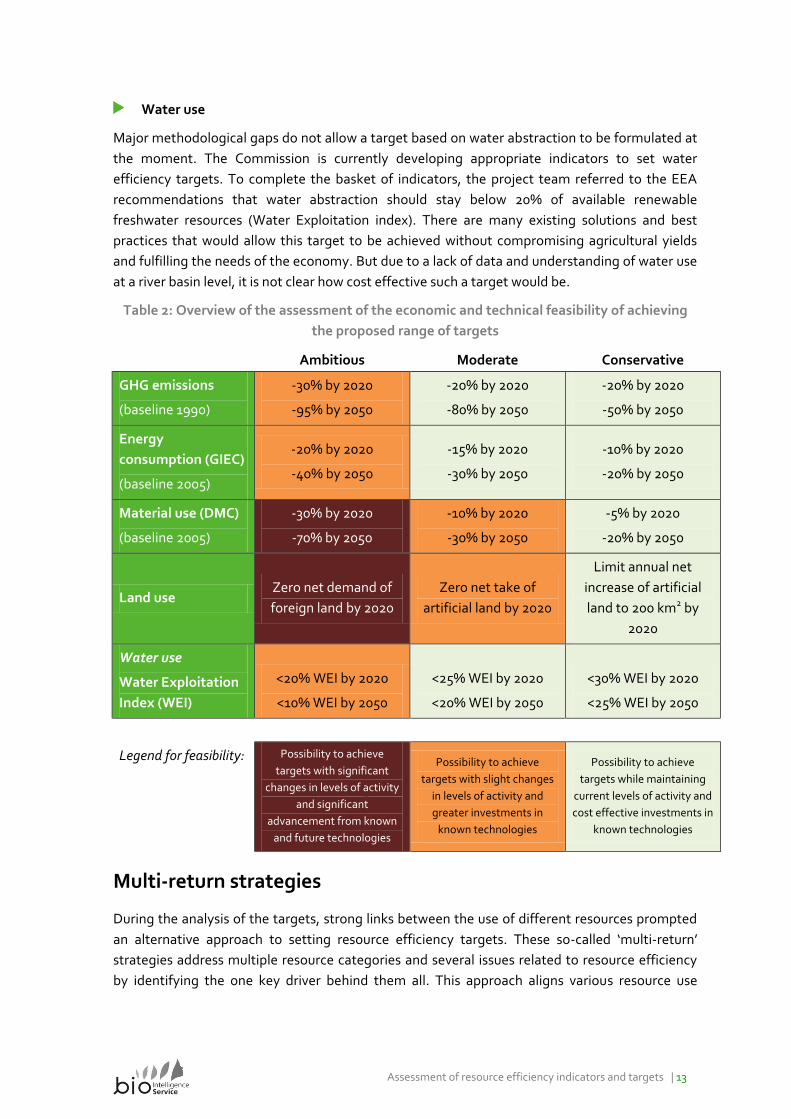
Table 2: Overview of the assessment of the economic and technical feasibility of achieving
the proposed range of targets
Ambitious Moderate Conservative
GHG emissions
(baseline 1990)
-30% by 2020
-95% by 2050
-20% by 2020
-80% by 2050
-20% by 2020
-50% by 2050
Energy
consumption (GIEC)
(baseline 2005)
-20% by 2020
-40% by 2050
-15% by 2020
-30% by 2050
-10% by 2020
-20% by 2050
Material use (DMC)
(baseline 2005)
-30% by 2020
-70% by 2050
-10% by 2020
-30% by 2050
-5% by 2020
-20% by 2050
Land use Zero net demand of
foreign land by 2020
Zero net take of
artificial land by 2020
Limit annual net
increase of artificial
land to 200 km2 by
2020
Water use
Water Exploitation
Index (WEI)
<20% WEI by 2020
<10% WEI by 2050
<25% WEI by 2020
<20% WEI by 2050
<30% WEI by 2020
<25% WEI by 2050
Legend for feasibility: Possibility to achieve
targets with significant
changes in levels of activity
and significant
advancement from known
and future technologies
Possibility to achieve
targets with slight changes
in levels of activity and
greater investments in
known technologies
Possibility to achieve
targets while maintaining
current levels of activity and
cost effective investments in
known technologies
Multi-return strategies
During the analysis of the targets, strong links between the use of different resources prompted
an alternative approach to setting resource efficiency targets. These so-called ‘multi-return’
strategies address multiple resource categories and several issues related to resource efficiency
by identifying the one key driver behind them all. This approach aligns various resource use
14 | Assessment of resource efficiency indicators and targets
targets and captures them through one focussed policy intervention. The following multi-return
strategies were identified in this study:
Changing the human diet towards a lower share of animal-based food.
Tackling this will have several effects:
Positive effects on human health; less livestock lowers the pressure on
land and water resources; it also reduces GHG emissions from
ruminants; less demand for cooling and transportation of meat will
reduce energy consumption.
Steady stocks of built-up infrastructure and densification of settlements,
reducing urban sprawl will have following effects:
Decreasing material consumption; facilitating a continuous recycling of
construction materials; decreasing energy use for the construction of
infrastructure, in transport and in the use phase; decreasing use of land
area and sealing of land.
Product re-design for longevity and recycling. This is not really one strategy,
but a bundle of strategies, to be developed for groups of products. Tackling this
will have several effects:
Reducing the use of toxic materials; increasing the use of bio-
degradable materials; increasing longevity, repair-friendliness and re-
use of products; increasing recyclability by design; improving energy
efficiency in production and use of products.
Multi-return strategies could be an approach for target based policy that would require less
action, but would have broader effects.
Recommendations
The European Commission has made it clear in its Europe 2020 strategy the direction in which
the EU should be moving. Indicators and targets are important tools to guide, coordinate and
encourage progress in the right direction. Although the study has demonstrated that many of the
available indicators desperately need to be improved or developed further, this should not deter
the Commission in continuing their work by discussing and considering possible resource use and
resource efficiency targets. There is too much at stake to wait for a perfect set of indicators.
Many of proposed indicators can already be adopted for use in resource policy development. In
the case of limitations, other supporting indicators and experts should be consulted.
The project team identified the following areas where the Commission would benefit from
further development:
Continue improving and developing resource related indicators
Indicators and data on resource use embodied in trade - further develop
and harmonise different data and methodological approaches to
Assessment of resource efficiency indicators and targets | 15
calculate resource use embodied in international trade of the EU-27 and
EU Member States.
Indicators and data on the environmental impacts of resource use - further
strengthen and test currently developed methodologies and improve
the underlying databases for their calculation.
Indicators on the impacts on ecosystems and biodiversity – support the
development of approaches to link land cover and land use change to
indicators on ecosystem quality and biodiversity.
Indicators on the natural capital stock – support the development of
approaches for indicators and databases that can monitor scarcity and
overexploitation of resources.
Level 2 indicators - refine the understanding of the interlinkages
between level 1 (headline indicators) and level 2 (supporting indicators
addressing specific questions within a resource category) indicators, as
well as support the further development of specific level 2 indicators
that are not yet available.
Develop the knowledge base in order to better assess the impacts of resource
efficiency targets
Multi-return strategies – investigate how improving resource efficiency
for several resources at the same time can be achieved through focused
policy interventions.
Methodologies to better assess the impacts of (policy) responses (e.g.
environmental taxes, R&D spending in eco-innovation areas and
subsidies for resource-efficient technologies) on resource quantities and
related environmental impacts, in order to prioritise policy and business
action, e.g. marginal abatement curves for resource use.
Build-up the policy “business case” – find socio-economic evidence to
justify setting a target, when the scientific evidence on the
environmental rational is missing, e.g. emphasise the benefits of
securing supply and competitiveness.
Involve external actors and stakeholders in the process of target setting
Communication of indicators - rethink how the indicators could be better
communicated and more easily understood by everybody. Many of the
current resource related indicators use unclear language and
terminology, e.g. embodied water, actual land demand and virtual
footprint. Consider renaming or harmonising the terminology.
Establish open multi-party debates - extensive consultation allows all
viewpoints to be heard on an equal level and is a good starting point for
building consensus.

16 | Assessment of resource efficiency indicators and targets
This page was left intentionally blank.
Introduction
Assessment of resource efficiency indicators and targets | 17
Chapter 1: Introduction
Natural resources are fundamental for our society and its prosperity. They are needed in all
human activities, and their use forms the basis of our economy. Resources such as raw materials,
energy, food, water and land are directly extracted from nature to produce products and services
that create economic growth. In addition to the resources that are directly valued by the
economy, other natural resources, such as ecosystems, provide environmental and social services
that humans greatly depend on.
While humankind continues to develop and improve the quality of life, the natural resources on
this planet are limited. Our current rate of extraction and depletion of natural resources is
jeopardising our current ability to meet some of the world’s basic needs, let alone the ability of
future generations to meet their needs. Some renewable resources are already harvested beyond
the planet’s reproductive capacity. Many non-renewable resources are becoming scarce. The
depletion of natural resources affects countries’ economic development, supply security,
employment, human health, and other quality of life issues. Furthermore, the associated
environmental burden of resource extraction and use (e.g. pollution, waste, soil degradation,
habitat disruption) affects the natural environment (e.g. air, water, soil, biodiversity, landscape)
and the proper functioning of life sustaining ecosystem services.1
One of the greatest challenges of this century will be to balance the demands of a growing
global population with the planet’s carrying capacity. One approach to do this is to “do more
with less”, or in other words, become resource efficient. Despite (or maybe due to) technological
advancement our society’s use of resources is not very efficient. This is evident when comparing
the total amounts of resources that are extracted from nature, with the amount of resources that
are actually used and finally the amount ends up as waste and pollution.
1.1 Background
In March 2010, the European Commission put forward a Flagship Initiative for a Resource
Efficient Europe as part of its ‘Europe 2020 Strategy’2. The Initiative will guide policy
development related to resource use in Europe over the next ten years. The strategy called for a
shift towards a resource-efficient, low-carbon economy. Sustainable growth will be achieved by
decoupling economic growth from resource use and environmental impacts (see Figure 2). In this
context, the Commission needs indicators for resource use and resource efficiency to track the
EU’s progress towards this objective.3 Furthermore, encouraged by both the European
1 OECD (2008) Measuring material flows and resource productivity – Volume I. The OECD Guide, Chapter 1, OECD, Paris. 2 European Commission (2010) Europe 2020 – A strategy for smart, sustainable and inclusive growth. COM(2010) 2020
final. March 2010. 3 European Commission (2011) A resource-efficient Europe – Flagship initiative under the Europe 2020 Strategy.
COM(2011) 21 final. January 26, 2011.
Introduction
18 | Assessment of resource efficiency indicators and targets
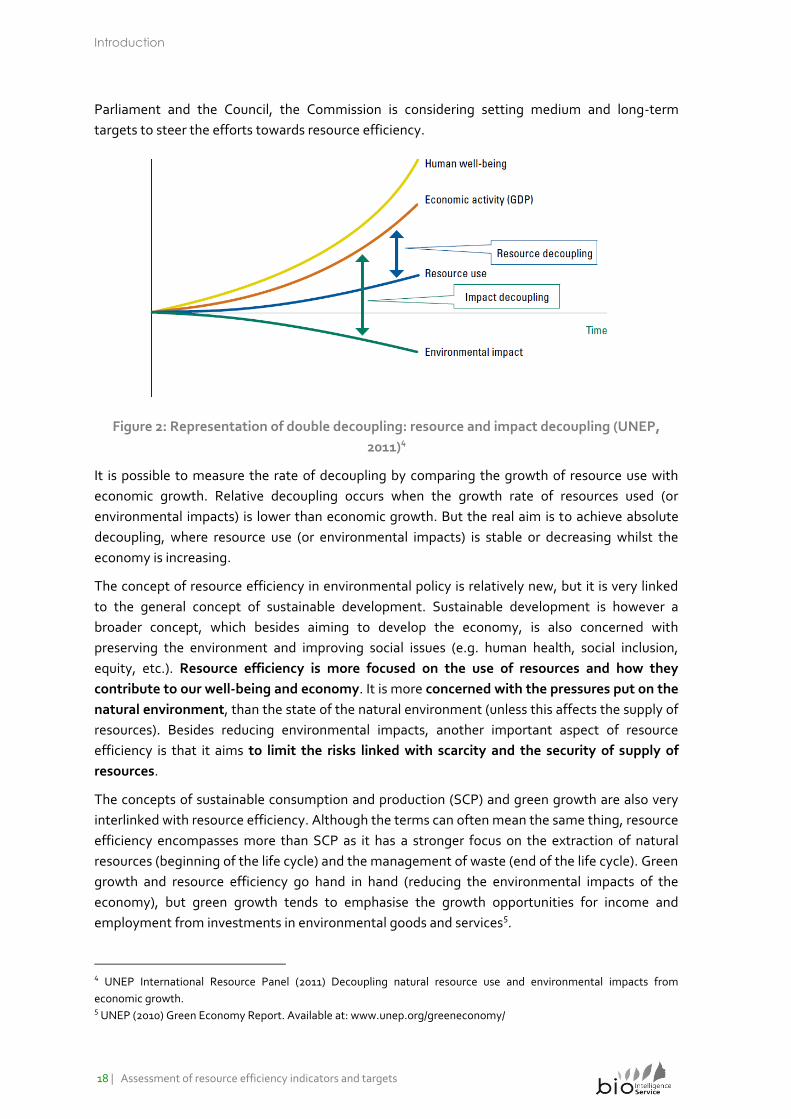
Parliament and the Council, the Commission is considering setting medium and long-term
targets to steer the efforts towards resource efficiency.
Figure 2: Representation of double decoupling: resource and impact decoupling (UNEP,
2011)4
It is possible to measure the rate of decoupling by comparing the growth of resource use with
economic growth. Relative decoupling occurs when the growth rate of resources used (or
environmental impacts) is lower than economic growth. But the real aim is to achieve absolute
decoupling, where resource use (or environmental impacts) is stable or decreasing whilst the
economy is increasing.
The concept of resource efficiency in environmental policy is relatively new, but it is very linked
to the general concept of sustainable development. Sustainable development is however a
broader concept, which besides aiming to develop the economy, is also concerned with
preserving the environment and improving social issues (e.g. human health, social inclusion,
equity, etc.). Resource efficiency is more focused on the use of resources and how they
contribute to our well-being and economy. It is more concerned with the pressures put on the
natural environment, than the state of the natural environment (unless this affects the supply of
resources). Besides reducing environmental impacts, another important aspect of resource
efficiency is that it aims to limit the risks linked with scarcity and the security of supply of
resources.
The concepts of sustainable consumption and production (SCP) and green growth are also very
interlinked with resource efficiency. Although the terms can often mean the same thing, resource
efficiency encompasses more than SCP as it has a stronger focus on the extraction of natural
resources (beginning of the life cycle) and the management of waste (end of the life cycle). Green
growth and resource efficiency go hand in hand (reducing the environmental impacts of the
economy), but green growth tends to emphasise the growth opportunities for income and
employment from investments in environmental goods and services5.
4 UNEP International Resource Panel (2011) Decoupling natural resource use and environmental impacts from
economic growth. 5 UNEP (2010) Green Economy Report. Available at: www.unep.org/greeneconomy/
Introduction
Assessment of resource efficiency indicators and targets | 19
1.2 Objectives of the study
This study investigates how indicators and targets of resource use can be applied in policy to
increase resource efficiency in the EU. The objective of this study is to identify and assess
indicators related to resource use and their environmental impacts and to evaluate the possibility
of setting corresponding targets. Ultimately, the study aims to present recommendations for the
implementation of indicators and targets in the EU policy context.
It must be noted that this study was conducted in parallel with the development of the
Commission’s Road to a Resource Efficient Europe6.This study provided input to the Commission’s
work, but followed its own objectives and schedule. The findings of this study are not necessarily,
and did not intend to be, consistent with the Roadmap.
1.3 Scope
At present there is no clear and pragmatic definition of natural resources shared between the EU,
Member States and international organisations7. Although the EU, OECD and UNEP have
advanced the concept of sustainable management of resources, the understanding of resources
has been interpreted in a multitude of ways. European Commission documents have left the
definition of natural resources open to be all encompassing, e.g. “including raw materials such as
minerals, biomass and biological resources; environmental media such as air, water and soil; flow
resources such as wind, geothermal, tidal and solar energy; and space (land area)”.8 The Council in a
later document has further considered ecosystems and biodiversity to also be considered as
natural resources.9
The OECD defines specifically natural resources in relation to economic purposes as “natural
assets (raw materials) occurring in nature that can be used for economic production or consumption”
10. These can be subdivided into mineral and energy resources, soil resources, water resources
and biological resources. The International Resource Panel first uses a broad definition “that
includes anything that occurs in nature that can be used for producing something else”11, but then
distinguishes between immaterial (e.g. the song of a bird) and material resources. Immaterial
resources are characterised by the fact that their use has no effect on the qualities that make
them useful, and that they cannot easily be given economic value. The use of material resources
6 European Commission (2011) Roadmap to a Resource Efficient Europe. COM(2011) 571 final. September 20, 2011. 7 European Environment Agency (2011) Resource efficiency in Europe. Policies and approaches in 31 EEA member and cooperating countries. Initial findings from the analysis of draft national reports on resource efficiency policies and instruments. EEA Report No 5/2011. 8 European Commission (2005) Thematic Strategy on the sustainable use of natural resources. COM(2005) 670 final 9 Council of the European Union (2010) Council conclusions on sustainable materials management and sustainable
production and consumption: key contribution to a resource-efficient Europe, 20 December 2010. 10 OECD (2010) OECD Global Forum on Environment, focusing on sustainable materials management. Summary Paper 2: Summary of SMM linkages. Working document, OECD Environment Directorate. Available at: www.oecd.org/dataoecd/23/19/46114406.pdf. 11 UNEP International Resource Panel (2011) Decoupling natural resource use and environmental impacts from economic growth.
Introduction
20 | Assessment of resource efficiency indicators and targets
on the other hand can eliminate at least some of the qualities that render them useful for certain
applications. In other words, the state of material resources can be transformed into something
where their potential usefulness for the same purpose is no longer available.
Instead of attempting to address all types of resources, this study proposes for practical
reasons a more specific definition in line with International Resource Panel and the preparatory
study for the Commission’s Review of the Thematic Strategy on the Sustainable Use of Natural
Resources12:
Resources are defined as the natural physical assets deliberately extracted and modified by
human activity for their utility to create economic value.
The above definition specifies resources as physical assets that are extracted from the natural
environment to produce goods and services, or modified to provide economic services to society.
Here a distinction is made between resources such as minerals, metals, biomass and water; and
ecosystems, which provide these resources as well as a variety of other benefits humans obtain
from the natural environment (i.e. ecosystem services). The natural environment is seen as both
a ‘source’ for natural resources to be used in society, and a ‘sink’ that absorbs wastes and
emissions, and reintegrates the substances into natural cycles. In this study natural resources are
therefore seen as the physical inputs to the economy. Their use involves impacts to the
environment in the form of emissions to air, water and soil (i.e. outputs of the economy) and their
effects on ecosystems and their functioning. This distinction is consistent with the three ‘areas
of protection’ given by Life Cycle Assessment methodology.13 Here human health, the natural
environment and natural resources are listed as separate areas of protection.
Although the title of this report is ‘Assessment of resource efficiency indicators and targets’, the
scope of the study is limited to natural resources that are directly used as inputs to the
economy14. The study does not assess resource efficiency indicators as such (e.g. by relating
resource inputs with physical or economic outputs15), but focuses on the total amounts of
resource inputs to the economy. At the end of the day, it is the total amounts of resource use that
threaten the environment and cause resource depletion. As all the resource use indicators can be
directly linked to their economic value, they can be used to calculate resource efficiency /
productivity indicators. This study is therefore focused on the following natural resources:
Materials (biotic and abiotic)
Energy (fossil fuels, nuclear and renewables16)
Air
12 BIO Intelligence Service, IEEP, IFF and Umweltbundesamt (2010) Preparatory study for the Review of the Thematic Strategy on the Sustainable Use of Natural Resources. Study commissioned by the European Commission, DG Environment. 13 Institute for Environment and Sustainability (2010) ILCD Handbook: General guide for Life Cycle Assessment – Detailed Guidance. DG Joint Research Centre, European Commission. 14 SERI (2009) How to measure Europe’s resource use. An analysis for Friends of the Earth Europe. 15 An example of such an indicator is resource productivity, which compares Gross Domestic Product (GDP) with
Domestic Material Consumption (DMC) [EUR/tonne] 16 Includes all the flow resources: wind, geothermal, tidal and solar energy.
Introduction
Assessment of resource efficiency indicators and targets | 21
Water
Land (spatial dimension including terrestrial, inland water and sea areas)
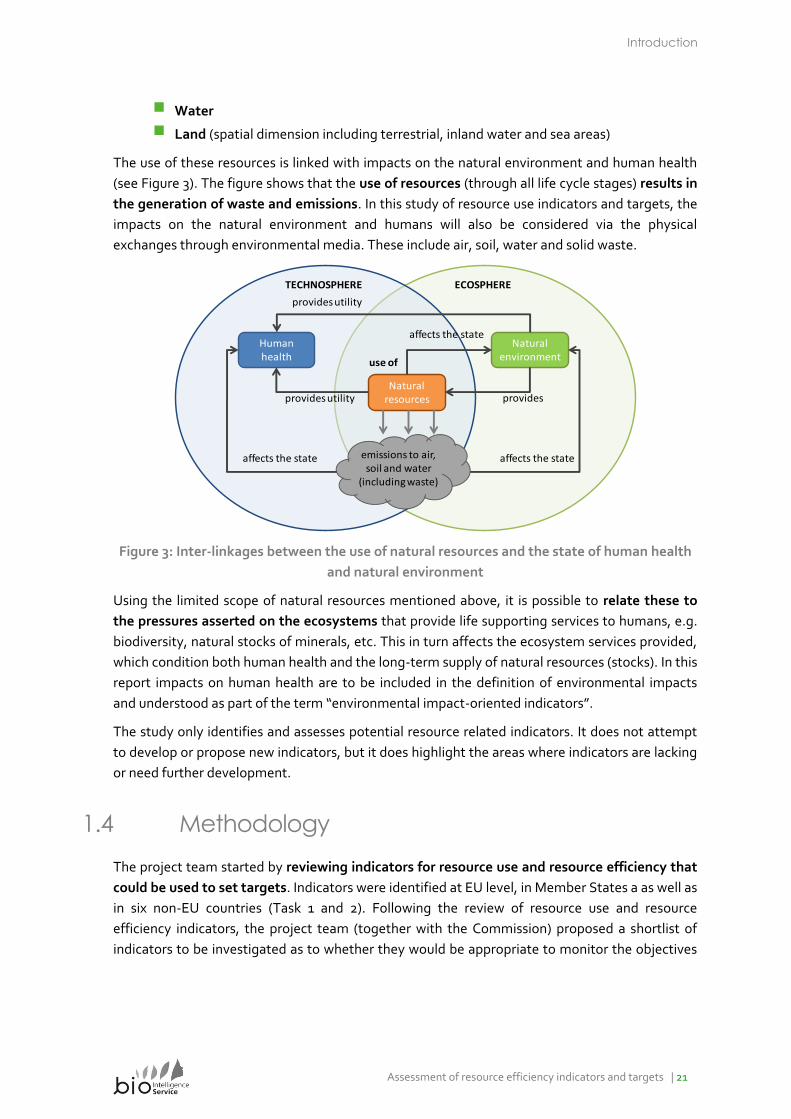
The use of these resources is linked with impacts on the natural environment and human health
(see Figure 3). The figure shows that the use of resources (through all life cycle stages) results in
the generation of waste and emissions. In this study of resource use indicators and targets, the
impacts on the natural environment and humans will also be considered via the physical
exchanges through environmental media. These include air, soil, water and solid waste.
TECHNOSPHERE ECOSPHERE
Human health
Natural resources
Natural environment
provides provides utility
emissions to air, soil and water
(including waste)
use of
affects the state
affects the state
affects the state
provides utility
Figure 3: Inter-linkages between the use of natural resources and the state of human health
and natural environment
Using the limited scope of natural resources mentioned above, it is possible to relate these to
the pressures asserted on the ecosystems that provide life supporting services to humans, e.g.
biodiversity, natural stocks of minerals, etc. This in turn affects the ecosystem services provided,
which condition both human health and the long-term supply of natural resources (stocks). In this
report impacts on human health are to be included in the definition of environmental impacts
and understood as part of the term “environmental impact-oriented indicators”.
The study only identifies and assesses potential resource related indicators. It does not attempt
to develop or propose new indicators, but it does highlight the areas where indicators are lacking
or need further development.
1.4 Methodology
The project team started by reviewing indicators for resource use and resource efficiency that
could be used to set targets. Indicators were identified at EU level, in Member States a as well as
in six non-EU countries (Task 1 and 2). Following the review of resource use and resource
efficiency indicators, the project team (together with the Commission) proposed a shortlist of
indicators to be investigated as to whether they would be appropriate to monitor the objectives
Introduction
22 | Assessment of resource efficiency indicators and targets
of the Flagship Initiative “Resource-efficient Europe” 17 and for setting corresponding targets.
The project team analysed each of the resource related indicators against the RACER
framework18 and a set of specific criteria related to key EU resource policy requirements.
Based on the strengths and weaknesses of each of the indicators across all the criteria, the
project team proposed a “basket of indicators” to monitor resource efficiency performance in the
EU (Task 3). The basket of indicators covers the resource use and associated environmental
pressures of the four main resources: materials, energy, water and land. In parallel, the project
team proposed a set of quantitative targets for 2020 and 2050 using the basket of indicators
(Task 4). Different approaches to setting targets were considered and the linkages between
the targets were analysed. A preliminary assessment of the feasibility and consequences of
applying the proposed targets was then performed (Task 5).
Representatives from DG Environment, Eurostat, the Joint Research Centre (JRC) and the
European Environment Agency (EEA) followed the study throughout its duration and provided
valuable comments. Furthermore, an Expert Workshop with external experts was organised to
scrutinise the preliminary findings of the study (Task 6).
1.5 Structure of the report
This first chapter introduces the concept of resource efficiency and its policy context. It defines
the objectives and scope of the study. Chapter 2 summarises the findings from the review of
resource related indicators and targets in various countries. This provided inspiration for which
resource related indicators were selected for further investigation in the study. The results of the
evaluation of indicators are presented in Chapter 3 together with a proposal for structuring the
selected indicators (the so-called ‘basket of indicators’). Chapter 4 discusses various approaches
to setting resource use targets. The rationale for proposing different resource use targets is
presented and the linkages between targets are elaborated. Chapter 5 presents the baseline
scenario for future resource use trends based on current policy, which is used to analyse the
potential impacts of setting resource use targets. Chapter 6 discusses the findings of the study
and provides recommendations to the Commission on how to set targets for resource efficiency.
An ‘Annex Report’ complements this report.
17 European Commission (2010) Europe 2020. A strategy for smart, sustainable and inclusive growth. COM(2010) 2020.
18 RACER stands for “Relevant, Acceptable, Credible, Easy, Robust”. For more information see Ecologic, SERI & Best
Foot Forward (2008) Potential of the Ecological Footprint for monitoring environmental impacts from natural resource
use: Analysis of the potential of the Ecological Footprint and related assessment tools for use in the EU’s Thematic
Strategy on the Sustainable Use of Natural Resources. Report to the European Commission, DG Environment.
Brussels.
Review of indicators and targets
Assessment of resource efficiency indicators and targets | 23
Chapter 2: Review of indicators and targets
Indicators are used to address important issues and bring attention to them - or, in other words:
“what gets measured gets managed”. In the context of resource use, there is a need to monitor
the progress towards absolute decoupling of resources use and consequent environmental
degradation from economic growth (“double decoupling”). Resource use indicators should
provide information on the total amounts of resource used in the economy. Ultimately, the
resource use indicators should allow environmental impact and socio-economic indicators to be
linked to them in order to provide resource efficiency indicators.
It should be noted that it is not always possible to actually measure what one is really interested
in, e.g. it is difficult to measure damage to natural resources. Proxies of related aspects are
therefore often used as indicators, if no direct indicator can be found.
Targets are specific policy objectives. They are given by a defined performance indicator that
can be measured or quantified, e.g. a reduction of domestic material consumption by x %
compared to a reference year. In the context of environmental policy, setting quantitative and
binding targets can be a powerful approach for policy implementation. It shows a strong
commitment and gives a clear direction to Europe, Member States and economic sectors on
what needs to be achieved. Based on the precautionary principle, the setting of targets also helps
defining acceptable levels of risk and environmental quality in society.
2.1 DPSIR framework
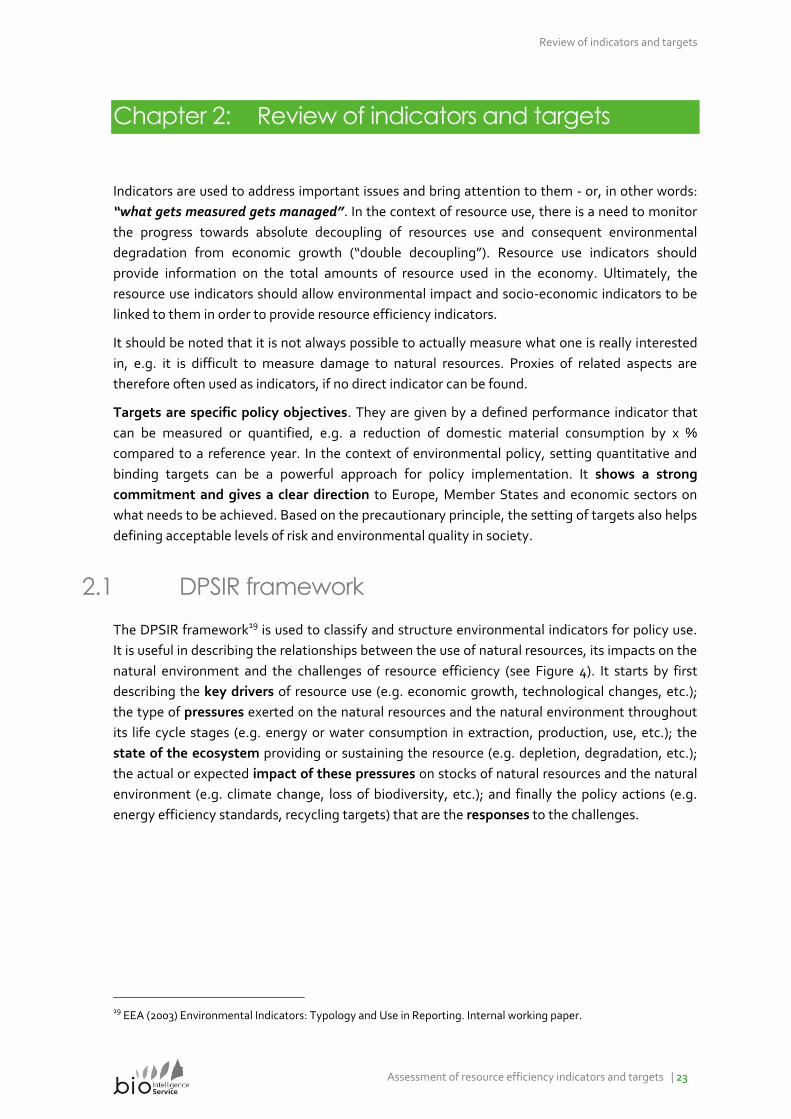
The DPSIR framework19 is used to classify and structure environmental indicators for policy use.
It is useful in describing the relationships between the use of natural resources, its impacts on the
natural environment and the challenges of resource efficiency (see Figure 4). It starts by first
describing the key drivers of resource use (e.g. economic growth, technological changes, etc.);
the type of pressures exerted on the natural resources and the natural environment throughout
its life cycle stages (e.g. energy or water consumption in extraction, production, use, etc.); the
state of the ecosystem providing or sustaining the resource (e.g. depletion, degradation, etc.);
the actual or expected impact of these pressures on stocks of natural resources and the natural
environment (e.g. climate change, loss of biodiversity, etc.); and finally the policy actions (e.g.
energy efficiency standards, recycling targets) that are the responses to the challenges.
19 EEA (2003) Environmental Indicators: Typology and Use in Reporting. Internal working paper.
Review of indicators and targets
24 | Assessment of resource efficiency indicators and targets
Drivers
Pressures
State
Impacts
Responses
Resource productivity
Resource specific impacts
Figure 4: The DPSIR framework (EEA, 2003)
Resource productivity indicators are typically derived from the relationship between drivers and
pressures, e.g. water consumption per capita. Resource specific impacts can be calculated based
on the relationship between pressures and impacts, e.g. GHG emissions per unit of primary
energy supply.
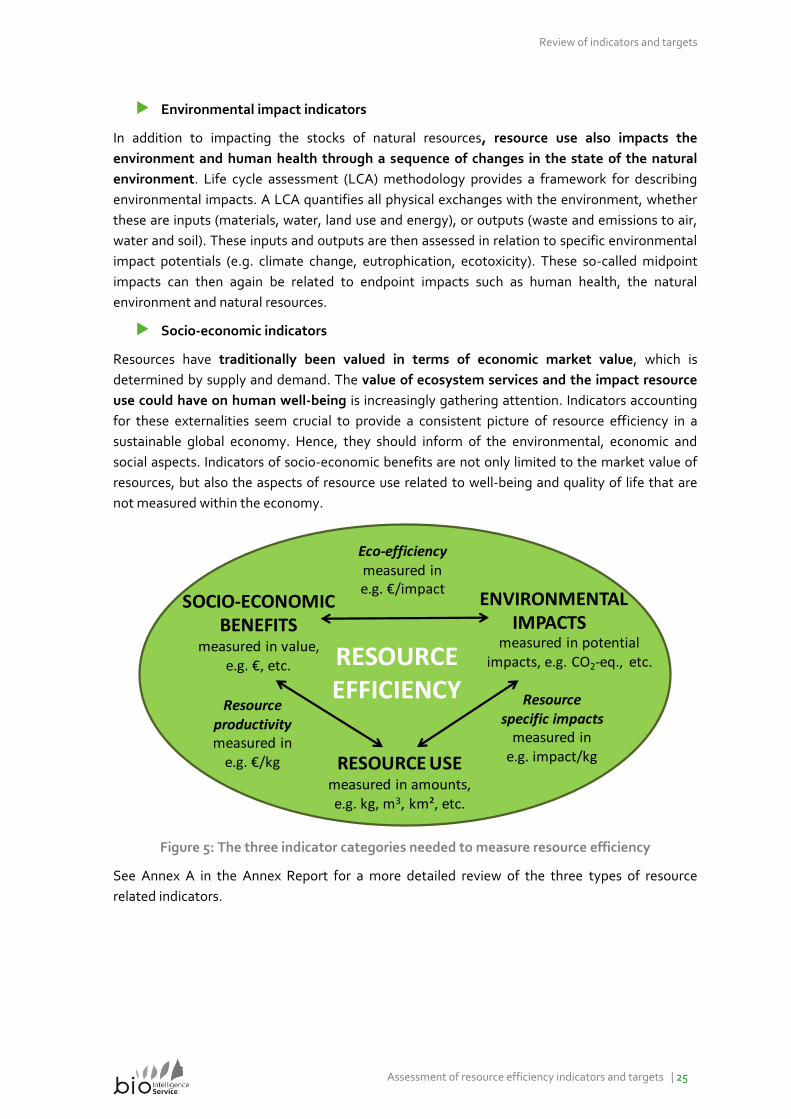
2.2 Resource efficiency indicators
The Commission’s Thematic Strategy on the Sustainable Use of Natural Resources defined three
types of indicators needed to measure resource efficiency (see (Figure 5)20:
Indicators to measure progress in productivity of the use of resources
(resource productivity), e.g. €/kg
Indicators to evaluate the environmental impact of the use of specific
resources, e.g. impact/kg
Indicators to measure progress in reducing the ecological stress of resource use
(eco-efficiency), e.g. €/impact
These indicators are based on three sets of knowledge: the sources and amounts of resource use,
the socio-economic benefits we derive from them, and the environmental impacts caused from
all of the life cycle stages. Each knowledge set uses a wide variety of indicators on their own.
Unless specified all indicators are based on a time period of a year.
Resource use indicators
The main issues regarding unsustainable resource use are the abundance, availability and
quality of the resource in nature. The use of resources is also related via production and
consumption processes, e.g. materials need energy and water to be processed. Indicators of
resource use should inform not only on the quantities of resources extracted, but also their
quality, abundance (e.g. renewable, non-renewable, exhaustible, non-exhaustible), availability
and location.
20 European Commission (2005) Thematic Strategy on the sustainable use of natural resources. COM(2005 670 final).
Review of indicators and targets
Assessment of resource efficiency indicators and targets | 25
Environmental impact indicators
In addition to impacting the stocks of natural resources, resource use also impacts the
environment and human health through a sequence of changes in the state of the natural
environment. Life cycle assessment (LCA) methodology provides a framework for describing
environmental impacts. A LCA quantifies all physical exchanges with the environment, whether
these are inputs (materials, water, land use and energy), or outputs (waste and emissions to air,
water and soil). These inputs and outputs are then assessed in relation to specific environmental
impact potentials (e.g. climate change, eutrophication, ecotoxicity). These so-called midpoint
impacts can then again be related to endpoint impacts such as human health, the natural
environment and natural resources.
Socio-economic indicators
Resources have traditionally been valued in terms of economic market value, which is
determined by supply and demand. The value of ecosystem services and the impact resource
use could have on human well-being is increasingly gathering attention. Indicators accounting
for these externalities seem crucial to provide a consistent picture of resource efficiency in a
sustainable global economy. Hence, they should inform of the environmental, economic and
social aspects. Indicators of socio-economic benefits are not only limited to the market value of
resources, but also the aspects of resource use related to well-being and quality of life that are
not measured within the economy.
RESOURCE USEmeasured in amounts, e.g. kg, m3, km², etc.
Resource productivitymeasured in
e.g. €/kg
ENVIRONMENTAL IMPACTS
SOCIO-ECONOMIC BENEFITS
measured in value, e.g. €, etc.
Resource specific impacts
measured in e.g. impact/kg
Eco-efficiencymeasured in e.g. €/impact
RESOURCE EFFICIENCY
measured in potential impacts, e.g. CO2-eq., etc.
Figure 5: The three indicator categories needed to measure resource efficiency
See Annex A in the Annex Report for a more detailed review of the three types of resource
related indicators.
Review of indicators and targets
26 | Assessment of resource efficiency indicators and targets
2.3 Existing resource use and resource efficiency
targets
Although hundreds of indicators for tracking resource use have been developed, only a few are
used to set concrete, quantitative targets. A review of resource use and resource efficiency
related targets in EU Member States, Australia, Canada, China, Japan, Switzerland, and
USA21, indicate that the strategic objectives for resource use tend to be general in nature,
with the exception of GHG emissions and renewable energy. These are often part of sustainable
development strategies or climate action plans. The typical areas covered by targets are related
to sustainable use of natural resources, waste, energy, water and land. For the EU Member
States, most of the climate change, energy and waste (recycling) targets are driven by EU
legislation.
Based on the Kyoto Protocol, the EU climate and energy package set the “20-20-20” targets.22 All
reviewed countries have set targets related to renewable energy. Denmark is the first country
to set the goal to be fossil fuel independent by 2050. Austria, Germany, Italy, Sweden and
Japan have specific objectives for material consumption and resource productivity (based on
Material Flow Analysis (MFA) indicators). Japan has been the most advanced and successful in
setting targets for resource productivity, cyclical use rate and amount of waste generated. In
addition to reuse and recycling targets, some countries such as Sweden, Finland and France
have also set targets for reducing waste generation.
Besides general national objectives, some countries have set specific requirements for certain
industries and products, e.g. by share of food and construction products from sustainable
sources, energy efficiency of buildings and vehicles. Targets for the share of agricultural land
for organic farming are common in many countries. Denmark and Germany have further
objectives for land use regarding forest land cover and artificial surfaces. To promote the
conservation and wise use of water, Canada intends to achieve a 30 % reduction in water use in
various sectors by 2025 (based on 2009 water use levels).
Finland, Scotland, Wales, Switzerland and Japan have formally adopted the use of Ecological
Footprint as an indicator23. Many other countries have considered using the indicator officially,
but none of the reviewed countries uses it to set targets.
In general, there is little political consensus among national governments for setting targets both
nationally and globally. This could partly be due to the lack of scientific evidence and general
agreement on the planet’s sustainability thresholds (see Table 3). Non-governmental
organisations and academics are pushing for more targets to be set and have even proposed
21 See Annex A for a more detailed review of resource related indicators and targets in EU Member States and selected
other countries. 22
Climate change and energy targets to be met by 2020 (from the EU climate and energy package, 2007):
A reduction in EU greenhouse gas emissions of at least 20% below 1990 levels
20% of EU energy consumption to come from renewable resources
A 20% reduction in primary energy use compared with projected levels, to be achieved by improving energy
efficiency. 23 Global Footprint Network. www.footprintnetwork.org/en/index.php/GFN/page/ten_in_ten_campaign
Review of indicators and targets
Assessment of resource efficiency indicators and targets | 27
specific targets to be integrated into policy. However, most countries are hesitant. Many
governments formulate general sustainable development strategies without any time-bound
quantitative targets. Although many countries are more concerned about the security of supply
for certain critical raw materials than the environmental issues, no targets linked to security of
supply have yet been set on national level (China does however set export restrictions on some
raw materials).
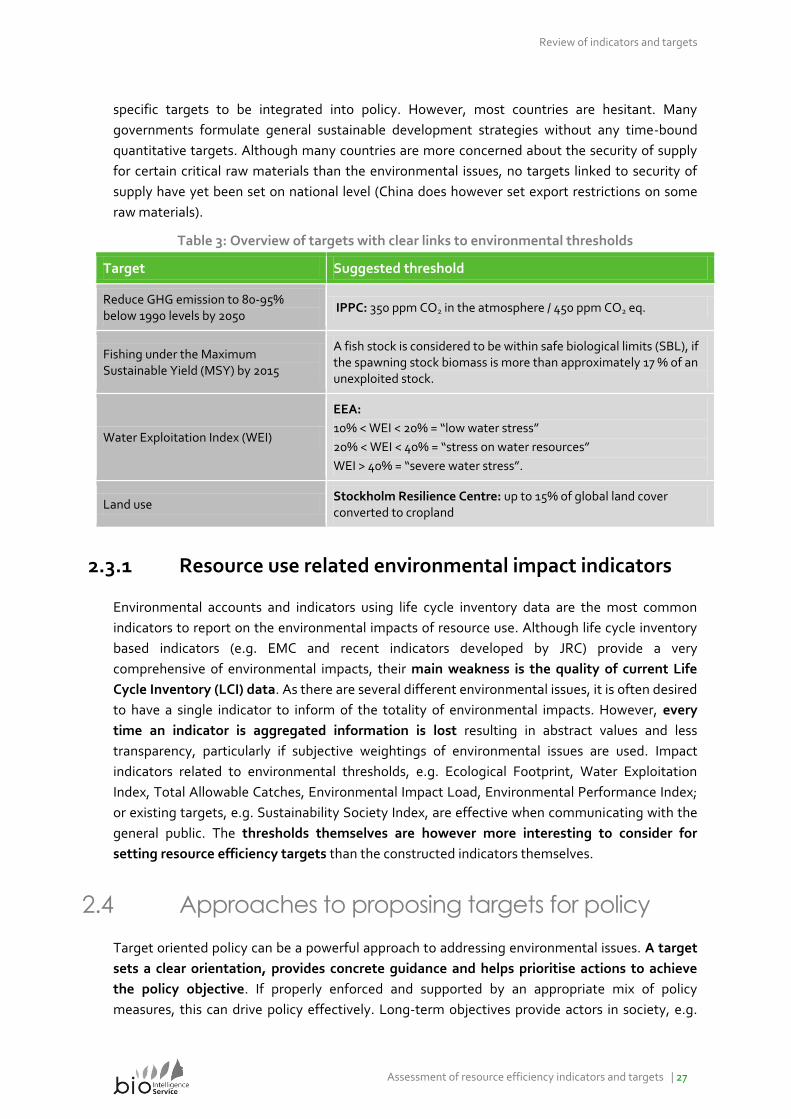
Table 3: Overview of targets with clear links to environmental thresholds
Target Suggested threshold
Reduce GHG emission to 80-95% below 1990 levels by 2050
IPPC: 350 ppm CO2 in the atmosphere / 450 ppm CO2 eq.
Fishing under the Maximum Sustainable Yield (MSY) by 2015
A fish stock is considered to be within safe biological limits (SBL), if the spawning stock biomass is more than approximately 17 % of an unexploited stock.
Water Exploitation Index (WEI)
EEA:
10% < WEI < 20% = “low water stress”
20% < WEI < 40% = “stress on water resources”
WEI > 40% = “severe water stress”.
Land use Stockholm Resilience Centre: up to 15% of global land cover converted to cropland
2.3.1 Resource use related environmental impact indicators
Environmental accounts and indicators using life cycle inventory data are the most common
indicators to report on the environmental impacts of resource use. Although life cycle inventory
based indicators (e.g. EMC and recent indicators developed by JRC) provide a very
comprehensive of environmental impacts, their main weakness is the quality of current Life
Cycle Inventory (LCI) data. As there are several different environmental issues, it is often desired
to have a single indicator to inform of the totality of environmental impacts. However, every
time an indicator is aggregated information is lost resulting in abstract values and less
transparency, particularly if subjective weightings of environmental issues are used. Impact
indicators related to environmental thresholds, e.g. Ecological Footprint, Water Exploitation
Index, Total Allowable Catches, Environmental Impact Load, Environmental Performance Index;
or existing targets, e.g. Sustainability Society Index, are effective when communicating with the
general public. The thresholds themselves are however more interesting to consider for
setting resource efficiency targets than the constructed indicators themselves.
2.4 Approaches to proposing targets for policy
Target oriented policy can be a powerful approach to addressing environmental issues. A target
sets a clear orientation, provides concrete guidance and helps prioritise actions to achieve
the policy objective. If properly enforced and supported by an appropriate mix of policy
measures, this can drive policy effectively. Long-term objectives provide actors in society, e.g.
Review of indicators and targets
28 | Assessment of resource efficiency indicators and targets
governmental organisations and companies, certainty, stability and time to achieve the target in
the most efficient manner. There are several approaches to target setting, among those, four
perspectives have been identified24:
The perspective of limitations to the resource base
The perspective of limitations to absorption capacities of the earth’s ecosystems
The perspective of efficient and equitable resource supply for people
The perspective of efficient and equitable resource supply for economies
Where knowledge gaps exist, the precautionary principle allows for defining acceptable risks
and environmental quality based on the available scientific knowledge on environmental
thresholds and carrying capacity. For resources such as land, water and fish stocks there is some
understanding of the limits to when long-term depletion and degradation occurs. For energy and
material resources the limitations of the resource base is not so clear. Instead the knowledge of
the absorption capacities of nature’s ecosystems could be used to set a target. A clear
example of this is the limit of a maximum 2°C rise in global mean temperature, or 350 ppm CO2 in
the atmosphere, was used to define EU’s GHG emissions targets.
For resources that have global impacts, equity is a central feature. When trying to determine
targets that will entail a certain distribution of the benefits of resources, or obligations to carry
environmental burdens, it is challenging to determine what is fair. Equity can be seen from the
perspective of ‘intergenerational equity’ (i.e. not compromising the ability of future generations
to meet their needs) and ‘intragenerational equity’ (i.e. the fairness of distributing wealth and
burdens among communities and countries within one generation). Discussions on equity tend to
be ethical (and political), and often lead to great disputes. For example, should policy dictate
whether the limited supply of rare earths should be used to produce environmental technologies,
medical equipment or mobile phones?
An element often used to determine targets is the cost-effectiveness of setting a target and
introducing new policy measures (widely used for energy efficiency measures). The relative cost-
efficiency of policy measures is typically estimated in impact assessments through the use of
cost-benefit analysis, which quantifies the consequences of a measure in monetary units to
assess the net present value of costs and (market and non-market) benefits.
An approach to the target setting process is to arrange open multi-party debates where
representatives of the main stakeholders are brought together to define concrete objectives and
plan of actions. The ‘Grenelle de l'environnement’ process that France instigated in 2007 is an
example of such a process25. Extensive consultation in this way allows all viewpoints to be heard
on an equal level and is a good starting point for building consensus.
As there often is no clear guideline or evidence to set a target, actors acknowledge that the
setting of targets and implementation of measures best can be conceived as a trial and error
24 BIO Intelligence Service, IEEP, IFF and Umweltbundesamt (2010) Preparatory study for the Review of the Thematic
Strategy on the Sustainable Use of Natural Resources. Study commissioned by the European Commission, DG
Environment. 25 Website for the ‘Grenelle’ Environment Round Table: www.legrenelle-environnement.fr
Review of indicators and targets
Assessment of resource efficiency indicators and targets | 29
process26. Sometimes ambitious targets may not be reached due to a number of uncertainties
beyond the control of the actors or the lack of successful implementation of the chosen
measures. It is then a discussion on whether it is better to set an ambitious target and only
reach it partly, or to set a less ambitious target to be sure it can be achieved.
Although there is a strong drive to set clear targets to guide resource efficiency policy in the EU,
it should be noted that target oriented policy is not necessarily the best approach. Depending
on how the target is defined, the mix of supporting policy instruments; and how they are
implemented, target setting could lead to unintended negative consequences. This is of
particular importance when considering how the use of resources is interlinked. For example, the
targets set for biofuels in transport have significant consequences for land use.
Whatever the approach to setting targets for resource use and efficiency, it is essential that the
targets are based on relevant existing indicators, and that the knowledge of resource use and
its environmental impacts is well developed. Indicators representing these two types of
indicators are investigated further in the study.
26 Stockholm Environment Institute and Aarhus University (2011) Implementability of agro-environmental targets in Denmark. Study for the Baltic Sea Region.

Review of indicators and targets
30 | Assessment of resource efficiency indicators and targets
This page was left intentionally blank.
Evaluation of indicators
Assessment of resource efficiency indicators and targets | 31
Chapter 3: Evaluation of indicators
The chapter presents the results of the evaluation of the shortlist of indicators most relevant for
tracking resource use and the associated environmental impacts. Based on the results from this
evaluation, the project team derived a basket of indicators. The strengths and weaknesses of
each of the indicators in the basket are provided. Finally, a baseline based on historical data of
each of the main indicators is presented to provide an idea of trends, and to compare Member
States with each other.
3.1 Methodology
In order to perform the assessment of indicators, the project team developed an evaluation
methodology, which contained three parts:
1) A general evaluation of the overall robustness of the potential indicators in the portfolio
using the so-called “RACER” framework. RACER stands for “Relevant, Acceptable,
Credible, Easy, Robust” and allowed the general value of scientific tools for use in policy
making to be assessed. The RACER framework has already been applied in previous
studies on indicators for the Resource Strategy for DG Environment27. The “RACER”
evaluation provided an overview of the general indicator properties and qualities. Each
RACER sub-criterion was answered with a short descriptive text plus a three-level scoring
(green: criterion completely fulfilled; orange: criterion partly fulfilled; red: criterion not
fulfilled), supporting the visual presentation of the results.
2) A “specific evaluation” focusing on key issues related to the implementation of the
portfolio of indicators in the context of the Europe 2020 Flagship Initiative and the
Resource Strategy. This part comprised a set of specific questions, which were also
answered through short descriptive texts. No scoring was applied to this part of the
evaluation. The specific evaluation supported the identification of indicators suitable for
the basket.
3) An evaluation summary, which addressed the question whether the indicator is
regarded as a potential candidate for the basket and how it complements other potential
indicators in the basket.
Annex B in the Annex Report provides an overview over the applied structure of the evaluation
scheme as well as the questions addressed in each part of the evaluation. If the team has
specified the allocation of a green, orange or red score, these specifications are also listed in the
table.
From an initial list of 47 resource use and resource efficiency indicators collected by the project
team, the project team (in discussion with the Commission) selected 29 indicators, which were
27
Best, A., Giljum, S., Simmons, C., Blobel, D., Lewis, K., Hammer, M., Cavalieri, S., Lutter, S., Maguire, C. (2008) Potential of the
Ecological Footprint for monitoring environmental impacts from natural resource use: Analysis of the potential of the Ecological
Footprint and related assessment tools for use in the EU’s Thematic Strategy on the Sustainable Use of Natural Resources. Report to
the European Commission, DG Environment. Brussels.
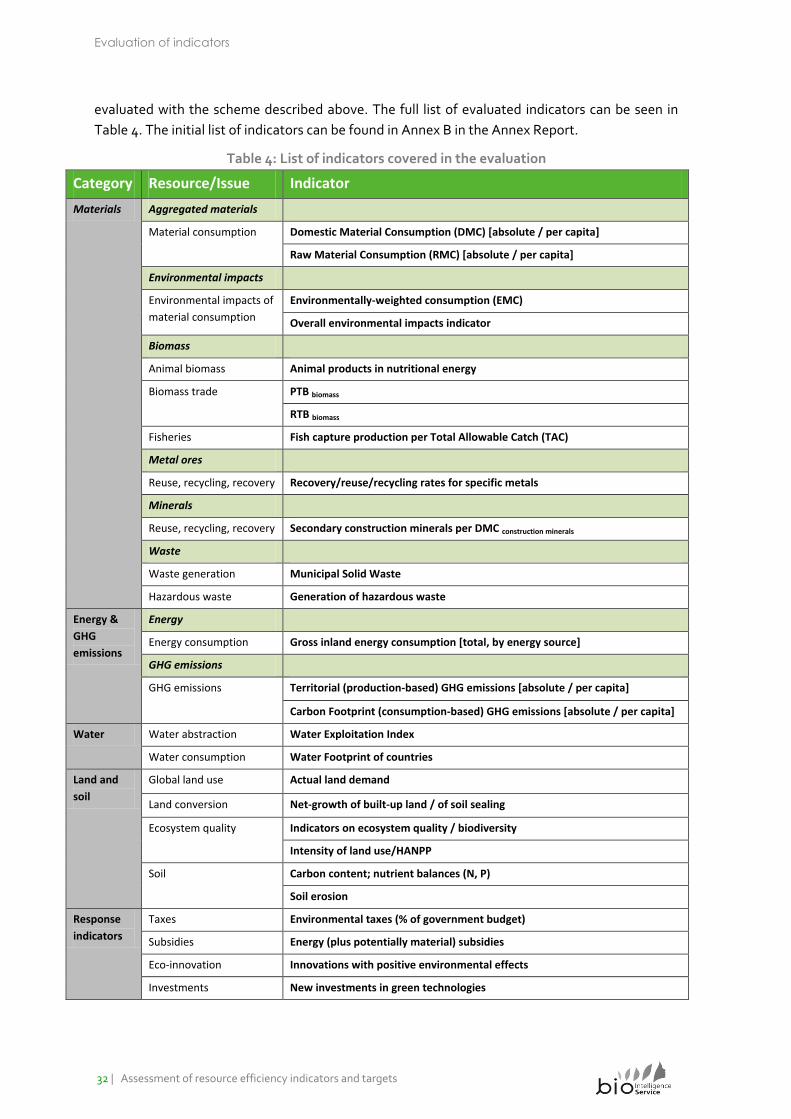
Evaluation of indicators
32 | Assessment of resource efficiency indicators and targets
evaluated with the scheme described above. The full list of evaluated indicators can be seen in
Table 4. The initial list of indicators can be found in Annex B in the Annex Report.
Table 4: List of indicators covered in the evaluation
Category Resource/Issue Indicator
Materials Aggregated materials
Material consumption Domestic Material Consumption (DMC) [absolute / per capita]
Raw Material Consumption (RMC) [absolute / per capita]
Environmental impacts
Environmental impacts of
material consumption
Environmentally-weighted consumption (EMC)
Overall environmental impacts indicator
Biomass
Animal biomass Animal products in nutritional energy
Biomass trade PTB biomass
RTB biomass
Fisheries Fish capture production per Total Allowable Catch (TAC)
Metal ores
Reuse, recycling, recovery Recovery/reuse/recycling rates for specific metals
Minerals
Reuse, recycling, recovery Secondary construction minerals per DMC construction minerals
Waste
Waste generation Municipal Solid Waste
Hazardous waste Generation of hazardous waste
Energy &
GHG
emissions
Energy
Energy consumption Gross inland energy consumption [total, by energy source]
GHG emissions
GHG emissions Territorial (production-based) GHG emissions [absolute / per capita]
Carbon Footprint (consumption-based) GHG emissions [absolute / per capita]
Water Water abstraction Water Exploitation Index
Water consumption Water Footprint of countries
Land and
soil
Global land use Actual land demand
Land conversion Net-growth of built-up land / of soil sealing
Ecosystem quality Indicators on ecosystem quality / biodiversity
Intensity of land use/HANPP
Soil Carbon content; nutrient balances (N, P)
Soil erosion
Response
indicators
Taxes Environmental taxes (% of government budget)
Subsidies Energy (plus potentially material) subsidies
Eco-innovation Innovations with positive environmental effects
Investments New investments in green technologies
Evaluation of indicators
Assessment of resource efficiency indicators and targets | 33
Note: Energy subsidies were initially planned to be evaluated, however, due to lack of any reliable and recent data, this
indicator was dropped from the list by the team. Note also that the two recycling indicators (metals and construction
minerals) were evaluated within one evaluation scheme.
In addition to the evaluation of the single indicators, also the basket of indicators was evaluated
using the three-part evaluation framework.
3.2 Results from the RACER evaluation
The following two pages present the summary evaluation tables generated through the RACER-
part of the evaluation. Note that the columns with the big RACER letters illustrate the un-
weighted average score of all sub-categories within the respective RACER pillar. Note also that
the criteria on “acceptance” could not be evaluated for the Life-Cycle Resource Indicator by JRC,
because the indicator is only now being developed. The full results of the detailed evaluations for
all indicators can be found in Annex B in the Annex Report.
The third last column in the summary tables illustrates whether an indicator is comprehensive,
i.e. whether it includes several or all relevant aspects related to the respective resource use
category. For example, in the case of material use, the first two indicators (DMC and RMC)
include all types of materials, whereas the other indicators (e.g. animal products in nutritional
energy, fish capture, or recycling rates) focus on specific issues related to selected material flows.
This separation according to comprehensiveness was important for deriving the basket of
indicators (see below). The headline indicators suggested for the basket (Level 1; marked blue in
the following table) are all comprehensive indicators, which cover all respective aspects. The
indicators on Level 2 complement the headline indicators by focusing on specific issues.
The last two columns in the table show whether an indicator is mainly focused on resource use
(i.e. environmental pressures) or oriented towards measuring environmental impacts related to
resource use. This distinction was also crucial for deriving the basket of indicators, which contains
both resource use-oriented and environmental impact-oriented indicators (see Table 7).
The summary table illustrates that the indicators perform very differently across the set of
RACER criteria. No indicator completely fulfilled all criteria. In general, the headline indicators
selected for the basket (Level 1) perform well, with most evaluation criteria being completely or
partly fulfilled. Exceptions are the indicators on environmental impacts of resource use, which
lack acceptance with regard to several groups of actors (partly because the environmental impact
indicator by JRC is still in the stage of development). Another exception are those indicators,
which apply a fully territorial perspective (e.g. territorial GHG emissions, Water Exploitation
Index and HANPP) and are therefore not able to illustrate burden shifting through international
trade.
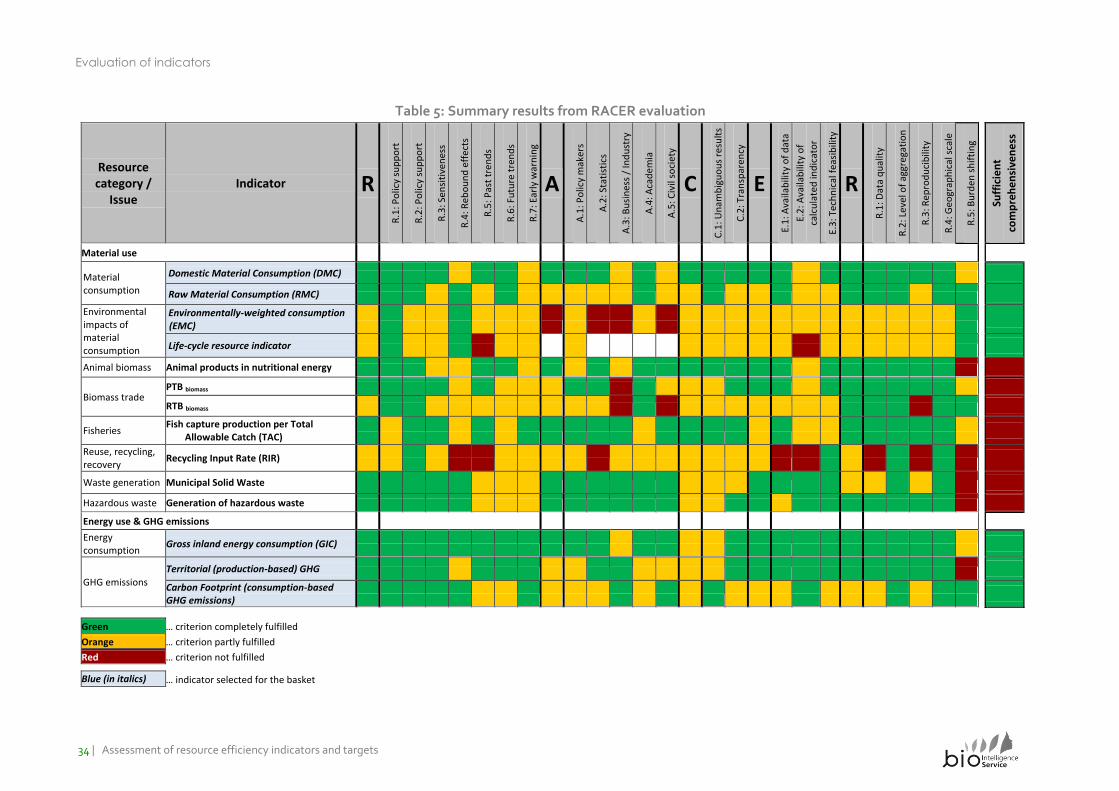
Evaluation of indicators
34 | Assessment of resource efficiency indicators and targets
Table 5: Summary results from RACER evaluation
Resource category /
Issue Indicator R
R.1
: Po
licy
sup
po
rt
R.2
: Po
licy
sup
po
rt
R.3
: Sen
siti
ven
ess
R.4
: Reb
ou
nd
eff
ect
s
R.5
: Pas
t tr
end
s
R.6
: Fu
ture
tre
nd
s
R.7
: Ear
ly w
arn
ing
A
A.1
: Po
licy
mak
ers
A.2
: Sta
tist
ics
A.3
: Bu
sin
ess
/ In
du
stry
A.4
: Aca
dem
ia
A.5
: Civ
il so
ciet
y
C
C.1
: Un
amb
igu
ou
s re
sult
s
C.2
: Tra
nsp
aren
cy
E
E.1
: Ava
ilab
ility
of
dat
a
E.2
: Ava
ilab
ility
of
calc
ula
ted
ind
icat
or
E.3
: Tec
hn
ical
fea
sib
ility
R
R.1
: Dat
a q
ual
ity
R.2
: Lev
el o
f ag
gre
gati
on
R.3
: Rep
rod
uci
bili
ty
R.4
: Geo
grap
hic
al s
cale
R.5
: Bu
rden
sh
ifti
ng
Suff
icie
nt
com
pre
hen
sive
ne
ss
Material use
Material consumption
Domestic Material Consumption (DMC)
Raw Material Consumption (RMC)
Environmental impacts of material consumption
Environmentally-weighted consumption (EMC)
Life-cycle resource indicator
Animal biomass Animal products in nutritional energy
Biomass trade PTB biomass
RTB biomass
Fisheries Fish capture production per Total
Allowable Catch (TAC)
Reuse, recycling, recovery
Recycling Input Rate (RIR)
Waste generation Municipal Solid Waste
Hazardous waste Generation of hazardous waste
Energy use & GHG emissions Energy consumption
Gross inland energy consumption (GIC)
GHG emissions
Territorial (production-based) GHG
Carbon Footprint (consumption-based GHG emissions)
Green … criterion completely fulfilled
Orange … criterion partly fulfilled
Red … criterion not fulfilled
Blue (in italics) … indicator selected for the basket
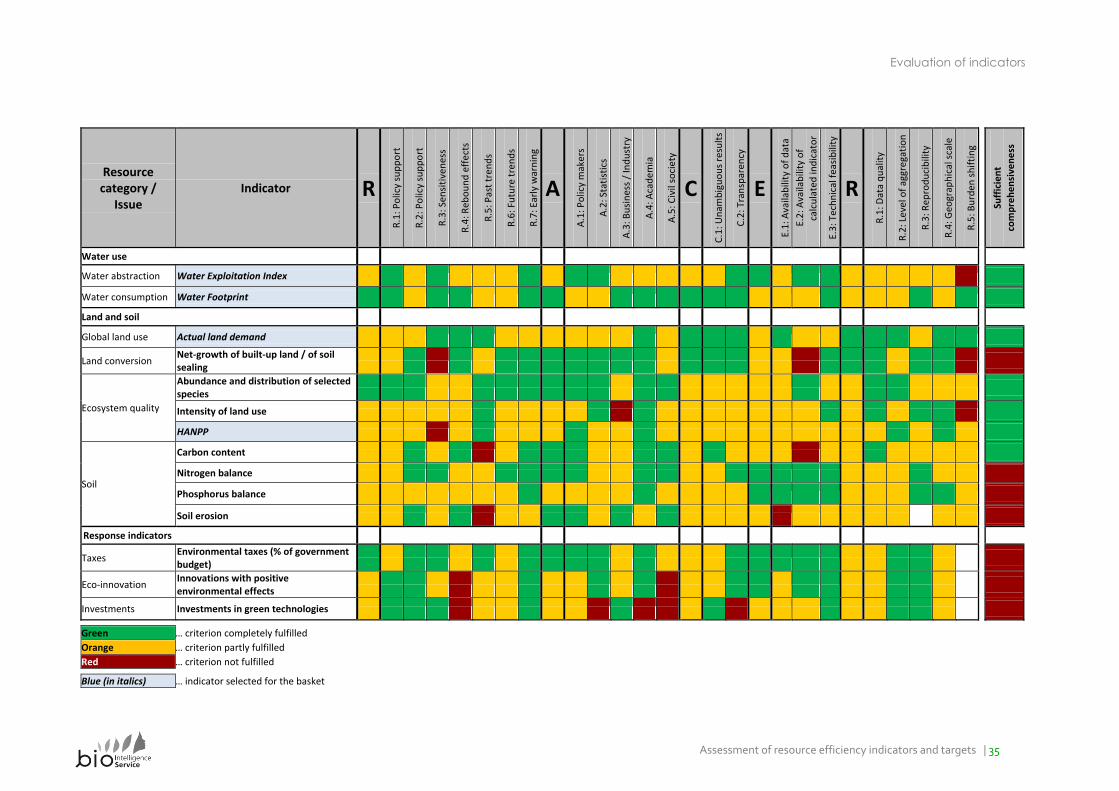
Evaluation of indicators
Assessment of resource efficiency indicators and targets | 35
Resource category /
Issue Indicator R
R.1
: Po
licy
sup
po
rt
R.2
: Po
licy
sup
po
rt
R.3
: Sen
siti
ven
ess
R.4
: Reb
ou
nd
eff
ect
s
R.5
: Pas
t tr
end
s
R.6
: Fu
ture
tre
nd
s
R.7
: Ear
ly w
arn
ing
A
A.1
: Po
licy
mak
ers
A.2
: Sta
tist
ics
A.3
: Bu
sin
ess
/ In
du
stry
A.4
: Aca
dem
ia
A.5
: Civ
il so
ciet
y
C
C.1
: Un
amb
igu
ou
s re
sult
s
C.2
: Tra
nsp
aren
cy
E
E.1
: Ava
ilab
ility
of
dat
a
E.2
: Ava
ilab
ility
of
calc
ula
ted
ind
icat
or
E.3
: Tec
hn
ical
fea
sib
ility
R
R.1
: Dat
a q
ual
ity
R.2
: Lev
el o
f ag
gre
gati
on
R.3
: Rep
rod
uci
bili
ty
R.4
: Geo
grap
hic
al s
cale
R.5
: Bu
rden
sh
ifti
ng
Suff
icie
nt
com
pre
he
nsi
ven
ess
Water use
Water abstraction Water Exploitation Index
Water consumption Water Footprint
Land and soil
Global land use Actual land demand
Land conversion Net-growth of built-up land / of soil sealing
Ecosystem quality
Abundance and distribution of selected species
Intensity of land use
HANPP
Soil
Carbon content
Nitrogen balance
Phosphorus balance
Soil erosion
Response indicators
Taxes Environmental taxes (% of government budget)
Eco-innovation Innovations with positive environmental effects
Investments Investments in green technologies
Green … criterion completely fulfilled
Orange … criterion partly fulfilled
Red … criterion not fulfilled
Blue (in italics) … indicator selected for the basket
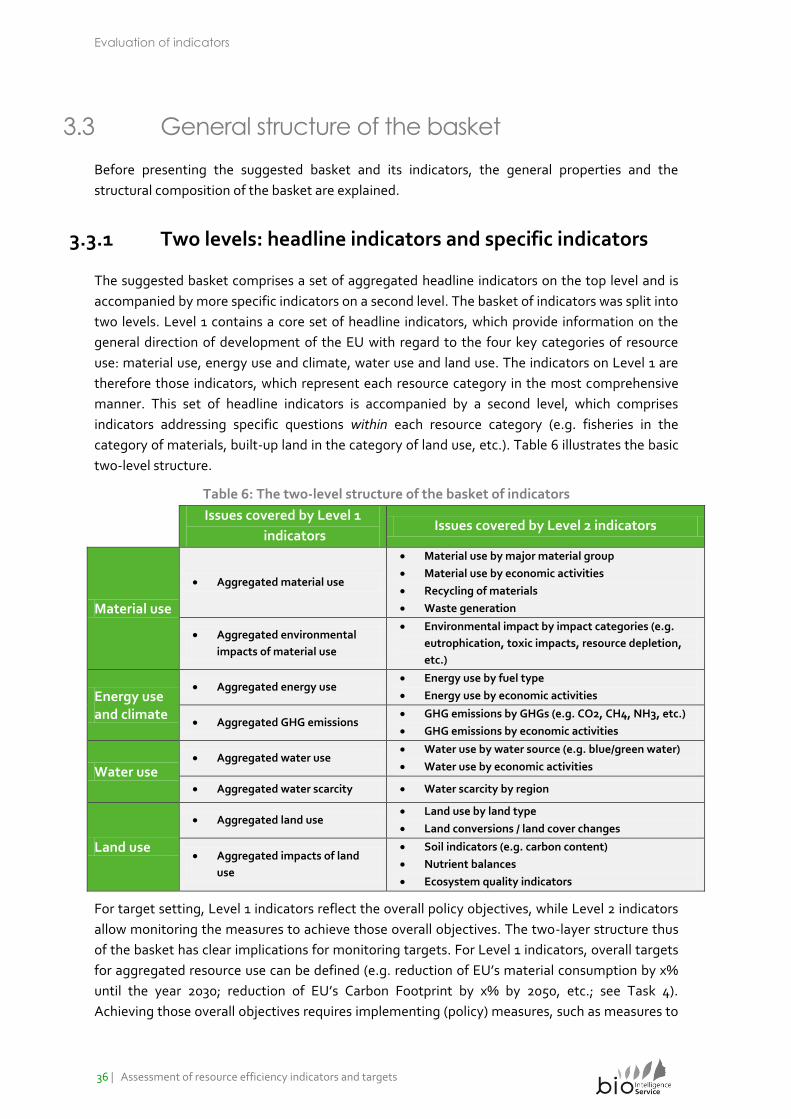
Evaluation of indicators
36 | Assessment of resource efficiency indicators and targets
3.3 General structure of the basket
Before presenting the suggested basket and its indicators, the general properties and the
structural composition of the basket are explained.
3.3.1 Two levels: headline indicators and specific indicators
The suggested basket comprises a set of aggregated headline indicators on the top level and is
accompanied by more specific indicators on a second level. The basket of indicators was split into
two levels. Level 1 contains a core set of headline indicators, which provide information on the
general direction of development of the EU with regard to the four key categories of resource
use: material use, energy use and climate, water use and land use. The indicators on Level 1 are
therefore those indicators, which represent each resource category in the most comprehensive
manner. This set of headline indicators is accompanied by a second level, which comprises
indicators addressing specific questions within each resource category (e.g. fisheries in the
category of materials, built-up land in the category of land use, etc.). Table 6 illustrates the basic
two-level structure.
Table 6: The two-level structure of the basket of indicators
Issues covered by Level 1
indicators Issues covered by Level 2 indicators
Material use
Aggregated material use
Material use by major material group
Material use by economic activities
Recycling of materials
Waste generation
Aggregated environmental
impacts of material use
Environmental impact by impact categories (e.g.
eutrophication, toxic impacts, resource depletion,
etc.)
Energy use and climate
Aggregated energy use Energy use by fuel type
Energy use by economic activities
Aggregated GHG emissions GHG emissions by GHGs (e.g. CO2, CH4, NH3, etc.)
GHG emissions by economic activities
Water use Aggregated water use
Water use by water source (e.g. blue/green water)
Water use by economic activities
Aggregated water scarcity Water scarcity by region
Land use
Aggregated land use Land use by land type
Land conversions / land cover changes
Aggregated impacts of land
use
Soil indicators (e.g. carbon content)
Nutrient balances
Ecosystem quality indicators
For target setting, Level 1 indicators reflect the overall policy objectives, while Level 2 indicators
allow monitoring the measures to achieve those overall objectives. The two-layer structure thus
of the basket has clear implications for monitoring targets. For Level 1 indicators, overall targets
for aggregated resource use can be defined (e.g. reduction of EU’s material consumption by x%
until the year 2030; reduction of EU’s Carbon Footprint by x% by 2050, etc.; see Task 4).
Achieving those overall objectives requires implementing (policy) measures, such as measures to
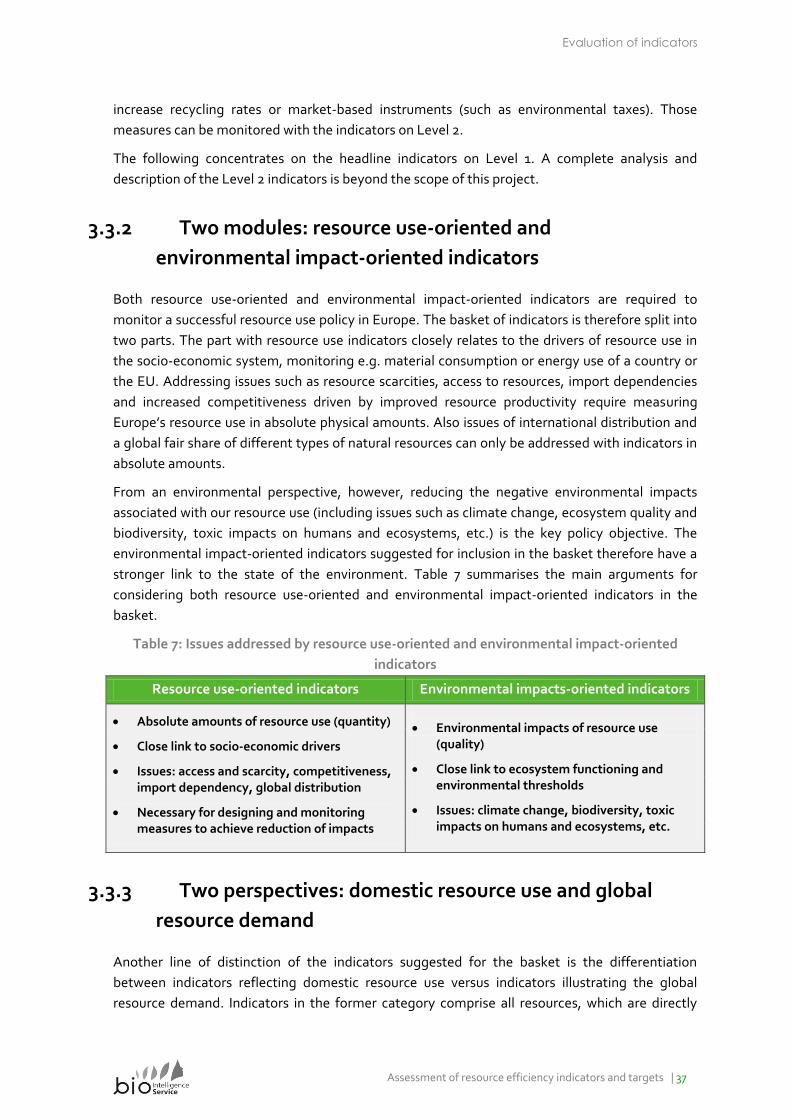
Evaluation of indicators
Assessment of resource efficiency indicators and targets | 37
increase recycling rates or market-based instruments (such as environmental taxes). Those
measures can be monitored with the indicators on Level 2.
The following concentrates on the headline indicators on Level 1. A complete analysis and
description of the Level 2 indicators is beyond the scope of this project.
3.3.2 Two modules: resource use-oriented and
environmental impact-oriented indicators
Both resource use-oriented and environmental impact-oriented indicators are required to
monitor a successful resource use policy in Europe. The basket of indicators is therefore split into
two parts. The part with resource use indicators closely relates to the drivers of resource use in
the socio-economic system, monitoring e.g. material consumption or energy use of a country or
the EU. Addressing issues such as resource scarcities, access to resources, import dependencies
and increased competitiveness driven by improved resource productivity require measuring
Europe’s resource use in absolute physical amounts. Also issues of international distribution and
a global fair share of different types of natural resources can only be addressed with indicators in
absolute amounts.
From an environmental perspective, however, reducing the negative environmental impacts
associated with our resource use (including issues such as climate change, ecosystem quality and
biodiversity, toxic impacts on humans and ecosystems, etc.) is the key policy objective. The
environmental impact-oriented indicators suggested for inclusion in the basket therefore have a
stronger link to the state of the environment. Table 7 summarises the main arguments for
considering both resource use-oriented and environmental impact-oriented indicators in the
basket.
Table 7: Issues addressed by resource use-oriented and environmental impact-oriented
indicators
Resource use-oriented indicators Environmental impacts-oriented indicators
Absolute amounts of resource use (quantity)
Close link to socio-economic drivers
Issues: access and scarcity, competitiveness, import dependency, global distribution
Necessary for designing and monitoring measures to achieve reduction of impacts
Environmental impacts of resource use (quality)
Close link to ecosystem functioning and environmental thresholds
Issues: climate change, biodiversity, toxic impacts on humans and ecosystems, etc.
3.3.3 Two perspectives: domestic resource use and global
resource demand
Another line of distinction of the indicators suggested for the basket is the differentiation
between indicators reflecting domestic resource use versus indicators illustrating the global
resource demand. Indicators in the former category comprise all resources, which are directly
Evaluation of indicators
38 | Assessment of resource efficiency indicators and targets
used for domestic production and consumption activities. Thus they include domestically
extracted resources plus direct imports and exports, which actually cross the country border (in
the case of land use, this category comprises only domestic land use, as land is not physically
crossing borders). The latter group of indicators additionally includes resources embodied in
internationally-traded products.28 Those indicators are therefore suitable to monitor the total
global resource demand associated with European production and consumption, including
resources used outside the EU borders to produce imported goods. Those indicators with a global
scope are in line with EU policy documents, which ask for applying a life-cycle perspective in
environmental policy, in order to reflect possible outsourcing of environmental burden from the
EU to other world regions. At the same time, this approach poses challenges to EU resource
policy making, as the policy sphere is extended to a level beyond EU borders. Issues on whether
and how to share environmental responsibility between producing and consuming countries are
brought on the agenda through those types of indicators, as the debate on climate change
illustrates.
3.3.4 Other important features of the basket
The indicators suggested for the basket are consistent in terms of boundary setting and
accounting principles. All resource use-oriented indicators in the basket and some of the
environmental impact-oriented indicators (e.g. energy/climate and water) are derived from
environmental accounts and thus have a strong link to the statistical system and integrated
economic-environmental accounting frameworks such as SEEA or NAMEA. They share a
common understanding of where to draw the accounting line between the natural and the socio-
economic system.
All indicators suggested for the basket can be linked to economic data to establish indicators
on resource efficiency. As agreed with the Commission, the focus of the evaluations in this
project was put on indicators in absolute numbers. These indicators are the relevant ones to
monitor for whether pressures and impacts on the environment are increasing or decreasing.
However, all suggested indicators can be linked to economic data, such as GDP on the country
level or output/value added on the sectoral level, in order to assess the resource
efficiency/productivity of Europe’s resource use. Also when assessing whether de-coupling can
be observed between economic growth and resource use and environmental impacts,
respectively, this requires linking indicators in physical units with indicators on economic value in
monetary units.
The basket of resource use indicators needs to be complemented by other indicators
informing about environmental risks. The suggested basket informs about EU’s resource use in
a very comprehensive manner, covering all main resource use categories. However, it is
important to emphasise that issues related to some environmental risks cannot be covered,
which are particularly important in a long-term and intergenerational perspective. The most
prominent examples are risks due to the use of chemicals, nuclear energy and the use of
genetically-modified organisms (GMOs). None of the suggested indicators can reflect the risks
28 Those resources are also called “indirect”, “virtual” or “hidden” resource flows in the literature.
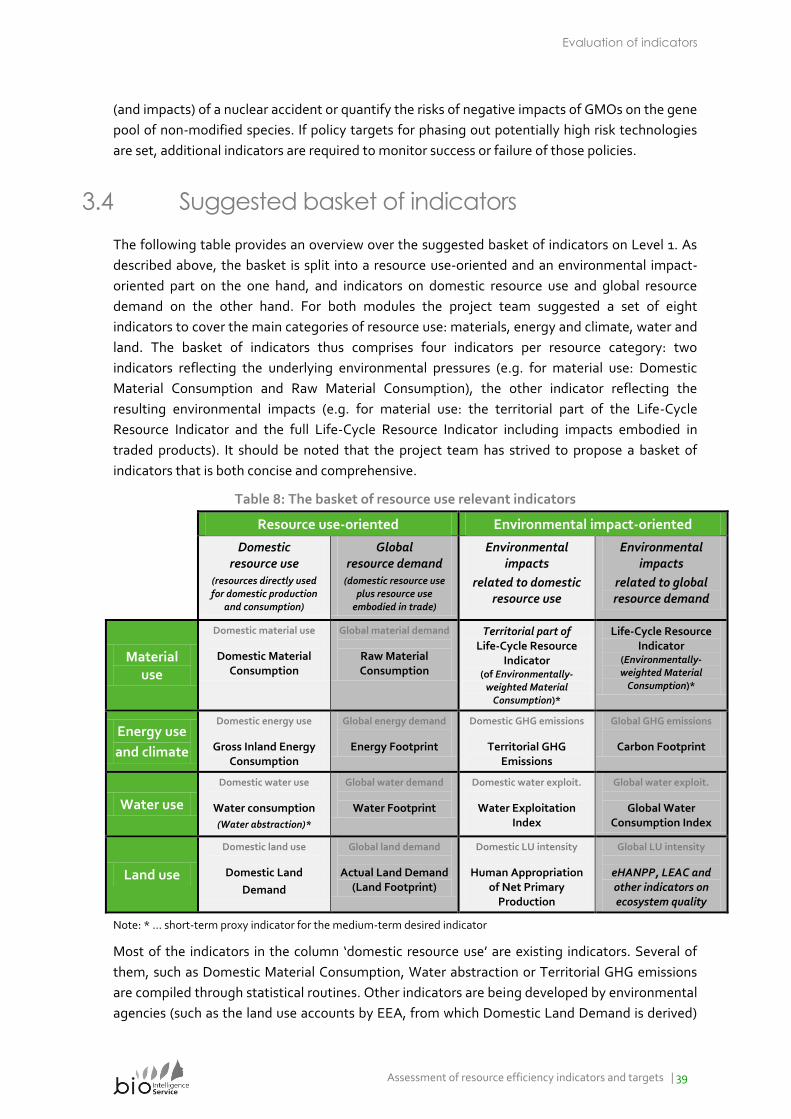
Evaluation of indicators
Assessment of resource efficiency indicators and targets | 39
(and impacts) of a nuclear accident or quantify the risks of negative impacts of GMOs on the gene
pool of non-modified species. If policy targets for phasing out potentially high risk technologies
are set, additional indicators are required to monitor success or failure of those policies.
3.4 Suggested basket of indicators
The following table provides an overview over the suggested basket of indicators on Level 1. As
described above, the basket is split into a resource use-oriented and an environmental impact-
oriented part on the one hand, and indicators on domestic resource use and global resource
demand on the other hand. For both modules the project team suggested a set of eight
indicators to cover the main categories of resource use: materials, energy and climate, water and
land. The basket of indicators thus comprises four indicators per resource category: two
indicators reflecting the underlying environmental pressures (e.g. for material use: Domestic
Material Consumption and Raw Material Consumption), the other indicator reflecting the
resulting environmental impacts (e.g. for material use: the territorial part of the Life-Cycle
Resource Indicator and the full Life-Cycle Resource Indicator including impacts embodied in
traded products). It should be noted that the project team has strived to propose a basket of
indicators that is both concise and comprehensive.
Table 8: The basket of resource use relevant indicators
Resource use-oriented Environmental impact-oriented
Domestic resource use
(resources directly used for domestic production
and consumption)
Global resource demand
(domestic resource use plus resource use
embodied in trade)
Environmental impacts
related to domestic resource use
Environmental impacts
related to global resource demand
Material use
Domestic material use
Domestic Material Consumption
Global material demand
Raw Material Consumption
Territorial part of Life-Cycle Resource
Indicator (of Environmentally-
weighted Material Consumption)*
Life-Cycle Resource Indicator
(Environmentally-weighted Material
Consumption)*
Energy use
and climate
Domestic energy use
Gross Inland Energy Consumption
Global energy demand
Energy Footprint
Domestic GHG emissions
Territorial GHG Emissions
Global GHG emissions
Carbon Footprint
Water use
Domestic water use
Water consumption
(Water abstraction)*
Global water demand
Water Footprint
Domestic water exploit.
Water Exploitation Index
Global water exploit.
Global Water Consumption Index
Land use
Domestic land use
Domestic Land
Demand
Global land demand
Actual Land Demand (Land Footprint)
Domestic LU intensity
Human Appropriation of Net Primary
Production
Global LU intensity
eHANPP, LEAC and other indicators on ecosystem quality
Note: * ... short-term proxy indicator for the medium-term desired indicator
Most of the indicators in the column ‘domestic resource use’ are existing indicators. Several of
them, such as Domestic Material Consumption, Water abstraction or Territorial GHG emissions
are compiled through statistical routines. Other indicators are being developed by environmental
agencies (such as the land use accounts by EEA, from which Domestic Land Demand is derived)
Evaluation of indicators
40 | Assessment of resource efficiency indicators and targets
or by academic groups (such as Environmentally-weighted Material Consumption or Human
Appropriation of Net Primary Production). From the group of indicators on global resource
demand, some are currently being tested with pilots (for example, Raw Material Consumption,
Actual Land Demand, Water Footprint or Carbon Footprint). The Global Water Consumption
Index was introduced in this study.
It has to be noted that JRC’s life cycle resource indicators overlap with other indicators. The
impacts of water, energy and land use are all covered in the JRC indicators. This issue was raised
at the Second Progress Meeting, however it was seen as unavoidable by the participants as all
the indicators are closely linked. Besides, each of the selected indicators has a particular focus,
which is policy relevant. There is no way to develop a single indicator to cover all the different
aspects of resource efficiency; therefore the Life-Cycle Resource Indicator is not a substitute to
other indicators of the basket but rather a useful complement.
Note that the cell with environmental impact-oriented indicators for the category of land use in
the global perspective could not be filled with a concrete suggestion for an indicator. This reflects
the fact the indicators measuring ecosystem quality and the links between land use and
biodiversity are still under development by various organisations and research groups. Therefore,
only the most promising candidates are listed as a group here (including embodied HANPP
(eHANPP) and the Land and Ecosystem Accounts (LEAC) developed by the EEA).
Note also that the RACER evaluation is biased towards established indicators that can be used
immediately. For example, the DMC indicator received generally higher scores in the RACER
evaluation across all criteria, as the methodology is already internationally harmonised and well
accepted and reliable data sets in time series exist. Still, the project team suggests RMC as a key
indicator for the perspective of global demand, as RMC includes the up-stream (or indirect)
material flows of internationally traded products and is thus more robust than DMC against the
outsourcing of environmental pressures to other world regions. This information on the higher
robustness is available from criterion “R.5 Burden shifting” in the RACER evaluation, where RMC
scores higher than DMC. This aspect is also evident in the specific evaluation under “Territory vs.
Life-cycle perspective”.
For each of the indicators suggested for the basket, the following two tables summarise the
strengths and the reasons, why the team has suggested selecting the respective indicator for the
basket. Also, the main weaknesses and areas for improvement are listed.
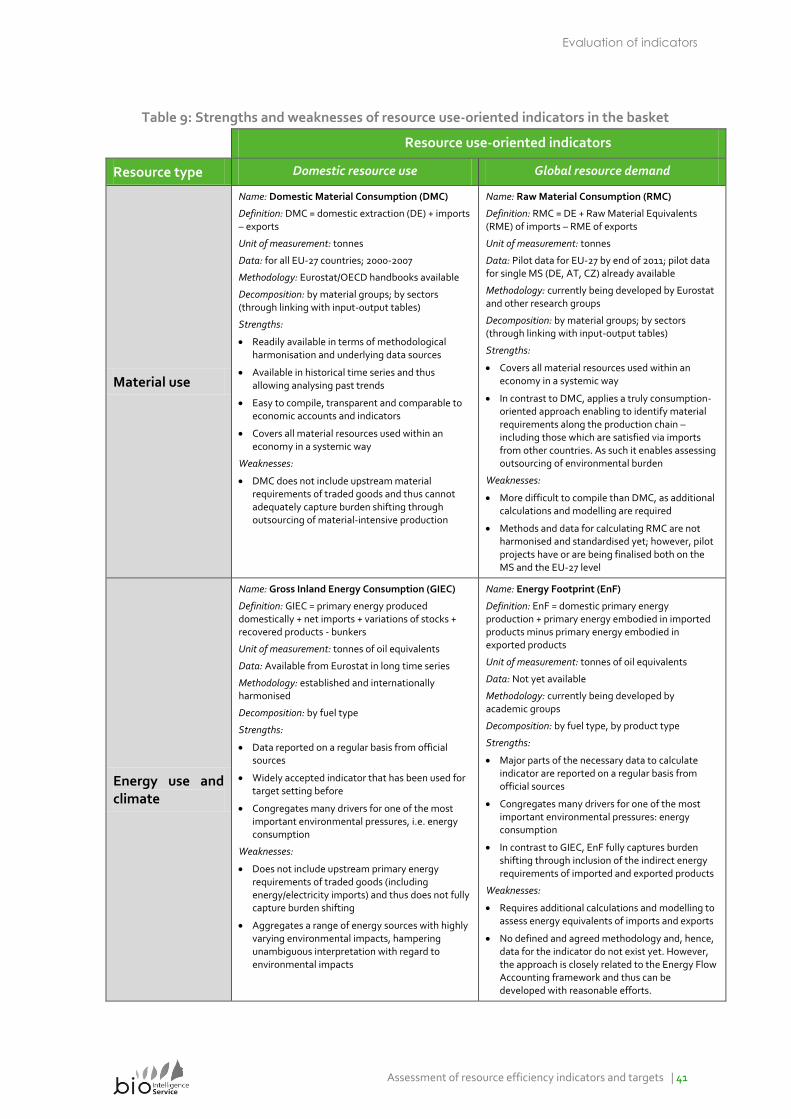
Evaluation of indicators
Assessment of resource efficiency indicators and targets | 41
Table 9: Strengths and weaknesses of resource use-oriented indicators in the basket
Resource use-oriented indicators
Resource type Domestic resource use Global resource demand
Material use
Name: Domestic Material Consumption (DMC)
Definition: DMC = domestic extraction (DE) + imports – exports
Unit of measurement: tonnes
Data: for all EU-27 countries; 2000-2007
Methodology: Eurostat/OECD handbooks available
Decomposition: by material groups; by sectors (through linking with input-output tables)
Strengths:
Readily available in terms of methodological harmonisation and underlying data sources
Available in historical time series and thus allowing analysing past trends
Easy to compile, transparent and comparable to economic accounts and indicators
Covers all material resources used within an economy in a systemic way
Weaknesses:
DMC does not include upstream material requirements of traded goods and thus cannot adequately capture burden shifting through outsourcing of material-intensive production
Name: Raw Material Consumption (RMC)
Definition: RMC = DE + Raw Material Equivalents (RME) of imports – RME of exports
Unit of measurement: tonnes
Data: Pilot data for EU-27 by end of 2011; pilot data for single MS (DE, AT, CZ) already available
Methodology: currently being developed by Eurostat and other research groups
Decomposition: by material groups; by sectors (through linking with input-output tables)
Strengths:
Covers all material resources used within an economy in a systemic way
In contrast to DMC, applies a truly consumption-oriented approach enabling to identify material requirements along the production chain – including those which are satisfied via imports from other countries. As such it enables assessing outsourcing of environmental burden
Weaknesses:
More difficult to compile than DMC, as additional calculations and modelling are required
Methods and data for calculating RMC are not harmonised and standardised yet; however, pilot projects have or are being finalised both on the MS and the EU-27 level
Energy use and climate
Name: Gross Inland Energy Consumption (GIEC)
Definition: GIEC = primary energy produced domestically + net imports + variations of stocks + recovered products - bunkers
Unit of measurement: tonnes of oil equivalents
Data: Available from Eurostat in long time series
Methodology: established and internationally harmonised
Decomposition: by fuel type
Strengths:
Data reported on a regular basis from official sources
Widely accepted indicator that has been used for target setting before
Congregates many drivers for one of the most important environmental pressures, i.e. energy consumption
Weaknesses:
Does not include upstream primary energy requirements of traded goods (including energy/electricity imports) and thus does not fully capture burden shifting
Aggregates a range of energy sources with highly varying environmental impacts, hampering unambiguous interpretation with regard to environmental impacts
Name: Energy Footprint (EnF)
Definition: EnF = domestic primary energy production + primary energy embodied in imported products minus primary energy embodied in exported products
Unit of measurement: tonnes of oil equivalents
Data: Not yet available
Methodology: currently being developed by academic groups
Decomposition: by fuel type, by product type
Strengths:
Major parts of the necessary data to calculate indicator are reported on a regular basis from official sources
Congregates many drivers for one of the most important environmental pressures: energy consumption
In contrast to GIEC, EnF fully captures burden shifting through inclusion of the indirect energy requirements of imported and exported products
Weaknesses:
Requires additional calculations and modelling to assess energy equivalents of imports and exports
No defined and agreed methodology and, hence, data for the indicator do not exist yet. However, the approach is closely related to the Energy Flow Accounting framework and thus can be developed with reasonable efforts.
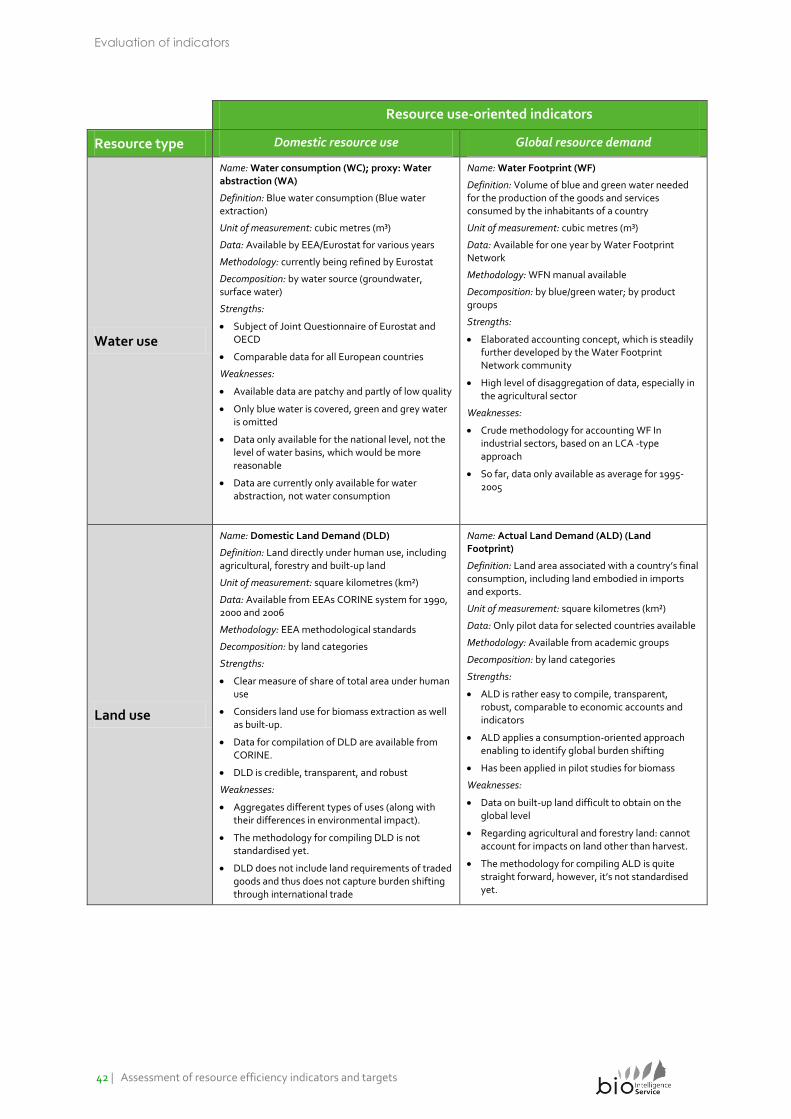
Evaluation of indicators
42 | Assessment of resource efficiency indicators and targets
Resource use-oriented indicators
Resource type Domestic resource use Global resource demand
Water use
Name: Water consumption (WC); proxy: Water abstraction (WA)
Definition: Blue water consumption (Blue water extraction)
Unit of measurement: cubic metres (m³)
Data: Available by EEA/Eurostat for various years
Methodology: currently being refined by Eurostat
Decomposition: by water source (groundwater, surface water)
Strengths:
Subject of Joint Questionnaire of Eurostat and OECD
Comparable data for all European countries
Weaknesses:
Available data are patchy and partly of low quality
Only blue water is covered, green and grey water is omitted
Data only available for the national level, not the level of water basins, which would be more reasonable
Data are currently only available for water abstraction, not water consumption
Name: Water Footprint (WF)
Definition: Volume of blue and green water needed for the production of the goods and services consumed by the inhabitants of a country
Unit of measurement: cubic metres (m³)
Data: Available for one year by Water Footprint Network
Methodology: WFN manual available
Decomposition: by blue/green water; by product groups
Strengths:
Elaborated accounting concept, which is steadily further developed by the Water Footprint Network community
High level of disaggregation of data, especially in the agricultural sector
Weaknesses:
Crude methodology for accounting WF In industrial sectors, based on an LCA -type approach
So far, data only available as average for 1995-2005
Land use
Name: Domestic Land Demand (DLD)
Definition: Land directly under human use, including agricultural, forestry and built-up land
Unit of measurement: square kilometres (km²)
Data: Available from EEAs CORINE system for 1990, 2000 and 2006
Methodology: EEA methodological standards
Decomposition: by land categories
Strengths:
Clear measure of share of total area under human use
Considers land use for biomass extraction as well as built-up.
Data for compilation of DLD are available from CORINE.
DLD is credible, transparent, and robust
Weaknesses:
Aggregates different types of uses (along with their differences in environmental impact).
The methodology for compiling DLD is not standardised yet.
DLD does not include land requirements of traded goods and thus does not capture burden shifting through international trade
Name: Actual Land Demand (ALD) (Land Footprint)
Definition: Land area associated with a country’s final consumption, including land embodied in imports and exports.
Unit of measurement: square kilometres (km²)
Data: Only pilot data for selected countries available
Methodology: Available from academic groups
Decomposition: by land categories
Strengths:
ALD is rather easy to compile, transparent, robust, comparable to economic accounts and indicators
ALD applies a consumption-oriented approach enabling to identify global burden shifting
Has been applied in pilot studies for biomass
Weaknesses:
Data on built-up land difficult to obtain on the global level
Regarding agricultural and forestry land: cannot account for impacts on land other than harvest.
The methodology for compiling ALD is quite straight forward, however, it’s not standardised yet.
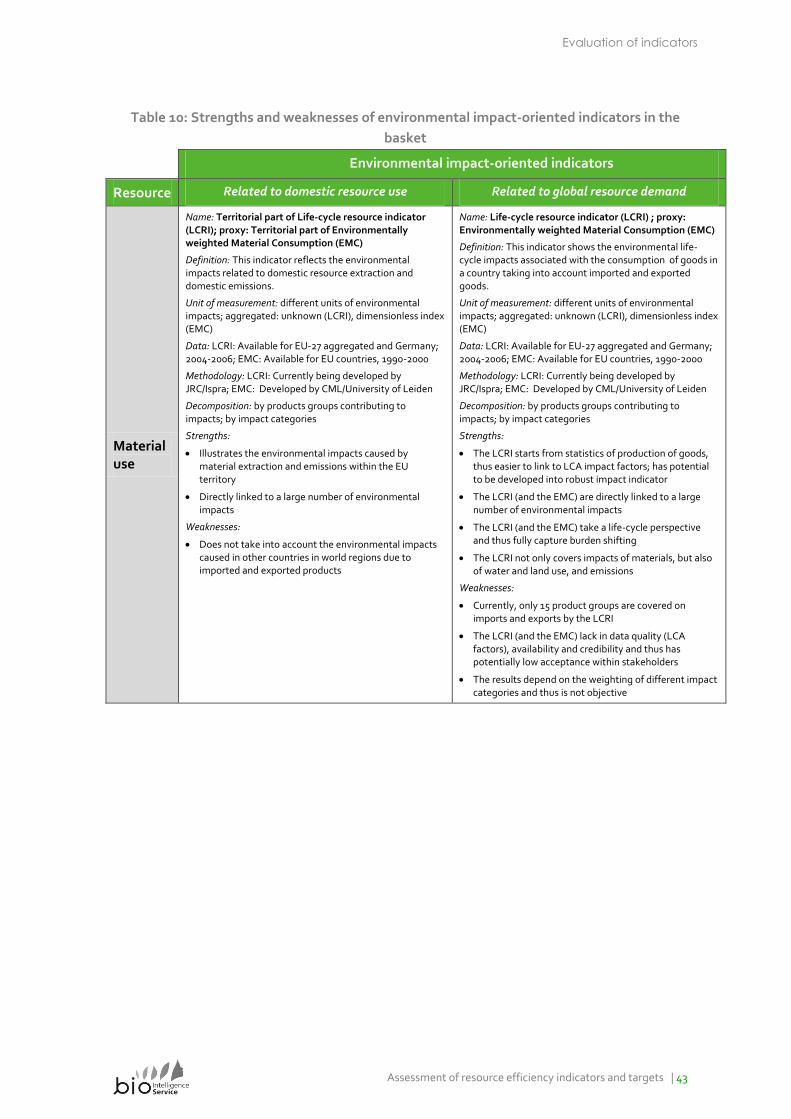
Evaluation of indicators
Assessment of resource efficiency indicators and targets | 43
Table 10: Strengths and weaknesses of environmental impact-oriented indicators in the
basket
Environmental impact-oriented indicators
Resource Related to domestic resource use Related to global resource demand
Material use
Name: Territorial part of Life-cycle resource indicator (LCRI); proxy: Territorial part of Environmentally weighted Material Consumption (EMC)
Definition: This indicator reflects the environmental impacts related to domestic resource extraction and domestic emissions.
Unit of measurement: different units of environmental impacts; aggregated: unknown (LCRI), dimensionless index (EMC)
Data: LCRI: Available for EU-27 aggregated and Germany; 2004-2006; EMC: Available for EU countries, 1990-2000
Methodology: LCRI: Currently being developed by JRC/Ispra; EMC: Developed by CML/University of Leiden
Decomposition: by products groups contributing to impacts; by impact categories
Strengths:
Illustrates the environmental impacts caused by material extraction and emissions within the EU territory
Directly linked to a large number of environmental impacts
Weaknesses:
Does not take into account the environmental impacts caused in other countries in world regions due to imported and exported products
Name: Life-cycle resource indicator (LCRI) ; proxy: Environmentally weighted Material Consumption (EMC)
Definition: This indicator shows the environmental life-cycle impacts associated with the consumption of goods in a country taking into account imported and exported goods.
Unit of measurement: different units of environmental impacts; aggregated: unknown (LCRI), dimensionless index (EMC)
Data: LCRI: Available for EU-27 aggregated and Germany; 2004-2006; EMC: Available for EU countries, 1990-2000
Methodology: LCRI: Currently being developed by JRC/Ispra; EMC: Developed by CML/University of Leiden
Decomposition: by products groups contributing to impacts; by impact categories
Strengths:
The LCRI starts from statistics of production of goods, thus easier to link to LCA impact factors; has potential to be developed into robust impact indicator
The LCRI (and the EMC) are directly linked to a large number of environmental impacts
The LCRI (and the EMC) take a life-cycle perspective and thus fully capture burden shifting
The LCRI not only covers impacts of materials, but also of water and land use, and emissions
Weaknesses:
Currently, only 15 product groups are covered on imports and exports by the LCRI
The LCRI (and the EMC) lack in data quality (LCA factors), availability and credibility and thus has potentially low acceptance within stakeholders
The results depend on the weighting of different impact categories and thus is not objective
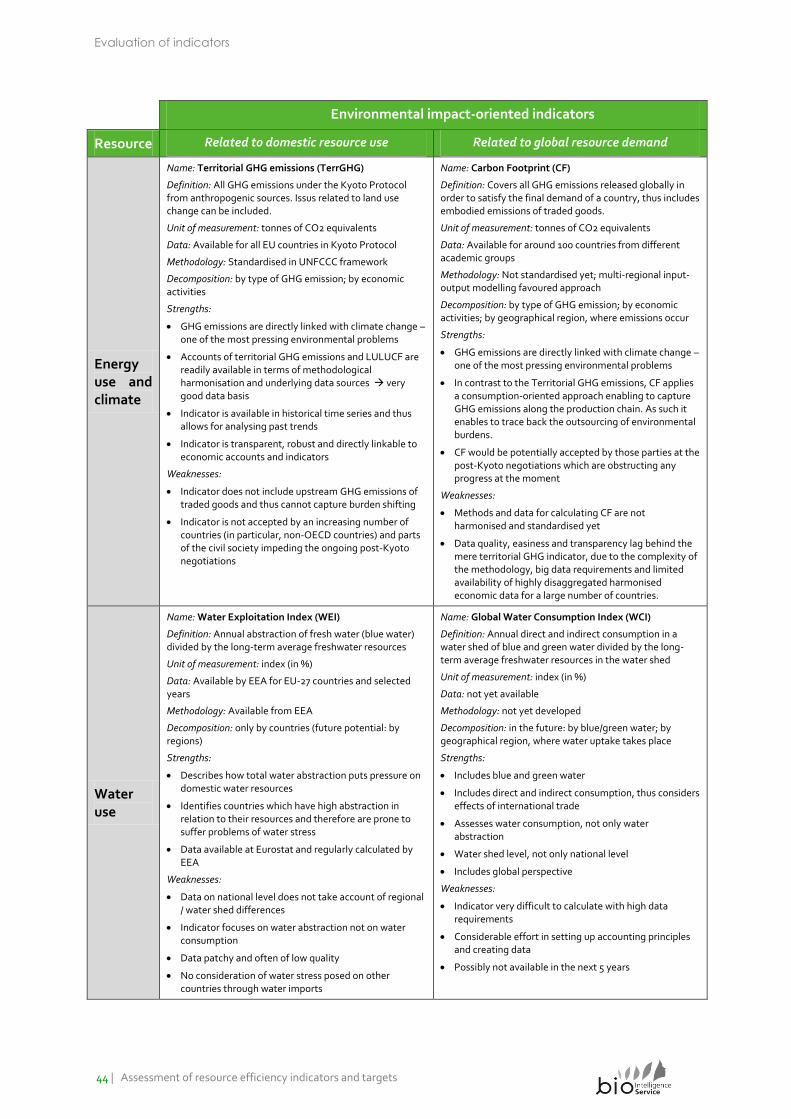
Evaluation of indicators
44 | Assessment of resource efficiency indicators and targets
Environmental impact-oriented indicators
Resource Related to domestic resource use Related to global resource demand
Energy use and climate
Name: Territorial GHG emissions (TerrGHG)
Definition: All GHG emissions under the Kyoto Protocol from anthropogenic sources. Issus related to land use change can be included.
Unit of measurement: tonnes of CO2 equivalents
Data: Available for all EU countries in Kyoto Protocol
Methodology: Standardised in UNFCCC framework
Decomposition: by type of GHG emission; by economic activities
Strengths:
GHG emissions are directly linked with climate change – one of the most pressing environmental problems
Accounts of territorial GHG emissions and LULUCF are readily available in terms of methodological harmonisation and underlying data sources very good data basis
Indicator is available in historical time series and thus allows for analysing past trends
Indicator is transparent, robust and directly linkable to economic accounts and indicators
Weaknesses:
Indicator does not include upstream GHG emissions of traded goods and thus cannot capture burden shifting
Indicator is not accepted by an increasing number of countries (in particular, non-OECD countries) and parts of the civil society impeding the ongoing post-Kyoto negotiations
Name: Carbon Footprint (CF)
Definition: Covers all GHG emissions released globally in order to satisfy the final demand of a country, thus includes embodied emissions of traded goods.
Unit of measurement: tonnes of CO2 equivalents
Data: Available for around 100 countries from different academic groups
Methodology: Not standardised yet; multi-regional input-output modelling favoured approach
Decomposition: by type of GHG emission; by economic activities; by geographical region, where emissions occur
Strengths:
GHG emissions are directly linked with climate change – one of the most pressing environmental problems
In contrast to the Territorial GHG emissions, CF applies a consumption-oriented approach enabling to capture GHG emissions along the production chain. As such it enables to trace back the outsourcing of environmental burdens.
CF would be potentially accepted by those parties at the post-Kyoto negotiations which are obstructing any progress at the moment
Weaknesses:
Methods and data for calculating CF are not harmonised and standardised yet
Data quality, easiness and transparency lag behind the mere territorial GHG indicator, due to the complexity of the methodology, big data requirements and limited availability of highly disaggregated harmonised economic data for a large number of countries.
Water use
Name: Water Exploitation Index (WEI)
Definition: Annual abstraction of fresh water (blue water) divided by the long-term average freshwater resources
Unit of measurement: index (in %)
Data: Available by EEA for EU-27 countries and selected years
Methodology: Available from EEA
Decomposition: only by countries (future potential: by regions)
Strengths:
Describes how total water abstraction puts pressure on domestic water resources
Identifies countries which have high abstraction in relation to their resources and therefore are prone to suffer problems of water stress
Data available at Eurostat and regularly calculated by EEA
Weaknesses:
Data on national level does not take account of regional / water shed differences
Indicator focuses on water abstraction not on water consumption
Data patchy and often of low quality
No consideration of water stress posed on other countries through water imports
Name: Global Water Consumption Index (WCI)
Definition: Annual direct and indirect consumption in a water shed of blue and green water divided by the long-term average freshwater resources in the water shed
Unit of measurement: index (in %)
Data: not yet available
Methodology: not yet developed
Decomposition: in the future: by blue/green water; by geographical region, where water uptake takes place
Strengths:
Includes blue and green water
Includes direct and indirect consumption, thus considers effects of international trade
Assesses water consumption, not only water abstraction
Water shed level, not only national level
Includes global perspective
Weaknesses:
Indicator very difficult to calculate with high data requirements
Considerable effort in setting up accounting principles and creating data
Possibly not available in the next 5 years
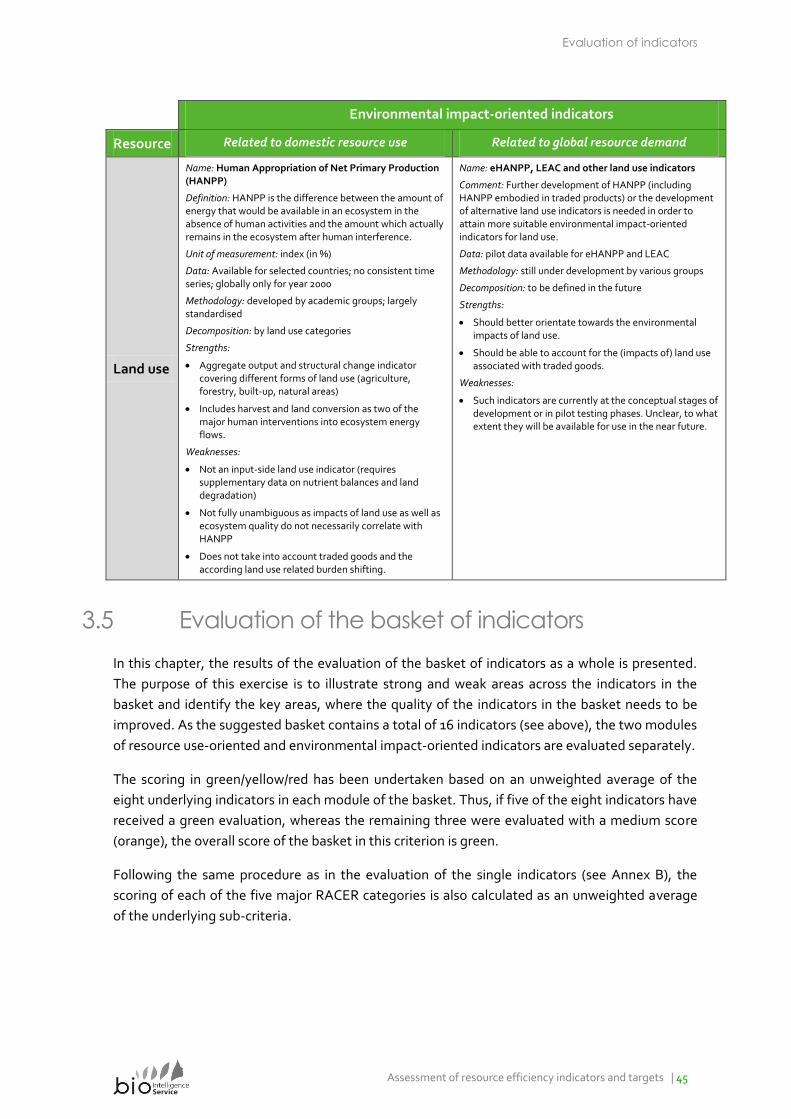
Evaluation of indicators
Assessment of resource efficiency indicators and targets | 45
Environmental impact-oriented indicators
Resource Related to domestic resource use Related to global resource demand
Land use
Name: Human Appropriation of Net Primary Production (HANPP)
Definition: HANPP is the difference between the amount of energy that would be available in an ecosystem in the absence of human activities and the amount which actually remains in the ecosystem after human interference.
Unit of measurement: index (in %)
Data: Available for selected countries; no consistent time series; globally only for year 2000
Methodology: developed by academic groups; largely standardised
Decomposition: by land use categories
Strengths:
Aggregate output and structural change indicator covering different forms of land use (agriculture, forestry, built-up, natural areas)
Includes harvest and land conversion as two of the major human interventions into ecosystem energy flows.
Weaknesses:
Not an input-side land use indicator (requires supplementary data on nutrient balances and land degradation)
Not fully unambiguous as impacts of land use as well as ecosystem quality do not necessarily correlate with HANPP
Does not take into account traded goods and the according land use related burden shifting.
Name: eHANPP, LEAC and other land use indicators
Comment: Further development of HANPP (including HANPP embodied in traded products) or the development of alternative land use indicators is needed in order to attain more suitable environmental impact-oriented indicators for land use.
Data: pilot data available for eHANPP and LEAC
Methodology: still under development by various groups
Decomposition: to be defined in the future
Strengths:
Should better orientate towards the environmental impacts of land use.
Should be able to account for the (impacts of) land use associated with traded goods.
Weaknesses:
Such indicators are currently at the conceptual stages of development or in pilot testing phases. Unclear, to what extent they will be available for use in the near future.
3.5 Evaluation of the basket of indicators
In this chapter, the results of the evaluation of the basket of indicators as a whole is presented.
The purpose of this exercise is to illustrate strong and weak areas across the indicators in the
basket and identify the key areas, where the quality of the indicators in the basket needs to be
improved. As the suggested basket contains a total of 16 indicators (see above), the two modules
of resource use-oriented and environmental impact-oriented indicators are evaluated separately.
The scoring in green/yellow/red has been undertaken based on an unweighted average of the
eight underlying indicators in each module of the basket. Thus, if five of the eight indicators have
received a green evaluation, whereas the remaining three were evaluated with a medium score
(orange), the overall score of the basket in this criterion is green.
Following the same procedure as in the evaluation of the single indicators (see Annex B), the
scoring of each of the five major RACER categories is also calculated as an unweighted average
of the underlying sub-criteria.
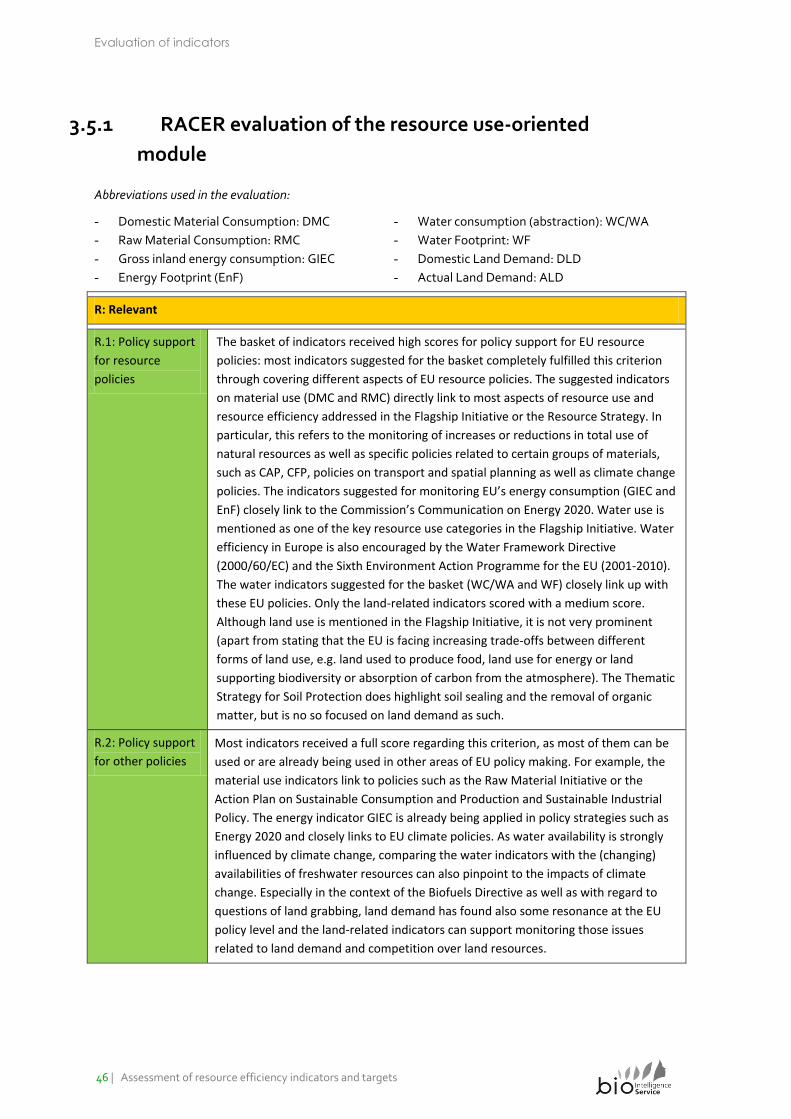
Evaluation of indicators
46 | Assessment of resource efficiency indicators and targets
3.5.1 RACER evaluation of the resource use-oriented
module
Abbreviations used in the evaluation:
- Domestic Material Consumption: DMC
- Raw Material Consumption: RMC
- Gross inland energy consumption: GIEC
- Energy Footprint (EnF)
- Water consumption (abstraction): WC/WA
- Water Footprint: WF
- Domestic Land Demand: DLD
- Actual Land Demand: ALD
R: Relevant
R.1: Policy support
for resource
policies
The basket of indicators received high scores for policy support for EU resource
policies: most indicators suggested for the basket completely fulfilled this criterion
through covering different aspects of EU resource policies. The suggested indicators
on material use (DMC and RMC) directly link to most aspects of resource use and
resource efficiency addressed in the Flagship Initiative or the Resource Strategy. In
particular, this refers to the monitoring of increases or reductions in total use of
natural resources as well as specific policies related to certain groups of materials,
such as CAP, CFP, policies on transport and spatial planning as well as climate change
policies. The indicators suggested for monitoring EU’s energy consumption (GIEC and
EnF) closely link to the Commission’s Communication on Energy 2020. Water use is
mentioned as one of the key resource use categories in the Flagship Initiative. Water
efficiency in Europe is also encouraged by the Water Framework Directive
(2000/60/EC) and the Sixth Environment Action Programme for the EU (2001-2010).
The water indicators suggested for the basket (WC/WA and WF) closely link up with
these EU policies. Only the land-related indicators scored with a medium score.
Although land use is mentioned in the Flagship Initiative, it is not very prominent
(apart from stating that the EU is facing increasing trade-offs between different
forms of land use, e.g. land used to produce food, land use for energy or land
supporting biodiversity or absorption of carbon from the atmosphere). The Thematic
Strategy for Soil Protection does highlight soil sealing and the removal of organic
matter, but is no so focused on land demand as such.
R.2: Policy support
for other policies
Most indicators received a full score regarding this criterion, as most of them can be
used or are already being used in other areas of EU policy making. For example, the
material use indicators link to policies such as the Raw Material Initiative or the
Action Plan on Sustainable Consumption and Production and Sustainable Industrial
Policy. The energy indicator GIEC is already being applied in policy strategies such as
Energy 2020 and closely links to EU climate policies. As water availability is strongly
influenced by climate change, comparing the water indicators with the (changing)
availabilities of freshwater resources can also pinpoint to the impacts of climate
change. Especially in the context of the Biofuels Directive as well as with regard to
questions of land grabbing, land demand has found also some resonance at the EU
policy level and the land-related indicators can support monitoring those issues
related to land demand and competition over land resources.
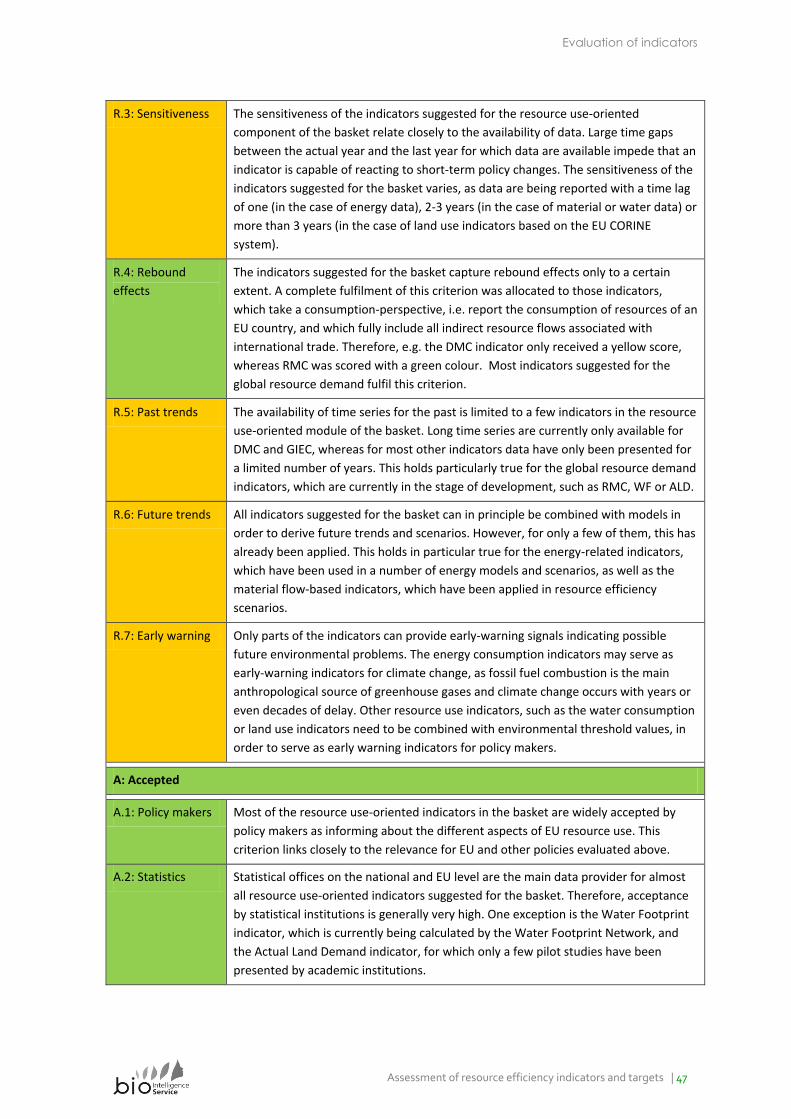
Evaluation of indicators
Assessment of resource efficiency indicators and targets | 47
R.3: Sensitiveness The sensitiveness of the indicators suggested for the resource use-oriented
component of the basket relate closely to the availability of data. Large time gaps
between the actual year and the last year for which data are available impede that an
indicator is capable of reacting to short-term policy changes. The sensitiveness of the
indicators suggested for the basket varies, as data are being reported with a time lag
of one (in the case of energy data), 2-3 years (in the case of material or water data) or
more than 3 years (in the case of land use indicators based on the EU CORINE
system).
R.4: Rebound
effects
The indicators suggested for the basket capture rebound effects only to a certain
extent. A complete fulfilment of this criterion was allocated to those indicators,
which take a consumption-perspective, i.e. report the consumption of resources of an
EU country, and which fully include all indirect resource flows associated with
international trade. Therefore, e.g. the DMC indicator only received a yellow score,
whereas RMC was scored with a green colour. Most indicators suggested for the
global resource demand fulfil this criterion.
R.5: Past trends The availability of time series for the past is limited to a few indicators in the resource
use-oriented module of the basket. Long time series are currently only available for
DMC and GIEC, whereas for most other indicators data have only been presented for
a limited number of years. This holds particularly true for the global resource demand
indicators, which are currently in the stage of development, such as RMC, WF or ALD.
R.6: Future trends All indicators suggested for the basket can in principle be combined with models in
order to derive future trends and scenarios. However, for only a few of them, this has
already been applied. This holds in particular true for the energy-related indicators,
which have been used in a number of energy models and scenarios, as well as the
material flow-based indicators, which have been applied in resource efficiency
scenarios.
R.7: Early warning Only parts of the indicators can provide early-warning signals indicating possible
future environmental problems. The energy consumption indicators may serve as
early-warning indicators for climate change, as fossil fuel combustion is the main
anthropological source of greenhouse gases and climate change occurs with years or
even decades of delay. Other resource use indicators, such as the water consumption
or land use indicators need to be combined with environmental threshold values, in
order to serve as early warning indicators for policy makers.
A: Accepted
A.1: Policy makers Most of the resource use-oriented indicators in the basket are widely accepted by
policy makers as informing about the different aspects of EU resource use. This
criterion links closely to the relevance for EU and other policies evaluated above.
A.2: Statistics Statistical offices on the national and EU level are the main data provider for almost
all resource use-oriented indicators suggested for the basket. Therefore, acceptance
by statistical institutions is generally very high. One exception is the Water Footprint
indicator, which is currently being calculated by the Water Footprint Network, and
the Actual Land Demand indicator, for which only a few pilot studies have been
presented by academic institutions.
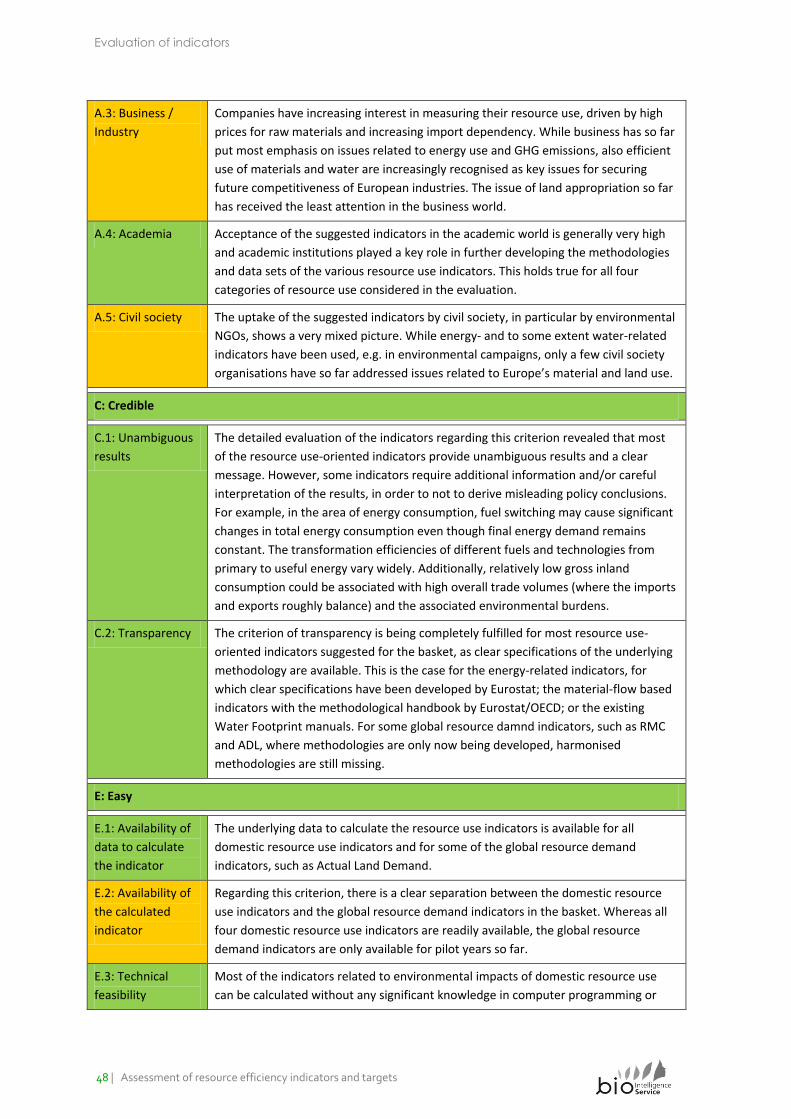
Evaluation of indicators
48 | Assessment of resource efficiency indicators and targets
A.3: Business /
Industry
Companies have increasing interest in measuring their resource use, driven by high
prices for raw materials and increasing import dependency. While business has so far
put most emphasis on issues related to energy use and GHG emissions, also efficient
use of materials and water are increasingly recognised as key issues for securing
future competitiveness of European industries. The issue of land appropriation so far
has received the least attention in the business world.
A.4: Academia Acceptance of the suggested indicators in the academic world is generally very high
and academic institutions played a key role in further developing the methodologies
and data sets of the various resource use indicators. This holds true for all four
categories of resource use considered in the evaluation.
A.5: Civil society The uptake of the suggested indicators by civil society, in particular by environmental
NGOs, shows a very mixed picture. While energy- and to some extent water-related
indicators have been used, e.g. in environmental campaigns, only a few civil society
organisations have so far addressed issues related to Europe’s material and land use.
C: Credible
C.1: Unambiguous
results
The detailed evaluation of the indicators regarding this criterion revealed that most
of the resource use-oriented indicators provide unambiguous results and a clear
message. However, some indicators require additional information and/or careful
interpretation of the results, in order to not to derive misleading policy conclusions.
For example, in the area of energy consumption, fuel switching may cause significant
changes in total energy consumption even though final energy demand remains
constant. The transformation efficiencies of different fuels and technologies from
primary to useful energy vary widely. Additionally, relatively low gross inland
consumption could be associated with high overall trade volumes (where the imports
and exports roughly balance) and the associated environmental burdens.
C.2: Transparency The criterion of transparency is being completely fulfilled for most resource use-
oriented indicators suggested for the basket, as clear specifications of the underlying
methodology are available. This is the case for the energy-related indicators, for
which clear specifications have been developed by Eurostat; the material-flow based
indicators with the methodological handbook by Eurostat/OECD; or the existing
Water Footprint manuals. For some global resource damnd indicators, such as RMC
and ADL, where methodologies are only now being developed, harmonised
methodologies are still missing.
E: Easy
E.1: Availability of
data to calculate
the indicator
The underlying data to calculate the resource use indicators is available for all
domestic resource use indicators and for some of the global resource demand
indicators, such as Actual Land Demand.
E.2: Availability of
the calculated
indicator
Regarding this criterion, there is a clear separation between the domestic resource
use indicators and the global resource demand indicators in the basket. Whereas all
four domestic resource use indicators are readily available, the global resource
demand indicators are only available for pilot years so far.
E.3: Technical
feasibility
Most of the indicators related to environmental impacts of domestic resource use
can be calculated without any significant knowledge in computer programming or
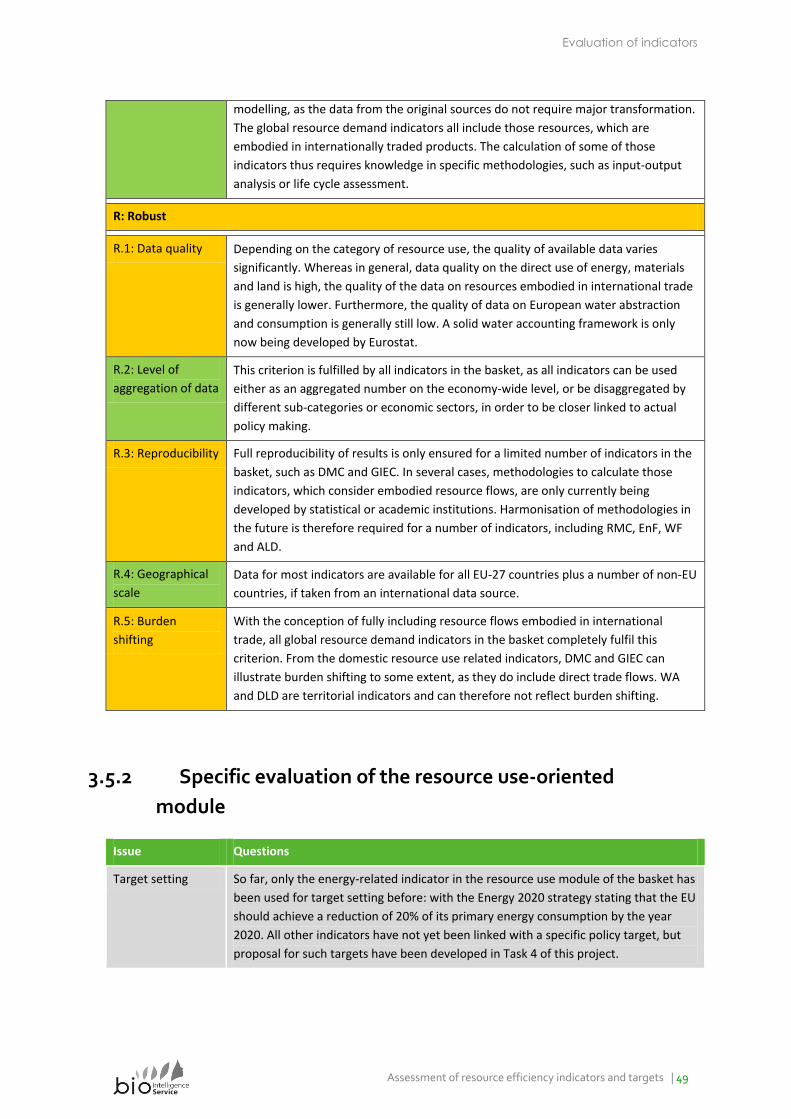
Evaluation of indicators
Assessment of resource efficiency indicators and targets | 49
modelling, as the data from the original sources do not require major transformation.
The global resource demand indicators all include those resources, which are
embodied in internationally traded products. The calculation of some of those
indicators thus requires knowledge in specific methodologies, such as input-output
analysis or life cycle assessment.
R: Robust
R.1: Data quality Depending on the category of resource use, the quality of available data varies
significantly. Whereas in general, data quality on the direct use of energy, materials
and land is high, the quality of the data on resources embodied in international trade
is generally lower. Furthermore, the quality of data on European water abstraction
and consumption is generally still low. A solid water accounting framework is only
now being developed by Eurostat.
R.2: Level of
aggregation of data
This criterion is fulfilled by all indicators in the basket, as all indicators can be used
either as an aggregated number on the economy-wide level, or be disaggregated by
different sub-categories or economic sectors, in order to be closer linked to actual
policy making.
R.3: Reproducibility Full reproducibility of results is only ensured for a limited number of indicators in the
basket, such as DMC and GIEC. In several cases, methodologies to calculate those
indicators, which consider embodied resource flows, are only currently being
developed by statistical or academic institutions. Harmonisation of methodologies in
the future is therefore required for a number of indicators, including RMC, EnF, WF
and ALD.
R.4: Geographical
scale
Data for most indicators are available for all EU-27 countries plus a number of non-EU
countries, if taken from an international data source.
R.5: Burden
shifting
With the conception of fully including resource flows embodied in international
trade, all global resource demand indicators in the basket completely fulfil this
criterion. From the domestic resource use related indicators, DMC and GIEC can
illustrate burden shifting to some extent, as they do include direct trade flows. WA
and DLD are territorial indicators and can therefore not reflect burden shifting.
3.5.2 Specific evaluation of the resource use-oriented
module
Issue Questions
Target setting So far, only the energy-related indicator in the resource use module of the basket has
been used for target setting before: with the Energy 2020 strategy stating that the EU
should achieve a reduction of 20% of its primary energy consumption by the year
2020. All other indicators have not yet been linked with a specific policy target, but
proposal for such targets have been developed in Task 4 of this project.
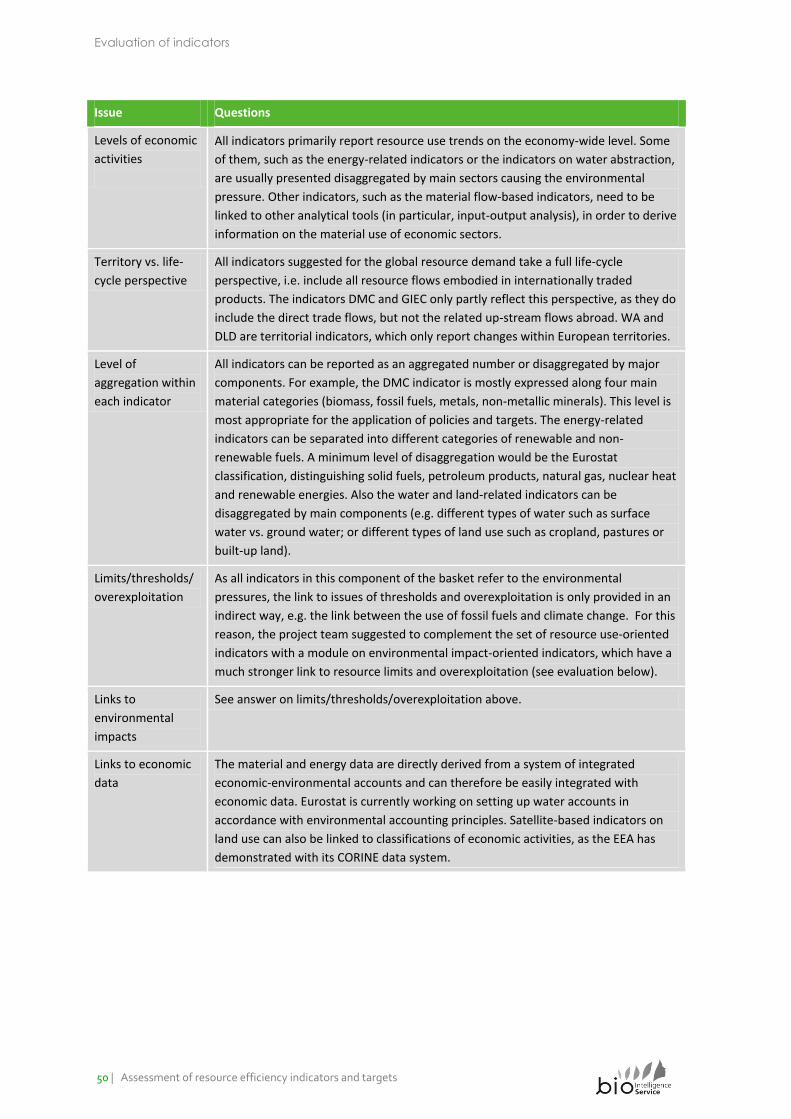
Evaluation of indicators
50 | Assessment of resource efficiency indicators and targets
Issue Questions
Levels of economic
activities
All indicators primarily report resource use trends on the economy-wide level. Some
of them, such as the energy-related indicators or the indicators on water abstraction,
are usually presented disaggregated by main sectors causing the environmental
pressure. Other indicators, such as the material flow-based indicators, need to be
linked to other analytical tools (in particular, input-output analysis), in order to derive
information on the material use of economic sectors.
Territory vs. life-
cycle perspective
All indicators suggested for the global resource demand take a full life-cycle
perspective, i.e. include all resource flows embodied in internationally traded
products. The indicators DMC and GIEC only partly reflect this perspective, as they do
include the direct trade flows, but not the related up-stream flows abroad. WA and
DLD are territorial indicators, which only report changes within European territories.
Level of
aggregation within
each indicator
All indicators can be reported as an aggregated number or disaggregated by major
components. For example, the DMC indicator is mostly expressed along four main
material categories (biomass, fossil fuels, metals, non-metallic minerals). This level is
most appropriate for the application of policies and targets. The energy-related
indicators can be separated into different categories of renewable and non-
renewable fuels. A minimum level of disaggregation would be the Eurostat
classification, distinguishing solid fuels, petroleum products, natural gas, nuclear heat
and renewable energies. Also the water and land-related indicators can be
disaggregated by main components (e.g. different types of water such as surface
water vs. ground water; or different types of land use such as cropland, pastures or
built-up land).
Limits/thresholds/
overexploitation
As all indicators in this component of the basket refer to the environmental
pressures, the link to issues of thresholds and overexploitation is only provided in an
indirect way, e.g. the link between the use of fossil fuels and climate change. For this
reason, the project team suggested to complement the set of resource use-oriented
indicators with a module on environmental impact-oriented indicators, which have a
much stronger link to resource limits and overexploitation (see evaluation below).
Links to
environmental
impacts
See answer on limits/thresholds/overexploitation above.
Links to economic
data
The material and energy data are directly derived from a system of integrated
economic-environmental accounts and can therefore be easily integrated with
economic data. Eurostat is currently working on setting up water accounts in
accordance with environmental accounting principles. Satellite-based indicators on
land use can also be linked to classifications of economic activities, as the EEA has
demonstrated with its CORINE data system.
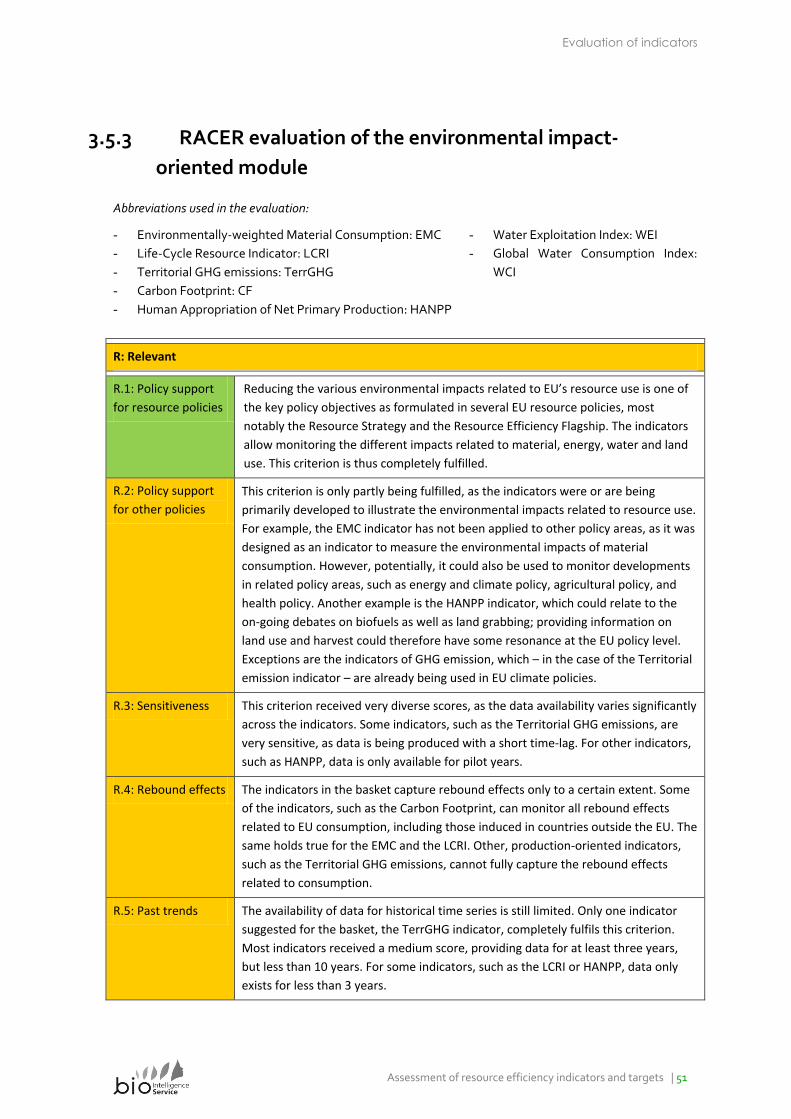
Evaluation of indicators
Assessment of resource efficiency indicators and targets | 51
3.5.3 RACER evaluation of the environmental impact-
oriented module
Abbreviations used in the evaluation:
- Environmentally-weighted Material Consumption: EMC
- Life-Cycle Resource Indicator: LCRI
- Territorial GHG emissions: TerrGHG
- Carbon Footprint: CF
- Human Appropriation of Net Primary Production: HANPP
- Water Exploitation Index: WEI
- Global Water Consumption Index:
WCI
R: Relevant
R.1: Policy support
for resource policies
Reducing the various environmental impacts related to EU’s resource use is one of
the key policy objectives as formulated in several EU resource policies, most
notably the Resource Strategy and the Resource Efficiency Flagship. The indicators
allow monitoring the different impacts related to material, energy, water and land
use. This criterion is thus completely fulfilled.
R.2: Policy support
for other policies
This criterion is only partly being fulfilled, as the indicators were or are being
primarily developed to illustrate the environmental impacts related to resource use.
For example, the EMC indicator has not been applied to other policy areas, as it was
designed as an indicator to measure the environmental impacts of material
consumption. However, potentially, it could also be used to monitor developments
in related policy areas, such as energy and climate policy, agricultural policy, and
health policy. Another example is the HANPP indicator, which could relate to the
on-going debates on biofuels as well as land grabbing; providing information on
land use and harvest could therefore have some resonance at the EU policy level.
Exceptions are the indicators of GHG emission, which – in the case of the Territorial
emission indicator – are already being used in EU climate policies.
R.3: Sensitiveness This criterion received very diverse scores, as the data availability varies significantly
across the indicators. Some indicators, such as the Territorial GHG emissions, are
very sensitive, as data is being produced with a short time-lag. For other indicators,
such as HANPP, data is only available for pilot years.
R.4: Rebound effects The indicators in the basket capture rebound effects only to a certain extent. Some
of the indicators, such as the Carbon Footprint, can monitor all rebound effects
related to EU consumption, including those induced in countries outside the EU. The
same holds true for the EMC and the LCRI. Other, production-oriented indicators,
such as the Territorial GHG emissions, cannot fully capture the rebound effects
related to consumption.
R.5: Past trends The availability of data for historical time series is still limited. Only one indicator
suggested for the basket, the TerrGHG indicator, completely fulfils this criterion.
Most indicators received a medium score, providing data for at least three years,
but less than 10 years. For some indicators, such as the LCRI or HANPP, data only
exists for less than 3 years.
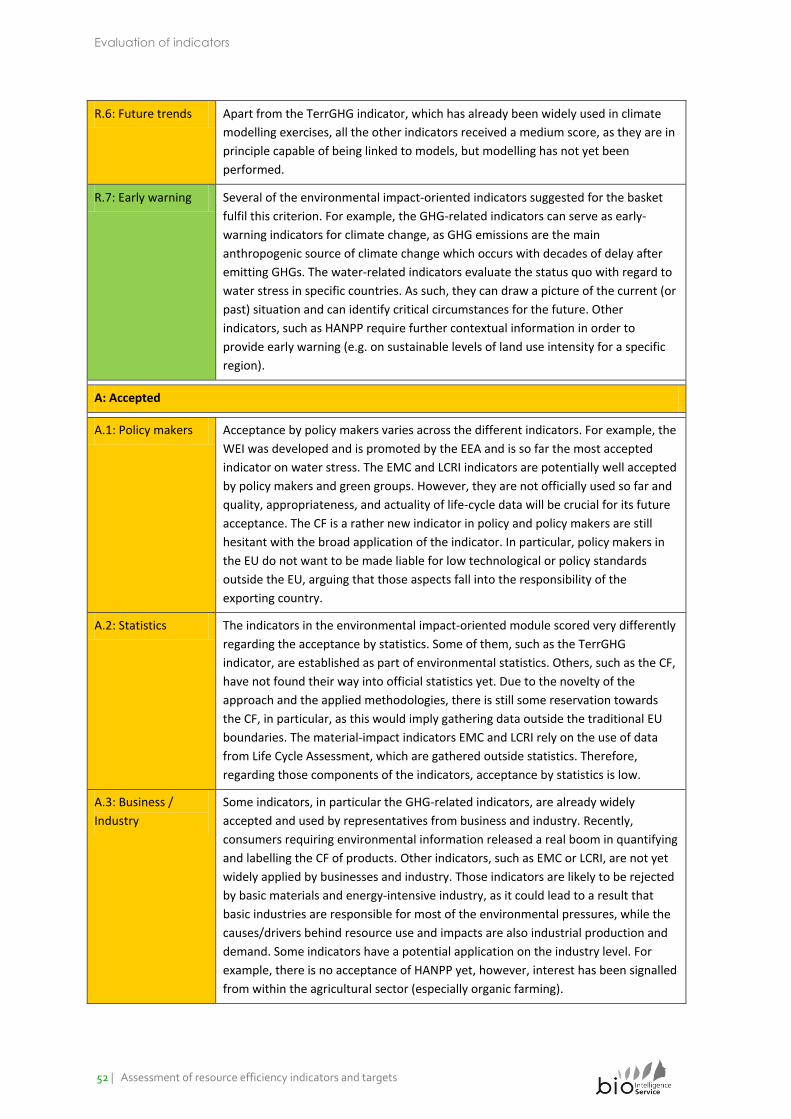
Evaluation of indicators
52 | Assessment of resource efficiency indicators and targets
R.6: Future trends Apart from the TerrGHG indicator, which has already been widely used in climate
modelling exercises, all the other indicators received a medium score, as they are in
principle capable of being linked to models, but modelling has not yet been
performed.
R.7: Early warning Several of the environmental impact-oriented indicators suggested for the basket
fulfil this criterion. For example, the GHG-related indicators can serve as early-
warning indicators for climate change, as GHG emissions are the main
anthropogenic source of climate change which occurs with decades of delay after
emitting GHGs. The water-related indicators evaluate the status quo with regard to
water stress in specific countries. As such, they can draw a picture of the current (or
past) situation and can identify critical circumstances for the future. Other
indicators, such as HANPP require further contextual information in order to
provide early warning (e.g. on sustainable levels of land use intensity for a specific
region).
A: Accepted
A.1: Policy makers Acceptance by policy makers varies across the different indicators. For example, the
WEI was developed and is promoted by the EEA and is so far the most accepted
indicator on water stress. The EMC and LCRI indicators are potentially well accepted
by policy makers and green groups. However, they are not officially used so far and
quality, appropriateness, and actuality of life-cycle data will be crucial for its future
acceptance. The CF is a rather new indicator in policy and policy makers are still
hesitant with the broad application of the indicator. In particular, policy makers in
the EU do not want to be made liable for low technological or policy standards
outside the EU, arguing that those aspects fall into the responsibility of the
exporting country.
A.2: Statistics The indicators in the environmental impact-oriented module scored very differently
regarding the acceptance by statistics. Some of them, such as the TerrGHG
indicator, are established as part of environmental statistics. Others, such as the CF,
have not found their way into official statistics yet. Due to the novelty of the
approach and the applied methodologies, there is still some reservation towards
the CF, in particular, as this would imply gathering data outside the traditional EU
boundaries. The material-impact indicators EMC and LCRI rely on the use of data
from Life Cycle Assessment, which are gathered outside statistics. Therefore,
regarding those components of the indicators, acceptance by statistics is low.
A.3: Business /
Industry
Some indicators, in particular the GHG-related indicators, are already widely
accepted and used by representatives from business and industry. Recently,
consumers requiring environmental information released a real boom in quantifying
and labelling the CF of products. Other indicators, such as EMC or LCRI, are not yet
widely applied by businesses and industry. Those indicators are likely to be rejected
by basic materials and energy-intensive industry, as it could lead to a result that
basic industries are responsible for most of the environmental pressures, while the
causes/drivers behind resource use and impacts are also industrial production and
demand. Some indicators have a potential application on the industry level. For
example, there is no acceptance of HANPP yet, however, interest has been signalled
from within the agricultural sector (especially organic farming).
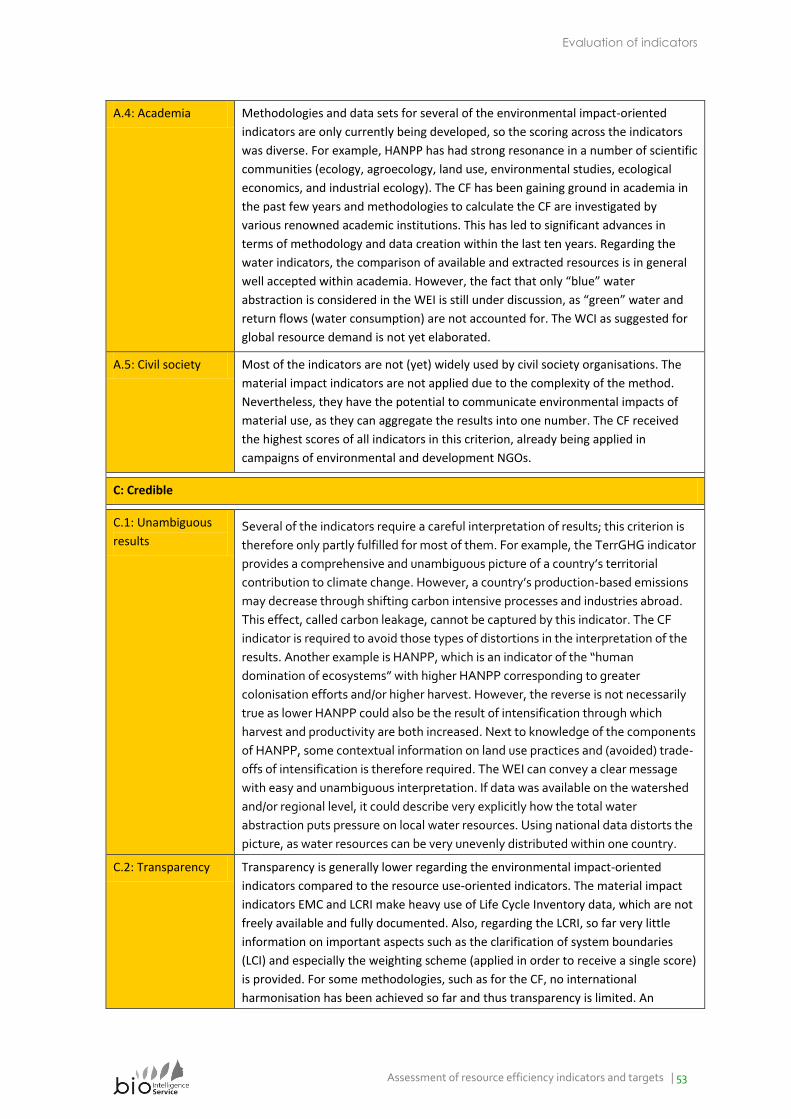
Evaluation of indicators
Assessment of resource efficiency indicators and targets | 53
A.4: Academia Methodologies and data sets for several of the environmental impact-oriented
indicators are only currently being developed, so the scoring across the indicators
was diverse. For example, HANPP has had strong resonance in a number of scientific
communities (ecology, agroecology, land use, environmental studies, ecological
economics, and industrial ecology). The CF has been gaining ground in academia in
the past few years and methodologies to calculate the CF are investigated by
various renowned academic institutions. This has led to significant advances in
terms of methodology and data creation within the last ten years. Regarding the
water indicators, the comparison of available and extracted resources is in general
well accepted within academia. However, the fact that only “blue” water
abstraction is considered in the WEI is still under discussion, as “green” water and
return flows (water consumption) are not accounted for. The WCI as suggested for
global resource demand is not yet elaborated.
A.5: Civil society Most of the indicators are not (yet) widely used by civil society organisations. The
material impact indicators are not applied due to the complexity of the method.
Nevertheless, they have the potential to communicate environmental impacts of
material use, as they can aggregate the results into one number. The CF received
the highest scores of all indicators in this criterion, already being applied in
campaigns of environmental and development NGOs.
C: Credible
C.1: Unambiguous
results Several of the indicators require a careful interpretation of results; this criterion is
therefore only partly fulfilled for most of them. For example, the TerrGHG indicator
provides a comprehensive and unambiguous picture of a country’s territorial
contribution to climate change. However, a country’s production-based emissions
may decrease through shifting carbon intensive processes and industries abroad.
This effect, called carbon leakage, cannot be captured by this indicator. The CF
indicator is required to avoid those types of distortions in the interpretation of the
results. Another example is HANPP, which is an indicator of the “human
domination of ecosystems” with higher HANPP corresponding to greater
colonisation efforts and/or higher harvest. However, the reverse is not necessarily
true as lower HANPP could also be the result of intensification through which
harvest and productivity are both increased. Next to knowledge of the components
of HANPP, some contextual information on land use practices and (avoided) trade-
offs of intensification is therefore required. The WEI can convey a clear message
with easy and unambiguous interpretation. If data was available on the watershed
and/or regional level, it could describe very explicitly how the total water
abstraction puts pressure on local water resources. Using national data distorts the
picture, as water resources can be very unevenly distributed within one country.
C.2: Transparency Transparency is generally lower regarding the environmental impact-oriented
indicators compared to the resource use-oriented indicators. The material impact
indicators EMC and LCRI make heavy use of Life Cycle Inventory data, which are not
freely available and fully documented. Also, regarding the LCRI, so far very little
information on important aspects such as the clarification of system boundaries
(LCI) and especially the weighting scheme (applied in order to receive a single score)
is provided. For some methodologies, such as for the CF, no international
harmonisation has been achieved so far and thus transparency is limited. An
Evaluation of indicators
54 | Assessment of resource efficiency indicators and targets
exception to the mainly medium scores in this criterion is the TerrGHG indicator, for
which the underlying methodology is clearly defined by the UN Framework
Convention on Climate Change.
E: Easy
E.1: Availability of
data to calculate the
indicator
The availability of underlying data to calculate the indicators is restricted in most
cases. The Life Cycle Inventory data required for the material impact indicators is
only partly freely available through the European LCA platform. Other data systems
needed are e.g. GaBi or the Ecoinvent database. Also for other environmental
impact-oriented indicators, substantial amounts of data are required, which are not
always easy to obtain. For example, the HANPP indicator requires data on climate
(temperature, precipitation) and soil quality, which need to be derived from
Dynamic Global Vegetation Models. Data on land use and land cover is easier to
obtain from FAOstat or Eurostat.
E.2: Availability of
the calculated
indicator
In parallel to the criterion E.1 above, also the availability of the calculated indicator
is limited. Best data are available for the TerrGHG indicator and also for the CF pilot
data, which has been published in time series. A relatively good situation can be
observed for the WEI, where the indicator is calculated on a regular basis by the EEA
and data are available for various years. The material impact data are either old
(only up to the year 2000 for the case of the EMC) or not yet developed in full time
series (the LCRI indicator is only available for the period of 2004-2006 so far for the
EU and Germany). HANPP is currently available at the global level for the year 2000
only.
E.3: Technical
feasibility
Most of the environmental impact-oriented indicators require a substantial
technical knowledge for their calculation. The material impact indicators EMC and
LCRI require specific LCA software and knowledge how to use them properly. Other
indicators, such as the CF, require comprehensive modelling approaches, such as
multi-regional input-output models, which require significant technical expert
knowledge to perform the calculations.
R: Robust
R.1: Data quality Data quality varies significantly across the indicators and – apart from the TerrGHG
indicator, no indicator reached the highest score in this criterion. For the material
impact indicators, two main components are required: Information about the
physical production and consumption volumes, which is generally available in good
quality, e.g. from material flow accounts; and life cycle impact factors, which are
often prone to uncertainties and restrictions, e.g. regarding geographical and
temporal specifications. Indicators relying on input-output analysis generally suffer
from the limited availability of highly disaggregated harmonised economic data for
a large number of countries. European water data (both for water reserves as well
as for abstraction) are available in Eurostat’s New Cronos database. However,
reported data are often incomplete or of questionable quality.
R.2: Level of
aggregation of data
Data for the indicators are not always available on the appropriate level. For
example, water data is available on the aggregated country level and only stepwise
being disaggregated with regard to the more appropriate water basin levels. One
key problem related to the material impact indicators is that LCA impact factors are
only available for single products, which makes it difficult to apply them for macro
Evaluation of indicators
Assessment of resource efficiency indicators and targets | 55
assessments. Therefore, the LCRI indicator applies the approach to select a limited
number of representative products for each product group. On the other hand,
HANPP can currently be spatially disaggregated up to a 10x10 km resolution and
aggregated to all higher spatial levels. It can also be calculated for different
agricultural products.
R.3: Reproducibility Reproducibility of results is limited, as the methodologies for most indicators are
not yet harmonised. This holds true for the material impact indicators EMC and LCRI
as well as for the calculation of CF and the water scarcity indicators. Only HANPP
and TerrGHG are sufficiently standardised to allow a proper reproduction of results.
R.4: Geographical
scale
Data of the indicators are in several cases not yet available for all EU countries. For
example, the LCRI developed by JRC, is so far only available for the EU-27 as an
aggregate and for Germany as a national example. However, some indicators, such
as the TerrGHG, are available on a national level for the 27 EU Member States and
almost all other countries worldwide.
R.5: Burden shifting The capacity to monitor burden shifting depends on whether or not the resources
embodied in international trade are properly considered. Some of the
environmental impact indicators in the short term are completely territorial (e.g.
TerrGHG or HANPP). The global resource demand related indicators all take a global
perspective and are thus able to monitor burden shifting.
3.5.4 Specific evaluation of the environmental impact-
oriented module
Issue Questions
Target setting So far, only the climate-related indicator in the environmental impact module of the
basket has been used for target setting with TerrGHG being the central indicator in
the Kyoto protocol. All other indicators have not yet been linked with a specific policy
target, but a proposal for such targets has been developed in Task 4 of this project.
Levels of economic
activities
All indicators primarily report resource use trends on the economy-wide level. Some
of them, in particular the material impact indicators, have a strong link to the product
level, with impact factors being attached to the EU consumption of specific products.
The land oriented indicators can be disaggregated and also be broken down to the
level of different product groups. While the CF is being calculated widely on the
product level (in the context of Carbon Footprint labelling), an integration of micro
and macro results for the CF has not yet been done. However, all GHG emission
indicators can be broken down into main sectors responsible for the respective
emissions.
Territory vs. life-
cycle perspective
Apart from the category of materials, all domestic resource use related
environmental impact indicators apply a territorial perspective. As the EU is
increasingly substituting material and energy-intensive products through imports, the
inclusion of the embodied resources will receive growing importance. Therefore, all
four suggested indicators representing global resource demand take a life-cycle
perspective.
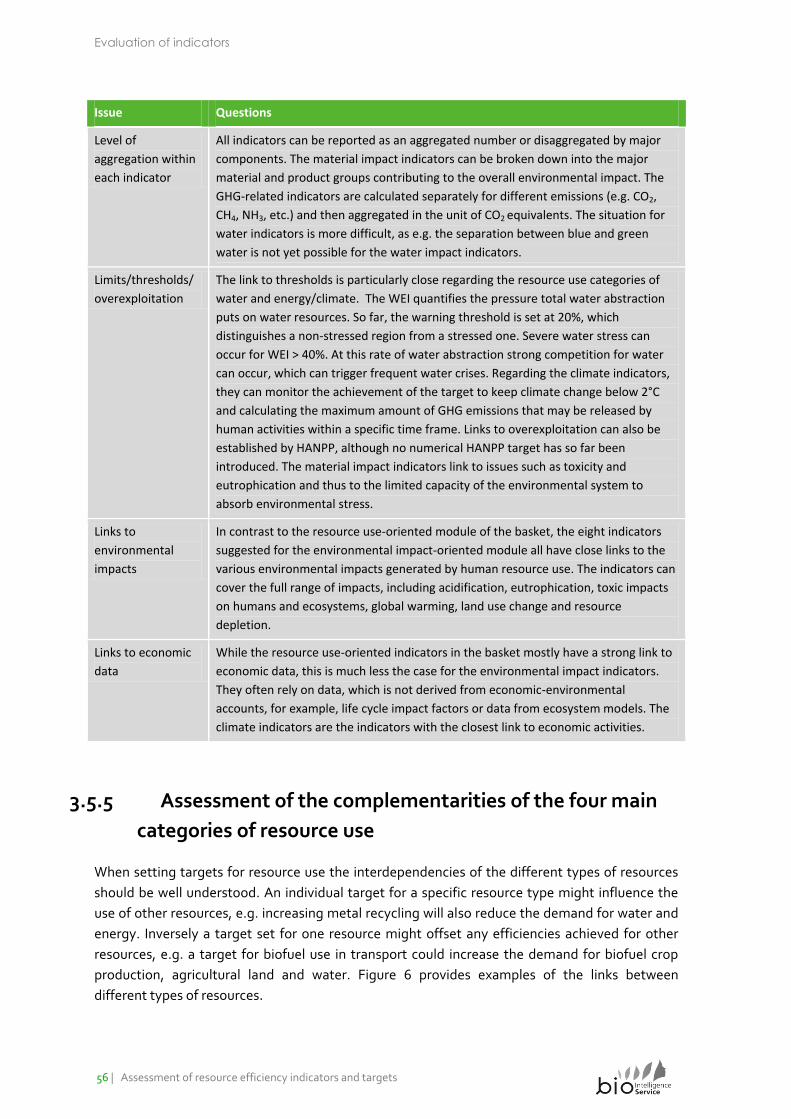
Evaluation of indicators
56 | Assessment of resource efficiency indicators and targets
Issue Questions
Level of
aggregation within
each indicator
All indicators can be reported as an aggregated number or disaggregated by major
components. The material impact indicators can be broken down into the major
material and product groups contributing to the overall environmental impact. The
GHG-related indicators are calculated separately for different emissions (e.g. CO2,
CH4, NH3, etc.) and then aggregated in the unit of CO2 equivalents. The situation for
water indicators is more difficult, as e.g. the separation between blue and green
water is not yet possible for the water impact indicators.
Limits/thresholds/
overexploitation
The link to thresholds is particularly close regarding the resource use categories of
water and energy/climate. The WEI quantifies the pressure total water abstraction
puts on water resources. So far, the warning threshold is set at 20%, which
distinguishes a non-stressed region from a stressed one. Severe water stress can
occur for WEI > 40%. At this rate of water abstraction strong competition for water
can occur, which can trigger frequent water crises. Regarding the climate indicators,
they can monitor the achievement of the target to keep climate change below 2°C
and calculating the maximum amount of GHG emissions that may be released by
human activities within a specific time frame. Links to overexploitation can also be
established by HANPP, although no numerical HANPP target has so far been
introduced. The material impact indicators link to issues such as toxicity and
eutrophication and thus to the limited capacity of the environmental system to
absorb environmental stress.
Links to
environmental
impacts
In contrast to the resource use-oriented module of the basket, the eight indicators
suggested for the environmental impact-oriented module all have close links to the
various environmental impacts generated by human resource use. The indicators can
cover the full range of impacts, including acidification, eutrophication, toxic impacts
on humans and ecosystems, global warming, land use change and resource
depletion.
Links to economic
data
While the resource use-oriented indicators in the basket mostly have a strong link to
economic data, this is much less the case for the environmental impact indicators.
They often rely on data, which is not derived from economic-environmental
accounts, for example, life cycle impact factors or data from ecosystem models. The
climate indicators are the indicators with the closest link to economic activities.
3.5.5 Assessment of the complementarities of the four main
categories of resource use
When setting targets for resource use the interdependencies of the different types of resources
should be well understood. An individual target for a specific resource type might influence the
use of other resources, e.g. increasing metal recycling will also reduce the demand for water and
energy. Inversely a target set for one resource might offset any efficiencies achieved for other
resources, e.g. a target for biofuel use in transport could increase the demand for biofuel crop
production, agricultural land and water. Figure 6 provides examples of the links between
different types of resources.
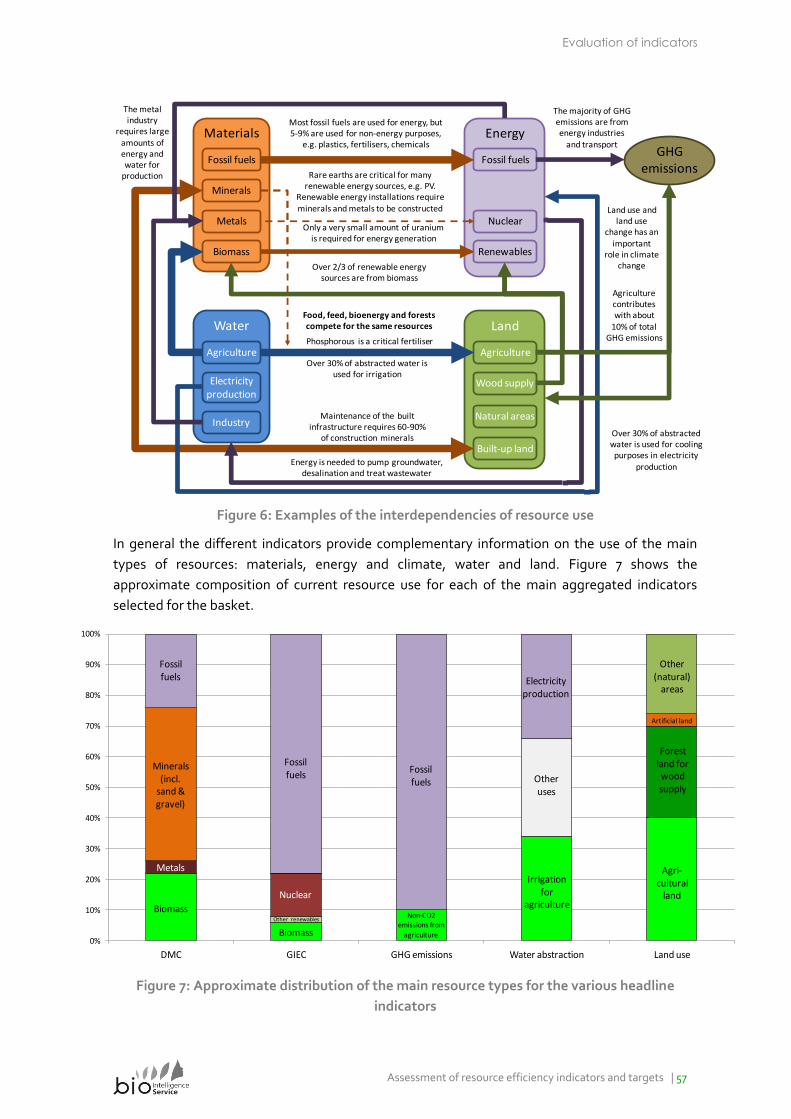
Evaluation of indicators
Assessment of resource efficiency indicators and targets | 57
Materials
Land
Energy
Water
Metals
Minerals
Biomass
Fossil fuels
Renewables
Nuclear
Fossil fuels
Agriculture
Electricity production
Industry
Agriculture
Most fossil fuels are used for energy, but 5-9% are used for non-energy purposes,
e.g. plastics, fertilisers, chemicals
Only a very small amount of uranium is required for energy generation
Over 2/3 of renewable energy sources are from biomass
Rare earths are critical for many renewable energy sources, e.g. PV.
Renewable energy installations require minerals and metals to be constructed
Wood supply
Built-up landEnergy is needed to pump groundwater,
desalination and treat wastewater
Over 30% of abstracted water is used for irrigation
Over 30% of abstracted water is used for cooling purposes in electricity
production
Food, feed, bioenergy and forests compete for the same resources
Maintenance of the built infrastructure requires 60-90%
of construction minerals
Phosphorous is a critical fertiliser
The metal industry
requires large
amounts of energy and water for
production
Natural areas
GHG emissions
Agriculture contributes with about
10% of total GHG emissions
The majority of GHG emissions are from energy industries
and transport
Land use and land use
change has an important
role in climate change
Figure 6: Examples of the interdependencies of resource use
In general the different indicators provide complementary information on the use of the main
types of resources: materials, energy and climate, water and land. Figure 7 shows the
approximate composition of current resource use for each of the main aggregated indicators
selected for the basket.
0%
10%
20%
30%
40%
50%
60%
70%
80%
90%
100%
DMC GIEC GHG emissions Water abstraction Land use
Fossil fuels
Fossil fuels
Fossil fuels
Electricity production
Biomass
Agri-cultural
land
Forest land for wood supply
Other uses
Biomass
Non-CO2emissions from
agriculture
Other renewables
Metals
Minerals (incl.
sand & gravel)
Other (natural)
areas
Artificial land
Irrigation for
agricultureNuclear
Figure 7: Approximate distribution of the main resource types for the various headline
indicators
Evaluation of indicators
58 | Assessment of resource efficiency indicators and targets
It can be seen in Figure 7 that the consumption of biomass can be tracked in all of the indicators
for resource use. There is also a direct relationship between the consumption of fossil fuels in
DMC, energy consumption and GHG emissions. The production of electricity is associated to
both energy consumption and water abstraction. Likewise water used in agriculture can be
related to agricultural land.
The consumption of metals and minerals cannot be directly associated to the indicators for
energy and climate, water and land at present, but they be correlated to their use in different
economic sectors, i.e. manufacturing, construction, etc. Indicators that measure water, energy
and GHG emissions are disaggregated by economic sector in current datasets from Eurostat and
EEA. For each of the indicators used for targets, the project team analysed the links to other
indicators/targets (see Chapter 4). These links were examined in more detail in the scenario
assessment (see Chapter 4).
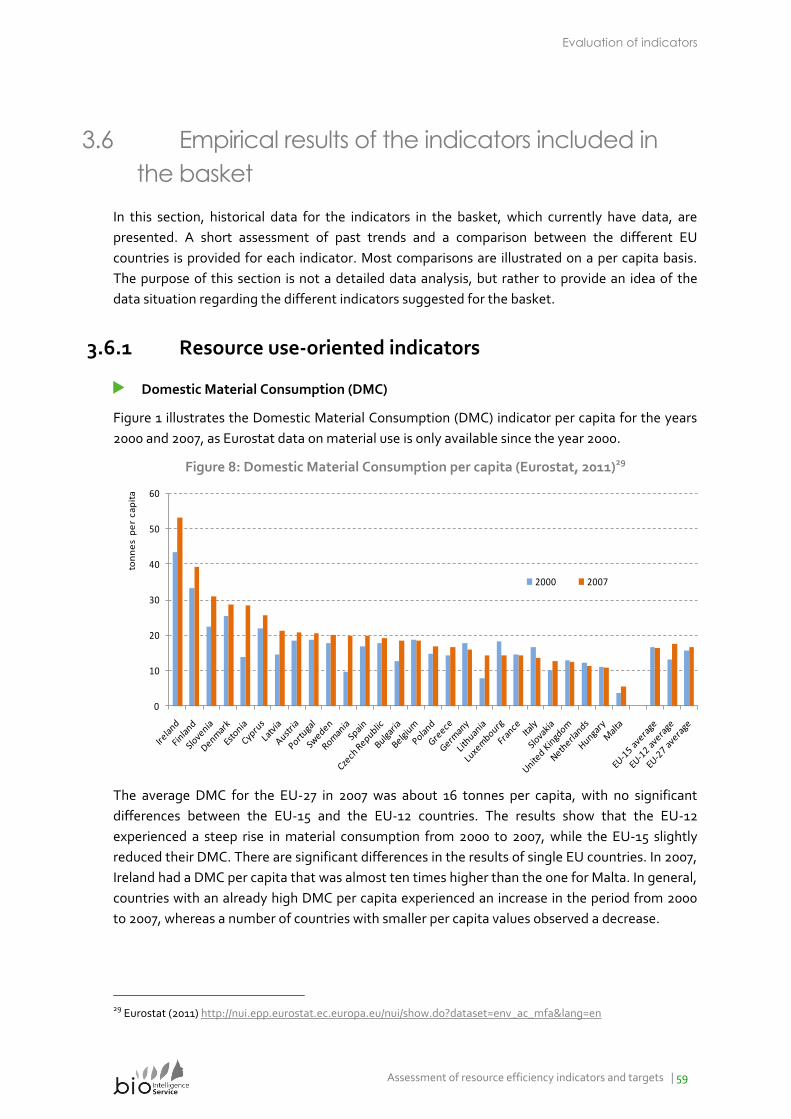
Evaluation of indicators
Assessment of resource efficiency indicators and targets | 59
3.6 Empirical results of the indicators included in
the basket
In this section, historical data for the indicators in the basket, which currently have data, are
presented. A short assessment of past trends and a comparison between the different EU
countries is provided for each indicator. Most comparisons are illustrated on a per capita basis.
The purpose of this section is not a detailed data analysis, but rather to provide an idea of the
data situation regarding the different indicators suggested for the basket.
3.6.1 Resource use-oriented indicators
Domestic Material Consumption (DMC)
Figure 1 illustrates the Domestic Material Consumption (DMC) indicator per capita for the years
2000 and 2007, as Eurostat data on material use is only available since the year 2000.
Figure 8: Domestic Material Consumption per capita (Eurostat, 2011)29
0
10
20
30
40
50
60
ton
ne
s p
er
ca
pit
a
2000 2007
The average DMC for the EU-27 in 2007 was about 16 tonnes per capita, with no significant
differences between the EU-15 and the EU-12 countries. The results show that the EU-12
experienced a steep rise in material consumption from 2000 to 2007, while the EU-15 slightly
reduced their DMC. There are significant differences in the results of single EU countries. In 2007,
Ireland had a DMC per capita that was almost ten times higher than the one for Malta. In general,
countries with an already high DMC per capita experienced an increase in the period from 2000
to 2007, whereas a number of countries with smaller per capita values observed a decrease.
29 Eurostat (2011) http://nui.epp.eurostat.ec.europa.eu/nui/show.do?dataset=env_ac_mfa&lang=en
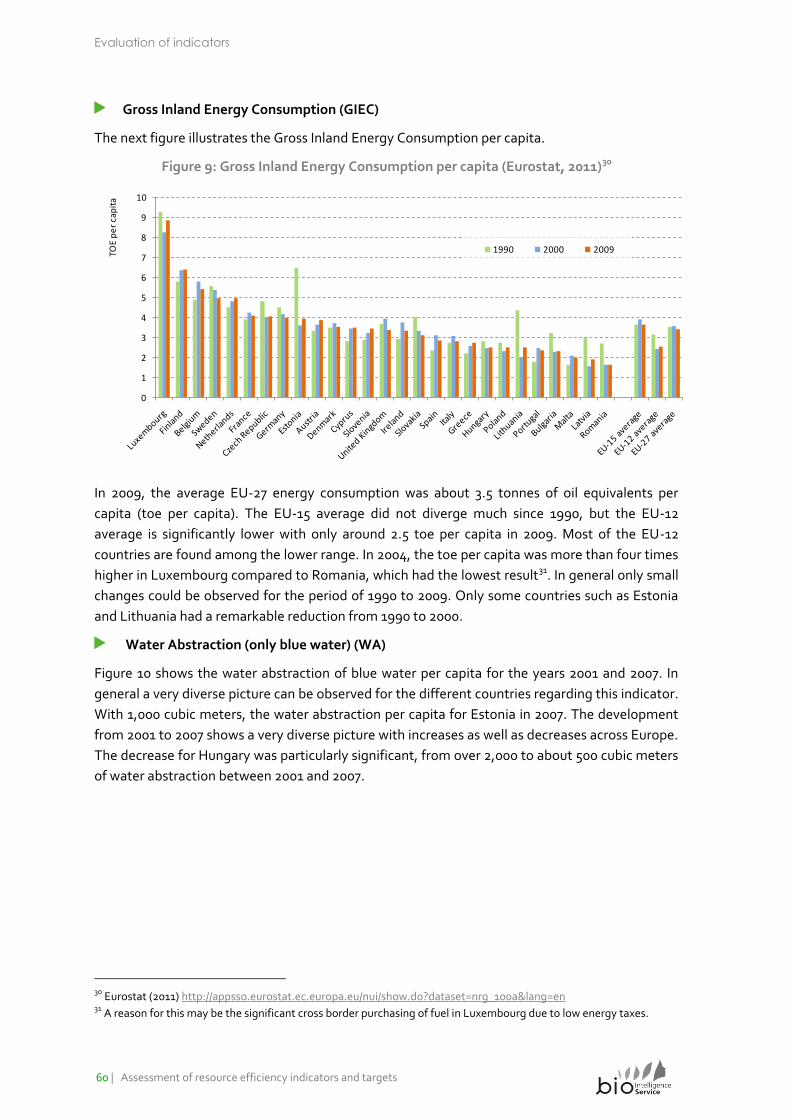
Evaluation of indicators
60 | Assessment of resource efficiency indicators and targets
Gross Inland Energy Consumption (GIEC)
The next figure illustrates the Gross Inland Energy Consumption per capita.
Figure 9: Gross Inland Energy Consumption per capita (Eurostat, 2011)30
0
1
2
3
4
5
6
7
8
9
10
TOE
pe
r ca
pit
a
1990 2000 2009
In 2009, the average EU-27 energy consumption was about 3.5 tonnes of oil equivalents per
capita (toe per capita). The EU-15 average did not diverge much since 1990, but the EU-12
average is significantly lower with only around 2.5 toe per capita in 2009. Most of the EU-12
countries are found among the lower range. In 2004, the toe per capita was more than four times
higher in Luxembourg compared to Romania, which had the lowest result31. In general only small
changes could be observed for the period of 1990 to 2009. Only some countries such as Estonia
and Lithuania had a remarkable reduction from 1990 to 2000.
Water Abstraction (only blue water) (WA)
Figure 10 shows the water abstraction of blue water per capita for the years 2001 and 2007. In
general a very diverse picture can be observed for the different countries regarding this indicator.
With 1,000 cubic meters, the water abstraction per capita for Estonia in 2007. The development
from 2001 to 2007 shows a very diverse picture with increases as well as decreases across Europe.
The decrease for Hungary was particularly significant, from over 2,000 to about 500 cubic meters
of water abstraction between 2001 and 2007.
30 Eurostat (2011) http://appsso.eurostat.ec.europa.eu/nui/show.do?dataset=nrg_100a&lang=en 31 A reason for this may be the significant cross border purchasing of fuel in Luxembourg due to low energy taxes.
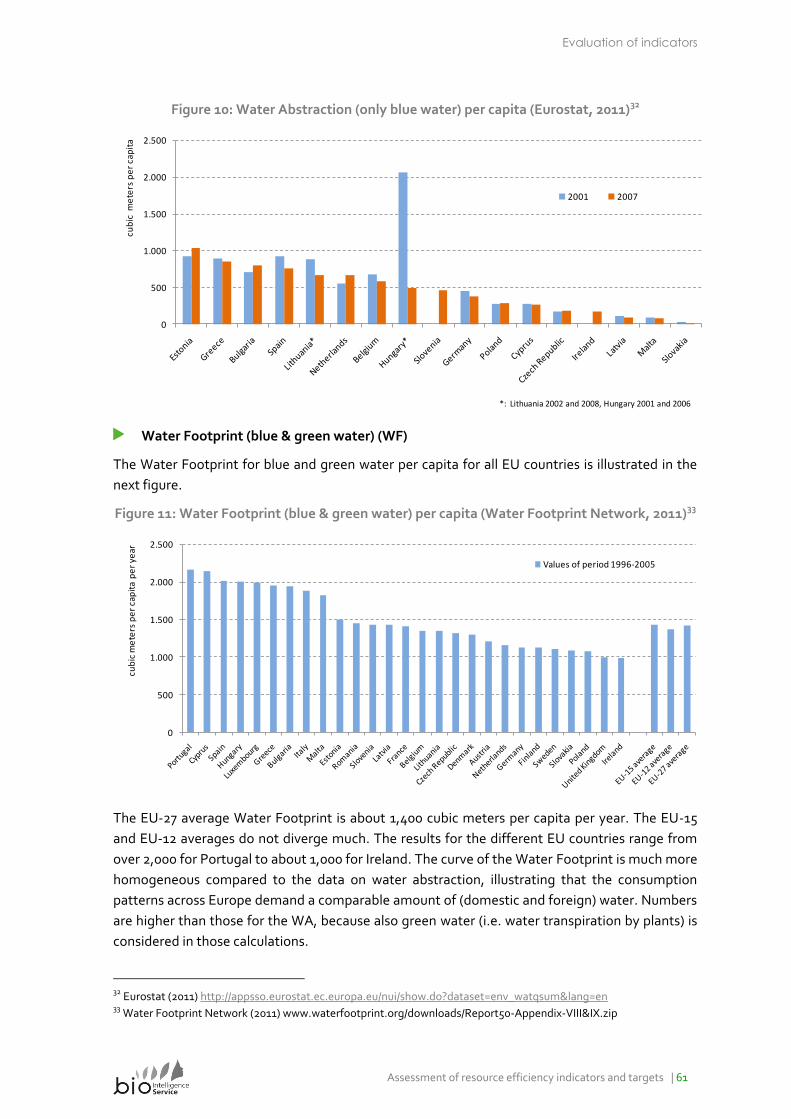
Evaluation of indicators
Assessment of resource efficiency indicators and targets | 61
Figure 10: Water Abstraction (only blue water) per capita (Eurostat, 2011)32
0
500
1.000
1.500
2.000
2.500
cub
ic m
ete
rs p
er
cap
ita
2001 2007
*: Lithuania 2002 and 2008, Hungary 2001 and 2006
Water Footprint (blue & green water) (WF)
The Water Footprint for blue and green water per capita for all EU countries is illustrated in the
next figure.
Figure 11: Water Footprint (blue & green water) per capita (Water Footprint Network, 2011)33
0
500
1.000
1.500
2.000
2.500
cub
ic m
ete
rs p
er
cap
ita
pe
r ye
ar
Values of period 1996-2005
The EU-27 average Water Footprint is about 1,400 cubic meters per capita per year. The EU-15
and EU-12 averages do not diverge much. The results for the different EU countries range from
over 2,000 for Portugal to about 1,000 for Ireland. The curve of the Water Footprint is much more
homogeneous compared to the data on water abstraction, illustrating that the consumption
patterns across Europe demand a comparable amount of (domestic and foreign) water. Numbers
are higher than those for the WA, because also green water (i.e. water transpiration by plants) is
considered in those calculations.
32 Eurostat (2011) http://appsso.eurostat.ec.europa.eu/nui/show.do?dataset=env_watqsum&lang=en 33 Water Footprint Network (2011) www.waterfootprint.org/downloads/Report50-Appendix-VIII&IX.zip
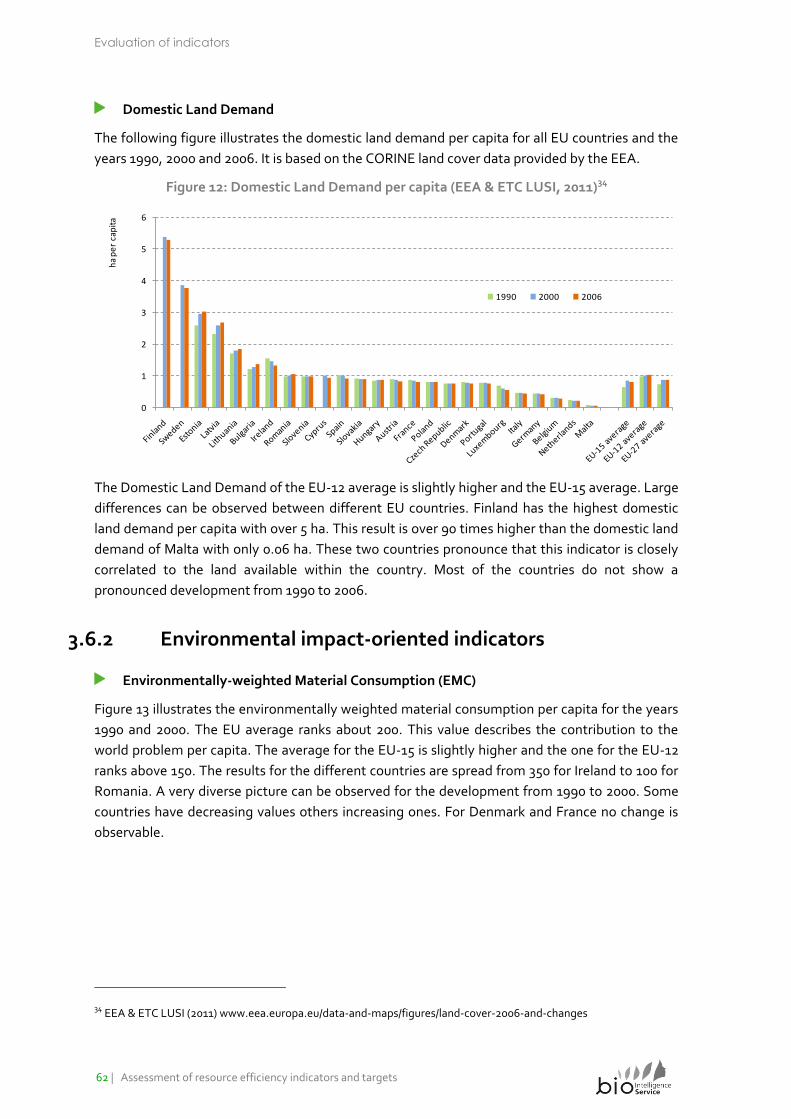
Evaluation of indicators
62 | Assessment of resource efficiency indicators and targets
Domestic Land Demand
The following figure illustrates the domestic land demand per capita for all EU countries and the
years 1990, 2000 and 2006. It is based on the CORINE land cover data provided by the EEA.
Figure 12: Domestic Land Demand per capita (EEA & ETC LUSI, 2011)34
0
1
2
3
4
5
6
ha
pe
r ca
pit
a
1990 2000 2006
The Domestic Land Demand of the EU-12 average is slightly higher and the EU-15 average. Large
differences can be observed between different EU countries. Finland has the highest domestic
land demand per capita with over 5 ha. This result is over 90 times higher than the domestic land
demand of Malta with only 0.06 ha. These two countries pronounce that this indicator is closely
correlated to the land available within the country. Most of the countries do not show a
pronounced development from 1990 to 2006.
3.6.2 Environmental impact-oriented indicators
Environmentally-weighted Material Consumption (EMC)
Figure 13 illustrates the environmentally weighted material consumption per capita for the years
1990 and 2000. The EU average ranks about 200. This value describes the contribution to the
world problem per capita. The average for the EU-15 is slightly higher and the one for the EU-12
ranks above 150. The results for the different countries are spread from 350 for Ireland to 100 for
Romania. A very diverse picture can be observed for the development from 1990 to 2000. Some
countries have decreasing values others increasing ones. For Denmark and France no change is
observable.
34 EEA & ETC LUSI (2011) www.eea.europa.eu/data-and-maps/figures/land-cover-2006-and-changes
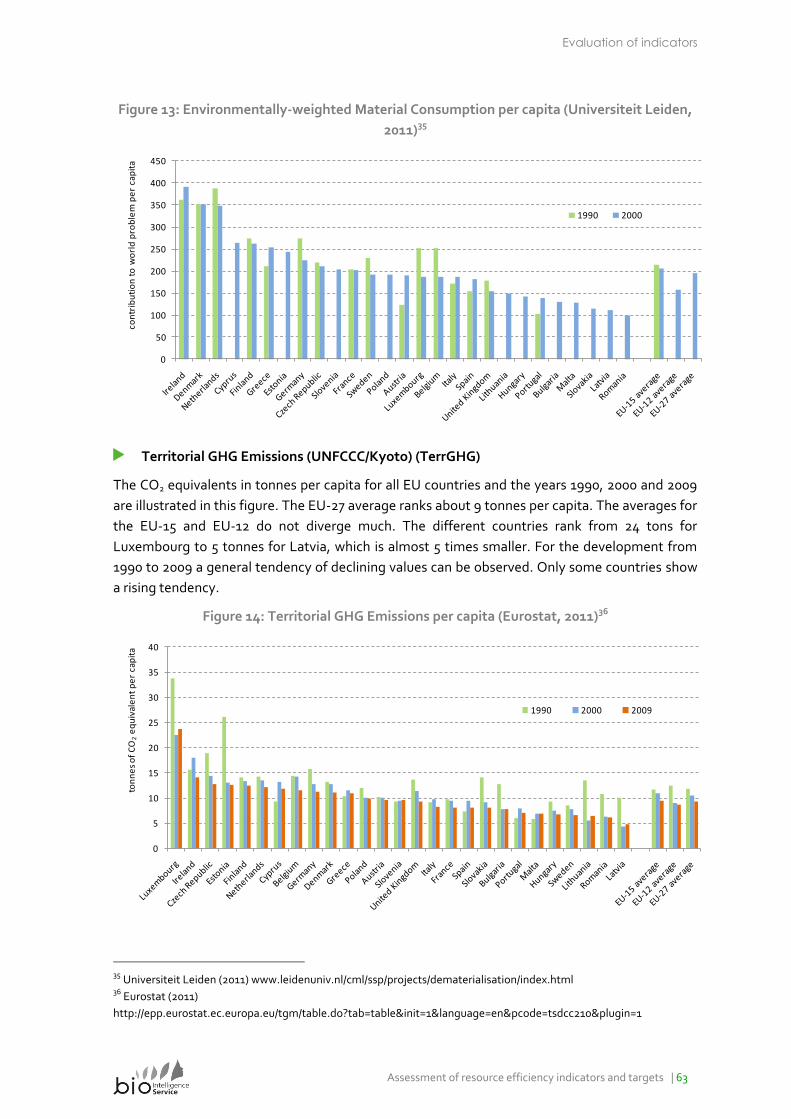
Evaluation of indicators
Assessment of resource efficiency indicators and targets | 63
Figure 13: Environmentally-weighted Material Consumption per capita (Universiteit Leiden,
2011)35
0
50
100
150
200
250
300
350
400
450
con
trib
uti
on
to
wo
rld
pro
ble
m p
er
cap
ita
1990 2000
Territorial GHG Emissions (UNFCCC/Kyoto) (TerrGHG)
The CO2 equivalents in tonnes per capita for all EU countries and the years 1990, 2000 and 2009
are illustrated in this figure. The EU-27 average ranks about 9 tonnes per capita. The averages for
the EU-15 and EU-12 do not diverge much. The different countries rank from 24 tons for
Luxembourg to 5 tonnes for Latvia, which is almost 5 times smaller. For the development from
1990 to 2009 a general tendency of declining values can be observed. Only some countries show
a rising tendency.
Figure 14: Territorial GHG Emissions per capita (Eurostat, 2011)36
0
5
10
15
20
25
30
35
40
ton
ne
s o
f C
O2
eq
uiv
ale
nt
pe
r ca
pit
a
1990 2000 2009
35 Universiteit Leiden (2011) www.leidenuniv.nl/cml/ssp/projects/dematerialisation/index.html 36 Eurostat (2011)
http://epp.eurostat.ec.europa.eu/tgm/table.do?tab=table&init=1&language=en&pcode=tsdcc210&plugin=1
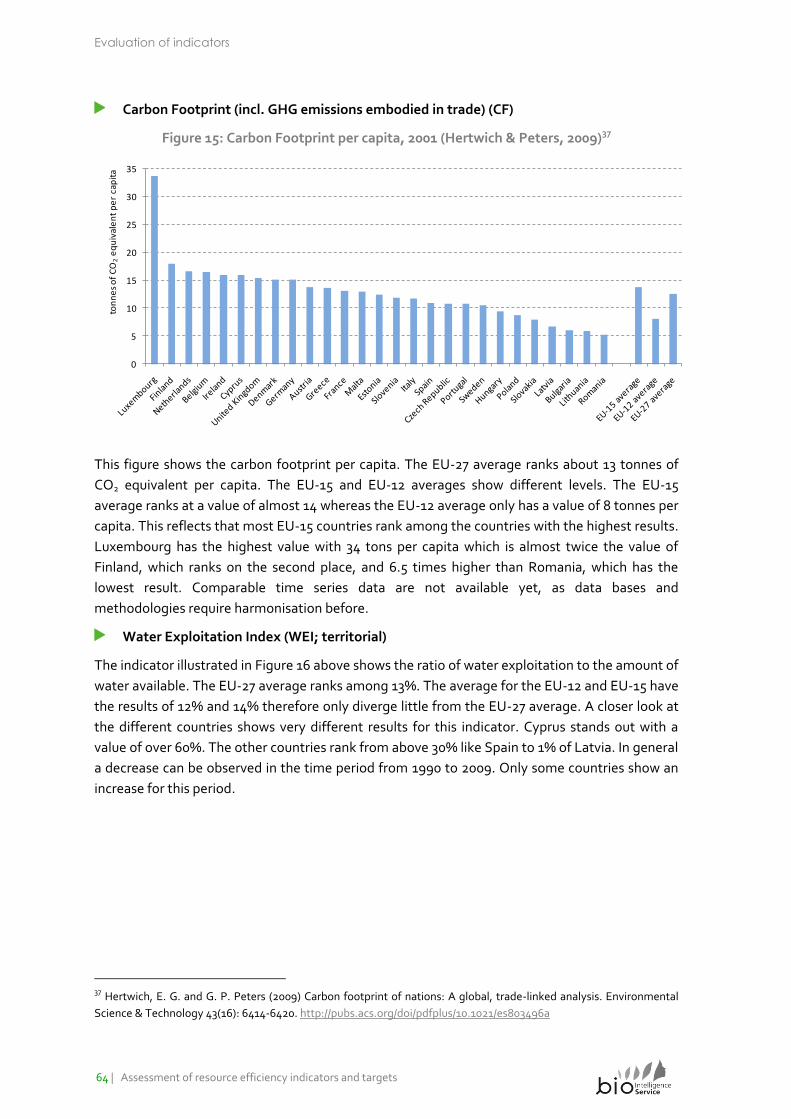
Evaluation of indicators
64 | Assessment of resource efficiency indicators and targets
Carbon Footprint (incl. GHG emissions embodied in trade) (CF)
Figure 15: Carbon Footprint per capita, 2001 (Hertwich & Peters, 2009)37
0
5
10
15
20
25
30
35
ton
ne
s o
f C
O2
eq
uiv
ale
nt
pe
r ca
pit
a
This figure shows the carbon footprint per capita. The EU-27 average ranks about 13 tonnes of
CO2 equivalent per capita. The EU-15 and EU-12 averages show different levels. The EU-15
average ranks at a value of almost 14 whereas the EU-12 average only has a value of 8 tonnes per
capita. This reflects that most EU-15 countries rank among the countries with the highest results.
Luxembourg has the highest value with 34 tons per capita which is almost twice the value of
Finland, which ranks on the second place, and 6.5 times higher than Romania, which has the
lowest result. Comparable time series data are not available yet, as data bases and
methodologies require harmonisation before.
Water Exploitation Index (WEI; territorial)
The indicator illustrated in Figure 16 above shows the ratio of water exploitation to the amount of
water available. The EU-27 average ranks among 13%. The average for the EU-12 and EU-15 have
the results of 12% and 14% therefore only diverge little from the EU-27 average. A closer look at
the different countries shows very different results for this indicator. Cyprus stands out with a
value of over 60%. The other countries rank from above 30% like Spain to 1% of Latvia. In general
a decrease can be observed in the time period from 1990 to 2009. Only some countries show an
increase for this period.
37 Hertwich, E. G. and G. P. Peters (2009) Carbon footprint of nations: A global, trade-linked analysis. Environmental
Science & Technology 43(16): 6414-6420. http://pubs.acs.org/doi/pdfplus/10.1021/es803496a
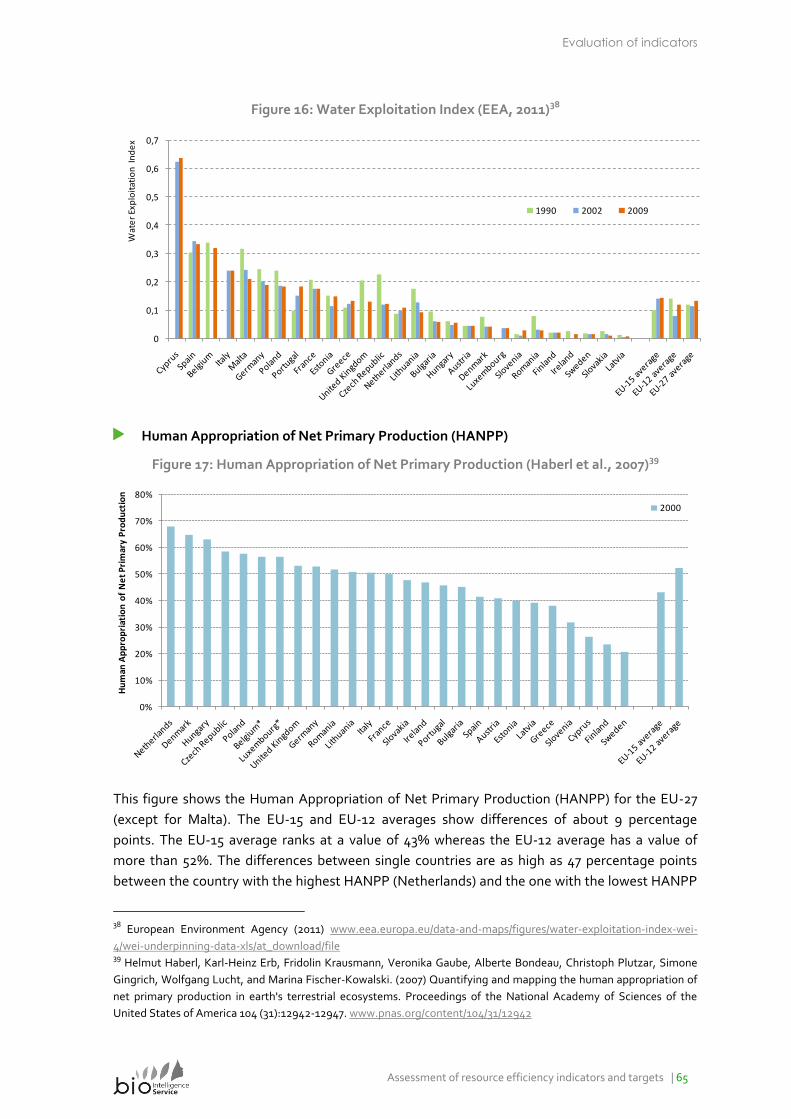
Evaluation of indicators
Assessment of resource efficiency indicators and targets | 65
Figure 16: Water Exploitation Index (EEA, 2011)38
0
0,1
0,2
0,3
0,4
0,5
0,6
0,7W
ate
r Ex
plo
itat
ion
In
de
x
1990 2002 2009
Human Appropriation of Net Primary Production (HANPP)
Figure 17: Human Appropriation of Net Primary Production (Haberl et al., 2007)39
0%
10%
20%
30%
40%
50%
60%
70%
80%
Hu
man
Ap
pro
pri
atio
n o
f N
et
Pri
mar
y P
rod
uct
ion
2000
This figure shows the Human Appropriation of Net Primary Production (HANPP) for the EU-27
(except for Malta). The EU-15 and EU-12 averages show differences of about 9 percentage
points. The EU-15 average ranks at a value of 43% whereas the EU-12 average has a value of
more than 52%. The differences between single countries are as high as 47 percentage points
between the country with the highest HANPP (Netherlands) and the one with the lowest HANPP
38
European Environment Agency (2011) www.eea.europa.eu/data-and-maps/figures/water-exploitation-index-wei-
4/wei-underpinning-data-xls/at_download/file 39 Helmut Haberl, Karl-Heinz Erb, Fridolin Krausmann, Veronika Gaube, Alberte Bondeau, Christoph Plutzar, Simone
Gingrich, Wolfgang Lucht, and Marina Fischer-Kowalski. (2007) Quantifying and mapping the human appropriation of
net primary production in earth's terrestrial ecosystems. Proceedings of the National Academy of Sciences of the
United States of America 104 (31):12942-12947. www.pnas.org/content/104/31/12942
Evaluation of indicators
66 | Assessment of resource efficiency indicators and targets
(Sweden). This reflects the differences in the agricultural systems of the European countries
which in turn seems to be highly dependent on natural conditions (climate, soils, water
availability) and population density.
3.7 Key findings from the evaluation of the
proposed basket of indicators
The suggested basket of indicators provides comprehensive information on Europe’s use of
natural resource and its various environmental impacts. The basket of indicators developed in
Task 3 allows monitoring the absolute amounts of resource use in different categories (materials,
energy/climate, water and land) as well as the various environmental impacts related to EU’s
resource use, including impacts on climate, ecosystems and human health. It thus provides a
framework for assessing environmental pressures and impacts in a consistent manner.
For all resource use categories, indicators are available already in the short term. Although
the availability of data varies across the resource use categories, at least pilot data sets are
currently available for all resource use-oriented and environmental impact-oriented indicators
suggested for the basket. The European Commission could and should therefore start setting up
a comprehensive monitoring system of EU’s resource use in the context of the Flagship Initiative
on “Resource Efficient Europe”.
Resources are needed to further harmonise methodologies and improve the data situation.
There is a clear lack of methodological harmonisation regarding many of the indicators with a
global perspective, in particular related to the consideration of resources embodied in
internationally-traded products. Furthermore, efforts are required to improve the data situation.
At the current stage, for many of desired future indicators, only pilot studies with data for
selected years are available. Those data sets are not robust enough to allow a proper monitoring
of the domestic and global environmental effects related to EU’s resource use.
In addition to the headline indicators suggested for the basket, the EU should implement a
Level 2 of indicators, which are more closely linked to specific resources or economic sectors.
The project team developed a 2-level structure for the basket: Level 1 comprising comprehensive
headline indicators and Level 2 with more specific indicators. While the headline indicators
provide an easy to communicate message about the overall direction of resource use in the EU,
the Level 2 indicators are needed to monitor focused strategies to reduce EU’s resource use and
its negative environmental impacts. Examples for those specific policy areas include waste
management, recycling, renewable energies, water management in agriculture, industry and
households and spatial and urban planning.
Evaluation of target setting
Assessment of resource efficiency indicators and targets | 67
Chapter 4: Evaluation of target setting
This chapter proposes a set of resource efficiency targets for the headline indicators included in
the basket of indicators (see Chapter 3: Evaluation of indicators). It begins with a discussion of
approaches to setting resource related targets. Targets that have already been proposed by the
European Commission or Member States are considered as a starting point to establishing links
between the different types of resources and indicators. The results of an initial analysis of
plausibility of the proposed targets is presented together with a discussion on what is the most
appropriate level to set the target (e.g. EU, Member State, sector, region, etc.). Finally the
chapter introduces a new approach to target setting.
4.1 The approach to target setting
The issue of setting targets on resource use is a very sensitive one. In order to provide a
comprehensive and viable set of targets, a proposal for targets should build on existing targets
and should use leading Member States as best practice examples40. For some indicators EU
Member States (MS) or other countries have already implemented targets. A proposal from the
European Commission (EC) can build on these in the sense of using them as best practice
examples. On the other hand, any target proposed from the EC should relate to the targets on
the MS level and should not counteract them. This task therefore builds on the review of existing
targets compiled in Task 2.
The actual process of setting targets can be considered as a process of balancing different
interests and perspectives. It is not a straightforward scientific procedure, but rather a normative
and political one. However, science can provide background information and causal links which is
a necessary basis for an informed political discussion. The proposed targets in this study are
meant as indicative and directional targets in order to start the discussion of setting targets,
rather than definite end results.
In order to address the different perspectives on target setting the project team developed an
evaluation scheme (see Annex C in the Annex Report) to describe and discuss all aspects related
to the specific target. The evaluation includes the following aspects:
Threats if no target was set, differentiated along environmental, economic and
social effects. The threats are classified as either trespassing a strong threshold
and staying below the target is needed to avoid irreversible change. Or the
threat symbolizes a minor danger where staying below the target ensures
preserving a desired quality.
Description of possible effects resulting from respecting the target, including a
rough approximation of the expected resource use in 2020 (or 2050) as well as
pros and cons of this particular target (e.g. effects on subcategories, sectors,
40 For a list of existing targets see Annex B of the Annex Report
Evaluation of target setting
68 | Assessment of resource efficiency indicators and targets
cross linkages between subcategories, conflicts resulting from competing uses,
chances arising)
Discussion of each specific target with regard to the four perspectives on
sustainable use of resources:
the perspective of limitations to the resource base,
the perspective of limitations to absorption capacities
of the earth’s ecosystems,
the perspective of efficient and equitable resource
supply for people (quality of life, well-being),
the perspective of efficient and equitable resource
supply for economies (efficiency).
Application of the target to the EU and MS level which discusses at what level
the target should be set and how a disaggregation or aggregation to other levels
can be done.
Possible variations of the target, e.g. targets on absolute quantities, targets on
preferable per capita values, targets on productivities or other intensive
measures etc.
Links to other indicators/targets
Related Level 2 indicators or by which measures can the implementation of the
headline indicator be put forward.
Existing targets in the EU, the EU Member States or other countries.
Finally, targets can range from highly general, overall objectives down to a specific measure that
directly guides the practical implementation. It is important to start with general objectives,
which provide the framework for later measurements and which guarantee the full coverage of
all resources. However, in the discussion of targets the project team had to address several
measures that link to the overall target and that provide examples of possible measures to be
taken.
4.2 Overview of existing targets in the EU and EU
Member States
Table 11 shows a summary of existing targets and targets for related fields that are already
implemented in the EU, EU Member States or other countries. (See Annex C in the Annex Report
for a detailed table). The table shows that well formulated targets exist for GHG emissions and
for energy efficiency. For other indicators, resource use is not yet targeted or only done so in
individual countries.
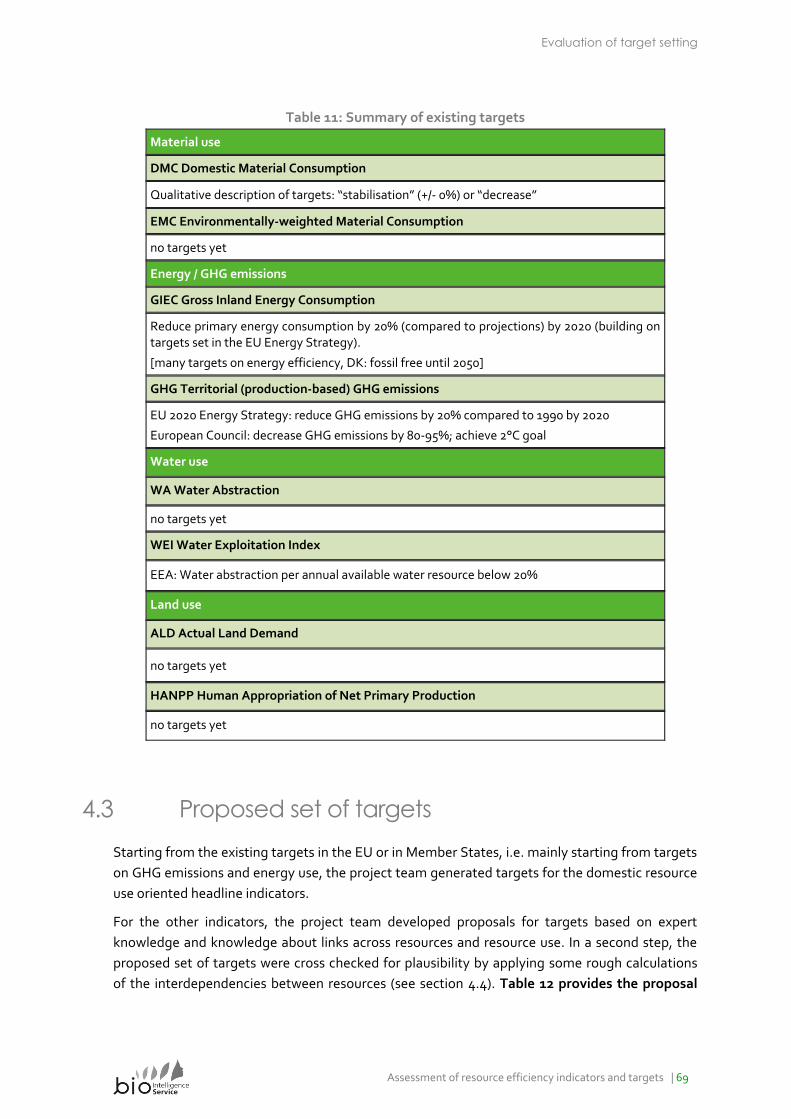
Evaluation of target setting
Assessment of resource efficiency indicators and targets | 69
Table 11: Summary of existing targets
Material use
DMC Domestic Material Consumption
Qualitative description of targets: “stabilisation” (+/- 0%) or “decrease”
EMC Environmentally-weighted Material Consumption
no targets yet
Energy / GHG emissions
GIEC Gross Inland Energy Consumption
Reduce primary energy consumption by 20% (compared to projections) by 2020 (building on targets set in the EU Energy Strategy).
[many targets on energy efficiency, DK: fossil free until 2050]
GHG Territorial (production-based) GHG emissions
EU 2020 Energy Strategy: reduce GHG emissions by 20% compared to 1990 by 2020
European Council: decrease GHG emissions by 80-95%; achieve 2°C goal
Water use
WA Water Abstraction
no targets yet
WEI Water Exploitation Index
EEA: Water abstraction per annual available water resource below 20%
Land use
ALD Actual Land Demand
no targets yet
HANPP Human Appropriation of Net Primary Production
no targets yet
4.3 Proposed set of targets
Starting from the existing targets in the EU or in Member States, i.e. mainly starting from targets
on GHG emissions and energy use, the project team generated targets for the domestic resource
use oriented headline indicators.
For the other indicators, the project team developed proposals for targets based on expert
knowledge and knowledge about links across resources and resource use. In a second step, the
proposed set of targets were cross checked for plausibility by applying some rough calculations
of the interdependencies between resources (see section 4.4). Table 12 provides the proposal
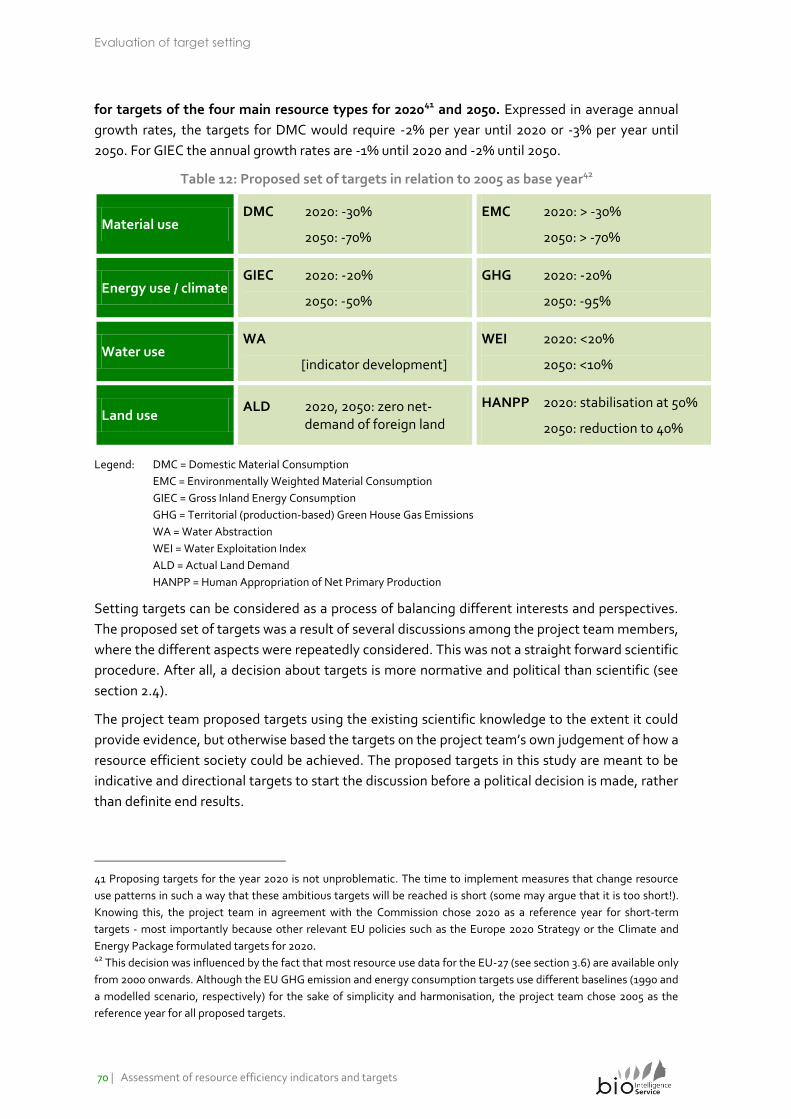
Evaluation of target setting
70 | Assessment of resource efficiency indicators and targets
for targets of the four main resource types for 202041 and 2050. Expressed in average annual
growth rates, the targets for DMC would require -2% per year until 2020 or -3% per year until
2050. For GIEC the annual growth rates are -1% until 2020 and -2% until 2050.
Table 12: Proposed set of targets in relation to 2005 as base year42
Material use DMC 2020: -30%
2050: -70%
EMC 2020: > -30%
2050: > -70%
Energy use / climate GIEC 2020: -20%
2050: -50%
GHG 2020: -20%
2050: -95%
Water use WA
[indicator development]
WEI 2020: <20%
2050: <10%
Land use ALD 2020, 2050: zero net- demand of foreign land
HANPP 2020: stabilisation at 50%
2050: reduction to 40%
Legend: DMC = Domestic Material Consumption
EMC = Environmentally Weighted Material Consumption
GIEC = Gross Inland Energy Consumption
GHG = Territorial (production-based) Green House Gas Emissions
WA = Water Abstraction
WEI = Water Exploitation Index ALD = Actual Land Demand
HANPP = Human Appropriation of Net Primary Production
Setting targets can be considered as a process of balancing different interests and perspectives.
The proposed set of targets was a result of several discussions among the project team members,
where the different aspects were repeatedly considered. This was not a straight forward scientific
procedure. After all, a decision about targets is more normative and political than scientific (see
section 2.4).
The project team proposed targets using the existing scientific knowledge to the extent it could
provide evidence, but otherwise based the targets on the project team’s own judgement of how a
resource efficient society could be achieved. The proposed targets in this study are meant to be
indicative and directional targets to start the discussion before a political decision is made, rather
than definite end results.
41 Proposing targets for the year 2020 is not unproblematic. The time to implement measures that change resource
use patterns in such a way that these ambitious targets will be reached is short (some may argue that it is too short!).
Knowing this, the project team in agreement with the Commission chose 2020 as a reference year for short-term
targets - most importantly because other relevant EU policies such as the Europe 2020 Strategy or the Climate and
Energy Package formulated targets for 2020. 42 This decision was influenced by the fact that most resource use data for the EU-27 (see section 3.6) are available only
from 2000 onwards. Although the EU GHG emission and energy consumption targets use different baselines (1990 and
a modelled scenario, respectively) for the sake of simplicity and harmonisation, the project team chose 2005 as the
reference year for all proposed targets.
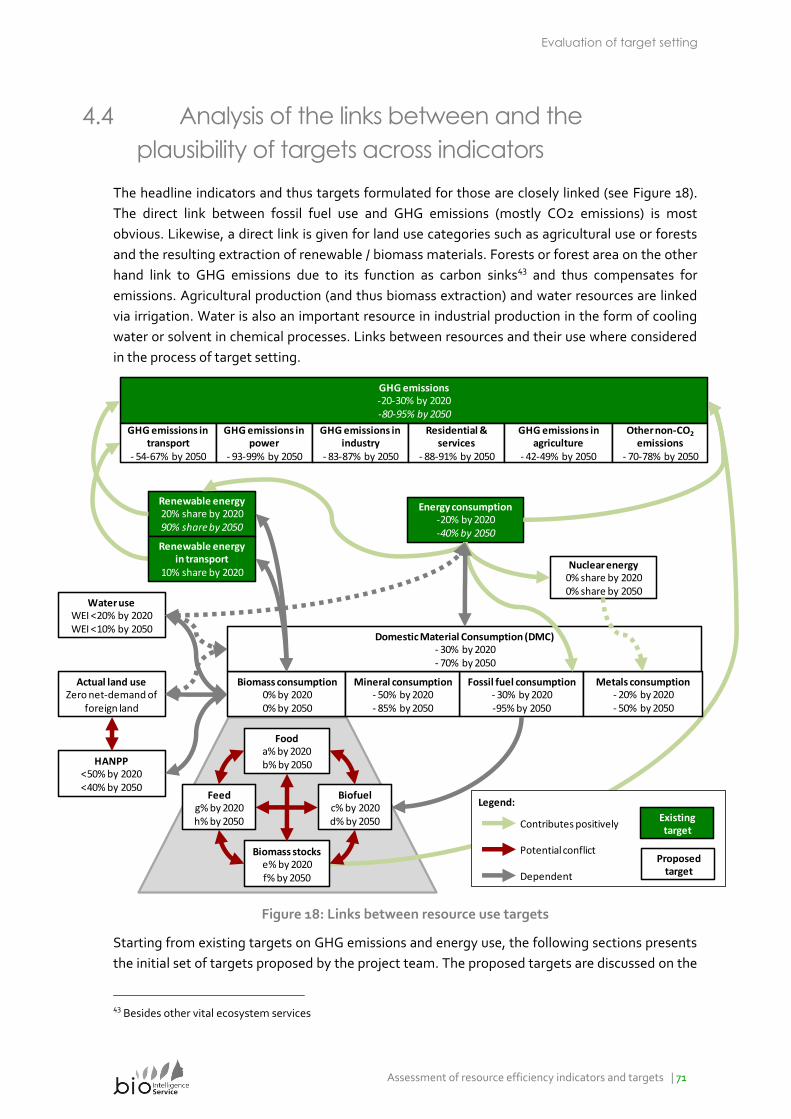
Evaluation of target setting
Assessment of resource efficiency indicators and targets | 71
4.4 Analysis of the links between and the
plausibility of targets across indicators
The headline indicators and thus targets formulated for those are closely linked (see Figure 18).
The direct link between fossil fuel use and GHG emissions (mostly CO2 emissions) is most
obvious. Likewise, a direct link is given for land use categories such as agricultural use or forests
and the resulting extraction of renewable / biomass materials. Forests or forest area on the other
hand link to GHG emissions due to its function as carbon sinks43 and thus compensates for
emissions. Agricultural production (and thus biomass extraction) and water resources are linked
via irrigation. Water is also an important resource in industrial production in the form of cooling
water or solvent in chemical processes. Links between resources and their use where considered
in the process of target setting.
Legend:
Contributes positively
Potential conflict
Dependent
Energy consumption-20% by 2020-40% by 2050
Renewable energy20% share by 202090% share by 2050
GHG emissions-20-30% by 2020-80-95% by 2050
Renewable energy in transport
10% share by 2020
GHG emissions in transport
- 54-67% by 2050
Fossil fuel consumption- 30% by 2020-95% by 2050
Fooda% by 2020b% by 2050
Biomass consumption0% by 20200% by 2050
Metals consumption- 20% by 2020- 50% by 2050
Mineral consumption- 50% by 2020- 85% by 2050
Domestic Material Consumption (DMC)- 30% by 2020- 70% by 2050
GHG emissions in power
- 93-99% by 2050
GHG emissions in industry
- 83-87% by 2050
Residential & services
- 88-91% by 2050
GHG emissions in agriculture
- 42-49% by 2050
Other non-CO2
emissions- 70-78% by 2050
Water useWEI <20% by 2020WEI <10% by 2050
Actual land useZero net-demand of
foreign land
HANPP<50% by 2020<40% by 2050
Nuclear energy0% share by 20200% share by 2050
Existing target
Feedg% by 2020h% by 2050
Biofuelc% by 2020d% by 2050
Biomass stockse% by 2020f% by 2050
Proposed target
Figure 18: Links between resource use targets
Starting from existing targets on GHG emissions and energy use, the following sections presents
the initial set of targets proposed by the project team. The proposed targets are discussed on the
43 Besides other vital ecosystem services
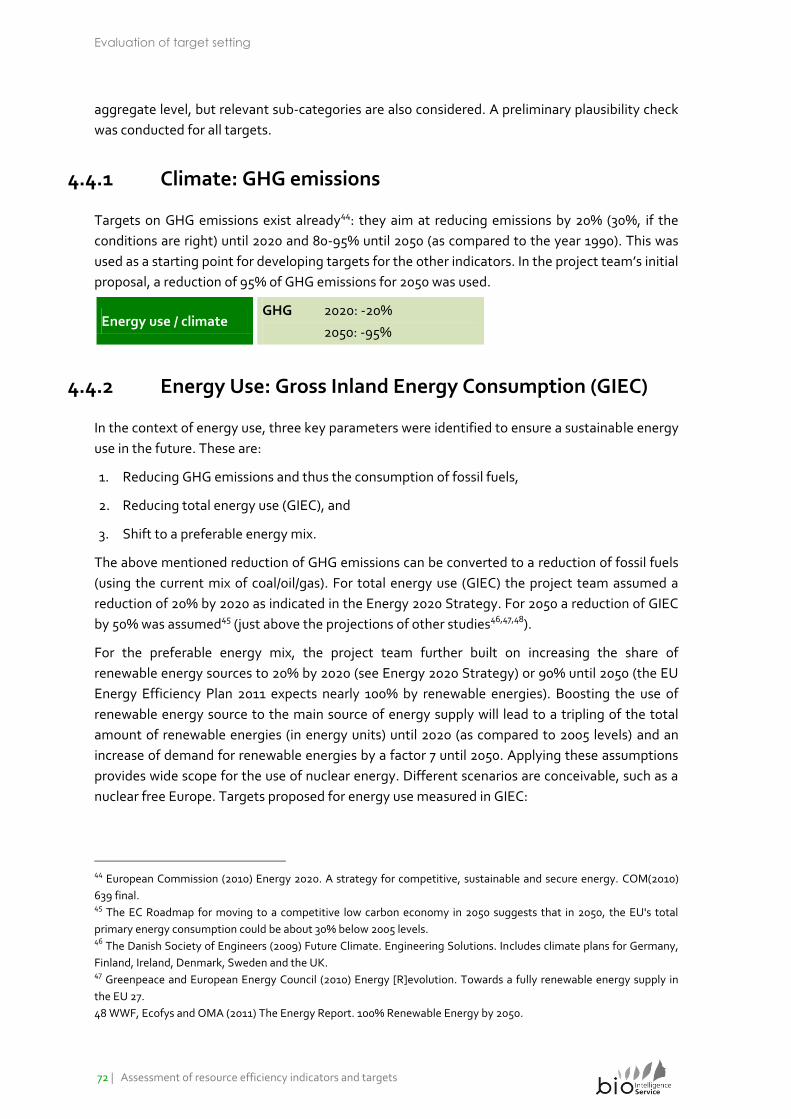
Evaluation of target setting
72 | Assessment of resource efficiency indicators and targets
aggregate level, but relevant sub-categories are also considered. A preliminary plausibility check
was conducted for all targets.
4.4.1 Climate: GHG emissions
Targets on GHG emissions exist already44: they aim at reducing emissions by 20% (30%, if the
conditions are right) until 2020 and 80-95% until 2050 (as compared to the year 1990). This was
used as a starting point for developing targets for the other indicators. In the project team’s initial
proposal, a reduction of 95% of GHG emissions for 2050 was used.
Energy use / climate GHG 2020: -20%
2050: -95%
4.4.2 Energy Use: Gross Inland Energy Consumption (GIEC)
In the context of energy use, three key parameters were identified to ensure a sustainable energy
use in the future. These are:
1. Reducing GHG emissions and thus the consumption of fossil fuels,
2. Reducing total energy use (GIEC), and
3. Shift to a preferable energy mix.
The above mentioned reduction of GHG emissions can be converted to a reduction of fossil fuels
(using the current mix of coal/oil/gas). For total energy use (GIEC) the project team assumed a
reduction of 20% by 2020 as indicated in the Energy 2020 Strategy. For 2050 a reduction of GIEC
by 50% was assumed45 (just above the projections of other studies46,47,48).
For the preferable energy mix, the project team further built on increasing the share of
renewable energy sources to 20% by 2020 (see Energy 2020 Strategy) or 90% until 2050 (the EU
Energy Efficiency Plan 2011 expects nearly 100% by renewable energies). Boosting the use of
renewable energy source to the main source of energy supply will lead to a tripling of the total
amount of renewable energies (in energy units) until 2020 (as compared to 2005 levels) and an
increase of demand for renewable energies by a factor 7 until 2050. Applying these assumptions
provides wide scope for the use of nuclear energy. Different scenarios are conceivable, such as a
nuclear free Europe. Targets proposed for energy use measured in GIEC:
44 European Commission (2010) Energy 2020. A strategy for competitive, sustainable and secure energy. COM(2010)
639 final. 45 The EC Roadmap for moving to a competitive low carbon economy in 2050 suggests that in 2050, the EU's total
primary energy consumption could be about 30% below 2005 levels. 46 The Danish Society of Engineers (2009) Future Climate. Engineering Solutions. Includes climate plans for Germany,
Finland, Ireland, Denmark, Sweden and the UK. 47 Greenpeace and European Energy Council (2010) Energy [R]evolution. Towards a fully renewable energy supply in
the EU 27.
48 WWF, Ecofys and OMA (2011) The Energy Report. 100% Renewable Energy by 2050.
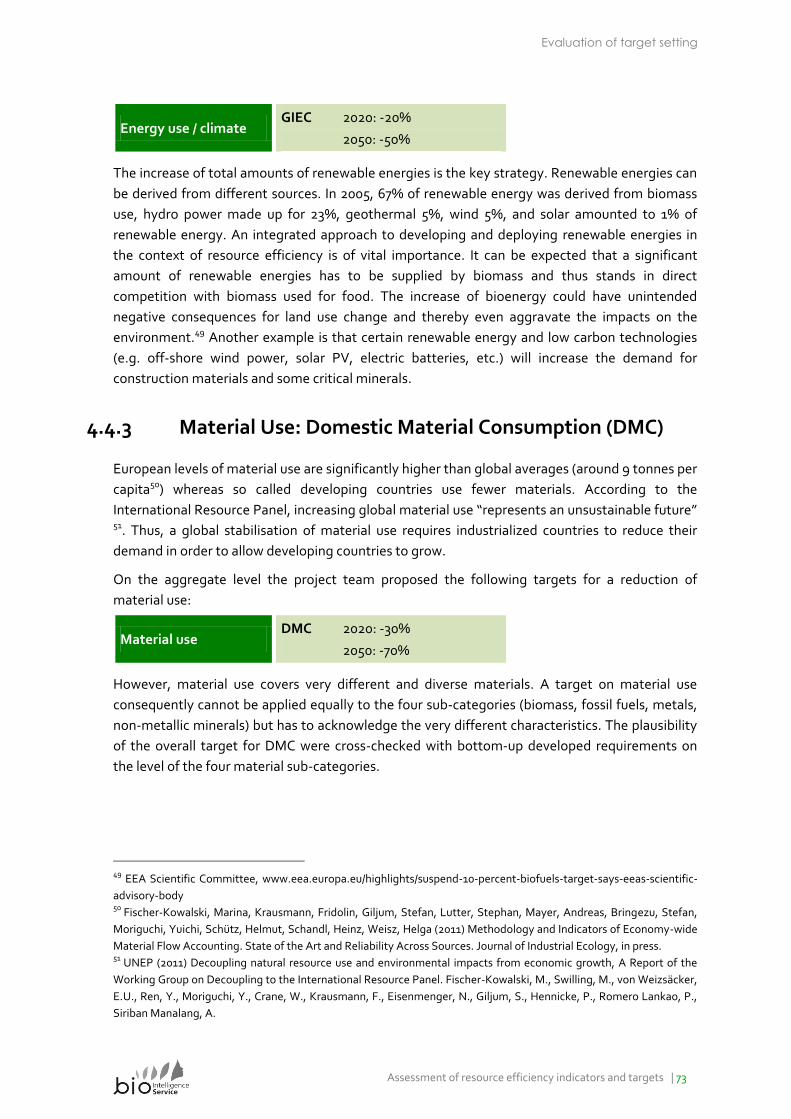
Evaluation of target setting
Assessment of resource efficiency indicators and targets | 73
Energy use / climate GIEC 2020: -20%
2050: -50%
The increase of total amounts of renewable energies is the key strategy. Renewable energies can
be derived from different sources. In 2005, 67% of renewable energy was derived from biomass
use, hydro power made up for 23%, geothermal 5%, wind 5%, and solar amounted to 1% of
renewable energy. An integrated approach to developing and deploying renewable energies in
the context of resource efficiency is of vital importance. It can be expected that a significant
amount of renewable energies has to be supplied by biomass and thus stands in direct
competition with biomass used for food. The increase of bioenergy could have unintended
negative consequences for land use change and thereby even aggravate the impacts on the
environment.49 Another example is that certain renewable energy and low carbon technologies
(e.g. off-shore wind power, solar PV, electric batteries, etc.) will increase the demand for
construction materials and some critical minerals.
4.4.3 Material Use: Domestic Material Consumption (DMC)
European levels of material use are significantly higher than global averages (around 9 tonnes per
capita50) whereas so called developing countries use fewer materials. According to the
International Resource Panel, increasing global material use “represents an unsustainable future”
51. Thus, a global stabilisation of material use requires industrialized countries to reduce their
demand in order to allow developing countries to grow.
On the aggregate level the project team proposed the following targets for a reduction of
material use:
Material use DMC 2020: -30%
2050: -70%
However, material use covers very different and diverse materials. A target on material use
consequently cannot be applied equally to the four sub-categories (biomass, fossil fuels, metals,
non-metallic minerals) but has to acknowledge the very different characteristics. The plausibility
of the overall target for DMC were cross-checked with bottom-up developed requirements on
the level of the four material sub-categories.
49 EEA Scientific Committee, www.eea.europa.eu/highlights/suspend-10-percent-biofuels-target-says-eeas-scientific-
advisory-body 50 Fischer-Kowalski, Marina, Krausmann, Fridolin, Giljum, Stefan, Lutter, Stephan, Mayer, Andreas, Bringezu, Stefan,
Moriguchi, Yuichi, Schütz, Helmut, Schandl, Heinz, Weisz, Helga (2011) Methodology and Indicators of Economy-wide
Material Flow Accounting. State of the Art and Reliability Across Sources. Journal of Industrial Ecology, in press. 51 UNEP (2011) Decoupling natural resource use and environmental impacts from economic growth, A Report of the
Working Group on Decoupling to the International Resource Panel. Fischer-Kowalski, M., Swilling, M., von Weizsäcker,
E.U., Ren, Y., Moriguchi, Y., Crane, W., Krausmann, F., Eisenmenger, N., Giljum, S., Hennicke, P., Romero Lankao, P.,
Siriban Manalang, A.
Evaluation of target setting
74 | Assessment of resource efficiency indicators and targets
Fossil fuels
Fossil fuels are non-renewable materials that are used as energy carriers. Fossil fuels are directly
and most significantly related to CO2 emissions that are emitted when burning coal, oil, gas, etc.
Building on the target on GHG emissions and energy use as described above , the required
reduction of DMC fossil fuels52 can be calculated as -30% until 2020, and -95% until 2050.
Europe in 2050 would appear as mostly fossil fuel free and thus potentially independent of
foreign supply of energy sources.
Biomass
Biomass comprises of materials derived from living or recently living organisms (e.g. crops and
crop residues, grazed biomass, wood). Biomass materials can be considered renewable materials
as long as the extraction does not exceed regeneration in a given year and productive soils are
not degraded.
Due to favourable biogeographic conditions (climate, soils) and a high availability of productive
land per capita, the EU has the potential of being self-sustaining with regard to food and other
uses of biomass. Looking at biomass trade, the EU appears as mostly self-sufficient already. Net-
imports of biomass amount to only 3% of total biomass use (although both imports and exports
of biomass are considerable). Hence, a stabilisation of DMC biomass at current levels, i.e.
stabilisation of biomass consumption (in terms of DMC) until 2020 and 2050, seem feasible.
Biomass serves five main purposes for societies:
Feeding humans
Feeding livestock
Providing energy (e.g. biofuels, wood fuel)
Use for construction purposes
Building biomass stocks (in vegetation and soils), which are important carbon
sinks (besides providing other vital ecosystem services)
Assuming a constant biomass extraction, these five use categories compete with each other.
From the previous section, it was clear that the demand for renewable energy will increase in the
future. Assuming that part of the increasing demand has to be satisfied by biomass resources,
this means that (some of) the other categories have to decrease. Biomass stocks in forests serve
as major carbon sinks and therefore forest area53 should not decline, but rather increase. Biomass
used for construction purposes is not expected to decrease but likely to increase. Given a (slowly)
growing population, the overall supply of nutritional biomass cannot decrease, but changes in
composition are possible. The production of animal products for human nutrition requires a high
input of biomass from cropland and grassland. A shift from animal based food towards a higher
52 The underlying calculation is based on the current energy mix (coal/oil/gas) which is questionable for the future but
valid for a first estimation. 53 Forests also provide a variety of other vital ecosystem services
Evaluation of target setting
Assessment of resource efficiency indicators and targets | 75
share of plant based food in European diets has the potential to considerably reduce the biomass
demand for human nutrition and free biomass resources for energy use.54
Metals
Metals are non-renewable resources, concentrated in deposits, and comprise a great number of
very different metals and ores some of which have toxic properties in small amounts. Some
metals are abundantly available in the earth crust; others are considered scarce; some are used in
societal products in large amounts (e.g. iron ore) others only in tiny fractions (“spice metals”).
Metals are mostly accumulated in stocks and thus have the potential of being recycled and
reused.55
The two main thresholds in relation to metals arise from the limited natural stocks and the EU’s
dependence on foreign supply. The overall development should therefore seek for independence
of foreign supply and the reduction of depletion of natural stocks in general (domestically and
globally) in order to avoid restricting future generations.
It is difficult to propose a reduction of metal ore consumption. First, the high diversity within
metals and ores requires objectives to be set on a more detailed level. Second, considering total
DMC, metals make up for the smallest sub-group in EU material use (only 4% of total DMC).
Thus, any target for metals has only little significance to the overall DMC target compared to the
other material categories. However, for metals in particular, DMC only shows part of the picture.
The EU relies intensively on imports of metal products (83% of DMI in 2007). For metals the
consideration of upstream resource requirements in the process of extraction and processing is
therefore crucial. DMC does not include these, whereas RMC (Raw Material Consumption) does.
As soon as data for RMC will be available on a broader scale, a more detailed analysis of metal
use can be conducted. It may then become more relevant to specify a specific target for metal
RMC.
Metals are typically accumulated in societal stocks. Hence, increasing use of societal or
anthropogenic stocks through recycling and reuse can provide relief to natural stocks. In order to
foster a more efficient and extensive use of societal stocks, development of technologies are
required as well as improvements in product design to unfold unused potentials.
Key parameters in reducing metal use are considered:
Exhausting recycling potentials by technological innovation and improved
product design
Reduction of growing demand for metals by changes in consumption patterns
Shifting towards increasing lifetimes of consumer goods
Particularly addressing societal use of minerals with highest environmental
impacts on ecosystems and human health
54 Institute for Social Ecology and Potsdam Institute for Climate Impact Research (2009) Eating the Planet: Feeding and
fuelling the world sustainably, fairly and humanely – a scoping study. Commissioned by: Compassion in World
Farming. 55 UNEP International Resource Panel (2011) Recycling Rates of Metals. A Status Report.
Evaluation of target setting
76 | Assessment of resource efficiency indicators and targets
Metals represent both high value resources and significant environmental impacts. Instead of
attempting to disaggregate the overall DMC target to DMC of metals, it would be better to focus
on increasing their resource efficiency. Although, the general aim would be reduce the
consumption of metals and their associated environmental impacts, this should not come at the
expense of compromising EU’s competiveness, nor should it hinder construction of the low
carbon and renewable energy infrastructure that is needed in the short and medium term.
Non-metallic minerals
Non-metallic minerals such as sand, gravel, limestone, clay, are mainly used for construction
activities building up infrastructure (roads and buildings). This material category makes up for
around half of material use.
An estimate for the EU56 reveals that around 25% of construction minerals are used for building
new infrastructure, the other 75% are used for maintaining existing stocks. At the same time,
land area is limited and the constant expansion of built-up land has to be stopped in order to
reduce pressure on land area (and thus on biodiversity and ecosystem services). Stabilising built-
up stocks is considered a key strategy since it results in a reduction of material use, a reduction of
energy use in the production and use phase, and a reduction of the use of land. The use of non-
metallic minerals should range around -50% by 2020 and -85% by 2050.
Stabilizing built-up stocks will require boosting recycling and reuse of societal stocks. Recycling
potentials are expected to be rather high (between 80-90%) and could significantly reduce the
pressure on natural stocks. At the same time, societal patterns of mobility and transport have to
be reconsidered and further developed under considerations of sustainability.
Consequences of DMC Reduction
The DMC targets will result in a per capita material use of 11 t/cap/yr in 2020 and nearly 5 t/cap/yr
in 2050. Other scenarios such as those presented by the International Resource Panel in the
“Decoupling Report” arrive at similar results. The Resource Panel’s Scenario 3 “Tough contraction
and convergence” project 5 t/cap/yr for industrialized countries with high population such as the
EU. Expressed in average annual growth rates, the targets for DMC would require -2% per year
until 2020 or -3% per year until 2050. (For GIEC the annual growth rates are -1% until 2020 and -
2% until 2050).
4.4.4 Material Use: Environmentally Weighted Material
Consumption (EMC)
Targeting EMC is rather difficult because the indicator still needs further development with
regards to methods and data availability. However, some general recommendation can be
formulated based on the available studies on EMC.
Current resource use policies (e.g. the “Thematic Strategy on the Sustainable Use of Natural
Resources” of the EC) call for a double decoupling, i.e. decoupling of resource use from economic
56 Large Scale Planning and Design of Resource Use. A project under the Framework contract ENV.G4/FRA/2008/0112.
2011.
Evaluation of target setting
Assessment of resource efficiency indicators and targets | 77
growth and decoupling of environmental impacts from resource use. Hence, a target on EMC
should aim for exceeding the reduction of DMC. In the case of biomass, this means that
although the use of biomass resources is stable, the EU should still strive for reducing the
environmental impact from agriculture and forestry such as land degradation, top soil loss, etc.
Material use EMC 2020: > -30%
2050: > -70%
4.4.5 Land Use: Domestic Land Demand
Land area is increasingly exposed to increasing demand by agriculture but also built-up land and
at the same time increasing pressure due to intensification of land use. Monitoring and targeting
domestic land demand addresses the first of these issues and asks for a balanced share between
different land use categories. Land use categories that have the smallest effects on land cover
should be preserved. This refers to wilderness areas but also forests. Conversely, expansion of
agricultural land should be strongly limited (see also the recommendation of the Stockholm
Resilience Centre57 on limiting the percentage of global land cover converted to cropland to 15%).
On the global level, distributional issues have to be considered additionally. As mentioned
before, Europe is characterized by favourable biogeographic conditions (climate, soils) and a high
availability of productive land per capita. Thus, Europe’s demand for foreign land area (in
particular productive land such as agricultural land) should be balanced. This can be traced by the
indicator Actual Land Demand (or comparable calculations such as GLUA58), which considers land
requirements embodied in trade flows. In relation to the request for stabilising biomass use, and
limiting the EU demand for limited land resources to a fair share, the target for zero net-demand
of foreign land is considered well-balanced.
Land use ALD 2020, 2050: zero net- demand of foreign land
Indicators and calculation methods still need development and harmonization, however, some
first estimates exist58, 59, 60). Estimations for the EU15 revealed that 18% of domestic demand of
agricultural products are supplied by foreign land.61 Projections for future land demand estimate
an increase of global or actual land demand by 20% to 50% until 2030.62
57 Rockstrom et al. (2009) Editorial, Earth's boundaries? Nature. Vol. 461, Issue 461, pp. 447-448. See also:
www.stockholmresilience.org/planetary-boundaries) 58 Bringezu and Bleischwitz (2009) Sustainable Resource Management. Global Trends, Visions and Policies. Greenleaf
Publishing. 59 Lambin & Meyfroidt (2011) Global land use change, economic globalization, and the looming land scarcity.
Proceedings of National Academy of Sciences www.pnas.org/content/early/2011/02/04/1100480108.full.pdf 60
Erb, Karl-Heinz (2004) Actual land demand of Austria 1926–2000: a variation on Ecological Footprint assessments.
Land Use Policy, Volume 21, Issue 3. Pages 247-259 61 Bringezu and Bleischwitz (2009) Sustainable Resource Management. Global Trends, Visions and Policies. Greenleaf
Publishing. 62 Lambin & Meyfroidt (2011) Global land use change, economic globalization, and the looming land scarcity.
Proceedings of National Academy of Sciences www.pnas.org/content/early/2011/02/04/1100480108.full.pdf
Evaluation of target setting
78 | Assessment of resource efficiency indicators and targets
4.4.6 Land Use: Human Appropriation of Net Primary
Production (HANPP)
HANPP, an indicator addressing land use intensity, varies across different land use categories.
Cropland is typically characterized by high HANPP levels at or above 85%, whereas forests have
low HANPP values below 30%. Depending on land cover patterns and the intensity of land use,
domestic HANPP across European countries differs widely. The highest average HANPP (60-
70%) occurs in countries with a high share of intensive agriculture, such as the Netherlands,
Hungary, Denmark and the Czech Republic. Countries with less intensive land use and a high
proportion of forest cover have much lower average HANPP. Average HANPP in Sweden, Finland
or Slovenia, for example, is less than 30%.
Land use HANPP 2020: stabilisation at 50%
2050: reduction to 40%
HANPP as share of NPP0 is currently about 48% in Europe (40% in Western Europe and 52% in
Eastern and South-Eastern Europe). While HANPP in Western Europe is mainly driven by harvest
(NPPh), in Eastern and South-Eastern Europe land conversion (NPP∆LC) plays an important role63.
The proposed target for 2020, i.e. 50%, represents stabilisation, whereas the 2050 target requires
action towards decreasing land use intensity without expanding the land area used.
The overall target for the EU-27 of stabilising average HANPP at 50% or reducing it to 40%
should not be applied equally to individual Member States. Countries with less favourable
conditions for intensive land use (e.g. Sweden, Finland or Slovenia) should maintain low levels of
HANPP. Whereas countries with productive land suitable for agricultural production (e.g. the
Netherlands, Hungary, Denmark and the Czech Republic) should still engage in agriculture – and
thus can have levels above the target level. However, HANPP in regions with high suitability for
intensive cropland agriculture should not exceed 75%. Although the proposed 2020 target for
HANPP corresponds to current levels, this still requires action to avoid that HANPP in regions of
high intensive land use does not exceed 75%. In other words, stabilising or reducing average
HANPP in Europe may require a stabilisation or increase in extensive land use types, and a
sustainable intensification on the best agricultural land. This is a trend, which has been observed
in Europe during the past decades.
The short discussion shows that the national level is not the most suitable level to monitor and
manage average land use intensity. A spatially explicit perspective is required and a more
suitable scale to apply HANPP targets could be based on regions defined by bio-geographic
characteristics such as agro-ecological zones. Agro-ecological zoning (AEZ), as applied in FAO
studies, defines zones on the basis of combinations of soil, landform and climatic characteristics.
The particular parameters used in the definition focus attention on the climatic and edaphic64
requirements of crops and on the management systems under which the crops are grown. Each
63 Haberl, H., Gaube, V. Díaz-Delgado, R., Krauze, K., Neuner, A., Peterseil, J., Plutzar, C., Singh, S.J. and Vadineanu, A.
(2009) Towards an integrated model of socioeconomic biodiversity drivers, pressures and impacts. A feasibility study
based on three European long-term socio-ecological research platforms. Ecological Economics 68. 64 Relating to soil
Evaluation of target setting
Assessment of resource efficiency indicators and targets | 79
zone has a similar combination of constraints and potentials for land use, and serves as a focus
for the targeting of recommendations designed to improve the existing land-use situation, either
through increasing production or by limiting land degradation.65
4.4.7 Water use
Indicators on water abstraction are still in development and some major decisions on
conventions still have to be taken. Thus, a target on water abstraction cannot be formulated for
the time being.
Water use WA
[indicator development]
The Water Exploitation Index is currently used in Europe66. In line with EEA recommendations,
the proposed target is to reduce the WEI below 20% until 2020 and below 10% until 2050. A
Water Exploitation Index between 10% and 20% is considered as “low water stress”), WEI
between 20% and 40% is indicating “stress on water resources” and above 40% represents “severe
water stress”.
Water use WEI 2020: <20%
2050: <10%
The targets on WEI have to be considered as overall targets. In order to be operational they need
to be linked to a particular spatial scale. Water and water bodies do not follow administrative
boundaries and consequently the level of management has to be set on a more ecosystem-
related level – this would preferably be at the river basin level.
4.5 Targets and the application on different levels
The set of targets proposed so far have been formulated for the EU-27 as a whole. These targets
provide a general framework and are orientated for specific measures to monitor the progress of
the EU and MS. In a next step, the overall objectives have to be translated to targets on a national
level or other relevant regional scale and then have to be complemented by specific measures
(see the previous chapter and the evaluation forms in Annex C in the Annex Report).
A breakdown of targets to the Member State level is reasonable for the resource use-oriented
headline indicators, i.e. DMC, GIEC, WA, ALD. These indicators are closely linked to socio-
economic activities and thus a disaggregation along political/economic entities is well grounded.
The same is true for the environmental impact-oriented indicators EMC and GHG.
The definition of targets on the MS level then again is not an easy task and can be done under
different perspectives:
65 FAO, www.fao.org/docrep/W2962E/w2962e00.htm#P-2
66 EEA (2009) Water resources across Europe – confronting water scarcity and drought. EEA report No. 2/2009.
Evaluation of target setting
80 | Assessment of resource efficiency indicators and targets
Equal breakdown of EU targets to the MS level, i.e. a 30% reduction on the EU
level equals a 30% reduction in all MS
Breakdown according to population size (e.g. per capita), which represents
social equality and the aim of providing all inhabitants with equal resources.
Breakdown according to economic output, which tackles the assumption that
economic development needs resources and in return the right of using a certain
amount of resources in order to allow for economic development. This takes the
different economic structures in MS into consideration
Breakdown according to predominant ecosystem characteristics (see also
below)
Or a combination of the approaches above
The question of which approach or combinations of approaches to apply is a matter of political
negotiation.
For HANPP and WEI the national level does not represent the appropriate reference scale (see
sections 3.5 and 4.4). These two indicators are closely linked to ecosystem functioning and
operational information can only be gained on a spatial scale that orients itself at the relevant
ecosystem boundaries. In the case of HANPP, agro-ecological zones are considered as a highly
relevant scale for targets to be set. In the case of WEI, river basins would be preferred. However,
in both cases (i.e. for HANPP and WEI) the aggregate level of the EU-27 and an overall target on
this level is useful because this serves as an overall framework and can complement the
ecosystem-perspective with the necessary administrative level.
4.6 Focussing on multi-return strategies
The above set of specifications provides a target for each of the headline indicators included in
the basket of indicators. This section introduces a different approach to setting targets. When
considering targeting resource use, one could try to build on the strong functional links between
resources67 and then identify key or “multi-return” strategies that capture, with one policy
intervention, all or most resources.
The strong functional ties between materials use, energy use, water use and land use grant
certain synergies, but sometimes also burden shifting. If one develops a strategy of reducing
materials, there may be an additional energy requirement for the investment, but then in the
longer run one will also save on energy (and on transport). The same logic also works the other
way round, and as a rule extends also to land use and water use. In some cases, the relations are
not synergistic but complementary. For example, one needs to invest in materials in the short
term to save on energy for heating and cooling in the long term. But even in this case, in the long
run there would be an overall materials and energy saving (as insulation materials tend to be light
and applied only once, while energy carriers for combustion are saved throughout the use phase).
67 Steinberger, Julia K., Krausmann, Fridolin, und Eisenmenger, Nina (2010) Global patterns of material use: a
socioeconomic and geophysical analysis. In: Ecological Economics 69(5), S. 1148-1158.
Evaluation of target setting
Assessment of resource efficiency indicators and targets | 81
Following this, it is possible to identify “Single-Return Strategies”: strategies that target one
specific effect. An example of this is Carbon Capture and Storage (CCS). CCS may substantially
reduce carbon emissions, but at the same time it lowers the energy return on investment,
requires substantial construction materials to be built, and potentially creates a risk of leakage in
the long run.
And then there are “Multi-Return Strategies” where one measure can have several effects on a
broad set of or even all resources. Among these Multi-Return Strategies the following have been
identified:
1. Changing the human diet towards a lower share of animal based food. Tackling this will
have several effects:
a. Positive effects on human health (less obesity, less cardiovascular diseases, lower
risk of livestock-related epidemics)
b. Decreasing livestock and thus lowering pressure on land because less land area is
needed for agricultural production (i.e. market fodder for livestock)
c. Lowering pressures on groundwater (nitrification)
d. Savings of energy (cooling, transportation)
e. Decreasing GHG emissions from ruminants
f. Savings on water use
2. Steady stocks of built-up infrastructure and densification of settlements, reducing urban
sprawl
a. decreasing material use, i.e. construction minerals, metals use in infrastructure,
b. facilitating a continuous recycling of construction materials
c. decreasing energy use for the construction of infrastructure, in transport and in the
use phase (more efficient heating, shorter distances)
d. decreasing use of land area and sealing of land
3. Product re-design for longevity and recycling. This is not really one strategy, but a bundle
of strategies, to be developed for groups of products.
a. reducing toxic materials, increasing use of bio-degradable materials
b. increasing longevity, repair-friendliness and re-use of products
c. increasing recyclability by design
d. improving energy efficiency in production and use of products
In the policy context of targeting, the question is whether several targets should or could be set
or if political concentration and power should focus on “Multi-Return strategies” that require less
action but broader effects.
4.7 Proposal of a range of targets
Based on the above the project team proposed a range of resource use targets for 2020 (medium
term perspective) and 2050 (long term perspective) corresponding to three different levels of
ambition levels. It was assumed that the targets proposed in the previous task represented the
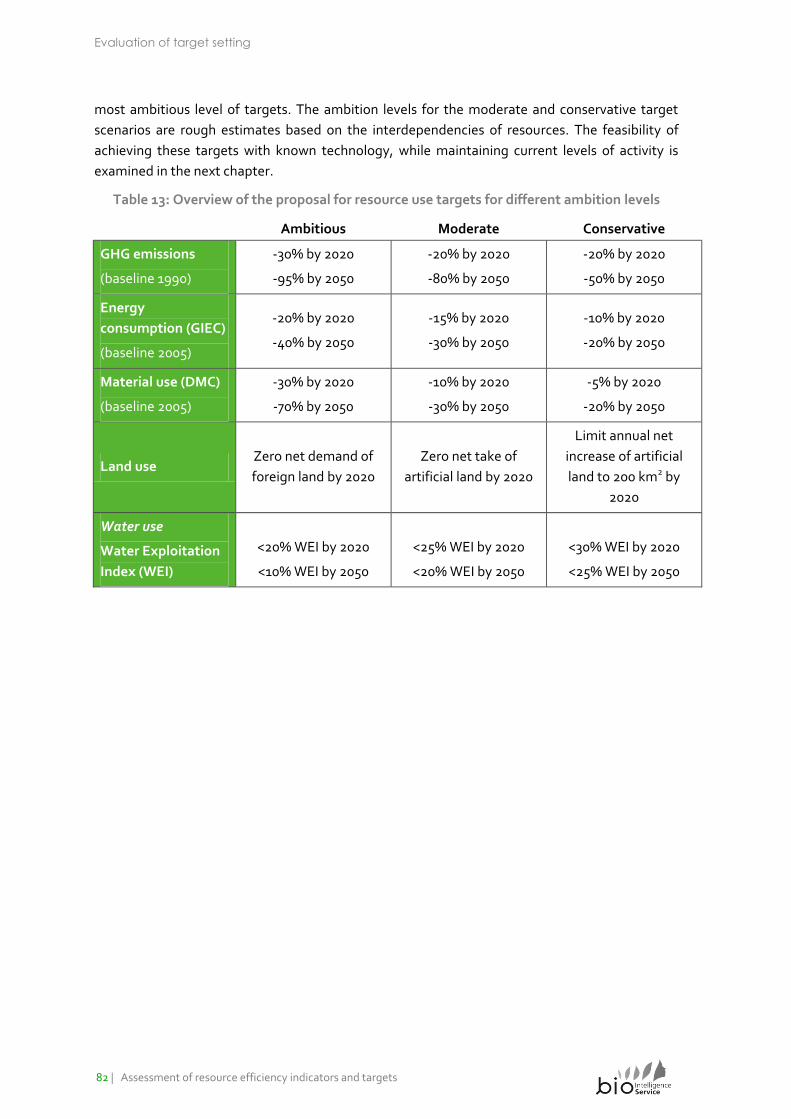
Evaluation of target setting
82 | Assessment of resource efficiency indicators and targets
most ambitious level of targets. The ambition levels for the moderate and conservative target
scenarios are rough estimates based on the interdependencies of resources. The feasibility of
achieving these targets with known technology, while maintaining current levels of activity is
examined in the next chapter.
Table 13: Overview of the proposal for resource use targets for different ambition levels
Ambitious Moderate Conservative
GHG emissions
(baseline 1990)
-30% by 2020
-95% by 2050
-20% by 2020
-80% by 2050
-20% by 2020
-50% by 2050
Energy
consumption (GIEC)
(baseline 2005)
-20% by 2020
-40% by 2050
-15% by 2020
-30% by 2050
-10% by 2020
-20% by 2050
Material use (DMC)
(baseline 2005)
-30% by 2020
-70% by 2050
-10% by 2020
-30% by 2050
-5% by 2020
-20% by 2050
Land use Zero net demand of
foreign land by 2020
Zero net take of
artificial land by 2020
Limit annual net
increase of artificial
land to 200 km2 by
2020
Water use
Water Exploitation
Index (WEI)
<20% WEI by 2020
<10% WEI by 2050
<25% WEI by 2020
<20% WEI by 2050
<30% WEI by 2020
<25% WEI by 2050
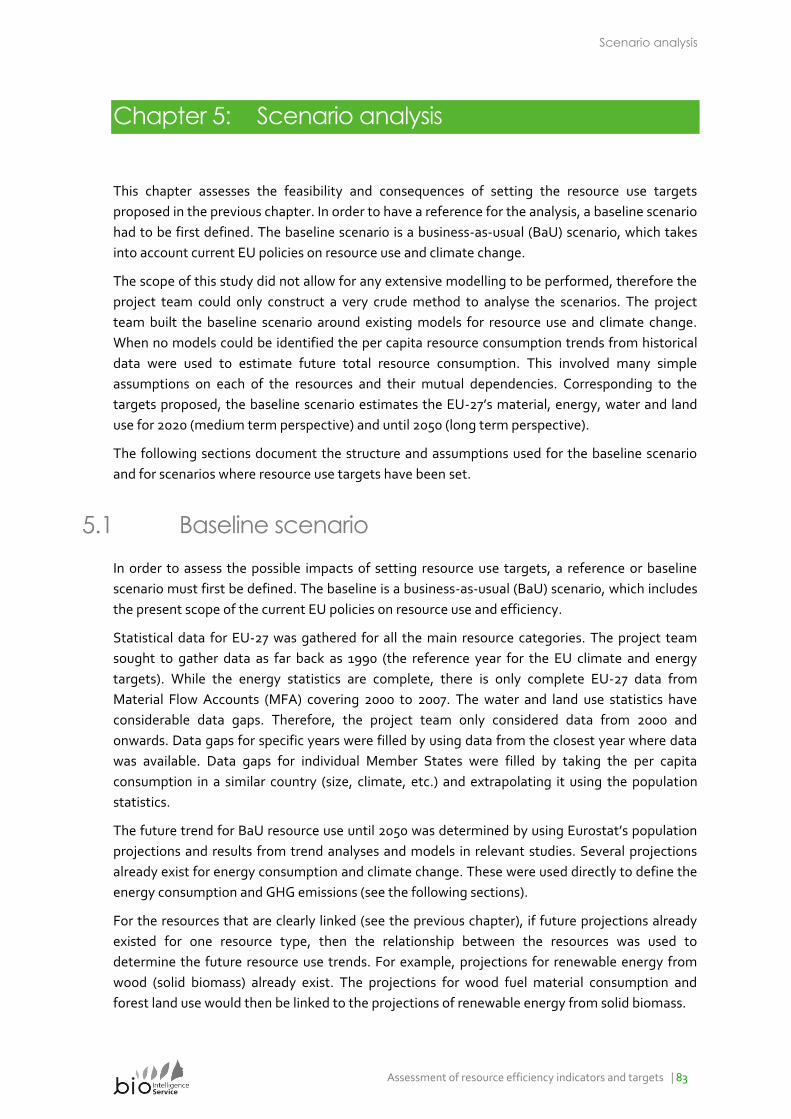
Scenario analysis
Assessment of resource efficiency indicators and targets | 83
Chapter 5: Scenario analysis
This chapter assesses the feasibility and consequences of setting the resource use targets
proposed in the previous chapter. In order to have a reference for the analysis, a baseline scenario
had to be first defined. The baseline scenario is a business-as-usual (BaU) scenario, which takes
into account current EU policies on resource use and climate change.
The scope of this study did not allow for any extensive modelling to be performed, therefore the
project team could only construct a very crude method to analyse the scenarios. The project
team built the baseline scenario around existing models for resource use and climate change.
When no models could be identified the per capita resource consumption trends from historical
data were used to estimate future total resource consumption. This involved many simple
assumptions on each of the resources and their mutual dependencies. Corresponding to the
targets proposed, the baseline scenario estimates the EU-27’s material, energy, water and land
use for 2020 (medium term perspective) and until 2050 (long term perspective).
The following sections document the structure and assumptions used for the baseline scenario
and for scenarios where resource use targets have been set.
5.1 Baseline scenario
In order to assess the possible impacts of setting resource use targets, a reference or baseline
scenario must first be defined. The baseline is a business-as-usual (BaU) scenario, which includes
the present scope of the current EU policies on resource use and efficiency.
Statistical data for EU-27 was gathered for all the main resource categories. The project team
sought to gather data as far back as 1990 (the reference year for the EU climate and energy
targets). While the energy statistics are complete, there is only complete EU-27 data from
Material Flow Accounts (MFA) covering 2000 to 2007. The water and land use statistics have
considerable data gaps. Therefore, the project team only considered data from 2000 and
onwards. Data gaps for specific years were filled by using data from the closest year where data
was available. Data gaps for individual Member States were filled by taking the per capita
consumption in a similar country (size, climate, etc.) and extrapolating it using the population
statistics.
The future trend for BaU resource use until 2050 was determined by using Eurostat’s population
projections and results from trend analyses and models in relevant studies. Several projections
already exist for energy consumption and climate change. These were used directly to define the
energy consumption and GHG emissions (see the following sections).
For the resources that are clearly linked (see the previous chapter), if future projections already
existed for one resource type, then the relationship between the resources was used to
determine the future resource use trends. For example, projections for renewable energy from
wood (solid biomass) already exist. The projections for wood fuel material consumption and
forest land use would then be linked to the projections of renewable energy from solid biomass.
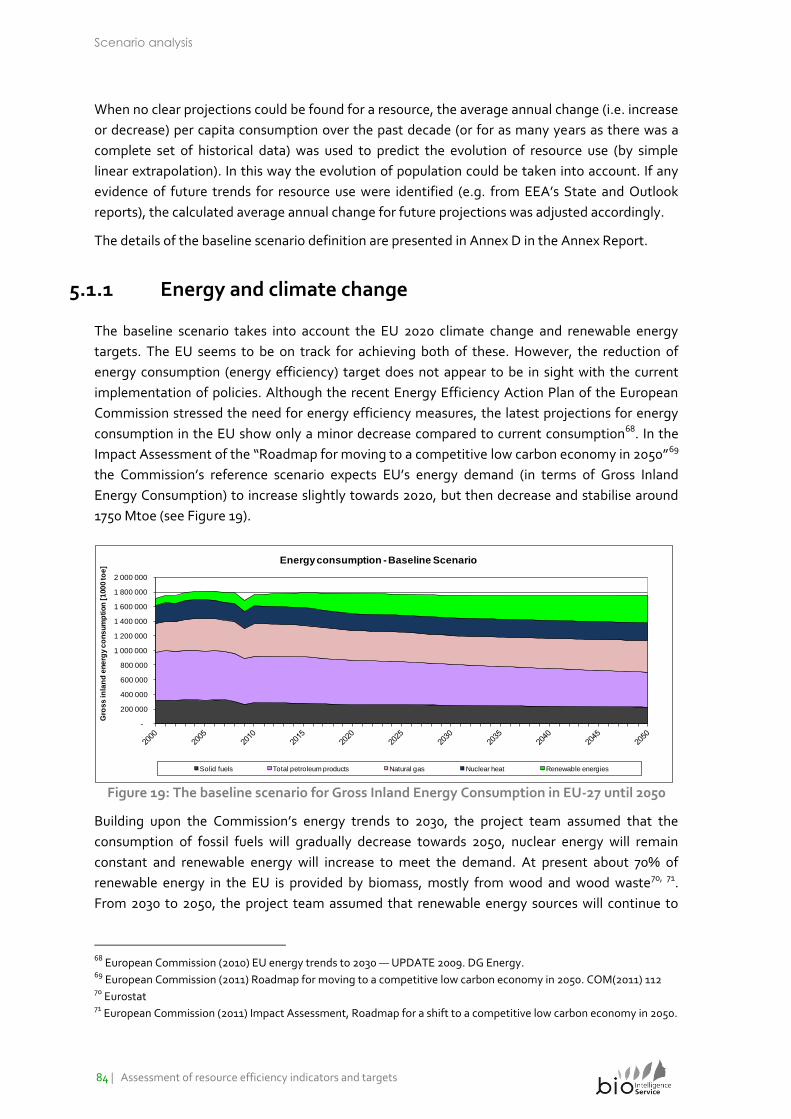
Scenario analysis
84 | Assessment of resource efficiency indicators and targets
When no clear projections could be found for a resource, the average annual change (i.e. increase
or decrease) per capita consumption over the past decade (or for as many years as there was a
complete set of historical data) was used to predict the evolution of resource use (by simple
linear extrapolation). In this way the evolution of population could be taken into account. If any
evidence of future trends for resource use were identified (e.g. from EEA’s State and Outlook
reports), the calculated average annual change for future projections was adjusted accordingly.
The details of the baseline scenario definition are presented in Annex D in the Annex Report.
5.1.1 Energy and climate change
The baseline scenario takes into account the EU 2020 climate change and renewable energy
targets. The EU seems to be on track for achieving both of these. However, the reduction of
energy consumption (energy efficiency) target does not appear to be in sight with the current
implementation of policies. Although the recent Energy Efficiency Action Plan of the European
Commission stressed the need for energy efficiency measures, the latest projections for energy
consumption in the EU show only a minor decrease compared to current consumption68. In the
Impact Assessment of the “Roadmap for moving to a competitive low carbon economy in 2050”69
the Commission’s reference scenario expects EU’s energy demand (in terms of Gross Inland
Energy Consumption) to increase slightly towards 2020, but then decrease and stabilise around
1750 Mtoe (see Figure 19).
-
200 000
400 000
600 000
800 000
1 000 000
1 200 000
1 400 000
1 600 000
1 800 000
2 000 000
Gro
ss
in
lan
d e
ne
rgy c
on
su
mp
tio
n [
100
0 t
oe
]
Energy consumption - Baseline Scenario
Solid fuels Total petroleum products Natural gas Nuclear heat Renewable energies
Figure 19: The baseline scenario for Gross Inland Energy Consumption in EU-27 until 2050
Building upon the Commission’s energy trends to 2030, the project team assumed that the
consumption of fossil fuels will gradually decrease towards 2050, nuclear energy will remain
constant and renewable energy will increase to meet the demand. At present about 70% of
renewable energy in the EU is provided by biomass, mostly from wood and wood waste70, 71.
From 2030 to 2050, the project team assumed that renewable energy sources will continue to
68 European Commission (2010) EU energy trends to 2030 — UPDATE 2009. DG Energy. 69 European Commission (2011) Roadmap for moving to a competitive low carbon economy in 2050. COM(2011) 112 70 Eurostat 71 European Commission (2011) Impact Assessment, Roadmap for a shift to a competitive low carbon economy in 2050.
Scenario analysis
Assessment of resource efficiency indicators and targets | 85
grow with 1% annual reaching 372 Mtoe in 2050. Although other renewable energy sources will
come to play, biomass will remain an important component amounting to 228 Mtoe in 2050
(predominantly crops, residues and waste)72.
In the European Commission’s “Roadmap for moving to a competitive low carbon economy in
2050”73 the modelling showed that full implementation of current policy will result in a 39%
reduction of domestic GHG emissions in 2050 (compared to 1990). If current trends continue
energy production and industry will reduce their GHG emissions, but the transport sector will
keep increasing its carbon emissions (see Figure 20).
-
1 000 000
2 000 000
3 000 000
4 000 000
5 000 000
6 000 000
GH
G e
mis
sio
ns [1
000 t
on
nes C
O2-e
q.]
Greenhouse gas (GHG) emissions - Baseline scenario
Energy Industries Industry, total Transport Agriculture (non CO2) Other sectors Waste Other (non CO2)
Figure 20: The baseline scenario for domestic greenhouse gas emissions in EU-27 until 2050
5.1.2 Material consumption
In the baseline scenario the overall domestic material consumption (DMC) in the EU-27 is
expected to rise slightly with growing population, but otherwise remains at around the current
levels (see Figure 21). The composition of DMC will however change – mainly due to current
energy policy. The projection for fossil fuel DMC follows the projections for fossil fuel energy
consumption. DMC of metals and minerals is expected to decrease slightly over the next decade
and then stabilise. Biomass is the component of DMC that is expected to grow the most - mainly
to meet the demand of renewable energy production.
72 European Commission (2011) Impact Assessment, Roadmap for a shift to a competitive low carbon economy in 2050. 73 European Commission (2011) Roadmap for moving to a competitive low carbon economy in 2050. COM(2011) 112
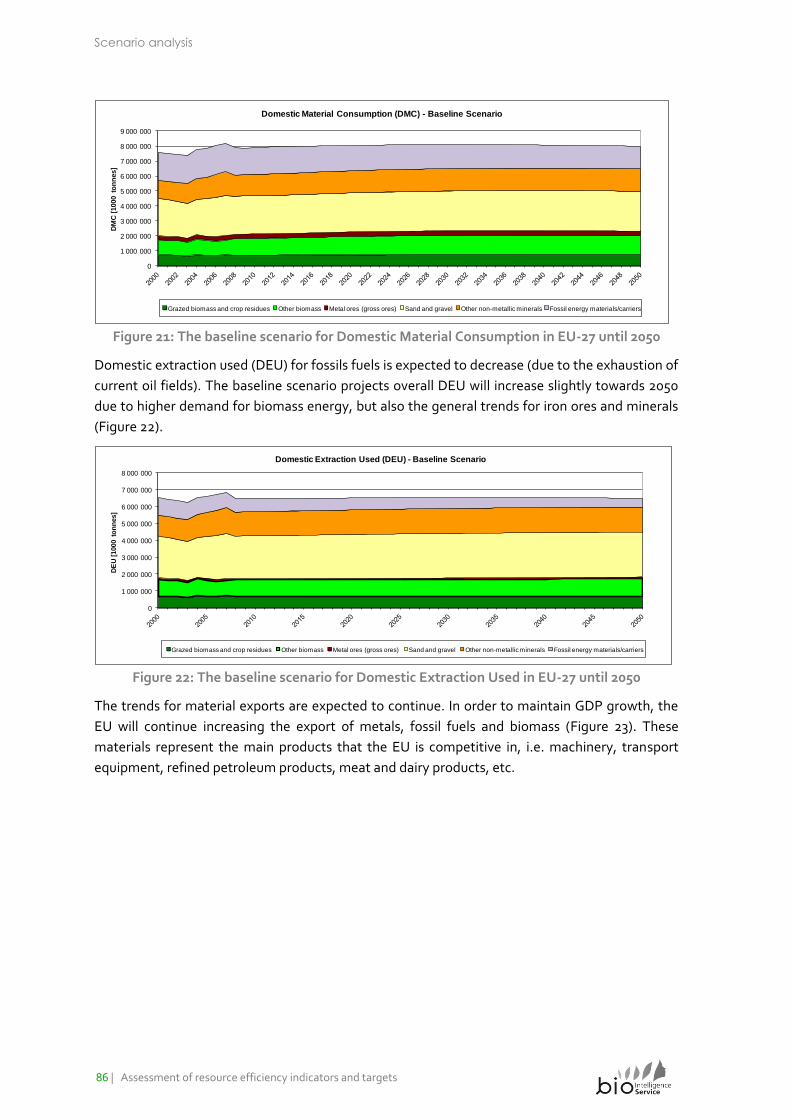
Scenario analysis
86 | Assessment of resource efficiency indicators and targets
0
1 000 000
2 000 000
3 000 000
4 000 000
5 000 000
6 000 000
7 000 000
8 000 000
9 000 000
DM
C [
1000 t
on
nes]
Domestic Material Consumption (DMC) - Baseline Scenario
Grazed biomass and crop residues Other biomass Metal ores (gross ores) Sand and gravel Other non-metallic minerals Fossil energy materials/carriers
Figure 21: The baseline scenario for Domestic Material Consumption in EU-27 until 2050
Domestic extraction used (DEU) for fossils fuels is expected to decrease (due to the exhaustion of
current oil fields). The baseline scenario projects overall DEU will increase slightly towards 2050
due to higher demand for biomass energy, but also the general trends for iron ores and minerals
(Figure 22).
0
1 000 000
2 000 000
3 000 000
4 000 000
5 000 000
6 000 000
7 000 000
8 000 000
DE
U [
1000 t
on
nes]
Domestic Extraction Used (DEU) - Baseline Scenario
Grazed biomass and crop residues Other biomass Metal ores (gross ores) Sand and gravel Other non-metallic minerals Fossil energy materials/carriers
Figure 22: The baseline scenario for Domestic Extraction Used in EU-27 until 2050
The trends for material exports are expected to continue. In order to maintain GDP growth, the
EU will continue increasing the export of metals, fossil fuels and biomass (Figure 23). These
materials represent the main products that the EU is competitive in, i.e. machinery, transport
equipment, refined petroleum products, meat and dairy products, etc.
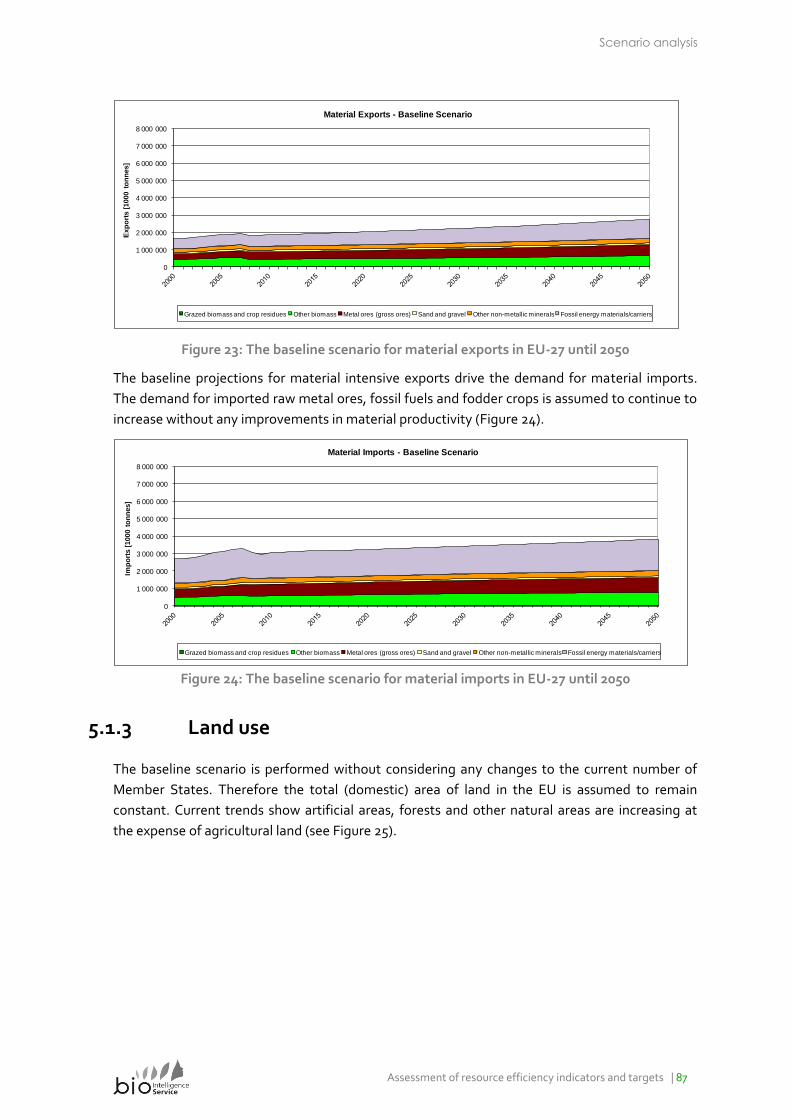
Scenario analysis
Assessment of resource efficiency indicators and targets | 87
0
1 000 000
2 000 000
3 000 000
4 000 000
5 000 000
6 000 000
7 000 000
8 000 000E
xp
ort
s [
1000 t
on
nes]
Material Exports - Baseline Scenario
Grazed biomass and crop residues Other biomass Metal ores (gross ores) Sand and gravel Other non-metallic minerals Fossil energy materials/carriers
Figure 23: The baseline scenario for material exports in EU-27 until 2050
The baseline projections for material intensive exports drive the demand for material imports.
The demand for imported raw metal ores, fossil fuels and fodder crops is assumed to continue to
increase without any improvements in material productivity (Figure 24).
0
1 000 000
2 000 000
3 000 000
4 000 000
5 000 000
6 000 000
7 000 000
8 000 000
Imp
ort
s [
1000 t
on
nes]
Material Imports - Baseline Scenario
Grazed biomass and crop residues Other biomass Metal ores (gross ores) Sand and gravel Other non-metallic minerals Fossil energy materials/carriers
Figure 24: The baseline scenario for material imports in EU-27 until 2050
5.1.3 Land use
The baseline scenario is performed without considering any changes to the current number of
Member States. Therefore the total (domestic) area of land in the EU is assumed to remain
constant. Current trends show artificial areas, forests and other natural areas are increasing at
the expense of agricultural land (see Figure 25).
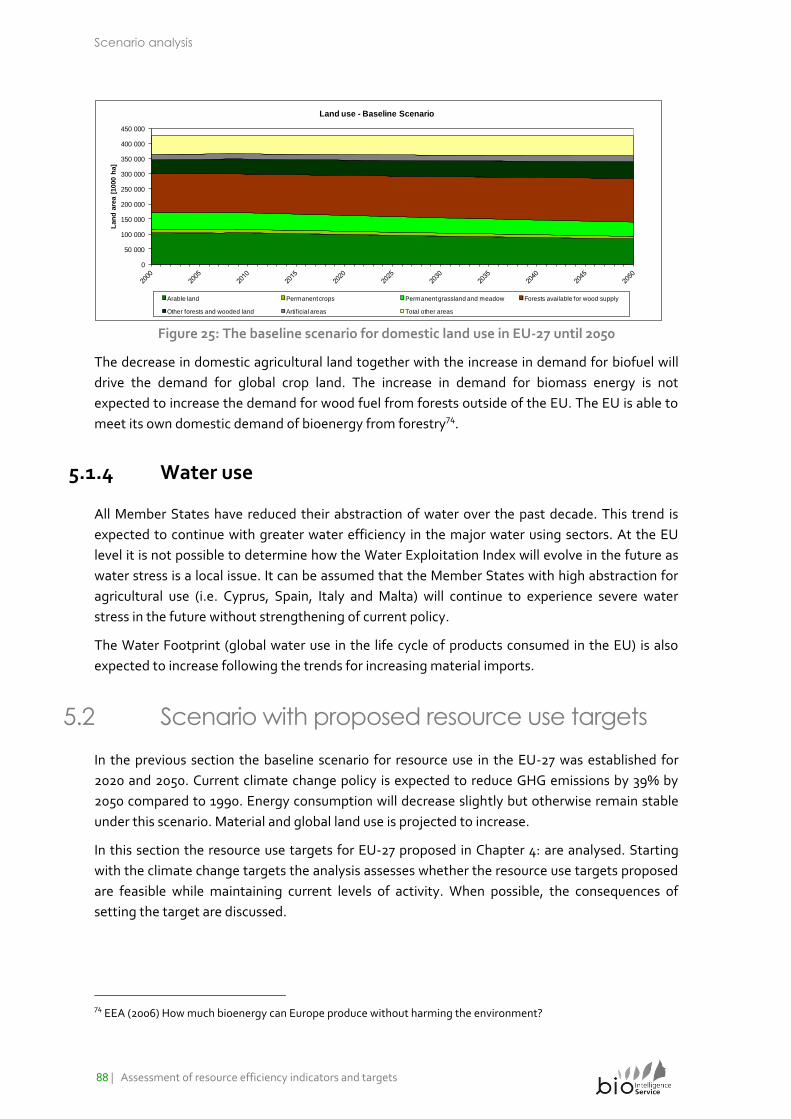
Scenario analysis
88 | Assessment of resource efficiency indicators and targets
0
50 000
100 000
150 000
200 000
250 000
300 000
350 000
400 000
450 000
Lan
d a
rea [
1000 h
a]
Land use - Baseline Scenario
Arable land Permanent crops Permanent grassland and meadow Forests available for wood supply
Other forests and wooded land Artificial areas Total other areas
Figure 25: The baseline scenario for domestic land use in EU-27 until 2050
The decrease in domestic agricultural land together with the increase in demand for biofuel will
drive the demand for global crop land. The increase in demand for biomass energy is not
expected to increase the demand for wood fuel from forests outside of the EU. The EU is able to
meet its own domestic demand of bioenergy from forestry74.
5.1.4 Water use
All Member States have reduced their abstraction of water over the past decade. This trend is
expected to continue with greater water efficiency in the major water using sectors. At the EU
level it is not possible to determine how the Water Exploitation Index will evolve in the future as
water stress is a local issue. It can be assumed that the Member States with high abstraction for
agricultural use (i.e. Cyprus, Spain, Italy and Malta) will continue to experience severe water
stress in the future without strengthening of current policy.
The Water Footprint (global water use in the life cycle of products consumed in the EU) is also
expected to increase following the trends for increasing material imports.
5.2 Scenario with proposed resource use targets
In the previous section the baseline scenario for resource use in the EU-27 was established for
2020 and 2050. Current climate change policy is expected to reduce GHG emissions by 39% by
2050 compared to 1990. Energy consumption will decrease slightly but otherwise remain stable
under this scenario. Material and global land use is projected to increase.
In this section the resource use targets for EU-27 proposed in Chapter 4: are analysed. Starting
with the climate change targets the analysis assesses whether the resource use targets proposed
are feasible while maintaining current levels of activity. When possible, the consequences of
setting the target are discussed.
74 EEA (2006) How much bioenergy can Europe produce without harming the environment?
Scenario analysis
Assessment of resource efficiency indicators and targets | 89
5.2.1 Climate change
In its Impact Assessment of the “Roadmap for a shift to a competitive low carbon economy in
2050”75 the Commission has already assessed the impacts of setting a GHG emissions target.
Meeting the 2ºC objective requires the halving of global emissions by 2050. In order to make its
proportionate contribution, Europe must reduce its GHG emissions by 75% or more by 2050
(compared to 1990).
The Impact Assessment showed that in order to achieve 80% reduction of domestic GHG
emissions while maintaining or even increasing activity levels in transport, annual energy
consumption should decrease by 30-35% to 1300 – 1350 Mtoe and that most of the energy is
based on renewable energy sources. Depending on early investment in different (known)
technology assumptions and global action, this could be cost-effective and lead to reduced fuels
costs.
Industry, services and the residential sector will also have to dramatically decrease their carbon
emissions through low carbon technologies, zero-energy buildings and carbon capture and
storage. Carbon emissions from the transport sector will inevitably rise towards 2030, but
increased vehicle efficiency, the use of cleaner energy and better use of infrastructure will
significantly decrease the sector’s contribution to GHG emissions. Non-CO2 emissions (mainly
from the agricultural and waste sector) will require greater yields, efficient fertiliser use, bio-
gasification of manure and better treatment of waste and manure.
High investments are required, but this offers opportunities for growth and employment. There
will be shifts in job sectors and ‘green’ labour skills would need to be revised and updated. Carbon
pricing initiatives and extension to non-ETS sectors could help guide investment. This could bring
benefits by reducing labour costs. As a reduction of domestic GHG emissions would encourage
the diffusion of renewable energy, this would decrease fossil energy imports and increase
security of energy supply. Furthermore, a reduction in GHG emissions would also reduce SO2,
NOx and PM emissions that would benefit the environment and human health.
A less ambitious target or delays in investment and global action would increase fuel costs and
supply risk, besides aggravating the effects of climate change. A more ambitious target (e.g. 95%
reduction of GHG emissions by 2050 compared to 1990) is technically and economically feasible
according to Greenpeace76 and WWF77, but would require greater infrastructure investments and
a lower demand and modal shift in the transport sector.
75 European Commission (2011) Impact Assessment. Roadmap for moving to a competitive low carbon economy in
2050. SEC(2011) 288 final 76 Greenpeace and the European Renewable Energy Council (2010) Energy [r]evolution. Towards a fully renewable
energy supply in the EU 27. 77 WWF, Ecofys and OMA (2011) The Energy Report. 100% renewable energy by 2050.
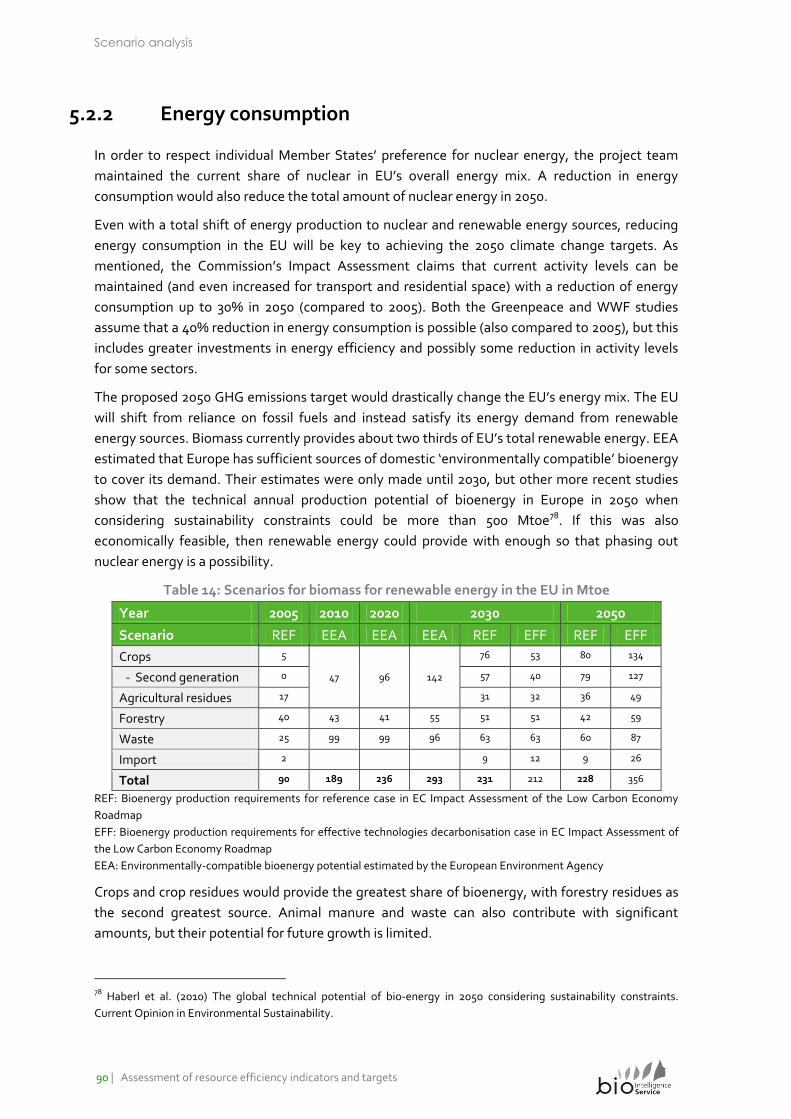
Scenario analysis
90 | Assessment of resource efficiency indicators and targets
5.2.2 Energy consumption
In order to respect individual Member States’ preference for nuclear energy, the project team
maintained the current share of nuclear in EU’s overall energy mix. A reduction in energy
consumption would also reduce the total amount of nuclear energy in 2050.
Even with a total shift of energy production to nuclear and renewable energy sources, reducing
energy consumption in the EU will be key to achieving the 2050 climate change targets. As
mentioned, the Commission’s Impact Assessment claims that current activity levels can be
maintained (and even increased for transport and residential space) with a reduction of energy
consumption up to 30% in 2050 (compared to 2005). Both the Greenpeace and WWF studies
assume that a 40% reduction in energy consumption is possible (also compared to 2005), but this
includes greater investments in energy efficiency and possibly some reduction in activity levels
for some sectors.
The proposed 2050 GHG emissions target would drastically change the EU’s energy mix. The EU
will shift from reliance on fossil fuels and instead satisfy its energy demand from renewable
energy sources. Biomass currently provides about two thirds of EU’s total renewable energy. EEA
estimated that Europe has sufficient sources of domestic ‘environmentally compatible’ bioenergy
to cover its demand. Their estimates were only made until 2030, but other more recent studies
show that the technical annual production potential of bioenergy in Europe in 2050 when
considering sustainability constraints could be more than 500 Mtoe78. If this was also
economically feasible, then renewable energy could provide with enough so that phasing out
nuclear energy is a possibility.
Table 14: Scenarios for biomass for renewable energy in the EU in Mtoe
Year 2005 2010 2020 2030 2050
Scenario REF EEA EEA EEA REF EFF REF EFF
Crops 5
47 96 142
76 53 80 134
- Second generation 0 57 40 79 127
Agricultural residues 17 31 32 36 49
Forestry 40 43 41 55 51 51 42 59
Waste 25 99 99 96 63 63 60 87
Import 2 9 12 9 26
Total 90 189 236 293 231 212 228 356
REF: Bioenergy production requirements for reference case in EC Impact Assessment of the Low Carbon Economy
Roadmap
EFF: Bioenergy production requirements for effective technologies decarbonisation case in EC Impact Assessment of
the Low Carbon Economy Roadmap
EEA: Environmentally-compatible bioenergy potential estimated by the European Environment Agency
Crops and crop residues would provide the greatest share of bioenergy, with forestry residues as
the second greatest source. Animal manure and waste can also contribute with significant
amounts, but their potential for future growth is limited.
78 Haberl et al. (2010) The global technical potential of bio-energy in 2050 considering sustainability constraints.
Current Opinion in Environmental Sustainability.
Scenario analysis
Assessment of resource efficiency indicators and targets | 91
There is currently a lot of ongoing discussion on how the increase demand of bioenergy will
affect food and feed production as well as land use change. The production of feedstock for
bioenergy is closely linked to food, feed and forestry production. It is not clear what will drive the
demand in a global market. Without proper policies in place, the bioenergy would undoubtedly
compete against food production and put even more pressure on global water use and land use
change resulting in unintended negative environmental and social consequences. There does
however seem to be evidence that there is potential to increase agricultural and forestry yields in
order to meet the demand without also increasing pressure on the environment.
Bioenergy will therefore continue to be the main source of renewable energy, at least until the
other renewable energy technologies establish themselves over the next two decades. Biomass
energy will then decrease but remain the principal energy source well into the future. The
demand for bioenergy will depend on when electrification of the transport sector will occur. At
present, the shift to battery-driven vehicles is not envisioned before 2030.
5.2.3 Material consumption
Biomass
The phasing out of fossil fuels from energy production will drastically reduce the DMC of fossil
energy carriers. A small amount of fossil materials will however still be needed for non-energy
uses, i.e. plastics and chemicals (approx. 85 – 115 Mt) 79. On the other hand the uptake of
renewable energy will be largely driven by a greater demand for biomass for energy production.
This will increase dramatically until 2040 but then stabilise as the other renewable sources (e.g.
wind, solar and geothermal) take off. As mentioned, biomass for energy use will be in direct
competition with the demand for food, feed and forests.
Both Greenpeace and WWF believe that the increasing world demand (for 9 billion people) for
food, bioenergy and even biomass material feedstock for materials can be supplied sustainably
without jeopardising forested and protected land areas. This does however require a 1% annual
increase in yield of global agricultural cropland80; a 50% reduction of current per capita meat
consumption in OECD countries by 2050; and a significant increase of energy recovery from
biowaste.
Bioenergy will predominantly come from energy crops (which are in competition with food and
feed), but with the current technological development this will instead be based on residues from
crops, animals and forests in the future. All other things being equal this would increase DMC of
biomass as more crop and forest residues would be ‘used’ in the economy. Therefore due to the
increase in demand for bioenergy, it would be difficult to reduce DMC of biomass. However, due
to favourable biogeographical conditions (climate and soils) and a high availability of productive
land per capita, the EU has the potential of being self-sustaining with regard to food and other
uses of biomass. The improvement of yields will be key to meeting the biomass demand. In
79 Greenpeace and the European Renewable Energy Council (2010) Energy [r]evolution. Towards a fully renewable
energy supply in the EU 27. 80 Current annual yield increase projections vary from 0.4 to 1.4%. The 1% annual yield increase does not take into
consideration the effects of climate change on agricultural production.
Scenario analysis
92 | Assessment of resource efficiency indicators and targets
agriculture the two approaches to increasing yields has either been through input intensification
(e.g. increasing the use of water, fertilisers and plant protection) or factor intensification (e.g.
applying best practices and new technology). In the case of resource efficiency, factor
intensification should be promoted rather than input intensification. If not, the improvement of
yields would entail higher levels of water and fertiliser use.
Another approach to meeting the demand for biomass, as mentioned in the previous chapter, is
by changing human (and animal) diets. At present, the EU average human diet contains a large
amount of protein and animal based products. Nutritional guidelines for a healthy diet
recommend a lower intake of protein and much less animal based products. The project team
roughly estimates that a 30% decrease of current consumption levels of beef and pork could
reduce biomass demand by over 6%. On a per capita level this would correspond to replacing a
beef steak or pork chop meal with a vegetarian option once a week. There also seems to be
considerable potential to reduce food waste. A 10% reduction of food waste by 2050 is quite
feasible and together with a less animal based diet this could almost reduce total biomass
(including food, feed and energy) demand by 10%. Besides reducing the amount of biomass and
the resulting environmental benefits, changing diets would have positive effects on human
health. Assuming all other things constant, expenses for food would decrease, which could
contract the economy of the food sector (but not necessarily the agricultural sector).
It is not clear whether extensive organic agricultural practices are compatible with the increase in
demand for biomass. Although, organic agricultural practices reduce the pressure on the local
natural environment, this may outweigh the global pressures by decrease in yields. There is
evidence 81 that organic farming can match the yields in conventional farming practices in
Europe, but it is actually in developing countries where the potential for increasing yields is
greatest (organic or not). With diet changes to a less meat intensive diet, there is a possibility
that organic agricultural practices could meet the demand for biomass in the future. Whatever
the case, more sustainable agricultural practices are certainly possible with the proposed targets,
even if intensive agriculture is necessary in some regions of Europe.
Metals
Metals only constitute 4% of DMC, but they contribute significantly to the EU economy and
global environmental impacts. Setting ambitious targets to encourage more efficient use of
metals, would both be cost-effective, environmental beneficial and limit dependence on foreign
imports (particularly for the critical raw materials such as rare earths). Although, it is feasible to
reduce the DMC of metals, this can only be done to a certain extent. While the baseline scenario
does not expect DMC of metallic ores to increase, metals are crucial for EU’s competitiveness in
the global trade of machinery, transport equipment and clean technologies. In order to maintain
the EU’s global trade position, domestic demand and exports should not be compromised by
limits in DMC, but rather in improvement of material productivity. It would therefore seem
pertinent to decrease domestic material input (DMI) by increasing recycling and resource
efficiency of metals. The potential of recycling, waste prevention and ecodesign has initially been
81 Halberg, N., Knudsen, M.T., Alrøe, H.F. and Kristensen, E.S., eds. (2006) Global Development of Organic Agriculture:
Challenges and Promises. CABI Publishing.
Scenario analysis
Assessment of resource efficiency indicators and targets | 93
estimated to be between 50 and 130 Mt of the DMC of metallic ores82. This represents about 20%
to 45% reductions of metal DMC compared to the year 2000. In the years leading up to 2050,
these material savings might not lead to an actual reduction of DMC. DMC of metals could
actually instead increase. In order to achieve the target for reductions in GHG emissions and
energy consumption, metals are required for the construction and production of energy efficient
infrastructure and products, and renewable energy installations such as windmills and biogas
plants. Once the new energy infrastructure is in place, it would possibly be able to reduce DMC.
Construction minerals
Construction minerals (even excluding sand and gravel) constitute the majority of DMC of all
non-metallic minerals. A recent study investigated the material input flows related to EU-27
transportation infrastructure and built-up areas83. A large share of the construction materials are
needed just to maintain the existing building stock and infrastructure. The shares of the input
flows needed for replacement at end-of-life are estimated at about 63-90% for the
transportation network and 88% for buildings. The study concluded that the materials flows
related to maintenance and renewal of existing stocks are much larger than the ones related to
infrastructure expansion. The estimates of the amounts of construction and demolition (C&D)
waste generated in the EU are not very reliable, but even when taking the high estimate of C&D
waste (approx. 1700 Mt) the current demand for construction minerals (2300 Mt) in the EU
cannot be satisfied even with 100% recycling84. Applying the full potential of C&D waste
recycling, only 25% of current construction mineral DMC could be reduced. But again, similar to
DMC of metals, the investment in energy efficiency and renewable technologies will also increase
the demand for construction minerals over the next decades.
If DMC of non-metallic minerals is to be reduced further as proposed in the previous chapter,
solutions for maintaining the current built stock have to be found. Significant increases in the use
of biomass and metals as substitutes for construction materials do not seem to be feasible with
the expected demands for bioenergy and metals. Substituting construction minerals with wood
may be a sustainable approach to construction (wood is an excellent sink for carbon emissions),
but this will not contribute to reducing the overall DMC. Solutions for reducing non-metallic
mineral DMC will have to include stabilising (and maybe even reducing) the built stock, extensive
recycling, increasing the density of urban areas and improving large scale planning. No evidence
was found concerning to what extent renovation of infrastructure could be less material
intensive. It is however believed that better planning of infrastructure maintenance could
significantly reduce DMC of construction minerals. Just consider how much materials are dug
away every time an electricity cable has to be replaced.
As it is not very clear how DMC of non-metallic minerals can be reduced, one could question
whether it is appropriate to set a target based on this indicator. Compared to other materials the
environmental impacts of many construction minerals (such as sand, gravel and clay) are minor
82 BIO Intelligence Service, VITO and the Institute for Social Ecology (2011) Analysis of the key contributions to
resource efficiency. Study commissioned by the European Commission, DG Environment. 83 BIO Intelligence Service (2011) Large Scale Planning and Design of Resource Use. Study commission by the
European Commission (DG ENV). 84 It must be noted that in general, the estimates for the use of construction minerals are not very reliable.
Scenario analysis
94 | Assessment of resource efficiency indicators and targets
even when considering their large quantities that are used. Furthermore, the demand for
construction minerals may increase in the next decades in order to achieve the targets for energy
efficiency of buildings (e.g. increased insulation) and to build new infrastructure for renewable
energy plants (e.g. wind, solar, biogas, etc).
5.2.4 Land use
It is evident that without greater yields, it will not be possible to increase biomass production
without land use change. Artificial land is currently increasing at the expense of agricultural land.
Although artificial land only constitutes less than 5% of the total land area in the EU, increases of
artificial land use drives the consumption of construction materials and has significant negative
impacts on the environment (e.g. soil sealing and fragmentation of natural habitats).
A major challenge to achieving the proposed target of limiting the increase of artificial land is
that the construction sector is currently very closely linked with economic growth. Many
measures to boost economic activity are related to the construction of new infrastructure. This is
beneficial for the economy on the long term, but often happens at the expense of agricultural or
natural land areas. Limiting net take of artificial land is possible, but will require densification of
existing built-up land, and/or remediation and reconversion of artificial land to natural land.
The EU is capable of being self-sufficient in biomass, but the target for land use should not
compromise the competitive advantage of growing crops in the biogeographic regions that are
most productive and best suited from a sustainability perspective. The proposed target for zero
net demand of foreign land must be carefully considered in this respect. The necessary change to
a less animal based and in season locally sourced diet could support this target.
5.2.5 Water use
The increase in demand of bioenergy will certainly also increase the need for irrigation. Water
availability depends on local conditions, but climate change may also have significant effects. At
an overall EU level it is difficult to assess what consequences the proposed resource use targets
will have on water stress. A major issue is good water use data to actually monitor the efficient
use of water. Several regions and countries in the EU do experience severe water stress, but it is
generally believed that it is possible to reduce the demand for freshwater through better
measuring and resource efficient practices85. It is therefore assumed that the water use targets
can ensure that all regions have sufficient water resources available.
85 BIO Intelligence Service (2011) Water saving potential in agriculture in Europe: findings from the existing studies and
application to case studies. Study commissioned by the European Commission, DG Environment
Scenario analysis
Assessment of resource efficiency indicators and targets | 95
5.3 Summary of findings from the target scenario
analysis
Table 15 presents an overview of the project team’s assessment of the feasibility of achieving
resource use targets for 2020 and 2050. It should be noted that the modelling and analysis
performed in the study is crude and makes many assumptions on the projections of resource use
and their links, cost-effectiveness and the diffusion of resource efficient technologies.
There is evidence that the EU can achieve an almost fully renewable energy based supply by
2050 and maintain the current activity levels. This would require a 40% decrease in energy
consumption compared to current levels. Bioenergy will be the main renewable energy source
(at least until the other renewable energy sources have developed fully). The EU can potentially
meet 70% of its primary energy demand through domestic bioenergy production, but this
would require significant increases in yields, diet changes and use of biowaste as an energy
source.
A reduction in domestic material consumption of fossil fuels is a consequence of the GHG
emission reduction target. Until 2050, it is not clear whether reductions in metal consumption
can also be achieved while maintaining current activity levels. Although recycling and other
approaches to increasing material productivity do result in reduced demand for metal ore
extraction, there will be a need for these materials to build new products and infrastructure
suited for a low carbon economy. Biomass material consumption could potentially be
stabilised but again this is dependent on diet changes and the treatment of biowaste.
It is unlikely that it is possible to reduce the consumption of non-metallic minerals (even with
increased recycling) as these are needed to maintain current buildings and infrastructure and
their demand might increase with greater demand for energy efficient buildings and new
infrastructure for renewable energy sources.
Thanks to its climate and soils, the EU could potentially be self sufficient in biomass
production with a shift to a less animal based diet and crops that are suited for the region
and seasons. Consideration should however be given to maintain (intensive) crop production in
the regions of Europe and the world that are most suited. An important learning from the EU’s
biofuel target is the importance of defining clear sustainability criteria for bioenergy in order not
to cause unintended negative impacts on land use change, climate change and biodiversity.
Water use is expected to increase with growing demand for bioenergy in the EU, but it is
assumed that if the use of water is better monitored, the demand can be reduced through
water efficient technologies and practices.
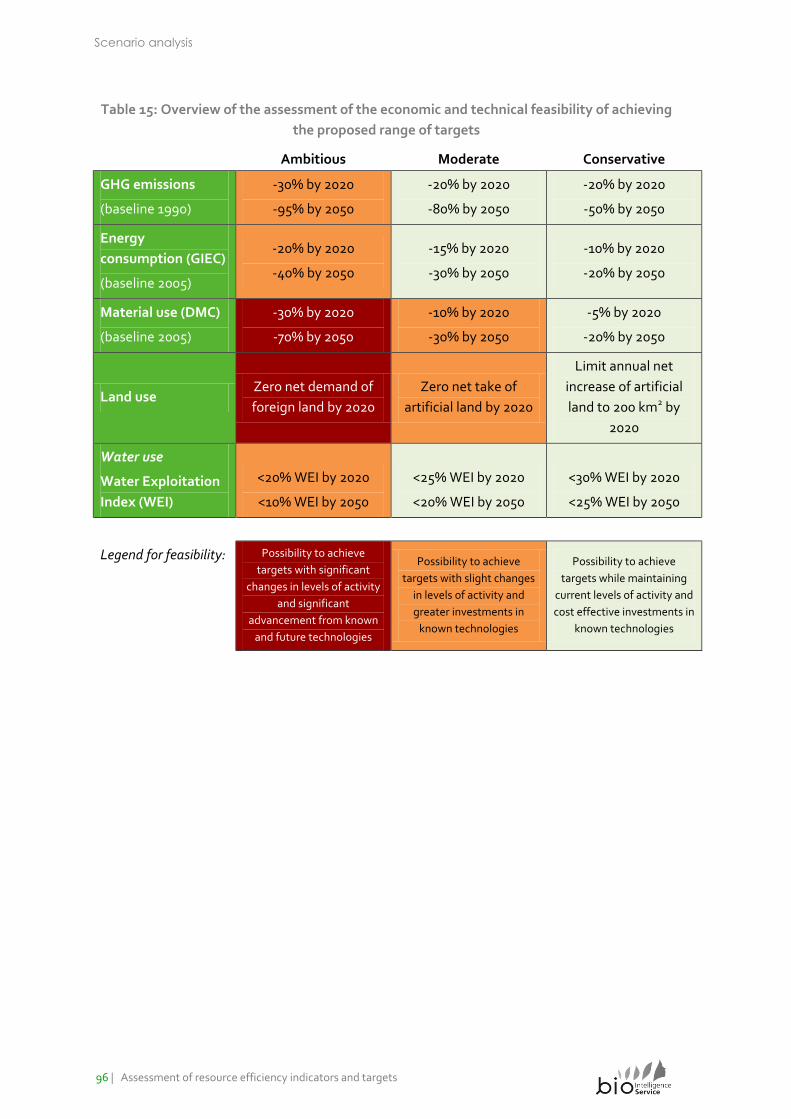
Scenario analysis
96 | Assessment of resource efficiency indicators and targets
Table 15: Overview of the assessment of the economic and technical feasibility of achieving
the proposed range of targets
Ambitious Moderate Conservative
GHG emissions
(baseline 1990)
-30% by 2020
-95% by 2050
-20% by 2020
-80% by 2050
-20% by 2020
-50% by 2050
Energy
consumption (GIEC)
(baseline 2005)
-20% by 2020
-40% by 2050
-15% by 2020
-30% by 2050
-10% by 2020
-20% by 2050
Material use (DMC)
(baseline 2005)
-30% by 2020
-70% by 2050
-10% by 2020
-30% by 2050
-5% by 2020
-20% by 2050
Land use Zero net demand of
foreign land by 2020
Zero net take of
artificial land by 2020
Limit annual net
increase of artificial
land to 200 km2 by
2020
Water use
Water Exploitation
Index (WEI)
<20% WEI by 2020
<10% WEI by 2050
<25% WEI by 2020
<20% WEI by 2050
<30% WEI by 2020
<25% WEI by 2050
Legend for feasibility: Possibility to achieve
targets with significant
changes in levels of activity
and significant
advancement from known
and future technologies
Possibility to achieve
targets with slight changes
in levels of activity and
greater investments in
known technologies
Possibility to achieve
targets while maintaining
current levels of activity and
cost effective investments in
known technologies
Recommendations
Assessment of resource efficiency indicators and targets | 97
Chapter 6: Recommendations: Moving forward
with existing indicators
This chapter provides the Commission with the project team’s recommendations for setting
resource use and resource efficiency targets.
6.1 The next steps for setting targets
The European Commission has made it clear in its Europe 2020 strategy which direction that the
EU should be moving. Indicators and targets are important tools to guide, coordinate and
encourage progress in the right direction. This study has proposed a framework of indicators that
can help the Commission in its efforts towards a resource efficient, low-carbon economy.
Although the study has demonstrated that many of the available indicators desperately need to
be improved or developed further, this should not deter the Commission in continuing their work
by discussing and considering possible resource use and resource efficiency targets. There is too
much at stake to wait for a perfect set of indicators. Many of proposed indicators can already be
adopted for use in resource policy development. In the case of limitations, other supporting
indicators and experts should be consulted.
6.1.1 Further development and implementation of
indicators
This study developed a basket of indicators to be used by the European Commission in the
context of the Resource Efficiency Roadmap and other resource policy processes. On the one
hand, the basket contains indicators, which are available in the short term (1 year) and could be
readily applied already from 2012. On the other hand, the suggested global resource demand
indicators are currently being developed and refined or newly introduced in this study. In the
following, the main areas for further development are summarised and specific
recommendations are provided regarding priorities in the field of indicator development and
application.
6.1.1.1 Resource use embodied in trade
The domestic environmental pressures within EU borders are well represented in all of the
suggested indicators of the basket. However, with increasing globalisation and international
trade, the inclusion of resource use embodied in internationally traded products becomes ever
more important for a directionally-safe interpretation of trends in European resource use and
efficiency.
Recommendations
98 | Assessment of resource efficiency indicators and targets
Further develop and harmonise different methodological approaches to
calculate resource use embodied in international trade of the EU-27 and EU MS
and expand and refine databases allowing this calculation:
Support the development of global, multi-regional input-output
frameworks extended by resource use data on the level of economic
sectors and product groups, in particular regarding the
disaggregation of resource-intensive economic sectors as well as
the production of time-series.
Support the further development of approaches applying resource
intensity coefficients on the product level derived from Life Cycle
Assessments (LCA), in particular regarding the geographical and
temporal specifications of such resource intensity coefficients of
traded products.
Support the development and testing of hybrid approaches
combining the mutual advantages of the two basic alternatives, i.e.
using coefficient approaches where a high product detail is required
(e.g. imports of different metal ores from various countries outside
the EU) and input-output approaches for higher-manufactured
products, which are more homogeneous regarding their material
composition and very time-consuming to assess with LCA.
6.1.1.2 Indicators on environmental impacts of resource use
In the past years, several indicators have been presented, which aim at quantifying the different
environmental impacts related to human resource use. Those indicators are still in the stage of
development and have only been tested with data for a few years or a few countries.
Further strengthen and test currently developed methodologies and improve
the underlying data bases for their calculation:
Support the improvement of the LCA-based impact factors for
different resources, in particular in the context of the JRC-based
European Life Cycle Database (ELCD). This concerns especially the
geographical specification of impacts according to countries outside
Europe, where the environmental impacts take place as well as the
development of time-series of impact factors, in order to reflect
technological improvements.
Ensure that the “Resource Life Cycle Indicator” developed by JRC is
further expanded in its scope, e.g. through inclusion of more than
the current 15 main traded product groups and the consideration of
more representative products within each of the selected product
groups.
Recommendations
Assessment of resource efficiency indicators and targets | 99
6.1.1.3 Indicators on impacts on ecosystems and biodiversity
The area of global resource demand, environmental impact-oriented indicators for the resource
category of land use was the only area, for which no specific indicator could be suggested in the
basket. Indicators covering those aspects of land cover and land use change are only currently
being developed.
Support the development of approaches to link land cover and land use change
to indicators on ecosystem quality and biodiversity, such as the Land and
Ecosystem Accounts (LEAC) by the EEA.
Support the further refinement of methodologies which enable assessing the
impacts of European production and consumption on ecosystems in other world
regions, such as embodied HANPP (eHANPP).
6.1.1.4 Indicators on the natural capital stock
This project focused on indicators, which reflect the flows of resources (materials, energy, water)
plus the issue of land use. Indicators illustrating the developments of natural capital stocks were
beyond the scope of this study. However, they are of crucial importance for assessing issues such
as overexploitation and resource scarcity. The main barrier for integrating such indicators into an
indicator system as proposed in this study is the still very limited data situation concerning both
non-renewable resource stocks (e.g. mineral resources) and stocks of biomass (e.g. forestry
stocks, carbon stocks, stocks of natural habitats).
Refine and harmonise methodologies to account for natural capital stocks, for
example, in the context of the upcoming revision of the SEEA system of
integrated environmental and economic accounts.
Support the collection and validation of data on the Member State and EU level
on both reserves of non-renewable resources (metal ores, industrial and
construction minerals) and stocks related to biomass and ecosystems.
6.1.1.5 Level 2 indicators
This study introduced a system of two levels for monitoring European resource use and
efficiency: a top level with headline indicators plus a second level with more detailed indicators
within each resource category. The further refinement and testing of the level 2 indicators was
beyond the scope of this study.
Refine the understanding of the interlinkages between level 1 and level 2
indicators
Analyse the influence of specific level 2 indicators on the overall
trend of the corresponding level 1 indicator, in order to set priorities
for policy action to improve the overall trend.
Test the suitability of level 2 indicators for target setting
accompanying the level 1 headline indicators and targets. This
Recommendations
100 | Assessment of resource efficiency indicators and targets
includes for example targets for material efficiency or GHG intensity
of specific economic sectors, targets for maximum waste
generation, or targets limiting specific environmental impacts from
resource use (e.g. acidification or ozone depletion).
Support the further development of specific level 2 indicators, which are not yet
available. Those indicators include:
Waste reduction, e.g. food waste
Recycling indicators
Water indicators such as water use by water source and water
scarcity by region
Soil indicators
6.1.1.6 Response indicators
Response indicators illustrate the action taken by policy, business or the civil society to improve
current trends in European resource use and efficiency. This study only briefly touched on the
issue of response indicators and a deeper understanding of the impacts of responses on certain
categories of resource use is still missing.
Develop methodologies to better assess the impacts of (policy) responses (e.g.
environmental taxes, R&D spending in eco-innovation areas, subsidies for
resource-efficient technologies, etc.) on resource quantities and related
environmental impacts, in order to prioritise policy and business action.
Include resource use and resource efficiency indicators as key indicators in EU
environmental assessment methodologies, which should ensure that the
implications of policy decisions on resource use and resource efficiency are taken
into account before the actual decisions are made.
6.1.2 Develop the knowledge base for impact assessments
Based on existing targets on climate change, renewable energy and energy consumption, this
study proposed an extensive set of possible resource use related targets for EU-27 for 2020 and
2050. The use of resources are closely linked. The analysis of the target scenarios showed to what
extent (non-energy related) resource use can be more sustainable in the EU. The analysis made it
clear that not all of the proposed targets are suitable for policy purposes. Only the level 1
indicators was assessed for target setting in this study. Many of these indicators provide an
overview for general resource efficiency trends, but often the more specific level 2 indicators are
more suitable for setting targets, e.g. recycling of critical raw materials instead of DMC of sand
and gravel.
Multi-return strategies – investigate how improving resource efficiency for
several resources at the same time can be achieved through focused policy
interventions
Recommendations
Assessment of resource efficiency indicators and targets | 101
Methodologies to better assess the impacts of (policy) responses (e.g.
environmental taxes, R&D spending in eco-innovation areas and subsidies for
resource-efficient technologies) on resource quantities and related
environmental impacts, in order to prioritise policy and business action, e.g.
marginal abatement curves for resource use
Build-up the policy “business case” – find socio-economic evidence to justify
setting a target, when the scientific evidence on the environmental rational is
missing, e.g. emphasise the benefits of securing supply and competitiveness
6.1.3 Involve external actors and stakeholders in the
process of target setting
An approach to the target setting process is to arrange open multi-party debates where
representatives of the main stakeholders are brought together to define concrete objectives and
plan of actions. Extensive consultation allows all viewpoints to be heard on an equal level and is a
good starting point for building consensus. It is therefore recommended to develop the
following:
Communication of indicators - rethink how the indicators could be better
communicated and more easily understood by everybody. Many of the current
resource related indicators use confusing language and terms, e.g. embodied
water, actual land demand and virtual footprint. Consider renaming or
harmonising the terminology.
Establish open multi-party debates - extensive consultation allows all viewpoints
to be heard on an equal level and is a good starting point for building consensus.

6 February 2012
20-22 Villa Deshayes 75014 Paris
+ 33 (0) 1 53 90 11 80 biois.com