Assessment of reliability of the hydrometer by examination ...
5
Proceedings of the first Southern African Geotechnical Conference - Jacobsz (Ed.) © 2016 Taylor & Francis Group, London, ISBN 978-1-138-02971-2 Assessment of reliability of the hydrometer by examination of sediment PR. Stott, PK. Monye & E. Theron Central University of Technology, Bloemfontein. South Aji'ica ABSTRACT: A fundamental aspect of the characterization of any soil is the assessment of its particle size distribution. While this is relatively easy for the coarse fraction it remains problematic for soil fines particularly for the fraction less than 2μm. Hydrometer analysis has been the standard tool for fines assessment for many years but there may be serious shortcomings. Nettleship et al. (1997), Savage (2007), Rodrigues et al. (2011) and many others have pointed to a number of problems facing the hydrometer. Some of the questions have been addressed by laser scattering techniques e.g. Eshel et al. (2004), but oth - ers, including completeness of dispersion and the amount of clay carried down with coarser fractions remain problematic. This investigation assesses some aspects of the reliability of the hydrometer by isolat- ing and testing the sand and silt fractions after settlement. Microscopic examination is used to compare the composition of sediment layers with that expected according to hydrometer theory. INTRODUCTION Hydrometer analysis is widely used internationally for determination of the clay and silt fraction of soils in both engineering and soil science practice. The standard procedure used in South Africa for Civil Engineering purposes is detailed in SANS 3001 GR3 (SABS 2012). The test has a number of theoretical weaknesses. It monitors the change in density of a settling suspension- theoretically at one level in the suspension. It has been pointed ou t, however, (e.g. Rolfe et al. 1960) that it averages the specific gravity over the submerged part of the instrument and therefore depends on the shape and depth of hydrometer submergence, which may bring errors into the analysis. Others (e.g. Savage 2007) have noted that hydrometer analysis relies on Stokes law (which assumes all particles to be spherica l); it assumes that all soil particles have the same density; it assumes complete dispersion of clay particles at the time of testing; and it assumes that fine particles are not carried down by coarse particles- all of which assumptions are dubious. Nettleship et al. (1997) suggested that hydrolysis of polyphosphate disper- sants may cause underestimation of clay fraction. Rodrigues et al. (2011 ) proposed that soil miner- alogy should be taken into account and probably different treatments and different dispersants are required for different clay types. In addition Keller and Gee (2006) noted that hydraulic soil property estimates work best for coarse-textured, structure- less soils of low clay content. One of the most problematic aspects of South African soils (from an insurance claims point of 28 1 view, from the point of view of frustration to the government's attempts to provide durable low-cost housing to the poor, and from the point of view of several aspects of the performance of roads, water supply conduits, etc.), is the behaviour of expan- sive clay. Most of the methods for predicting the severity of heave which may be expected on a si te under- lain by fine-textured soil rely on an estimate of clay fraction. As noted above by Keller and Gee, clay is the so il material which is least amenable to hydrau- lic methods of analysis, and hydrometer results can be expected to be particularly unreliable for these most problematic soils. Critical aspects of soil behavior depend on clay mineral content rather than particle size as given by the hydrometer test. It is assumed that clay par- ticles range from 2 microns downward, and that particles larger than 2 microns are silt. There are, however, some clays whose particles can be con- siderably larger than 2 microns (e.g. kaolinite, illite and halloysite) also silt particle sizes may range down to I micron. The range of sizes between approximately I and 2 microns may therefore be mineralogically either clay or silt. Stott and Theron (2016) examined suspensions after preparation for hydrometer testing following the procedures of SANS 3001 GR3. The suspen- sions were examined using a light microscope/digital camera combination. They found three aspects of incomplete dispersion which suggested that unre- liable results might be obtained by hydrometer analysis. The first was adhesion of clay to larger- sized particles, the second was agglomeration of clay particles among themselves and the third was
Transcript of Assessment of reliability of the hydrometer by examination ...

Proceedings of the first Southern African Geotechnical Conference - Jacobsz (Ed.) © 2016 Taylor & Francis Group, London, ISBN 978-1-138-02971-2
Assessment of reliability of the hydrometer by examination of sediment
PR. Stott, PK. Monye & E. Theron Central University of Technology, Bloemfontein. South Aji'ica
ABSTRACT: A fundamental aspect of the characterization of any soil is the assessment of its particle size distribution. While this is relatively easy for the coarse fraction it remains problematic for soil fines particularly for the fraction less than 2µm. Hydrometer analysis has been the standard tool for fines assessment for many years but there may be serious shortcomings. Nettleship et al. (1997), Savage (2007), Rodrigues et al. (2011) and many others have pointed to a number of problems facing the hydrometer. Some of the questions have been addressed by laser scattering techniques e.g. Eshel et al. (2004), but others, including completeness of dispersion and the amount of clay carried down with coarser fractions remain problematic. This investigation assesses some aspects of the reliability of the hydrometer by isolating and testing the sand and silt fractions after settlement. Microscopic examination is used to compare the composition of sediment layers with that expected according to hydrometer theory.
INTRODUCTION
Hydrometer analysis is widely used internationally for determination of the clay and silt fraction of soils in both engineering and soil science practice. The standard procedure used in South Africa for Civil Engineering purposes is detailed in SANS 3001 GR3 (SABS 2012). The test has a number of theoretical weaknesses. It monitors the change in density of a settling suspension- theoretically at one level in the suspension. It has been pointed out, however, (e.g. Rolfe et al. 1960) that it averages the specific gravity over the submerged part of the instrument and therefore depends on the shape and depth of hydrometer submergence, which may bring errors into the analysis.
Others (e.g. Savage 2007) have noted that hydrometer analysis relies on Stokes law (which assumes all particles to be spherical); it assumes that all soil particles have the same density; it assumes complete dispersion of clay particles at the time of testing; and it assumes that fine particles are not carried down by coarse particles- all of which assumptions are dubious. Nettleship et al. (1997) suggested that hydrolysis of polyphosphate dispersants may cause underestimation of clay fraction. Rodrigues et al. (2011) proposed that soil mineralogy should be taken into account and probably different treatments and different dispersants are required for different clay types. In addition Keller and Gee (2006) noted that hydraulic soil property estimates work best for coarse-textured, structureless soils of low clay content.
One of the most problematic aspects of South African soils (from an insurance claims point of
28 1
view, from the point of view of frustration to the government's attempts to provide durable low-cost housing to the poor, and from the point of view of several aspects of the performance of roads, water supply conduits, etc.), is the behaviour of expansive clay.
Most of the methods for predicting the severity of heave which may be expected on a si te underlain by fine-textured soil rely on an estimate of clay fraction. As noted above by Keller and Gee, clay is the soil material which is least amenable to hydraulic methods of analysis, and hydrometer results can be expected to be particularly unreliable for these most problematic soils.
Critical aspects of soil behavior depend on clay mineral content rather than particle size as given by the hydrometer test. It is assumed that clay particles range from 2 microns downward, and that particles larger than 2 microns are silt. There are, however, some clays whose particles can be considerably larger than 2 microns (e.g. kaolinite, illite and halloysite) also silt particle sizes may range down to I micron. The range of sizes between approximately I and 2 microns may therefore be mineralogically either clay or silt.
Stott and Theron (2016) examined suspensions after preparation for hydrometer testing following the procedures of SANS 3001 GR3. The suspensions were examined using a light microscope/digital camera combination. They found three aspects of incomplete dispersion which suggested that unreliable results might be obtained by hydrometer analysis. The first was adhesion of clay to largersized particles, the second was agglomeration of clay particles among themselves and the third was

agglomeration of clay and silt particles into groups of appreciable size. They speculated that these agglomerations would not precipitate at the rate expected for clay and would therefore give misleading results in hydrometer analysis.
The objective of the investigation here described is to evaluate the hydrometer test for assessing typical South African clayey soi ls in light of the above objections.
2 METHODS AND MATERIALS
2. 1 Soil samples and rreatments
A range of plastic clays from typical roads and housing projects were tested. Samples were treated with Sodium Hexametaphosphate and Sodium Carbonate as per SANS 3001-GR3. For control purposes examination of untreated samples were considered to serve as a check on the e!Tectiveness of the dispersant for each soil. Preliminary tests, however, showed that without treatment in dispersant, agglomerations are so large that meaningful information would not be obtained.
Samples were prepared in accordance with SANS 3001-GR3:2012. After being soaked in dispersant solution for not less than the prescribed minimum of 16 hours they were mechanically stirred at 1570 rpm for a minimum of 15 minutes and transferred to a settlement container specifically designed for this investigation. Distilled water was added to reach the dilution indicated in SANS 3001 GR3.
Samples were left to settle for approximately two days, excess water was carefully removed by a suction pipe. Containers were then transferred to an oven and dried at 45°C until the sediment was solid enough to be removed from the containers. The various fract ions, which were usually visually distinct, were separated. SANS 3001 GR3 is concerned primarily with determining sand and silt fraction and the last reading which is given as normal is 12 minutes. The sub 2µm fraction can be deduced by subtraction. An option! final reading at 12h is mentioned if a reading is required for the sub 2µm fraction. The clay topping was treated simply as a protective layer to shield the silt layers from disturbance while removing water from the container and was not examined. The separated layers were prepared for microscopic examination by the addition of de-ionised water.
2.2 Settlement container
A settlement container was designed to be waterproof while having one side removable for the extraction of settled samples. Figure I shows two
282
of these containers, one before closure, the other with water seal and front cover in place.
2.3 Microscopic examination
An optical microscope with !Ox, 40x, 60x and lOOx objectives was used for this investigation. The microscope was equipped with a 9 mega-pixel digital camera.
The combined optical and digital magnification was assessed by measurements on a micro ruler. Magnification can be expressed in various ways. For example the spacing between I 0 micron graduations on the micro ruler was 60 mm on the viewing screen when using the 60x objective, indicating a magnification of 6000 times. Alternatively the magnification can be expressed as the number of pixels per micron (22.48 for the same objective). The most useful way of indicating magnification is by the inclusion of a scale on photographic results. All photographs shown here have a scale rectangle 30µm x 2µm.
After removal of sediment from the container and separation of the visible layers, small samples of each layer were suspended in de-ionised water. A drop of that suspension was placed on a meticulously cleaned microscope slide and covered with a similarly cleaned cover slip. Photographs were taken of samples before and after addition of methylene blue.
Figure I. Settlement containers: 430 x 50 x 20mm: 0.43f.
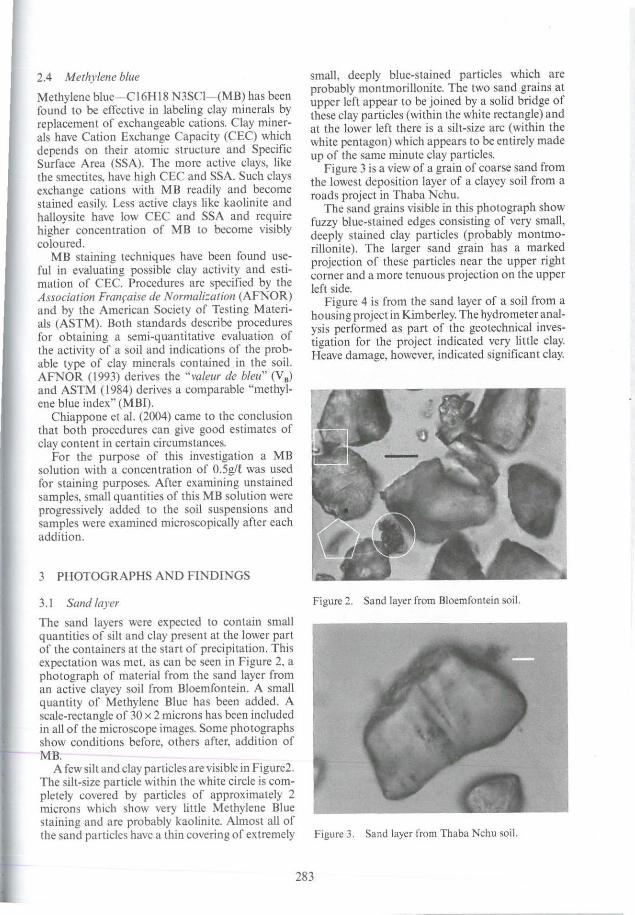
2.4 Methylene blue
Methylene blue- Cl6Hl8 N3SC1- (MB) has been found to be effective in labeling clay minerals by replacement of exchangeable cations. Clay minerals have Cation Exchange Capacity (CEC) which depends on their atomic structure and Specific Surface Area (SSA). The more active clays, like the smectites, have high CEC and SSA. Such clays exchange cations with MB readily and become stained easily. Less active clays like kaolinite and h'.111oysite have lo:"' CEC and SSA and require higher concentrauon of MB to become visibly coloured.
MB staining techniques have been found useful !n evaluating possible clay activity and estimation of CEC. Procedures are specified by the Association Fran(:aise de Normali:ation (AFNOR) and by the American Society of Testing Materials (ASTM). Both standards describe procedures for obtaining a semi-quantitative evaluation of the activity of a soil and indications of the probable type of clay minerals contained in the soil. AFNOR (1993) derives the "valeur de bleu" (V) and ASTM (1984) derives a comparable "methyiene blue index" (MBI).
Chiappone et al. (2004) came to the conclusion that both procedures can give good estimates of clay content in certain circumstances.
For the purpose of this investigation a MB solutio.n .with a concentration of 0.5g/t was used for stammg purposes. After examining unstained samples, small quantities of this MB solution were progressively added to the soil suspensions and samples were examined microscopically after each addition.
3 PHOTOGRAPHS AND FINDINGS
3.1 Sand layer
The sand layers were expected to contain small quantities of silt and clay present at the lower part of the containers at the start of precipitation. This expectation was met, as can be seen in Figure 2, a photograph of material from the sand layer from an active clayey soil from Bloemfontein. A small quantity of Methylene Blue has been added. A scale-rectangle of 30 x 2 microns has been included in all of the.1'.1icroscope images. Some photographs show cond1t1ons before, others after, addition of MB.
A few ~ilt and ~lay particles are visible in Figure2.
small, deeply blue-stained particles which are probably montmorillonite. The two sand grains at upper left appear to be joined by a solid bridge of these clay particles (within the white rectangle) and at the lower left there is a silt-size arc (within the white pentagon) which appears to be entirely made up of the same minute clay particles.
Figure 3 is a view of a grain of coarse sand from the lowest deposition layer of a clayey soil from a roads project in Thaba Nchu.
The sand grains visible in this photograph show fuzzy blue-stained edges consisting of very small, d.eepl~ stained clay particles (probably montmonllonite). The larger sand grain has a marked projection of these particles near the upper right corner and a more tenuous projection on the upper left side.
Figure 4 is from the sand layer of a soil from a housing project in Kimberley. The hydrometer analysis performed as part of the geotechnical investigation for the project indicated very little clay. Heave damage, however, indicated significant clay.
Figure 2. Sand layer from Bloemfontein soil.
The s1lt-s1ze particle within the white circle is compl~tely cove:ed by particles of approximately 2 rru~r<;>ns which show very little Methylene Blue stammg and are probably kaolinite. Almost all of the sand particles have a thin covering of extremely Figure 3. Sand layer from Thaba Nchu soil.
283

Figure 7. Coarse silt layer, Bloemfontein soil.
Figure 8. Coarse slit layer of Bloemfontein soil.
agglomerations precipitate more slowly than single particles of similar size.
3.3 Fine sift fayer
Figure 10 shows the fine silt layer from the Bloemfon tein soil of Figures 6,7 and 8. The agglomerations are again larger than the clean silt particles. Some fine silt particles appear to be fully coated with very fine, deeply stained clay particles. Some of the agglomerations appear to be clay particles with no silt core, the largest agglomerations probably do have silt cores. Genuine fine silt particles do not appear to make up the majority of the material present.
285
Figure 9. Coarse silt layer of Thaba Nchu soil.
Figure 10. Fine silt layer of Bloemfontein soil.
Figure 11 is a photograph from the fine silt layer of a soil from Wepener in the Free State. A large part of this layer appears to be made up of agglomerations of clay without silt cores.
Many of these agglomerations appear to be tenuous sting-like structures, in some cases up to IOOµm long. Observation of their movement under the microscope suggests that their bonds, though flexible enough to allow them to bend easily, are strong enough to hold the structures together robustly.
The silt particles present are completely coated by fine, high CEC/SSA clay which is deeply stained by the small quantity of methylene blue added to the suspension. A large proportion of the material appears to be clay.

Figure 11. Fine silt layer: Wepener soil.
4 CONCLUSIONS
The investigation tends to confirm the widely held view that hydrometer analysis is not always reliable. particularly for high clay-content soils. A number of the queries raised by Savage (2007) can be seen to be justified. The photographs generally indicate relatively few free clay particles in the sand layer but a noticeable increase in the silt layers. The fine silt layer has generally more free clay particles than the coarser layers (Figures I 0 and 11 ), suggesting that smaller particles may be more effective in carrying clay particles down with them than large particles.
Almost all sand and silt particles were seen to have at least a few a ttached clay particles. The coating of clay noted in the sand-layer was generally quite thin in comparison with the size of the sand grains and therefore unlikely to make up a large fraction of the material in this layer. Hydrometer analysis might therefore be expected to give an acceptable assessment of the sand fraction in many cases.
The silt layers, on the other hand were frequently found to be made up of agglomerations of fine sill and clay, or in some cases, of clay alone. These agglomerations were frequently larger than the bare particles of the host layers, suggesting that the agglomerations settle more slowly than single particles of their aggregate size, but more quickly than the individual small particles of which they are made.
In the analysis of high clay content soils it seems likely that the hydrometer will over-estimate the amount of silt to a considerable extent. Consequently the clay content will almost always be under-estimated.
REFERENCES
Chiappone, A. Marello, S. Scavia, C. & Setti, M. 2004. Clay mineral characterization through the methylene blue test: comparison with other experimental techniques and application of the method. Canadian Geotechnical Journal Dec. 2004; 41, 6; ProQuest Centml pp. 1168- 1178.
Eshel, G. Levy, G.J. Mingelgrin. U. & Singer, M.J (2004). Critical evaluation of the use of laser diffraction for particle-size distribution analysis. Soil Science Society of America Journal: 68:736-743(2004).
Keller. J.M & Gee, G.W. 2006. Comparison of ASTM and SSA Methods for Particle-Size Analysis. Soil Science Society of America Journal; Jul/Aug 2006; 70, 4; ProQuest Cemral pp. 1094- 1100.
Nettleship, l. Cisko, L. & Vallejo, L.E. 1997. Aggregation of clay in the hydrometer test. Canadian Geoteclmical Joumal 34:621--026 ( 1997).
Rodrigues. C. de Oliveira. V.A. da Silveira. P.M. & Santos, G.G. 20 11. Chemical Dispersants and Pre-Treatments to Determine Clay in Soils with Different Mineralogy. Journal of the Brasilian Society of Soil Science. Vol 35. No.5. 2011, pp.1589- 1596, 2011 Brasil. Available online at h11p://www.redalyc.org.
Rolfe, B.N. Miller, R.F. & McQueen, I.S. 1960. Dispersion Characteristics of Montmorillonite, Kaolinite, and Illite Clays in Waters of Varying Quality, and Their Control with Phosphate Dispersants. Geological S urrey Professiona l Paper 334-G US. Government Printing Office In cooperation 1vi1h Colorado State Unfrersity. Washington, 1960.
SABS. 2011 . Civil Engineering Test M erhods. Part GR3. Sourh Africa11 National S tandard SANS 3001:2011 Edition I . I. Pretoria: South African Bureau of Standards.
Savage, P.F. 2007. Evaluation of possible swelling potential of soil. Proceedings of rhe 26th South African Tra11.1pol'I Conference ( SATC 2007). 9- 12 July 2007. Pretoria: DTI.
Stott , P.R. & Theron, E. 2016. Shortcomings in the estimation of clay fraction by Hydrometer. Journal of the Sowh African !11s1itutio11 of Civil Engineering (in prim).
286