Assessment of Health Star Rating calculator options and ...
26
Assessment of Health Star Rating Calculator Options and Alignment with Dietary Guidelines a paper developed by the Food Regulation Standing Committee Health Star Rating Review Implementation Working Group Executive summary Background The Australia and New Zealand Ministerial Forum on Food Regulation (the Forum) agreed at the launch of the Health Star Rating (HSR) system that a formal review be done after five years of implementation. Overall, the Forum was supportive of the recommendations outlined in the Health Star Rating System Five Year Review Report (Review Report), noting that some recommendations were supported in principle subject to additional work and/or available funding. The Forum requested advice on whether the alternative approaches considered in the Review Report for total sugars and sodium achieves an outcome that more closely aligns the HSR system with Dietary Guidelines and provides incentive for reformulation. Dietary Guidelines here refer to both the Australian Dietary Guidelines and the Eating and Activity Guidelines for New Zealand Adults.
Transcript of Assessment of Health Star Rating calculator options and ...

Assessment of Health Star Rating
Calculator Options and Alignment
with Dietary Guidelines
a paper developed by the
Food Regulation Standing Committee
Health Star Rating Review Implementation
Working Group
Executive summary
Background
The Australia and New Zealand Ministerial Forum on Food Regulation (the Forum) agreed at
the launch of the Health Star Rating (HSR) system that a formal review be done after five
years of implementation. Overall, the Forum was supportive of the recommendations outlined
in the Health Star Rating System Five Year Review Report (Review Report), noting that some
recommendations were supported in principle subject to additional work and/or available
funding.
The Forum requested advice on whether the alternative approaches considered in the Review
Report for total sugars and sodium achieves an outcome that more closely aligns the HSR
system with Dietary Guidelines and provides incentive for reformulation. Dietary Guidelines
here refer to both the Australian Dietary Guidelines and the Eating and Activity Guidelines
for New Zealand Adults.

Approach
To provide advice back to the Forum, the following HSR calculator options were assessed:
HSR calculator
options
Calculator description
Original (current
calculator)
The original (current) calculator that was voluntarily implemented
from 2014 (includes a 22 point sugar scale, 30 point sodium scale, non-
linear above 900 mg sodium/100 g).
Review scenario Incorporates all recommendations from the Review Report, including a
new calculator for non-dairy beverages, minimally processed fruits and
vegetables scoring 5 stars, re-categorisation of jellies and iced
confections, dairy re-scaling and re-categorisation, increased sugar
sensitivity (25 point scale) and sodium sensitivity (90 mg increments in
30 point scale).
Total Sugars scenario Further increased sugar sensitivity (30 point scale) in combination with
the other Review recommendations.
Sodium scenario Further increased sodium sensitivity (75 mg increments in 30 point
scale) in combination with the other Review recommendations.
Combined scenario Increased sugar sensitivity (30 point scale) and sodium sensitivity (75
mg increments in 30 point scale) in combination with the other Review
recommendations.
Assessing alignment of a nutrient-focussed labelling system, such as the HSR, with Dietary
Guidelines is complex, with many different interpretations and approaches to analysis, all
which come with their relative strengths and limitations. This paper sought to answer the
following research questions:
1. Which HSR calculator option achieves an outcome that more closely aligns the HSR
system with Dietary Guidelines?
2. What is the impact (both direction and magnitude of change in HSR) of each HSR
calculator option compared to the Original (current) calculator?
3. Does a stronger approach to sodium provide a greater incentive to reformulate
products?
The assessment criteria used to assess which calculator option resulted in better alignment
with the dietary guidelines included:
1. Better minimises outliers of discretionary and five food group (FFG) foods (defined as
discretionary foods that score ≥3 stars and FFG foods that score below 3 stars).
2. Better addresses Actual (Group 1) outliers as defined by the Technical Advisory
Group (TAG).
3. Better differentiation between similar foods to enable consumers to make choices in
line with dietary guidelines.
Conclusions
Based on the assessment criteria used, all scenarios improved alignment with the Dietary
Guidelines compared to the Original (current) calculator. That said, the Combined
scenario was determined to achieve an outcome that more closely aligns the HSR system

with Dietary Guidelines as it was observed to reduce Actual (Group 1) outliers
(discretionary foods with a HSR ≥3 scoring higher than expected based on their nutritional
composition) more than all other scenarios.
The impact of all HSR calculator options was observed to result in 20% or more products
being affected by a change in HSR, with the Combined scenario observed to have a higher
proportion of products with a decreased HSR (of which 53% were discretionary foods).
The impact, in terms of magnitude of change, was relatively small for the majority of
products (+/- 0.5 stars).
Stronger approaches to sodium reduce the increments between baseline points; this is
likely to be similar with sugar but was not analysed in this report. Smaller increments
between baseline points may have the potential to incentivise Industry to reformulate
products as only a small change is required to change between baseline points.

1. Introduction
1.1 Purpose
This paper has been prepared by a Food Regulation Standing Committee (FRSC) Working
Group to provide advice to the Forum on whether a stronger approach to sugar and/or sodium
in the HSR calculator may achieve an outcome that more closely aligns the HSR system with
Dietary Guidelines compared to the changes to the HSR calculator recommended following
the ‘HSR System Five Year Review’ (the Review). The overall impact of implementing each
HSR calculator option was also considered in relation to the Original calculator. This paper
addresses the Forum’s concern that products that contain sodium below 900 mg/100 g may
not be provided with any incentive to reformulate – a secondary aim of the HSR system.
1.2 Research questions posed
1. Which HSR calculator option achieves an outcome that more closely aligns the HSR
system with Dietary Guidelines?
2. What is the impact (both direction and magnitude of change in HSR) of each HSR
calculator option compared to the Original (current) calculator?
3. Does a stronger approach to sodium provide a greater incentive to reformulate products?
1.3 Background
On 27 June 2014, the Forum endorsed the HSR system to be voluntarily implemented in
Australia and New Zealand for an initial five years. The Forum agreed at the launch of the
system that a formal review be done after five years of implementation.
The HSR system is a front-of-pack labelling system that rates the overall nutritional profile of
packaged food and assigns a rating from ½ a star to 5 stars. Under the objectives and
principles for the development of a front-of-pack labelling system, the system should be
aligned with other food regulation, public health policies, and authoritative sources of dietary
advice including Australian Dietary Guidelines (ADG)1.
A modified version of the Nutrient Profiling Scoring Criterion (NPSC) developed by Food
Standards Australia New Zealand (FSANZ) for the purpose of Standard 1.2.7 – Nutrition,
Health and Related Claims was the basis for the HSR system.
As a nutrient profiling tool, the HSR calculator intends to objectively differentiate between
foods and drinks to enable consumers to make healthier choices.
The calculator considers four aspects of a food associated with factors that increase the risk of
chronic diseases, these are energy, saturated fat, sodium and total sugars content, with the
food scoring baseline points for the amount of each nutrient per 100 g food according to a
scale within the calculator.
Certain ‘positive’ aspects of a food such as fruit, vegetable, nut and legume content, and in
some instances, dietary fibre and protein content are also considered, with points scored for
the amount of these components per 100 g food that offset the baseline points from the risk
increasing nutrients, with the resultant score then being assigned a star rating (0.5 to 5 stars).
Like many nutrient profiling models used for labelling, it is based on the assumption that
foods cannot be simply defined as healthy and unhealthy but exist along a continuum.
1 Front of pack labelling Project Committee Objectives and principles for the development of a front-of-pack labelling
(FoPL) system

1.4 Alignment with Dietary Guidelines
As described in the History and Development of the HSR system paper by the Technical
Advisory Group2, the HSR system is designed to assist consumers at the point of purchase to
make healthier food choices, relative to similar foods, in line with Dietary Guidelines.
The ADG and accompanying Australian Guide to Healthy Eating provide advice on the
amounts and kinds of foods that we need to eat for health and wellbeing, with a focus on fresh
foods. The HSR system was intended to be used in conjunction with the Dietary Guidelines, it
focuses on individual processed, packaged foods to guide consumer choice towards healthier
food options. It was not intended to provide recommendation on amounts of food to be
consumed.
There are five broad guidelines in the ADG covering the lifespan to encourage eating a
variety of foods from the five food groups, energy balance for a healthy weight, limiting
intake of specific nutrients, breastfeeding advice and food safety. The New Zealand Eating
and Activity Guidelines (NZEAG) also have five eating statements that encourage eating a
variety of foods, choosing water as the preferred drink, selecting foods with low levels of risk
increasing nutrients and that are less processed, reducing alcohol intake, and food safety.
As a system which provides a rating on the basis of select nutrients, the HSR can be aligned
with only some of these Dietary Guidelines: ADG Guideline 3: Limit intake of foods
containing saturated fat, added salt, added sugars and alcohol and NZEAG Eating Statement
2: Choose and/or prepare foods and drinks: with unsaturated fats instead of saturated fats,
that are low in salt (sodium), with little or no added sugar, that are mostly ‘whole’ and less
processed. The positive components (fibre, fruit/vegetable/nut/legume and protein, as a proxy
for iron and calcium content3) reflect to some extent ADG Guideline 2 to Enjoy a wide variety
of nutritious foods from these five food groups every day and NZEAG Eating Statement 1
Enjoy a variety of nutritious foods every day. Notably it is unable to incorporate
recommendations to select whole and less processed foods (in the NZEAG) and similarly
fresh produce and wholegrain cereals (in the ADG), though for those food groups where the
fibre content is taken into account in the HSR calculator, the HSR may assist in distinguishing
a wholegrain same food.
There are a number of relevant differences between the two countries’ Dietary Guidelines
when considering HSR alignment with Dietary Guidelines. These were also identified in the
TAG paper completed for the Review, Alignment of the HSR system with the Australian and
New Zealand Dietary Guidelines4:
The ADG describes food groups/subgroups as FFG or discretionary. The terms ‘five
food group’ and ‘discretionary’ are not part of the NZEAG.
The NZEAG recommends ‘eating fresh fruit and drinking plain water rather than
drinking fruit juice’ and recommends limiting the amount of dried fruit in the diet given
its concentration of sugar and potential impact on cavity risk to teeth. The ADG indicate
that fruit juices provide energy but most lack dietary fibre and can contribute to dental
erosion, and dried fruit can increase the risk of tooth decay and therefore indicate fruit
juice and dried fruit should be consumed only occasionally and in small amounts.
2 Technical Advisory Group (TAG) (2018) Five Year Review Of The Health Star Rating (HSR) System. HSR History and
development of the HSR algorithm. 3 Technical Advisory Group (TAG) (2018) Five Year Review Of The Health Star Rating (HSR) System. Protein. 4 Technical Advisory Group (TAG) (2018) Five Year Review Of The Health Star Rating (HSR) System. Alignment of the
HSR system with the Australian and New Zealand Dietary Guidelines: Analysis of alignment and identification of outliers.

The approach for assigning a star rating to non-dairy beverages, including fruit juice, has
already been agreed by the Forum with a different calculator to be used and hence this
category of products is not considered further in this paper.
1.5 Health Star Rating System Five Year Review Report (Review Report)
The Forum considered the Review Report and the Report’s ten recommendations for
enhancing the HSR system in November 2019. The Forum published its Response to the
Review Report in December 2019. Overall, the Forum was supportive of the
recommendations outlined in the Review Report, noting that some recommendations were
supported in principle subject to additional work and/or available funding.
In relation to Recommendation 4, which considered the underlying calculator, the Forum’s
Response stated it supported:
• Changes to the HSR system that encourage dietary intake that is consistent with the
Dietary Guidelines;
• The promotion of all unprocessed and minimally processed fruits and vegetables without
differentiation;
• Stronger penalisation of sugars under the HSR system, recognising the role of sugars in
contributing to diet-related chronic disease;
• Greater discernment between products under the HSR system on the basis of sodium
content, in recognition of the link between high sodium intake and chronic disease;
• Greater discernment between dairy products in line with Dietary Guidelines; and
• HSR system enhancements, such as the one suggested for jellies and ice-confections,
that result in star ratings that more appropriately reflect the nutritional profile of
discretionary foods.
The Forum requested that FRSC and FSANZ provide additional advice to address some of the
Forum’s concerns outlined below:
The modelling in the Review Report relied upon to recommend a change from a 22 point
scale to a 25 point scale, rather than alternative 30 point scale for sugar was undertaken
in isolation of other HSR system changes and without due consideration of the products
impacted.
The recommended changes to the sodium point scale (Recommendation 4B in the
Review Report) may only impact a small subset of discretionary foods that are high in
sodium and that products below 900 mg/100 g are not provided with incentive to
reformulate – a secondary aim of the HSR system.
The re-categorisation and rescaling of the dairy food categories was considered without
sufficiently accounting for other HSR system changes.
The Forum requested that FRSC provide advice on whether the alternative approaches
considered during the Review, but not included in the final recommended approach, achieve
an outcome that more closely aligns the HSR system with Dietary Guidelines. The Forum
requested that FSANZ provide advice on the modelling that underpinned the Review Report
and on the impact of combining all the changes recommended in the Review and the
alternative scenarios (30 point sugar scale and/or smaller increments between points in the
sodium scale) to support a conclusion with respect to sodium, sugar and dairy scaling.

FSANZ concluded in the Peer Review of the Review modelling5 that the combined impact of
all the recommended changes to the Original HSR calculator was robust and accurate.
However, as noted by the Forum, the modelling relied upon to recommend a 25, rather than
30 HSR baseline points scale for total sugars, was undertaken in isolation of other HSR
system changes, namely dairy re-categorisation and rescaling of Category 2D (dairy foods).
FSANZ conducted additional modelling using the alternative sodium and sugars points tables
in the HSR calculator (Appendix 1). FSANZ assessed the proportion of products affected
(those that increase and decrease in HSR) by the Review’s proposed approach, and then using
the Review calculator as the baseline, considered the impact of implementing the alternative
sugar, sodium and combined sugar and sodium scenarios. An initial assessment of alignment
with Dietary Guidelines was also undertaken. FSANZ concluded that the Combined scenario
(alternative sugar and sodium point scales) aligns more closely with Dietary Guidelines, with
fewer discretionary products (approximately 4%) receiving a HSR ≥ 3. However, the FSANZ
report also stated that while the majority of FFG products in the database of individual food
products developed by TAG (TAG database) received a HSR ≥ 3, the Combined scenario also
resulted in an increase in the number of FFG products receiving HSR < 3 (3%).
This report builds on the FSANZ modelling to address the research questions outlined above
and also uses the TAG database.
2. Approach
2.1 Assessment of alignment of HSR calculator options with Dietary Guidelines
Previous assessments of HSR alignment with Dietary Guidelines have often relied on the
Australian Health Survey (AHS) Discretionary Foods List. This list was developed by the
Australian Bureau of Statistics (ABS) during the analysis phase of the 2011- 13 National
Nutrition and Physical Activity Survey (NNPAS) to determine the energy contribution of
discretionary foods to Australian diets. In the TAG database, used for modelling during the
Review, the TAG assigned foods a discretionary flag based on this AHS list. All foods not
classified as discretionary were considered to be FFG foods6. Alignment with Dietary
Guidelines was then determined by the number of foods that had a HSR considered too high
for a discretionary food, or too low for a FFG food. These products were termed outliers and
the cut-off level chosen for these apparent outliers was discretionary foods that score ≥3 stars
and FFG foods that score below 3 stars. For consistency, this was replicated in FSANZ’s
modelling and this paper. The TAG also conducted further analysis of these outliers for the
Review and identified three groups of outliers, indicating some products were actual outliers
that should be addressed (Group 1 outliers)7 8. The actual (Group 1) outliers were all
discretionary foods and are the outliers that the Review specifically wanted to target9. These
have also been considered in assessing alignment with Dietary Guidelines. The other two
5 FSANZ 2020 Report 1: Review of modelling undertaken for the Health Star Rating System Five Year Review 6 Note that fats and oils technically sit outside the five food group and discretionary groupings in the ADG but were assigned
FFG and discretionary flags: dairy spreads and butter high in saturated fats are categorised as discretionary choices and oils
are categorised as FFG. 7 The other two groups of outliers identified by TAG were: Group 2 (miscategorised outliers) - FFG foods with a low HSR
and lower nutritional profile or discretionary foods with a high HSR and absolute and/or relatively healthy nutritional profile.
The TAG considered these a limitation of the FFG/discretionary classification rather than a failure of the HSR system.
Group 3 (possibly miscategorised outliers) - Dairy foods with a low HSR and a relatively low nutritional profile within their
category such that they obtain a lower HSR than many discretionary foods. These were considered more challenging to
assess as dairy had been scaled to allow for adequate differentiation. 8 Technical Advisory Group (TAG) (2018) Five Year Review Of The Health Star Rating (HSR) System. Alignment of the
HSR system with the Australian and New Zealand Dietary Guidelines: Analysis of alignment and identification of outliers.
groups of outliers were either not necessary to adjust or involved more subjective assessment
and so were not considered further here.
The extent to which the HSR differentiates between products to Enable maximum
discernment between like foods with different nutritional profiles (a principle of the Review)
to enable consumers to make choices in line with Dietary Guidelines has also been considered
to determine how well the HSR calculator options align with Dietary Guidelines.
2.1.1 Criteria
The criteria used to determine closer alignment with Dietary Guidelines were:
1. Better minimises outliers of discretionary and FFG foods.
2. Better addresses Actual (Group 1) outliers as defined by the TAG.
3. Better differentiation between similar foods to enable consumers to make choices in
line with Dietary Guidelines.
2.2 Impact of each HSR calculator option on products
The degree of change expected by each calculator, in terms of the proportion of products in
the TAG database expected to change in HSR, as well as the direction and magnitude of
change, was also assessed to inform decision makers and stakeholders. It is important to note
that the TAG database includes a range of products on the market, not just those currently
carrying a HSR. Therefore, where modelling demonstrates changes in HSR, these do not
equate to the degree of label changes that might be required should the HSR calculator be
changed, but a hypothetical impact on a product category’s HSR.
2.3 Incentive for reformulation
Continuing to incentivise food manufacturers to decrease the content of risk-associated
nutrients in food products was one of the principles of the Review. The Forum noted in its
response that products below 900 mg/100 g of sodium were not provided with incentive to
reformulate. Therefore, this analysis gave some consideration to incentive for reformulation.
This was assessed by looking at the degree of reductions in sodium content needed to gain
higher star ratings for the proposed Review calculator and the more sensitive sodium
calculator for key products identified to contribute to adult sodium intakes as per the 2011-12
NNPAS.
2.4 HSR calculators assessed
FSANZ modelled four HSR calculator scenarios in its Peer Review of the Review modelling
and Modelling a stronger approach to total sugars and sodium (Appendix 1). These same
calculator options have been used in this report and are outlined below, along with the
Original (current) calculator for reference.
HSR calculator options Calculator description
Original (current
calculator)
The original (current) calculator that was voluntarily
implemented from 2014 (includes a 22 point sugar scale,
30 point sodium scale, non-linear above 900 mg
sodium/100 g).

HSR calculator options Calculator description
Review scenario Incorporates all recommendations from the Review Report,
including a new calculator for non-dairy beverages, minimally
processed fruits and vegetables scoring 5 stars,
re-categorisation of jellies and iced confections, dairy re-
scaling and re-categorisation, increased sugar sensitivity
(25 point scale) and sodium sensitivity (90 mg increments in
30 point scale).
Total Sugars scenario Further increased sugar sensitivity (30 point scale) in
combination with the other Review recommendations.
Sodium scenario Further increased sodium sensitivity (75 mg increments in
30 point scale) in combination with the other Review
recommendations.
Combined scenario Increased sugar sensitivity (30 point scale) and sodium
sensitivity (75 mg increments in 30 point scale) in combination
with the other Review recommendations.
The HSR calculator options assign different relative weightings to total sugars and sodium
content of food products by changing the algorithm used. For the Review and Total Sugars
scenario the relative weighting of sugars is increased by using a 25 point or 30 point table
respectively. This means that in the Total Sugars scenario products would receive more
baseline points for the total sugars content than in other options, and therefore generally
achieve lower HSRs in foods where total sugars is an operative component.
For the Review and Sodium scenario, both options have a 30 point table, but the smaller
sodium increments in the Sodium scenario (75 mg versus 90 mg in the Review scenario) and
different maximum levels (2250 mg versus 2700 mg) work to also lower the HSRs in foods
where sodium is an operative component. See FSANZ’s paper for more detail (Appendix 1).
Consistent with FSANZ’s approach, Category 1 – non-dairy beverage products were excluded
from the analysis as these will be subject to a separate calculator.
2.5 Strengths and Limitations
2.5.1 Use of the TAG database
The TAG database used to conduct the modelling in the Review was used in the FSANZ
modelling and any additional analysis for this paper, allowing outcomes to be directly
comparable to the Review Report. At the time of the Review modelling, it contained up-to-
date industry data. Limitations, also discussed in the TAG papers10, include: lack of
transparency of the data as it was provided by industry as commercial-in-confidence,
underrepresentation of the number of food products in the supermarket (5885 in the TAG
database and over 20,000 estimated in supermarkets), underrepresentation of discretionary
foods (estimated to be 50% of supermarket products but 36% of the database), and
overrepresentation of dairy products as a result of data supplied by industry when a dairy
anomaly was being considered. This latter is relevant when the proportion of products
impacted by a HSR change is considered. Due to the predominance of FFG foods, the impact
10 Technical Advisory Group (TAG) (2018) Five Year Review Of The Health Star Rating (HSR) System. Alignment of the
HSR system with the Australian and New Zealand Dietary Guidelines: Analysis of alignment and identification of outliers.

on FFG and discretionary foods of the different scenarios are reported as a proportion of these
food types.
2.5.2 FFG/ discretionary food flag
A limitation of the analysis is the reliance on the concept of discretionary and FFG foods to
determine alignment with Dietary Guidelines, which appears only in the ADG. The ABS
noted that the AHS Discretionary Foods List was developed specifically for the preliminary
analysis of the 2011-12 NNPAS data and applied at a food group or subgroup level and may
not be suitable for other applications. The ADG specify healthy choices in the FFG are those
that are lowest in saturated fats, added sugars and salt. Therefore a FFG food could still be
high in saturated fat, added sugars and/or sodium but might be considered an apparent outlier
if it scores less than 3 stars. Similarly, some individual foods within a food subgroup
designated discretionary according to the AHS list could be considered healthier (for
example, some types of dips) and so a HSR above 3 stars may be appropriate. The TAG
assessed that about one third of outliers assessed appear to be as a result of limitations of
these classifications rather than a failure of the HSR system11. It also showed that use of this
list also meant that a number of outliers were not captured such as fruit juices that obtain a
high HSR or where there is poor differentiation in the HSR between refined and wholegrain
foods.
Another limitation of applying the AHS Discretionary Food List is that it is a binary food flag
(FFG vs discretionary) that was designed to answer yes or no on whether a particular food
group/subgroup meets the compositional criteria set (often a single nutrient). The HSR system
is a spectrum rating, providing a relative rating of similar products based on a complex
nutritional profile of specific nutrients across a ten-point scale.
2.5.3 Selected cut-off point for outliers
Assessment of outliers by the TAG and FSANZ used a cut-off point of 3 stars; where an
apparent outlier is a discretionary food that scores ≥ 3 stars or a FFG food that scores < 3
stars. In the development of the HSR12, it was designed such that foods that were ineligible to
carry health claims under the Australia New Zealand Food Standards Code would receive half
to two-and-a-half stars and foods eligible to carry health claims would receive three to five
stars, with the intention of achieving consistency in labelling for the consumer. It is not clear
whether this still holds true with the changes proposed in the Review calculator or stronger
scenarios, particularly with the rescaling upwards of some dairy foods.
In the literature13, it has been argued the 3 star cut-off point is overly generous and that a 50%
‘pass’ mark of 2.5 stars would be more appropriate. The analysis in this paper retained the
3 star cut-off for consistency but it is noted some may believe this underquotes discretionary
outliers and over-quotes FFG outliers.
11 Technical Advisory Group (TAG) (2018) Five Year Review Of The Health Star Rating (HSR) System. Alignment of the
HSR system with the Australian and New Zealand Dietary Guidelines: Analysis of alignment and identification of outliers.
Accessed at: - 12 Technical Advisory Group (TAG) (2018) Five Year Review Of The Health Star Rating (HSR) System. History and
development of the HSR algorithm. 13 Lawrence MA, Pollard CM, Vidgen HA, Woods JL. The Health Star Rating system – is its reductionist (nutrient) approach
a benefit or risk for tackling dietary risk factors? Public Health Res Pract. 2019;29(1):e2911906.

3. Outcomes
3.1 Alignment with Dietary Guidelines
Criteria 1: Better minimises outliers of discretionary and FFG foods
The proportion of outliers (discretionary foods scoring ≥3 stars and FFG foods scoring < 3
stars) across the different calculator scenarios can be found in Table 1.
Table 1: Proportion of outliers for HSR calculator options (defined as a star rating below 3
for FFG or 3 or above for discretionary foods).
Total products
n=5456
Original
HSR
Calculator
Review
scenario
Calculator
Total
Sugars
scenario1
Calculator
Sodium
scenario1
Calculator
Combined
scenario
Calculator
FFG (<3)
n=3476
16%
(n=572)
14%
(n=476)
15%
(n=508)
17%
(n=592)
18%
(n=624)
Discretionary (≥3)
n=1980
40%
(n=799)
39%
(n=780)
38%
(n=759)
36%
(n=721)
35%
(n=699) 1In the FSANZ modelling (Appendix 1), proportions of outliers were calculated only on HSR Categories 1D-dairy beverages, 2 – foods and
2D – dairy foods. In this analysis, HSR Categories 3 - fats and oils and 3D - cheeses have been added to indicate the total outliers across all
of these categories. For that reason, the number of products quoted above is greater than in the FSANZ paper.
All scenarios result in slightly fewer outliers than the Original calculator. Where they differ is
in which outliers they reduce. The Review scenario has a net reduction in outliers for FFG
foods, and to a lesser extent for discretionary foods. The Sodium and Combined scenarios
have a net small increase in outliers for FFG foods, but they have a greater net reduction in
discretionary food outliers. On one hand it might be seen as preferable to choose a calculator
that results in outlier reductions in both FFG and discretionary foods (the Review scenario).
On the other hand, the proportion of outliers overall for discretionary foods remains
substantially higher than for FFG foods therefore addressing more discretionary outliers could
also be seen as preferable, in line with concerns expressed by the Forum (the Combined
scenario).
The Review scenario also results in slightly more discretionary foods rating very highly (≥ 4
stars) compared to both the Original calculator and Combined scenario. With the change from
the Original calculator to the Review calculator, 16 new discretionary products would
increase in HSR to score ≥4 stars (13 smooth/ gelatin based dairy desserts, such as chocolate
mousse and panacotta style desserts, a reduced fat sour cream and two ‘other beverages’). Six
discretionary foods no longer score ≥4 stars (muesli bars, fruit-based confectionary, sweet
biscuit and a sauce), resulting in a small net increase of ten discretionary products scoring ≥ 4
stars. The Combined scenario results in a net fewer discretionary foods scoring ≥4 stars
(n=41). These are mainly savoury sauces (tomato based), battered or crumbed fish, muesli
bars with confectionary and dry sauce mixes. While the number of mousse-style dairy
desserts receiving ≥4 stars still increases with the Combined scenario, due to the dairy
rescaling, fewer score ≥ 4 stars than in the Review scenario.
The types of FFG foods assessed as new outliers that occur in the Combined scenario are
mainly breakfast cereals with nuts or fruit (average 20% sugar), full fat hard cheeses, savoury
biscuits, and chocolate/coffee flavoured milks. These FFG outliers are likely have a relatively
low nutritional profile (that is, higher in some risk nutrients) within their category. TAG
identified many of these foods fitting this description when they reviewed alignment with
Dietary Guidelines with the Original calculator. TAG did not consider these true outliers (i.e.

not Group 1 outliers) and as a result this report did not assess these products in detail14.
Therefore, the relative weightings for total sugars and sodium content with the Combined
scenario which result in a greater reduction of discretionary outliers could be seen to move the
HSR system closer to alignment with Dietary Guidelines than the Review scenario.
Criteria 2: Better addresses actual (Group 1) outliers as defined by the TAG
The TAG identified three types of outliers, with Group 1 (actual outliers) being the outliers
that the Review specifically wanted to target. Outcomes for actual (Group 1) outliers for the
different HSR calculator options are given in Table 2.
Table 2: Proportion of actual (Group 1) outliers (as identified by TAG15, excluding ice
confection and jellies)
Description of outlier
type
% all
outliers
identified
Original
calculator
% all
outliers
identified
Review
scenario
% all
outliers
identified
Total sugars
scenario
% all
outliers
identified
Sodium
scenario
% all
outliers
identified
Combined
scenario
Actual (Group 1)
outliers: discretionary
foods scoring higher
than expected based
on nutritional profile*
25% 24% 25% 22% 21%
*For method used to calculate actual outliers, see Appendix 2
The Actual outliers were defined as discretionary foods with a HSR ≥3 which scored higher
than expected based on their nutritional composition16. Possible options identified by TAG for
addressing these outliers included changing the HSR calculator algorithm and/or HSR
Category classification. All calculator scenarios reduced these outliers through these changes
to some extent by incorporating recommended changes from the Review Report; however,
Table 2 illustrates that the Combined scenario had the greatest impact in reducing these actual
(Group 1) outliers compared to the Original calculator. Both the Review and the Total Sugars
scenarios had minimal impact in comparison to the Original calculator.
The types of products considered actual outliers (Group 1) by the TAG are listed in Table 3.
For more detailed analysis, including the mean HSR and range of these product categories,
see Appendix 3. Many of these products were identified in the Review as of concern to
stakeholders.
Table 3: Actual (Group 1) outliers and impact of the different HSR calculator options
14 Technical Advisory Group (TAG) (2018) Five Year Review Of The Health Star Rating (HSR) System. Alignment of the
HSR system with the Australian and New Zealand Dietary Guidelines: Analysis of alignment and identification of outliers. 15 HSR Technical Advisory Group (TAG) (2018). Alignment of the HSR system with the Australian and New Zealand
Dietary Guidelines: Analysis of alignment and identification of outliers. 16 HSR Technical Advisory Group (TAG) (2018). Alignment of the HSR system with the Australian and New Zealand
Dietary Guidelines: Analysis of alignment and identification of outliers.

Food or drink product
Original
calculator
% HSR≥3
(count)
Review
scenario
%
HSR≥3
Total
sugars
scenario
%
HSR≥3
Sodium
scenario
%
HSR≥3
Combine
d scenario
% HSR≥3
Muesli/cereal bars (n=134) 50%
(67)
47%
(63)
43%
(58)
46%
(61)
43%
(57)
Fruit bar/fruit-based
confectionary (n=18)
89%
(16)
61%
(11)
39%
(7)
61%
(11)
38%
(7)
Dry casserole/sauce mixes
(n=105)
71%
(75)
71%
(75)
71%
(75)
69%
(72)
68%
(71)
Ice creams ≤4.0g fat /100g
(n=27)
100%
(27)
96%
(26)
93%
(25)
93%
(25)
89%
(24)
Ice creams 4-10g fat /100g
(n=45)
29%
(13)
29%
(13)
24%
(11)
29%
(13)
24%
(11)
Dry gravy mixes (n=38) 89%
(34)
89%
(34)
89%
(34)
53%
(20)
53%
(20)
Gravies (prepared) (n=29) 93%
(27)
93%
(27)
93%
(27)
59%
(17)
59%
(17)
Salty snacks (crisps, corn
chips and extruded
snacks) (n=120)
17%
(20)
17%
(20)
17%
(20)
11%
(13)
11%
(13)
Coffee-based beverages
(n=22)
100%
(22)
100%
(22)
100%
(22)
100%
(22)
100%
(22)
Dairy desserts (n=47) 74%
(35)
68%
(32)
64%
(30)
68%
(32)
64%
(30)
Processed meat (including
ham) (n=59)
53%
(31)
47%
(28)
47%
(28)
37%
(22)
37%
(22)
Discretionary Breakfast
cereals (> 30 g total sugars
or > 35 g if contain dried
fruit) (n=16)
6%
(1)
6%
(1)
6%
(1)
6%
(1)
6%
(1)
As shown in Table 3, all scenarios decreased the proportion of actual outliers in five out of the
12 discretionary categories compared to the Original calculator: muesli bars, fruit bars, ice
cream (< 4g fat), dairy desserts and processed meats. The Combined scenario had the greatest
decrease in outliers in all of these categories, except processed meat and dairy desserts where
the decrease was the same for the Sodium scenario and Total Sugars scenario respectively.
The Combined scenario also decreased the outliers in an additional five categories: dry
casserole/sauce mixes, ice cream (4-10g fat), dry gravy mixes, gravies (prepared) and salty
snacks in contrast to the Review scenario, which did not appear to have any impact on these
categories.
There was no observed change in outliers for coffee-based beverages and breakfast cereals in
all scenarios, noting there was only one breakfast cereal affected.

Criteria 3: Better differentiation between similar foods
The mean HSR and HSR ranges overall and for individual product categories were considered
as a means of determining whether consumers could select between products within a
category in line with Dietary Guidelines. In the development of the HSR system dairy foods
was one food category that was treated slightly differently to create a slightly wider range of
star ratings to allow more informed choice within this product range and support Dietary
Guidelines to enable reduced fat and no added sugar products to obtain a higher HSR.
Without this change dairy foods would have a narrow range of HSR scores due to the
derivation from a single food source (milk), making it difficult for consumers to select
healthier products within this category. The mean and HSR ranges was also considered in the
context of the desire for foods recommended in the Dietary Guidelines to generally have a
higher HSR than foods not recommended (such as FFG foods having a higher HSR than
discretionary foods in general), however a balance to enable differentiation in line with
Dietary Guidelines is also important.
As seen in Figure 1, both the Review scenario and the Total Sugars scenario were observed to
narrow the range of star ratings of FFG foods, whilst the Sodium and the Combined scenarios
had a similar overall distribution of star ratings for FFG foods as the Original (current)
calculator. The average HSR of FFG foods was observed to be relatively similar (difference
of 0.1) across the different scenarios. The Review and Total Sugars scenarios were the only
ones to see a slight increase in mean HSR of FFG foods, in comparison to the Original
calculator. The Total Sugars, Sodium and Combined scenarios were observed to broaden the
range of star ratings of discretionary foods, in comparison to the Original calculator. While
the Review calculator increased the mean HSR of FFG foods, it had no impact on the mean
HSR of discretionary foods. The Total Sugars, Sodium and Combined scenarios all reduced
the mean HSR of discretionary foods while either increasing the mean of FFG foods (Total
Sugars) or having no impact on the FFG mean HSR (Sodium and Combined scenarios)
compared to the Original calculator. The broadened interquartile range observed in these
scenarios started at a lower HSR (1.0) than the Original and Review scenarios (1.5). Based on
mean and interquartile range, the Total Sugars scenario was observed to more distinctly
differentiate between FFG and discretionary foods than other scenarios.
Overall

Figure 1: Distribution of HSR by FFG/ discretionary food flag for the HSR calculator options
(excludes category 1 beverages). The box displays the interquartile range and the mean value
is marked with an 'x'. The lines extending above and below the box indicate the most extreme
value within the upper and lower interquartile range, and additional values outside this range
are marked as circles.
One of the messages promoted to consumers about the HSR system is that ‘the more stars, the
healthier the choice’ within a product category. As such, this report acknowledges that
differentiation between similar foods needs to be looked at for the food supply overall, but
also within a product category. Presented below is the distribution of HSRs against all
scenarios for specific product categories, with additional examples provided in Appendix 4.
Bread
Figure 2: Distribution of HSR for Breads by FFG/ discretionary food flag for the HSR
calculator options. Discretionary breads include sweet breads (iced and un-iced), and
savoury topped/filled breads.
As seen in Figure 2, there is clear distinction between HSR for discretionary breads and FFG
breads across all scenarios (no discretionary breads are observed to have a rating greater than
3.5 stars). The mean HSR for both FFG breads and discretionary breads was observed to be
similar across all scenarios, including the Original calculator. Further to the overall category
trend, within the bread category, it was observed that white bread has a lower HSR range
compared to wholemeal/grain breads, noting there is still overlap between the two varieties,
with less overlap between the two bread types in the Sodium and Combined scenarios.
Table 4: Comparison of HSR range for different bread types
Product type Original
calculator
Review
scenario
Total
Sugars
scenario
Sodium
scenario
Combined
scenario
White breads 3 – 4.5 3 – 4.5 3 – 4.5 3 - 4 3 – 4
Wholemeal/grain breads 3.5 - 5 3.5 – 5 3.5 - 5 3.5 – 4.5 3.5 - 4.5
Salty snacks
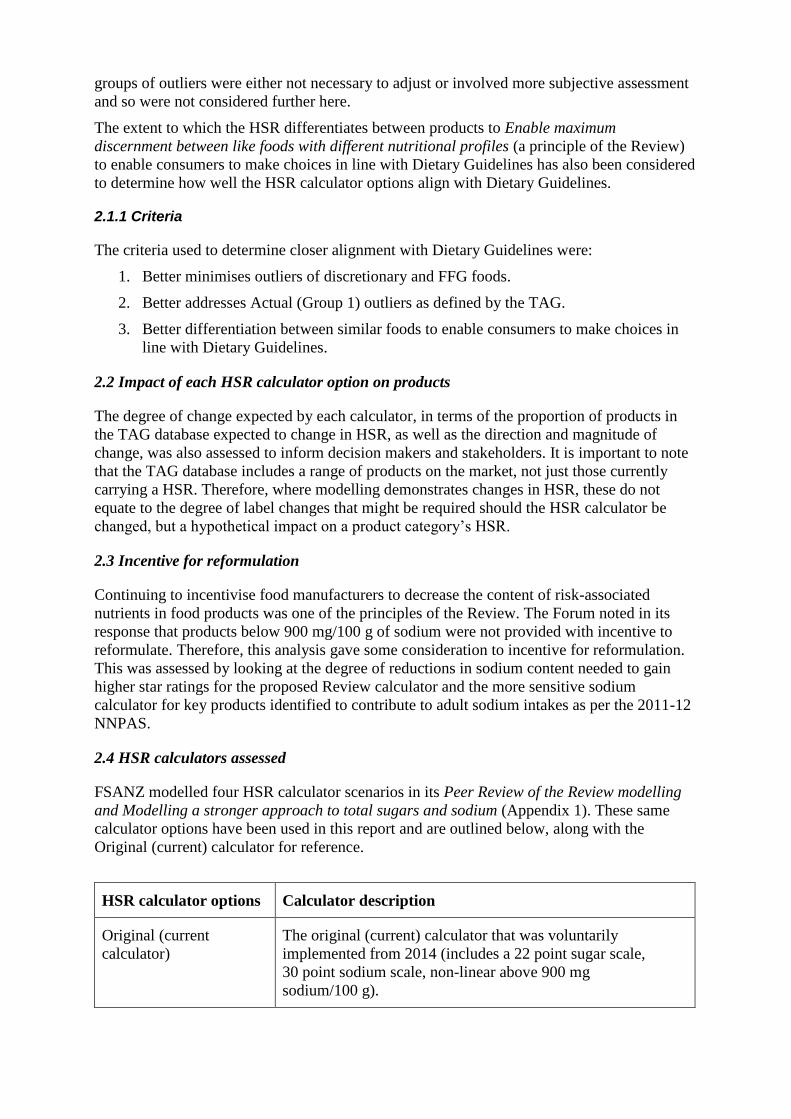
Figure 3: Distribution of HSR for Salty snacks for the HSR calculator options. Data
presented includes the following categories: Potato crisps, Other vegetable crisps, Corn chips
and Extruded snacks.
Salty snack products are all flagged as discretionary foods. As seen in Figure 3, the mean
HSR of the salty snack products did not vary much from the Original calculator for the
Review and Total Sugars scenarios (all ranging 0.5 – 4.5 stars). Both the Sodium and
Combined scenarios results in an observed decrease in mean HSR, as well as a broader range
of star ratings at the lower end of ratings, with a range of 0.5 – 3.5 stars. There were no
observed additional values that fell outside of the range for the Sodium and Combined
scenarios (presented as circles in Figure 3).
Yoghurts
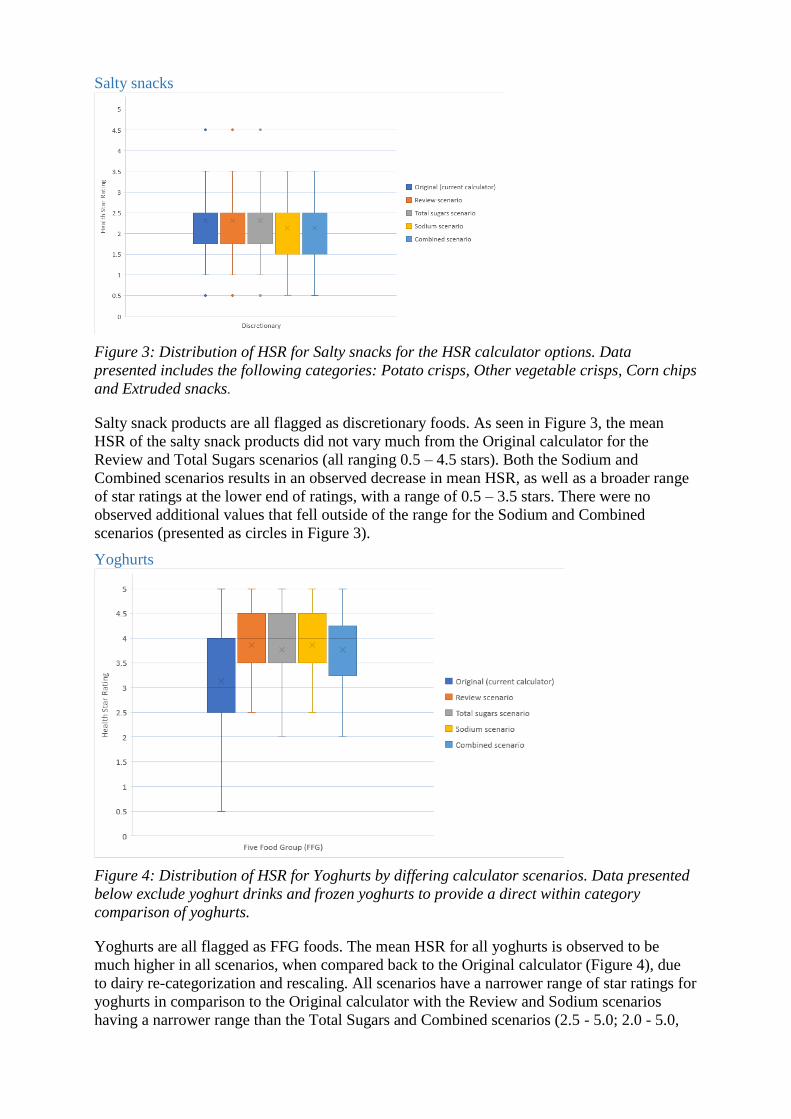
Figure 4: Distribution of HSR for Yoghurts by differing calculator scenarios. Data presented
below exclude yoghurt drinks and frozen yoghurts to provide a direct within category
comparison of yoghurts.
Yoghurts are all flagged as FFG foods. The mean HSR for all yoghurts is observed to be
much higher in all scenarios, when compared back to the Original calculator (Figure 4), due
to dairy re-categorization and rescaling. All scenarios have a narrower range of star ratings for
yoghurts in comparison to the Original calculator with the Review and Sodium scenarios
having a narrower range than the Total Sugars and Combined scenarios (2.5 - 5.0; 2.0 - 5.0,

respectively). The Review Report identified flavoured yoghurts as a category intended to be
targeted by the Review calculator with a reduction in HSR. In the Review scenario, all
yoghurts impacted increased in HSR. This upward trend in HSR was seen across all scenarios,
but to a lesser extent (that is fewer products increased) for the Total Sugars and Combined
scenarios.
Key findings – Alignment with Dietary Guidelines
All scenarios result in small shifts towards better alignment with Dietary Guidelines
compared to the Original calculator.
The Combined scenario reduced Actual (Group 1) outliers (discretionary foods with a
HSR ≥3 scoring higher than expected based on their nutritional composition) more than
all other scenarios.
The Combined scenario reduced more Actual outliers than the Review scenario, both in
terms of number of food categories addressed (10 out of 12 categories for the
Combined compared to 5 out of 12 categories for the Review scenario) and degree of
impact within a category. These food categories were identified by TAG as areas of
concern by stakeholders.
The average HSR of FFG foods was observed to be relatively similar (difference of
0.1) across the different scenarios.
The average HSR of discretionary foods was not affected by the Review scenario, and
was similar (difference of 0.1) for the sugar and sodium scenarios. The Combined
scenario had the greatest reduction in the mean HSR of discretionary foods compared
to the Original calculator.
Based on mean and interquartile range, the Total Sugars scenario was observed to more
distinctly differentiate between FFG and discretionary foods than other scenarios. That
said, the Total Sugars scenario was observed to have the same proportion of actual
(Group 1) outliers as the Original calculator (25%), whilst the Review, Sodium and
Combined scenarios were observed to reduce the proportion of actual (Group 1)
outliers (24%, 22% and 21%, respectively).
In conclusion, on balance, the relative weightings for total sugars and sodium content
of foods in the Combined scenario achieves an outcome that more closely aligns the
HSR system with Dietary Guidelines compared to all other scenarios based on the
criteria used.
3.2 Impact of HSR calculator options
To understand how HSR ratings on products might broadly change from now, depending on
which calculator is adopted, the impact on HSRs achieved was considered. It is important to
note these figures are based on the TAG database of products which include products that are
not currently labelled with the HSR (the Review Report indicated that currently about a third
of products in the market use the HSR system label). FSANZ also considered the impact of
change on HSR, taking the Review calculator as a baseline and considering how the stronger
sugar and sodium scenarios might impact on HSR changes. See Appendix 1 for more detail.

Table 5: Impact of proposed changes of HSR calculator options in comparison to the Original
calculator. Data presented excludes Category 1 non-dairy beverages.
Criteria Review
scenario
Total Sugars
scenario
Sodium
scenario
Combined
scenario
Increased
HSR
(n= 5456)
15%
(792)
15%
(771)
9%
(506)
9%
(488)
Decreased
HSR
(n=5456)
7%
(381)
13%
(736)
22%
(1191)
28%
(1518)
Total
affected
(n=5456)
21%
(1173)
28%
(1507)
31%
(1697)
37%
(2006)
HSR
changes
Range -2.0 to
+2.0 stars (49%
moved +0.5 and
27% moved –0.5
stars)
Range -2.0 to
+2.0 stars (41%
moved -0.5 and
40% moved +0.5
stars)
Range -2.0 to
+2.0 stars
(majority (62%)
moved -0.5
stars)
Range -2.0 to
+2.0 stars
(majority (66%)
moved -0.5
stars)
As seen in Table 5, all scenarios were observed to result in 20% or more products being
affected by a change in HSR. The Review scenario resulted in approximately twice as many
products increasing in HSR than decreasing, if they were impacted. The Combined scenario
was observed to have a higher proportion of products affected by a change in HSR, with the
majority decreasing in HSR. 53% (800/1518) of the products that decreased in HSR under the
Combined scenario were discretionary foods. A similar pattern was observed in the Sodium
scenario.
The magnitude of change in HSR was relatively small (+/- 0.5 stars) across all scenarios.
Changes to the sodium point scale in both the Sodium scenario and Combined scenario were
observed to result in more products decreasing in rating by 0.5 stars. The Total Sugars
scenario saw a fairly equal increase and decrease by 0.5 stars. The impact of the Combined
scenario, in terms of number of products affected, was found to be less than the cumulative
effect of Total Sugar and Sodium scenarios because some of the increases in HSR due to
dairy rescaling were effectively cancelled out by the combination of changes in the Total
sugars or Sodium point scales.
Key findings - Impact
All calculator scenarios impact a minority of products in the TAG database.
The Review scenario resulted in approximately twice as many products increasing in
HSR than decreasing
The Combined scenario was observed to have a higher proportion of products affected
by a change in HSR than the Review scenario, with the majority decreasing in HSR. Of
the ones decreasing in HSR, 53% were discretionary foods.
The magnitude of change in HSR where it occurs is small (mainly +/- 0.5 stars) across
all scenarios.

3.3 Incentives for reformulation for each HSR calculator option
In its Response to the Review, the Forum was concerned that recommended changes to the
sodium point scale to use 90 mg increments for sodium content to improve the sensitivity of
the HSR calculator to foods with high sodium content, would only impact a small subset of
discretionary foods that are high in sodium (those with >900 mg sodium/100 g, noting the
Original calculator already had 90 mg increments in the sodium point scale for foods
≤ 900 mg/100g), thus providing little incentive for food reformulation. A full analysis of
potential for reformulation with the calculator options has not been conducted here. However,
some consideration of incentive for reformulation of key products that contribute to sodium
intakes for the general population is provided.
The NNPAS 2011-12 found that the main contributors to sodium intakes included Cereal-
based products and dishes, mainly from the mixed dishes where cereal is the major ingredient
(25%), Cereal and cereal products, mainly bread (18%) and Meat and poultry, mainly
processed meat and mixed dishes (18%).
In the HSR system, if a manufacturer was to reduce the sodium level in a product with the
aim of obtaining a higher HSR, an incentive is created when smaller reductions in sodium
content are needed to affect sodium baseline points and the resulting HSR. The Sodium and
Combined scenarios have smaller scaling increments (75 mg compared to 90mg increments).
Examples to demonstrate the difference in sodium reduction required to increase an HSR are
provided below, noting that as sodium content is only one of several nutrients in the HSR
calculator algorithm, a decrease of 75 mg sodium/100 g food is not necessarily required for,
or may not result in, a change in star rating.
It is important to note there are limitations to reformulation achievable depending on the
product because sodium serves several technological functions, including food preservation.
However, it is recognised that sodium reduction in processed foods in Australia is desirable
(reduction of sodium levels in processed foods is one of the aims of the Reformulation
Program of the Healthy Food Partnership in Australia). A HSR system that can provide HSR
gains with smaller reductions in sodium would assist in encouraging reformulation within
technological limits. The ranges of sodium content in a product category also give some
indication of the potential for reformulation.
Bread With the Review calculator, no breads are impacted by a change in HSR. The range of sodium
content of breads in the TAG database is 205 to 798 mg/100g. In the Sodium and Combined
scenarios, some breads reduce in HSR by 0.5 stars (23% of breads, 51/226). If small
reductions in sodium content were made (5 to 15 %, or as little as 25 mg reduction in a 400
mg sodium/ 100 g bread product) many breads affected could regain the 0.5 star decrease that
would occur if the Sodium or Combined scenarios were to be adopted. For breads not
impacted by a change in HSR, the smaller sodium increments also enable manufacturers to
increase the HSR at lower levels of sodium reduction. In comparison, with the Review
calculator, much larger reductions in sodium (75% of the total content) would be required, if
manufacturers wished to increase the HSR through sodium reformulation.
Breakfast cereals The breakfast cereals in the database have a sodium range of 0 to 710mg/100g. The HSR of
breakfast cereals is driven by a number of nutrients in the calculator that are relevant for this
product (for example, total sugars, fibre, protein). However, the more sensitive sodium
scaling in the Sodium and Combined scenarios does encourage reformulation with regards to
sodium content in some cereals more than the Review scenario. For example, in the Review
scenario a breakfast cereal with 590 mg sodium /100mg cereal would need to reduce its
sodium content by 40% to increase its star rating (unlikely due to food technology

considerations). With the more sensitive sodium scaling, sodium content would only need to
be reduced by 11% to increase the HSR, creating an incentive to reformulate.
Meat and poultry (mainly processed meat) In the TAG database, there are 6 processed delicatessen poultry meats, with a sodium content
range of 580 to 1050 mg/100 g. Under the Review scenario, an average reduction of 215 mg
of sodium is required to increase the HSR. With the more sensitive sodium scaling of the
Sodium and Combined scenarios, a smaller average reduction in sodium of 138 mg is
required to increase the HSR, assuming no other changes in the product formulation.
Key Finding
The smaller increments in sodium scaling of the Sodium scenario and Combined
scenario make it more feasible for manufacturers to reformulate if they wish to do so,
compared to the Review scenario.
4. Conclusions In terms of alignment with Dietary Guidelines, the potential impact of the system on products
and potential for reformulation, the following conclusions have been made:
Based on the assessment criteria used, all scenarios improved alignment with the Dietary
Guidelines compared to the Original (current) calculator. That said, the Combined
scenario was determined to achieve an outcome that more closely aligns the HSR system
with Dietary Guidelines as it was observed to reduce Actual (Group 1) outliers
(discretionary foods with a HSR ≥3 scoring higher than expected based on their nutritional
composition) more than all other scenarios.
The impact of all HSR calculator options was observed to result in 20% or more products
being affected by a change in HSR, with the Combined scenario observed to have a higher
proportion of products with a decreased HSR (of which 53% were discretionary foods).
The impact, in terms of magnitude of change, was relatively small for the majority of
products (+/- 0.5 stars).
Stronger approaches to sodium reduce the increments between baseline points; this is
likely to be similar with sugar but was not analysed in this report. Smaller increments
between baseline points may have the potential to incentivise Industry to reformulate
products as only a small change is required to change between baseline points.

Appendix 2: Method used to calculate the proportion of Actual (Group 1) outliers for
each scenario
Note: All calculations below exclude Category 1 non-dairy beverages.
Calculation of total outliers
The following calculation was used to determine the total number of outliers for each
scenario:
Total outliers = (no. discretionary foods with a HSR ≥3) + (no. FFG foods with a HSR <3)
Identification of Actual (Group 1) outliers
The TAG paper identified categories in the TAG database that they classified as actual
outliers (Tables 2 and 5 of the TAG paper17). These were all discretionary foods with a HSR
of ≥3 scoring higher than expected based on their nutritional profile.
The categories identified by TAG were extracted from the TAG database, excluding any
products with a HSR <3 and excluding ice confection and jellies categories. The rationale
behind this is because ice confection and jellies are now handled by a separate algorithm
(non-dairy beverages calculator) and our assessment of the stronger sugar and sodium
scenarios did not apply to that calculator. The table below lists the 5-digit codes in the TAG
database of categories determined to be actual (group 1) outliers) in our analysis:
Category as identified by TAG 5-digit code in TAG
Muesli/cereal bars 28301, 28302, 28303, 28304
Fruit bar/fruit-based confectionary 28201
Dry casserole/recipe mix/sauce mixes 23110
Ice creams ≤4.0g fat /100g 19503
Ice creams 4-10g fat /100g 19502, 19505
Dry gravy mixes 23102
Gravies (prepared) 23101
Salty snacks (crisps, corn chips and extruded snacks) 26101, 26102, 26201, 26301,
26401
Coffee-based beverages 11208
Dairy desserts 19701
Processed meat (including ham) 18602, 18604, 18605, 18606
Breakfast cereals 12502, 12504, 12513
Calculation of proportion of Actual (Group 1) outliers
The following calculation was used to determine the proportion of Actual outliers for each
scenario:
% Actual outliers = (no. Actual outliers) / (no. Total outliers)) * 100
17 HSR Technical Advisory Group (TAG) (2018) Alignment of the HSR system with the Australian and New Zealand
Dietary Guidelines: Analysis of alignment and identification of outliers.

Appendix 3: Proportion of Actual (Group 1) Outliers, mean HSR and HSR range, across the HSR calculator options
Food or drink
product
Original
calculator
Mean HSR
(range)
Original
calculator
% HSR≥3
Review
scenario
Mean HSR
(range)
Review
scenario
% HSR≥3
Total
Sugars
scenario
Mean HSR
(range)
Total
Sugars
scenario
% HSR≥3
Sodium
scenario
Mean HSR
(range)
Sodium
scenario
% HSR≥3
Combined
scenario
Mean HSR
(range)
Combined
scenario
% HSR≥3
Muesli/cereal
bars
2.7
(0.5 – 5.0)
50%
(n=67/134)
2.8
(0.5 – 5.0)
47%
(n=63/134)
2.6
(0.5 – 5.0)
43%
(n=58/134)
2.7
(0.5 – 5.0)
46%
(n=61/134)
2.6
(0.5 – 5.0)
43%
(n=57/134)
Fruit bar/fruit-
based
confectionary
3.2
(1.0 – 4.0)
89%
(n=16/18)
2.9
(0.5 – 4.0)
61%
(n=11/18)
2.8
(0.5 – 4.0)
39%
(n=7/18)
2.9
(0.5 – 4.0)
61%
(n=11/18)
2.8
(0.5 – 5.0)
39%
(n=7/18)
Dry casserole/
recipe mix/sauce
mixes
2.9
(0.5 – 4.0)
71%
(n=75/105)
2.9
(0.5 – 4.0)
71%
(n=75/105)
2.9
(0.5 – 4.0)
71%
(n=75/105)
2.8
(0.5 – 4.0)
69%
(n=72/105)
2.8
(0.5 – 4.0)
68%
(n=71/105)
Ice creams ≤4.0g
fat /100g
3.2
(3.0 – 3.5)
100%
(n-27/27)
3.2
(2.5 – 3.5)
96%
(n=26/27)
3.1
(2.5 – 3.5)
93%
(n=25/27)
3.1
(2.5 – 3.5)
93%
(n=25/27)
3.1
(2.5 – 3.5)
89%
(n=24/27)
Ice creams 4-10g
fat /100g
2.5
(1.5 – 3.5)
29%
(n=13/45)
2.5
(1.5 – 3.5)
29%
(n=13/45)
2.4
(1.5 – 3.5)
24%
(n=11/45)
2.4
(1.5 – 3.5)
29%
(n=13/45)
2.4
(1.5 – 3.5)
24%
(n=11/45)
Dry gravy mixes 3.0
(2.5 – 3.5)
89%
(n=34/38)
3.0
(2.5 – 3.5)
89%
(n=34/38)
3.0
(2.5 – 3.5)
89%
(n=34/38)
2.8
(2.5 – 3.0)
53%
(n=20/38)
2.8
(2.5 – 3.0)
53%
(n=20/38)
Gravies
(prepared)
3.0
(2.5 – 3.0)
93%
(n=27/29)
3.0
(2.5 – 3.0)
93%
(n=27/29)
3.0
(2.5 – 3.0)
93%
(n=27/29)
2.8
(2.5 – 3.0)
59%
(n=17/29)
2.8
(2.5 – 3.0)
59%
(n=17/29)
Salty snacks
(crisps, corn
chips & extruded
snacks)
1.9
(0.5 – 4.5)
17%
(n=20/120)
1.9
(0.5 – 4.5)
17%
(n=20/120)
1.9
(0.5 – 4.5)
17%
(n=20/120)
1.7
(0.5 – 4.0)
11%
(n=13/120)
1.7
(0.5 – 4.0)
11%
(n=13/120)
Coffee-based
beverages
3.2
(3.0 – 4.0)
100%
(n=22/22)
3.2
(3.0 – 4.0)
100%
(n=22/22)
3.2
(3.0 – 4.0)
100%
(n=22/22)
3.2
(3.0 – 4.0)
100%
(n=22/22)
3.2
(3.0 – 4.0)
100%
(n=22/22)
Dairy desserts 2.9 74% 2.9 68% 2.7 64% 2.8 68% 2.7 64%

Food or drink
product
Original
calculator
Mean HSR
(range)
Original
calculator
% HSR≥3
Review
scenario
Mean HSR
(range)
Review
scenario
% HSR≥3
Total
Sugars
scenario
Mean HSR
(range)
Total
Sugars
scenario
% HSR≥3
Sodium
scenario
Mean HSR
(range)
Sodium
scenario
% HSR≥3
Combined
scenario
Mean HSR
(range)
Combined
scenario
% HSR≥3
(0.5 – 3.5) (n=35/47) (0.5 – 4.5) (n=32/47) (0.5 – 4.0) (n=30/47) (0.5 – 4.5) (n=32/47) (0.5 – 4.0) (n=30/47)
Processed meat
(including ham)
2.7
(1.0 – 4.0)
53%
(n=31/59)
2.6
(1.0 – 4.0)
47%
(n=28/59)
2.6
(1.0 – 4.0)
47%
(n=28/59)
2.2
(1.0 -4.0)
37%
(n=22/59)
2.3
(1.0 – 4.0)
37%
(n=22/59)
Breakfast cereals
(>30 g
sugars/100 g or
>35 g/100 with
dried fruit)
2.2
(1.5 – 3.5)
6%
(n=1/16)
2.0
(1.5 – 3.0)
6%
(n=1/16)
1.8
(1.0 – 3.0)
6%
(n=1/16)
1.9
(1.5 – 3.0)
6%
(n=1/16)
1.7
(1.0 – 3.0)
6%
(n=1/16)

Appendix 4: Mean and range of HSR for selected products
MUESLI AND SNACK BARS (discretionary foods)
(includes fruit bars, snack bars and all muesli bars)
DRIED FRUIT (FFG foods)
(includes categories: dried fruit and nut mixes, other dried fruit mixes and dried vine fruit).
BISCUITS (FFG and discretionary foods)
(includes sweet and savoury)

CHEESE (FFG foods)
(including hard, brie/camembert styles and processed cheeses, Category 3D)
The mean HSR for cheese varied across the scenarios, with the mean HSR being higher than the
Original for the Review and Total Sugars scenarios, and slightly lower than the Original for the
Sodium and Combined scenarios. The overall distribution of HSR for cheeses was observed to be
the same across all the scenarios. That said, the interquartile range (boxes) was observed to be
higher (2.0 - 4.0) for the Review and Total Sugar scenarios when compared to the other scenarios,
including the Original calculator (1.5 - 4.0). This is likely attributable to the dairy-rescaling, which
is somewhat mitigated by the changes in the sodium point scale in the Sodium and Combined
scenarios. All scenarios help to differentiate cheese with a higher nutritional profile for the cheese
category, with reduced fat cheeses having a higher HSR range than full fat varieties (4.0 - 5.0; 0.5 -
5.0, respectively).
The FSANZ analysis of the Combined scenario for cheese relative to the Review as a baseline
found that the maximum reduction in HSR of 1.5 stars was found in four reduced fat cheeses,
therefore concluded that misaligned with Dietary Guidelines because it had a stronger impact on
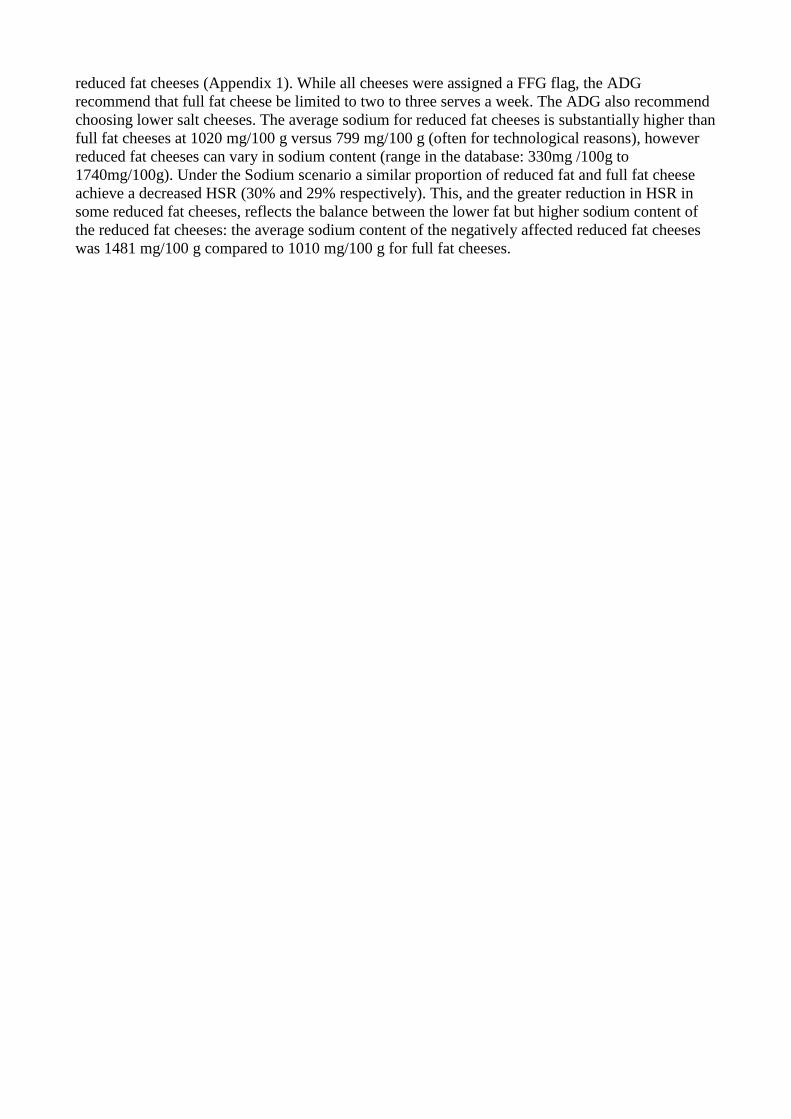
reduced fat cheeses (Appendix 1). While all cheeses were assigned a FFG flag, the ADG
recommend that full fat cheese be limited to two to three serves a week. The ADG also recommend
choosing lower salt cheeses. The average sodium for reduced fat cheeses is substantially higher than
full fat cheeses at 1020 mg/100 g versus 799 mg/100 g (often for technological reasons), however
reduced fat cheeses can vary in sodium content (range in the database: 330mg /100g to
1740mg/100g). Under the Sodium scenario a similar proportion of reduced fat and full fat cheese
achieve a decreased HSR (30% and 29% respectively). This, and the greater reduction in HSR in
some reduced fat cheeses, reflects the balance between the lower fat but higher sodium content of
the reduced fat cheeses: the average sodium content of the negatively affected reduced fat cheeses
was 1481 mg/100 g compared to 1010 mg/100 g for full fat cheeses.