Hospital Quality Star Rating on Hospital Compare … Goal of Public Input Period ... 3.1 Combined...
25
1 Hospital Quality Star Rating on Hospital Compare Public Input Period Enhancements of the Overall Hospital Quality Star Rating Prepared by: Yale New Haven Health Services Corporation/Center for Outcomes Research & Evaluation (YNHHSC/CORE) August 2017
Transcript of Hospital Quality Star Rating on Hospital Compare … Goal of Public Input Period ... 3.1 Combined...

1
Hospital Quality Star Rating on Hospital Compare Public Input Period
Enhancements of the Overall Hospital Quality Star Rating
Prepared by: Yale New Haven Health Services Corporation/Center for Outcomes Research & Evaluation (YNHHSC/CORE)
August 2017

2
Table of Contents 1. Introductions ................................................................................................................................................... 3
1.1 Background .............................................................................................................................................. 3
1.2 Goal of Public Input Period ...................................................................................................................... 3
2. Providing Feedback ......................................................................................................................................... 5
2.1 Instructions for Providing Comments ...................................................................................................... 5
3. Enhancements for the Overall Star Rating ...................................................................................................... 6
3.1 Combined Enhancement for the Star Rating Calculation ........................................................................ 6
3.2 Application of Quadrature in Latent Variable Models .......................................................................... 10
4. Topics Under Ongoing Re-evaluation ............................................................................................................ 11
4.1 Weighting of Measure Groups .............................................................................................................. 11
4.2 Negative Loadings.................................................................................................................................. 13
4.3 Public Reporting Thresholds .................................................................................................................. 16
5. Future Areas of Re-evaluation ....................................................................................................................... 17
5.1 Stratification by Hospital Type or Characteristics ................................................................................. 17
5.2 Measure Inclusion ................................................................................................................................. 18
Appendix A: Overall Star Rating Assignment Enhancements ................................................................................ 19

3
1. Introductions The Centers for Medicare & Medicaid Services (CMS) contracted with the Center for Outcomes Research and Evaluation (CORE) to re-evaluate the Overall Hospital Quality Star Rating on Hospital Compare. The goal of the Overall Hospital Quality Star Rating project is to improve the usability, accessibility, and interpretability of CMS’s hospital quality website, Hospital Compare, for patients and consumers. We seek public input on proposed methodology enhancements for the Overall Star Rating.
1.1 Background The Centers for Medicare and Medicaid Services (CMS) contracted with Yale New Haven Health Services Corporation – Center for Outcomes Research and Evaluation (CORE) and Lantana Consulting Group to work in collaboration with other contractors to re-evaluate and develop the Hospital Quality Star Rating on Hospital Compare (hereinafter “Overall Star Rating”). Hospital Compare is a website that includes information on over 100 quality measures and more than 4,000 hospitals.
The primary objective of the Overall Star Rating project is to summarize information from the existing measures on Hospital Compare in a way that is useful and easy to interpret for patients and consumers. Consistent with other star rating programs, the methodology assigns each hospital between one and five stars, reflecting the hospital’s overall performance on selected quality measures. The Overall Star Ratings are intended to complement existing efforts, such as the individual measures on Hospital Compare and the Hospital Consumer Assessment of Healthcare Providers and Systems star rating.
The guiding principles for the Overall Star Rating methodology development are:
1. Alignment with Hospital Compare and other CMS programs; 2. Transparency of methodological decisions; and 3. Being responsive to and inclusive of stakeholder input.
In the past, CMS and the development team have sought to be transparent and responsive to stakeholder input by convening a multi-stakeholder Technical Expert Panel in 2014 and a Patient & Patient Advocate Work Group in 2015 as well as holding two public input periods, two National Provider Calls, and a hospital dry run. In 2017, CMS and the development team continue efforts to maximize transparency by building upon these prior stakeholder engagement activities by assembling a new multi-disciplinary Technical Expert Panel and convening a Provider Leadership Work Group.
1.2 Goal of Public Input Period CMS and the development team are seeking a wide variety of stakeholder input on several methodology re-evaluation items designed to enhance the Overall Star Rating methodology. This public input period aims to highlight technical and policy considerations for the public.
While we welcome public input and insight on any aspect of the Overall Star Rating methodology, the development team would appreciate comments on the content within these materials. While the team has evaluated several methodological enhancements and continues to evaluate others, this public input period is designed to solicit specific feedback on the enhancements listed, as well as topics in active re-evaluation. Please note we are receiving concurrent input from our Technical Expert Panel and our work groups.

4
Specifically, this document:
1. Describes the process for providing feedback during the public input period (Section 2) 2. Presents enhancements for the Overall Star Rating (Section 3) 3. Presents topics under ongoing re-evaluation (Section 4) 4. Proposes future areas of re-evaluation (Section 5) 5. Provides results of the Overall Star Rating assignment enhancement (Appendix A)
We invite the public to comment on the Overall Star Rating methodology. Feedback provided by stakeholders will inform any potential future Star Rating work by CMS.
5
2. Providing Feedback CMS requests that interested parties submit comments on the methodology under re-evaluation for the Overall Star Rating. CMS asks that stakeholders provide comments regarding the approaches to calculating hospital summary scores and translating summary scores to star ratings. The public may also offer general suggestions regarding the Overall Star Rating project.
2.1 Instructions for Providing Comments • If you are providing comments on behalf of an organization, include the organization’s name and
contact information. • If you are commenting as an individual, submit identifying or contact information. • Comments are due by close of business September 27, 2017. • Please do not include personal health information in your comments. • Send your comments to [email protected].

6
3. Enhancements for the Overall Star Rating
3.1 Combined Enhancement for the Star Rating Calculation Background The development team is currently seeking public input on a number of possible enhancements for the Overall Star Rating methodology. These topics were also discussed with stakeholder and expert groups. Within Step 5 of the Overall Star Rating methodology, which assigns hospitals to a star rating based on their summary scores, the development team investigated three main topics for enhancement, which are listed below. These topics were chosen based on earlier stakeholder and expert feedback.
• K-means clustering using complete convergence • Hospital summary score winsorization • Resequencing reporting thresholds
Figure 1. Current Overall Star Rating Methodology Sequence
K-Means Clustering K-means clustering is used in the Overall Star Rating methodology to create five star categories and assign hospitals to star categories in a way that ensures hospital summary scores are more similar within that star category and more different than summary scores in other star categories. Within the Statistical Analysis System software, k-means clustering separates hospital summary scores into the five star categories. The current Statistical Analysis System software procedure utilizes the recommended default setting, which runs a single iteration to identify the k-means clusters or star categories. Through stakeholder input, and as a part of planned Overall Star Rating re-evaluation, we have assessed the use of multiple iterations of clustering to achieve complete convergence as a technical enhancement to the methodology. Complete converegence essentially recalculates star ratings to identify the optimal solution of star ratings assignments.

7
Hospital Summary Score Winsorization The current methodology also winsorizes the hospital summary score prior to clustering in order to minimize the number of extreme outliers and promote a broader distribution of star ratings without sacrificing reliability. The original decision to winsorize the hospital summary scores was implemented based on policy and consumer input to generate a broader star rating distribution by avoiding the clustering of extreme outlier hospitals into a star rating category. Given that use of complete convergence for k-means clustering results in a broader distribution of star ratings, this winsorization step no longer appears to be necessary.
Resequencing Reporting Thresholds In the current methodology, the star ratings are assigned after winsorization of the hospital summary scores but prior to application of the public reporting threshold. This sequence was originally designed to maximize the amount of “information” available for clustering hospitals and to apply the public reporting threshold in a manner that could provide hospitals with private rating information if the number or type of measures reported were not sufficient to receive a publicly reported star rating. This approach mirrors the approach used for many individual quality measures reported on Hospital Compare. Based on prior stakeholder feedback and regularly planned analyses, the development team believes that the steps to star rating assignment should be reordered so that star rating assignment (clustering) is applied after the public reporting thresholds are applied. In other words, only those hospitals that meet the public reporting thresholds would be clustered into star ratings. Because k-means clustering is inherently a comparative analytic procedure, there may be better conceptual basis to apply clustering only to the subset of hospitals for which a star rating is ultimately to be reported.
Figure 2. Proposed Methodology Enhancement Sequence

8
Consolidated Methodology Enhancements Taken together, the potential enhancements can be implemented as a combined improvement to the Overall Star Rating methodology by applying the reporting threshold prior to k-means clustering, removing hospital summary score winsorization, and using complete convergence for k-means clustering. Prior to making such changes to the methodology, CMS seeks input regarding these recommendations in order to receive stakeholder feedback, anticipate any unexpected results, and inform future Technical Expert Panel and work group discussions.
Re-evaluation Activities We conducted several analyses to better understand this consolidated improvement and its impact on the methodology and ratings. These analyses can be found in the appendix.
Distribution (Table 1): Complete convergence, without any adjustment to current winsorization, results in a broader distribution of hospitals across star ratings by increasing the difference between hospital summary scores for different star categories. The distribution is modestly broader with public reporting thresholds applied prior to clustering. The broader distribution only shifts hospitals outwards, resulting in more one-, two-, four-, and five-star hospitals. More details are available in Table 1 and Appendix A.
Table 1. Overall Star Rating Distribution for Default Settings and Complete Convergence (December 2016 Data)
Star Rating Default (Current) Complete Convergence w/o Winsorization, w/ Resequencing
1 112 (3.09%) 208 (5.73%)
2 694 (19.12%) 721 (19.87%)
3 1,794 (49.44%) 1,170 (32.24%)
4 946 (26.07%) 1,140 (31.41%)
5 83 (2.29%) 390 (10.75%)
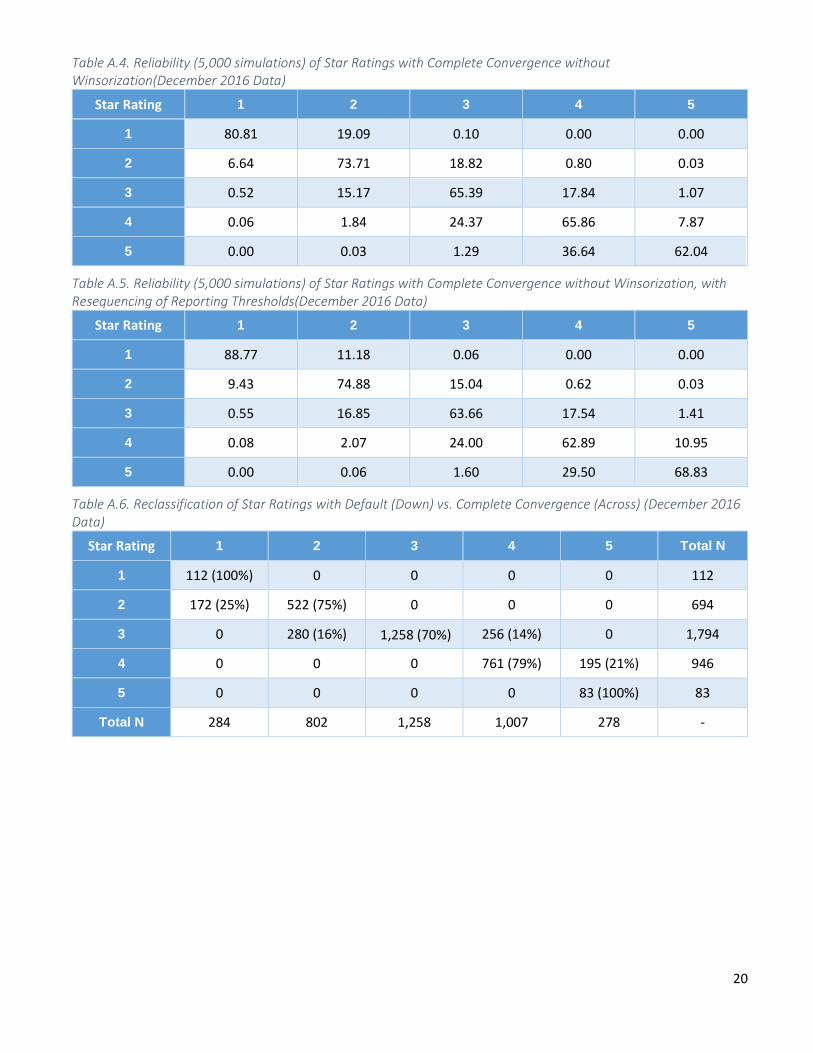
Reliability (Appendix A, Table A.2-A.5): The development team used a simulation methodology to test the reliability of star ratings classification based on how often hospitals remained in the same star category or moved to other star categories during the simulations. The simulations revealed that the current clustering method resulted in moderate overall reliability while complete convergence had higher reliability for the one- and five-star categories and moderate reliability for the two-, three-, and four-star categories.
Reclassification (Appendix A, Table A.6-A.8): When compared to the prior December 2016 results, complete convergence without winsorization resulted in 698 hospitals shifting outward with 178 transferring to a higher star rating and 520 transferring to a lower star rating. Hospitals do not shift more than one-star category with three-star hospitals becoming two-star or four-star hospitals, four-star hospitals becoming five-star, and two-star hospitals becoming one-star hospitals.
Pairwise Comparison (Appendix A, Table A.9-A.15): Using complete convergence, more measure groups have five-star hospitals with measure group scores that are significantly (p<0.0001) better than four-star hospitals, four-star hospitals that are better than three-star hospitals, and so on.
9
Current Technical Expert Panel and Stakeholder Feedback The current Technical Expert Panel was in general agreement that this is a positive enhancement to the methodology. They also asked the development team to examine the stability of clustering, impact analyses of these proposed changes, and to evaluate other statistical clustering options as part of future re-evaluation activities.
Questions for Public Input:
1. Should the updates described above be implemented in a future Overall Star Rating release? 2. Does it make sense to limit the number of hospitals included in the clustering of hospitals for star
assignements to those hospitals that will receive a star rating (meaning hospitals that meet the public reporting threshold)?
3. Do you agree with removing the winsorization step from the methodology since these updates allow for a broader distribution?

10
3.2 Application of Quadrature in Latent Variable Models Background Calculating a measure group score for each hospital using latent variable models require the calculation of an integral, which is approximated using quadrature. Quadrature is a numeric method for approximating integrals by calculating a weighted sum of function (or equation) values for the random effect. In the original Overall Star Rating Statistical Analysis System software pack, the quadrature method used in latent variable modeling used the option of ‘NOAD’ to utilize non-adaptive Gaussian quadrature in order to obtain estimations in reasonable time without initial values.
A common challenge encountered with the use of non-adaptive Gaussian quadrature is that it often requires the use of a large number of quadrature points, or an outcome following a strict normal distribution, to calculate the log-likelihood and derivatives necessary to achieve an acceptable level of accuracy. CMS seeks to enhance the methodology by using the ‘NOAD’ option to calculate initial values for each latent variable model, but to add the use of adaptive quadrature to each model to ensure more stable estimates.
Re-evaluation Activities The development team seeks to optimize the approximation of the integral, the latent variable modeling solution, by adding a specification to require XTOL = 10^-5 as the relative parameter convergence criterion. In addition, the development team seeks to use adaptive quadrature, using the empirical Bayes means and variances, updated at each iteration to essentially shift and scale the quadrature locations during calculation. This centering and scaling improves the likelihood approximation by placing each quadrature point according to the density function of the random effect. As a result, adaptive Gaussian quadrature needs fewer quadrature points than non-adaptive Gaussian quadrature to receive accurate estimations.
The development team has tested this improvement in several prior reporting periods and believes this improvement will yield improvements in the stability of hospital measure group scores, and ultimately improve the reliability of hospital star rating classifications.
Question for Public Input:
1. Are there any concerns with making this technical modification to the methodology?

11
4. Topics Under Ongoing Re-evaluation We are seeking public input concurrent with re-evaluation work in order to maximize transparency and identify any potential opportunities or concerns earlier in the process. In this section, you will find a number of topics the team is currently exploring.
4.1 Weighting of Measure Groups Background In the current Overall Star Rating methodology, measure groups are combined to create a hospital summary score through the weighted average of that hospital’s available group scores. The current weighting scheme (Table 2) was modified from that used by the Hospital Value-Based Purchasing program. We have also included example alternatives of weighting for comment (Table 3). Commenters can also send any other recommendations they feel are more appropriate for the measure group weightings.
Re-evaluation Activities The development team is currently seeking public input as this is a policy-based decision, which was previously discussed with the original Technical Expert Panel and vetted through public input.
Prior Feedback The previous Technical Expert Panel and work groups suggested that outcome measures hold more importance and information than process or imaging measures and therefore, should contribute more to the Overall Star Rating. The original Technical Expert Panel also emphasized the need for consistent incentives between CMS measurement programs. The development team has also brought these measure weights to other stakeholder groups including the Patient & Patient Advocate Work Group and the Provider Leadership Work Group.
Current Technical Expert Panel Feedback Some of the current Technical Expert Panel agreed that outcome measures hold more importance than process measures. Some members also felt the process Effectiveness of Care and Timeliness of Care groups should hold more weight, albeit less than outcome measure groups. A few members had mixed feelings about the inclusion of the Patient Experience group in the Overall Star Rating due to the separate Hospital Consumer Assessment of Healthcare Providers and Systems star rating, however several members felt strongly that Patient Experience was an important aspect of overall quality and should be included. In general, Technical Expert Panel presented a variety of views including some members that favored the simple current approach to weighting in which all outcomes groups received the same weight and all process groups received the same weight.
Table 2. Measure Group Weighting for the Star Rating
Measure Group Star Rating Weights
Mortality 22%
Safety of Care 22%
Readmission 22%
Patient Experience 22%
Effectiveness of Care 4%
Timeliness of Care 4%
Efficient Use of Medical Imaging 4%

12
Table 3. Example of Alternative Measure Group Weighting
Questions for Public Input:
1. Do you have a preference between the current and alternative weightings? 2. Would you propose an alternative distribution of measure group weights? 3. If modified, what process should be used to determine new weights?
Measure Group Star Rating Weights
Alternative #1 Star Rating Weights
Alternative #2 Mortality 20% 25%
Safety of Care 20% 15%
Readmission 20% 15%
Patient Experience 20% 25%
Effectiveness of Care 8% 8%
Timeliness of Care 8% 8%
Efficient Use of Medical Imaging 4% 4%

13
4.2 Negative LoadingsBackground The latent variable model for each measure group produces a loading for each measure, which represents the degree of the measure’s influence on the group score relative to the other measures included in the same group. Measures that are more consistent or more correlated within the group have a greater influence on the hospital’s group score.
A negative loading indicates that an individual measure is in a reverse relationship with the latent variable compared with most other included measures. As such, hospitals with higher summary scores, or latent quality, are likely to have higher values on numerous positively loaded measures and lower values on the rare negatively loaded measures. Conceptually, this could mean that if two hospitals had identical performance on all but one negatively loaded measure, the hospital with higher (better) performance on that negatively loaded measure would have a lower summary score than the hospital with lower performance on that negatively loaded measure. Holding all other measure scores constant, the summary score for these two hospitals would be very similar, unless the negatively loaded measure dominated the summary score. This scenario, while highly improbable, is problematic with respect to face validity.
In the current methodology, a measure’s loading is specific to the measure and considers national performance on the measures and its correlation with all other measures in the measure group. In other words, the loading may change quarter to quarter depending on national performance and other measures included or excluded from the measure group. In recent quarters of public reporting, between one and three of the 57 included quality measures in the Overall Star Rating have had a negative loading. However, these measure loadings are statistically non-significant as each measure loadings’ 95% confidence interval includes zero. While several explanations may exist for negative loadings conceptually, in actuality, little effect is seen from these measures on the Overall Star Rating.
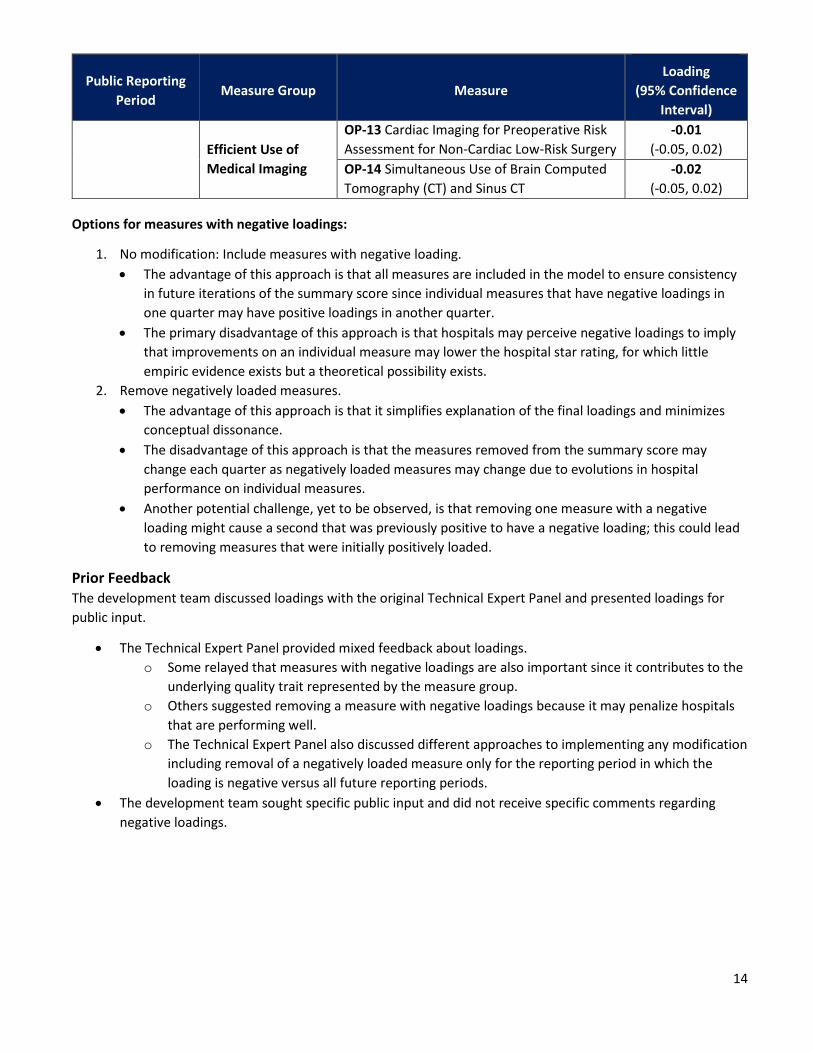
Re-evaluation Activities For each quarter that the Overall Star Rating has been publicly reported, there was at least one and no more than three measures with negative loadings. The measures and their loadings are presented in Table 4 below.
Table 4. Measures with Negative Loadings by Reporting Period
Public Reporting Period
Measure Group Measure Loading
(95% Confidence Interval)
July 2016
Safety of Care HAI-6 Clostridium Difficile (C.difficile) -0.007
(-0.026, 0.012)
Efficient Use of Medical Imaging
OP-13 Cardiac Imaging for Preoperative Risk Assessment for Non-Cardiac Low-Risk Surgery
-0.01 (-0.05, 0.02)
OP-14 Simultaneous Use of Brain Computed Tomography (CT) and Sinus CT
-0.02 (-0.05, 0.02)
October 2016
Safety of Care HAI-6 Clostridium Difficile (C.difficile) 0.001
(-0.018, 0.020)
Efficient Use of Medical Imaging
OP-13 Cardiac Imaging for Preoperative Risk Assessment for Non-Cardiac Low-Risk Surgery
-0.01 (-0.05, 0.02)
OP-14 Simultaneous Use of Brain Computed Tomography (CT) and Sinus CT
-0.02 (-0.05, 0.02)
December 2016 Safety of Care HAI-6 Clostridium Difficile (C.difficile) 0.03
(0.01, 0.05)
14
Public Reporting Period
Measure Group Measure Loading
(95% Confidence Interval)
Efficient Use of Medical Imaging
OP-13 Cardiac Imaging for Preoperative Risk Assessment for Non-Cardiac Low-Risk Surgery
-0.01 (-0.05, 0.02)
OP-14 Simultaneous Use of Brain Computed Tomography (CT) and Sinus CT
-0.02 (-0.05, 0.02)
Options for measures with negative loadings:
1. No modification: Include measures with negative loading. • The advantage of this approach is that all measures are included in the model to ensure consistency
in future iterations of the summary score since individual measures that have negative loadings in one quarter may have positive loadings in another quarter.
• The primary disadvantage of this approach is that hospitals may perceive negative loadings to imply that improvements on an individual measure may lower the hospital star rating, for which little empiric evidence exists but a theoretical possibility exists.
2. Remove negatively loaded measures. • The advantage of this approach is that it simplifies explanation of the final loadings and minimizes
conceptual dissonance. • The disadvantage of this approach is that the measures removed from the summary score may
change each quarter as negatively loaded measures may change due to evolutions in hospital performance on individual measures.
• Another potential challenge, yet to be observed, is that removing one measure with a negative loading might cause a second that was previously positive to have a negative loading; this could lead to removing measures that were initially positively loaded.
Prior Feedback The development team discussed loadings with the original Technical Expert Panel and presented loadings for public input.
• The Technical Expert Panel provided mixed feedback about loadings. o Some relayed that measures with negative loadings are also important since it contributes to the
underlying quality trait represented by the measure group. o Others suggested removing a measure with negative loadings because it may penalize hospitals
that are performing well. o The Technical Expert Panel also discussed different approaches to implementing any modification
including removal of a negatively loaded measure only for the reporting period in which the loading is negative versus all future reporting periods.
• The development team sought specific public input and did not receive specific comments regarding negative loadings.

15
Current Technical Expert Panel Feedback While some Technical Expert Panel members felt strongly that measures with statistically significant negative loadings should be removed, other Technical Expert Panel members felt less strongly, noting this wasn’t an important issue at this time, or even stating a preference for inclusion of all measures not meeting the original exclusion criteria. There was broad Technical Expert Panel agreement that if removed, only measures with a statistically significant (p<0.05) negative loading should be removed. The Technical Expert Panel also discussed the options for removing such measures, including the removal of measures for that reporting period or removal of measures from all reporting periods moving forward.
Questions for Public Input:
1. Should measures with negative loadings be retained in the Overall Star Rating? 2. Should measures with negative, but non-significant (for example, 95% confidence interval includes zero)
be treated the same or different from measures with a significant negative loading?

16
4.3 Public Reporting Thresholds Background The current methodology requires that hospitals must report at least three measure groups, one of which must be an outcome group, with at least three measures within each measure group to receive a star rating. In addition, if a hospital meets this criteria, any other reported measure or measure group is subsequently included in the calculation of the star rating. In other words, if a hospital meets these thresholds and has additional measure groups, each with one to two measures, these group scores will be included in their star rating using standard weights.
This approach was intended to balance maximizing the number of hospitals receiving a star rating with the need for hospital star ratings to be based on a minimum amount of information, ensuring face validity and reliability. The current reporting thresholds were derived from discussions with the original Technical Expert Panel as well as vetted through public input processes. Although in the first quarter of the Overall Star Rating we noted some imbalance of measure reporting across star rating categories (limited reporting of mortality measures among hospitals receiving five stars), this pattern is no longer observed as the number and type of measures on Hospital Compare has evolved.
Currently the proportion of hospitals reporting each measure group is balanced and consistent across each measure group.
Re-evaluation Activities Additional analyses conducted by the development team to assess the relationship between individual measure reporting and group scores also revealed little correlation and no systematic relationship between the number of measures reported and each group score.
Prior Feedback Some stakeholders have expressed concern that hospitals being compared in the Overall Star Rating are too different with respect to the number or type of measures included. Because the types and number of measures reported can vary between hospitals, stakeholders have suggested that reporting criteria should be adjusted so that the Overall Star Rating includes hospitals reporting more similar numbers of measures. In addition, some stakeholders have suggested that not all other measures should be included in the star rating once the reporting threshold is met. In other words, three measures should still be required for additional measure groups to be included.
Current Technical Expert Panel Feedback While the development team had discussions about the thresholds, the current Technical Expert Panel did not feel strongly about changing the current reporting threshold.
Questions for Public Input:
1. Should the current measure group requirements (three measure groups with one outcome group) be modified?
2. Should the current minimum measure requirement (three measures) be modified? 3. Should the current inclusion of all other measures once the reporting threshold is met be modified?

17
5. Future Areas of Re-evaluation The development team is currently planning a list of future areas of re-evaluation based on prior activities and recent feedback and suggestions from stakeholders, the Technical Expert Panel, and work groups.
5.1 Stratification by Hospital Type or Characteristics Background Similar to the reporting of individual quality measures, the current Overall Star Rating methodology does not stratify by type or characteristic of hospitals. Stakeholders have expressed concern that hospitals included in the Overall Star Rating are too different in numbers or types of individually reported quality measures. Currently, the proportion of hospitals reporting each measure group is fairly balanced across each star rating category.
Currently, the development team’s re-evaluation activities investigating the public reporting threshold have also generated feedback recommending the stratification of hospitals for the Overall Star Rating. Of note, a primary concern with this approach is that it may confuse patients and families since hospital ratings in different stratas may not be directly comparable.
Current Technical Expert Panel Feedback Some members of our current Technical Expert Panel did recommend stratification by hospital type. Specific options for stratification raised were Critical Access Hospitals or specialty hospital designation, or by the number of measures or measure groups reported. Some members of the panel do not feel that stratification is appropriate because it is not indicated by the original measure stewards. Some also added that stratification by hospital type implies there may be substantial and inappropriate bias in a given measure that are not accounted for and felt that empirical evidence would need to be presented before implementation of any stratification.
Questions for Public Input:
1. Should the Ovearll Star Rating be stratified? If so, by what characteristics or feature of hospital quality reporting?
2. Should the Overall Star Rating be stratified by type of hospital? 3. Are there other hospital characteristics we should consider in any stratification testing? 4. Do you have any concerns about the comparability of star ratings if stratification is applied?

18
5.2 Measure Inclusion Background The current Overall Star Rating methodology has measure inclusion criteria that was vetted through a Technical Expert Panel, the Patient & Patient Advocate Work Group, and a public input period. Currently the measure exclusion criteria is as follows:
• Measures suspended, retired, or delayed from public reporting on Hospital Compare; • Measures with no more than 100 hospitals reporting performance publicly; • Structural measures (for example, participation in a registry, or patient volume); • Measures for which it is unclear whether a higher or lower score is better (non-directional); • Measures not required for Inpatient Quality Reporting (IQR) Program or Outpatient Quality Reporting
(OQR) Program; and • Overlapping measures (for example, measures that are identical to another measure, or measures with
substantial overlap in cohort and/or outcome).
Questions for Public Input:
1. Are there other measure inclusion criteria the Overall Star Rating methodology should take into consideration?
2. Are there certain measures that are currently excluded that you feel should not be excluded?

19
Appendix A: Overall Star Rating Assignment Enhancements Table A.1. Overall Star Rating Distribution for Default Settings and Complete Convergence (December 2016 Data)
Star Rating Default (Current) Complete Convergence Complete
Convergence w/o Winsorization
Complete Convergence w/o Winsorization, w/
Resequencing
1 112 (3.09%) 284 (7.83%) 284 (7.83%) 208 (5.73%)
2 694 (19.12%) 802 (22.10%) 870 (23.97%) 721 (19.87%)
3 1,794 (49.44%) 1,258 (34.67%) 1,368 (37.70%) 1,170 (32.24%)
4 946 (26.07%) 1,007 (27.75%) 924 (25.46%) 1,140 (31.41%)
5 83 (2.29%) 278 (7.66%) 183 (5.04%) 390 (10.75%)
Table A.2. Reliability (5,000 simulations) of Star Ratings with Default Settings(December 2016 Data)
Star Rating 1 2 3 4 5
1 79.72 20.28 0 0 0
2 2.9 79.98 17.02 0.09 0
3 0.08 9.69 78.32 11.71 0.2
4 0 0.37 26.8 70.6 2.24
5 0 0 0.08 45.14 54.78
Table A.3. Reliability (5,000 simulations) of Star Ratings with Complete Convergence(December 2016 Data)
Star Rating 1 2 3 4 5
1 80.81 19.09 0.10 0 0
2 6.64 73.71 18.82 0.80 0.03
3 0.52 15.17 65.39 17.84 1.07
4 0.06 1.84 24.37 65.86 7.87
5 0 0.03 1.29 36.64 62.04
20
Table A.4. Reliability (5,000 simulations) of Star Ratings with Complete Convergence without Winsorization(December 2016 Data)
Star Rating 1 2 3 4 5
1 80.81 19.09 0.10 0.00 0.00
2 6.64 73.71 18.82 0.80 0.03
3 0.52 15.17 65.39 17.84 1.07
4 0.06 1.84 24.37 65.86 7.87
5 0.00 0.03 1.29 36.64 62.04
Table A.5. Reliability (5,000 simulations) of Star Ratings with Complete Convergence without Winsorization, with Resequencing of Reporting Thresholds(December 2016 Data)
Star Rating 1 2 3 4 5
1 88.77 11.18 0.06 0.00 0.00
2 9.43 74.88 15.04 0.62 0.03
3 0.55 16.85 63.66 17.54 1.41
4 0.08 2.07 24.00 62.89 10.95
5 0.00 0.06 1.60 29.50 68.83
Table A.6. Reclassification of Star Ratings with Default (Down) vs. Complete Convergence (Across) (December 2016 Data)
Star Rating 1 2 3 4 5 Total N
1 112 (100%) 0 0 0 0 112
2 172 (25%) 522 (75%) 0 0 0 694
3 0 280 (16%) 1,258 (70%) 256 (14%) 0 1,794
4 0 0 0 761 (79%) 195 (21%) 946
5 0 0 0 0 83 (100%) 83
Total N 284 802 1,258 1,007 278 -

21
Table A.7. Reclassification of Star Ratings with Default (Down) vs. Complete Convergence Without Winsorization (Across) (December 2016 Data)
Star Rating 1 2 3 4 5 Total N
1 112 (100%) 0 0 0 0 112
2 172 (25%) 522 (75%) 0 0 0 694
3 0 348 (19%) 1,368 (76%) 78 (4%) 0 1,794
4 0 0 0 846 (89%) 100 (11%) 946
5 0 0 0 0 83 (100%) 83
Total N 284 870 1,368 924 183 -
Table A.8. Reclassification of Star Ratings with Default (Down) vs. Complete Convergence Without Winsorization, With Resequencing Reporting Thresholds (Across) (December 2016 Data)
Star Rating 1 2 3 4 5 Total N
1 112 (100%) 0 0 0 0 112
2 96 (14%) 598 (86%) 0 0 0 694
3 0 123 (7%) 1,170 (65%) 501 (28%) 0 1,794
4 0 0 0 639 (68%) 307 (33%) 946
5 0 0 0 0 83 (100%) 83
Total N 208 721 1,170 1,140 390 -
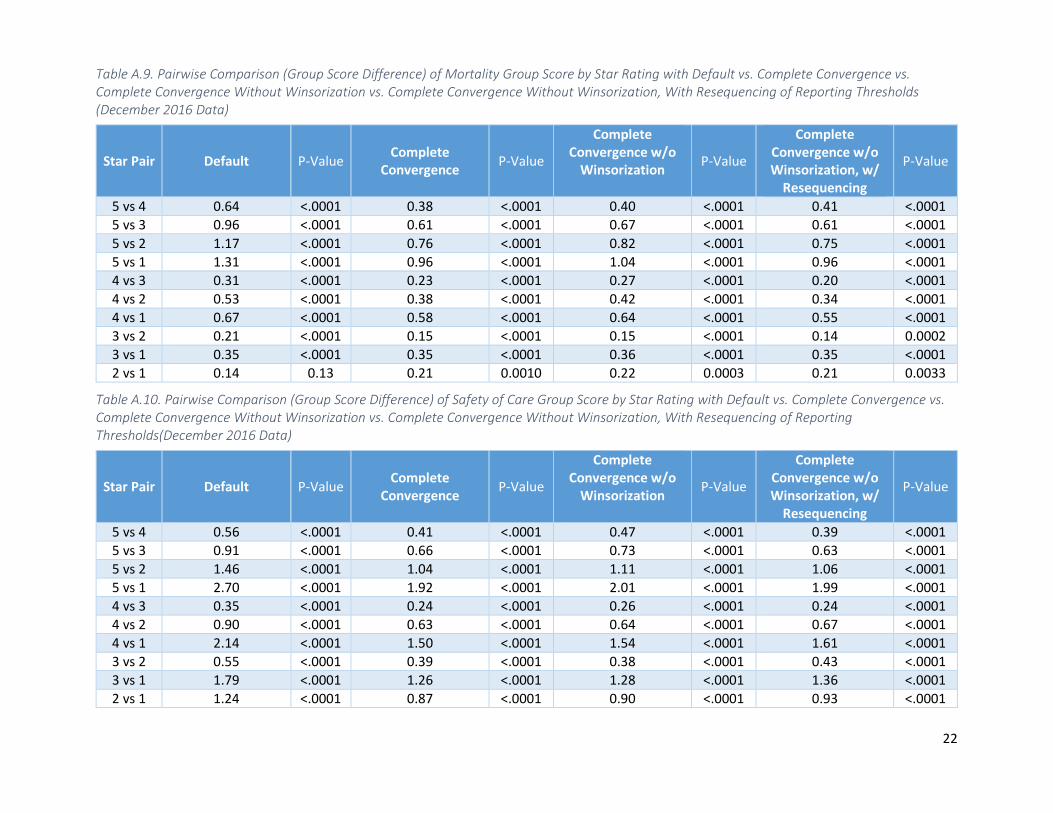
Table A.9. Pairwise Comparison (Group Score Difference) of Mortality Group Score by Star Rating with Default vs. Complete Convergence vs. Complete Convergence Without Winsorization vs. Complete Convergence Without Winsorization, With Resequencing of Reporting Thresholds (December 2016 Data)
Star Pair Default P-Value Complete Convergence P-Value
Complete Convergence w/o
Winsorization P-Value
Complete Convergence w/o Winsorization, w/
Resequencing
P-Value
5 vs 4 0.64 <.0001 0.38 <.0001 0.40 <.0001 0.41 <.0001 5 vs 3 0.96 <.0001 0.61 <.0001 0.67 <.0001 0.61 <.0001 5 vs 2 1.17 <.0001 0.76 <.0001 0.82 <.0001 0.75 <.0001 5 vs 1 1.31 <.0001 0.96 <.0001 1.04 <.0001 0.96 <.0001 4 vs 3 0.31 <.0001 0.23 <.0001 0.27 <.0001 0.20 <.0001 4 vs 2 0.53 <.0001 0.38 <.0001 0.42 <.0001 0.34 <.0001 4 vs 1 0.67 <.0001 0.58 <.0001 0.64 <.0001 0.55 <.0001 3 vs 2 0.21 <.0001 0.15 <.0001 0.15 <.0001 0.14 0.0002 3 vs 1 0.35 <.0001 0.35 <.0001 0.36 <.0001 0.35 <.0001 2 vs 1 0.14 0.13 0.21 0.0010 0.22 0.0003 0.21 0.0033
Table A.10. Pairwise Comparison (Group Score Difference) of Safety of Care Group Score by Star Rating with Default vs. Complete Convergence vs. Complete Convergence Without Winsorization vs. Complete Convergence Without Winsorization, With Resequencing of Reporting Thresholds(December 2016 Data)
Star Pair Default P-Value Complete Convergence P-Value
Complete Convergence w/o
Winsorization P-Value
Complete Convergence w/o Winsorization, w/
Resequencing
P-Value
5 vs 4 0.56 <.0001 0.41 <.0001 0.47 <.0001 0.39 <.0001 5 vs 3 0.91 <.0001 0.66 <.0001 0.73 <.0001 0.63 <.0001 5 vs 2 1.46 <.0001 1.04 <.0001 1.11 <.0001 1.06 <.0001 5 vs 1 2.70 <.0001 1.92 <.0001 2.01 <.0001 1.99 <.0001 4 vs 3 0.35 <.0001 0.24 <.0001 0.26 <.0001 0.24 <.0001 4 vs 2 0.90 <.0001 0.63 <.0001 0.64 <.0001 0.67 <.0001 4 vs 1 2.14 <.0001 1.50 <.0001 1.54 <.0001 1.61 <.0001 3 vs 2 0.55 <.0001 0.39 <.0001 0.38 <.0001 0.43 <.0001 3 vs 1 1.79 <.0001 1.26 <.0001 1.28 <.0001 1.36 <.0001 2 vs 1 1.24 <.0001 0.87 <.0001 0.90 <.0001 0.93 <.0001
22

Table A.11. Pairwise Comparison (Group Score Difference) of Readmission Group Score by Star Rating with Default vs. Complete Convergence vs. Complete Convergence Without Winsorization vs. Complete Convergence Without Winsorization, With Resequencing of Reporting Thresholds (December 2016 Data)
Star Pair Default P-Value Complete Convergence P-Value
Complete Convergence w/o
Winsorization P-Value
Complete Convergence w/o Winsorization, w/
Resequencing
P-Value
5 vs 4 1.08 <.0001 0.67 <.0001 0.80 <.0001 0.58 <.0001 5 vs 3 1.67 <.0001 1.12 <.0001 1.26 <.0001 1.03 <.0001 5 vs 2 2.46 <.0001 1.70 <.0001 1.88 <.0001 1.65 <.0001 5 vs 1 3.37 <.0001 2.45 <.0001 2.64 <.0001 2.45 <.0001 4 vs 3 0.59 <.0001 0.45 <.0001 0.46 <.0001 0.44 <.0001 4 vs 2 1.38 <.0001 1.03 <.0001 1.08 <.0001 1.06 <.0001 4 vs 1 2.29 <.0001 1.78 <.0001 1.84 <.0001 1.86 <.0001 3 vs 2 0.79 <.0001 0.58 <.0001 0.63 <.0001 0.62 <.0001 3 vs 1 1.70 <.0001 1.33 <.0001 1.39 <.0001 1.42 <.0001 2 vs 1 0.91 <.0001 0.75 <.0001 0.76 <.0001 0.80 <.0001
Table A.12. Pairwise Comparison (Group Score Difference) of Patient Experience Group Score by Star Rating with Default vs. Complete Convergence vs. Complete Convergence Without Winsorization vs. Complete Convergence Without Winsorization, With Resequencing of Reporting Thresholds (December 2016 Data)
Star Pair Default P-Value Complete Convergence P-Value
Complete Convergence w/o
Winsorization P-Value
Complete Convergence w/o Winsorization, w/
Resequencing
P-Value
5 vs 4 0.51 <.0001 0.52 <.0001 0.47 <.0001 0.55 <.0001 5 vs 3 1.30 <.0001 1.12 <.0001 1.11 <.0001 1.19 <.0001 5 vs 2 2.23 <.0001 1.82 <.0001 1.84 <.0001 1.88 <.0001 5 vs 1 3.04 <.0001 2.61 <.0001 2.66 <.0001 2.65 <.0001 4 vs 3 0.79 <.0001 0.60 <.0001 0.63 <.0001 0.64 <.0001 4 vs 2 1.72 <.0001 1.31 <.0001 1.37 <.0001 1.32 <.0001 4 vs 1 2.53 <.0001 2.10 <.0001 2.19 <.0001 2.10 <.0001 3 vs 2 0.93 <.0001 0.71 <.0001 0.73 <.0001 0.68 <.0001 3 vs 1 1.75 <.0001 1.50 <.0001 1.55 <.0001 1.46 <.0001 2 vs 1 0.82 <.0001 0.79 <.0001 0.82 <.0001 0.78 <.0001
23
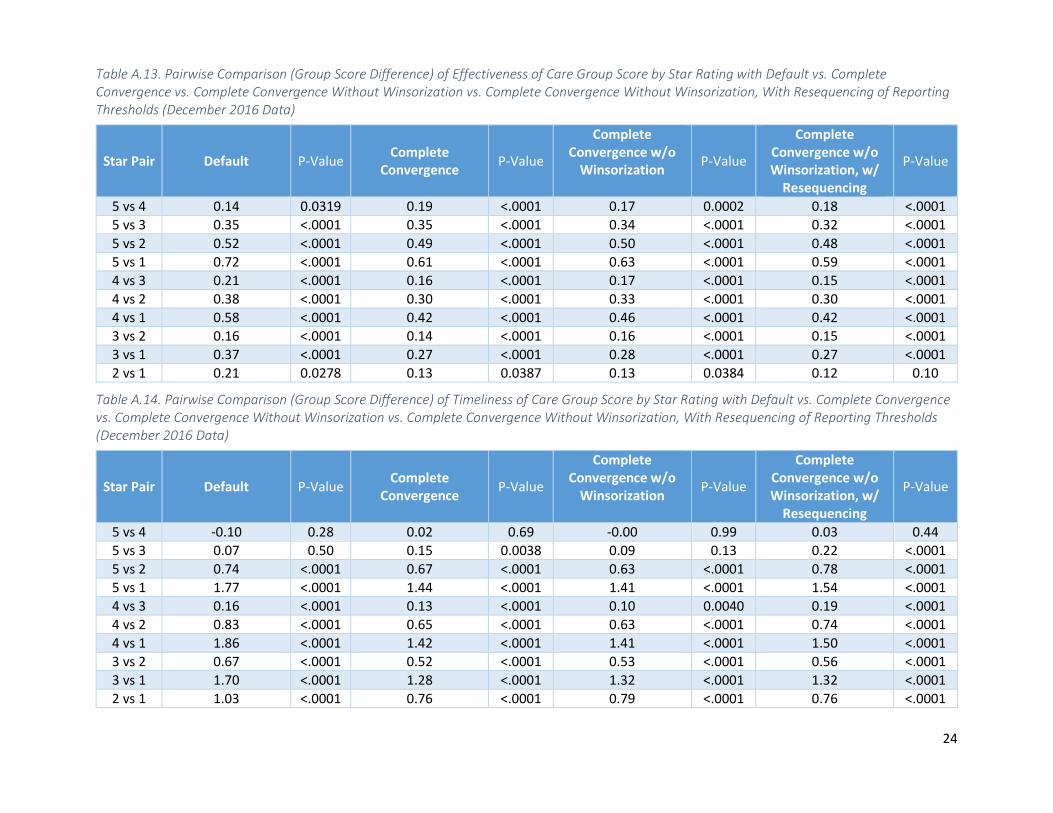
Table A.13. Pairwise Comparison (Group Score Difference) of Effectiveness of Care Group Score by Star Rating with Default vs. Complete Convergence vs. Complete Convergence Without Winsorization vs. Complete Convergence Without Winsorization, With Resequencing of Reporting Thresholds (December 2016 Data)
Star Pair Default P-Value Complete Convergence P-Value
Complete Convergence w/o
Winsorization P-Value
Complete Convergence w/o Winsorization, w/
Resequencing
P-Value
5 vs 4 0.14 0.0319 0.19 <.0001 0.17 0.0002 0.18 <.0001 5 vs 3 0.35 <.0001 0.35 <.0001 0.34 <.0001 0.32 <.0001 5 vs 2 0.52 <.0001 0.49 <.0001 0.50 <.0001 0.48 <.0001 5 vs 1 0.72 <.0001 0.61 <.0001 0.63 <.0001 0.59 <.0001 4 vs 3 0.21 <.0001 0.16 <.0001 0.17 <.0001 0.15 <.0001 4 vs 2 0.38 <.0001 0.30 <.0001 0.33 <.0001 0.30 <.0001 4 vs 1 0.58 <.0001 0.42 <.0001 0.46 <.0001 0.42 <.0001 3 vs 2 0.16 <.0001 0.14 <.0001 0.16 <.0001 0.15 <.0001 3 vs 1 0.37 <.0001 0.27 <.0001 0.28 <.0001 0.27 <.0001 2 vs 1 0.21 0.0278 0.13 0.0387 0.13 0.0384 0.12 0.10
Table A.14. Pairwise Comparison (Group Score Difference) of Timeliness of Care Group Score by Star Rating with Default vs. Complete Convergence vs. Complete Convergence Without Winsorization vs. Complete Convergence Without Winsorization, With Resequencing of Reporting Thresholds (December 2016 Data)
Star Pair Default P-Value Complete Convergence P-Value
Complete Convergence w/o
Winsorization P-Value
Complete Convergence w/o Winsorization, w/
Resequencing
P-Value
5 vs 4 -0.10 0.28 0.02 0.69 -0.00 0.99 0.03 0.44 5 vs 3 0.07 0.50 0.15 0.0038 0.09 0.13 0.22 <.0001 5 vs 2 0.74 <.0001 0.67 <.0001 0.63 <.0001 0.78 <.0001 5 vs 1 1.77 <.0001 1.44 <.0001 1.41 <.0001 1.54 <.0001 4 vs 3 0.16 <.0001 0.13 <.0001 0.10 0.0040 0.19 <.0001 4 vs 2 0.83 <.0001 0.65 <.0001 0.63 <.0001 0.74 <.0001 4 vs 1 1.86 <.0001 1.42 <.0001 1.41 <.0001 1.50 <.0001 3 vs 2 0.67 <.0001 0.52 <.0001 0.53 <.0001 0.56 <.0001 3 vs 1 1.70 <.0001 1.28 <.0001 1.32 <.0001 1.32 <.0001 2 vs 1 1.03 <.0001 0.76 <.0001 0.79 <.0001 0.76 <.0001
24

25
Table A.15. Pairwise Comparison (Group Score Difference) of Efficiency of Medical Imaging Group Score by Star Rating with Default vs. Complete Convergence vs. Complete Convergence Without Winsorization vs. Complete Convergence Without Winsorization, With Resequencing of Reporting Thresholds (December 2016 Data)
Star Pair Default P-Value Complete Convergence P-Value
Complete Convergence w/o
Winsorization P-Value
Complete Convergence w/o Winsorization, w/
Resequencing
P-Value
5 vs 4 0.02 0.83 0.04 0.42 0.07 0.24 0.08 0.08 5 vs 3 0.15 0.12 0.16 0.0054 0.16 0.0158 0.20 <.0001 5 vs 2 0.23 0.06 0.23 0.0004 0.28 0.0003 0.23 <.0001 5 vs 1 0.10 0.42 0.22 0.0059 0.25 0.0069 0.20 0.0047 4 vs 3 0.13 0.0001 0.12 0.0012 0.09 0.0119 0.12 0.0009 4 vs 2 0.21 <.0001 0.19 <.0001 0.21 <.0001 0.15 0.0006 4 vs 1 0.08 0.29 0.17 0.0024 0.18 0.0022 0.12 0.053 3 vs 2 0.08 0.07 0.07 0.09 0.12 0.0026 0.03 0.53 3 vs 1 -0.05 0.55 0.06 0.32 0.09 0.13 0.00 0.95 2 vs 1 -0.13 0.22 -0.01 0.86 -0.03 0.65 -0.02 0.76