Assessment of Anchorage School District students participating in
32
Fishery Data Series No. 09-20 Assessment of Anchorage School District Students Participating in the Salmon in the Classroom Program, 2006-2007 by L. Saree Timmons, Patricia A. Hansen, and Texas Gail Raymond April 2009 Alaska Department of Fish and Game Divisions of Sport Fish and Commercial Fisheries
Transcript of Assessment of Anchorage School District students participating in

Fishery Data Series No. 09-20
Assessment of Anchorage School District Students Participating in the Salmon in the Classroom Program, 2006-2007
by
L. Saree Timmons,
Patricia A. Hansen,
and
Texas Gail Raymond
April 2009
Alaska Department of Fish and Game Divisions of Sport Fish and Commercial Fisheries

Symbols and Abbreviations The following symbols and abbreviations, and others approved for the Système International d'Unités (SI), are used without definition in the following reports by the Divisions of Sport Fish and of Commercial Fisheries: Fishery Manuscripts, Fishery Data Series Reports, Fishery Management Reports, and Special Publications. All others, including deviations from definitions listed below, are noted in the text at first mention, as well as in the titles or footnotes of tables, and in figure or figure captions. Weights and measures (metric) centimeter cm deciliter dL gram g hectare ha kilogram kg kilometer km liter L meter m milliliter mL millimeter mm Weights and measures (English) cubic feet per second ft3/s foot ft gallon gal inch in mile mi nautical mile nmi ounce oz pound lb quart qt yard yd Time and temperature day d degrees Celsius °C degrees Fahrenheit °F degrees kelvin K hour h minute min second s Physics and chemistry all atomic symbols alternating current AC ampere A calorie cal direct current DC hertz Hz horsepower hp hydrogen ion activity pH (negative log of) parts per million ppm parts per thousand ppt, ‰ volts V watts W
General Alaska Administrative Code AAC all commonly accepted abbreviations e.g., Mr., Mrs.,
AM, PM, etc. all commonly accepted professional titles e.g., Dr., Ph.D., R.N., etc. at @ compass directions:
east E north N south S west W
copyright © corporate suffixes:
Company Co. Corporation Corp. Incorporated Inc. Limited Ltd.
District of Columbia D.C. et alii (and others) et al. et cetera (and so forth) etc. exempli gratia (for example) e.g. Federal Information Code FIC id est (that is) i.e. latitude or longitude lat. or long. monetary symbols (U.S.) $, ¢ months (tables and figures): first three letters Jan,...,Dec registered trademark ® trademark ™ United States (adjective) U.S. United States of America (noun) USA U.S.C. United States
Code U.S. state use two-letter
abbreviations (e.g., AK, WA)
Measures (fisheries) fork length FL mid eye to fork MEF mid eye to tail fork METF standard length SL total length TL Mathematics, statistics all standard mathematical signs, symbols and abbreviations alternate hypothesis HA base of natural logarithm e catch per unit effort CPUE coefficient of variation CV common test statistics (F, t, χ2, etc.) confidence interval CI correlation coefficient (multiple) R correlation coefficient (simple) r covariance cov degree (angular ) ° degrees of freedom df expected value E greater than > greater than or equal to ≥ harvest per unit effort HPUE less than < less than or equal to ≤ logarithm (natural) ln logarithm (base 10) log logarithm (specify base) log2, etc. minute (angular) ' not significant NS null hypothesis HO percent % probability P probability of a type I error (rejection of the null hypothesis when true) α probability of a type II error (acceptance of the null hypothesis when false) β second (angular) " standard deviation SD standard error SE variance population Var sample var

FISHERY DATA SERIES NO. 09-20
ASSESSMENT OF ANCHORAGE SCHOOL DISTRICT STUDENTS PARTICIPATING IN THE SALMON IN THE CLASSROOM PROGRAM,
2006-2007
by L. Saree Timmons
Alaska Department of Fish and Game, Division of Sport Fish, Anchorage
Patricia A. Hansen Alaska Department of Fish and Game, Division of Sport Fish, Anchorage
and Texas Gail Raymond
Anchorage School District, Science Department, Anchorage
This investigation was partially financed by the Federal Aid in Sport Fish Restoration Act (16 U.S.C. 777-777K) under Project F-31-18, Job Number F-31-18b.
Alaska Department of Fish and Game Division of Sport Fish, Research and Technical Services 333 Raspberry Road, Anchorage, Alaska, 99518-1599
April 2009

ADF&G Fishery Data Series was established in 1987 for the publication of Division of Sport Fish technically oriented results for a single project or group of closely related projects, and in 2004 became a joint divisional series with the Division of Commercial Fisheries. Fishery Data Series reports are intended for fishery and other technical professionals and are available through the Alaska State Library and on the Internet: http://www.sf.adfg.state.ak.us/statewide/divreports/html/intersearch.cfm This publication has undergone editorial and peer review.
L. Saree Timmons Alaska Department of Fish and Game, Division of Sport Fish
333 Raspberry Road, Anchorage, AK, USA
Patricia A. Hansen Alaska Department of Fish and Game, Division of Sport Fish
333 Raspberry Road, Anchorage, AK, USA
and Texas Gail Raymond
Anchorage School District 5530 E Northern Lights Blvd., Anchorage, AK USA
This document should be cited as: Timmons, L. S., P. A. Hansen, and T. G. Raymond. 2009. Assessment of Anchorage School District students
participating in the Salmon in the Classroom program, 2006-2007. Alaska Department of Fish and Game, Fishery Data Series No. 09-20, Anchorage.
The Alaska Department of Fish and Game (ADF&G) administers all programs and activities free from discrimination based on race, color, national origin, age, sex, religion, marital status, pregnancy, parenthood, or disability. The department administers all programs and activities in compliance with Title VI of the Civil Rights Act of 1964, Section 504 of the Rehabilitation Act of 1973, Title II of the Americans with Disabilities Act (ADA) of 1990, the Age Discrimination Act of 1975, and Title IX of the Education Amendments of 1972.
If you believe you have been discriminated against in any program, activity, or facility please write: ADF&G ADA Coordinator, P.O. Box 115526, Juneau, AK 99811-5526
U.S. Fish and Wildlife Service, 4401 N. Fairfax Drive, MS 2042, Arlington, VA 22203 Office of Equal Opportunity, U.S. Department of the Interior, 1849 C Street NW MS 5230, Washington DC 20240
The department’s ADA Coordinator can be reached via phone at the following numbers: (VOICE) 907-465-6077, (Statewide Telecommunication Device for the Deaf) 1-800-478-3648, (Juneau TDD) 907-
465-3646, or (FAX) 907-465-6078 For information on alternative formats and questions on this publication, please contact:
ADF&G, Division of Sport Fish, Research and Technical Services, 333 Raspberry Road, Anchorage AK 99518 907-267-2375.

i
TABLE OF CONTENTS Page
LIST OF TABLES.........................................................................................................................................................ii LIST OF FIGURES.......................................................................................................................................................ii LIST OF APPENDICES ...............................................................................................................................................ii ABSTRACT ..................................................................................................................................................................1 INTRODUCTION.........................................................................................................................................................1 Study Location and Participants ....................................................................................................................................4 OBJECTIVES................................................................................................................................................................4 METHODS....................................................................................................................................................................5 Study Design and Data Collection.................................................................................................................................5 Data Analysis.................................................................................................................................................................5 RESULTS......................................................................................................................................................................7 Summary Statistics ........................................................................................................................................................7 Paired Tests ...................................................................................................................................................................7 Results by Item ............................................................................................................................................................10 Teacher and Class Characteristics ...............................................................................................................................10 DISCUSSION..............................................................................................................................................................10 Student Knowledge......................................................................................................................................................10
Prior Knowledge.....................................................................................................................................................14 Misconceptions .......................................................................................................................................................18
Student Opinions and Program Feedback....................................................................................................................19 Conclusions .................................................................................................................................................................20 ACKNOWLEDGMENTS ...........................................................................................................................................20 REFERENCES CITED ...............................................................................................................................................20 APPENDIX A. PRE/POST TEST AND TEACHER SURVEY ................................................................................23
ii
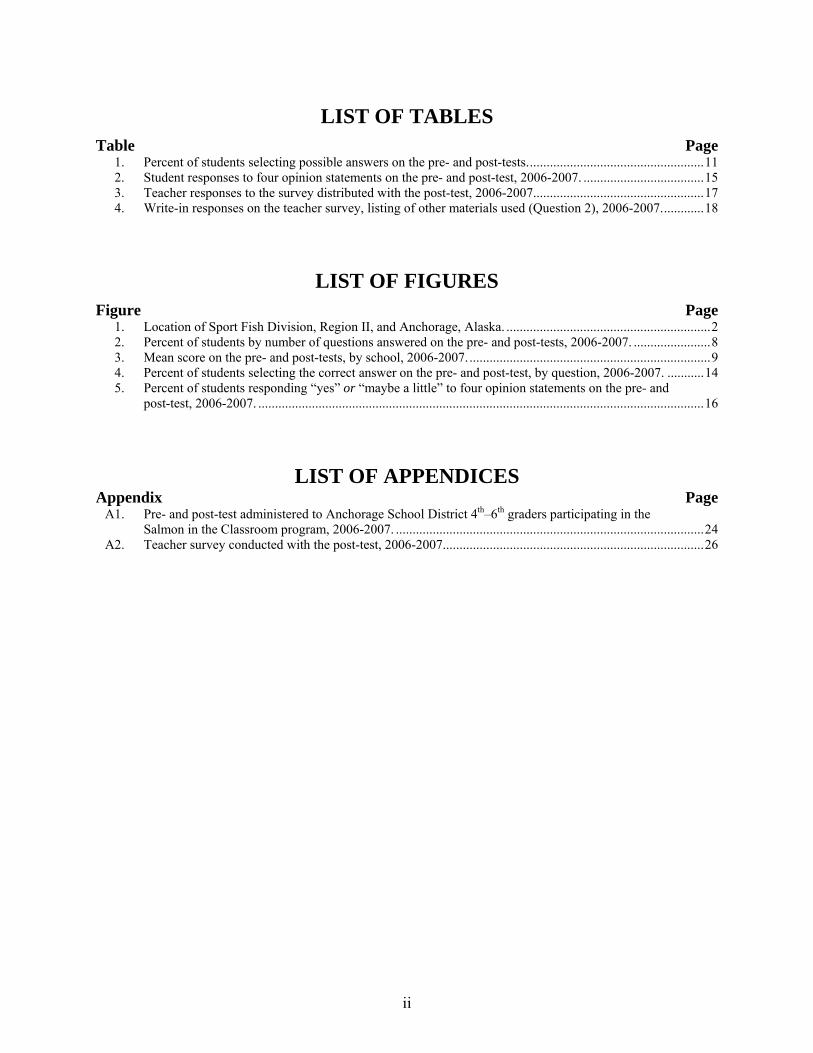
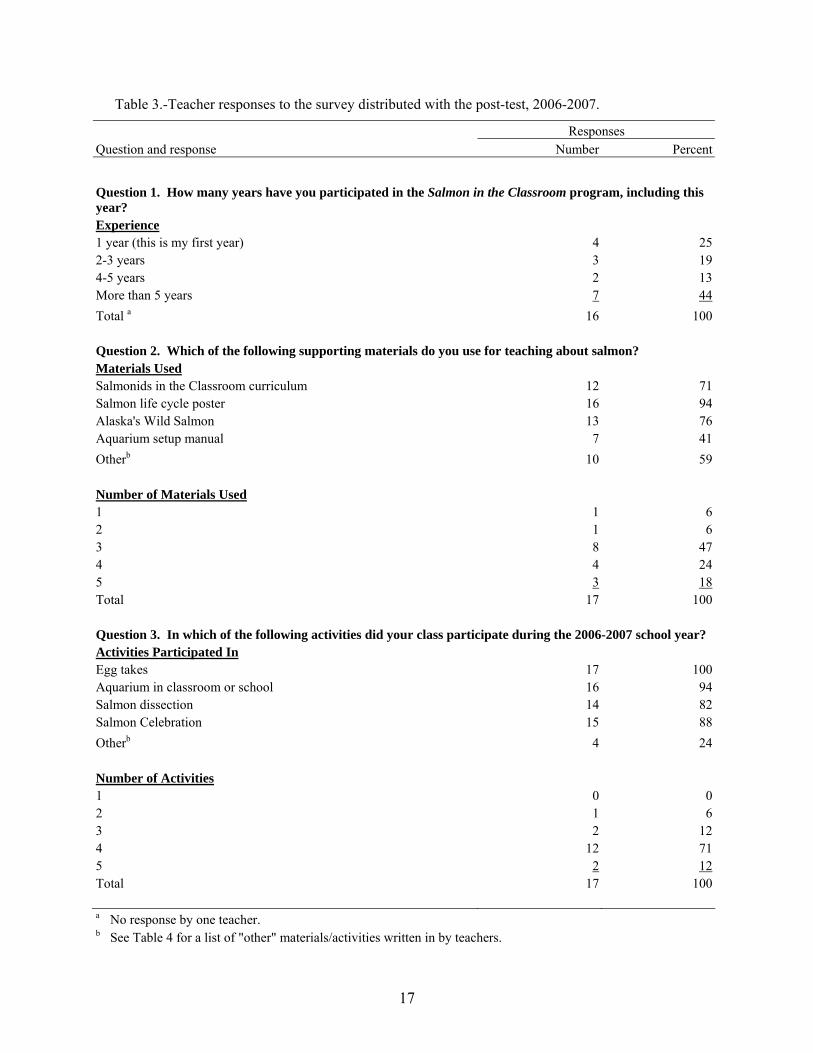
LIST OF TABLES Table Page 1. Percent of students selecting possible answers on the pre- and post-tests.....................................................11 2. Student responses to four opinion statements on the pre- and post-test, 2006-2007. ....................................15 3. Teacher responses to the survey distributed with the post-test, 2006-2007...................................................17 4. Write-in responses on the teacher survey, listing of other materials used (Question 2), 2006-2007.............18
LIST OF FIGURES Figure Page 1. Location of Sport Fish Division, Region II, and Anchorage, Alaska. .............................................................2 2. Percent of students by number of questions answered on the pre- and post-tests, 2006-2007. .......................8 3. Mean score on the pre- and post-tests, by school, 2006-2007. ........................................................................9 4. Percent of students selecting the correct answer on the pre- and post-test, by question, 2006-2007. ...........14 5. Percent of students responding “yes” or “maybe a little” to four opinion statements on the pre- and
post-test, 2006-2007. .....................................................................................................................................16
LIST OF APPENDICES Appendix Page A1. Pre- and post-test administered to Anchorage School District 4th–6th graders participating in the
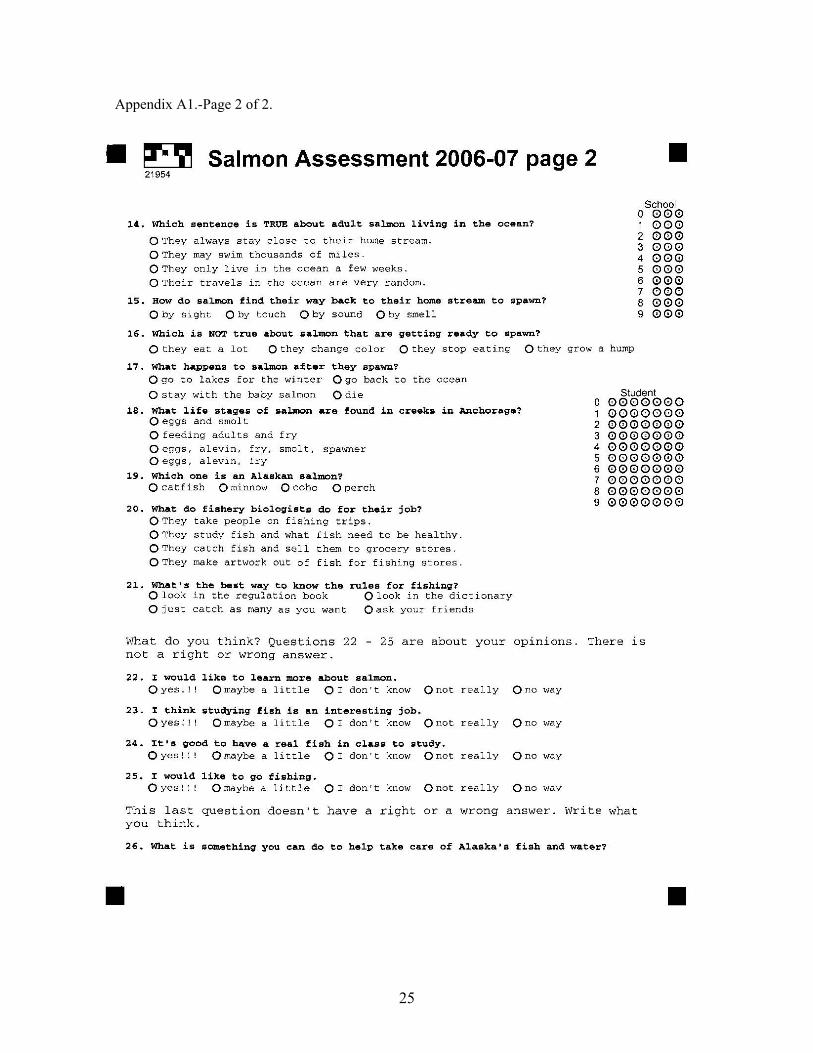
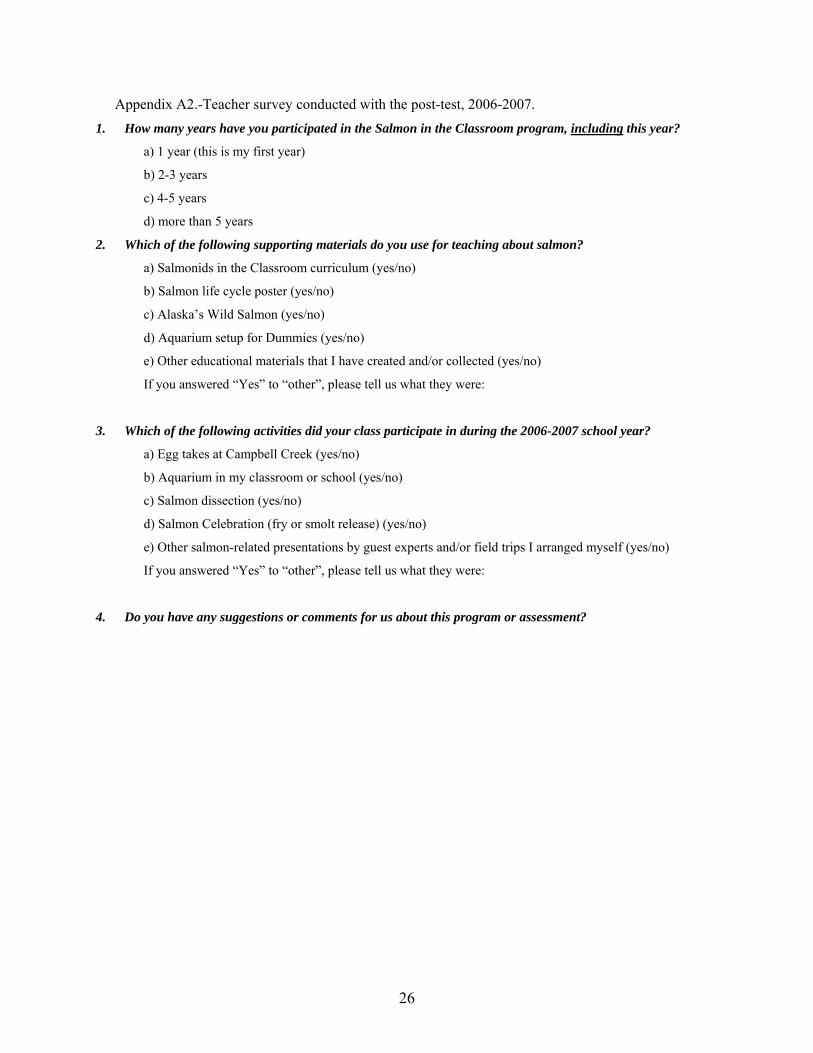
Salmon in the Classroom program, 2006-2007. ............................................................................................24 A2. Teacher survey conducted with the post-test, 2006-2007..............................................................................26

1
ABSTRACT The Alaska Department of Fish and Game, Division of Sport Fish and the Anchorage School District conducted an assessment of the Salmon in the Classroom program in Southcentral Alaska (Region II). Anchorage School District students in 4th–6th grades who participated in the program were given a pre- and post-test that consisted of 21 multiple-choice questions measuring basic knowledge about salmon, and four opinion statements. Although 536 pre-tests from 18 schools, and 384 post-tests from 13 schools, were returned, paired pre-post tests were only available for 124 students. This occurred because very few student identification numbers were provided on the tests by teachers. We were therefore unable to conduct hypothesis tests correlating teacher and classroom characteristics with test results. Results of the post-test were therefore conservative because students who joined the program after it began were included in post-test scores.
Overall, students’ knowledge increased from September 2006 to May 2007; students averaged 61% (SE = 0.8) correct on the pre-test and 71% (SE = 1%) on the post-test. The objective for 25% of students in the program to score at least a 70%, from the Region II strategic plan for aquatic education, was exceeded: 60% (SE = 3%) of students scored at least a 70% on the post-test. Although the percent of students answering the multiple choice questions correctly increased for all questions, misperceptions remained at the end of the program for many important concepts. Student enthusiasm, as measured by the percent of students responding “yes” or “maybe,” decreased for the four opinion statements concerning learning about salmon, fishery careers, real fish in class, and sport fishing.
To increase effectiveness of the Salmon in the Classroom program, Sport Fish aquatic educators should look carefully at topics for which misunderstandings remained at the end of the 2006-2007 school year to identify potential improvements to the program, consider possible reasons for the decrease in student enthusiasm, identify ways to engage students more effectively, and develop a mechanism for encouraging feedback on the program from teachers and students. The assessment project should be conducted again in 2007-2008, but participation in the pre- and post-tests needs to be increased, and particular effort should be made to obtain student identification numbers so that a sufficient sample of paired pre- and post-tests is available for analysis.
Key words: Salmon in the Classroom, aquatic education, education assessment, education evaluation, pre-test, post-test, multiple choice test, student, strategic plan, Anchorage School District.
INTRODUCTION The Alaska Department of Fish and Game (ADF&G), Division of Sport Fish (Sport Fish) began dedicating staff and funding to information and education activities in Southcentral Alaska (Region II; Figure 1) in 1996. Dubbed the STREAM (Salmon Trout Restoration Education and Aquatic Management) program, the goal was “to increase the public’s awareness of Alaska’s healthy wild salmon stocks through education and the offering of hands-on opportunities” (Kraus 1999; Kraus et al. 2000; Kraus and Olson 2003a, 2003b). Region II’s main aquatic education focus was the “Salmon in the Classroom” program (also called “Salmonids in the Classroom” or “Inclass Salmon Incubation Program”), primarily for elementary students. The number of schools in the program increased from 34 in 1996 to 110 in 2004, and the communities served increased to include the Anchorage, Matanuska-Susitna, Kenai Peninsula, Kodiak, and Prince William Sound areas (Kraus et al. 2000; Kraus and Olson 2003a, 2003b; Kraus 2005a, 2005b; Kraus 2006a, 2006b).
The program, modeled after similar ones in Washington, British Columbia, and Oregon, supports aquariums placed in public school classrooms in which students raise salmon, from eggs to fry. In Region II, the program includes the following five components, all led by Sport Fish employees: (1) support for classroom aquariums for raising salmon, from egg to fry; (2) field trips to watch an egg take at a local stream and receive eggs for the aquarium; (3) salmon dissections in the classroom; (4) ice fishing field trips to a local stocked lake; and (5) “salmon celebration” field trips to release fry raised in the classroom or to watch release of hatchery fish

2
Figure 1.-Location of Sport Fish Division, Region II, and Anchorage, Alaska.
into a local stream. The ice fishing field trip was cancelled for the 2006-2007 school year because fish stocked into the lake used for the event were too small.
Teachers wishing to participate in the program are provided an aquarium in which to raise salmon eggs, equipment such as a chiller to maintain the correct water temperature, food for the salmon fry, and support from aquatic education employees in the form of assistance with trouble-shooting and repairs to the aquarium equipment. Some limited educational support materials are also available, including a guide to setup and maintenance of the aquariums, a curriculum for elementary grades (“Salmonids in the Classroom,” aimed specifically at 2nd grade), a salmon life cycle poster, and the publication “Alaska’s Wild Salmon.” To accommodate as many classes as possible, aquariums are limited to one per school. However, aquariums are frequently placed in common areas in the schools, such as libraries, so that multiple classes within the school can participate in the program, and multiple classes per school may participate in the dissections and field trips. Any grade is allowed to participate, but historically, most participation is by elementary schools, particularly grades K-3, although in recent years participation has expanded widely and now includes many classes in grades 4-6 as well.
Anchorage

3
In 2004, Region II began the process of developing a strategic plan (Timmons 2006) to guide the aquatic education programs of Region II in supporting the overall mission and goals of the Region, the Division as provided in its strategic plan (ADF&G 2002), and ADF&G. A vision, mission, and seven goals were outlined for the aquatic education program, and measurable objectives and strategies for accomplishing the objectives were developed (Timmons 2006). The Salmon in the Classroom program remained one of the primary tools for meeting the goals and objectives of the plan. The vision of the Region II aquatic education plan is:
Alaskans and visitors to Southcentral Alaska understand and appreciate the unique value of the region’s aquatic resources and sport fisheries, the factors affecting them and principles for conserving them, and the role of ADF&G, Division of Sport Fish in sustaining those valuable resources;
Alaskans and visitors demonstrate this understanding and appreciation through responsible sport fishing practices, sustainable uses of aquatic resources, involvement in fishery management, and support for the missions of the Department and Division.
The mission is:
To foster an informed and educated public that appreciates, respects and sustainably uses the State’s fisheries and aquatic resources in Southcentral Alaska, and supports the Division’s mission to protect, improve, and manage the use and development of those fisheries and aquatic resources.
The three goals pertinent to the Salmon in the Classroom program are:
Among children in Southcentral Alaska, cultivate an understanding of the basic fundamentals of fish biology and aquatic resource principles, and fisheries and aquatic resources management; and kindle a life-long appreciation and stewardship of aquatic resources;
Among Alaskans in Southcentral Alaska and visitors to the area, foster knowledge about and support for the core activities of the Division of Sport Fish used to accomplish its mission: stock assessment, management, hatchery production, access development and maintenance, habitat assessment, information and education, enforcement, and planning and surveys.
Encourage and facilitate new anglers in adopting sport fishing as a pastime, and promote responsible sport fishing by children and adult anglers in Southcentral Alaska.
Evaluation is essential to determine if programs should be continued, how they can be improved, and to document whether or not they are producing the desired outcomes (Hinchcliff et al. 2004). But although outputs (such as numbers of students, presentations, and classes) have been well documented, there has been no evaluation of the various components of the region’s education program, particularly Salmon in the Classroom which is the main focus of the region’s educational resources.
Therefore, a study to assess the Salmon in the Classroom component of the region’s education program was initiated for the 2006-2007 school year. Although the regional aquatic education plan includes goals and objectives for all aquatic education programs across the entire region,

4
this first evaluation project is focused narrowly on selected knowledge-related objectives from the plan that pertain to students participating in the Salmon in the Classroom program in the Anchorage School District (ASD).
STUDY LOCATION AND PARTICIPANTS Anchorage is Alaska’s center of commerce, and with a population of 260,000, its largest city. Its 2,000 square mile area ranges from the dense city center, to semi-rural mountainous regions north and east, to the sea on the western edge. Challenges to this urban community include rapid demographic changes rising from a “boom and bust” economy, rising poverty rates, and accelerating immigration. The cultural and ethnic profile of the city profoundly shifted in the post-oil boom 1990s. Minorities now comprise 30% of the population, and that number is rapidly growing. Large influxes of Hispanic, Filipino, Asian, Pacific Islanders, and eastern Europeans have changed the face of the city and the learning needs of the children. Anchorage now is home to 20% of Alaska’s Natives, forming the state’s largest single “Native village.”
ASD was chosen for this project because of the long history of the Salmon in the Classroom program there; strong support for the program among teachers, school officials, and parents; and willingness of ASD to provide critical infrastructure support for implementing an evaluation. In addition, the Salmon in the Classroom program is an approved component of the ASD science curriculum for 2nd grade. ASD is the 88th largest school district in the nation, enrolling almost 50,000 students, or about 39% of the state’s school-age population; and with about 3,500 teachers. It is a U.S. Department of Education-designated “central city” district. Minorities in the schools grew by 53% in the 1990s. Currently, 50% of ASD students are ethnic non-whites; and all racial, ethnic, and language groups have grown in absolute numbers over the past 5 years. The greatest growth is among Alaska Natives, now at 13% of ASD students; Asian/Pacific Islanders, and Hispanics. More than 84 languages are spoken in the 90 public schools. Significantly, over 37% of ASD students now live in poverty, and this proportion is increasing (ASD Title I). Yet, these students are Alaska’s future—they will be the workforce, researchers, developers, and leaders. Alaska’s borders are non-contiguous with other states. Alaska cannot afford to lose any groups or individuals to the achievement gap.
The purpose of this project is to evaluate selected outcomes from the Region II aquatic education strategic plan (see Appendix A1 in Timmons 2006), as they relate to 4th–6th grade ASD students participating in the Salmon in the Classroom program, to help determine if goals 1, 3 and 4 of the plan are being met. Because teaching methods and student ability differ greatly by student age, and because valid assessment techniques are different for younger students, only students in grades 4-6 were included in the study.
OBJECTIVES The objectives for this study were to estimate, for ASD students in 4th–6th grades who participated in the Salmon in the Classroom program during the 2006-2007 school year:
1. the percent who scored at least 70% on the post-test at the end of the school year;
2. the average score on the pre-test and the post-test;
3. the average change in score between the pre-test and post-test; and
4. test the null hypothesis that there was no correlation between:

5
a. teacher experience (years participating in the Salmon in the Classroom program) and the average post-test score for the class;
b. the number of Salmon in the Classroom activities and the average post-test score for the class;
c. teacher experience (years participating in the Salmon in the Classroom program) and the average change in score between pre- and post-tests for the class;
d. the number of Salmon in the Classroom activities and the average change in score between pre- and post-tests for the class.
In all cases the alternative hypothesis was that there was a positive correlation. In all cases the null hypothesis was rejected if the sample correlation coefficient was ≥0.25 with probabilities of Type I and Type II error being 0.20 and 0.05, respectively.
In addition, the following task was included:
1. test the hypothesis that there was no significant difference in the average post-test score of the class among teachers who used (1) no materials, (2) only materials supplied by ADF&G, and (3) materials supplied by the teacher (regardless of ADF&G material).
METHODS STUDY DESIGN AND DATA COLLECTION Students in ASD 4th–6th grades in classes participating in the Salmon in the Classroom program during the 2006-2007 school year were given a pre-test and post-test concerning their knowledge of topics covered by the program (Appendix A1). All teachers in the program were provided the tests, although not all students took the tests. The test was reviewed by the ASD science and assessment departments to ensure validity, such as non-biased wording and age appropriateness. The test was multiple-choice, “bubble” format in which students selected a response by filling in a circle adjacent to their answer of choice. Pre- and post-tests included a student field in which teachers were to fill in the students’ identification numbers (ID) so that pre- and post-test results could be paired at the student level. Personal identities of students were not included. School codes were also included on the test. A teacher survey was distributed with the post-test (Appendix A2).
ASD distributed tests to participating teachers, who administered the tests and returned them to ASD. ASD scanned completed tests, and provided the final resulting data to ADF&G for analysis.
The pre-test was administered in early September 2006 prior to the first field trip. The post-test and teacher survey were administered in late May 2007 after the final field trip of the school year. The exact dates of test administration were chosen by individual teachers.
DATA ANALYSIS The percent of students scoring at least 70% on the post-test was calculated as a binomial proportion (Cochran 1977) by:
100*ˆ %70%70 ⎟
⎠⎞
⎜⎝⎛= >
> nnp , (1)

6
with variance estimated as:
,100*1
)ˆ1(ˆ)ˆ(ˆ 27070
70 −−
= >>> n
pppraV (2)
where:
n>70% = the number of students who scored >70% on the post-test, n = the total number of students who took the post-test.
The average score on the pre-test and the post-test was calculated as:
s
n
sts
t n
xx
s∑== 1 , (3)
with variance:
( )
11
2
2−
−=∑=
s
n
stts
t n
xxs
s
, (4)
where:
xts = the score of student s on test t (pre or post), ns = the number of students who took test t.
For each student for which there were paired pre- and post-test data, the change in score between the pre-test and post-test was calculated as:
ds = xpost,s – xpre,s , (5)
where:
xpost,s = the score of student s on the post-test, xpre,s = the score of student s on the pre-test.
The average change in score was calculated as:
s
n
ss
n
dd
s∑== 1 , (6)
with variance:
( )1
1
2
2−
−=∑=
s
n
ss
d n
dds
s
, (7)
where:
7
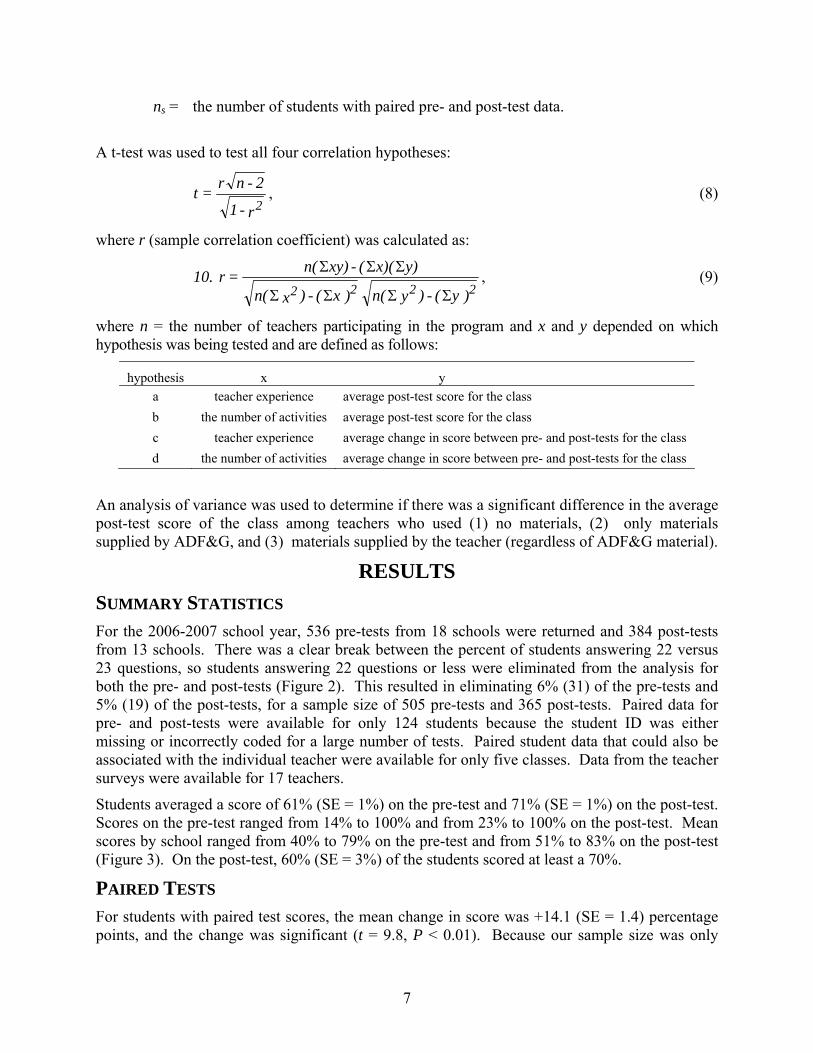
ns = the number of students with paired pre- and post-test data.
A t-test was used to test all four correlation hypotheses:
r-1
2-nr=t2
, (8)
where r (sample correlation coefficient) was calculated as:
)y(-)yn( )x(-)xn(
y)x)((-xy)n(=r 10.2222 ΣΣΣΣ
ΣΣΣ , (9)
where n = the number of teachers participating in the program and x and y depended on which hypothesis was being tested and are defined as follows:
hypothesis x y a teacher experience average post-test score for the class b the number of activities average post-test score for the class c teacher experience average change in score between pre- and post-tests for the class d the number of activities average change in score between pre- and post-tests for the class
An analysis of variance was used to determine if there was a significant difference in the average post-test score of the class among teachers who used (1) no materials, (2) only materials supplied by ADF&G, and (3) materials supplied by the teacher (regardless of ADF&G material).
RESULTS SUMMARY STATISTICS For the 2006-2007 school year, 536 pre-tests from 18 schools were returned and 384 post-tests from 13 schools. There was a clear break between the percent of students answering 22 versus 23 questions, so students answering 22 questions or less were eliminated from the analysis for both the pre- and post-tests (Figure 2). This resulted in eliminating 6% (31) of the pre-tests and 5% (19) of the post-tests, for a sample size of 505 pre-tests and 365 post-tests. Paired data for pre- and post-tests were available for only 124 students because the student ID was either missing or incorrectly coded for a large number of tests. Paired student data that could also be associated with the individual teacher were available for only five classes. Data from the teacher surveys were available for 17 teachers.
Students averaged a score of 61% (SE = 1%) on the pre-test and 71% (SE = 1%) on the post-test. Scores on the pre-test ranged from 14% to 100% and from 23% to 100% on the post-test. Mean scores by school ranged from 40% to 79% on the pre-test and from 51% to 83% on the post-test (Figure 3). On the post-test, 60% (SE = 3%) of the students scored at least a 70%.
PAIRED TESTS For students with paired test scores, the mean change in score was +14.1 (SE = 1.4) percentage points, and the change was significant (t = 9.8, P < 0.01). Because our sample size was only

8
Pre-test
0
20
40
60
80
100
0 1 2 3 4 5 6 7 8 9 10 11 12 13 14 15 16 17 18 19 20 21 22 23 24 25
Number of Questions Answ ered
Perc
ent o
f Stu
dent
s
Post-test
0
20
40
60
80
100
0 1 2 3 4 5 6 7 8 9 10 11 12 13 14 15 16 17 18 19 20 21 22 23 24 25
Number of Questions Answ ered
Perc
ent o
f Stu
dent
s
Figure 2.-Percent of students by number of questions answered on the pre- and post-
tests, 2006-2007.

9
Pre-test
0
20
40
60
80
100
1 2 3 4 5 6 7 8 9 10 11 12 13 14 15 16 17 18
School
Mea
n S
core
Post-test
0
20
40
60
80
100
1 2 3 4 5 6 7 8 9 10 11 12 13
School
Mea
n S
core
Note: School numbers are aliases and schools with the same pre- and post-test
alias are not necessarily the same school. Figure 3.-Mean score on the pre- and post-tests, by school, 2006-2007.
124 paired tests, we tested the hypothesis that there was no difference between the mean score of paired tests versus non-paired tests. On the pre-test, there was no significant difference between paired and non-paired tests (mean for paired = 61.3%, mean for non-paired = 61.1%, t = -0.05, P = 0.96). On the post-test, paired and non-paired scores were significantly different (mean for paired = 75.4%, mean for non-paired = 69.2%, t = -3.3, P < 0.01).

10
RESULTS BY ITEM On the pre-test, the highest percent (86%) of students selected the correct answer for question 1 (fins), and the lowest (27%) for question 5 (swim bladder) (Table 1; Figure 4). On the post-test, the highest percent correct was question 4 (90%, heart), and the lowest percent was question 16 (38%, spawners). For all opinion questions, the percent of students selecting “yes” decreased from the pre-test to the post-test, as did the percent selecting “yes” or “maybe a little” (Table 2; Figure 5).
TEACHER AND CLASS CHARACTERISTICS Because of the small sample size of only five classes for which paired data were available that could be matched with an individual teacher, we did not conduct the hypothesis tests of correlation between teacher characteristics and changes in test scores.
Teachers who responded to the teacher survey had varied experience in the program (Table 3). More than 70% made use of teaching aids available from ADF&G, and 59% used other materials (Table 4). Only 41% used the aquarium setup manual. All of the classes attended the egg take, most made use of an aquarium in the class or school, and most participated in salmon dissections and the end-of-year field trip to the Salmon Celebration.
DISCUSSION This project provided the first quantitative assessment of Region II’s Salmon in the Classroom program. Teachers in the program were willing to administer the pre- and post-tests, and we received no complaints about the assessment being onerous, a concern expressed by some Region II staff at the outset of the assessment project. This may be because assessment is expected in most formal education programs, teachers are well-acquainted with assessment techniques, the pre- and post-tests were short and easy to administer and required minimal effort on the part of teachers, and ASD support staff and ADF&G provided the tests, scored them, and analyzed the data.
However, effort should be made to increase the number of 4th–6th graders participating in the program and increase the participation rate in the pre- and post-test. Only 18 of about 60 total ASD schools that had 4th–6th graders took part in the pre-test, and only 13 in the post-test. Our sample of paired students was even lower, only 124 students, and this was primarily a result of student IDs being provided on a very low percentage of tests. Overall participation might be increased by personal contact with teachers in the program and reminders to administer and submit the tests. Teachers might be encouraged to participate, and to be more conscientious about providing student IDs, if overall results of the study and of their individual classes are made available to them, and if ADF&G makes changes to the program that address shortcomings identified by the assessment that are also helpful to teachers.
STUDENT KNOWLEDGE Overall, students’ knowledge of salmon increased over the school year (Figure 4). The objective for 25% of students in the program to score at least a 70%, from the Region II strategic plan for aquatic education, was exceeded by a large margin: 60% (SE = 3%) of students scored at least a 70% on the post-test. The post-test results are a conservative estimate of mean score because

11
Table 1.-Percent of students selecting possible answers on the pre- and post-tests.
Note: The correct answer is shaded and bold.
Percent Question/Answer Pre-test Post-test
Question 1: How does a fish steer its body through the water? A) swim bladder 6 8B) gills 4 2C) fins 87 87D) pyloric caeca 3 3 Question 2: What does the fish's stomach do? A) makes eggs 36 22B) digests food 61 74C) watches out for predators 1 2D) helps it hear 2 2 Question 3: What does the fish's liver do? A) helps with digestion, stores fat, and removes poisons from the blood 50 65B) helps the fish breath oxygen out of the water 18 14C) pumps blood through the fish's body 14 12D) grows the fishes eggs 18 9 Question 4: What does the fish's heart do? A) filters blood 6 4B) pumps blood 83 90C) makes blood 6 3D) stores blood 4 2 Question 5: What does the fish's swim bladder do? A) digests food 8 4B) helps the fish swim faster 30 23C) holds urine 35 22D) helps the fish float in one place 27 51 Question 6: What do the fish's kidneys do? A) takes waste out of blood 54 64B) helps the fish hear 7 2C) pumps blood 6 4D) helps the fish stay warm 33 30 Question 7: Why are eggs and milt important? A) they help pump blood 4 2B) they help digest food 4 2C) they make baby salmon 79 85D) they protect the fish 13 11
-continued-

12
Table 1.-Page 2 of 3.
Percent Question/Answer Pre-test Post-test Question 8: What part of the human body is similar to a fish's gills? A) liver 5 5B) lungs 69 76C) heart 20 12D) kidneys 6 8 Question 9: What does the slime on a fish do? A) digests food 1 2B) gets oxygen from the water 18 10C) filters blood 4 1D) protects it from germs 77 87 Question 10: When the salmon starts out its life as an egg in a stream, where would it be found? A) buried carefully in the mud 29 25B) in a nest made of sticks 4 3C) under the gravel 54 63D) floating on a pond 14 9 Question 11: After hatching, how does an alevin get its food? A) it eats small bits of plants 14 8B) its mother brings it food 10 7C) it strains insects 8 4D) from its yolk-sac 68 81 Question 12: Which sentence is NOT true about salmon fry? A) Some salmon fry may travel to the ocean right after they come out of the gravel 28 26B) Birds and other animals eat salmon fry. 11 6C) All salmon fry are found far out in the middle of the sea. 52 62D) Some salmon fry live in streams or lakes for a while. 8 7 Question 13: What happens to salmon when they change into smolt? A) Their bodies change to a shiny, silvery color. 60 61B) Their stomachs must be able to digest plants in addition to insects 14 17C) Their eyesight gets better by 200%. 8 6D) They make eggs or milt 18 16 Question 14: Which sentence is TRUE about adult salmon living in the ocean? A) They always stay close to their home stream. 15 17B) They may swim thousands of miles. 47 53C) They only live in the ocean a few weeks. 17 18D) Their travels in the ocean are very random. 20 13
-continued-

13
Table 1.-Page 3 of 3.
Percent Question/Answer Pre-test Post-test Question 15: How do salmon find their way back to their home stream to spawn? A) by sight 24 7B) by touch 3 4C) by sound 10 7D) by smell 63 82 Question 16: Which is NOT true about salmon that are getting ready to spawn? A) they eat a lot 31 38B) they change color 14 10C) they stop eating 27 32D) they grow a hump 28 20 Question 17: What happens to salmon after they spawn? A) go to lakes for the winter 5 3B) go back to the ocean 11 7C) stay with the baby salmon 10 6D) die 74 84 Question 18: What life stages of salmon are found in creeks in Anchorage? A) eggs and smolt 21 12B) feeding adults and fry 11 8C) eggs, alevin, fry, smolt, spawner 48 60D) eggs, alevin, fry 20 20 Question 19: Which one is an Alaskan salmon? A) catfish 9 3B) minnow 27 12C) coho 55 82D) perch 8 3 Question 20: What do fishery biologists do for their job? A) They take people on fishing trips 8 6B) They study fish and what fish need to be healthy 80 85C) They catch fish and sell them to grocery stores. 9 9D) They make artwork out of fish for fishing stores 3 1 Question 21: What's the best way to know the rules for fishing? A) look in the regulation book 78 80B) look in the dictionary 3 5C) just catch as many as you want 8 6D) ask your friends 11 9

14
0
20
40
60
80
100
Fins
Sto
mac
h
Live
r
Hea
rt
Sw
im b
ladd
er
Kid
neys
Egg
s/m
ilt
Gill
s
Slim
e
Egg
Ale
vin
Fry
Sm
olt
Adu
lts
Hom
ing
Spa
wni
ng
Spa
wni
ng
Cre
ek li
fe s
tage
s
Ala
skan
sal
mon
Fish
ery
biol
ogis
ts
Reg
ulat
ions
Question Topic
% o
f Stu
dent
s w
/Cor
rect
Ans
wer
Pre-test Post-test
Note: See Table 1 for complete question wording.
Figure 4.-Percent of students selecting the correct answer on the pre- and post-test, by question, 2006-2007.
ASD has an over-all district transiency rate of 26.8%, and post-test results include students who may have entered the program mid-way through the school year.
Prior Knowledge Prior knowledge is one of the most important considerations in teaching (Gunter et. al 2007). Without any prior knowledge, students will be overwhelmed with new information and will be unable to relate new information to concepts they already understand. On the other hand, if students have an abundance of knowledge about a topic, they could become bored and time may be wasted focusing on concepts they already thoroughly understand. Therefore, assessing prior knowledge is essential to effective teaching and is also crucial to identifying underlying misconceptions that should be explicitly addressed by educators.
The test in this study provided helpful information concerning the prior knowledge students bring about salmon into the program. Based on this study, as they entered the program at the beginning of the school year, many (70%+) students already had a basic understanding of the function of the fish’s fins (Question 1), heart (Question 4), eggs and milt (Question 7), and slime (Question 9); they understood that salmon die after spawning (Question 17); they knew what fishery biologists do (Question 20), and where to find fishing regulations (Question 21). It was surprising that, as they entered the program, nearly 70% of students knew that alevins get their nourishment from the yolk-sac (Table 1, Question 11), because we had expected the terms “alevin” and “yolk-sac” to be unfamiliar terms to most children of this age group.

15
Table 2.-Student responses to four opinion statements on the pre- and post-test, 2006-2007.
Pre-test Post-test Statement and response Number Percent Number Percent I would like to learn more about salmon. Yes!!! 299 59 133 37Maybe a little. 134 27 128 35I don't know. 37 7 45 12Not really. 24 5 44 12No way. 10 2 14 4Total 504 100 364 100 I think studying fish is an interesting job. Yes!!! 256 51 117 32Maybe a little. 129 26 114 31I don't know. 59 12 57 16Not really. 36 7 55 15No way. 23 5 22 6Total 503 100 365 100 It's good to have a real fish in class to study. Yes!!! 350 70 225 62Maybe a little. 79 16 72 20I don't know. 35 7 36 10Not really. 21 4 19 5No way. 18 4 13 4Total 503 100 365 100 I would like to go fishing. Yes!!! 400 80 276 76Maybe a little. 58 12 37 10I don't know. 16 3 17 5Not really. 12 2 24 7No way. 16 3 11 3Total 502 100 365 100

16
50
60
70
80
90
100
I would like to learn moreabout salmon.
I think studying fish is aninteresting job.
It's good to have a real fishin class to study.
I would like to go fishing.
Statement
Per
cent
Pre-test Post-test
Note that the vertical axis begins at 50%. Figure 5.-Percent of students responding “yes” or “maybe a little” to four opinion statements on the
pre- and post-test, 2006-2007.
High prior knowledge of these terms and concepts may be from prior involvement in our program or students may have obtained the knowledge from other sources. In many ASD schools, the program is open to the whole school. Even though it may not be the primary emphasis for younger grades, younger children may be exposed to the program through the aquarium being in a common area and they may attend the field trips with their older classmates. In addition, many children in Alaska are involved in sport fishing or other similar activities, and many different areas of modern Alaskan culture emphasize salmon.
Another possibility is that some classes might have begun the unit on salmon prior to administration of the pre-test. Pre-tests were distributed to teachers right before the egg take in mid-September because we had assumed that teachers use the egg take as the introductory activity for the program. However, we discovered in a subsequent study that at least some teachers begin teaching about salmon from the first day of school in mid-August. Therefore, for some of the students, the pre-test may not have really been a pre-test. We do not know how many classes began the unit prior to the pre-test, but for future studies, this potential issue can be avoided by distributing the pre-test near the beginning of the school year.
17
Table 3.-Teacher responses to the survey distributed with the post-test, 2006-2007.
Responses Question and response Number Percent
Question 1. How many years have you participated in the Salmon in the Classroom program, including this year? Experience 1 year (this is my first year) 4 252-3 years 3 194-5 years 2 13More than 5 years 7 44Total a 16 100 Question 2. Which of the following supporting materials do you use for teaching about salmon? Materials Used Salmonids in the Classroom curriculum 12 71Salmon life cycle poster 16 94Alaska's Wild Salmon 13 76Aquarium setup manual 7 41Otherb 10 59 Number of Materials Used 1 1 62 1 63 8 474 4 245 3 18Total 17 100 Question 3. In which of the following activities did your class participate during the 2006-2007 school year? Activities Participated In Egg takes 17 100Aquarium in classroom or school 16 94Salmon dissection 14 82Salmon Celebration 15 88Otherb 4 24 Number of Activities 1 0 02 1 63 2 124 12 715 2 12Total 17 100 a No response by one teacher. b See Table 4 for a list of "other" materials/activities written in by teachers.

18
Table 4.-Write-in responses on the teacher survey, listing of other materials used (Question 2), 2006-2007.
Other materials used by teachers Salmon trade books 3 part cards of Alaska's salmon. Made salmon bulletin board. Researched/dissected fish. Created a salmon book. Salmon science notebooks, math/story problems. Assorted web pages. Watershed health/bugs helped create materials for helping teach other students at the "Salmon Celebration" Was given various materials from 6th grade teacher. Background information: salmon anatomy. Scales & Tales and news clippings: they were hand down materials.
The basic understandings of fish and salmon that many students already have as they enter the program are important, in that they give Sport Fish educators a foundation on which to build. However, the amount of time and effort spent targeting these concepts should be evaluated. Rather than focusing on concepts many students already understand, basic concepts can be used as building blocks to teach concepts that showed little improvement or for which misconceptions continued through the end of the school year.
Misconceptions A pre/post-test assessment can be beneficial for identifying concepts that need clarification through more time, emphasis, or modified teaching techniques. Several such areas were identified through this assessment. Although the percent of students choosing the correct answer for the question concerning the function of the stomach increased from 61% on the pre-test to 74% on the post-test, most students who did not select the correct answer chose “makes eggs” instead. Even after participating in a dissection, 22% of students thought that the function of the stomach was to “make eggs” rather than “digest food.” This could reflect confusion among children this age who may equate “stomach” with “body cavity,” or who think that babies develop in the “stomach” of the mother in humans. During dissections, Sport Fish aquatic educators should consider focusing time on carefully explaining the function of the stomach, and pointing out the location of eggs and stomach in the body cavity of the fish. However, educators should be aware that overcoming prior misconceptions can be extremely difficult, and in fact, educators may inadvertently reinforce misconceptions.
Continued lack of understanding or misconceptions were indicated for the liver, swim bladder, kidneys, and gills (Table 1, Questions 3, 5, 6 and 8); and concerning egg, fry, smolt and ocean life stages (Questions 10, 12, 13, 14). Sport Fish aquatic educators should carefully evaluate presentations as they are currently structured to ensure that the program covers these topics and in ways that are meaningful to students. The Salmonids in the Classroom curriculum will be revised during 2007-2008. During the revision process, special attention should be given to these concepts.

19
STUDENT OPINIONS AND PROGRAM FEEDBACK Students’ opinions about the program after participating are a concern. Students were less positive about learning about salmon, studying fish for a job, having a real fish in class, and sport fishing at the end of the program than at the beginning. Of course, we cannot expect that 100% of students will be enthusiastic about these topics, and it is also possible that these results simply reflect students’ overall readiness to be done with school in general at the end of the school year. However, we need to seriously consider the possibility that these results are a reflection of the program itself. For example, perhaps the way material is presented does not fully engage students, making them less interested in learning about salmon at the end of the program. Perhaps Sport Fish educators should highlight a broader variety of careers available in fisheries. Perhaps students find dissecting a real fish distasteful or even disturbing; or perhaps they find caring for live fish in a cold-water aquarium onerous or boring. Perhaps they were excited about the prospect of sport fishing, but cancellation of the ice fishing field trip dampened their spirits.
In the past, the only feedback received from students and teachers came from those who were enthusiastic about the program. There has been no effective mechanism to receive constructive criticism, concerns, or suggestions about the program, or to contact teachers who drop out of the program to find out why they did so. Therefore, in the past it was assumed that the program was meaningful and effective for all participants and that the program increased enthusiasm for studying salmon, becoming a fishery biologist, and sport fishing. Although it would be tempting to look at the post-test results alone and conclude that the program is having a positive outcome on students, program staff should rather make efforts to discover why students are less enthusiastic at the end of the program than at the beginning.
There are several ways to collect this kind of information. First, feedback from teachers should be gathered. Although the teacher survey in this study provided write-in space for suggestions and this program has conducted informal surveys of teachers in the past, most input appears to be given hastily, input is received from a self-selecting sample of teachers, and teachers provide few detailed concerns or suggestions for improvements on surveys (unpublished data). To receive truly useful feedback that accurately reflects the program, a random sample of teachers should be selected. A Sport Fish aquatic education representative should meet with the selected teachers individually and in-person. During the meeting, teachers should be assured that the purpose of receiving feedback is not because of program cuts or drastic changes, but to ensure that the program is responsive to the needs of teachers and students, and to increase program effectiveness. Teachers also should be shown results of this study, and changes already made to the program to increase its effectiveness based on study results and previous teacher input. This will assure teachers that the time they take to provide feedback will result in program improvements and effectiveness, and that Sport Fish Division is sincere in its desire for input from participants and to improve the program.
Second, teachers who drop out of the program should be contacted and an exit interview should be conducted, preferably in person. This will allow drop-out rates to be determined, information that has not been available previously. Reasons for dropping out of the program should be documented and tracked to discover if there are commonalities and to elucidate possible areas for program improvement.
Third, Sport Fish educators should adopt feedback tools to use with students during presentations. These tools, called classroom assessment techniques in formal education, are

20
intended to be used frequently to make immediate adjustments to teaching methods. Classroom assessment has several benefits for the instructor, providing “day-to-day feedback that can be applied immediately… useful information about what students have learned without the amount of time required for preparing tests, reading papers, etc. … allow you to address student misconceptions or lack of understanding in a timely way…help to foster good working relationships with students…” For students, classroom assessment can “reduce feelings of isolation and impotence, especially in large classes; increase understanding and ability to think critically about the course content; foster an attitude that values understanding and long-term retention” (Haugen 1999). There are many classroom assessment tools (Angelo and Cross 1993) that Sport Fish educators could adopt or modify for use in the Salmon in the Classroom program that will give them immediate information about student engagement and understanding, and could provide insight into the decrease in enthusiasm indicated by results of this study.
CONCLUSIONS Overall, results of this project indicate that the Salmon in the Classroom program increased ASD 4th-6th graders’ overall knowledge of salmon during the 2006-2007 school year, and the program far exceeded the strategic plan objective for 25% of students in the program to score at least a 70% on the post-test. The Salmon in the Classroom program thus continues to be one of the primary tools by which Region II pursues its aquatic education goals, and staff should consider a more ambitious objective if the aquatic education plan is revised.
To increase effectiveness of the Salmon in the Classroom program, Sport Fish aquatic educators should look carefully at topics for which misunderstandings remained at the end of the 2006-2007 school year to identify potential improvements to the program, consider possible reasons for the decrease in student enthusiasm, identify ways to engage students more effectively, and develop a mechanism for encouraging feedback on the program from teachers and students. The assessment project should be conducted again in 2007-2008 to obtain further information on the program’s effectiveness, and document effects of program changes on students’ knowledge and opinions. Participation in the pre- and post-tests needs to be increased, and particular effort should be made to obtain student IDs so that a sufficient sample of paired pre-post tests is available for analysis.
ACKNOWLEDGMENTS Stacie Hall provided helpful expertise and review of this project during the planning phase. Lisa Olson provided reviews of the draft test. Sarah Hotchkiss set up the test form and scanned completed tests. Danise Podvin provided assessment expertise and support in planning the project. Crystal Wrabetz provided assistance in delivering tests to teachers.
REFERENCES CITED ADF&G (Alaska Department of Fish and Game). 2002. Division of Sport Fish Strategic Plan. Developed by the
Division of Sport Fish Planning and Policy Analysis Unit in conjunction with the Department Leadership Team. Available at: http://www.sf.adfg.state.ak.us/statewide/stratplan/SPhome.cfm, Anchorage.
Angelo, T. A. and K. P. Cross. 1993. Classroom assessment techniques: a handbook for college teachers. Second Edition. Jossey-Bass Publishers, San Francisco.
Cochran, W. G. 1977. Sampling techniques, third edition. John Wiley and Sons, New York.
Gunter, M. A., T. H. Estes and S. L. Mintz. 2007. Instruction: a models approach. 5th edition. Pearson Education, Inc. Boston, MA.

REFERENCES CITED (Continued)
21
Haugen, L. 1999. Classroom assessment techniques. Center for Teaching Excellence, Iowa State University. http://www.celt.iastate.edu/teaching/cat.html
Hinchcliff, G., L. Hinkey, and S. Tavares. 2004. Project design and evaluation. NOAA Coastal Services Center, Coastal Learning Services, Charleston, SC.
Kraus, F. R. 1999. Summary of public education and outreach activities conducted by the Salmon Trout Restoration Education and Aquatic Management (STREAM) program, July 1990-June 1998. Alaska Department of Fish and Game, Special Publication No. 99-3, Anchorage. http://www.sf.adfg.state.ak.us/FedAidPDFs/sp99-03.pdf
Kraus, F. R. 2005a. Summary of public education and outreach activities conducted by the Salmon Trout Restoration Education and Aquatic Management (STREAM) program, July 1, 2001-June 30, 2002. Alaska Department of Fish and Game, Fishery Management Report No. 05-55, Anchorage. http://www.sf.adfg.state.ak.us/FedAidPDFs/fmr05-55.pdf
Kraus, F. R. 2005b. Summary of public education and outreach activities conducted by the Salmon Trout Restoration Education and Aquatic Management (STREAM) program, July 1, 2002-June 30, 2003. Alaska Department of Fish and Game, Fishery Management Report No. 05-56, Anchorage. http://www.sf.adfg.state.ak.us/FedAidPDFs/fmr05-56.pdf
Kraus, F. R. 2006a. Summary of public education and outreach activities conducted by the Salmon Trout Restoration Education and Aquatic Management (STREAM) Program, July 1, 2003-June 30, 2004. Alaska Department of Fish and Game, Fishery Management Report No. 06-50, Anchorage. http://www.sf.adfg.state.ak.us/FedAidpdfs/fmr06-50.pdf
Kraus, F. R. 2006b. Summary of public education and outreach activities conducted by the Salmon Trout Restoration Education and Aquatic Management (STREAM) Program, July 1, 2004-June 30, 2005. Alaska Department of Fish and Game, Fishery Management Report No. 06-55, Anchorage. http://www.sf.adfg.state.ak.us/FedAidPDFs/Fmr06-55.pdf
Kraus, F. R., A. Hoffmann, and L. Olson. 2000. Summary of public education, outreach and information activities conducted by southcentral region’s information and education program, July 1, 1998-June 30, 1999. Alaska Department of Fish and Game, Fishery Management Report No. 00-14, Anchorage. http://www.sf.adfg.state.ak.us/FedAidPDFs/fmr00-14.pdf
Kraus, F. R., and L. Olson. 2003a. Summary of public education, outreach and information activities conducted by Southcentral Region's information and education program, July 1, 1998-June 30, 1999. Alaska Department of Fish and Game, Fishery Management Report No. 03-08, Anchorage. http://www.sf.adfg.state.ak.us/FedAidPDFs/fmr03-08.pdf
Kraus, F. R., and L. Olson. 2003b. Summary of public education, outreach and information activities conducted by southcentral region's information and education program, July 1, 2000-June 30, 2001. Alaska Department of Fish and Game, Fishery Management Report No. 03-09, Anchorage. http://www.sf.adfg.state.ak.us/FedAidPDFs/fmr03-09.pdf
Timmons, L. S. 2006. Strategic plan for the Division of Sport Fish, Southcentral Region, Sport Fishing and Aquatic Education Program. Alaska Department of Fish and Game, Special Publication No. 06-30, Anchorage. http://www.sf.adfg.state.ak.us/FedAidpdfs/Sp06-30.pdf

22

23
APPENDIX A. PRE/POST TEST AND TEACHER SURVEY

24
Appendix A1.-Pre- and post-test administered to Anchorage School District 4th–6th graders participating in the Salmon in the Classroom program, 2006-2007.
-continued-
25
Appendix A1.-Page 2 of 2.
26
Appendix A2.-Teacher survey conducted with the post-test, 2006-2007. 1. How many years have you participated in the Salmon in the Classroom program, including this year?
a) 1 year (this is my first year)
b) 2-3 years
c) 4-5 years
d) more than 5 years
2. Which of the following supporting materials do you use for teaching about salmon?
a) Salmonids in the Classroom curriculum (yes/no)
b) Salmon life cycle poster (yes/no)
c) Alaska’s Wild Salmon (yes/no)
d) Aquarium setup for Dummies (yes/no)
e) Other educational materials that I have created and/or collected (yes/no)
If you answered “Yes” to “other”, please tell us what they were:
3. Which of the following activities did your class participate in during the 2006-2007 school year?
a) Egg takes at Campbell Creek (yes/no)
b) Aquarium in my classroom or school (yes/no)
c) Salmon dissection (yes/no)
d) Salmon Celebration (fry or smolt release) (yes/no)
e) Other salmon-related presentations by guest experts and/or field trips I arranged myself (yes/no)
If you answered “Yes” to “other”, please tell us what they were:
4. Do you have any suggestions or comments for us about this program or assessment?