ASSESSING ALERTNESS FROM EEG POWER SPECTRAL BANDS
18
ASSESSING ALERTNESS FROM EEG POWER SPECTRAL BANDS Robin Alvarez [email protected] Escuela Politécnica Nacional (DETRI) Quito- Ecuador Del Pozo Francisco Politécnica de Madrid Abstract— The assessment of low level of alertness and drowsiness conditions of humans, while performing critical tasks, requires the development of automatic detection systems to work in real time, to be as pervasive as possible for long lasting periods of use and robust enough to cope with a wide intra- and inter-individual variability. A new alertness detection procedure based on the spectral analysis of the EEG signal is proposed, mostly concerned with the provision of robust classification criteria under the working conditions depicted above. The wide inter- individual variability has been reduced down to operational levels by means of a personal dependant normalization algorithm, which consists of describing the EEG spectral morphology as a function of the alpha behaviour of each subject. With this approach, drowsiness classification can be achieved by simple thresholding of the EEG spectral variable selected: the power ratio between a high frequency and an alpha bands defined for each individual. Variable that has been selected to optimize the discriminant power and its inter- individual stability. The experimental results include the selection of the preferred recording sites and the demonstration of the reliability of the classification criteria along the time for each individual. The paper also analyses the time resolution of the algorithms to assure their real time operation. Technological requirements of the method proposed allow concluding that the design of a wearable one single EEG lead non- intrusive device it is feasible to reliably discriminate continuously drowsiness situations. Index Terms— alertness, drowsiness, EEG spectral analysis, hypo-vigilance a M I. INTRODUCTION ANY accidents are associated to low level of lertness of humans while performing critical tasks, as driving a car [1] or operating machines or energy plans, to give but a few examples. Low level of alertness can drive into drowsiness to individuals performing monotonous and repetitive tasks, lacking external stimuli, especially when other factors are involved as insufficient previous sleep hours, rich intakes of food and drink or certain drug therapies. Many efforts have been dedicated already to identify and detect the low level of alertness and drowsiness of humans. However, the development of robust detection algorithms and minimally intrusive systems for real time applications, to be worn by target users for long periods, is still an important challenge for which reliable practical solutions are still to come. The assessment of the level of alertness of humans has been approached in the literature in several ways. Among them, the relation between the power spectra of EEG and human alertness, the approach of present work, has been studied since 1967 [2], [3]. Many publications had reported spectral density changes related to alertness, under a wide variety of experimental conditions. Several studies, using the traditional frequency bands (delta, theta, alpha y beta) to describe the EEG, have reported the onset of alpha bursts along monotonous tasks [4], although no attempts were included to quantify the alertness levels. Other studies depict the possibility of detecting and tracking alertness and drowsiness from frequencies over 30 Hz, in the 80-420 Hz range [5]. More recently, using neuronal networks, it was reported a significant correlation between the error while performing specific tasks and the increase of the power spectrum in the 3.7 Hz and 14.7 Hz bands [6]; the absence however of a clear description of the experimental conditions makes difficult to reliably associate error rates and alertness level. Discriminant function analysis applied to the EEG spectrum from 1 to 24 Hz has been suggested to classify EEG patterns along the alertness-drowsiness continuum [7]. Saroj and Craig [8] report that although variations in alpha waves are associated to drowsiness, larger differences were easily detected in the delta y theta waves, from the average of 19 EEG channels recordings; a finding far from any option to implement wearable devices, necessarily based on a reduced number of recording leads. An increase in alpha and theta rhythms as a consequence of sleep deprivation has been also reported [9], concluding that
Transcript of ASSESSING ALERTNESS FROM EEG POWER SPECTRAL BANDS

ASSESSING ALERTNESS FROM EEG POWER SPECTRAL BANDS
Robin Alvarez [email protected]
Escuela Politécnica Nacional (DETRI) Quito- Ecuador
Del Pozo Francisco
Politécnica de Madrid
Abstract— The assessment of low level of
alertness and drowsiness conditions of humans, while performing critical tasks, requires the development of automatic detection systems to work in real time, to be as pervasive as possible for long lasting periods of use and robust enough to cope with a wide intra- and inter-individual variability.
A new alertness detection procedure based on the spectral analysis of the EEG signal is proposed, mostly concerned with the provision of robust classification criteria under the working conditions depicted above. The wide inter-individual variability has been reduced down to operational levels by means of a personal dependant normalization algorithm, which consists of describing the EEG spectral morphology as a function of the alpha behaviour of each subject. With this approach, drowsiness classification can be achieved by simple thresholding of the EEG spectral variable selected: the power ratio between a high frequency and an alpha bands defined for each individual. Variable that has been selected to optimize the discriminant power and its inter-individual stability. The experimental results include the selection of the preferred recording sites and the demonstration of the reliability of the classification criteria along the time for each individual. The paper also analyses the time resolution of the algorithms to assure their real time operation. Technological requirements of the method proposed allow concluding that the design of a wearable one single EEG lead non-intrusive device it is feasible to reliably discriminate continuously drowsiness situations.
Index Terms— alertness, drowsiness, EEG
spectral analysis, hypo-vigilance
aM
I. INTRODUCTION ANY accidents are associated to low level of
lertness of humans while performing critical tasks, as driving a car [1] or operating machines or energy
plans, to give but a few examples. Low level of alertness can drive into drowsiness to individuals performing monotonous and repetitive tasks, lacking external stimuli, especially when other factors are involved as insufficient previous sleep hours, rich intakes of food and drink or certain drug therapies.
Many efforts have been dedicated already to identify and detect the low level of alertness and drowsiness of humans. However, the development of robust detection algorithms and minimally intrusive systems for real time applications, to be worn by target users for long periods, is still an important challenge for which reliable practical solutions are still to come.
The assessment of the level of alertness of humans has been approached in the literature in several ways. Among them, the relation between the power spectra of EEG and human alertness, the approach of present work, has been studied since 1967 [2], [3]. Many publications had reported spectral density changes related to alertness, under a wide variety of experimental conditions. Several studies, using the traditional frequency bands (delta, theta, alpha y beta) to describe the EEG, have reported the onset of alpha bursts along monotonous tasks [4], although no attempts were included to quantify the alertness levels. Other studies depict the possibility of detecting and tracking alertness and drowsiness from frequencies over 30 Hz, in the 80-420 Hz range [5].
More recently, using neuronal networks, it was reported a significant correlation between the error while performing specific tasks and the increase of the power spectrum in the 3.7 Hz and 14.7 Hz bands [6]; the absence however of a clear description of the experimental conditions makes difficult to reliably associate error rates and alertness level.
Discriminant function analysis applied to the EEG spectrum from 1 to 24 Hz has been suggested to classify EEG patterns along the alertness-drowsiness continuum [7]. Saroj and Craig [8] report that although variations in alpha waves are associated to drowsiness, larger differences were easily detected in the delta y theta waves, from the average of 19 EEG channels recordings; a finding far from any option to implement wearable devices, necessarily based on a reduced number of recording leads. An increase in alpha and theta rhythms as a consequence of sleep deprivation has been also reported [9], concluding that
complexity of the EEG signal and individual variability is a mayor problem for EEG to build a reliable alertness detector.
An obliged related reference are the classical polisomnographic studies, concerned with sleep analysis [10], [11] to characterize specific sleep disorders and to investigate their causes. Although alertness and drowsiness status are well documented and identified there, their value to our objectives is relative, since both, recording conditions and their purpose of defining sleep phases’ profiles, are away from the detection of a subject entering into a reduced alert or drowsiness condition, with his/her eyes open and doing regular tasks, as driving a car or doing other sensible tasks. Moreover, some of these sleep studies has reported the difficulties of expressing waking drowsiness states as deviations from pooled sleep data [12], [13].
Other alternative approaches to EEG spectral analysis have been published. Eye behavior and facial expression have been published to be related to a person’s level of alertness in car drivers [14]; characterized and quantified with different variables: eye blink frequency, eye closure duration and speed or percentage of eye closure over time [15] – [18]. This approach has the great advantage of being completely non-intrusive, since nothing is to be placed on the person, as with the physiological signal based procedures requiring electrodes glued to the skin. However, this is also the reason of its main drawbacks: reliable feature detection algorithm are difficult to achieve if we consider that the system has to work while the driver moves his/her head, and a high frame ratio of the TV cameras is required to cope with the high speed of eye blinking. Difficulties that are greatly increased when the driver uses glasses, excluding any possibility to use sun glasses while driving. Moreover, the great inter-individual variability makes mandatory the implementation of complex personalization routines previous to any use of the system.
Correlation between driver alertness, vehicle behavior and car instrument handling has been published. Speed reduction [19], [21] and increases in the number and amplitude of steering wheel movements [22], [23] have been reported as drivers approach drowsiness. These studies agree that any decision systems to assess drowsiness have necessarily to take into account several of these variables simultaneously.
Several EU funded projects have dealt with the issue of security of car driving, including assessing driver alertness [24], [25]. These projects, apart from exploring the benefits of the integrated use of a variety of technologies for driver vigilance and vehicle control, has made clear the need for intensive research on drowsiness measurement based on physiological
signal as well as the need for well defined alertness/drowsiness criteria based on them.
Based on this state of the art and taking into consideration the development pace of sensors, microelectronics and signal processing technologies, we consider that further work is required to assess drowsiness with real time minimally intrusive wearable devices, based on physiological signals and very notably on the EEG, to discriminate situations of an individual evolving toward drowsiness, well in advance to falling into sleep.
II. METHODS
The control of the alertness status of the
experimental subjects is not a simple issue, for which no sound guidelines have been found in the literature. It was approached in this study by controlling two factors: 1) maintaining the subjects doing specific tasks, whose demand of attention can be modified in a reproducible scale and 2) controlling the level of tiredness both through the subjective self-assessment of that level by the experimental subjects themselves, immediately before the experimental sessions; or provoked by extreme conditions of sleep deprivation, a factor that, although assumed to have a widely different effect across individuals, is at least quantifiable and reproducible and when used at extreme limits produce neatly tiredness situations, common to any experimental subject.
The control of stimuli was achieved by asking the subjects to perform a fixed sequence of tasks, demanding clearly different levels of attention. All other potential stimuli were kept as controlled as possible by running the EEG measurement sessions within a silent and quite environment without other stimuli those of the experimental tasks. EEG was recorded with the following protocol: It starts with a 5 minutes session where the subject is asked to be relaxed with the eyes closed, and a complete absence of visual and sound stimuli, to identify the “alpha behavior” of each subject; who was allowed previously to get in contact with the environment to make the experimental setting familiar to him/her. Immediately after, it follows two consecutive driving sessions on a car simulator (Grand prix 3, 2000 Hasbro interactive, Inc.), with different levels of difficulty. The first one is a 10 minutes relaxed driving session and the second one a 10 minutes fast driving period, demanding a much greater levels of attention. With this design it is expected that the level of alertness required to adapt the demands of the experimental tasks is interfering with the tiredness status of the driver previous to the experiment. Expected results should show a modulation effect of the level of alertness by the intensity of the stimuli for each individual performing the different experimental tasks.

20 healthy volunteers (ranging 22 to 41 years old) were included in the experiment. Other volunteers were included in related experiments for the: 1) initial selection of the EEG spectral features according to their discrimination power of the state of alertness; 2) identification of the optimum recording sites; 3) characterization of the intra-individual stability of the alertness classification criteria.
EEG was recorded with a standard multi-channel general purpose EEG recording system (MP30-BIOPAC Systems, Inc.). EEG signals were sampled with a 100 Hz sampling rate and 8 bit quantification. After sampling, the digital signal was band pass filtered (8th order Butterworth filter) between 4 and 45 Hz.
The low frequency components removed below 4 Hz were considered of negligible significance in this study, well away from out target spectral bands, having the great benefit of reducing enormously movement artifacts, a question of prime importance in the environment this system is intended to be used.
Several power spectrum estimation methods were evaluated comparatively to select the best possible choice to analyze the EEG, taking into account the main concern of present investigation: the evolution of the alertness level and the detection of drowsiness have to be evaluated continuously in real time, to generate the appropriate advising or alarm signals to prevent the user of these situations. Taking also into consideration the restrictions imposed by the fact that the processing algorithms have to be installed finally on miniature wearable wireless devices to minimize system intrusiveness. A Welch method was finally selected, with 50% overlapping and Hanning windowing filled with zeroes up to 512 points.
Finally to handle efficiently the great amount of data and experimental conditions under study, a PC based application to support the experiments was developed. The figures that follows are screen designs of that software application.
III. RESULTS
A. Selecting the EEG features Based on our previous experience and that from the
reviewed literature, the search for the EEG features to assess the alertness level was focused on variables derived from the power within specific spectral bands. Figure 1 shows the clear effects on the EEG spectral density when a person is asked to move from relaxed conditions toward situations demanding higher levels of alertness.
The mean EEG power spectra of the experimental subjects, averaged for each of the three experimental sessions (closed eyes, monotonous driving and very fast driving) and normalized (to its maximum value),
are shown in Figure 2. The four examples of that figure have been selected
to emphasize the differences associated to the specific alpha behavior of each individual, defined by his/her power spectrum obtained with the eyes closed, an essential issue of the method proposed. In the figure three of them have clearly different alpha frequencies and the fourth one do not show any rhythmic behavior at all. Although most of the experimental subjects (15/20) showed an alpha rhythm around 10 Hz, 2 have more than 12,5 Hz, another 7,5 Hz and two of them did not show clear alpha rhythm at all.
Two conclusions can be derived from this study: 1) There is a widening effect of the spectrum as a response to the stimuli, that increases with its intensity, in agreement with previous reports [4],[8],[9], depicting the association of several spectral bands with relaxation and alertness status, 2) That widening effect always take place around the location of the alpha frequency of each individual, the peak of the power spectrum when averaged during an eyes closed session.
This evidence justifies our proposal that any alertness-related EEG characterization based on its spectral morphology has to be defined in relation to the particular alpha behavior of each individual. The spectral spreading effect associated to the increase of the alertness level as well as the changes observed in their morphologies suggested the definition of three variables to describe the EEG behavior: The power in a band around the personal alpha band (PAB) defined in relation to the personal alpha rhythm (PAR) as (PAB = PAR ± 2 Hz); the power over that band that we will call the High Frequency Band (HFB) and a Low Frequency Band (LFB) the power below the PAB. Band delineation was achieved by comparative multifactorial analysis to assess the discrimination power of the different choices. Other secondary variables were also defined from them: the ratio between each power band and the total spectral power (TP) (PAB/TP, HFB/TP and LFB/TP) and the relation between the HFB/PAB. These variables are similar to other previously published: the initial work by Matousek [2] that proposed the theta/alpha ratio, and more recently other more complex functions of the spectral density bands, as that proposed by De Ward and Brookhuis in 1991 and 1993 [26], [27] of theta band density plus alpha/beta ratio. In should be noticed, however, that in the reports mentioned, bands were defined by their traditional fixed frequencies limits and corresponds to polisomnographic studies, while we propose bands defined by the individual value of the alpha rhythm and EEG recordings are obtained with the eyes open while driving a car simulator.
These spectral variables were analyzed from long

EEG recordings series (more than 25 min.) to identify the statistical levels of alertness discrimination power corresponding to individuals while driving in the simulator under slow and rapid driving conditions. The LFB was excluded initially once it was observed its poor discrimination power. Among the other variables, HFB/PAB, which showed the best discrimination power (t (unequal variances) = 45.6, p<0.01), was selected.
B. Selecting the EEG recording sites It should be clearly understood that this critical
issue of selecting the most appropriate recording sites is approached here taking into account that recording sites should be optimized in number and location, to make their placing and wearing as easy and comfortable as possible. Only so we will be able to build devices that users complain their use during long periods: Electrodes simple to fix, comfortable to wear and suitable for instrumental arrangements with affordable levels of noise due to head/body movements. In other words, this analysis more that identifying the best recording site was focused to demonstrate that it is possible to get the required discrimination power for the previously selected more convenient sites. C3, C4, Cz, O1 y O2 (10-20 international standard) EEG recording sites were included in this study. Ground electrode was located at A2 and the reference electrode in A1.
The recording sites were thoroughly explored with EEG series from individuals under the selected experimental protocol. As shown in Figure 3 all sites offered good discriminating power, with very statistically significant differences in the HFB/PAB variable.
To compare the obtained result, Table 1 includes the significance t-test for the differences of mean corresponding to each pair of stimulation sessions, as well as the Anova F and p values for the stimuli factor.
O1, O2 and Cz sites depicted the largest mean value difference significance and Anova score. However, the main conclusion is that any of the sites selected are suitable enough to drive the alertness classification system.
C. Drowsiness related EEG spectral features: intra-personal variability Although in most papers reviewed human variability
is identified as a principal problem to end with robust detection criteria, most attempts to control that variability has been mainly focused: 1) to minimize the effects of well known noise sources, as it is the case with some artifact produced by the experimental subject (eye blinks, EMG, EOG, etc.) and 2) to get rid of many other sources of suspected or completely unknown sources of variability, for which the only
option is to manipulate, personalize, the row EEG signals by some sort of statistical normalization of the EEG time series (i.e.: the conventional z-normalization, subtracting the mean and dividing by the standard deviation). A further personalization procedure will consists of defining a background baseline against which changes due to the experimental factors are measured; an always risky operation that assumes that pooled data contains all non-relevant information.
Our first analysis was focused to assess intra-individual variability. Target spectral variables were evaluated along a series of experimental sessions at random hours of different days for single individuals; all of them obtained under similar conditions of previous night sleep duration and own perception of the subjective alertness state.
Fig. 4 shows the HFB/PAB variable for an individual at six time points corresponding to randomly defined days and hours. Each record includes the three consecutive sessions described in methods. It can be observed that, although there are significant differences between the mean value estimators, due to many other not controlled factors, it is possible to define a unique classification threshold valid for all samples of the same individual.
D. Drowsiness related EEG spectral features: inter-personal variability Fig. 5 shows the EEG spectral variable HFB/PAB
(ratio between the high frequency band and the alpha band), for all subjects with well defined alpha behavior (18/20), as a function of 1) the self-assessment of the tiredness status previous to the experimental sessions (1: very tired, 2: tired; 3: normal/active), and 2) the level of the experimental stimuli (1: relaxed with the eyes closed; 2: slow driving; and 3: fast driving). A statistically significant dependency of the mean values of the HFB/PAB is here demonstrated both as a function of the alertness level (Anova: F 209,5, p < 0,0001) and of the intensity of the stimuli (Anova: F 356,8 p < 0,0001). In the first case no differences are observed between the tired and very tired condition, being however very significant when the person feel her/him-self under normal/active condition.
Concerning the stimuli intensity factor, differences between the mean values of the three states considered are all highly significant with a p better than 0,001 for all pairs of means (relax with eye closed, slow driving and fast driving). The numerical values of figure 5 are shown in Table 2 for comparison.
From the results of the two-factor Anova analysis (stimuli intensity and tiredness condition prior to the experiment) it was suggested to analyze how the two factors inter-actuate, both to better understand their

relationship with drowsiness and to support the appropriateness of the experimental factors selected to control the level of alertness. Table 3 shows the mean value, the S.D and S.E. of the spectral variable HFB/PAB for each value of the experimental factors: tiredness status and stimuli level, taking the other, stimuli level and tiredness status respectively, as parameter.
These values are represented in Figure 6 for comparison, taking into consideration all data available, only excluding those from the individuals without a defined alpha behavior. From the representation in the Figure 6 (top) we can conclude: 1) As expected from the result of Figure 5, there is a systematic and significant increase of the spectral estimator HFB/PAB mean values when we increase the intensity of the stimuli for all values of the tiredness level. 2) For each value of the stimuli there is a clear separation between the mean values for the very tired and tired conditions in relation to the normal situation, as it was also shown in Figure 5; 3) The rate of increase seems to be much attenuated for the individual starting with a normal level of tiredness as compared to those tired or very tired, demonstrating some sort of maximum alertness saturation effect of the HFB/PAB, toward we converge by forcing a person to do a demanding task, regardless his/her actual tiredness situation.
From the figure 6 (bottom): 1) there exist significant separations between the curves corresponding to the individuals who declared themselves to be tired or very tired before the start of the experiment. An effect that has been also observed in the figure 6 (top); 2) When the level of the stimuli is increased further (very fast driving) the discriminating variable tend to become horizontal, showing a weak dependency with the tiredness level of the experimental subject supporting the conclusion of previous paragraph.
IV. DISCUSSION The results above support the hypothesis that it is
possible to detect reliably the level of alertness of an individual from well defined spectral features of single lead EEG signals. Moreover, classification can be achieved from a variety of single recording sites, including those that are more suitable for minimally intrusive wearable applications, namely: the frontal sites (reducing the difficulties associated to fix the electrodes through the hair) and the occipital sites, convenient points to build hear-hold wireless portable detection devices.
The well documented large inter-individual variability reported in the literature and observed in our experiments seems to be successfully controlled by the normalization proposed: 1) spectral widening effect has to be defined as a function of the alpha
behavior of each individual and 2) classification power is notably enhanced when the dependency of the power of the high frequency band is normalized by the power of the individual personal alpha band.
The principal finding of this work is the demonstration that drowsiness classification criteria, stable across inter- and intra-individuals, can be achieved by simple thresholding of the EEG selected spectral variable HFB/PAB (ratio between the high frequency band and the alpha band), for all subjects with well defined alpha behavior.
The obtained results also support the appropriateness of the proposed experimental methodology to control situations associated to different levels of alertness, simple to replicate.
Although the proportion of individuals with a not-clear alpha behavior is low, new approaches to identify drowsiness for these cases has to be investigated to end with reliable automatic drowsiness classification engines that could be applied without restriction. At present we have observed, with the only two individuals analyzed a clear shift of low frequencies power toward the high frequency spectral regions as the intensity of the stimuli increases.
V. Practical implementations of real time drowsiness detection devices
It has to be taken into account that the obtained
clear significant results of the previous section correspond to the estimators of the mean value for the proposed EEG classification variable; which means that the reliability of any automatic real time classifier will increase with the size of the moving averaging window, used to estimate that mean value of the discrimination variable, a parameter that is inversely proportional to the time resolution of the drowsiness detector. In Figure 7 and 8 we show the classification performance for different window sizes and different smoothed degree; the top figures is the output of the classification algorithm along a regular experimental session (relax, slow and fast driving), where the vertical lines mark the switch between these three situations.
Below it has been included the statistical distribution of the spectral discrimination variable, together with its Gaussian best fit, to calculate the type I and II errors of the classification, to assess the quality of the classification procedure.
This issue open the important issue of demonstrating whether the proposed processing algorithms and classification criteria are suitable for the assessment in real-time of drowsing. In other words, if it is possible to obtain an acceptable balance between reliability of the classification decisions and the time resolution of the procedure, the time span

required to elaborate these decisions. To analyze this, two related studies were carried out. In the first one we analyze the effect of the spectral estimation time windows on the classification resulting errors. Starting with a time width of 10 seconds we measured the quality of the proposed classification algorithm with 20, 30 sec. time windows, and so on until the obtained classification errors are considered good enough for its use in real applications. This analysis was also performed by an equivalent procedure of smoothing a number of consecutive spectral outputs (HFB/PAB discrimination variable) calculated with the basic 10 sec. window. Again this analysis proceeded until the averaging number of consecutive samples provides an acceptable value of the classification errors.
Results of figures 7 and 8 together with the representation of the scatter distribution of the HFB/PAB variable, in figure 9, depict similar conclusions with this two approaches to reduce the dispersion of the classification variable; as it should be, since differences between both calculations, obtained with the same data windows of the EEG time series, are only due to the effects of the statistical sampling properties of the two procedures to estimate the spectral density function and the discreteness effects of these calculations.
Table 4 presents the measured variance of HFB/PAB as a function of: 1) data window time span, up to 40 sec. in 10 sec. steps and 2) the number of consecutive 10 sec. output points averaged. The table also depicts the classification quality defined by the t-test and p-value. As shown in the table better classification outcomes are obtained, for all the input data spans considered, with the smoothing procedure.
Comparing the balance between the two inversely related figures of quality (time resolution vs. reliability of the alertness estimation) we can conclude that a reliable assessment of alertness can be obtained with a 40 sec. resolution window; a time resolution considered good enough for most envisaged applications, as that of car drivers. Moreover, time resolution could be increased, if required, with an affordable loss in the resulting error that, on the other hand, can be Type I or II errors optimized, depending on the specific application: i.e.: for car driving could be adequate to minimize the ratio of false positives.
To conclude, the previous results open the possibility of designing automatic devices to discriminate in real time the level of alertness and the detection of drowsiness situations, simple, feasible and minimally intrusive, based on signal processing algorithm and discrimination criteria simple to implement and robust across intra-/inter- individuals. UPM-GBT group is developing a new system of dry electrodes based on high impedance interfaces (1012 Ω). Figure 10 shows: a) The schematic diagram; b)
dry electrodes: two possibilities: plane and with thin tubes for introducing in the hair.
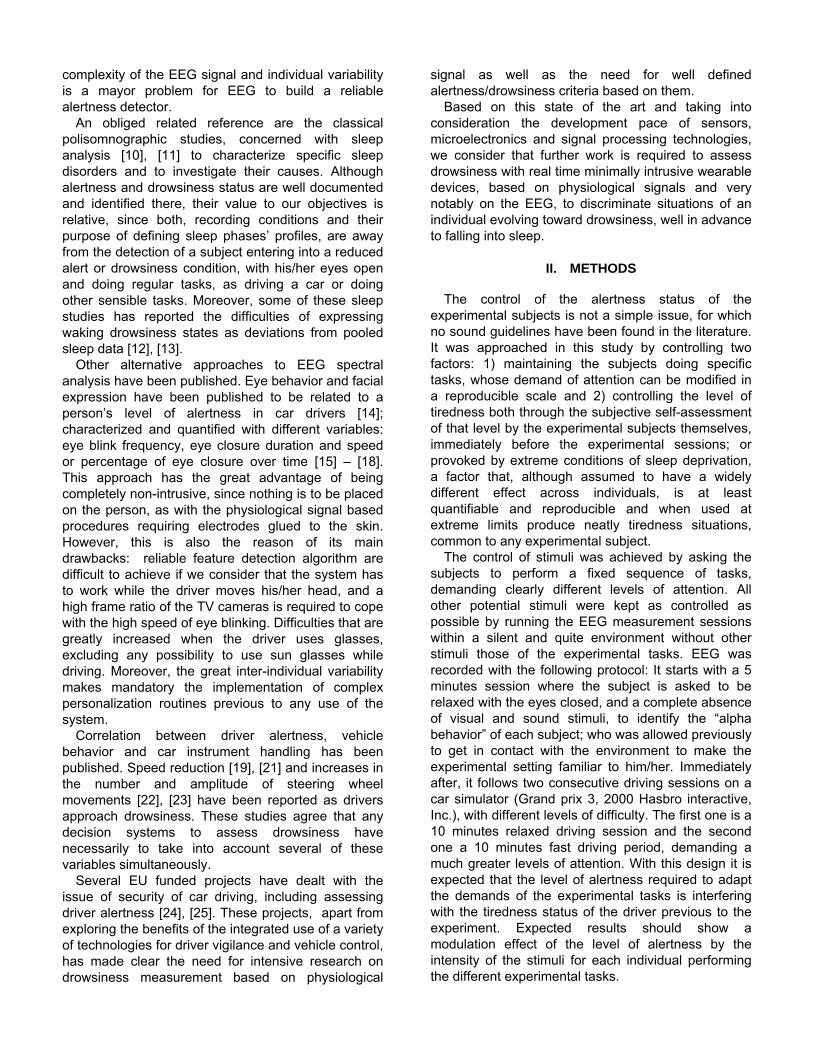
Figure 11 shows the complete transmission equipment. The information of the EEG can be obtained through radio frequency or RS232 cable. Figure 12 shows the adaptable support system for our dry electrodes, connected to the brain cortex through shielded wires.
Figure 13 shows a) the complete hardware system: electronic circuit and dry electrodes system and b) an user with the system. The necessary time for setting the dry electrodes system is only 4 seconds.
ACKNOWLEDGMENT Authors want to acknowledge the support of the
Fundación Francisco Corell, as well as the EU funded project “Sensation: Advanced Sensor Development for Attention, Stress, Vigilance & Sleep/Wakefulness Monitoring”, (ref.: IST-507231).
REFERENCES [1] K.L. Saroj and A. Craig, “A critical review of
psychophysiology of driver fatigue,” Biological Psychology 55, pp. 173 – 194, 2001.
[2] M. Matousek, “Automatic analysis in clinical electroencephalography,” Research Report, No. 9, Psychiatric Research Institute, Prague, 1967.
[3] P. Kallaway and R. Maulsby, “The normative electroencephalographic data reference library,” Final Report. NASA Contractor Report NAS9-1200, National Aeronautics and Space Administration, Washington, D.C., 1967.
[4] K. Idogawa, “A time variation of Professional Driver’s EEG in Monotonous Work,” IEEE Engineering in Medicine & Biology Society, 11th annual international conference, pp., 719-720, 1989.
[5] R. F. Kaplan, R. Heights and K. A. Laparo, ,"Alertness and drowsiness detection and tracking system,” US Pat. Number 5,813,993. Date of Pat. Sep. 29, 1998.
[6] T. P. Jung, S. Makeig and M. Stensmo, “Estimating alertness from the EEG power spectrum,” IEEE Transactions on Biomedical Engineering, vol. 45, pp. 60–69, 1997.
[7] D. J. Levendowsky, Z. R. Konstantinovic, R. Olmstead and C. Berka, “Method for the quantification of human alertness,” US Pat. Appl. Pub. 2004/0193068 A1. Pub. Date Dec. 5, 2002.
[8] K.L. Saroj and A. Craig, “Development of an algorithm for an EEG-based driver fatigue countermeasure,” Journal of Safety Research, 34, pp. 321 – 328, 2003.
[9] R. Bittner, K. Hána, L. Pousek and P. Vysoký, “Detecting of Fatigue States of a Car Driver,”

Lecture Notes in Computer Science, Publisher: Springer-Verlag Heidelberg, ISSN: 0302-9743, Volume 2199, pp. 62, January 2001
[10] H. Davis, P. Davis and A. Loomis, “Human brain potential during the onset of sleep,” J Neurophysiol.,vol.1, pp. 24-38, 1938.
[11] J. Santamaría, and K. Chiapa, “The EEG of drowsiness in normal adults,” J. Clin. Neurophysiol., vol.4, Nº 4, pp. 327-382, 1987.
[12] S. Makeig and M. Inlow, “Lapses in alert coherence of fluctuation in performance and EEG spectrum,” Electroencephalogr.Clin. Neurophysiol., vol. 86, pp. 23-35, 1993
[13] A. Vuckovie, and D. Popovie, “Artificial neural network for detecting drowsiness from EEG recordings,” IEEE Transactions on Biomedical Engineering, 155 –158, 2002.
[14] Q. Ji and X. Yang, “Real-Time Eye,Gaze,and Face Pose Tracking for Monitoring Driver Vigilance,” Real-Time Imaging, 8, pp. 357–377, 2002.
[15] R. Grace, V.E. Byrne, D.M Bierman, J.M. Legrand, D.Gricourt, B.K. Davis, J.J. Staszewski, and B.A.Carnahan, “Drowsy driver detection system for heavy vehicles,” in Proc. Digital Avionics Systems Conference, 17th DASC. The AIAA/IEEE/SAE, Volume: 2, 1998, pp.I36/1 - I36/8,.
[16] T. Hayami, K. Matsunag, K. Shidoji, and Y. Matsuki, “Detecting drowsiness while driving by measuring eye movement - a pilot study,” in Proc. Intelligent Transportation Systems, The IEEE 5th International Conference on, 2002, Pages:156 – 161.
[17] T. Ito, S. Mita, K. Kozuka, T. Nakano and S. Yamamoto, “Driver blink measurement by the motion picture processing and its application to drowsiness detection,” in Proc. Intelligent Transportation Systems, The IEEE 5th International Conference on , 2002, Pages:168 – 173.
[18] T. Hamada, T. Ito, K. Adachi, T. Nakano and S. Yamamoto, “Detecting method for drivers' drowsiness applicable to individual features,” in Proc. Intelligent Transportation Systems, IEEE, Vol. 2, Oct. 2003, pp.1405 – 1410.
[19] A.T. Ranney, L.A. Simmons and A. Masalonis, “Prolonged exposure to glare and driving time: effects on perfomance in a driving simulator,” Accident Analysis and Prevention, 31, 601-610,1999.
[20] F. Cnossen, T. Rothengatter and T. Meijman, “Strategic changes in task performance in simulated car driving as an adaptive response to
task demands,” Transportation Research Part F, 3,123-140, 2000
[21] J.T. Arnedt, G.J.S. Wilde, P.W. Munt and A.W. Maclean, “How do prolonged wakefulness and alcohol compare in the decrements they produce on a simulated driving task,” Accident Analysis and Prevention, 33,337-344, 2001
[22] B. Cointot, P. Siarry, E. Boisvert, Y. Mevel, S. Bowhis and J.P. Faidy, “Detection of driver‘s low vigilance periods on motonuay,” Proceeding of the 26th International Symposium on Automotive Technology and Automation, (Aachen, Germany), September 1993
[23] W.B. Verwey and D.M. Zaidel, ”Preventing drowsiness accidents by an alertness maintenance device,” Accident Analysis and Prevention, 31, 199-211, 1999
[24] AWAKE project (IST-2000-28062): System for effective assessment of driver vigilance and warning according to traffic risk estimation.
[25] SAVE project (TR1047): System for effective assessment of the driver state and vehicle control in emergency situations.
[26] D. De Waard and K.A. Brookhuis, “Assessing driver status: a demonstration experiment on the road,” Accid. Anal. Prevent. 23 (4), 297-307, 1991.
[27] K.A. Brookhuis and D. De Waard, “The use of psychophysiology to assess driver status,” Ergonomics 36 (9), 1099-1110, 1993.
Robin Álvarez Rueda was born in Cayambe, Ecuador, in 1969. Telecommunication Eng., degree from Universidad Politécnica Nacional, Quito - Ecuador, 1995. He received the M.Sc. degree in Telecommunications from Universidad de Cantabria, Santander - Spain, 2001. He received his Ph.D degree in Telecomunicactions at Universidad Politécnica de Madrid, Spain, January-2006. His interest lies in the alertness-drowsiness phenomena and transcranial magnetic stimulation. Francisco del Pozo Telecommunication Eng. (1969) and Ph.D. (1979) degrees from the Universidad Politécnica of Madrid, Spain. Research fellow at: Physics Department, Imperial College (London); Neurobiology Department, University of Yale; Department of Laboratory Medicine and Pathology, University of Minnesota; Biophysics and Physiology Department, University of New York. Full Professor (1986) at the Universidad Politécnica de Madrid.

Figure 1 Time evolution of the power spectrum of an individual with an alpha rhythm of around 10 Hz, visible in the top figure.
Middle and bottom figures correspond to the same person asked to perform tasks demanding a progressive degree of attention (monotonous driving, middle and very fast driving, bottom)

(a)
(b)
(c) (d) Figure 2. Mean EEG spectra for four individuals showing the widening effect due to the increase in the level of the stimuli (eye closed, monotonous driving and very fast driving). Different alpha frequencies can be observed: a) 7,5 Hz, b) 12.5 Hz, and c) 10 Hz. That contrast with (d) where the presence of any rhythm was not detected
Figure 3. Comparison of the mean value of the HFB/PAB variable with their 95% CI for the different recording sites, corresponding to the three recording session stimuli (c: eye closed, s: slow driving; h: rapid driving).

Figure 4. HFB/PAB mean value and 95% CI for a subject along 6 different days. Recording sessions were taken at random hours. Experimental conditions: c: relaxed with the eyes closed; s: slow driving; and h: fast driving
Mean value 99% CI
Tiredness status
HFB
/PA
B
1 2 31
1,05
1,1
1,15
1,2
1,25
1,3
Mean value 99% CI
Stimuli Intensity
HFB
/PAB
1 2 30,99
1,09
1,19
1,29
1,39
Figure 5. HFB/PAB mean value and 99% CI for all subjects with well defined alpha behavior as a function of (top) tiredness status (1: very tired, 2: tired; 3: normal/active), and (bottom) the level of the experimental stimuli (1: relaxed with the eyes closed; 2: slow driving; and 3: fast driving)

Figure 6. HFB/PAB mean value and 99% CI for all subjects with well defined alpha behavior for each value of the experimental factors: tiredness status and stimuli level, taking the other, stimuli level and tiredness status respectively, as parameter.

(a) (b)
(c) (d) Figure 7. Classification performance for different window sizes: a) 10 sec., b) 20 sec., c) 30 sec. and d) 40 sec. The top representation of each display is the output HFB/PAB variable along a regular experimental session (relax and closed eyes, slow and fast driving), vertical wider lines mark the switch between these three situations; below the statistical distribution of HFB/PAB, with its Gaussian best fit, to calculate the type I and II errors.
a) b)
c) d) Figure 8. Classification performance for different numbers of consecutive smoothed 10 sec. samples; a) no smoothing , b) 2 sample smoothed, c) 3 samples and

d) 4 samples. Recording conditions are as those of previous figure.
Figure 9. Scatter plots for (top) different window sizes (10 sec., 20 sec., 30 sec., and 40 sec); and (bottom) different number of consecutive samples averaged experimental conditions: c: relaxed with the eyes closed; s: slow driving; and h: fast driving

(a)
(b)
Figure 10. Dry electrodes based on high impedance interfaces (1012 Ω). UPM-GBT group is developing a new system based on this idea : a) Schematic diagram; b) dry electrodes: two possibilities: plane and with thin tubes for introducing in the hair .

Figure 11. The complete transmission equipment. The information of the EEG can be obtained through radio frequency or RS232 cable.
Figure 12. Adaptable support system for our dry electrodes.
(a)
(b)
Figure 13. a) The complete hardware system: electronic circuit and dry electrodes system; b) an user using the system. The necessary time for setting the dry electrodes system is only 4 seconds.

Sites on the scalp
C3 C4 Cz O1 O2 Mean dif. t value 8.44 13.2 20.07 23.8 24.27 p 0.0 0.0 0.0 0.00 0.0
ANOVA F value 71.12 173.84 402.92 565.89 589.35 p 0.0000 0.0000 0.0000 0.0000 0.0000 Table 1. HFB/PAB mean difference t-test (slow vs fast driving) and Anova (stimuli intensity factor) results, for the pre-selected EEG recording sites.
Exp.Cond All subject (with alpha rhythm) No alpha rhythm
Factor N Mean V. Std.Dev. Std.Err. N Mean V. Std.Dev. Std. Err. Very tired 1360 1,0402 0,4101 0,0111 442 2,15 0,708 0,0337
Tired 740 1,0378 0,4273 0,0157
Normal 2640 1,2500 0,2907 0,0057 156 2,27 0,7459 0,0597
Relax 1534 1,0119 0,2716 0,0069 206 1,94 0,5306 0,0370
Slow Drv. 1812 1,1329 0,3920 0,0092 198 1,82 0,3847 0,0273
Fast Drv. 1394 1,3468 0,3426 0,0092 194 2,80 0,7555 0,0542
N total 4740 598 Table 2: HFB/PAB mean value, sample size, standard deviation and mean value standard error (99%) for all subjects with well defined alpha behavior and those without defined alpha rhythm as a function of tiredness status (very tired, tired; and normal/active), and the level of the experimental stimuli (relaxed with the eyes closed; slow driving; and fast driving)
Multivariate All subjects (with alpha rhythm)
Analysis N Mean V. Std.Dev. Std.Err. Prev. Relax 422 0,8644 0,2335 0,0114 Status Slow Drv. 544 0,9878 0,4188 0,018
1 Fast Drv. 394 1,3007 0,4193 0,0211 Prev. Relax 218 0,9728 0,3202 ,0217 Status Slow Drv. 340 0,9972 0,4673 0,0253
2 Fast Drv. 182 1,1916 0,4259 0,0316 Prev. Relax 894 1,091 0,2431 0,0081 Status Slow Drv. 928 1,2677 0,2833 0,0093
3 Fast Drv. 818 1,4036 0,2563 0,009 Stimuli Relax 422 0,8644 0,2335 0,0114 level Slow Drv. 218 0,9728 0,3202 0,0217
1 Fast Drv. 894 1,091 0,2431 0,0081 Stimuli Relax 544 0,9878 0,4188 0,018 level Slow Drv. 340 0,9972 0,4673 0,0253
2 Fast Drv. 928 1,2677 0,2833 0,0093 Stimuli Relax 394 1,3007 0,4193 0,0211 level Slow Drv. 182 1,1916 0,4259 0,0316
3 Fast Drv. 818 1,4036 0,2573 0,009 N total 9480
Table 3: HFB/PAB mean value, sample size, standard deviation and mean value standard error (99%) for all subjects with well defined alpha behavior, as a function of tiredness status and stimuli level, taking the other, stimuli level and tiredness status respectively, as parameter.

Data window time span Number of (10 seg.) samples averaged
t= 10 sec t= 20 sec t= 20 sec t= 40 sec N = 1 N = 2 N = 3 N = 4
Average Eye Closed 0.536 0.501 0.468 0.459 0.563 0.551 0.541 0.522
Average Slow Drv. 1.106 1.089 1.084 1.081 1.093 1.083 1.093 1.098
Average Fast Drv. 1.653 1.63 1.624 1.624 1.622 1.622 1.609 1.607
Var. Eye Closed 0.078 0.044 0,01 0.009 0.05509 0.0296 0.02136 0.01922
Var. Slow Drv. 0.071 0,036 0.02 0.015 0.01455 0.00815 0.00405 0.0030
Var. Fast Drv. 0.121 0.056 0.04 0.026 0.02146 0.00899 0.00801 0.00619
t (Closed / Slow Drv) 13.6517 14.5999 15.938 16.63 21.19 28.79 37.65 42.582
p (Closed / Slow Drv) 0.0 0.0 0.0 0.0 0.0 0.0 0.0 0.0
t (Slow Drv /Fast Drv) 15.1666 15.139 15.6464 16.045 33.92 50.15 57.02 64.25
p(Slow Drv. / Fast Drv) 0.0 0.0 0.0 0.0 0.0 0.0 0.0 0.0 Table 4: Dependency of the standard errors to estimate HFB/PAB and the classification quality for both methods as a function of the different operational parameters considered.


![Driver Alertness Detection System [DADS.] executive presentation.](https://static.fdocuments.net/doc/165x107/547ac4c8b4af9f66518b45ce/driver-alertness-detection-system-dads-executive-presentation.jpg)