ASHFORD TRUST REPORTS THIRD QUARTER 2018 RESULTS … · ASHFORD TRUST REPORTS THIRD QUARTER 2018...
33
NEWS RELEASE Contact: Deric Eubanks Jordan Jennings Joe Calabrese Chief Financial Officer Investor Relations Financial Relations Board (972) 490-9600 (972) 778-9487 (212) 827-3772 ASHFORD TRUST REPORTS THIRD QUARTER 2018 RESULTS Actual RevPAR Increased 0.5% for All Hotels Not Under Renovation Completed Acquisition of La Posada de Santa Fe DALLAS, November 1, 2018 – Ashford Hospitality Trust, Inc. (NYSE: AHT) (“Ashford Trust” or the “Company”) today reported financial results and performance measures for the third quarter ended September 30, 2018. The comparable performance measurements for Occupancy, Average Daily Rate (ADR), Revenue Per Available Room (RevPAR), and Hotel EBITDA assume each of the hotel properties in the Company’s hotel portfolio as of September 30, 2018 were owned as of the beginning of each of the periods presented. Unless otherwise stated, all reported results compare the third quarter ended September 30, 2018 with the third quarter ended September 30, 2017 (see discussion below). The reconciliation of non-GAAP financial measures is included in the financial tables accompanying this press release. STRATEGIC OVERVIEW • Opportunistic focus on upper upscale, full-service hotels • Targets moderate leverage levels of approximately 55 - 60% to enhance equity returns • Highly-aligned management team and advisory structure • Attractive dividend yield of approximately 9.3% • Targets cash and cash equivalents at a level of 25 - 35% of total equity market capitalization for the purposes of: ▪ working capital needs at property and corporate levels ▪ providing a hedge in the event of uncertain economic times ▪ being prepared to pursue accretive investments or stock buybacks as those opportunities arise FINANCIAL AND OPERATING HIGHLIGHTS • Net loss attributable to common stockholders was $38.2 million or $0.40 per diluted share for the quarter • Actual RevPAR for all hotels increased 0.2% to $125.15 during the quarter • Actual RevPAR for all hotels not under renovation increased 0.5% to $125.48 during the quarter • Comparable RevPAR for all hotels decreased 0.6% to $125.15 during the quarter • Comparable RevPAR for all hotels not under renovation decreased 0.4% to $125.48 during the quarter • Adjusted EBITDAre was $101.7 million for the quarter • Adjusted funds from operations (AFFO) was $0.30 per diluted share for the quarter
Transcript of ASHFORD TRUST REPORTS THIRD QUARTER 2018 RESULTS … · ASHFORD TRUST REPORTS THIRD QUARTER 2018...

NEWS RELEASE
Contact: Deric Eubanks Jordan Jennings Joe Calabrese
Chief Financial Officer Investor Relations Financial Relations Board
(972) 490-9600 (972) 778-9487 (212) 827-3772
ASHFORD TRUST REPORTS THIRD QUARTER 2018 RESULTS Actual RevPAR Increased 0.5% for All Hotels Not Under Renovation
Completed Acquisition of La Posada de Santa Fe
DALLAS, November 1, 2018 – Ashford Hospitality Trust, Inc. (NYSE: AHT) (“Ashford Trust” or the
“Company”) today reported financial results and performance measures for the third quarter ended
September 30, 2018. The comparable performance measurements for Occupancy, Average Daily Rate
(ADR), Revenue Per Available Room (RevPAR), and Hotel EBITDA assume each of the hotel properties
in the Company’s hotel portfolio as of September 30, 2018 were owned as of the beginning of each of the
periods presented. Unless otherwise stated, all reported results compare the third quarter ended
September 30, 2018 with the third quarter ended September 30, 2017 (see discussion below). The
reconciliation of non-GAAP financial measures is included in the financial tables accompanying this
press release.
STRATEGIC OVERVIEW
• Opportunistic focus on upper upscale, full-service hotels
• Targets moderate leverage levels of approximately 55 - 60% to enhance equity returns
• Highly-aligned management team and advisory structure
• Attractive dividend yield of approximately 9.3%
• Targets cash and cash equivalents at a level of 25 - 35% of total equity market capitalization for
the purposes of:
▪ working capital needs at property and corporate levels
▪ providing a hedge in the event of uncertain economic times
▪ being prepared to pursue accretive investments or stock buybacks as those
opportunities arise
FINANCIAL AND OPERATING HIGHLIGHTS
• Net loss attributable to common stockholders was $38.2 million or $0.40 per diluted share for the
quarter
• Actual RevPAR for all hotels increased 0.2% to $125.15 during the quarter
• Actual RevPAR for all hotels not under renovation increased 0.5% to $125.48 during the quarter
• Comparable RevPAR for all hotels decreased 0.6% to $125.15 during the quarter
• Comparable RevPAR for all hotels not under renovation decreased 0.4% to $125.48 during the
quarter
• Adjusted EBITDAre was $101.7 million for the quarter
• Adjusted funds from operations (AFFO) was $0.30 per diluted share for the quarter

AHT Reports Third Quarter Results
Page 2
November 1, 2018
• As of November 1, 2018, the Company’s common stock is trading at an approximate 9.3%
dividend yield
• During the quarter, the Company entered into a new $100 million acquisition credit facility
• Subsequent to quarter end, the Company completed the acquisition of the 157-room La Posada de
Santa Fe for $50 million
• Capex invested during the quarter was $47.0 million
ENHANCED RETURN FUNDING PROGRAM
On June 26, 2018, the Company announced that it had entered into an Enhanced Return Funding Program
(“ERFP”) with Ashford Inc. (NYSE American: AINC). Subject to the terms of the two-year
programmatic agreement, Ashford Inc. has committed to effectively fund amounts equal to 10% of the
purchase price of Ashford Trust hotel acquisitions, up to an amount of $50 million in aggregate funding.
The Program has the potential to be upsized to $100 million based upon mutual agreement. The Program
is structured to significantly improve the 5-year internal rate of return for new hotel acquisitions at
Ashford Trust.
LA POSADA DE SANTA FE ACQUISITION
On October 31, 2018, the Company completed the acquisition of the 157-room La Posada de Santa Fe in
Santa Fe, New Mexico (“La Posada”) for $50 million. The purchase of La Posada is the Company’s
second hotel acquisition to benefit from the ERFP. Remington Lodging took over management of the
property upon closing of the acquisition. Remington Lodging, who also manages the Hilton Santa Fe
owned by Ashford Trust, and the Company expect to realize significant synergies from the joint
management of La Posada and the Hilton Santa Fe.
CAPITAL STRUCTURE
At September 30, 2018, the Company had total mortgage loans of $3.9 billion with a blended average
interest rate of 5.5%.
During the quarter, the Company repurchased a $56 million junior mezzanine loan on one of the loan
pools from its $1.07 billion refinancing that it completed during the second quarter 2018. The junior
mezzanine loan is priced at LIBOR + 9.00%.
During the quarter, under its “at the market” equity offering program, the Company issued an aggregate
of 2.4 million shares of common stock resulting in gross proceeds of approximately $15.5 million.
During the quarter, the Company entered into a new $100 million acquisition credit facility that provides
for a one-year revolving line of credit and bears interest at rate of LIBOR + 2.65%.
PORTFOLIO REVPAR
As of September 30, 2018, the portfolio consisted of 118 properties. During the third quarter of 2018,
106 of the Company’s hotels were not under renovation. The Company believes reporting its operating
metrics for its hotels on a comparable total basis (all 118 hotels) and comparable not under renovation
basis (106 hotels) is a measure that reflects a meaningful and focused comparison of the operating results
in its portfolio. Details of each category are provided in the tables attached to this release.
• Comparable RevPAR decreased 0.6% to $125.15 for all hotels on a 1.8% increase in ADR and a
2.3% decrease in occupancy
• Comparable RevPAR decreased 0.4% to $125.48 for hotels not under renovation on a 1.7%
increase in ADR and a 2.0% decrease in occupancy

AHT Reports Third Quarter Results
Page 3
November 1, 2018
HOTEL EBITDA MARGINS AND QUARTERLY SEASONALITY TRENDS
The Company believes year-over-year Comparable Hotel EBITDA and Comparable Hotel EBITDA
Margin comparisons are more meaningful to gauge the performance of the Company’s hotels than
sequential quarter-over-quarter comparisons. Given the seasonality in the Company’s portfolio and its
active capital recycling, to help investors better understand this seasonality, the Company provides
quarterly detail on its Comparable Hotel EBITDA and Comparable Hotel EBITDA Margin for the current
and certain prior-year periods based upon the number of hotels in the Company’s portfolio as of the end
of the current period. As the Company’s portfolio mix changes from time to time so will the seasonality
for Comparable Hotel EBITDA and Comparable Hotel EBITDA Margin. The details of the quarterly
calculations for the previous four quarters for the 118 hotels are provided in the table attached to this
release.
COMMON STOCK DIVIDEND
On September 14, 2018, the Company announced that its Board of Directors had declared a quarterly cash
dividend of $0.12 per diluted share for the Company's common stock for the third quarter ending
September 30, 2018, payable on October 15, 2018, to shareholders of record as of September 28, 2018.
“Over the last several months, we have, in a disciplined manner, diligently executed on two accretive
acquisitions that have benefitted from our recently-announced ERFP with Ashford Inc.,” commented
Douglas A. Kessler, Ashford Trust’s President and Chief Executive Officer. “Through the ERFP, we have
acquired both the Hilton Alexandria Old Town as well as the La Posada de Santa Fe and recently entered
into a definitive agreement to acquire the Hilton Scotts Valley. We remain very excited about the ERFP
program and, looking ahead, expect that this funding arrangement will be a competitive advantage when
identifying opportunities to accretively grow our platform and increase stockholder value.”
INVESTOR CONFERENCE CALL AND SIMULCAST
Ashford Hospitality Trust, Inc. will conduct a conference call on Friday November 2, 2018, at 1:00 p.m.
ET. The number to call for this interactive teleconference is (323) 794-2597. A replay of the conference
call will be available through Friday, November 9, 2018, by dialing (719) 457-0820 and entering the
confirmation number, 4159118.
The Company will also provide an online simulcast and rebroadcast of its third quarter 2018 earnings
release conference call. The live broadcast of Ashford Hospitality Trust’s quarterly conference call will
be available online at the Company's web site, www.ahtreit.com on Friday, November 2, 2018, beginning
at 1:00 p.m. ET. The online replay will follow shortly after the call and continue for approximately one year.
We use certain non-GAAP measures, in addition to the required GAAP presentations, as we believe these
measures improve the understanding of our operational results and make comparisons of operating results
among peer real estate investment trusts more meaningful. The non-GAAP financial measures, which
should not be relied upon as a substitute for GAAP measures, used in this press release are FFO, AFFO,
EBITDA, EBITDAre, Adjusted EBITDAre, and Hotel EBITDA. Please refer to our most recently filed
Annual Report on Form 10-K for a more detailed description of how these non-GAAP measures are
calculated. The reconciliation of non-GAAP measures to the closing GAAP measures are provided
below and provide further details of our results for the period being reported.
* * * * *
Ashford Hospitality Trust is a real estate investment trust (REIT) focused on investing opportunistically

AHT Reports Third Quarter Results
Page 4
November 1, 2018
in the hospitality industry in upper upscale, full-service hotels.
Ashford has created an Ashford App for the hospitality REIT investor community. The Ashford App is
available for free download at Apple’s App Store and the Google Play Store by searching “Ashford.”
Certain statements and assumptions in this press release contain or are based upon "forward-looking" information and are
being made pursuant to the safe harbor provisions of the federal securities regulations. Forward looking statements in this
press release may include, among others, statements about the Company’s strategy and future plans. When we use the words
"will likely result," "may," "anticipate," "estimate," "should," "expect," "believe," "intend," or similar expressions, we intend to
identify forward-looking statements. Such statements are subject to numerous assumptions and uncertainties, many of which are
outside Ashford Trust’s control.
These forward-looking statements are subject to known and unknown risks and uncertainties, which could cause actual results to
differ materially from those anticipated, including, without limitation: general conditions of the capital markets and the market
price of our common stock; changes in our business or investment strategy; availability, terms and deployment of capital;
availability of qualified personnel; changes in our industry and the market in which we operate, interest rates or the general
economy; our ability to successfully complete and integrate acquisitions, and manage our planned growth, and the degree and
nature of our competition. These and other risk factors are more fully discussed in Ashford Trust’s filings with the Securities
and Exchange Commission.
The forward-looking statements included in this press release are only made as of the date of this press release. The Company
can give no assurance that these forward-looking statements will be attained or that any deviation will not occur. We are not
obligated to publicly update or revise any forward-looking statements, whether as a result of new information, future events or
circumstances, changes in expectations or otherwise.

5
ASHFORD HOSPITALITY TRUST, INC. AND SUBSIDIARIESCONSOLIDATED BALANCE SHEETS
(in thousands, except share amounts)(unaudited)
September 30,2018
December 31,2017
ASSETSInvestments in hotel properties, net $ 4,089,985 $ 4,035,915Cash and cash equivalents 325,839 354,805Restricted cash 141,092 116,787Marketable securities 24,173 26,926Accounts receivable, net of allowance of $608 and $770, respectively 60,208 44,257Inventories 4,223 4,244Investment in Ashford Inc. 1,763 437Investment in OpenKey 2,751 2,518Deferred costs, net 3,427 2,777Prepaid expenses 29,662 19,269Derivative assets 2,969 2,010Other assets 18,117 14,152Intangible asset, net 9,854 9,943Due from third-party hotel managers 19,277 17,387Assets held for sale — 18,423
Total assets $ 4,733,340 $ 4,669,850
LIABILITIES AND EQUITYLiabilities:
Indebtedness, net $ 3,894,447 $ 3,696,300Accounts payable and accrued expenses 147,808 132,401Dividends and distributions payable 28,095 25,045Due to Ashford Inc., net 5,176 15,146Due to related party, net 1,078 1,067Due to third-party hotel managers 2,745 2,431Intangible liabilities, net 15,572 15,839Derivative liabilities, net 205 —Other liabilities 19,613 18,376Liabilities associated with assets held for sale — 13,977
Total liabilities 4,114,739 3,920,582
Redeemable noncontrolling interests in operating partnership 118,663 116,122Equity:
Preferred stock, $0.01 par value, 50,000,000 shares authorized :Series D Cumulative Preferred Stock 2,389,393 shares issued and outstanding at September 30, 2018 and December 31,
2017 24 24Series F Cumulative Preferred Stock 4,800,000 shares issued and outstanding at September 30, 2018 and December 31,
2017 48 48Series G Cumulative Preferred Stock 6,200,000 shares issued and outstanding at September 30, 2018 and December 31,
2017 62 62Series H Cumulative Preferred Stock 3,800,000 shares issued and outstanding at September 30, 2018 and December 31,
2017 38 38Series I Cumulative Preferred Stock 5,400,000 shares issued and outstanding at September 30, 2018 and December 31,
2017 54 54Common stock, $0.01 par value, 400,000,000 shares authorized, 101,038,430 and 97,409,113 shares issued and outstanding at
September 30, 2018 and December 31, 2017, respectively 1,010 974Additional paid-in capital 1,811,391 1,784,997Accumulated deficit (1,313,327) (1,153,697)
Total shareholders' equity of the Company 499,300 632,500Noncontrolling interests in consolidated entities 638 646Total equity 499,938 633,146
Total liabilities and equity $ 4,733,340 $ 4,669,850

6
ASHFORD HOSPITALITY TRUST, INC. AND SUBSIDIARIESCONSOLIDATED STATEMENTS OF OPERATIONS
(in thousands, except per share amounts)(unaudited)
Three Months Ended Nine Months EndedSeptember 30, September 30,
2018 2017 2018 2017REVENUE
Rooms $ 288,016 $ 289,017 $ 868,090 $ 876,927Food and beverage 49,396 48,313 164,869 175,005Other 17,309 15,006 51,358 43,720
Total hotel revenue 354,721 352,336 1,084,317 1,095,652Other 1,209 989 2,984 2,052
Total revenue 355,930 353,325 1,087,301 1,097,704EXPENSES
Hotel operating expensesRooms 64,197 63,950 187,497 188,857Food and beverage 37,649 37,173 116,270 121,619Other expenses 109,992 112,421 332,629 337,978Management fees 13,198 13,027 40,306 40,100
Total hotel operating expenses 225,036 226,571 676,702 688,554Property taxes, insurance and other 20,774 18,194 59,363 55,293Depreciation and amortization 64,923 60,135 192,536 185,380Impairment charges (27) 1,785 1,652 1,785Transaction costs — — 11 11Advisory services fee:
Base advisory fee 9,156 8,579 26,644 25,934Reimbursable expenses 2,251 1,641 5,777 5,800Non-cash stock/unit-based compensation 4,855 4,392 20,540 7,748Incentive fee (3,457) — — —
Corporate, general and administrative:Non-cash stock/unit-based compensation — — 536 565Other general and administrative 3,090 2,412 7,914 10,271
Total operating expenses 326,601 323,709 991,675 981,341OPERATING INCOME (LOSS) 29,329 29,616 95,626 116,363
Equity in earnings (loss) of unconsolidated entities 310 (679) 892 (3,580)Interest income 1,150 706 2,779 1,460Gain (loss) on sale of hotel properties (9) 15 394 14,024Other income (expense), net (202) (273) 80 (3,539)Interest expense, net of premium amortization (54,057) (54,413) (159,063) (156,303)Amortization of loan costs (6,674) (2,550) (14,617) (10,921)Write-off of premiums, loan costs and exit fees (1,572) — (9,316) (1,629)Unrealized gain (loss) on marketable securities 68 (936) (758) (4,813)Unrealized gain (loss) on derivatives (2,085) (1,479) (3,672) (1,804)
INCOME (LOSS) BEFORE INCOME TAXES (33,742) (29,993) (87,655) (50,742)Income tax benefit (expense) (519) 1,267 (2,606) 507
NET INCOME (LOSS) (34,261) (28,726) (90,261) (50,235)(Income) loss from consolidated entities attributable to noncontrolling interest (10) (22) 8 (4)Net (income) loss attributable to redeemable noncontrolling interests in operating partnership 6,682 6,940 18,087 13,202NET INCOME (LOSS) ATTRIBUTABLE TO THE COMPANY (27,589) (21,808) (72,166) (37,037)Preferred dividends (10,645) (11,440) (31,933) (33,352)Extinguishment of issuance costs uon redemption of prefered stock — (4,507) — (4,507)NET INCOME (LOSS) ATTRIBUTABLE TO COMMON STOCKHOLDERS $ (38,234) $ (37,755) $ (104,099) $ (74,896)
INCOME (LOSS) PER SHARE – BASIC AND DILUTEDBasic:
Net income (loss) attributable to common stockholders $ (0.40) $ (0.40) $ (1.09) $ (0.80)Weighted average common shares outstanding – basic 97,467 95,332 96,591 95,169
Diluted:Net income (loss) attributable to common stockholders $ (0.40) $ (0.40) $ (1.09) $ (0.80)Weighted average common shares outstanding – diluted 97,467 95,332 96,591 95,169
Dividends declared per common share: $ 0.12 $ 0.12 $ 0.36 $ 0.36

7
ASHFORD HOSPITALITY TRUST, INC. AND SUBSIDIARIESRECONCILIATION OF NET INCOME (LOSS) TO EBITDA, EBITDAre AND ADJUSTED EBITDAre
(in thousands)(unaudited)
Three Months Ended Nine Months EndedSeptember 30, September 30,
2018 2017 2018 2017Net income (loss) $ (34,261) $ (28,726) $ (90,261) $ (50,235)
Interest expense and amortization of premiums and loan costs, net 60,731 56,963 173,680 167,224Depreciation and amortization 64,923 60,135 192,536 185,380Income tax expense (benefit) 519 (1,267) 2,606 (507)Equity in (earnings) loss of unconsolidated entities (310) 679 (892) 3,632Company's portion of EBITDA of Ashford Inc. (1,607) (384) 959 (20)Company's portion of EBITDA of OpenKey (158) (113) (419) (361)
EBITDA 89,837 87,287 278,209 305,113Impairment charges on real estate (27) 1,785 1,652 1,785(Gain) loss on sale of hotel properties 9 (15) (394) (14,024)
EBITDAre 89,819 89,057 279,467 292,874Amortization of unfavorable contract liabilities (39) (363) (117) (1,151)Uninsured hurricane related costs (43) 3,711 (271) 3,711Write-off of premiums, loan costs and exit fees 1,572 — 9,316 1,629Other (income) expense, net 10 273 (80) 3,539Transaction, acquisition and management conversion costs 391 202 596 3,770Legal judgment and related legal costs 1 27 928 4,091Unrealized (gain) loss on marketable securities (68) 936 758 4,813Unrealized (gain) loss on derivatives 2,085 1,479 3,672 1,804Dead deal costs 52 5 55 9Software implementation costs — — — 1,034Non-cash stock/unit-based compensation 5,143 4,613 21,946 8,751Company's portion of (gain) loss of investment in securities investment fund — — — (52)Company's portion of adjustments to EBITDA of Ashford Inc. 2,814 1,703 4,997 3,752Company's portion of adjustments to EBITDA of OpenKey 4 2 12 4
Adjusted EBITDAre $ 101,741 $ 101,645 $ 321,279 $ 328,578
ASHFORD HOSPITALITY TRUST, INC. AND SUBSIDIARIESRECONCILIATION OF NET INCOME (LOSS) TO FUNDS FROM OPERATIONS ("FFO") AND ADJUSTED FFO
(in thousands, except per share amounts)(unaudited)
Three Months Ended Nine Months EndedSeptember 30, September 30,
2018 2017 2018 2017Net income (loss) $ (34,261) $ (28,726) $ (90,261) $ (50,235)
(Income) loss from consolidated entities attributable to noncontrolling interest (10) (22) 8 (4)Net (income) loss attributable to redeemable noncontrolling interests in operating partnership 6,682 6,940 18,087 13,202Preferred dividends (10,645) (11,440) (31,933) (33,352)Extinguishment of issuance costs upon redemption of preferred stock — (4,507) — (4,507)
Net income (loss) attributable to common stockholders (38,234) (37,755) (104,099) (74,896)Depreciation and amortization on real estate 64,865 60,075 192,363 185,197Gain (loss) on sale of hotel properties 9 (15) (394) (14,024)Net income (loss) attributable to redeemable noncontrolling interests in operating partnership (6,682) (6,940) (18,087) (13,202)Equity in (earnings) loss of unconsolidated entities (310) 679 (892) 3,632Impairment charges on real estate (27) 1,785 1,652 1,785Company's portion of FFO of Ashford Inc. 470 (570) 1,391 (3,265)Company's portion of FFO of unconsolidated entities (160) (116) (426) (366)
FFO available to common stockholders and OP unitholders 19,931 17,143 71,508 84,861Extinguishment of issuance costs upon redemption of preferred stock — 4,507 — 4,507Write-off of premiums, loan costs and exit fees 1,572 — 9,316 1,629Uninsured hurricane related costs (43) 3,711 (271) 3,711Other (income) expense, net 10 273 (80) 3,539Transaction, acquisition and management conversion costs 391 202 596 3,770Legal judgment and related legal costs 1 27 928 4,091Unrealized (gain) loss on marketable securities (68) 936 758 4,813Unrealized (gain) loss on derivatives 2,085 1,479 3,672 1,804Dead deal costs 52 5 55 9Software implementation costs — — — 1,034Non-cash stock/unit-based compensation 5,143 4,613 21,946 8,751Amortization of loan costs 6,673 2,549 14,612 10,917Company's portion of (gain) loss of investment in securities investment fund — — — (52)Company's portion of adjustments to FFO of Ashford Inc. (1,453) 1,580 730 6,130Company's portion of adjustments to FFO of OpenKey 4 2 12 4
Adjusted FFO available to common stockholders and OP unitholders $ 34,298 $ 37,027 $ 123,782 $ 139,518
Adjusted FFO per diluted share available to common stockholders and OP unitholders $ 0.30 $ 0.33 $ 1.08 $ 1.23
Weighted average diluted shares 115,318 113,777 115,016 113,203

8
ASHFORD HOSPITALITY TRUST, INC. AND SUBSIDIARIESSUMMARY OF INDEBTEDNESS
SEPTEMBER 30, 2018 (dollars in thousands)
(unaudited)
Indebtedness Maturity Interest Rate
Fixed-RateDebt
Floating-RateDebt
TotalDebt
Comparable TTMHotel
EBITDA (7)
Comparable TTM
EBITDADebt Yield
BAML Le Pavillon - 1 hotel June 2019 LIBOR + 5.10% $ — $ 43,750 (1) $ 43,750 $ 2,433 5.6%
Omni American Bank Ashton - 1 hotel July 2019 4.00% 5,267 — 5,267 1,131 21.5%
Morgan Stanley Ann Arbor - 1 hotel July 2019 LIBOR + 4.15% — 35,200 (2) 35,200 3,731 10.6%
Morgan Stanley - 8 hotels July 2019 LIBOR + 4.09% — 144,000 (2) 144,000 11,785 8.2%
NorthStar HGI Wisconsin Dells - 1 hotel August 2019 LIBOR + 4.95% — 7,778 (3) 7,778 958 12.3%Secured credit facility - various September 2019 Base Rate(4) + 1.65% or
LIBOR + 2.65% — — — N/A N/A
Morgan Stanley Pool - 17 hotels November 2019 LIBOR + 3.00% — 427,000 (5) 427,000 50,602 11.9%
JPMorgan Chase - 8 hotels February 2020 LIBOR + 2.92% — 395,000 (5) 395,000 45,379 11.5%
BAML Highland Pool - 21 hotels April 2020 LIBOR + 3.20% — 962,575 (5) 962,575 105,399 10.9%
BAML Indigo Atlanta - 1 hotel May 2020 LIBOR + 2.90% — 16,100 (6) 16,100 2,329 14.5%
KEYS Pool A - 7 hotels June 2020 LIBOR + 3.65% — 180,720 (5) 180,720 21,368 11.8%
KEYS Pool B - 7 hotels June 2020 LIBOR + 3.39% — 174,400 (5) 174,400 21,437 12.3%
KEYS Pool C - 5 hotels June 2020 LIBOR + 3.73% — 221,040 (5) 221,040 25,053 11.3%
KEYS Pool D - 5 hotels June 2020 LIBOR + 4.02% — 262,640 (5) 262,640 28,380 10.8%
KEYS Pool E - 5 hotels June 2020 LIBOR + 2.73% — 160,000 (5) 160,000 24,234 15.1%
KEYS Pool F - 5 hotels June 2020 LIBOR + 3.68% — 215,120 (5) 215,120 24,481 11.4%
GACC Gateway - 1 hotel November 2020 6.26% 93,891 — 93,891 14,194 15.1%
Aareal Princeton/Nashville - 2 hotels June 2022 LIBOR + 3.00% — 174,211 174,211 27,430 15.7%
Prudential Boston Back Bay - 1 hotel November 2022 LIBOR + 2.00% — 97,000 97,000 13,748 14.2%
Deutsche Bank W Minneapolis - 1 hotel May 2023 5.46% 53,086 — 53,086 6,207 11.7%
Aareal Hilton Alexandria - 1 hotel June 2023 LIBOR + 2.45% — 73,450 73,450 8,862 12.1%
GACC Manchester RI - 1 hotel January 2024 5.49% 6,913 — 6,913 1,349 19.5%
GACC Jacksonville RI - 1 hotel January 2024 5.49% 10,089 — 10,089 317 3.1%
Key Bank Manchester CY - 1 hotel May 2024 4.99% 6,444 — 6,444 938 14.6%
Morgan Stanley Pool C1 - 3 hotels August 2024 5.20% 65,572 — 65,572 8,686 13.2%
Morgan Stanley Pool C2 - 2 hotels August 2024 4.85% 12,114 — 12,114 1,832 15.1%
Morgan Stanley Pool C3 - 3 hotels August 2024 4.90% 24,215 — 24,215 3,623 15.0%
BAML Pool 5 - 2 hotels February 2025 4.45% 19,962 — 19,962 2,584 12.9%BAML Pool 3 - 3 hotels February 2025 4.45% 51,633 — 51,633 6,887 13.3%Unencumbered hotels — — — 2,267 N/A
Total $ 349,186 $ 3,589,984 $ 3,939,170 $ 467,624 11.9%
Percentage 8.9% 91.1% 100.0%
Weighted average interest rate 5.33% 5.55% 5.53%
All indebtedness is non-recourse with the exception of the secured credit facility.(1) This mortgage loan has three one-year extension options, subject to satisfaction of certain conditions. The second one-year extension period began in June 2018.(2) This mortgage loan has three one-year extension options, subject to satisfaction of certain conditions. The second one-year extension period began in July 2018.(3) This mortgage loan has two one-year extension options, subject to satisfaction of certain conditions. The first one-year extension period began in August 2018.(4) Base Rate, as defined in the secured credit facility agreement, is the greater of (i) the prime rate set by Bank of America, or (ii) federal funds rate + 0.5%, or (iii) LIBOR
+ 1.0%.(5) This mortgage loan has five one-year extension options, subject to satisfaction of certain conditions.(6) This mortgage loan has two one-year extension options, subject to satisfaction of certain conditions.(7) See Exhibit 1 for reconciliation of net income (loss) to hotel EBITDA.

9
ASHFORD HOSPITALITY TRUST, INC. AND SUBSIDIARIESINDEBTEDNESS BY MATURITY ASSUMING EXTENSION OPTIONS ARE EXERCISED
SEPTEMBER 30, 2018(dollars in thousands)
(unaudited)
2018 2019 2020 2021 2022 Thereafter Total
Secured credit facility - various $ — $ — $ — $ — $ — $ — $ —
Omni American Bank Ashton - 1 hotel — 5,168 — — — — 5,168
BAML Le Pavillon - 1 hotel — — 43,750 — — — 43,750
Morgan Stanley - 8 hotels — — 144,000 — — — 144,000
Morgan Stanley Ann Arbor - 1 hotel — — 35,200 — — — 35,200
NorthStar HGI Wisconsin Dells - 1 hotel — — 7,778 — — — 7,778
GACC Gateway - 1 hotel — — 89,886 — — — 89,886
BAML Indigo Atlanta - 1 hotel — — — — 15,470 — 15,470
Aareal Princeton/Nashville - 2 hotels — — — — 168,211 — 168,211
Prudential Boston Back Bay - 1 hotel — — — — 97,000 — 97,000
Deutsche Bank W Minneapolis - 1 hotel — — — — — 48,182 48,182
Aareal Hilton Alexandria - 1 hotel — — — — — 73,450 73,450
GACC Jacksonville RI - 1 hotel — — — — — 9,036 9,036
GACC Manchester RI - 1 hotel — — — — — 6,191 6,191
Key Bank Manchester CY - 1 hotel — — — — — 5,671 5,671
Morgan Stanley Pool C1 - 3 hotels — — — — — 58,612 58,612
Morgan Stanley Pool C2 - 2 hotels — — — — — 10,755 10,755
Morgan Stanley Pool C3 - 3 hotels — — — — — 21,522 21,522
Morgan Stanley Pool - 17 hotels — — — — — 427,000 427,000
JPMorgan Chase - 8 hotels — — — — — 395,000 395,000
BAML Pool 3 - 3 hotels — — — — — 44,413 44,413
BAML Pool 5 - 2 hotels — — — — — 17,073 17,073
BAML Highland Pool - 21 hotels — — — — — 962,575 962,575
KEYS Pool A - 7 hotels — — — — — 180,720 180,720
KEYS Pool B - 7 hotels — — — — — 174,400 174,400
KEYS Pool C - 5 hotels — — — — — 221,040 221,040
KEYS Pool D - 5 hotels — — — — — 262,640 262,640
KEYS Pool E - 5 hotels — — — — — 160,000 160,000
KEYS Pool F - 5 hotels — — — — — 215,120 215,120
Principal due in future periods — 5,168 320,614 — 280,681 3,293,400 3,899,863
Scheduled amortization payments remaining 1,604 6,554 8,035 8,170 6,805 8,139 39,307
Total indebtedness $ 1,604 $ 11,722 $ 328,649 $ 8,170 $ 287,486 $ 3,301,539 $ 3,939,170

10
ASHFORD HOSPITALITY TRUST, INC. AND SUBSIDIARIESKEY PERFORMANCE INDICATORS
(unaudited)
ALL HOTELS:Three Months Ended September 30,
Actual
Non-comparableAdjustments Comparable Actual
Non-comparableAdjustments Comparable Actual Comparable
2018 2018 2018 2017 2017 2017 % Variance % VarianceRooms revenue (in thousands) $ 287,104 $ — $ 287,104 $ 287,955 $ 705 $ 288,660 (0.30)% (0.54)%RevPAR $ 125.15 $ — $ 125.15 $ 124.92 $ 59.35 $ 125.88 0.18 % (0.58)%Occupancy 78.04% —% 78.04% 79.68% (41.25)% 79.88% (2.06)% (2.30)%ADR $ 160.36 $ — $ 160.36 $ 156.77 $ 143.87 $ 157.58 2.29 % 1.77 %
ALL HOTELS:Nine Months Ended September 30,
Actual
Non-comparable Adjustments Comparable Actual
Non-comparable Adjustments Comparable Actual Comparable
2018 2018 2018 2017 2017 2017 % Variance % VarianceRooms revenue (in thousands) $ 864,604 $ 4,258 $ 868,862 $ 872,993 $ (6,519) $ 866,474 (0.96)% 0.28 %RevPAR $ 127.19 $ 546.51 $ 127.67 $ 125.61 $ (44.87) $ 127.33 1.26 % 0.26 %Occupancy 77.59% 165.83% 77.69% 78.57% (62.74)% 78.91% (1.25)% (1.54)%ADR $ 163.92 $ 329.56 $ 164.32 $ 159.87 $ (71.51) $ 161.37 2.53 % 1.83 %
NOTES: (1) The above comparable information assumes the 118 hotel properties owned and included in the Company's operations at September 30, 2018, were owned as of the
beginning of each of the periods presented. Non-comparable adjustments include pre-acquisition results from hotel properties acquired during the period offset by results from hotel properties sold during the period.
(2) The above information does not reflect the operations of Orlando WorldQuest Resort.
ALL HOTELS NOT UNDER RENOVATION: Three Months Ended September 30,
Actual
Non-comparable Adjustments Comparable Actual
Non-comparable Adjustments Comparable Actual Comparable
2018 2018 2018 2017 2017 2017 % Variance % VarianceRooms revenue (in thousands) $ 243,027 $ — $ 243,027 $ 243,159 $ 705 $ 243,864 (0.05)% (0.34)%RevPAR $ 125.48 $ — $ 125.48 $ 124.83 $ 59.35 $ 125.95 0.53 % (0.37)%Occupancy 78.95% —% 78.95% 80.36% (41.25)% 80.60% (1.75)% (2.04)%ADR $ 158.94 $ — $ 158.94 $ 155.34 $ 143.87 $ 156.28 2.32 % 1.70 %
ALL HOTELS NOT UNDER RENOVATION: Nine Months Ended September 30,
Actual
Non-comparable Adjustments Comparable Actual
Non-comparable Adjustments Comparable Actual Comparable
2018 2018 2018 2017 2017 2017 % Variance % VarianceRooms revenue (in thousands) $ 718,187 $ 4,258 $ 722,445 $ 722,943 $ (6,519) $ 716,424 (0.66)% 0.84 %RevPAR $ 125.17 $ 546.51 $ 125.74 $ 122.73 $ (44.87) $ 124.70 1.99 % 0.84 %Occupancy 78.14% 165.83% 78.25% 78.49% (62.74)% 78.88% (0.45)% (0.80)%ADR $ 160.20 $ 329.56 $ 160.68 $ 156.37 $ (71.51) $ 158.08 2.45 % 1.65 %
NOTES: (1) The above comparable information assumes the 106 hotel properties owned and included in the Company's operations at September 30, 2018, and not under renovation
during the three months ended September 30, 2018, were owned as of the beginning of the periods presented. Non-comparable adjustments include pre-acquisition results from hotel properties acquired during the period offset by results from hotel properties sold during the period.
(2) The above information does not reflect the operations of Orlando WorldQuest Resort.(3) Excluded Hotels Under Renovation:
Hampton Inn Suites Phoenix Airport, Hilton St. Petersburg Bayfront, Hilton Tampa Westshore, Hotel Indigo Atlanta Midtown, Hyatt Regency Coral Gables, Le Pavillon Hotel, Marriott Crystal Gateway, Marriott Omaha, Renaissance Nashville, Residence Inn Jacksonville, Residence Inn Orlando Sea World, Ritz-Carlton Atlanta

11
ASHFORD HOSPITALITY TRUST, INC. AND SUBSIDIARIESHOTEL EBITDA
(dollars in thousands)(unaudited)
ALL HOTELS: Three Months Ended Nine Months EndedSeptember 30, September 30,
2018 2017 % Variance 2018 2017 % VarianceTotal hotel revenue $ 353,504 $ 350,958 0.73 % $ 1,079,802 $ 1,090,603 (0.99)%Non-comparable adjustments — 2,036 7,054 (5,871)Comparable total hotel revenue $ 353,504 $ 352,994 0.14 % $ 1,086,856 $ 1,084,732 0.20 %
Hotel EBITDA $ 111,389 $ 113,302 (1.69)% $ 356,795 $ 365,253 (2.32)%Non-comparable adjustments (60) 1,904 3,705 2,762Comparable hotel EBITDA $ 111,329 $ 115,206 (3.37)% $ 360,500 $ 368,015 (2.04)%
Hotel EBITDA margin 31.51% 32.28% (0.77)% 33.04% 33.49% (0.45)%Comparable hotel EBITDA margin 31.49% 32.64% (1.15)% 33.17% 33.93% (0.76)%
Hotel EBITDA adjustments attributable to consolidated noncontrolling interests $ 101 $ 116 (12.93)% $ 258 $ 283 (8.83)%Hotel EBITDA attributable to the Company and OP unitholders $ 111,288 $ 113,186 (1.68)% $ 356,537 $ 364,970 (2.31)%Comparable hotel EBITDA attributable to the Company and OP unitholders $ 111,228 $ 115,090 (3.36)% $ 360,242 $ 367,732 (2.04)%
NOTES:(1) The above comparable information assumes the 118 hotel properties owned and included in the Company's operations at September 30, 2018, were owned as of the
beginning of each of the periods presented. Non-comparable adjustments include pre-acquisition results from hotel properties acquired during the period offset by results from hotel properties sold during the period.
(2) The above information does not reflect the operations of Orlando WorldQuest Resort.(3) See Exhibit 1 for reconciliation of net income (loss) to hotel EBITDA.
ALL HOTELS NOT UNDER RENOVATION:
Three Months Ended Nine Months EndedSeptember 30, September 30,
2018 2017 % Variance 2018 2017 % VarianceTotal hotel revenue $ 294,015 $ 291,136 0.99 % $ 880,708 $ 883,074 (0.27)%Non-comparable adjustments — 2,036 7,054 (5,869)Comparable total hotel revenue $ 294,015 $ 293,172 0.29 % $ 887,762 $ 877,205 1.20 %
Hotel EBITDA $ 96,749 $ 97,401 (0.67)% $ 299,170 $ 300,994 (0.61)%Non-comparable adjustments (60) 1,872 3,705 2,667Comparable hotel EBITDA $ 96,689 $ 99,273 (2.60)% $ 302,875 $ 303,661 (0.26)%
Hotel EBITDA margin 32.91% 33.46% (0.55)% 33.97% 34.08% (0.11)%Comparable hotel EBITDA margin 32.89% 33.86% (0.97)% 34.12% 34.62% (0.50)%
Hotel EBITDA adjustments attributable to consolidated noncontrolling interests $ 101 $ 116 (12.93)% $ 258 $ 283 (8.83)%Hotel EBITDA attributable to the Company and OP unitholders $ 96,648 $ 97,285 (0.65)% $ 298,912 $ 300,711 (0.60)%Comparable hotel EBITDA attributable to the Company and OP unitholders $ 96,588 $ 99,157 (2.59)% $ 302,617 $ 303,378 (0.25)%
NOTES:(1) The above comparable information assumes the 106 hotel properties owned and included in the Company's operations at September 30, 2018, and not under renovation
during the three months ended September 30, 2018, were owned as of the beginning of the periods presented. Non-comparable adjustments include pre-acquisition results from hotel properties acquired during the period offset by results from hotel properties sold during the period.
(2) The above information does not reflect the operations of Orlando WorldQuest Resort.(3) See Exhibit 1 for reconciliation of net income (loss) to hotel EBITDA.(4) Excluded Hotels Under Renovation:
Hampton Inn Suites Phoenix Airport, Hilton St. Petersburg Bayfront, Hilton Tampa Westshore, Hotel Indigo Atlanta Midtown, Hyatt Regency Coral Gables, Le Pavillon Hotel, Marriott Crystal Gateway, Marriott Omaha, Renaissance Nashville, Residence Inn Jacksonville, Residence Inn Orlando Sea World, Ritz-Carlton Atlanta

12
ASHFORD HOSPITALITY TRUST, INC. AND SUBSIDIARIESHOTEL REVENUE & EBITDA FOR TRAILING TWELVE MONTHS
(dollars in thousands)(unaudited)
Actual
Non-comparable Adjustments Comparable Actual
Non-comparable Adjustments Comparable Actual
Non-comparable Adjustments Comparable Actual
Non-comparable Adjustments Comparable
2018 2018 2018 2018 2018 2018 2018 2018 2018 2017 2017 20173rd Quarter 3rd Quarter 3rd Quarter 2nd Quarter 2nd Quarter 2nd Quarter 1st Quarter 1st Quarter 1st Quarter 4th Quarter 4th Quarter 4th Quarter
Total hotel revenue $ 353,504 $ — $ 353,504 $ 386,834 $ 5,301 $ 392,135 $ 339,465 $ 1,752 $ 341,217 $ 339,160 $ 2,271 $ 341,431Hotel EBITDA $ 111,389 $ (60) $ 111,329 $ 136,792 $ 2,795 $ 139,587 $ 108,614 $ 970 $ 109,584 $ 106,630 $ 494 $ 107,124Hotel EBITDA margin 31.51% 31.49% 35.36% 35.60% 32.00% 32.12% 31.44% 31.38%
EBITDA % of total TTM 24.0% 23.8% 29.5% 29.9% 23.4% 23.4% 23.1% 22.9%
JV interests in EBITDA $ 101 $ — $ 101 $ 108 $ — $ 108 $ 49 $ — $ 49 $ 85 $ — $ 85
Actual
Non-comparable Adjustments Comparable
2018 2018 2018TTM TTM TTM
Total hotel revenue $ 1,418,963 $ 9,324 $ 1,428,287Hotel EBITDA $ 463,425 $ 4,199 $ 467,624Hotel EBITDA margin 32.66% 32.74%
EBITDA % of total TTM 100.0% 100.0%
JV interests in EBITDA $ 343 $ — $ 343
NOTES:(1) The above comparable information assumes the 118 hotel properties owned and included in the Company's operations at September 30, 2018, were owned as of the beginning of each of the periods presented. Non-comparable
adjustments include pre-acquisition results from hotel properties acquired during the period offset by results from hotel properties sold during the period.(2) The above information does not reflect the operations of Orlando WorldQuest Resort.(3) See Exhibit 1 for reconciliation of net income (loss) to hotel EBITDA.

13
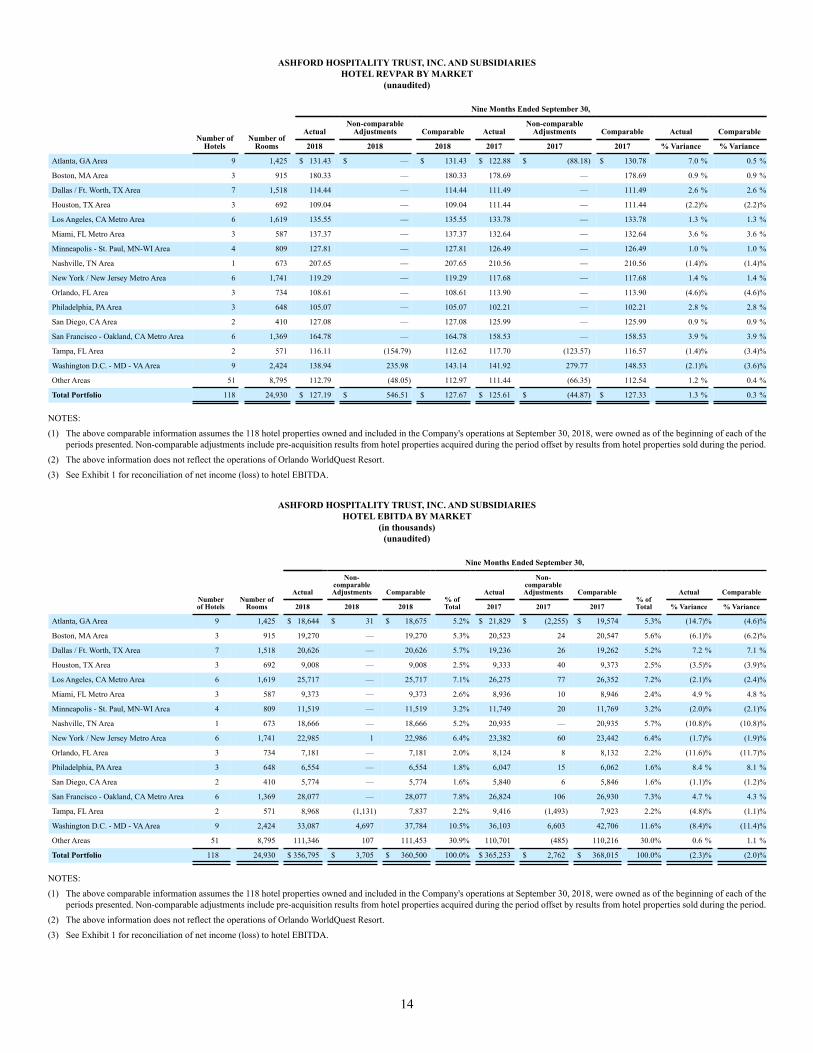
ASHFORD HOSPITALITY TRUST, INC. AND SUBSIDIARIESHOTEL REVPAR BY MARKET
(unaudited)
Three Months Ended September 30,
Number ofHotels
Number ofRooms
ActualNon-comparable
Adjustments Comparable ActualNon-comparable
Adjustments Comparable Actual Comparable
2018 2018 2018 2017 2017 2017 % Variance % Variance
Atlanta, GA Area 9 1,425 $ 128.47 $ — $ 128.47 $ 128.40 $ — $ 128.40 0.1 % 0.1 %
Boston, MA Area 3 915 217.08 — 217.08 207.03 — 207.03 4.9 % 4.9 %
Dallas / Ft. Worth, TX Area 7 1,518 103.19 — 103.19 106.16 — 106.16 (2.8)% (2.8)%
Houston, TX Area 3 692 100.18 — 100.18 108.41 — 108.41 (7.6)% (7.6)%
Los Angeles, CA Metro Area 6 1,619 129.81 — 129.81 128.06 — 128.06 1.4 % 1.4 %
Miami, FL Metro Area 3 587 93.92 — 93.92 99.68 — 99.68 (5.8)% (5.8)%
Minneapolis - St. Paul, MN-WI Area 4 809 133.42 — 133.42 139.84 — 139.84 (4.6)% (4.6)%
Nashville, TN Area 1 673 207.60 — 207.60 207.06 — 207.06 0.3 % 0.3 %
New York / New Jersey Metro Area 6 1,741 122.75 — 122.75 126.74 — 126.74 (3.1)% (3.1)%
Orlando, FL Area 3 734 92.44 — 92.44 99.86 — 99.86 (7.4)% (7.4)%
Philadelphia, PA Area 3 648 115.70 — 115.70 110.73 — 110.73 4.5 % 4.5 %
San Diego, CA Area 2 410 138.61 — 138.61 136.22 — 136.22 1.8 % 1.8 %
San Francisco - Oakland, CA Metro Area 6 1,369 172.17 — 172.17 165.38 — 165.38 4.1 % 4.1 %
Tampa, FL Area 2 571 87.28 — 87.28 90.67 (92.52) 90.31 (3.7)% (3.4)%
Washington D.C. - MD - VA Area 9 2,424 126.23 — 126.23 123.84 247.79 129.78 1.9 % (2.7)%
Other Areas 51 8,795 113.08 — 113.08 112.88 (80.80) 113.38 0.2 % (0.3)%
Total Portfolio 118 24,930 $ 125.15 $ — $ 125.15 $ 124.92 $ 59.35 $ 125.88 0.2 % (0.6)%
NOTES:(1) The above comparable information assumes the 118 hotel properties owned and included in the Company's operations at September 30, 2018, were owned as of the beginning of each of the
periods presented. Non-comparable adjustments include pre-acquisition results from hotel properties acquired during the period offset by results from hotel properties sold during the period.(2) The above information does not reflect the operations of Orlando WorldQuest Resort.(3) See Exhibit 1 for reconciliation of net income (loss) to hotel EBITDA.
ASHFORD HOSPITALITY TRUST, INC. AND SUBSIDIARIESHOTEL EBITDA BY MARKET
(in thousands)(unaudited)
Three Months Ended September 30,
Numberof Hotels
Number ofRooms
Actual
Non-comparable Adjustments Comparable
% ofTotal
Actual
Non-comparable Adjustments Comparable
% ofTotal
Actual Comparable
2018 2018 2018 2017 2017 2017 % Variance % Variance
Atlanta, GA Area 9 1,425 $ 6,135 $ 19 $ 6,154 5.5% $ 5,857 $ 289 $ 6,146 5.4% 4.7 % 0.1 %
Boston, MA Area 3 915 9,110 — 9,110 8.2% 8,427 12 8,439 7.3% 8.1 % 8.0 %
Dallas / Ft. Worth, TX Area 7 1,518 5,449 — 5,449 4.9% 5,453 5 5,458 4.7% (0.1)% (0.2)%
Houston, TX Area 3 692 2,371 — 2,371 2.1% 2,641 19 2,660 2.3% (10.2)% (10.9)%
Los Angeles, CA Metro Area 6 1,619 7,388 — 7,388 6.6% 7,742 34 7,776 6.7% (4.6)% (5.0)%
Miami, FL Metro Area 3 587 1,027 — 1,027 0.9% 1,269 4 1,273 1.1% (19.1)% (19.3)%
Minneapolis - St. Paul, MN-WI Area 4 809 4,159 — 4,159 3.7% 4,872 6 4,878 4.2% (14.6)% (14.7)%
Nashville, TN Area 1 673 6,577 — 6,577 5.9% 6,294 — 6,294 5.5% 4.5 % 4.5 %
New York / New Jersey Metro Area 6 1,741 7,527 — 7,527 6.8% 7,829 8 7,837 6.8% (3.9)% (4.0)%
Orlando, FL Area 3 734 1,350 — 1,350 1.2% 1,830 5 1,835 1.7% (26.2)% (26.4)%
Philadelphia, PA Area 3 648 2,437 — 2,437 2.2% 2,383 7 2,390 2.2% 2.3 % 2.0 %
San Diego, CA Area 2 410 2,180 — 2,180 2.0% 2,264 4 2,268 2.0% (3.7)% (3.9)%
San Francisco - Oakland, CA Metro Area 6 1,369 10,038 — 10,038 9.0% 9,378 57 9,435 8.2% 7.0 % 6.4 %
Tampa, FL Area 2 571 1,185 (77) 1,108 1.0% 1,564 (254) 1,310 1.1% (24.2)% (15.4)%
Washington D.C. - MD - VA Area 9 2,424 9,743 — 9,743 8.8% 9,320 1,927 11,247 9.8% 4.5 % (13.4)%
Other Areas 51 8,795 34,713 (2) 34,711 31.2% 36,179 (219) 35,960 31.0% (4.1)% (3.5)%
Total Portfolio 118 24,930 $ 111,389 $ (60) $ 111,329 100.0% $ 113,302 $ 1,904 $ 115,206 100.0% (1.7)% (3.4)%
NOTES:(1) The above comparable information assumes the 118 hotel properties owned and included in the Company's operations at September 30, 2018, were owned as of the beginning of each of the
periods presented. Non-comparable adjustments include pre-acquisition results from hotel properties acquired during the period offset by results from hotel properties sold during the period.(2) The above information does not reflect the operations of Orlando WorldQuest Resort.(3) See Exhibit 1 for reconciliation of net income (loss) to hotel EBITDA.
14
ASHFORD HOSPITALITY TRUST, INC. AND SUBSIDIARIESHOTEL REVPAR BY MARKET
(unaudited)
Nine Months Ended September 30,
Number ofHotels
Number ofRooms
ActualNon-comparable
Adjustments Comparable ActualNon-comparable
Adjustments Comparable Actual Comparable
2018 2018 2018 2017 2017 2017 % Variance % Variance
Atlanta, GA Area 9 1,425 $ 131.43 $ — $ 131.43 $ 122.88 $ (88.18) $ 130.78 7.0 % 0.5 %
Boston, MA Area 3 915 180.33 — 180.33 178.69 — 178.69 0.9 % 0.9 %
Dallas / Ft. Worth, TX Area 7 1,518 114.44 — 114.44 111.49 — 111.49 2.6 % 2.6 %
Houston, TX Area 3 692 109.04 — 109.04 111.44 — 111.44 (2.2)% (2.2)%
Los Angeles, CA Metro Area 6 1,619 135.55 — 135.55 133.78 — 133.78 1.3 % 1.3 %
Miami, FL Metro Area 3 587 137.37 — 137.37 132.64 — 132.64 3.6 % 3.6 %
Minneapolis - St. Paul, MN-WI Area 4 809 127.81 — 127.81 126.49 — 126.49 1.0 % 1.0 %
Nashville, TN Area 1 673 207.65 — 207.65 210.56 — 210.56 (1.4)% (1.4)%
New York / New Jersey Metro Area 6 1,741 119.29 — 119.29 117.68 — 117.68 1.4 % 1.4 %
Orlando, FL Area 3 734 108.61 — 108.61 113.90 — 113.90 (4.6)% (4.6)%
Philadelphia, PA Area 3 648 105.07 — 105.07 102.21 — 102.21 2.8 % 2.8 %
San Diego, CA Area 2 410 127.08 — 127.08 125.99 — 125.99 0.9 % 0.9 %
San Francisco - Oakland, CA Metro Area 6 1,369 164.78 — 164.78 158.53 — 158.53 3.9 % 3.9 %
Tampa, FL Area 2 571 116.11 (154.79) 112.62 117.70 (123.57) 116.57 (1.4)% (3.4)%
Washington D.C. - MD - VA Area 9 2,424 138.94 235.98 143.14 141.92 279.77 148.53 (2.1)% (3.6)%
Other Areas 51 8,795 112.79 (48.05) 112.97 111.44 (66.35) 112.54 1.2 % 0.4 %
Total Portfolio 118 24,930 $ 127.19 $ 546.51 $ 127.67 $ 125.61 $ (44.87) $ 127.33 1.3 % 0.3 %
NOTES:(1) The above comparable information assumes the 118 hotel properties owned and included in the Company's operations at September 30, 2018, were owned as of the beginning of each of the
periods presented. Non-comparable adjustments include pre-acquisition results from hotel properties acquired during the period offset by results from hotel properties sold during the period.(2) The above information does not reflect the operations of Orlando WorldQuest Resort.(3) See Exhibit 1 for reconciliation of net income (loss) to hotel EBITDA.
ASHFORD HOSPITALITY TRUST, INC. AND SUBSIDIARIESHOTEL EBITDA BY MARKET
(in thousands)(unaudited)
Nine Months Ended September 30,
Numberof Hotels
Number ofRooms
Actual
Non-comparable Adjustments Comparable
% ofTotal
Actual
Non-comparable Adjustments Comparable
% ofTotal
Actual Comparable
2018 2018 2018 2017 2017 2017 % Variance % Variance
Atlanta, GA Area 9 1,425 $ 18,644 $ 31 $ 18,675 5.2% $ 21,829 $ (2,255) $ 19,574 5.3% (14.7)% (4.6)%
Boston, MA Area 3 915 19,270 — 19,270 5.3% 20,523 24 20,547 5.6% (6.1)% (6.2)%
Dallas / Ft. Worth, TX Area 7 1,518 20,626 — 20,626 5.7% 19,236 26 19,262 5.2% 7.2 % 7.1 %
Houston, TX Area 3 692 9,008 — 9,008 2.5% 9,333 40 9,373 2.5% (3.5)% (3.9)%
Los Angeles, CA Metro Area 6 1,619 25,717 — 25,717 7.1% 26,275 77 26,352 7.2% (2.1)% (2.4)%
Miami, FL Metro Area 3 587 9,373 — 9,373 2.6% 8,936 10 8,946 2.4% 4.9 % 4.8 %
Minneapolis - St. Paul, MN-WI Area 4 809 11,519 — 11,519 3.2% 11,749 20 11,769 3.2% (2.0)% (2.1)%
Nashville, TN Area 1 673 18,666 — 18,666 5.2% 20,935 — 20,935 5.7% (10.8)% (10.8)%
New York / New Jersey Metro Area 6 1,741 22,985 1 22,986 6.4% 23,382 60 23,442 6.4% (1.7)% (1.9)%
Orlando, FL Area 3 734 7,181 — 7,181 2.0% 8,124 8 8,132 2.2% (11.6)% (11.7)%
Philadelphia, PA Area 3 648 6,554 — 6,554 1.8% 6,047 15 6,062 1.6% 8.4 % 8.1 %
San Diego, CA Area 2 410 5,774 — 5,774 1.6% 5,840 6 5,846 1.6% (1.1)% (1.2)%
San Francisco - Oakland, CA Metro Area 6 1,369 28,077 — 28,077 7.8% 26,824 106 26,930 7.3% 4.7 % 4.3 %
Tampa, FL Area 2 571 8,968 (1,131) 7,837 2.2% 9,416 (1,493) 7,923 2.2% (4.8)% (1.1)%
Washington D.C. - MD - VA Area 9 2,424 33,087 4,697 37,784 10.5% 36,103 6,603 42,706 11.6% (8.4)% (11.4)%
Other Areas 51 8,795 111,346 107 111,453 30.9% 110,701 (485) 110,216 30.0% 0.6 % 1.1 %
Total Portfolio 118 24,930 $ 356,795 $ 3,705 $ 360,500 100.0% $ 365,253 $ 2,762 $ 368,015 100.0% (2.3)% (2.0)%
NOTES:(1) The above comparable information assumes the 118 hotel properties owned and included in the Company's operations at September 30, 2018, were owned as of the beginning of each of the
periods presented. Non-comparable adjustments include pre-acquisition results from hotel properties acquired during the period offset by results from hotel properties sold during the period.(2) The above information does not reflect the operations of Orlando WorldQuest Resort.(3) See Exhibit 1 for reconciliation of net income (loss) to hotel EBITDA.

15
ASHFORD HOSPITALITY TRUST, INC. AND SUBSIDIARIESTOTAL ENTERPRISE VALUE
SEPTEMBER 30, 2018(in thousands, except share price)
(unaudited)
September 30, 2018End of quarter common shares outstanding 101,038Partnership units outstanding 20,660Combined common shares and partnership units outstanding 121,698Common stock price at quarter end $ 6.39Market capitalization at quarter end $ 777,650Series D preferred stock $ 59,735Series F preferred stock $ 120,000Series G preferred stock $ 155,000Series H preferred stock $ 95,000Series I preferred stock $ 135,000Debt on balance sheet date $ 3,939,170Joint venture partner's share of consolidated debt $ (2,004)Net working capital (see below) $ (460,329)Total enterprise value (TEV) $ 4,819,222
Ashford Inc. Investment:Common stock owned at end of quarter 598Common stock price at quarter end $ 75.87Market value of Ashford Inc. investment $ 45,383
Cash and cash equivalents $ 325,716Restricted cash $ 140,886Accounts receivable, net $ 60,184Prepaid expenses $ 29,639Investment in securities $ 24,173Due from third-party hotel managers, net $ 16,528Market value of Ashford Inc. investment $ 45,383Total current assets $ 642,509
Accounts payable, net & accrued expenses $ 147,734Dividends and distributions payable $ 28,095Due to affiliates, net $ 6,351Total current liabilities $ 182,180
Net working capital* $ 460,329
* Includes the Company's pro rata share of net working capital in joint ventures.
16
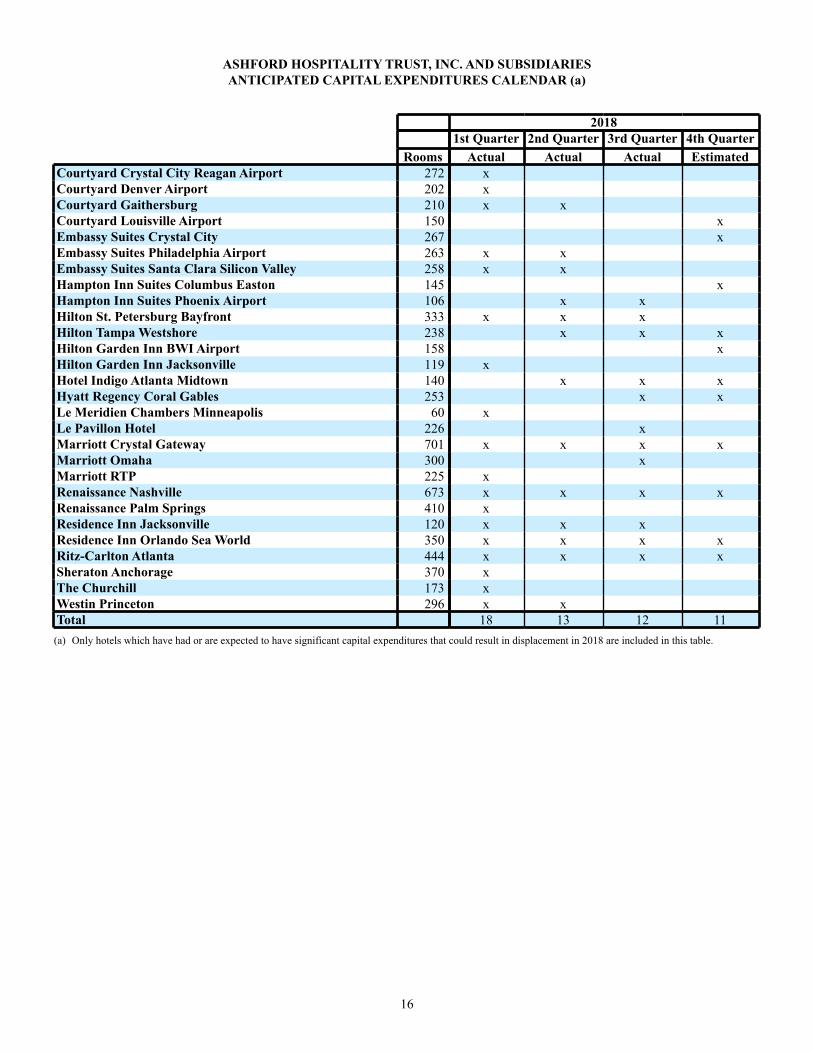
ASHFORD HOSPITALITY TRUST, INC. AND SUBSIDIARIESANTICIPATED CAPITAL EXPENDITURES CALENDAR (a)
20181st Quarter 2nd Quarter 3rd Quarter 4th Quarter
Rooms Actual Actual Actual EstimatedCourtyard Crystal City Reagan Airport 272 xCourtyard Denver Airport 202 xCourtyard Gaithersburg 210 x xCourtyard Louisville Airport 150 xEmbassy Suites Crystal City 267 xEmbassy Suites Philadelphia Airport 263 x xEmbassy Suites Santa Clara Silicon Valley 258 x xHampton Inn Suites Columbus Easton 145 xHampton Inn Suites Phoenix Airport 106 x xHilton St. Petersburg Bayfront 333 x x xHilton Tampa Westshore 238 x x xHilton Garden Inn BWI Airport 158 xHilton Garden Inn Jacksonville 119 xHotel Indigo Atlanta Midtown 140 x x xHyatt Regency Coral Gables 253 x xLe Meridien Chambers Minneapolis 60 xLe Pavillon Hotel 226 xMarriott Crystal Gateway 701 x x x xMarriott Omaha 300 xMarriott RTP 225 xRenaissance Nashville 673 x x x xRenaissance Palm Springs 410 xResidence Inn Jacksonville 120 x x xResidence Inn Orlando Sea World 350 x x x xRitz-Carlton Atlanta 444 x x x xSheraton Anchorage 370 xThe Churchill 173 xWestin Princeton 296 x xTotal 18 13 12 11(a) Only hotels which have had or are expected to have significant capital expenditures that could result in displacement in 2018 are included in this table.

Exhibit 1
17
ASHFORD HOSPITALITY TRUST, INC. AND SUBSIDIARIESRECONCILIATION OF NET INCOME (LOSS) TO HOTEL EBITDA
(in thousands)(unaudited)
2018 2018 2018 2017 September 30, 20183rd Quarter 2nd Quarter 1st Quarter 4th Quarter TTM
Net income (loss) $ 42,925 $ 68,862 $ 40,311 $ 33,102 $ 185,200Non-property adjustments (17) (394) 1,669 8,246 9,504Interest income (73) (58) (30) (28) (189)Interest expense 2,096 1,634 1,600 1,258 6,588Amortization of loan costs 149 178 112 73 512Depreciation and amortization 64,745 64,385 62,869 61,182 253,181Income tax expense (benefit) 14 9 — 173 196Non-hotel EBITDA ownership expense 1,550 2,176 2,083 2,624 8,433Hotel EBITDA including amounts attributable tononcontrolling interest 111,389 136,792 108,614 106,630 463,425Non-comparable adjustments (60) 2,795 970 494 4,199Comparable hotel EBITDA $ 111,329 $ 139,587 $ 109,584 $ 107,124 $ 467,624
NOTES:(1) The above comparable information assumes the 118 hotel properties owned and included in the Company's operations at September 30, 2018, were owned as of the
beginning of each of the periods presented. Non-comparable adjustments include pre-acquisition results from hotel properties acquired during the period offset by results from hotel properties sold during the period.

Exhibit 1
18
ASHFORD HOSPITALITY TRUST, INC. AND SUBSIDIARIESRECONCILIATION OF NET INCOME (LOSS) TO HOTEL EBITDA
(in thousands)(unaudited)
Three Months Ended September 30, 2018Hotel
Properties Not Under Renovation
Hotel Properties
Under Renovation Hotel Total
Orlando WorldQuest
ResortCorporate / Allocated
Ashford Hospitality Trust, Inc.
Net income (loss) $ 41,995 $ 930 $ 42,925 $ 91 $ (77,277) $ (34,261)Non-property adjustments (2) (15) (17) — 17 —Interest income (72) (1) (73) — 73 —Interest expense 1,890 206 2,096 — 51,961 54,057Amortization of loan cost 110 39 149 — 6,525 6,674Depreciation and amortization 51,511 13,234 64,745 128 50 64,923Income tax expense (benefit) 14 — 14 — 505 519Non-hotel EBITDA ownership expense 1,303 247 1,550 9 (1,559) —Hotel EBITDA including amounts attributable to noncontrolling interest 96,749 14,640 111,389 228 (19,705) 91,912Less: EBITDA adjustments attributable to consolidated noncontrolling interest (101) — (101) — 101 —Equity in (earnings) loss of unconsolidated entities — — — — (310) (310)Company's portion of EBITDA of Ashford Inc. — — — — (1,607) (1,607)Company's portion of EBITDA of OpenKey — — — — (158) (158)Hotel EBITDA attributable to the Company and OP unitholders $ 96,648 $ 14,640 $ 111,288 $ 228 $ (21,679) $ 89,837Non-comparable adjustments (60) — (60)Comparable hotel EBITDA $ 96,689 $ 14,640 $ 111,329
NOTES:(1) The above comparable information assumes the 118 hotel properties owned and included in the Company's operations at September 30, 2018, were owned as of the
beginning of each of the periods presented. Non-comparable adjustments include pre-acquisition results from hotel properties acquired during the period offset by results from hotel properties sold during the period.
(2) Excluded Hotels Under Renovation:Hampton Inn Suites Phoenix Airport, Hilton St. Petersburg Bayfront, Hilton Tampa Westshore, Hotel Indigo Atlanta Midtown, Hyatt Regency Coral Gables, Le Pavillon Hotel, Marriott Crystal Gateway, Marriott Omaha, Renaissance Nashville, Residence Inn Jacksonville, Residence Inn Orlando Sea World, Ritz-Carlton Atlanta

Exhibit 1
19
ASHFORD HOSPITALITY TRUST, INC. AND SUBSIDIARIESRECONCILIATION OF NET INCOME (LOSS) TO HOTEL EBITDA
(in thousands)(unaudited)
Three Months Ended June 30, 2018Hotel
Properties Not Under Renovation
Hotel Properties
Under Renovation Hotel Total
Orlando WorldQuest
ResortCorporate / Allocated
Ashford Hospitality Trust, Inc.
Net income (loss) $ 60,530 $ 8,332 $ 68,862 $ 244 $ (92,457) $ (23,351)Non-property adjustments (429) 35 (394) — 394 —Interest income (58) — (58) — 58 —Interest expense 1,438 196 1,634 — 51,082 52,716Amortization of loan cost 140 38 178 — 5,312 5,490Depreciation and amortization 51,743 12,642 64,385 132 49 64,566Income tax expense (benefit) 9 — 9 — 2,964 2,973Non-hotel EBITDA ownership expense 1,709 467 2,176 21 (2,197) —Hotel EBITDA including amounts attributable to noncontrolling interest 115,082 21,710 136,792 397 (34,795) 102,394Less: EBITDA adjustments attributable to consolidated noncontrolling interest (108) — (108) — 108 —Equity in (earnings) loss of unconsolidated entities — — — — (1,170) (1,170)Company's portion of EBITDA of Ashford Inc. — — — — 3,551 3,551Company's portion of EBITDA of OpenKey — — — — (122) (122)Hotel EBITDA attributable to the Company and OP unitholders $ 114,974 $ 21,710 $ 136,684 $ 397 $ (32,428) $ 104,653Non-comparable adjustments 2,795 — 2,795Comparable hotel EBITDA $ 117,877 $ 21,710 $ 139,587
NOTES:(1) The above comparable information assumes the 118 hotel properties owned and included in the Company's operations at September 30, 2018, were owned as of the
beginning of each of the periods presented. Non-comparable adjustments include pre-acquisition results from hotel properties acquired during the period offset by results from hotel properties sold during the period.
(2) Excluded Hotels Under Renovation:Hampton Inn Suites Phoenix Airport, Hilton St. Petersburg Bayfront, Hilton Tampa Westshore, Hotel Indigo Atlanta Midtown, Hyatt Regency Coral Gables, Le Pavillon Hotel, Marriott Crystal Gateway, Marriott Omaha, Renaissance Nashville, Residence Inn Jacksonville, Residence Inn Orlando Sea World, Ritz-Carlton Atlanta

Exhibit 1
20
ASHFORD HOSPITALITY TRUST, INC. AND SUBSIDIARIESRECONCILIATION OF NET INCOME (LOSS) TO HOTEL EBITDA
(in thousands)(unaudited)
Three Months Ended March 31, 2018Hotel
Properties Not Under Renovation
Hotel Properties
Under Renovation Hotel Total
Orlando WorldQuest
ResortCorporate / Allocated
Ashford Hospitality Trust, Inc.
Net income (loss) $ 31,188 $ 9,123 $ 40,311 $ 483 $ (73,443) $ (32,649)Non-property adjustments 1,770 (101) 1,669 — (1,669) —Interest income (30) — (30) — 30 —Interest expense 1,419 181 1,600 — 50,690 52,290Amortization of loan cost 74 38 112 — 2,341 2,453Depreciation and amortization 51,250 11,619 62,869 130 48 63,047Income tax expense (benefit) — — — — (886) (886)Non-hotel EBITDA ownership expense 1,668 415 2,083 (11) (2,072) —Hotel EBITDA including amounts attributable to noncontrolling interest 87,339 21,275 108,614 602 (24,961) 84,255Less: EBITDA adjustments attributable to consolidated noncontrolling interest (49) — (49) — 49 —Equity in (earnings) loss of unconsolidated entities — — — — 588 588Company's portion of EBITDA of Ashford Inc. — — — — (964) (964)Company's portion of EBITDA of OpenKey — — — — (139) (139)Hotel EBITDA attributable to the Company and OP unitholders $ 87,290 $ 21,275 $ 108,565 $ 602 $ (25,427) $ 83,740Non-comparable adjustments 970 — 970Comparable hotel EBITDA $ 88,309 $ 21,275 $ 109,584
NOTES:(1) The above comparable information assumes the 118 hotel properties owned and included in the Company's operations at September 30, 2018, were owned as of the
beginning of each of the periods presented. Non-comparable adjustments include pre-acquisition results from hotel properties acquired during the period offset by results from hotel properties sold during the period.
(2) Excluded Hotels Under Renovation:Hampton Inn Suites Phoenix Airport, Hilton St. Petersburg Bayfront, Hilton Tampa Westshore, Hotel Indigo Atlanta Midtown, Hyatt Regency Coral Gables, Le Pavillon Hotel, Marriott Crystal Gateway, Marriott Omaha, Renaissance Nashville, Residence Inn Jacksonville, Residence Inn Orlando Sea World, Ritz-Carlton Atlanta

Exhibit 1
21
ASHFORD HOSPITALITY TRUST, INC. AND SUBSIDIARIESRECONCILIATION OF NET INCOME (LOSS) TO HOTEL EBITDA
(in thousands)(unaudited)
Three Months Ended December 31, 2017Hotel
Properties Not Under Renovation
Hotel Properties
Under Renovation Hotel Total
Orlando WorldQuest
ResortCorporate / Allocated
Ashford Hospitality Trust, Inc.
Net income (loss) $ 25,076 $ 8,026 $ 33,102 $ 230 $ (71,857) $ (38,525)Non-property adjustments 8,246 — 8,246 (75) (8,171) —Interest income (28) — (28) — 28 —Interest expense 1,086 172 1,258 — 51,851 53,109Amortization of loan cost 36 37 73 — 2,225 2,298Depreciation and amortization 50,454 10,728 61,182 123 46 61,351Income tax expense (benefit) 173 — 173 — (1,884) (1,711)Non-hotel EBITDA ownership expense 2,468 156 2,624 25 (2,649) —Hotel EBITDA including amounts attributable to noncontrolling interest 87,511 19,119 106,630 303 (30,411) 76,522Less: EBITDA adjustments attributable to consolidated noncontrolling interest (85) — (85) — 85 —Equity in (earnings) loss of unconsolidated entities — — — — 2,286 2,286Company's portion of EBITDA of Ashford Inc. — — — — (1,646) (1,646)Company's portion of EBITDA of OpenKey — — — — (137) (137)Hotel EBITDA attributable to the Company and OP unitholders $ 87,426 $ 19,119 $ 106,545 $ 303 $ (29,823) $ 77,025Non-comparable adjustments 624 (130) 494Comparable hotel EBITDA $ 88,135 $ 18,989 $ 107,124
NOTES:(1) The above comparable information assumes the 118 hotel properties owned and included in the Company's operations at September 30, 2018, were owned as of the
beginning of each of the periods presented. Non-comparable adjustments include pre-acquisition results from hotel properties acquired during the period offset by results from hotel properties sold during the period.
(2) Excluded Hotels Under Renovation:Hampton Inn Suites Phoenix Airport, Hilton St. Petersburg Bayfront, Hilton Tampa Westshore, Hotel Indigo Atlanta Midtown, Hyatt Regency Coral Gables, Le Pavillon Hotel, Marriott Crystal Gateway, Marriott Omaha, Renaissance Nashville, Residence Inn Jacksonville, Residence Inn Orlando Sea World, Ritz-Carlton Atlanta

Exhibit 1
22
ASHFORD HOSPITALITY TRUST, INC. AND SUBSIDIARIESRECONCILIATION OF NET INCOME (LOSS) TO HOTEL EBITDA
(in thousands)(unaudited)
Three Months Ended September 30, 2017Hotel
Properties Not Under Renovation
Hotel Properties
Under Renovation Hotel Total
Orlando WorldQuest
ResortCorporate / Allocated
Ashford Hospitality Trust, Inc.
Net income (loss) $ 40,683 $ 5,218 $ 45,901 $ 69 $ (74,696) $ (28,726)Non-property adjustments 1,549 221 1,770 — (1,770) —Interest income (27) (1) (28) — 28 —Interest expense 528 170 698 — 53,715 54,413Amortization of loan cost — 37 37 — 2,513 2,550Depreciation and amortization 49,967 9,999 59,966 120 49 60,135Income tax expense (benefit) 33 — 33 — (1,300) (1,267)Non-hotel EBITDA ownership expense 4,668 257 4,925 7 (4,932) —Hotel EBITDA including amounts attributable to noncontrolling interest 97,401 15,901 113,302 196 (26,393) 87,105Less: EBITDA adjustments attributable to consolidated noncontrolling interest (116) — (116) — 116 —Equity in (earnings) loss of unconsolidated entities — — — — 679 679Company's portion of EBITDA of Ashford Inc. — — — — (384) (384)Company's portion of EBITDA of OpenKey — — — — (113) (113)Hotel EBITDA attributable to the Company and OP unitholders $ 97,285 $ 15,901 $ 113,186 $ 196 $ (26,095) $ 87,287Non-comparable adjustments 1,872 32 1,904Comparable hotel EBITDA $ 99,273 $ 15,933 $ 115,206
NOTES:(1) The above comparable information assumes the 118 hotel properties owned and included in the Company's operations at September 30, 2018, were owned as of the
beginning of each of the periods presented. Non-comparable adjustments include pre-acquisition results from hotel properties acquired during the period offset by results from hotel properties sold during the period.
(2) Excluded Hotels Under Renovation:Hampton Inn Suites Phoenix Airport, Hilton St. Petersburg Bayfront, Hilton Tampa Westshore, Hotel Indigo Atlanta Midtown, Hyatt Regency Coral Gables, Le Pavillon Hotel, Marriott Crystal Gateway, Marriott Omaha, Renaissance Nashville, Residence Inn Jacksonville, Residence Inn Orlando Sea World, Ritz-Carlton Atlanta

Exhibit 1
23
ASHFORD HOSPITALITY TRUST, INC. AND SUBSIDIARIESRECONCILIATION OF NET INCOME (LOSS) TO HOTEL EBITDA
(in thousands)(unaudited)
Nine Months Ended September 30, 2018Hotel
Properties Not Under Renovation
Hotel Properties
Under Renovation Hotel Total
Orlando WorldQuest
ResortCorporate / Allocated
Ashford Hospitality Trust, Inc.
Net income (loss) $ 133,713 $ 18,385 $ 152,098 $ 818 $ (243,177) $ (90,261)Non-property adjustments 1,339 (81) 1,258 — (1,258) —Interest income (160) (1) (161) — 161 —Interest expense 4,747 583 5,330 — 153,733 159,063Amortization of loan cost 324 115 439 — 14,178 14,617Depreciation and amortization 154,504 37,495 191,999 390 147 192,536Income tax expense (benefit) 23 — 23 — 2,583 2,606Non-hotel EBITDA ownership expense 4,680 1,129 5,809 19 (5,828) —Hotel EBITDA including amounts attributable to noncontrolling interest 299,170 57,625 356,795 1,227 (79,461) 278,561Less: EBITDA adjustments attributable to consolidated noncontrolling interest (258) — (258) — 258 —Equity in (earnings) loss of unconsolidated entities — — — — (892) (892)Company's portion of EBITDA of Ashford Inc. — — — — 959 959Company's portion of EBITDA of OpenKey — — — — (419) (419)Hotel EBITDA attributable to the Company and OP unitholders $ 298,912 $ 57,625 $ 356,537 $ 1,227 $ (79,555) $ 278,209Non-comparable adjustments 3,705 — 3,705Comparable hotel EBITDA $ 302,875 $ 57,625 $ 360,500
NOTES:(1) The above comparable information assumes the 118 hotel properties owned and included in the Company's operations at September 30, 2018, were owned as of the
beginning of each of the periods presented. Non-comparable adjustments include pre-acquisition results from hotel properties acquired during the period offset by results from hotel properties sold during the period.
(2) Excluded Hotels Under Renovation:Hampton Inn Suites Phoenix Airport, Hilton St. Petersburg Bayfront, Hilton Tampa Westshore, Hotel Indigo Atlanta Midtown, Hyatt Regency Coral Gables, Le Pavillon Hotel, Marriott Crystal Gateway, Marriott Omaha, Renaissance Nashville, Residence Inn Jacksonville, Residence Inn Orlando Sea World, Ritz-Carlton Atlanta

Exhibit 1
24
ASHFORD HOSPITALITY TRUST, INC. AND SUBSIDIARIESRECONCILIATION OF NET INCOME (LOSS) TO HOTEL EBITDA
(in thousands)(unaudited)
Nine Months Ended September 30, 2017Hotel
Properties Not Under Renovation
Hotel Properties
Under Renovation Hotel Total
Orlando WorldQuest
ResortCorporate / Allocated
Ashford Hospitality Trust, Inc.
Net income (loss) $ 146,855 $ 33,428 $ 180,283 $ 1,023 $ (231,541) $ (50,235)Non-property adjustments (12,460) 221 (12,239) — 12,239 —Interest income (94) (4) (98) — 98 —Interest expense 1,515 237 1,752 — 154,551 156,303Amortization of loan cost 168 49 217 — 10,704 10,921Depreciation and amortization 152,882 29,976 182,858 350 2,172 185,380Income tax expense (benefit) 56 — 56 — (563) (507)Non-hotel EBITDA ownership expense 12,072 352 12,424 (6) (12,418) —Hotel EBITDA including amounts attributable to noncontrolling interest 300,994 64,259 365,253 1,367 (64,758) 301,862Less: EBITDA adjustments attributable to consolidated noncontrolling interest (283) — (283) — 283 —Equity in (earnings) loss of unconsolidated entities — — — — 3,632 3,632Company's portion of EBITDA of Ashford Inc. — — — — (20) (20)Company's portion of EBITDA of OpenKey — — — — (361) (361)Hotel EBITDA attributable to the Company and OP unitholders $ 300,711 $ 64,259 $ 364,970 $ 1,367 $ (61,224) $ 305,113Non-comparable adjustments 2,667 95 2,762Comparable hotel EBITDA $ 303,661 $ 64,354 $ 368,015
NOTES:(1) The above comparable information assumes the 118 hotel properties owned and included in the Company's operations at September 30, 2018, were owned as of the
beginning of each of the periods presented. Non-comparable adjustments include pre-acquisition results from hotel properties acquired during the period offset by results from hotel properties sold during the period.
(2) Excluded Hotels Under Renovation:Hampton Inn Suites Phoenix Airport, Hilton St. Petersburg Bayfront, Hilton Tampa Westshore, Hotel Indigo Atlanta Midtown, Hyatt Regency Coral Gables, Le Pavillon Hotel, Marriott Crystal Gateway, Marriott Omaha, Renaissance Nashville, Residence Inn Jacksonville, Residence Inn Orlando Sea World, Ritz-Carlton Atlanta

Exhibit 1
25
ASHFORD HOSPITALITY TRUST, INC. AND SUBSIDIARIESRECONCILIATION OF NET INCOME (LOSS) TO HOTEL EBITDA
(in thousands)(unaudited)
Three Months Ended September 30, 2018
Atlanta, GA Area
Boston, MA Area
Dallas / Ft. Worth, TX Area
Houston, TX Area
Los Angeles,
CA Metro Area
Miami, FL Metro Area
Minneapolis - St. Paul, MN -
WI AreaNashville, TN Area
New York / New Jersey Metro Area
Net income (loss) $ 2,514 $ 4,363 $ 2,042 $ 814 $ 2,524 $ (923) $ 1,558 $ 4,194 $ 3,270
Non-property adjustments — — — 1 — (21) — — —
Interest income (1) — (2) — (4) (1) (15) — (10)
Interest expense 206 1,014 — — — — — — —
Amortization of loan costs 39 55 — — — — — — —
Depreciation and amortization 3,318 3,607 3,392 1,386 4,623 2,000 2,567 2,371 4,079
Income tax expense (benefit) — — — — — — — — —
Non-hotel EBITDA ownership expense 59 71 17 170 245 (28) 49 12 188
Hotel EBITDA including amounts attributable to noncontrolling interest 6,135 9,110 5,449 2,371 7,388 1,027 4,159 6,577 7,527
Non-comparable adjustments 19 — — — — — — — —
Comparable hotel EBITDA $ 6,154 $ 9,110 $ 5,449 $ 2,371 $ 7,388 $ 1,027 $ 4,159 $ 6,577 $ 7,527
Orlando, FL Area
Philadelphia, PA Area
San Diego, CA Area
San Francisco - Oakland, CA Metro
AreaTampa, FL
Area
Washington D.C. - MD -
VA Area Other AreasTotal
Portfolio
Net income (loss) $ (684) $ 731 $ 1,274 $ 6,828 $ (443) $ 1,376 $ 13,487 $ 42,925
Non-property adjustments 1 — — — 20 (4) (14) (17)
Interest income (3) (1) (2) (6) — (12) (18) (75)
Interest expense — — — — — 872 4 2,096
Amortization of loan costs — — — — — 54 — 148
Depreciation and amortization 2,008 1,653 884 3,138 1,580 7,417 20,723 64,746
Income tax expense (benefit) — — — — — — 14 14
Non-hotel EBITDA ownership expense 28 54 24 78 28 40 517 1,552
Hotel EBITDA including amounts attributable to noncontrolling interest 1,350 2,437 2,180 10,038 1,185 9,743 34,713 111,389
Non-comparable adjustments — — — — (77) — (2) (60)
Comparable hotel EBITDA $ 1,350 $ 2,437 $ 2,180 $ 10,038 $ 1,108 $ 9,743 $ 34,711 $ 111,329
NOTES:(1) The above comparable information assumes the 118 hotel properties owned and included in the Company's operations at September 30, 2018, were owned as of the
beginning of each of the periods presented. Non-comparable adjustments include pre-acquisition results from hotel properties acquired during the period offset by results from hotel properties sold during the period.
(2) The above information does not reflect the operations of Orlando WorldQuest Resort.
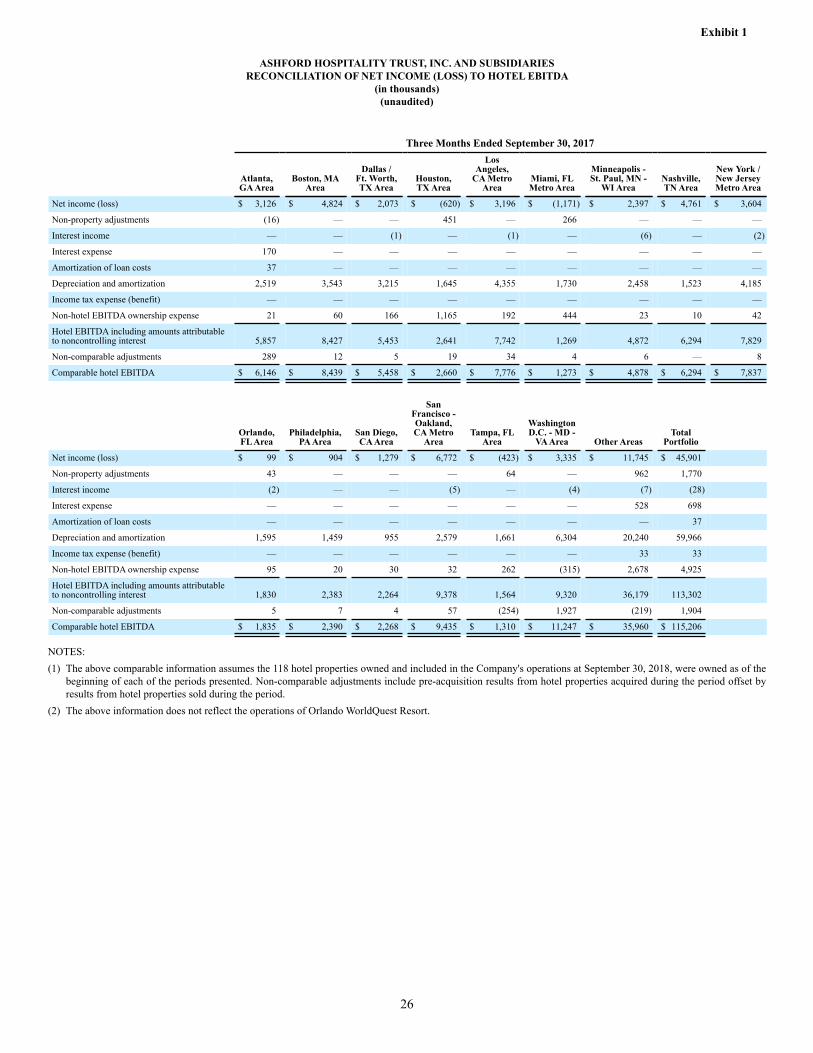
Exhibit 1
26
ASHFORD HOSPITALITY TRUST, INC. AND SUBSIDIARIESRECONCILIATION OF NET INCOME (LOSS) TO HOTEL EBITDA
(in thousands)(unaudited)
Three Months Ended September 30, 2017
Atlanta, GA Area
Boston, MA Area
Dallas / Ft. Worth, TX Area
Houston, TX Area
Los Angeles,
CA Metro Area
Miami, FL Metro Area
Minneapolis - St. Paul, MN -
WI AreaNashville, TN Area
New York / New Jersey Metro Area
Net income (loss) $ 3,126 $ 4,824 $ 2,073 $ (620) $ 3,196 $ (1,171) $ 2,397 $ 4,761 $ 3,604
Non-property adjustments (16) — — 451 — 266 — — —
Interest income — — (1) — (1) — (6) — (2)
Interest expense 170 — — — — — — — —
Amortization of loan costs 37 — — — — — — — —
Depreciation and amortization 2,519 3,543 3,215 1,645 4,355 1,730 2,458 1,523 4,185
Income tax expense (benefit) — — — — — — — — —
Non-hotel EBITDA ownership expense 21 60 166 1,165 192 444 23 10 42
Hotel EBITDA including amounts attributable to noncontrolling interest 5,857 8,427 5,453 2,641 7,742 1,269 4,872 6,294 7,829
Non-comparable adjustments 289 12 5 19 34 4 6 — 8
Comparable hotel EBITDA $ 6,146 $ 8,439 $ 5,458 $ 2,660 $ 7,776 $ 1,273 $ 4,878 $ 6,294 $ 7,837
Orlando, FL Area
Philadelphia, PA Area
San Diego, CA Area
San Francisco - Oakland, CA Metro
AreaTampa, FL
Area
Washington D.C. - MD -
VA Area Other AreasTotal
Portfolio
Net income (loss) $ 99 $ 904 $ 1,279 $ 6,772 $ (423) $ 3,335 $ 11,745 $ 45,901
Non-property adjustments 43 — — — 64 — 962 1,770
Interest income (2) — — (5) — (4) (7) (28)
Interest expense — — — — — — 528 698
Amortization of loan costs — — — — — — — 37
Depreciation and amortization 1,595 1,459 955 2,579 1,661 6,304 20,240 59,966
Income tax expense (benefit) — — — — — — 33 33
Non-hotel EBITDA ownership expense 95 20 30 32 262 (315) 2,678 4,925
Hotel EBITDA including amounts attributable to noncontrolling interest 1,830 2,383 2,264 9,378 1,564 9,320 36,179 113,302
Non-comparable adjustments 5 7 4 57 (254) 1,927 (219) 1,904
Comparable hotel EBITDA $ 1,835 $ 2,390 $ 2,268 $ 9,435 $ 1,310 $ 11,247 $ 35,960 $ 115,206
NOTES:(1) The above comparable information assumes the 118 hotel properties owned and included in the Company's operations at September 30, 2018, were owned as of the
beginning of each of the periods presented. Non-comparable adjustments include pre-acquisition results from hotel properties acquired during the period offset by results from hotel properties sold during the period.
(2) The above information does not reflect the operations of Orlando WorldQuest Resort.

Exhibit 1
27
ASHFORD HOSPITALITY TRUST, INC. AND SUBSIDIARIESRECONCILIATION OF NET INCOME (LOSS) TO HOTEL EBITDA
(in thousands)(unaudited)
Nine Months Ended September 30, 2018
Atlanta, GA Area
Boston, MA Area
Dallas / Ft. Worth, TX Area
Houston, TX Area
Los Angeles,
CA Metro Area
Miami, FL Metro Area
Minneapolis - St. Paul, MN -
WI AreaNashville, TN Area
New York / New Jersey Metro Area
Net income (loss) $ 8,336 $ 4,779 $ 10,072 $ 4,691 $ 11,736 $ 3,658 $ 3,769 $ 12,095 $ 10,359
Non-property adjustments — — — (134) — (120) — — —
Interest income (3) — (5) — (7) (2) (38) — (21)
Interest expense 583 2,846 — — — — — — —
Amortization of loan costs 115 165 — — — — — — —
Depreciation and amortization 9,231 11,176 10,280 4,102 13,758 5,716 7,639 6,526 12,387
Income tax expense (benefit) — — — — — — — — —
Non-hotel EBITDA ownership expense 382 304 279 349 230 121 149 45 260
Hotel EBITDA including amounts attributable to noncontrolling interest 18,644 19,270 20,626 9,008 25,717 9,373 11,519 18,666 22,985
Non-comparable adjustments 31 — — — — — — — 1
Comparable hotel EBITDA $ 18,675 $ 19,270 $ 20,626 $ 9,008 $ 25,717 $ 9,373 $ 11,519 $ 18,666 $ 22,986
Orlando, FL Area
Philadelphia, PA Area
San Diego, CA Area
San Francisco - Oakland, CA Metro
AreaTampa, FL
Area
Washington D.C. - MD -
VA Area Other AreasTotal
Portfolio
Net income (loss) $ 1,357 $ 1,473 $ 2,618 $ 18,497 $ 4,116 $ 9,351 $ 45,191 $ 152,098
Non-property adjustments (39) — — — (374) 1,941 (16) 1,258
Interest income (7) (2) (3) (15) — (23) (37) (163)
Interest expense — — — — — 872 1,029 5,330
Amortization of loan costs — — — — — 54 104 438
Depreciation and amortization 5,816 4,894 2,691 9,287 5,068 20,598 62,831 192,000
Income tax expense (benefit) — — — — — — 23 23
Non-hotel EBITDA ownership expense 54 189 468 308 158 294 2,221 5,811
Hotel EBITDA including amounts attributable to noncontrolling interest 7,181 6,554 5,774 28,077 8,968 33,087 111,346 356,795
Non-comparable adjustments — — — — (1,131) 4,697 107 3,705
Comparable hotel EBITDA $ 7,181 $ 6,554 $ 5,774 $ 28,077 $ 7,837 $ 37,784 $ 111,453 $ 360,500
NOTES:(1) The above comparable information assumes the 118 hotel properties owned and included in the Company's operations at September 30, 2018, were owned as of the
beginning of each of the periods presented. Non-comparable adjustments include pre-acquisition results from hotel properties acquired during the period offset by results from hotel properties sold during the period.
(2) The above information does not reflect the operations of Orlando WorldQuest Resort.

Exhibit 1
28
ASHFORD HOSPITALITY TRUST, INC. AND SUBSIDIARIESRECONCILIATION OF NET INCOME (LOSS) TO HOTEL EBITDA
(in thousands)(unaudited)
Nine Months Ended September 30, 2017
Atlanta, GA Area
Boston, MA Area
Dallas / Ft. Worth, TX Area
Houston, TX Area
Los Angeles,
CA Metro Area
Miami, FL Metro Area
Minneapolis - St. Paul, MN -
WI AreaNashville, TN Area
New York / New Jersey Metro Area
Net income (loss) $ 25,304 $ 10,068 $ 8,970 $ 2,414 $ 13,137 $ (1,450) $ 4,152 $ 15,716 $ 10,354
Non-property adjustments (14,109) — — 451 — 266 — — —
Interest income (12) — (3) — (3) — (30) — (6)
Interest expense 237 — — — — — — — —
Amortization of loan costs 49 — — — — — — — —
Depreciation and amortization 10,122 10,404 9,362 5,233 12,832 5,205 7,562 5,174 12,614
Income tax expense (benefit) — — — — — — — — —
Non-hotel EBITDA ownership expense 238 51 907 1,235 309 4,915 65 45 420
Hotel EBITDA including amounts attributable to noncontrolling interest 21,829 20,523 19,236 9,333 26,275 8,936 11,749 20,935 23,382
Non-comparable adjustments (2,255) 24 26 40 77 10 20 — 60
Comparable hotel EBITDA $ 19,574 $ 20,547 $ 19,262 $ 9,373 $ 26,352 $ 8,946 $ 11,769 $ 20,935 $ 23,442
Orlando, FL Area
Philadelphia, PA Area
San Diego, CA Area
San Francisco - Oakland, CA Metro
AreaTampa, FL
Area
Washington D.C. - MD -
VA Area Other AreasTotal
Portfolio
Net income (loss) $ 3,509 $ 1,681 $ 2,792 $ 19,530 $ 4,761 $ 18,271 $ 41,074 $ 180,283
Non-property adjustments 43 — — — 64 — 1,046 (12,239)
Interest income (5) — — (14) — (12) (13) (98)
Interest expense — — — — — — 1,515 1,752
Amortization of loan costs — — — — — — 168 217
Depreciation and amortization 4,470 4,275 2,982 7,170 4,374 18,672 62,407 182,858
Income tax expense (benefit) — — — — — — 56 56
Non-hotel EBITDA ownership expense 107 91 66 138 217 (828) 4,448 12,424
Hotel EBITDA including amounts attributable to noncontrolling interest 8,124 6,047 5,840 26,824 9,416 36,103 110,701 365,253
Non-comparable adjustments 8 15 6 106 (1,493) 6,603 (485) 2,762
Comparable hotel EBITDA $ 8,132 $ 6,062 $ 5,846 $ 26,930 $ 7,923 $ 42,706 $ 110,216 $ 368,015
NOTES:(1) The above comparable information assumes the 118 hotel properties owned and included in the Company's operations at September 30, 2018, were owned as of the
beginning of each of the periods presented. Non-comparable adjustments include pre-acquisition results from hotel properties acquired during the period offset by results from hotel properties sold during the period.
(2) The above information does not reflect the operations of Orlando WorldQuest Resort.

Exhibit 1
29
ASHFORD HOSPITALITY TRUST, INC. AND SUBSIDIARIESRECONCILIATION OF NET INCOME (LOSS) TO HOTEL EBITDA
(in thousands)(unaudited)
TTM Ended September 30, 2018
KEYS Pool A - 7 hotels
KEYS Pool B - 7 hotels
KEYS Pool C - 5 hotels
KEYS Pool D - 5 hotels
KEYS Pool E - 5 hotels
KEYS Pool F - 5 hotels
BAML Highland Pool
- 21 hotels
Morgan Stanley Pool -
17 hotels
Morgan Stanley - 8
hotels
JP Morgan Chase - 8
hotels
BAML Pool 3 - 3
hotels
Net income (loss) $ 2,091 $ 12,438 $ 9,266 $ 13,949 $ 8,593 $ 12,008 $ 45,828 $ 20,725 $ 1,472 $ 22,428 $ 1,304
Non-property adjustments 10,135 (75) (60) 72 (6) — (345) (132) — (29) (17)
Interest income (17) (9) — — — (22) — (8) — (74) (2)
Interest expense (1) — — — 1,548 — — — 12 4 —
Amortization of loan costs — — — — 104 — — — — — —
Depreciation and amortization 9,106 8,758 14,927 14,596 13,118 12,115 59,034 29,598 9,933 22,465 5,530
Income tax expense (benefit) 14 63 — — — — — — — — —
Non-hotel EBITDA ownership expense 466 333 965 (157) 979 392 2,566 561 382 665 72
Hotel EBITDA including amounts attributable to noncontrolling interest 21,794 21,508 25,098 28,460 24,336 24,493 107,083 50,744 11,799 45,459 6,887
Non-comparable adjustments (426) (71) (45) (80) (102) (12) (1,684) (142) (14) (80) —
Comparable hotel EBITDA $ 21,368 $ 21,437 $ 25,053 $ 28,380 $ 24,234 $ 24,481 $ 105,399 $ 50,602 $ 11,785 $ 45,379 $ 6,887
Morgan Stanley Pool C1 - 3 hotels
Morgan Stanley
Pool C3 - 3 hotels
BAML Pool 5 - 2
hotels
Morgan Stanley
Pool C2 - 2 hotels
Aareal Princeton /
Nashville - 2 hotels
Aareal Hilton Alexandria - 1
hotel
Morgan Stanley Ann
Arbor - 1 hotel
Omni American
Bank Ashton - 1 hotel
BAML Indigo
Atlanta - 1 hotel
Prudential Boston Back Bay - 1 hotel
GACC Gateway - 1
hotel
Net income (loss) $ 4,462 $ 2,271 $ 1,914 $ 853 $ 15,812 $ 194 $ 2,500 $ 602 $ 181 $ 3,355 $ 3,454
Non-property adjustments (40) — — — — — — — — — —
Interest income — — (5) (1) — (8) — — — — —
Interest expense — — — — — 872 — — 755 3,398 —
Amortization of loan costs — — — — — 54 — — 152 202 —
Depreciation and amortization 4,262 1,262 582 939 11,718 734 1,184 522 1,119 6,605 11,049
Income tax expense (benefit) — — — — — — — — — — —
Non-hotel EBITDA ownership expense 18 90 93 48 (69) 5 57 11 124 209 (309)
Hotel EBITDA including amounts attributable to noncontrolling interest 8,702 3,623 2,584 1,839 27,461 1,851 3,741 1,135 2,331 13,769 14,194
Non-comparable adjustments (16) — — (7) (31) 7,011 (10) (4) (2) (21) —
Comparable hotel EBITDA $ 8,686 $ 3,623 $ 2,584 $ 1,832 $ 27,430 $ 8,862 $ 3,731 $ 1,131 $ 2,329 $ 13,748 $ 14,194
GACC Jacksonville RI - 1 hotel
BAML Le Pavillon - 1
hotel
Key Bank Manchester
CY - 1 hotel
GACC Manchester RI - 1 hotel
Deutsche Bank W
Minneapolis - 1 hotel
NorthStar HGI
Wisconsin Dells - 1 hotel
BAML Pool 4 - 2 hotels
NorthStar Gainesville -
1 hotelWachovia 5 -
5 hotelsUnencumbered
hotelsTotal
Portfolio
Net income (loss) $ (1,296) $ (1,280) $ 330 $ 327 $ 2,737 $ 25 $ (13) $ (10) $ (44) $ (1,276) $ 185,200
Non-property adjustments (38) — — — — — — — — 39 9,504
Interest income — — — — (46) — — — — 3 (189)
Interest expense — — — — — — — — — — 6,588
Amortization of loan costs — — — — — — — — — — 512
Depreciation and amortization 1,596 3,019 528 951 3,421 867 — — — 3,643 253,181
Income tax expense (benefit) — — 57 63 — — — — — (1) 196
Non-hotel EBITDA ownership expense 55 732 23 8 95 67 12 10 44 (114) 8,433
Hotel EBITDA including amounts attributable to noncontrolling interest 317 2,471 938 1,349 6,207 959 (1) — — 2,294 463,425
Non-comparable adjustments — (38) — — — (1) 1 — — (27) 4,199
Comparable hotel EBITDA $ 317 $ 2,433 $ 938 $ 1,349 $ 6,207 $ 958 $ — $ — $ — $ 2,267 $ 467,624
NOTES:(1) The above comparable information assumes the 118 hotel properties owned and included in the Company's operations at September 30, 2018, were owned as of the
beginning of each of the periods presented. Non-comparable adjustments include pre-acquisition results from hotel properties acquired during the period offset by results from hotel properties sold during the period.
(2) The above information does not reflect the operations of Orlando WorldQuest Resort.
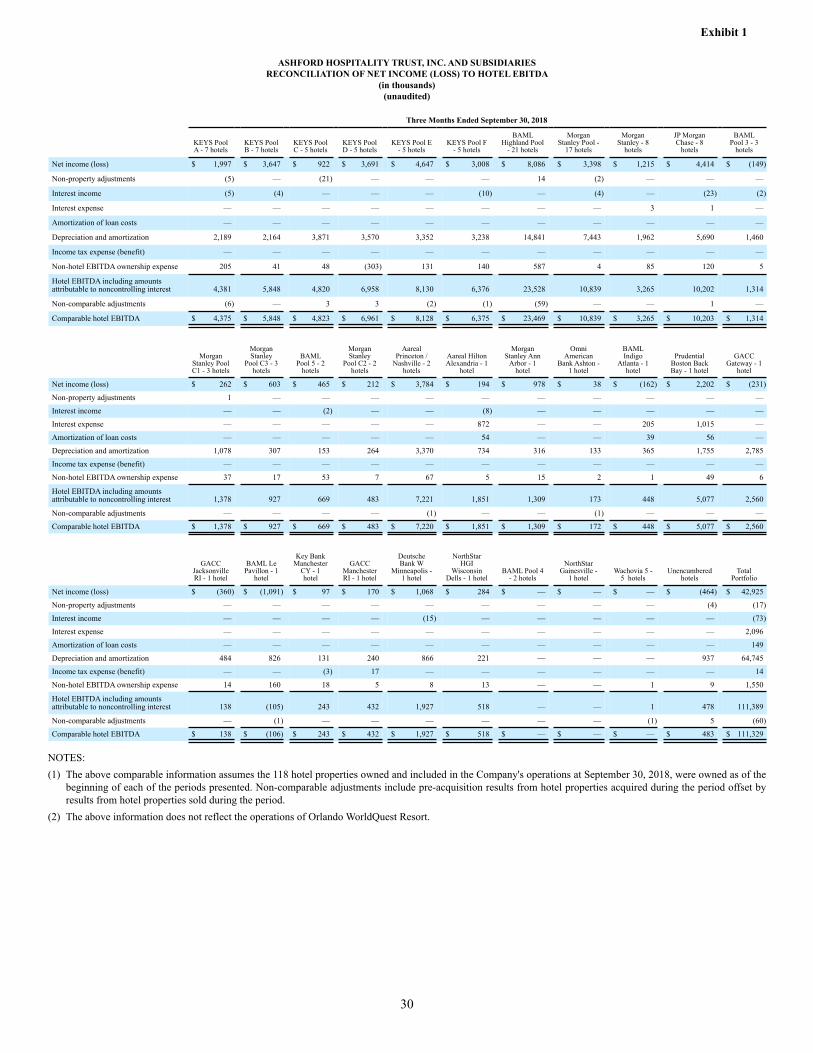
Exhibit 1
30
ASHFORD HOSPITALITY TRUST, INC. AND SUBSIDIARIESRECONCILIATION OF NET INCOME (LOSS) TO HOTEL EBITDA
(in thousands)(unaudited)
Three Months Ended September 30, 2018
KEYS Pool A - 7 hotels
KEYS Pool B - 7 hotels
KEYS Pool C - 5 hotels
KEYS Pool D - 5 hotels
KEYS Pool E - 5 hotels
KEYS Pool F - 5 hotels
BAML Highland Pool
- 21 hotels
Morgan Stanley Pool -
17 hotels
Morgan Stanley - 8
hotels
JP Morgan Chase - 8
hotels
BAML Pool 3 - 3
hotels
Net income (loss) $ 1,997 $ 3,647 $ 922 $ 3,691 $ 4,647 $ 3,008 $ 8,086 $ 3,398 $ 1,215 $ 4,414 $ (149)
Non-property adjustments (5) — (21) — — — 14 (2) — — —
Interest income (5) (4) — — — (10) — (4) — (23) (2)
Interest expense — — — — — — — — 3 1 —
Amortization of loan costs — — — — — — — — — — —
Depreciation and amortization 2,189 2,164 3,871 3,570 3,352 3,238 14,841 7,443 1,962 5,690 1,460
Income tax expense (benefit) — — — — — — — — — — —
Non-hotel EBITDA ownership expense 205 41 48 (303) 131 140 587 4 85 120 5
Hotel EBITDA including amounts attributable to noncontrolling interest 4,381 5,848 4,820 6,958 8,130 6,376 23,528 10,839 3,265 10,202 1,314
Non-comparable adjustments (6) — 3 3 (2) (1) (59) — — 1 —
Comparable hotel EBITDA $ 4,375 $ 5,848 $ 4,823 $ 6,961 $ 8,128 $ 6,375 $ 23,469 $ 10,839 $ 3,265 $ 10,203 $ 1,314
Morgan Stanley Pool C1 - 3 hotels
Morgan Stanley
Pool C3 - 3 hotels
BAML Pool 5 - 2
hotels
Morgan Stanley
Pool C2 - 2 hotels
Aareal Princeton /
Nashville - 2 hotels
Aareal Hilton Alexandria - 1
hotel
Morgan Stanley Ann
Arbor - 1 hotel
Omni American
Bank Ashton - 1 hotel
BAML Indigo
Atlanta - 1 hotel
Prudential Boston Back Bay - 1 hotel
GACC Gateway - 1
hotel
Net income (loss) $ 262 $ 603 $ 465 $ 212 $ 3,784 $ 194 $ 978 $ 38 $ (162) $ 2,202 $ (231)
Non-property adjustments 1 — — — — — — — — — —
Interest income — — (2) — — (8) — — — — —
Interest expense — — — — — 872 — — 205 1,015 —
Amortization of loan costs — — — — — 54 — — 39 56 —
Depreciation and amortization 1,078 307 153 264 3,370 734 316 133 365 1,755 2,785
Income tax expense (benefit) — — — — — — — — — — —
Non-hotel EBITDA ownership expense 37 17 53 7 67 5 15 2 1 49 6
Hotel EBITDA including amounts attributable to noncontrolling interest 1,378 927 669 483 7,221 1,851 1,309 173 448 5,077 2,560
Non-comparable adjustments — — — — (1) — — (1) — — —
Comparable hotel EBITDA $ 1,378 $ 927 $ 669 $ 483 $ 7,220 $ 1,851 $ 1,309 $ 172 $ 448 $ 5,077 $ 2,560
GACC Jacksonville RI - 1 hotel
BAML Le Pavillon - 1
hotel
Key Bank Manchester
CY - 1 hotel
GACC Manchester RI - 1 hotel
Deutsche Bank W
Minneapolis - 1 hotel
NorthStar HGI
Wisconsin Dells - 1 hotel
BAML Pool 4 - 2 hotels
NorthStar Gainesville -
1 hotelWachovia 5 -
5 hotelsUnencumbered
hotelsTotal
Portfolio
Net income (loss) $ (360) $ (1,091) $ 97 $ 170 $ 1,068 $ 284 $ — $ — $ — $ (464) $ 42,925
Non-property adjustments — — — — — — — — — (4) (17)
Interest income — — — — (15) — — — — — (73)
Interest expense — — — — — — — — — — 2,096
Amortization of loan costs — — — — — — — — — — 149
Depreciation and amortization 484 826 131 240 866 221 — — — 937 64,745
Income tax expense (benefit) — — (3) 17 — — — — — — 14
Non-hotel EBITDA ownership expense 14 160 18 5 8 13 — — 1 9 1,550
Hotel EBITDA including amounts attributable to noncontrolling interest 138 (105) 243 432 1,927 518 — — 1 478 111,389
Non-comparable adjustments — (1) — — — — — — (1) 5 (60)
Comparable hotel EBITDA $ 138 $ (106) $ 243 $ 432 $ 1,927 $ 518 $ — $ — $ — $ 483 $ 111,329
NOTES:(1) The above comparable information assumes the 118 hotel properties owned and included in the Company's operations at September 30, 2018, were owned as of the
beginning of each of the periods presented. Non-comparable adjustments include pre-acquisition results from hotel properties acquired during the period offset by results from hotel properties sold during the period.
(2) The above information does not reflect the operations of Orlando WorldQuest Resort.

Exhibit 1
31
ASHFORD HOSPITALITY TRUST, INC. AND SUBSIDIARIESRECONCILIATION OF NET INCOME (LOSS) TO HOTEL EBITDA
(in thousands)(unaudited)
Three Months Ended June 30, 2018
KEYS Pool A - 7 hotels
KEYS Pool B - 7 hotels
KEYS Pool C - 5 hotels
KEYS Pool D - 5 hotels
KEYS Pool E - 5 hotels
KEYS Pool F - 5 hotels
BAML Highland Pool
- 21 hotels
Morgan Stanley Pool -
17 hotels
Morgan Stanley - 8
hotels
JP Morgan Chase - 8
hotels
BAML Pool 3 - 3
hotels
Net income (loss) $ 3,250 $ 3,709 $ 2,920 $ 4,464 $ 3,694 $ 3,397 $ 18,108 $ 6,491 $ 818 $ 7,916 $ 501
Non-property adjustments (13) — — (5) — — (421) 43 — — —
Interest income (6) (3) — — — (7) — (3) — (23) (1)
Interest expense — — — — 473 — — — 3 1 —
Amortization of loan costs — — — — 85 — — — — — —
Depreciation and amortization 2,201 2,196 3,790 3,687 3,419 3,082 14,733 7,610 2,623 5,774 1,415
Income tax expense (benefit) — — — — — — — — — — —
Non-hotel EBITDA ownership expense 27 48 219 169 165 50 439 123 28 207 32
Hotel EBITDA including amounts attributable to noncontrolling interest 5,459 5,950 6,929 8,315 7,836 6,522 32,859 14,264 3,472 13,875 1,947
Non-comparable adjustments (57) (1) (1) (2) 1 — (239) — — — —
Comparable hotel EBITDA $ 5,402 $ 5,949 $ 6,928 $ 8,313 $ 7,837 $ 6,522 $ 32,620 $ 14,264 $ 3,472 $ 13,875 $ 1,947
Morgan Stanley Pool C1 - 3 hotels
Morgan Stanley
Pool C3 - 3 hotels
BAML Pool 5 - 2
hotels
Morgan Stanley
Pool C2 - 2 hotels
Aareal Princeton /
Nashville - 2 hotels
Aareal Hilton Alexandria - 1
hotel
Morgan Stanley Ann
Arbor - 1 hotel
Omni American
Bank Ashton - 1 hotel
BAML Indigo
Atlanta - 1 hotel
Prudential Boston Back Bay - 1 hotel
GACC Gateway - 1
hotel
Net income (loss) $ 1,118 $ 720 $ 578 $ 346 $ 5,709 $ — $ 713 $ 174 $ 114 $ 1,725 $ 1,850
Non-property adjustments — — — — — — — — — — —
Interest income — — (1) (1) — — — — — — —
Interest expense — — — — — — — — 196 961 —
Amortization of loan costs — — — — — — — — 38 55 —
Depreciation and amortization 1,061 321 144 239 3,175 — 295 134 292 1,778 2,790
Income tax expense (benefit) — — — — — — — — — — —
Non-hotel EBITDA ownership expense 32 27 (8) 14 218 — 22 4 29 11 6
Hotel EBITDA including amounts attributable to noncontrolling interest 2,211 1,068 713 598 9,102 — 1,030 312 669 4,530 4,646
Non-comparable adjustments — — — — — 3,093 — — — — —
Comparable hotel EBITDA $ 2,211 $ 1,068 $ 713 $ 598 $ 9,102 $ 3,093 $ 1,030 $ 312 $ 669 $ 4,530 $ 4,646
GACC Jacksonville RI - 1 hotel
BAML Le Pavillon - 1
hotel
Key Bank Manchester
CY - 1 hotel
GACC Manchester RI - 1 hotel
Deutsche Bank W
Minneapolis - 1 hotel
NorthStar HGI
Wisconsin Dells - 1 hotel
BAML Pool 4 - 2 hotels
NorthStar Gainesville -
1 hotelWachovia 5 -
5 hotelsUnencumbered
hotelsTotal
Portfolio
Net income (loss) $ (796) $ (193) $ 138 $ 202 $ 1,058 $ 17 $ — $ — $ (1) $ 122 $ 68,862
Non-property adjustments 2 — — — — — — — — — (394)
Interest income — — — — (13) — — — — — (58)
Interest expense — — — — — — — — — — 1,634
Amortization of loan costs — — — — — — — — — — 178
Depreciation and amortization 459 776 130 239 853 216 — — — 953 64,385
Income tax expense (benefit) — — 3 6 — — — — — — 9
Non-hotel EBITDA ownership expense (1) 226 2 1 74 3 — — — 9 2,176
Hotel EBITDA including amounts attributable to noncontrolling interest (336) 809 273 448 1,972 236 — — (1) 1,084 136,792
Non-comparable adjustments — — — — — — — — 1 — 2,795
Comparable hotel EBITDA $ (336) $ 809 $ 273 $ 448 $ 1,972 $ 236 $ — $ — $ — $ 1,084 $ 139,587
NOTES:(1) The above comparable information assumes the 118 hotel properties owned and included in the Company's operations at September 30, 2018, were owned as of the
beginning of each of the periods presented. Non-comparable adjustments include pre-acquisition results from hotel properties acquired during the period offset by results from hotel properties sold during the period.
(2) The above information does not reflect the operations of Orlando WorldQuest Resort.

Exhibit 1
32
ASHFORD HOSPITALITY TRUST, INC. AND SUBSIDIARIESRECONCILIATION OF NET INCOME (LOSS) TO HOTEL EBITDA
(in thousands)(unaudited)
Three Months Ended March 31, 2018
KEYS Pool A - 7 hotels
KEYS Pool B - 7 hotels
KEYS Pool C - 5 hotels
KEYS Pool D - 5 hotels
KEYS Pool E - 5 hotels
KEYS Pool F - 5 hotels
BAML Highland Pool
- 21 hotels
Morgan Stanley Pool -
17 hotels
Morgan Stanley - 8
hotels
JP Morgan Chase - 8
hotels
BAML Pool 3 - 3
hotels
Net income (loss) $ 2,554 $ 2,506 $ 3,314 $ 3,324 $ 132 $ 2,693 $ 9,898 $ 6,597 $ (248) $ 4,834 $ 883
Non-property adjustments 1,971 — (39) 46 (6) — (39) (146) — (20) (17)
Interest income (1) (1) — — — (3) — (1) — (14) —
Interest expense — — — — 544 — — — 3 1 —
Amortization of loan costs — — — — 19 — — — — — —
Depreciation and amortization 2,201 2,197 3,692 3,671 3,248 2,954 14,917 7,348 2,690 5,615 1,342
Income tax expense (benefit) (1) — — — — — — — — — —
Non-hotel EBITDA ownership expense 72 166 486 (12) 418 55 460 500 100 31 (14)
Hotel EBITDA including amounts attributable to noncontrolling interest 6,796 4,868 7,453 7,029 4,355 5,699 25,236 14,298 2,545 10,447 2,194
Non-comparable adjustments 14 — (2) — 1 1 (804) — — — —
Comparable hotel EBITDA $ 6,810 $ 4,868 $ 7,451 $ 7,029 $ 4,356 $ 5,700 $ 24,432 $ 14,298 $ 2,545 $ 10,447 $ 2,194
Morgan Stanley Pool C1 - 3 hotels
Morgan Stanley
Pool C3 - 3 hotels
BAML Pool 5 - 2
hotels
Morgan Stanley
Pool C2 - 2 hotels
Aareal Princeton /
Nashville - 2 hotels
Aareal Hilton Alexandria - 1
hotel
Morgan Stanley Ann
Arbor - 1 hotel
Omni American
Bank Ashton - 1 hotel
BAML Indigo
Atlanta - 1 hotel
Prudential Boston Back Bay - 1 hotel
GACC Gateway - 1
hotel
Net income (loss) $ 2,002 $ 384 $ 374 $ 209 $ 2,582 $ — $ 125 $ 173 $ 63 $ (1,564) $ 32
Non-property adjustments (41) — — — — — — — — — —
Interest income — — — — — — — — — — —
Interest expense — — — — — — — — 181 871 —
Amortization of loan costs — — — — — — — — 38 55 —
Depreciation and amortization 1,056 314 144 258 2,813 — 288 128 222 1,567 2,774
Income tax expense (benefit) — — — — — — — — — — —
Non-hotel EBITDA ownership expense (136) 25 44 8 (388) — 6 2 85 58 5
Hotel EBITDA including amounts attributable to noncontrolling interest 2,881 723 562 475 5,007 — 419 303 589 987 2,811
Non-comparable adjustments — — — — — 1,760 — — — — —
Comparable hotel EBITDA $ 2,881 $ 723 $ 562 $ 475 $ 5,007 $ 1,760 $ 419 $ 303 $ 589 $ 987 $ 2,811
GACC Jacksonville RI - 1 hotel
BAML Le Pavillon - 1
hotel
Key Bank Manchester
CY - 1 hotel
GACC Manchester RI - 1 hotel
Deutsche Bank W
Minneapolis - 1 hotel
NorthStar HGI
Wisconsin Dells - 1 hotel
BAML Pool 4 - 2 hotels
NorthStar Gainesville -
1 hotelWachovia 5 -
5 hotelsUnencumbered
hotelsTotal
Portfolio
Net income (loss) $ (256) $ 16 $ 7 $ (53) $ 413 $ (51) $ — $ — $ — $ (632) $ 40,311
Non-property adjustments (40) — — — — — — — — — 1,669
Interest income — — — — (10) — — — — — (30)
Interest expense — — — — — — — — — — 1,600
Amortization of loan costs — — — — — — — — — — 112
Depreciation and amortization 368 719 130 238 850 216 — — — 909 62,869
Income tax expense (benefit) — — — 1 — — — — — — —
Non-hotel EBITDA ownership expense (21) 167 1 — 10 4 — — — (49) 2,083
Hotel EBITDA including amounts attributable to noncontrolling interest 51 902 138 186 1,263 169 — — — 228 108,614
Non-comparable adjustments — — — — — — — — — — 970
Comparable hotel EBITDA $ 51 $ 902 $ 138 $ 186 $ 1,263 $ 169 $ — $ — $ — $ 228 $ 109,584
NOTES:(1) The above comparable information assumes the 118 hotel properties owned and included in the Company's operations at September 30, 2018, were owned as of the
beginning of each of the periods presented. Non-comparable adjustments include pre-acquisition results from hotel properties acquired during the period offset by results from hotel properties sold during the period.
(2) The above information does not reflect the operations of Orlando WorldQuest Resort.

Exhibit 1
33
ASHFORD HOSPITALITY TRUST, INC. AND SUBSIDIARIESRECONCILIATION OF NET INCOME (LOSS) TO HOTEL EBITDA
(in thousands)(unaudited)
Three Months Ended December 31, 2017
KEYS Pool A - 7 hotels
KEYS Pool B - 7 hotels
KEYS Pool C - 5 hotels
KEYS Pool D - 5 hotels
KEYS Pool E - 5 hotels
KEYS Pool F - 5 hotels
BAML Highland Pool
- 21 hotels
Morgan Stanley Pool -
17 hotels
Morgan Stanley - 8
hotels
JP Morgan Chase - 8
hotels
BAML Pool 3 - 3
hotels
Net income (loss) $ (5,710) $ 2,576 $ 2,110 $ 2,470 $ 120 $ 2,910 $ 9,736 $ 4,239 $ (313) $ 5,264 $ 69
Non-property adjustments 8,182 (75) — 31 — — 101 (27) — (9) —
Interest income (5) (1) — — — (2) — — — (14) 1
Interest expense (1) — — — 531 — — — 3 1 —
Amortization of loan costs — — — — — — — — — — —
Depreciation and amortization 2,515 2,201 3,574 3,668 3,099 2,841 14,543 7,197 2,658 5,386 1,313
Income tax expense (benefit) 15 63 — — — — — — — — —
Non-hotel EBITDA ownership expense 162 78 212 (11) 265 147 1,080 (66) 169 307 49
Hotel EBITDA including amounts attributable to noncontrolling interest 5,158 4,842 5,896 6,158 4,015 5,896 25,460 11,343 2,517 10,935 1,432
Non-comparable adjustments (377) (70) (45) (81) (102) (12) (582) (142) (14) (81) —
Comparable hotel EBITDA $ 4,781 $ 4,772 $ 5,851 $ 6,077 $ 3,913 $ 5,884 $ 24,878 $ 11,201 $ 2,503 $ 10,854 $ 1,432
Morgan Stanley Pool C1 - 3 hotels
Morgan Stanley
Pool C3 - 3 hotels
BAML Pool 5 - 2
hotels
Morgan Stanley
Pool C2 - 2 hotels
Aareal Princeton /
Nashville - 2 hotels
Aareal Hilton Alexandria - 1
hotel
Morgan Stanley Ann
Arbor - 1 hotel
Omni American
Bank Ashton - 1 hotel
BAML Indigo
Atlanta - 1 hotel
Prudential Boston Back Bay - 1 hotel
GACC Gateway - 1
hotel
Net income (loss) $ 1,080 $ 564 $ 497 $ 86 $ 3,737 $ — $ 684 $ 217 $ 166 $ 992 $ 1,803
Non-property adjustments — — — — — — — — — — —
Interest income — — (2) — — — — — — — —
Interest expense — — — — — — — — 173 551 —
Amortization of loan costs — — — — — — — — 37 36 —
Depreciation and amortization 1,067 320 141 178 2,360 — 285 127 240 1,505 2,700
Income tax expense (benefit) — — — — — — — — — — —
Non-hotel EBITDA ownership expense 85 21 4 19 34 — 14 3 9 91 (326)
Hotel EBITDA including amounts attributable to noncontrolling interest 2,232 905 640 283 6,131 — 983 347 625 3,175 4,177
Non-comparable adjustments (16) — — (7) (30) 2,158 (10) (3) (2) (21) —
Comparable hotel EBITDA $ 2,216 $ 905 $ 640 $ 276 $ 6,101 $ 2,158 $ 973 $ 344 $ 623 $ 3,154 $ 4,177
GACC Jacksonville RI - 1 hotel
BAML Le Pavillon - 1
hotel
Key Bank Manchester
CY - 1 hotel
GACC Manchester RI - 1 hotel
Deutsche Bank W
Minneapolis - 1 hotel
NorthStar HGI
Wisconsin Dells - 1 hotel
BAML Pool 4 - 2 hotels
NorthStar Gainesville -
1 hotelWachovia 5 -
5 hotelsUnencumbered
hotelsTotal
Portfolio
Net income (loss) $ 116 $ (12) $ 88 $ 8 $ 198 $ (225) $ (13) $ (10) $ (43) $ (302) $ 33,102
Non-property adjustments — — — — — — — — — 43 8,246
Interest income — — — — (8) — — — — 3 (28)
Interest expense — — — — — — — — — — 1,258
Amortization of loan costs — — — — — — — — — — 73
Depreciation and amortization 285 698 137 234 852 214 — — — 844 61,182
Income tax expense (benefit) — — 57 39 — — — — — (1) 173
Non-hotel EBITDA ownership expense 63 179 2 2 3 47 12 10 43 (83) 2,624
Hotel EBITDA including amounts attributable to noncontrolling interest 464 865 284 283 1,045 36 (1) — — 504 106,630
Non-comparable adjustments — (37) — — — (1) 1 — — (32) 494
Comparable hotel EBITDA $ 464 $ 828 $ 284 $ 283 $ 1,045 $ 35 $ — $ — $ — $ 472 $ 107,124
NOTES:(1) The above comparable information assumes the 118 hotel properties owned and included in the Company's operations at September 30, 2018, were owned as of the
beginning of each of the periods presented. Non-comparable adjustments include pre-acquisition results from hotel properties acquired during the period offset by results from hotel properties sold during the period.
(2) The above information does not reflect the operations of Orlando WorldQuest Resort.