ASAS-SN Bright SN Catalog 2015 - arXiv · ASAS-SN Bright SN Catalog 2015 3 Finally, in x4, we...
13
ASAS-SN Bright SN Catalog 2015 1 The ASAS-SN Bright Supernova Catalog – II. 2015 T. W.-S. Holoien 1,2,3? , J. S. Brown 1 , K. Z. Stanek 1,2 , C. S. Kochanek 1,2 , B. J. Shappee 4,5 , J. L. Prieto 6,7 , Subo Dong 8 , J. Brimacombe 9 , D. W. Bishop 10 , U. Basu 1,11 , J. F. Beacom 1,2,12 , D. Bersier 13 , Ping Chen 8 , A. B. Danilet 12 , E. Falco 14 , D. Godoy-Rivera 1 , N. Goss 1 , G. Pojmanski 15 , G. V. Simonian 1 , D. M. Skowron 15 , Todd A. Thompson 1,2 , P. R. Wo´ zniak 16 , C. G. ´ Avila 17 , G. Bock 18 , J.-L. G. Carballo 19 , E. Conseil 20 , C. Contreras 17 , I. Cruz 21 , J. M. F. And´ ujar 22 , Zhen Guo 8,23 , E. Y. Hsiao 24 , S. Kiyota 25 , R. A. Koff 26 , G. Krannich 27 , B. F. Madore 4 , P. Marples 28 , G. Masi 29 , N. Morrell 17 , L. A. G. Monard 30 , J. C. Munoz-Mateos 31 , B. Nicholls 32 , J. Nicolas 33 , R. M. Wagner 1,34 , and W. S. Wiethoff 35 1 Department of Astronomy, The Ohio State University, 140 West 18th Avenue, Columbus, OH 43210, USA 2 Center for Cosmology and AstroParticle Physics (CCAPP), The Ohio State University, 191 W. Woodruff Ave., Columbus, OH 43210, USA 3 US Department of Energy Computational Science Graduate Fellow 4 Carnegie Observatories, 813 Santa Barbara Street, Pasadena, CA 91101, USA 5 Hubble and Carnegie-Princeton Fellow 6 N´ ucleo de Astronom´ ıa de la Facultad de Ingenier´ ıa, Universidad Diego Portales, Av. Ej´ ercito 441, Santiago, Chile 7 Millennium Institute of Astrophysics, Santiago, Chile 8 Kavli Institute for Astronomy and Astrophysics, Peking University, Yi He Yuan Road 5, Hai Dian District, Beijing 100871, China 9 Coral Towers Observatory, Cairns, Queensland 4870, Australia 10 Rochester Academy of Science, 1194 West Avenue, Hilton, NY, 14468, USA 11 Grove City High School, 4665 Hoover Road, Grove City, OH 43123, USA 12 Department of Physics, The Ohio State University, 191 W. Woodruff Ave., Columbus, OH 43210, USA 13 Astrophysics Research Institute, Liverpool John Moores University, 146 Brownlow Hill, Liverpool L3 5RF, UK 14 Harvard-Smithsonian Center for Astrophysics, 60 Garden St., Cambridge, MA 02138, USA 15 Warsaw University Astronomical Observatory, Al. Ujazdowskie 4, 00-478 Warsaw, Poland 16 Los Alamos National Laboratory, Mail Stop B244, Los Alamos, NM 87545, USA 17 Las Campanas Observatory, Carnegie Observatories, Casilla 601, La Serena, Chile 18 Runaway Bay Observatory, 1 Lee Road, Runaway Bay, Queensland 4216, Australia 19 Observatorio Cerro del Viento, MPC I84, Pl. Fernandez Pirfano 3-5A, 06010 Badajoz, Spain 20 Association Francaise des Observateurs d’Etoiles Variables (AFOEV), Observatoire de Strasbourg, 11 Rue de l’Universite, 67000 Strasbourg, France 21 Cruz Observatory, 1971 Haverton Drive, Reynoldsburg, OH, 43068, USA 22 Observatory Inmaculada del Molino, Hernando de Esturmio 46, Osuna, 41640 Sevilla, Spain 23 Department of Astronomy, Peking University, Yi He Yuan Road 5, Hai Dian District, Beijing 100871, China 24 Department of Physics, Florida State University, 77 Chieftain Way, Tallahassee, FL, 32306, USA 25 Variable Star Observers League in Japan, 7-1 Kitahatsutomi, Kamagaya, Chiba 273-0126, Japan 26 Antelope Hills Observatory, 980 Antelope Drive West, Bennett, CO, 80102, USA 27 Roof Observatory Kaufering, Lessingstr. 16, D-86916 Kaufering, Germany 28 Leyburn & Loganholme Observatories, 45 Kiewa Drive, Loganholme, Queensland 4129, Australia 29 Virtual Telescope Project, Via Madonna de Loco, 47-03023 Ceccano (FR), Italy 30 Kleinkaroo Observatory, Calitzdorp, St. Helena 1B, P.O. Box 281, 6660 Calitzdorp, Western Cape, South Africa 31 European Southern Observatory, Casilla 19001, Santiago, Chile 32 Mount Vernon Observatory, 6 Mount Vernon Place, Nelson, New Zealand 33 Groupe SNAude France, 364 Chemin de Notre Dame, 06220 Vallauris, France 34 LBT Observatory, University of Arizona, Tucson, AZ 85721-0065 USA 35 Department of Earth and Environmental Sciences, University of Minnesota, 230 Heller Hall, 1114 Kirby Drive, Duluth, MN. 55812, USA 10 February 2017 MNRAS 000, 000–000 (0000) arXiv:1610.03061v2 [astro-ph.HE] 9 Feb 2017
-
Upload
truongtruc -
Category
Documents
-
view
220 -
download
0
Transcript of ASAS-SN Bright SN Catalog 2015 - arXiv · ASAS-SN Bright SN Catalog 2015 3 Finally, in x4, we...

ASAS-SN Bright SN Catalog 2015 1
The ASAS-SN Bright Supernova Catalog – II. 2015
T. W.-S. Holoien1,2,3?, J. S. Brown1, K. Z. Stanek1,2, C. S. Kochanek1,2,B. J. Shappee4,5, J. L. Prieto6,7, Subo Dong8, J. Brimacombe9, D. W. Bishop10,U. Basu1,11, J. F. Beacom1,2,12, D. Bersier13, Ping Chen8, A. B. Danilet12,E. Falco14, D. Godoy-Rivera1, N. Goss1, G. Pojmanski15, G. V. Simonian1,
D. M. Skowron15, Todd A. Thompson1,2, P. R. Wozniak16, C. G. Avila17,G. Bock18, J.-L. G. Carballo19, E. Conseil20, C. Contreras17, I. Cruz21,J. M. F. Andujar22, Zhen Guo8,23, E. Y. Hsiao24, S. Kiyota25, R. A. Koff26,G. Krannich27, B. F. Madore4, P. Marples28, G. Masi29, N. Morrell17,L. A. G. Monard30, J. C. Munoz-Mateos31, B. Nicholls32, J. Nicolas33,R. M. Wagner1,34, and W. S. Wiethoff35
1 Department of Astronomy, The Ohio State University, 140 West 18th Avenue, Columbus, OH 43210, USA2 Center for Cosmology and AstroParticle Physics (CCAPP), The Ohio State University, 191 W. Woodruff Ave.,
Columbus, OH 43210, USA3 US Department of Energy Computational Science Graduate Fellow4 Carnegie Observatories, 813 Santa Barbara Street, Pasadena, CA 91101, USA5 Hubble and Carnegie-Princeton Fellow6 Nucleo de Astronomıa de la Facultad de Ingenierıa, Universidad Diego Portales, Av. Ejercito 441, Santiago, Chile7 Millennium Institute of Astrophysics, Santiago, Chile8 Kavli Institute for Astronomy and Astrophysics, Peking University, Yi He Yuan Road 5, Hai Dian District,
Beijing 100871, China9 Coral Towers Observatory, Cairns, Queensland 4870, Australia10 Rochester Academy of Science, 1194 West Avenue, Hilton, NY, 14468, USA11 Grove City High School, 4665 Hoover Road, Grove City, OH 43123, USA12 Department of Physics, The Ohio State University, 191 W. Woodruff Ave., Columbus, OH 43210, USA13 Astrophysics Research Institute, Liverpool John Moores University, 146 Brownlow Hill, Liverpool L3 5RF, UK14 Harvard-Smithsonian Center for Astrophysics, 60 Garden St., Cambridge, MA 02138, USA15 Warsaw University Astronomical Observatory, Al. Ujazdowskie 4, 00-478 Warsaw, Poland16 Los Alamos National Laboratory, Mail Stop B244, Los Alamos, NM 87545, USA17 Las Campanas Observatory, Carnegie Observatories, Casilla 601, La Serena, Chile18 Runaway Bay Observatory, 1 Lee Road, Runaway Bay, Queensland 4216, Australia19 Observatorio Cerro del Viento, MPC I84, Pl. Fernandez Pirfano 3-5A, 06010 Badajoz, Spain20 Association Francaise des Observateurs d’Etoiles Variables (AFOEV), Observatoire de Strasbourg, 11 Rue de l’Universite,
67000 Strasbourg, France21 Cruz Observatory, 1971 Haverton Drive, Reynoldsburg, OH, 43068, USA22 Observatory Inmaculada del Molino, Hernando de Esturmio 46, Osuna, 41640 Sevilla, Spain23 Department of Astronomy, Peking University, Yi He Yuan Road 5, Hai Dian District, Beijing 100871, China24 Department of Physics, Florida State University, 77 Chieftain Way, Tallahassee, FL, 32306, USA25 Variable Star Observers League in Japan, 7-1 Kitahatsutomi, Kamagaya, Chiba 273-0126, Japan26 Antelope Hills Observatory, 980 Antelope Drive West, Bennett, CO, 80102, USA27 Roof Observatory Kaufering, Lessingstr. 16, D-86916 Kaufering, Germany28 Leyburn & Loganholme Observatories, 45 Kiewa Drive, Loganholme, Queensland 4129, Australia29 Virtual Telescope Project, Via Madonna de Loco, 47-03023 Ceccano (FR), Italy30 Kleinkaroo Observatory, Calitzdorp, St. Helena 1B, P.O. Box 281, 6660 Calitzdorp, Western Cape, South Africa31 European Southern Observatory, Casilla 19001, Santiago, Chile32 Mount Vernon Observatory, 6 Mount Vernon Place, Nelson, New Zealand33 Groupe SNAude France, 364 Chemin de Notre Dame, 06220 Vallauris, France34 LBT Observatory, University of Arizona, Tucson, AZ 85721-0065 USA35 Department of Earth and Environmental Sciences, University of Minnesota, 230 Heller Hall, 1114 Kirby Drive,
Duluth, MN. 55812, USA
10 February 2017
MNRAS 000, 000–000 (0000)
arX
iv:1
610.
0306
1v2
[as
tro-
ph.H
E]
9 F
eb 2
017

MNRAS 000, 000–000 (0000) Preprint 10 February 2017 Compiled using MNRAS LATEX style file v3.0
ABSTRACTThis manuscript presents information for all supernovae discovered by the All-SkyAutomated Survey for SuperNovae (ASAS-SN) during 2015, its second full year of op-erations. The same information is presented for bright (mV 6 17), spectroscopicallyconfirmed supernovae discovered by other sources in 2015. As with the first ASAS-SNbright supernova catalog, we also present redshifts and near-UV through IR magni-tudes for all supernova host galaxies in both samples. Combined with our previouscatalog, this work comprises a complete catalog of 455 supernovae from multiple pro-fessional and amateur sources, allowing for population studies that were previouslyimpossible. This is the second of a series of yearly papers on bright supernovae andtheir hosts from the ASAS-SN team.
Key words: supernovae, general — catalogues — surveys
1 INTRODUCTION
In recent decades, systematic searches for supernovae haveprogressed into the era of large projects that survey some orall of the sky for supernovae and other transient phenomenausing varying degrees of automation. These projects includethe Lick Observatory Supernova Search (LOSS; Li et al.2000), the Panoramic Survey Telescope & Rapid ResponseSystem (Pan-STARRRS; Chambers et al. 2016), the TexasSupernova Search (Quimby 2006), the Sloan Digital Sky Sur-vey (SDSS) Supernova Survey (Frieman et al. 2008), theCatalina Real-Time Transient Survey (CRTS; Drake et al.2009), the CHilean Automatic Supernova sEarch (CHASE;Pignata et al. 2009), the Palomar Transient Factory (PTF;Law et al. 2009), the Gaia transient survey (Hodgkin et al.2013), the La Silla-QUEST (LSQ) Low Redshift SupernovaSurvey (Baltay et al. 2013), the Mobile Astronomical Systemof TElescope Robots (MASTER; Gorbovskoy et al. 2013)survey, the Optical Gravitational Lensing Experiment-IV(OGLE-IV; Wyrzykowski et al. 2014), and, recently, the As-teroid Terrestrial-impact Last Alert System (ATLAS; Tonry2011), among numerous others.
Prior to 2013, however, there was no rapid-cadence op-tical survey that surveyed the entire visible night sky tofind the bright, nearby supernovae that can be studied mostcomprehensively, and thus have the largest impact on ourunderstanding of supernova physics. This changed with thecreation of the All-Sky Automated Survey for SuperNovae(ASAS-SN1; Shappee et al. 2014), a long-term project de-signed to find bright transients, such as nearby supernovae(e.g., Dong et al. 2016; Holoien et al. 2016b; Shappee et al.2016), tidal disruption events (Holoien et al. 2014a; Brownet al. 2016b,a; Holoien et al. 2016d,c), flares in active galacticnuclei (Shappee et al. 2014), stellar outbursts (Holoien et al.2014b; Schmidt et al. 2014; Herczeg et al. 2016; Schmidtet al. 2016), and cataclysmic variable stars (Kato et al.2014a,b, 2015, 2016).
ASAS-SN accomplishes this using 8 telescopes with 14-cm aperture lenses and standard V -band filters which havea 4.5 × 4.5 degree field-of-view and a limiting magnitudeof mV ∼ 17 (see Shappee et al. (2014) for further techni-cal details). The ASAS-SN telescopes are divided into twounits, each consisting of four telescopes on a common mount
? [email protected] http://www.astronomy.ohio-state.edu/~assassin/
hosted by the Las Cumbres Observatory Global TelescopeNetwork (LCOGT; Brown et al. 2013). Our northern unit,Brutus, is hosted at the LCOGT site on Mount Haleakalain Hawaii, while our southern unit, Cassius, is hosted at theLCOGT site at Cerro Tololo, Chile. These two units give usroughly 20000 square degrees of coverage per clear night,and we cover the entire observable sky (∼ 30000 squaredegrees on a given night) with a 2 − 3 day cadence. Alldata are processed and automatically searched in real-time,which allows for rapid discovery and response, and discover-ies are announced publicly, sometimes within a few hours ofdata collection. For a more detailed history of the ASAS-SNproject, see the introduction of Holoien et al. (2016a).
Though some professional surveys have more numerousdiscoveries, all transients discovered by ASAS-SN are brightand relatively nearby, which allows them to be observed overwide wavelength ranges and long time baselines using fairlymodest resources. Spectra of ASAS-SN discoveries are ofteneasily obtainable with a 1-m telescope, and all ASAS-SNsupernovae have been spectroscopically confirmed and clas-sified. ASAS-SN also uses an untargeted survey approach,which allows us to provide a less biased tool than other sur-veys for studying the populations of nearby supernovae andtheir host galaxies.
This manuscript is the second of a series of yearly cat-alogs provided by the ASAS-SN team and presents the col-lected information on supernovae discovered by ASAS-SN in2015 and their host galaxies. As was done in our 2013 and2014 catalog (Holoien et al. 2016a), we provide the sameinformation for bright supernovae, defined as those withmpeak 6 17, discovered by other professional surveys andamateur astronomers in 2015 in order to construct a fullsample of bright supernovae discovered in 2015. The anal-yses and information presented here supersedes our discov-ery and classification Astronomer’s Telegrams (ATels), all ofwhich are cited in this manuscript, and the information pub-licly available on the ASAS-SN web pages. We also exam-ine simple statistical properties of the combined supernovaesample from this manuscript and from Holoien et al. (2016a).Throughout our analyses, we assume a standard ΛCDM cos-mology with H0 = 69.3 km s−1 Mpc−1, ΩM = 0.29, andΩΛ = 0.71 for converting host redshifts into distances.
In §2 we detail the sources of the information presentedin this manuscript. In §3, we give statistics on the supernovaeand hosts in the full, cumulative sample, provide analyses ofthe data, and discuss the overall trends seen in the sample.
c© 0000 The Authors
ASAS-SN Bright SN Catalog 2015 3
Finally, in §4, we conclude with remarks about the overallfindings and look at how future ASAS-SN catalogs will bean integral tool in nearby supernova rate calculations thatwill be done by the ASAS-SN team.
2 DATA SAMPLES
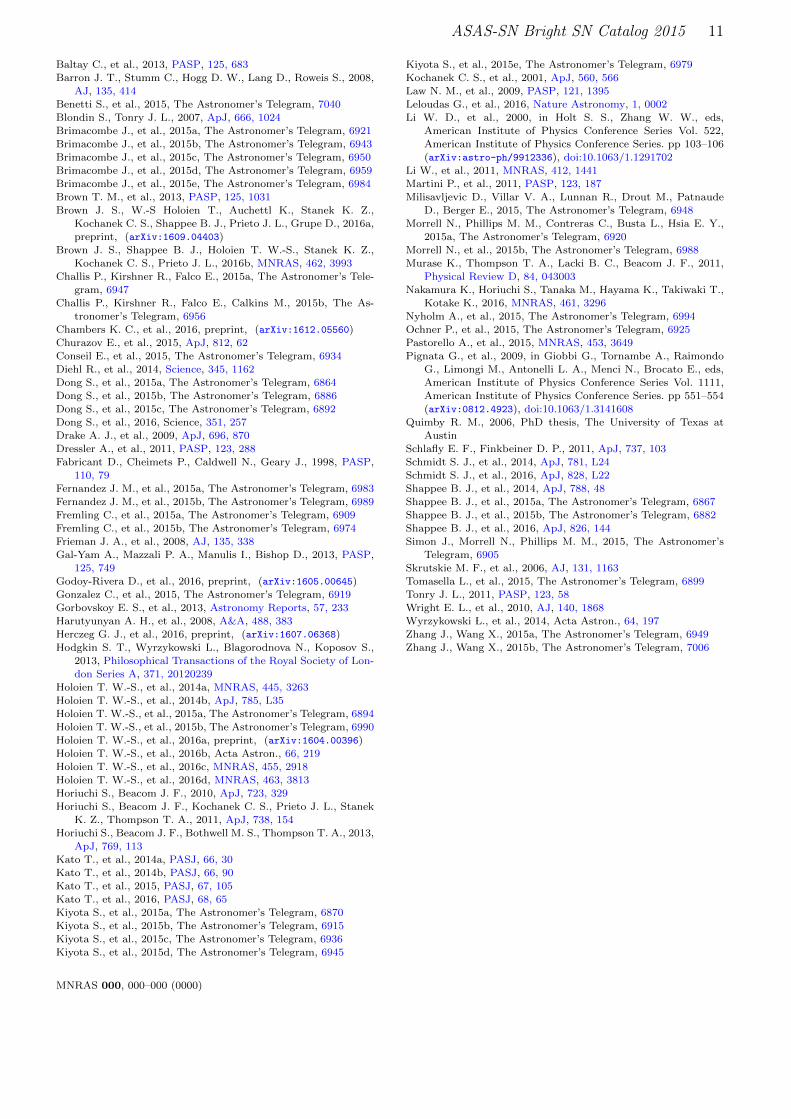
Here we describe the sources of the data collected for oursupernova and host galaxy samples, which are presented inTables 1, 2, 3, and 4.
2.1 The ASAS-SN Supernova Sample
The ASAS-SN supernova sample is listed in Table 1 andincludes all supernovae discovered by ASAS-SN between2015 January 1 and 2015 December 31. As in Holoienet al. (2016a), we collected the names, discovery dates, hostnames, and host offsets for ASAS-SN discoveries from ourdiscovery Astronomer’s Telegrams (ATels), which are citedin Table 1. IAU names are also listed for those supernovaethat had one assigned. As we note in our ATels, we view theASAS-SN names as having priority due to the failure of theIAU system to provide proper credit to the discovery team.We use the IAU system only to avoid temporal reportingconflicts, and encourage others to refer to our discoveries bytheir ASAS-SN designations.
Redshifts have been spectroscopically measured fromclassification spectra in all cases. For cases where a redshifthad been previously measured for a supernova host galaxyand is consistent with the transient redshift, we list the red-shift of the host obtained from the NASA/IPAC Extragalac-tic Database (NED)2. For cases where the measurements arenot consistent or where a host redshift was not available, wetypically report the redshifts given in the classification tele-grams.
Supernova classifications are taken from classificationtelegrams, which we have also cited in Table 1. For thosesupernovae that had best-fit ages reported in their classi-fications, we also give the approximate ages at discovery,measured in days relative to peak. Supernovae were typi-cally classified using either the Supernova Identification code(SNID; Blondin & Tonry 2007) or the Generic ClassificationTool (GELATO3; Harutyunyan et al. 2008), both of whichcompare the observed input spectra to template spectra inorder to estimate the best supernova type and age match.
Two supernovae, ASASSN-15da and ASASSN-15hx,never had a redshift announced publicly, and we report red-shift measurements here. Using the classification spectrumtaken with the Ohio State Multi-Object Spectrograph (OS-MOS; Martini et al. 2011) mounted on the MDM Obser-vatory Hiltner 2.4-m telescope we measured a redshift of0.048 ± 0.003 for ASASSN-15da using SNID. We measureda redshift of 0.0081 for ASASSN-15hx using the host-galaxyHα line detected in a nebular spectrum obtained on 2016March 11 with the Inamori Magellan Areal Camera andSpectrograph (IMACS; Dressler et al. 2011) mounted on the
2 https://ned.ipac.caltech.edu/3 gelato.tng.iac.es
Magellan-Baade 6.5-m telescope at Las Campanas Observa-tory.
Based on checking archival classification and late-timespectra of the 2015 ASAS-SN supernova discoveries, wealso update a number of redshifts and classifications fromthe values reported in the discovery and classificationtelegrams. ASASSN-15al, ASASSN-15az, ASASSN-15bm,ASASSN-15bo, ASASSN-15jm, ASASSN-15lo, ASASSN-15mg, ASASSN-15mx, ASASSN-15nx, ASASSN-15ou,ASASSN-15rg, ASASSN-15sh, ASASSN-15um, ASASSN-15uo, ASASSN-15up, and ASASSN-15ug have updatedredshifts that have been remeasured from supernova orhost spectra obtained with OSMOS on the MDM 2.4-mtelescope, IMACS on the Magellan-Baade 6.5-m telescope,the FAst Spectrograph for the Tillinghast Telescope (FAST;Fabricant et al. 1998), and the Wide Field Reimaging CCDCamera (WFCCD) mounted on the 2.5-m du Pont telescopeat Las Campanas Observatory. Based on a re-examinationof the classification spectra, we have updated the classi-fications of ASASSN-15fa, ASASSN-15fr, ASASSN-15fs,ASASSN-15ga, ASASSN-15hy, ASASSN-15jm, ASASSN-15kg, ASASSN-15kj, ASASSN-15mi, ASASSN-15og,ASASSN-15ou, ASASSN-15tg, ASASSN-15um, ASASSN-15uo, ASASSN-15us, and ASASSN-15ut. We also reportan updated redshift for ASASSN-15ed from Pastorelloet al. (2015) and an updated redshift and classification ofASASSN-15no from Benetti et al. (in preparation). Theseredshifts and classifications are reported in Table 1.
For all ASAS-SN supernovae we solved the astrometryin follow-up images using astrometry.net (Barron et al. 2008)and measured a centroid position for the supernova usingIRAF, which typically yielded errors of <1.′′0 in position.This is significantly more accurate than measuring the co-ordinates directly from ASAS-SN images, which have a 7.′′0pixel scale. Follow-up images used to measure astrometrywere obtained using the LCOGT 1-m telescopes at McDon-ald Observatory, Cerro Tololo Inter-American Observatory,Siding Springs Observatory, and the South African Astro-nomical Observatory (Brown et al. 2013); OSMOS mountedon the MDM Hiltner 2.4-m telescope; the Las CampanasObservatory Swope 1-m telescope; IMACS mounted on theMagellan-Baade 6.5-m telescope; or from amateur collabo-rators working with the ASAS-SN team. In most cases, wereported coordinates measured from follow-up images in ourdiscovery telegrams, but we report new, more accurate coor-dinates in Table 1 for supernovae that were announced withcoordinates measured from ASAS-SN data.
We have re-measured V -band, host-subtracted discov-ery and peak magnitudes from ASAS-SN data for all ASAS-SN supernova discoveries, and report these magnitudes inTable 1. In some cases, re-reductions of the ASAS-SN datahave resulted in differences between the magnitudes given inTable 1 and those in the original discovery ATels. Here, the“discovery magnitude” is defined as the magnitude on theannounced discovery date. We also performed a parabolicfit to the measured magnitudes for cases with enough de-tections, and we use the brighter value between the peak ofthe fit and the brightest measured magnitude as the “peakmagnitude” reported in Table 1. For cases with too few de-tections for a parabolic fit, we use the brightest measuredmagnitude as the peak magnitude.
One supernova, ASASSN-15kn, was announced by
MNRAS 000, 000–000 (0000)
4 T. W.-S. Holoien et al.
ASAS-SN in an ATel and was later announced by theItalian Supernovae Search Project4 in a the Central Bu-reau for Astronomical Telegram (CBAT) with the namePSNJ12415045-0710122. The ISSP discovery image was ob-tained prior to the ASAS-SN discovery image, but since weannounced it first, we list it as an ASAS-SN discovery withits ASAS-SN name in Table 1.
All supernovae discovered by ASAS-SN in 2015 are in-cluded in this catalog, including those that were fainter thanmV = 17, but in the comparison analyses presented in §3we exclude those supernovae with mV,peak > 17 so that oursample matches the non-ASAS-SN sample.
2.2 The Non-ASAS-SN Supernova Sample
Table 2 gives information for the sample of bright super-novae that were not discovered by ASAS-SN. This sample in-cludes all spectroscopically confirmed supernovae with peakmagnitudes mpeak 6 17 discovered between 2015 January 1and 2015 December 31.
Data for these non-ASAS-SN discoveries were compiledfrom the “latest supernovae” website5 maintained by D. W.Bishop (Gal-Yam et al. 2013). This page provides a reposi-tory of discoveries reported from different channels and at-tempts to link objects reported by different sources at differ-ent times, and thus provides the best available source in 2015for collecting information on supernovae discovered by dif-ferent sources. The names, IAU names, discovery dates, co-ordinates, host names, host offsets, peak magnitudes, types,and discovery sources that are listed in Table 2 were takenfrom this page when possible. Redshifts for host galaxieswere retrieved from NED when available, and were takenfrom the latest supernovae website when previous host mea-surements were not available. For cases where the websitedid not list a host name or host offset for the supernova,this information was taken from NED. We define the offsetin these cases as the difference between the reported super-nova coordinates and the galaxy coordinates in NED. For allsupernovae in both samples, we give the primary name ofthe host galaxy from NED, which sometimes differs from thename listed on the ASAS-SN supernova page or the latestsupernovae website.
We list the name of the discovery group for all super-novae discovered by other professional surveys. For super-novae discovered by non-professional astronomers, we lista discovery source of “Amateurs” in order to distinguishthese supernovae from those discovered by ASAS-SN andother professional surveys. As was the case in 2014, ama-teurs accounted for the largest number of bright supernovadiscoveries after ASAS-SN in 2015.
Lastly, we note in Table 2 whether these supernovaewere independently recovered while scanning ASAS-SN dataso that we can quantify the impact ASAS-SN would have onthe discovery of bright supernovae without the presence ofother supernova searches. In §3.2, we examine the cases ofthe two very bright (mpeak < 15) supernovae from 2015 thatwere not recovered by ASAS-SN in order to determine why
4 http://italiansupernovae.org/5 http://www.rochesterastronomy.org/snimages/
ASAS-SN missed these supernovae despite its large coveragearea and high cadence.
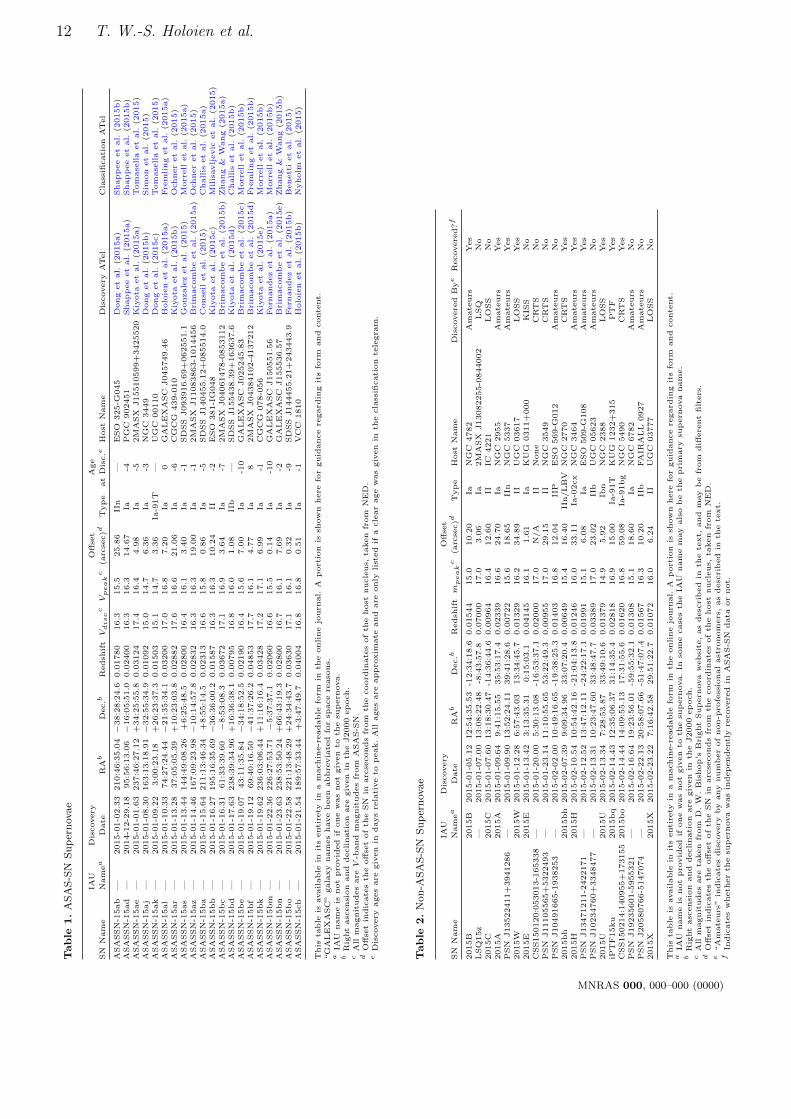
2.3 The Host Galaxy Samples
We have collected Galactic extinction values and magni-tudes in various photometric filters spanning from the near-ultraviolet (NUV) to the infrared (IR) for all host galax-ies of the supernovae in both the ASAS-SN and the non-ASAS-SN samples. These data are presented in Tables 3and 4 for ASAS-SN hosts and non-ASAS-SN hosts, respec-tively. The Galactic AV is taken from Schlafly & Finkbeiner(2011) and was gathered from NED for the supernova posi-tion. We obtained NUV magnitudes from the Galaxy Evo-lution Explorer (GALEX) All Sky Imaging Survey (AIS),optical ugriz magnitudes from the Sloan Digital Sky Sur-vey Data Release 12 (SDSS DR12; Alam et al. 2015), IRJHKS magnitudes from the Two-Micron All Sky Survey(2MASS; Skrutskie et al. 2006), and W1 and W2 magni-tudes from the Wide-field Infrared Survey Explorer (WISE;Wright et al. 2010) AllWISE source catalog. For cases wherethe host is not detected in 2MASS data, we adopt an upperlimit which corresponds to the faintest detected host magni-tude in our sample (mJ > 16.5, mH > 15.7) for the J- andH-bands.
For the KS-band, we estimate a host magnitude forthose hosts that are not detected in 2MASS but are de-tected in the WISE W1-band by adding the mean Ks−W1offset from the sample to the WISE W1 data. We calcu-lated this offset by averaging the offsets for all hosts thatwere detected in both the KS- and W1-bands from both su-pernova samples, and it is equal to −0.64 magnitudes witha scatter of 0.05 magnitudes and a standard error of 0.002magnitudes. This agrees well with the offset calculated withthe 2014 sample in Holoien et al. (2016a). For hosts that arenot detected in either 2MASS or WISE, we again adopt anupper limit corresponding to the faintest detected host inthat filter, mKS > 15.6.
3 ANALYSIS
Here we provide some basic statistical analyses of the super-nova samples and examine reasons why ASAS-SN does notrecover some very bright supernovae.
3.1 Sample Analyses
Combining all the bright supernovae from both samples dis-covered between 2014 May 1, when ASAS-SN became op-erational in both hemispheres, and 2015 December 31 pro-vides a total sample of 425 supernovae, after excluding thoseASAS-SN discoveries with mpeak > 17.0. Of these, 57%(242) were discovered by ASAS-SN, 25% (105) were discov-ered by amateurs, and 18% (78) were discovered by otherprofessional surveys. By type, 278 were Type Ia supernovae,115 were Type II supernovae, and 31 were Type Ib/Ic su-pernovae. Following Li et al. (2011), we include Type IIbsupernovae in the Type II sample to allow a more direct com-parison with their results. ASASSN-15lh is either a Type Isuperluminous supernova (SLSN-I; Dong et al. 2016; Godoy-Rivera et al. 2016) or a tidal disruption event around a Kerr
MNRAS 000, 000–000 (0000)

ASAS-SN Bright SN Catalog 2015 5
Ia76% (183)
II
21% (50)
Ib/Ic3% (8)
ASAS-SN Discoveries (241)
Ia
52% (95)
II
36% (65)
Ib/Ic13% (23)
Non-ASAS-SN Discoveries (183)
Ia
66% (278)
II
27% (115)
Ib/Ic7% (31)
Full Sample (424)
Figure 1. Left Panel : Pie chart breaking down the ASAS-SN sample of supernovae discovered between 2014 May 01 and 2015 December31 by type. The fractional breakdown is quite similar to that of an ideal magnitude-limited sample from Li et al. (2011). Center Panel :
The same breakdown of supernova types for the Non-ASAS-SN sample from the same time period. Right Panel: The same breakdown
of supernova types for the combined sample. Type IIb supernovae are considered part of the “Type II” sample for this analysis.
black hole (Leloudas et al. 2016), and we do not include itin analyses that look at trends by type. ASAS-SN discov-ered 66% (183) of the Type Ia supernovae, 43% (50) of theType II supernovae, and 26% (8) of the Type Ib/Ic super-novae. Amateurs discovered 20% (55), 31% (36), and 48%(15) of the Type Ia, Type II, and Type Ib/Ic supernovae,respectively, while other professional surveys accounted forthe remaining 15% (41), 25% (29), and 26% (8) of each.
In Figure 1 we show a breakdown by type of the su-pernovae in the ASAS-SN sample, the non-ASAS-SN sam-ple, and the combined sample. As would be expected from amagnitude-limited sample, Type Ia supernovae represent thelargest fraction of supernovae in all three samples (e.g., Liet al. 2011). The ASAS-SN sample has the highest fractionof Type Ia supernovae of the three samples, and matches the“ideal magnitude-limited sample” breakdown (79% Type Ia,17% Type II, and 4% Type Ib/Ic) predicted from the LOSSvolume-limited sample in Li et al. (2011) almost exactly. Aswas the case with just the 2014 sample, the non-ASAS-SNsample and the overall sample have higher fractions of TypeII and Type Ib/Ic supernovae (Holoien et al. 2016a).
Although ASAS-SN discovers fewer supernovae over-all than other professional surveys, ASAS-SN has been thedominant source of bright supernova discoveries since be-coming operational in both hemispheres in May of 2014.Trends seen in the 2014 sample (Holoien et al. 2016a) con-tinue in the 2015 sample as well. ASAS-SN often discoverssupernovae shortly after explosion due to its rapid cadence:217 of the ASAS-SN supernovae have approximate measuredages at discovery, and 70% (151) were discovered prior toreaching their peak brightness.
ASAS-SN also continues to be less affected by hostgalaxy selection effects than other bright supernova searches:24% (57) of the ASAS-SN bright supernovae were discov-ered in catalogued host galaxies without known redshifts,while only 14% (26) of the supernovae discovered by othersources were found in such hosts. An additional 3% (7) ofthe ASAS-SN supernovae were found in uncatalogued hostsor have no apparent host galaxy compared to 1% (2) of the
non-ASAS-SN discoveries, indicating that ASAS-SN is lessbiased against finding supernovae in uncatalogued hosts.
ASAS-SN discoveries continue to stand out from brightsupernovae discovered by other sources with regards to theiroffsets from their host galaxy nuclei. In Figure 2 we showthe host KS-band absolute magnitude and the offset fromhost nucleus for all supernovae in our sample, with the me-dian values for each source (ASAS-SN, amateurs, or otherprofessionals) marked with horizontal and vertical lines. Tohelp put the overall magnitude scale in perspective, a typ-ical L? galaxy has M?,KS = −24.2 (Kochanek et al. 2001),and a corresponding luminosity scale is given on the upperaxis of the Figure.
Amateur surveys are significantly biased towards lu-minous galaxies and larger offsets from the host nucleus,which is unsurprising given that they tend to observe bright,nearby galaxies and use less sophisticated detection tech-niques than professional surveys. This approach allows am-ateur observers to obtain many observations of such galaxiesper night, increasing their chances of finding supernovae, butit biases them against finding supernovae in fainter hosts.Other professional surveys in our comparison sample do dis-cover supernovae with smaller angular separations than am-ateurs (median value of 12.′′2 vs. 15.′′0), but in terms of phys-ical separation both samples exhibit a similar median offset(4.9 kpc for professionals, 5.1 kpc for amateurs). Conversely,ASAS-SN discoveries have median offsets of 4.′′9 and 2.6 kpc,indicating that ASAS-SN is less biased against discoveriesclose to the host nucleus than either comparison group. Thethree other professional groups with the most discoveriesin our comparison sample are CRTS (Drake et al. 2009),MASTER (Gorbovskoy et al. 2013), and LOSS (Li et al.2000), which either do not use difference imaging or ig-nore central regions of galaxies in their searches, and thislikely contributes to their larger offsets. As we pointed outin Holoien et al. (2016a), however, ASAS-SN continues tofind a higher rate of tidal disruption events than other sur-veys (see Holoien et al. 2016d,c), including those that do usedifference imaging, which implies that the avoidance of the
MNRAS 000, 000–000 (0000)

6 T. W.-S. Holoien et al.
Figure 2. Upper Panel : Absolute KS-band host galaxy magnitude versus the offset from host nucleus in arcseconds for our total brightsupernova sample. The upper axis gives the log (L/L?) values corresponding to the magnitude scale for M?,KS
= −24.2 (Kochanek et al.
2001). Supernovae discovered by ASAS-SN are shown as red stars, those discovered by amateur observers are shown as black circles,
and those discovered by other professional surveys are shown as blue squares. Filled points indicate supernovae that were independentlyrecovered by ASAS-SN. Triangles are used to indicate upper limits on host galaxy magnitudes for hosts that were not detected by either
2MASS or WISE. Median offsets and magnitudes for ASAS-SN, Amateurs, and other professionals are indicated by dashed, dotted,
and dash-dotted lines, respectively, in colors matching the data points. Upper limits are included in computing the median magnitudes.Lower Panel : As above, but with the offset measured in kiloparsecs rather than arcseconds.
central regions of galaxies is still fairly common in surveysother than CRTS, MASTER, and LOSS.
The median host magnitudes for supernovae discov-ered by ASAS-SN, other professionals, and amateurs areMKS ' −22.7, MKS ' −22.6, and MKS ' −23.9, respec-tively. While the median host magnitude for other profes-sionals’ discoveries is slightly fainter than that for ASAS-SN discoveries, the measurements are consistent given the
uncertainties. There is however a clear distinction betweenprofessional surveys (including ASAS-SN) and amateurs.
ASAS-SN has had a significant impact on the discov-ery of bright supernovae. One way this can be seen is bylooking at the number of bright supernovae discovered permonth in 2013, 2014, and 2015. Figure 3 shows a histogramof supernovae with mpeak 6 17 discovered by ASAS-SN andthose discovered by other sources in each month of 2013,2014, and 2015. As was the case in Holoien et al. (2016a),
MNRAS 000, 000–000 (0000)

ASAS-SN Bright SN Catalog 2015 7
2013
Jan.
Feb.
Mar
.A
pr.
May
Jun.
Jul.
Aug
.Se
p.O
ct.
Nov
.D
ec.
2014
Jan.
Feb.
Mar
.A
pr.
May
Jun.
Jul.
Aug
.Se
p.O
ct.
Nov
.D
ec.
2105
Jan.
Feb.
Mar
.A
pr.
May
Jun.
Jul.
Aug
.Se
p.O
ct.
Nov
.D
ec.
Month
0
5
10
15
20
25
30
35
NSN
Real-timeAnalysisBegins
Brutus UpgradedCassius Deployed
Machine LearningImplemented
Cassius Upgraded
ASAS-SN DiscoveriesRecoveredNot Recovered
Figure 3. Histogram of bright supernovae discoveries in each month of 2013, 2014, and 2015. ASAS-SN discoveries are indicated in red,
supernovae discovered by other sources and independently recovered by ASAS-SN are indicated in green, and supernovae that were not
recovered by ASAS-SN are indicated in blue. Significant milestones in the ASAS-SN timeline are also indicated. The impact of ASAS-SNbecoming operational in both hemispheres in 2014 May is clearly seen by a large increase in discoveries in all following months. ASAS-SN
accounts for at least half of the bright supernova discoveries in every month after 2014 April, and also recovers a significant fraction of
the supernovae it does not discover, particularly in 2015.
we include information for all bright supernovae discoveredin the early months of 2014 for completeness, and we addthe same information for all of 2013 as well to expand ourcomparison. To help show the impact of various improve-ments to the ASAS-SN hardware and software, we indicatecertain milestones, such as the deployment of our southernunit Cassius and its upgrade to 4 telescopes, on the figureas well.
Before our southern unit Cassius became operational,other supernova searches were discovering the majority ofbright, nearby supernovae. However, as can be seen in Fig-ure 3, the addition of Cassius and improvements to ourpipeline had a major impact on our detection efficiency. Forevery month of 2014 and 2015 after the deployment of Cas-sius, ASAS-SN discovers or independently recovers at leasthalf of all bright supernovae, and often this fraction is sig-nificantly larger. The average number of bright supernovaediscovered per month has also increased substantially sinceASAS-SN became operational in both hemispheres, from 14with a scatter of 4 supernovae per month to 21 with a scat-ter of 5 supernovae per month. This implies that the rate ofbright supernovae discovered per month has increased from∼ 13 ± 2 supernovae per month prior to Cassius becomingoperational to ∼ 21 ± 2 supernovae per month afterwards,providing roughly 4σ evidence that the discovery rate hasincreased since Cassius was deployed. This suggests thatASAS-SN is discovering supernovae that would not other-wise be discovered by other supernova searches, and thusthat we can now construct a more complete sample of bright,nearby supernovae.
ASAS-SN is also less biased in terms of the locations of
its discoveries. Figure 4 shows a cumulative normalized his-togram of supernovae with respect to the sine of their dec-lination. The green dashed line represents what would beexpected if supernovae were discovered at all declinationsequally. As can be seen in the figure, supernovae discov-ered by non-ASAS-SN sources have a clear bias towards thenorthern hemisphere: the non-ASAS-SN histogram falls sig-nificantly below the “no bias” expectation except at very low(sin (Dec) . −0.8) and very high (sin (Dec) & 0.6) declina-tions. This is not unexpected, as many professional searchesare based in the northern hemisphere. The ASAS-SN dis-coveries make the combined sample (the black line) followthe expected distribution very closely. The primary bias re-maining in sky coverage is the Galactic plane.
The redshift distribution of our full sample, dividedby supernova type, is shown in Figure 5. There is a cleardistinction between the redshifts of Type Ia and Type IIsupernovae in our sample, with the Type II distributionpeaking at z . 0.01 and the Type Ia distribution peak-ing closer to z ∼ 0.03. This distribution is not unexpectedfor a magnitude-limited sample, as Type Ia supernovae aretypically more luminous than core-collapse supernovae. Aswas the case in our 2014 sample (see Holoien et al. 2016a),the Type Ib/Ic distribution peaks between z = 0.015 andz = 0.02. This trend is not as clear, due in part to the com-paratively small number of Type Ib/Ic supernovae in thesample.
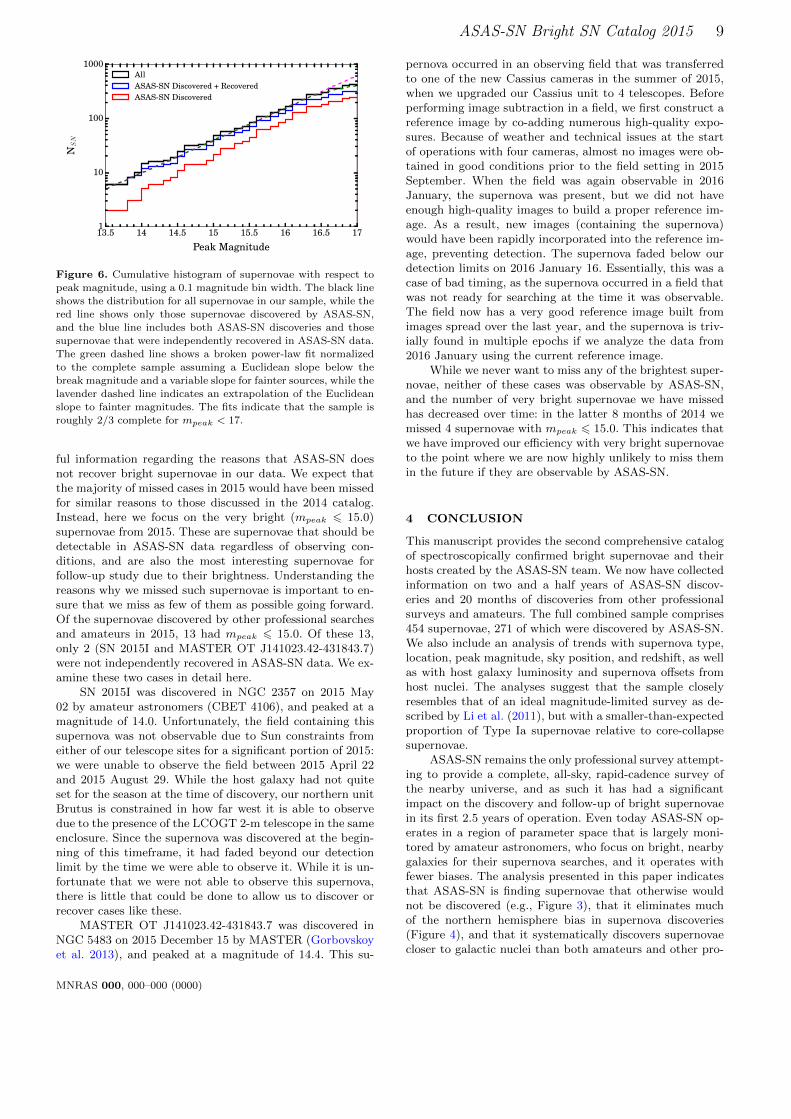
Finally, Figure 6 shows a cumulative histogram of su-pernova peak magnitudes with 13.5 < mpeak < 17.0. ASAS-SN discoveries, ASAS-SN discoveries and recovered super-novae, and all supernovae from our sample are shown in
MNRAS 000, 000–000 (0000)

8 T. W.-S. Holoien et al.
-1 -0.75 -0.5 -0.25 0 0.25 0.5 0.75 1
sin(Dec)
0
0.25
0.5
0.75
1N
SN
OtherASAS-SNAll
Figure 4. Cumulative normalized histogram of supernova dis-
coveries with respect to the sine of their declination. ASAS-SNdiscoveries are shown in red, non-ASAS-SN discoveries are shown
in blue, and the combined sample is shown in black. The green
dashed line represents what would be expected if supernovae wereequally likely to be discovered at all declinations. Non-ASAS-SN
discoveries have a clear northern bias and fall well below the ex-
pectation except near the poles, while ASAS-SN discoveries cor-rect this trend.
red, blue, and black, respectively. As was the case in thelast 8 months of 2014, amateur observers account for a largenumber of very bright discoveries (those with mpeak . 14.5;Holoien et al. 2016a). However, in 2015, ASAS-SN discov-ered a fairly significant fraction of these very bright super-novae as well, showing that it can be competitive with am-ateurs who observe the relatively small number of very low-redshift galaxies with high cadence. ASAS-SN discovers orrecovers every supernova with mpeak < 14, and accounts fora large fraction of the supernovae overall. We discuss thenon-recovered cases with mpeak < 15 in §3.2. At m ∼ 16.5the distribution flattens, as such supernovae spend less timeat magnitudes bright enough to be found by ASAS-SN.
A full discussion of supernova rates is being deferredto an upcoming manuscript (Holoien et al., in prep.), butFigure 6 illustrates the magnitude completeness of our sam-ple. We fit a broken power-law in magnitude (shown with agreen dashed line) to the unbinned magnitudes of the theo-retically observable SN brighter than m = 17.0 assuming aEuclidean slope below the break magnitude and a variableslope for fainter sources, deriving the parameters and theiruncertainties using Monte Carlo Markov Chain (MCMC)methods. For the SN discovered by ASAS-SN, the num-ber counts are consistent with a Euclidean slope down to16.30 ± 0.08 mag, which is about 0.3 mag fainter than wefound for the 2013/2014 sample and another indication ofimprovements in our survey and pipelines. For the samplesadding SN later found by ASAS-SN or the sample of allbright SN, we find similar break magnitudes of 16.26± 0.07and 16.27± 0.07 mag, respectively.
The integral completenesses of the three samples rela-tive to the Euclidean predictions are 0.95±0.03 (0.64±0.04),0.93±0.03 (0.60±0.03), and 0.94±0.03 (0.64±0.03) at 16.5(17.0) mag, respectively. The differential completenesses ofthe three samples relative to the Euclidean predictions are0.62 ± 0.09 (0.19 ± 0.05), 0.54 ± 0.06 (0.15 ± 0.03) and0.60 ± 0.07 (0.20 ± 0.04) at 16.5 (17.0) mag, respectively.
0 0.01 0.02 0.03 0.04 0.05 0.06 0.07 0.08 0.09 0.10 0.11
Redshift
5
10
15
20
25
30
35
40
45
50
NSN
Type IaType IIType Ib/Ic
Figure 5. Histograms of the supernova redshifts with a bin width
of z = 0.005. The red, blue, and green lines show the Type Ia,
Type II, and Type Ib/Ic redshift distributions, respectively. Sub-types (e.g., SN 1991T-like Type Ia supernovae) are included as
part of their parent groups. Type Ia supernovae in our sample arepredominantly found at higher redshifts, while the Type II su-
pernovae are found at comparatively lower redshifts, as expected
from a magnitude-limited sample.
These results vary little between the three sample defini-tions and a rough characterization is that 2/3 of the SNbrighter than 17 mag are being found, but only one in 5-6 of the 17 mag SN are being found (relative to the Eu-clidean extrapolation from the brighter < 16 mag SN). TheEuclidean approximation modestly underestimates the truecompleteness for the faint SN because of deviations from aEuclidean geometry, the effects of time dilation on rates, andK-corrections. We will include these higher order correctionswhen we carry out a full analysis of the rates.
3.2 Examination of Missed Cases
In Holoien et al. (2016a) we performed a retrospective ex-amination of all bright supernovae that were not discoveredor recovered by ASAS-SN in a single month (2014 August)in order to better understand some of the reasons ASAS-SNwould not recover supernovae that should be bright enoughto be detected. Our conclusion was that many of the missedcases in 2014 would be recovered by ASAS-SN today, dueto factors such as better cadence, Galactic plane coverage,and an improved detection pipeline.
This is born out in the observations. From 2014 May1 through 2014 December 31, ASAS-SN recovered 24%(19/80) of the supernovae discovered by other sources. In2015, this fraction increased dramatically, to 55% (57/104),indicating that our recovery rate has indeed improved since2014. Of the 47 supernovae that were not recovered, roughlyhalf (23) had peak magnitudes of mpeak > 16.5, which makesthem more likely to be missed in our data due to factors suchas peaking between ASAS-SN observations or occurring dur-ing the full moon, when our survey depth is reduced. While itis clear that there is still room for improvement, ASAS-SN isnow recovering more than half of the supernovae discoveredby other supernova searches, and we expect this fraction tocontinue to increase in the future.
A similar analysis of missed cases to the one performedin Holoien et al. (2016a) is unlikely to reveal additional use-
MNRAS 000, 000–000 (0000)
ASAS-SN Bright SN Catalog 2015 9
13.5 14 14.5 15 15.5 16 16.5 17
Peak Magnitude
1
10
100
1000N
SN
AllASAS-SN Discovered + RecoveredASAS-SN Discovered
Figure 6. Cumulative histogram of supernovae with respect to
peak magnitude, using a 0.1 magnitude bin width. The black lineshows the distribution for all supernovae in our sample, while the
red line shows only those supernovae discovered by ASAS-SN,
and the blue line includes both ASAS-SN discoveries and thosesupernovae that were independently recovered in ASAS-SN data.
The green dashed line shows a broken power-law fit normalized
to the complete sample assuming a Euclidean slope below thebreak magnitude and a variable slope for fainter sources, while the
lavender dashed line indicates an extrapolation of the Euclideanslope to fainter magnitudes. The fits indicate that the sample is
roughly 2/3 complete for mpeak < 17.
ful information regarding the reasons that ASAS-SN doesnot recover bright supernovae in our data. We expect thatthe majority of missed cases in 2015 would have been missedfor similar reasons to those discussed in the 2014 catalog.Instead, here we focus on the very bright (mpeak 6 15.0)supernovae from 2015. These are supernovae that should bedetectable in ASAS-SN data regardless of observing con-ditions, and are also the most interesting supernovae forfollow-up study due to their brightness. Understanding thereasons why we missed such supernovae is important to en-sure that we miss as few of them as possible going forward.Of the supernovae discovered by other professional searchesand amateurs in 2015, 13 had mpeak 6 15.0. Of these 13,only 2 (SN 2015I and MASTER OT J141023.42-431843.7)were not independently recovered in ASAS-SN data. We ex-amine these two cases in detail here.
SN 2015I was discovered in NGC 2357 on 2015 May02 by amateur astronomers (CBET 4106), and peaked at amagnitude of 14.0. Unfortunately, the field containing thissupernova was not observable due to Sun constraints fromeither of our telescope sites for a significant portion of 2015:we were unable to observe the field between 2015 April 22and 2015 August 29. While the host galaxy had not quiteset for the season at the time of discovery, our northern unitBrutus is constrained in how far west it is able to observedue to the presence of the LCOGT 2-m telescope in the sameenclosure. Since the supernova was discovered at the begin-ning of this timeframe, it had faded beyond our detectionlimit by the time we were able to observe it. While it is un-fortunate that we were not able to observe this supernova,there is little that could be done to allow us to discover orrecover cases like these.
MASTER OT J141023.42-431843.7 was discovered inNGC 5483 on 2015 December 15 by MASTER (Gorbovskoyet al. 2013), and peaked at a magnitude of 14.4. This su-
pernova occurred in an observing field that was transferredto one of the new Cassius cameras in the summer of 2015,when we upgraded our Cassius unit to 4 telescopes. Beforeperforming image subtraction in a field, we first construct areference image by co-adding numerous high-quality expo-sures. Because of weather and technical issues at the startof operations with four cameras, almost no images were ob-tained in good conditions prior to the field setting in 2015September. When the field was again observable in 2016January, the supernova was present, but we did not haveenough high-quality images to build a proper reference im-age. As a result, new images (containing the supernova)would have been rapidly incorporated into the reference im-age, preventing detection. The supernova faded below ourdetection limits on 2016 January 16. Essentially, this was acase of bad timing, as the supernova occurred in a field thatwas not ready for searching at the time it was observable.The field now has a very good reference image built fromimages spread over the last year, and the supernova is triv-ially found in multiple epochs if we analyze the data from2016 January using the current reference image.
While we never want to miss any of the brightest super-novae, neither of these cases was observable by ASAS-SN,and the number of very bright supernovae we have missedhas decreased over time: in the latter 8 months of 2014 wemissed 4 supernovae with mpeak 6 15.0. This indicates thatwe have improved our efficiency with very bright supernovaeto the point where we are now highly unlikely to miss themin the future if they are observable by ASAS-SN.
4 CONCLUSION
This manuscript provides the second comprehensive catalogof spectroscopically confirmed bright supernovae and theirhosts created by the ASAS-SN team. We now have collectedinformation on two and a half years of ASAS-SN discov-eries and 20 months of discoveries from other professionalsurveys and amateurs. The full combined sample comprises454 supernovae, 271 of which were discovered by ASAS-SN.We also include an analysis of trends with supernova type,location, peak magnitude, sky position, and redshift, as wellas with host galaxy luminosity and supernova offsets fromhost nuclei. The analyses suggest that the sample closelyresembles that of an ideal magnitude-limited survey as de-scribed by Li et al. (2011), but with a smaller-than-expectedproportion of Type Ia supernovae relative to core-collapsesupernovae.
ASAS-SN remains the only professional survey attempt-ing to provide a complete, all-sky, rapid-cadence survey ofthe nearby universe, and as such it has had a significantimpact on the discovery and follow-up of bright supernovaein its first 2.5 years of operation. Even today ASAS-SN op-erates in a region of parameter space that is largely moni-tored by amateur astronomers, who focus on bright, nearbygalaxies for their supernova searches, and it operates withfewer biases. The analysis presented in this paper indicatesthat ASAS-SN is finding supernovae that otherwise wouldnot be discovered (e.g., Figure 3), that it eliminates muchof the northern hemisphere bias in supernova discoveries(Figure 4), and that it systematically discovers supernovaecloser to galactic nuclei than both amateurs and other pro-
MNRAS 000, 000–000 (0000)

10 T. W.-S. Holoien et al.
fessionals and in significantly less luminous galaxies thanamateurs (Figure 2). Compared to our performance in 2014(Holoien et al. 2016a), we independently recovered a signif-icantly higher fraction of non-ASAS-SN discoveries in 2015,and we recovered all very bright (mpeak 6 15.0) supernovaethat were observable by our telescopes in 2015.
The completeness of our full sample has also improvedsince the end of 2014. In Figure 6 we show that the mag-nitude distribution of the bright supernovae discovered be-tween 2014 May 1 and 2015 December 31 is roughly com-plete to a peak magnitude of mpeak = 16.3, and is roughly66% complete for mpeak 6 17.0. While we still must ad-dress the absolute normalization of the expected number ofsupernovae (by accounting for factors such as sky coverageand time windows) in order to determine nearby supernovaerates, this analysis serves as a precursor to rate calculationswhich will be presented in future work by the ASAS-SNteam (Holoien et al., in prep.). As noted in Holoien et al.(2016a), such nearby rate calculations have the potential toimpact a number of fields, including the nearby core-collapserate (e.g., Horiuchi et al. 2011, 2013) and multi-messengerstudies ranging from gravitational waves (e.g., Ando et al.2013; Nakamura et al. 2016), to MeV gamma rays from TypeIa supernovae (e.g., Horiuchi & Beacom 2010; Diehl et al.2014; Churazov et al. 2015) to GeV–TeV gamma rays andneutrinos from rare types of core-collapse supernovae (e.g.,Ando & Beacom 2005; Murase et al. 2011; Abbasi et al.2012). These joint measurements would greatly increase thescientific reach of ASAS-SN discoveries.
This is the second of a yearly series of bright supernovacatalogs provided by the ASAS-SN team. It is our hope thatby collecting and publishing these data on supernovae andtheir hosts that we will create convenient and useful repos-itories that can be used for new and interesting populationstudies. These catalogs also provide a tool for other profes-sional supernova surveys to perform similar analyses of theirdata pipelines as we have done for ASAS-SN. While ASAS-SN may discover fewer supernovae than other professionalsurveys because it is limited to only bright supernovae, itdoes find the best and the brightest, and these catalogs areone way in which we can fully leverage the unbiased ASAS-SN sample to impact the field of supernova science now andin the future.
ACKNOWLEDGMENTS
The authors thank LCOGT and its staff for their continuedsupport of ASAS-SN.
ASAS-SN is supported by NSF grant AST-1515927. De-velopment of ASAS-SN has been supported by NSF grantAST-0908816, the Center for Cosmology and AstroParticlePhysics at the Ohio State University, the Mt. Cuba Astro-nomical Foundation, and by George Skestos.
TW-SH is supported by the DOE ComputationalScience Graduate Fellowship, grant number DE-FG02-97ER25308. JSB, KZS, and CSK are supported byNSF grant AST-1515927. KZS and CSK are also sup-ported by NSF grant AST-1515876. BJS is supported byNASA through Hubble Fellowship grant HST-HF-51348.001awarded by the Space Telescope Science Institute, whichis operated by the Association of Universities for Research
in Astronomy, Inc., for NASA, under contract NAS 5-26555. Support for JLP is in part provided by FONDECYTthrough the grant 1151445 and by the Ministry of Econ-omy, Development, and Tourism’s Millennium Science Ini-tiative through grant IC120009, awarded to The MillenniumInstitute of Astrophysics, MAS. SD is supported by “theStrategic Priority Research Program-The Emergence of Cos-mological Structures” of the Chinese Academy of Sciences(Grant No. XDB09000000) and Project 11573003 supportedby NSFC. JFB is supported by NSF grant PHY-1404311.PRW acknowledges support from the US Department ofEnergy as part of the Laboratory Directed Research andDevelopment program at LANL.
This research has made use of the XRT Data AnalysisSoftware (XRTDAS) developed under the responsibility ofthe ASI Science Data Center (ASDC), Italy. At Penn Statethe NASA Swift program is support through contract NAS5-00136.
This research was made possible through the use of theAAVSO Photometric All-Sky Survey (APASS), funded bythe Robert Martin Ayers Sciences Fund.
This research has made use of data provided by Astrom-etry.net (Barron et al. 2008).
This paper uses data products produced by the OIRTelescope Data Center, supported by the Smithsonian As-trophysical Observatory.
Observations made with the NASA Galaxy EvolutionExplorer (GALEX) were used in the analyses presented inthis manuscript. Some of the data presented in this paperwere obtained from the Mikulski Archive for Space Tele-scopes (MAST). STScI is operated by the Association ofUniversities for Research in Astronomy, Inc., under NASAcontract NAS5-26555. Support for MAST for non-HST datais provided by the NASA Office of Space Science via grantNNX13AC07G and by other grants and contracts.
Funding for SDSS-III has been provided by the Al-fred P. Sloan Foundation, the Participating Institutions,the National Science Foundation, and the U.S. Depart-ment of Energy Office of Science. The SDSS-III web siteis http://www.sdss3.org/.
This publication makes use of data products from theTwo Micron All Sky Survey, which is a joint project of theUniversity of Massachusetts and the Infrared Processing andAnalysis Center/California Institute of Technology, fundedby NASA and the National Science Foundation.
This publication makes use of data products from theWide-field Infrared Survey Explorer, which is a joint projectof the University of California, Los Angeles, and the JetPropulsion Laboratory/California Institute of Technology,funded by NASA.
This research has made use of the NASA/IPAC Ex-tragalactic Database (NED), which is operated by the JetPropulsion Laboratory, California Institute of Technology,under contract with NASA.
REFERENCES
Abbasi R., et al., 2012, A&A, 539, A60
Alam S., et al., 2015, ApJS, 219, 12
Ando S., Beacom J. F., 2005, Physical Review Letters, 95, 061103Ando S., et al., 2013, Reviews of Modern Physics, 85, 1401
MNRAS 000, 000–000 (0000)
ASAS-SN Bright SN Catalog 2015 11
Baltay C., et al., 2013, PASP, 125, 683
Barron J. T., Stumm C., Hogg D. W., Lang D., Roweis S., 2008,AJ, 135, 414
Benetti S., et al., 2015, The Astronomer’s Telegram, 7040
Blondin S., Tonry J. L., 2007, ApJ, 666, 1024Brimacombe J., et al., 2015a, The Astronomer’s Telegram, 6921
Brimacombe J., et al., 2015b, The Astronomer’s Telegram, 6943
Brimacombe J., et al., 2015c, The Astronomer’s Telegram, 6950Brimacombe J., et al., 2015d, The Astronomer’s Telegram, 6959
Brimacombe J., et al., 2015e, The Astronomer’s Telegram, 6984
Brown T. M., et al., 2013, PASP, 125, 1031Brown J. S., W.-S Holoien T., Auchettl K., Stanek K. Z.,
Kochanek C. S., Shappee B. J., Prieto J. L., Grupe D., 2016a,preprint, (arXiv:1609.04403)
Brown J. S., Shappee B. J., Holoien T. W.-S., Stanek K. Z.,
Kochanek C. S., Prieto J. L., 2016b, MNRAS, 462, 3993Challis P., Kirshner R., Falco E., 2015a, The Astronomer’s Tele-
gram, 6947
Challis P., Kirshner R., Falco E., Calkins M., 2015b, The As-tronomer’s Telegram, 6956
Chambers K. C., et al., 2016, preprint, (arXiv:1612.05560)
Churazov E., et al., 2015, ApJ, 812, 62Conseil E., et al., 2015, The Astronomer’s Telegram, 6934
Diehl R., et al., 2014, Science, 345, 1162
Dong S., et al., 2015a, The Astronomer’s Telegram, 6864Dong S., et al., 2015b, The Astronomer’s Telegram, 6886
Dong S., et al., 2015c, The Astronomer’s Telegram, 6892Dong S., et al., 2016, Science, 351, 257
Drake A. J., et al., 2009, ApJ, 696, 870
Dressler A., et al., 2011, PASP, 123, 288Fabricant D., Cheimets P., Caldwell N., Geary J., 1998, PASP,
110, 79
Fernandez J. M., et al., 2015a, The Astronomer’s Telegram, 6983Fernandez J. M., et al., 2015b, The Astronomer’s Telegram, 6989
Fremling C., et al., 2015a, The Astronomer’s Telegram, 6909
Fremling C., et al., 2015b, The Astronomer’s Telegram, 6974Frieman J. A., et al., 2008, AJ, 135, 338
Gal-Yam A., Mazzali P. A., Manulis I., Bishop D., 2013, PASP,
125, 749Godoy-Rivera D., et al., 2016, preprint, (arXiv:1605.00645)
Gonzalez C., et al., 2015, The Astronomer’s Telegram, 6919Gorbovskoy E. S., et al., 2013, Astronomy Reports, 57, 233
Harutyunyan A. H., et al., 2008, A&A, 488, 383
Herczeg G. J., et al., 2016, preprint, (arXiv:1607.06368)Hodgkin S. T., Wyrzykowski L., Blagorodnova N., Koposov S.,
2013, Philosophical Transactions of the Royal Society of Lon-
don Series A, 371, 20120239Holoien T. W.-S., et al., 2014a, MNRAS, 445, 3263
Holoien T. W.-S., et al., 2014b, ApJ, 785, L35
Holoien T. W.-S., et al., 2015a, The Astronomer’s Telegram, 6894Holoien T. W.-S., et al., 2015b, The Astronomer’s Telegram, 6990
Holoien T. W.-S., et al., 2016a, preprint, (arXiv:1604.00396)
Holoien T. W.-S., et al., 2016b, Acta Astron., 66, 219Holoien T. W.-S., et al., 2016c, MNRAS, 455, 2918
Holoien T. W.-S., et al., 2016d, MNRAS, 463, 3813
Horiuchi S., Beacom J. F., 2010, ApJ, 723, 329Horiuchi S., Beacom J. F., Kochanek C. S., Prieto J. L., Stanek
K. Z., Thompson T. A., 2011, ApJ, 738, 154Horiuchi S., Beacom J. F., Bothwell M. S., Thompson T. A., 2013,
ApJ, 769, 113
Kato T., et al., 2014a, PASJ, 66, 30Kato T., et al., 2014b, PASJ, 66, 90
Kato T., et al., 2015, PASJ, 67, 105Kato T., et al., 2016, PASJ, 68, 65Kiyota S., et al., 2015a, The Astronomer’s Telegram, 6870Kiyota S., et al., 2015b, The Astronomer’s Telegram, 6915
Kiyota S., et al., 2015c, The Astronomer’s Telegram, 6936Kiyota S., et al., 2015d, The Astronomer’s Telegram, 6945
Kiyota S., et al., 2015e, The Astronomer’s Telegram, 6979
Kochanek C. S., et al., 2001, ApJ, 560, 566
Law N. M., et al., 2009, PASP, 121, 1395Leloudas G., et al., 2016, Nature Astronomy, 1, 0002
Li W. D., et al., 2000, in Holt S. S., Zhang W. W., eds,
American Institute of Physics Conference Series Vol. 522,American Institute of Physics Conference Series. pp 103–106
(arXiv:astro-ph/9912336), doi:10.1063/1.1291702
Li W., et al., 2011, MNRAS, 412, 1441Martini P., et al., 2011, PASP, 123, 187
Milisavljevic D., Villar V. A., Lunnan R., Drout M., PatnaudeD., Berger E., 2015, The Astronomer’s Telegram, 6948
Morrell N., Phillips M. M., Contreras C., Busta L., Hsia E. Y.,
2015a, The Astronomer’s Telegram, 6920Morrell N., et al., 2015b, The Astronomer’s Telegram, 6988
Murase K., Thompson T. A., Lacki B. C., Beacom J. F., 2011,
Physical Review D, 84, 043003Nakamura K., Horiuchi S., Tanaka M., Hayama K., Takiwaki T.,
Kotake K., 2016, MNRAS, 461, 3296
Nyholm A., et al., 2015, The Astronomer’s Telegram, 6994Ochner P., et al., 2015, The Astronomer’s Telegram, 6925
Pastorello A., et al., 2015, MNRAS, 453, 3649
Pignata G., et al., 2009, in Giobbi G., Tornambe A., RaimondoG., Limongi M., Antonelli L. A., Menci N., Brocato E., eds,
American Institute of Physics Conference Series Vol. 1111,American Institute of Physics Conference Series. pp 551–554
(arXiv:0812.4923), doi:10.1063/1.3141608
Quimby R. M., 2006, PhD thesis, The University of Texas atAustin
Schlafly E. F., Finkbeiner D. P., 2011, ApJ, 737, 103
Schmidt S. J., et al., 2014, ApJ, 781, L24Schmidt S. J., et al., 2016, ApJ, 828, L22
Shappee B. J., et al., 2014, ApJ, 788, 48
Shappee B. J., et al., 2015a, The Astronomer’s Telegram, 6867Shappee B. J., et al., 2015b, The Astronomer’s Telegram, 6882
Shappee B. J., et al., 2016, ApJ, 826, 144
Simon J., Morrell N., Phillips M. M., 2015, The Astronomer’sTelegram, 6905
Skrutskie M. F., et al., 2006, AJ, 131, 1163Tomasella L., et al., 2015, The Astronomer’s Telegram, 6899
Tonry J. L., 2011, PASP, 123, 58
Wright E. L., et al., 2010, AJ, 140, 1868Wyrzykowski L., et al., 2014, Acta Astron., 64, 197
Zhang J., Wang X., 2015a, The Astronomer’s Telegram, 6949
Zhang J., Wang X., 2015b, The Astronomer’s Telegram, 7006
MNRAS 000, 000–000 (0000)
12 T. W.-S. Holoien et al.
Table
1.
AS
AS
-SN
Su
per
novae
IAU
Dis
covery
Off
set
Age
SN
Nam
eN
am
ea
Date
RA
bD
ec.b
Redsh
ift
Vdiscc
Vpeakc
(arc
sec)d
Typ
eat
Dis
c.e
Host
Nam
eD
iscovery
AT
el
Cla
ssifi
cati
on
AT
el
ASA
SSN
-15ab
—2015-0
1-0
2.3
3210:4
6:3
5.0
4−
38:2
8:2
4.6
0.0
1780
16.3
15.5
25.8
6II
n—
ESO
325-G
045
Dong
et
al.
(2015a)
Shapp
ee
et
al.
(2015b)
ASA
SSN
-15ad
—2014-1
2-2
9.1
895:5
6:1
3.0
6−
16:0
5:5
1.0
0.0
2400
16.3
16.3
14.6
7Ia
-4P
GC
902451
Shapp
ee
et
al.
(2015a)
Shapp
ee
et
al.
(2015b)
ASA
SSN
-15ae
—2015-0
1-0
1.6
3237:4
6:2
7.1
2+
34:2
5:5
5.8
0.0
3124
17.4
16.4
4.9
8Ia
-52M
ASX
J15510599+
3425520
Kiy
ota
et
al.
(2015a)
Tom
ase
lla
et
al.
(2015)
ASA
SSN
-15aj
—2015-0
1-0
8.3
0163:1
3:1
8.9
1−
32:5
5:3
4.9
0.0
1092
15.0
14.7
6.3
6Ia
-3N
GC
3449
Dong
et
al.
(2015b)
Sim
on
et
al.
(2015)
ASA
SSN
-15ak
—2015-0
1-0
9.2
23:0
0:2
3.1
8+
26:2
3:3
7.3
0.0
1503
15.1
14.7
3.3
6Ia
-91T
—U
GC
00110
Dong
et
al.
(2015c)
Tom
ase
lla
et
al.
(2015)
ASA
SSN
-15al
—2015-0
1-1
0.3
374:2
7:2
4.4
4−
21:3
5:3
4.1
0.0
3200
17.0
16.8
7.2
0Ia
0G
AL
EX
ASC
J045749.4
6H
olo
ien
et
al.
(2015a)
Fre
mling
et
al.
(2015a)
ASA
SSN
-15ar
—2015-0
1-1
3.2
837:0
5:0
5.3
9+
10:2
3:0
3.8
0.0
2882
17.6
16.6
21.0
6Ia
-6C
GC
G439-0
10
Kiy
ota
et
al.
(2015b)
Ochner
et
al.
(2015)
ASA
SSN
-15as
—2015-0
1-1
3.4
4144:4
9:0
8.2
6+
6:2
5:4
8.5
0.0
2800
16.4
16.1
3.4
0Ia
-1SD
SS
J093916.6
9+
062551.1
Gonzale
zet
al.
(2015)
Morr
ell
et
al.
(2015a)
ASA
SSN
-15az
—2015-0
1-1
4.4
6167:0
9:2
3.9
8−
10:1
4:5
7.8
0.0
2832
16.3
16.3
19.0
0Ia
-12M
ASX
J11083863-1
014456
Bri
macom
be
et
al.
(2015a)
Ochner
et
al.
(2015)
ASA
SSN
-15ba
—2015-0
1-1
5.6
4211:1
3:4
6.3
4+
8:5
5:1
4.5
0.0
2313
16.6
15.8
0.8
6Ia
-5SD
SS
J140455.1
2+
085514.0
Conse
ilet
al.
(2015)
Challis
et
al.
(2015a)
ASA
SSN
-15bb
—2015-0
1-1
6.2
7195:1
6:3
5.6
9−
36:3
6:0
0.2
0.0
1587
16.3
16.3
10.2
4II
-2E
SO
381-I
G048
Kiy
ota
et
al.
(2015c)
Milis
avlj
evic
et
al.
(2015)
ASA
SSN
-15b
c—
2015-0
1-1
6.3
161:3
3:3
9.6
0−
8:5
3:0
8.3
0.0
3672
17.1
16.9
3.6
4Ia
-72M
ASX
J04061478-0
853112
Bri
macom
be
et
al.
(2015b)
Zhang
&W
ang
(2015a)
ASA
SSN
-15b
d—
2015-0
1-1
7.6
3238:3
9:3
4.9
6+
16:3
6:3
8.1
0.0
0795
16.8
16.0
1.0
8II
b—
SD
SS
J155438.3
9+
163637.6
Kiy
ota
et
al.
(2015d)
Challis
et
al.
(2015b)
ASA
SSN
-15b
e—
2015-0
1-1
9.0
743:1
1:3
5.8
4−
34:1
8:5
2.5
0.0
2190
16.4
15.6
7.0
0Ia
-10
GA
LE
XA
SC
J025245.8
3B
rim
acom
be
et
al.
(2015c)
Morr
ell
et
al.
(2015b)
ASA
SSN
-15bf
—2015-0
1-1
9.1
269:4
0:1
6.5
0−
41:3
7:2
6.2
0.0
4853
17.7
16.1
4.7
7Ia
82M
ASX
J04384102-4
137212
Bri
macom
be
et
al.
(2015d)
Fre
mling
et
al.
(2015b)
ASA
SSN
-15bk
—2015-0
1-1
9.6
2236:0
3:0
6.4
4+
11:1
6:1
6.4
0.0
3428
17.2
17.1
6.9
9Ia
-1C
GC
G078-0
56
Kiy
ota
et
al.
(2015e)
Morr
ell
et
al.
(2015b)
ASA
SSN
-15bm
—2015-0
1-2
2.3
6226:2
7:5
3.7
1−
5:3
7:3
7.1
0.0
2060
16.6
15.5
0.1
4Ia
-10
GA
LE
XA
SC
J150551.5
6Fern
andez
et
al.
(2015a)
Morr
ell
et
al.
(2015b)
ASA
SSN
-15bn
—2015-0
1-2
3.6
3238:5
3:5
0.2
4+
66:4
3:1
9.3
0.0
2800
16.7
16.1
7.6
9Ia
-2G
AL
EX
ASC
J155536.5
7B
rim
acom
be
et
al.
(2015e)
Zhang
&W
ang
(2015b)
ASA
SSN
-15b
o—
2015-0
1-2
2.5
8221:1
3:4
8.2
9+
24:3
4:4
3.7
0.0
3630
17.1
16.1
0.3
2Ia
-9SD
SS
J144455.2
1+
243443.9
Fern
andez
et
al.
(2015b)
Benett
iet
al.
(2015)
ASA
SSN
-15cb
—2015-0
1-2
1.5
4189:5
7:3
3.4
4+
3:4
7:4
9.7
0.0
4004
16.8
16.8
0.5
1Ia
-1V
CC
1810
Holo
ien
et
al.
(2015b)
Nyholm
et
al.
(2015)
This
table
isavailable
init
senti
rety
ina
machin
e-r
eadable
form
inth
eonline
journ
al.
Ap
ort
ion
issh
ow
nhere
for
guid
ance
regard
ing
its
form
and
conte
nt.
“G
AL
EX
ASC
”gala
xy
nam
es
have
been
abbre
via
ted
for
space
reaso
ns.
aIA
Unam
eis
not
pro
vid
ed
ifone
was
not
giv
en
toth
esu
pern
ova.
bR
ight
asc
ensi
on
and
declinati
on
are
giv
en
inth
eJ2000
ep
och.
cA
llm
agnit
udes
are
V-b
and
magnit
udes
from
ASA
S-S
N.
dO
ffse
tin
dic
ate
sth
eoff
set
of
the
SN
inarc
seconds
from
the
coord
inate
sof
the
host
nucle
us,
taken
from
NE
D.
eD
iscovery
ages
are
giv
en
indays
rela
tive
top
eak.
All
ages
are
appro
xim
ate
and
are
only
list
ed
ifa
cle
ar
age
was
giv
en
inth
ecla
ssifi
cati
on
tele
gra
m.
Table
2.
Non
-AS
AS
-SN
Su
per
novae
IAU
Dis
covery
Off
set
SN
Nam
eN
am
ea
Date
RA
bD
ec.b
Redsh
ift
mpeakc
(arc
sec)d
Typ
eH
ost
Nam
eD
iscovere
dB
ye
Recovere
d?f
2015B
2015B
2015-0
1-0
5.1
212:5
4:3
5.5
3-1
2:3
4:1
8.6
0.0
1544
15.0
10.2
0Ia
NG
C4782
Am
ate
urs
Yes
LSQ
15z
—2015-0
1-0
7.0
013:0
8:2
2.4
8-8
:43:5
7.8
0.0
7000
17.0
3.0
6Ia
2M
ASX
J13082255-0
844002
LSQ
No
2015C
2015C
2015-0
1-0
7.6
013:1
8:3
0.4
7-1
4:3
6:4
4.6
0.0
0964
16.4
12.6
0II
IC4221
LO
SS
No
2015A
2015A
2015-0
1-0
9.6
49:4
1:1
5.5
535:5
3:1
7.4
0.0
2339
16.6
24.7
0Ia
NG
C2955
Am
ate
urs
Yes
PSN
J13522411+
3941286
—2015-0
1-0
9.9
013:5
2:2
4.1
139:4
1:2
8.6
0.0
0722
15.6
18.6
5II
nN
GC
5337
Am
ate
urs
Yes
2015W
2015W
2015-0
1-1
2.2
86:5
7:4
3.0
313:3
4:4
5.7
0.0
1329
16.2
34.8
9II
UG
C03617
LO
SS
Yes
2015E
2015E
2015-0
1-1
3.4
23:1
3:3
5.3
10:1
5:0
3.1
0.0
4145
16.1
1.6
1Ia
KU
G0311+
000
KIS
SN
oC
SS150120:0
53013-1
65338
—2015-0
1-2
0.0
05:3
0:1
3.0
8-1
6:5
3:3
7.1
0.0
2000
17.0
N/A
IIN
one
CR
TS
No
PSN
J11105565+
5322493
—2015-0
1-2
3.1
411:1
0:5
5.6
553:2
2:4
9.3
0.0
0955
17.0
29.1
5II
NG
C3549
CR
TS
No
PSN
J10491665-1
938253
—2015-0
2-0
2.0
010:4
9:1
6.6
5-1
9:3
8:2
5.3
0.0
1403
16.8
12.0
4II
PE
SO
569-G
012
Am
ate
urs
No
2015bh
2015bh
2015-0
2-0
7.3
99:0
9:3
4.9
633:0
7:2
0.4
0.0
0649
15.4
16.4
0II
n/L
BV
NG
C2770
CR
TS
Yes
2015H
2015H
2015-0
2-1
0.5
410:5
4:4
2.1
6-2
1:0
4:1
3.8
0.0
1246
16.0
33.1
1Ia
-02cx
NG
C3464
Am
ate
urs
Yes
PSN
J13471211-2
422171
—2015-0
2-1
2.5
213:4
7:1
2.1
1-2
4:2
2:1
7.1
0.0
1991
15.1
6.0
8Ia
ESO
509-G
108
Am
ate
urs
Yes
PSN
J10234760+
3348477
—2015-0
2-1
3.3
110:2
3:4
7.6
033:4
8:4
7.7
0.0
3389
17.0
23.0
2II
bU
GC
05623
Am
ate
urs
No
2015U
2015U
2015-0
2-1
3.3
47:2
8:5
3.8
733:4
9:1
0.6
0.0
1379
14.9
5.9
2Ib
nN
GC
2388
LO
SS
Yes
iPT
F15ku
2015b
q2015-0
2-1
4.4
312:3
5:0
6.3
731:1
4:3
5.4
0.0
2818
16.9
15.0
0Ia
-91T
KU
G1232+
315
PT
FY
es
CSS150214:1
40955+
173155
2015b
o2015-0
2-1
4.4
414:0
9:5
5.1
317:3
1:5
5.6
0.0
1620
16.8
59.0
8Ia
-91bg
NG
C5490
CR
TS
Yes
PSN
J19235601-5
955321
—2015-0
2-1
6.6
419:2
3:5
6.0
1-5
9:5
5:3
2.1
0.0
1308
15.1
18.6
0Ia
NG
C6782
Am
ate
urs
No
PSN
J20580766-5
147074
—2015-0
2-2
2.1
320:5
8:0
7.6
6-5
1:4
7:0
7.4
0.0
1567
16.3
10.2
0II
bFA
IRA
LL
0927
Am
ate
urs
No
2015X
2015X
2015-0
2-2
3.2
27:1
6:4
2.5
829:5
1:2
2.7
0.0
1072
16.0
6.2
4II
UG
C03777
LO
SS
No
This
table
isavailable
init
senti
rety
ina
machin
e-r
eadable
form
inth
eonline
journ
al.
Ap
ort
ion
issh
ow
nhere
for
guid
ance
regard
ing
its
form
and
conte
nt.
aIA
Unam
eis
not
pro
vid
ed
ifone
was
not
giv
en
toth
esu
pern
ova.
Inso
me
case
sth
eIA
Unam
em
ay
als
ob
eth
epri
mary
sup
ern
ova
nam
e.
bR
ight
asc
ensi
on
and
declinati
on
are
giv
en
inth
eJ2000
ep
och.
cA
llm
agnit
udes
are
taken
from
D.
W.
Bis
hop’s
Bri
ght
Sup
ern
ova
websi
te,
as
desc
rib
ed
inth
ete
xt,
and
may
be
from
diff
ere
nt
filt
ers
.d
Off
set
indic
ate
sth
eoff
set
of
the
SN
inarc
seconds
from
the
coord
inate
sof
the
host
nucle
us,
taken
from
NE
D.
e“A
mate
urs
”in
dic
ate
sdis
covery
by
any
num
ber
of
non-p
rofe
ssio
nal
ast
ronom
ers
,as
desc
rib
ed
inth
ete
xt.
fIn
dic
ate
sw
heth
er
the
sup
ern
ova
was
indep
endentl
yre
covere
din
ASA
S-S
Ndata
or
not.
MNRAS 000, 000–000 (0000)
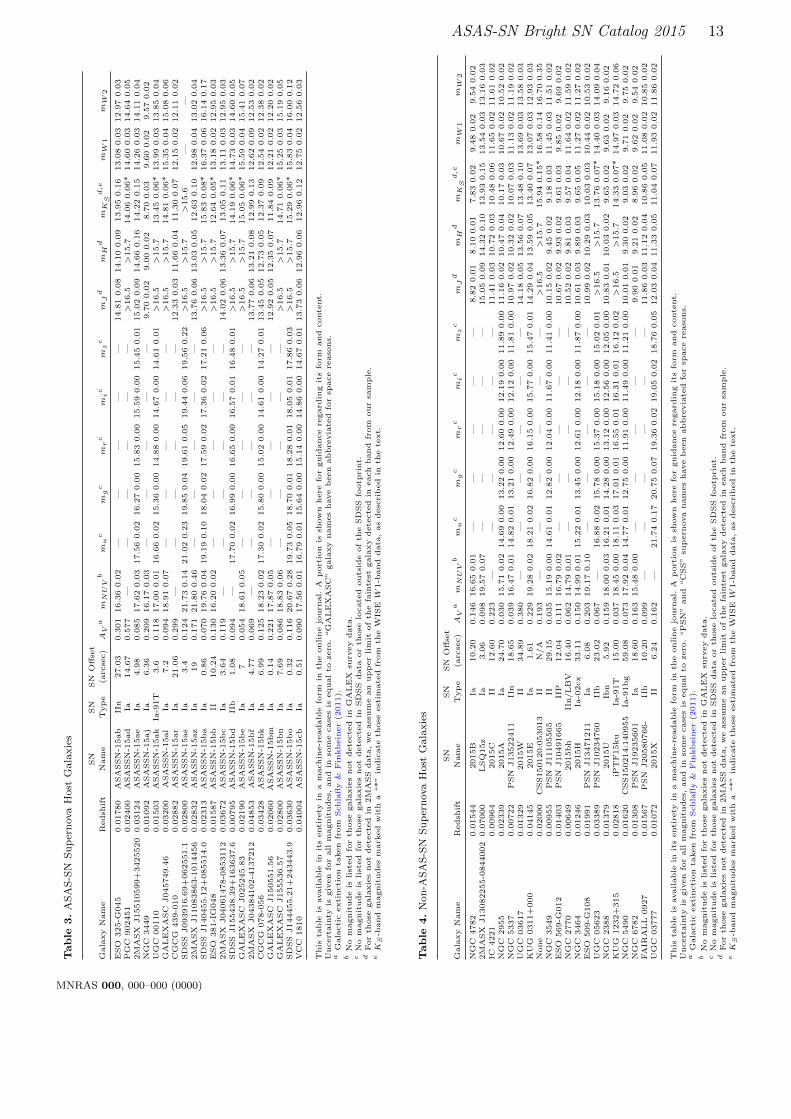
ASAS-SN Bright SN Catalog 2015 13
Table
3.
AS
AS
-SN
Su
per
nova
Host
Gala
xie
s
SN
SN
SN
Off
set
Gala
xy
Nam
eR
edsh
ift
Nam
eT
yp
e(a
rcse
c)
AV
am
NU
Vb
muc
mgc
mrc
mic
mzc
mJd
mH
dm
KS
d,e
mW
1m
W2
ESO
325-G
045
0.0
1780
ASA
SSN
-15ab
IIn
27.0
30.3
01
16.3
60.0
2—
——
——
14.8
10.0
814.1
00.0
913.9
50.1
613.0
80.0
312.9
70.0
3P
GC
902451
0.0
2400
ASA
SSN
-15ad
Ia14.6
70.5
77
——
——
——
>16.5
>15.7
14.0
60.0
6*
14.6
00.0
314.6
40.0
52M
ASX
J15510599+
3425520
0.0
3124
ASA
SSN
-15ae
Ia4.9
80.0
85
17.6
20.0
317.5
60.0
216.2
70.0
015.8
30.0
015.5
90.0
015.4
50.0
115.0
20.0
914.6
60.1
614.2
20.1
514.2
60.0
314.1
10.0
4N
GC
3449
0.0
1092
ASA
SSN
-15aj
Ia6.3
60.2
09
16.1
70.0
3—
——
——
9.7
00.0
29.0
00.0
28.7
00.0
39.6
00.0
29.5
70.0
2U
GC
00110
0.0
1503
ASA
SSN
-15ak
Ia-9
1T
3.6
0.1
18
17.0
00.0
116.6
60.0
215.3
60.0
014.8
80.0
014.6
70.0
014.6
10.0
1>
16.5
>15.7
13.4
50.0
6*
13.9
90.0
313.8
50.0
4G
AL
EX
ASC
J045749.4
60.0
3200
ASA
SSN
-15al
Ia7.2
0.0
94
18.9
10.0
7—
——
——
>16.5
>15.7
14.8
10.0
6*
15.3
50.0
415.0
80.0
6C
GC
G439-0
10
0.0
2882
ASA
SSN
-15ar
Ia21.0
60.2
99
——
——
——
12.3
30.0
311.6
60.0
411.3
00.0
712.1
50.0
212.1
10.0
2SD
SS
J093916.6
9+
062551.1
0.0
2800
ASA
SSN
-15as
Ia3.4
0.1
24
21.7
30.1
421.0
20.2
319.8
50.0
419.6
10.0
519.4
40.0
619.5
60.2
2>
16.5
>15.7
>15.6
——
2M
ASX
J11083863-1
014456
0.0
2832
ASA
SSN
-15az
Ia19
0.1
71
21.8
00.4
6—
——
——
13.7
60.0
613.0
30.0
512.6
30.1
012.9
80.0
413.0
20.0
4SD
SS
J140455.1
2+
085514.0
0.0
2313
ASA
SSN
-15ba
Ia0.8
60.0
70
19.7
60.0
419.1
90.1
018.0
40.0
217.5
90.0
217.3
60.0
217.2
10.0
6>
16.5
>15.7
15.8
30.0
8*
16.3
70.0
616.1
40.1
7E
SO
381-I
G048
0.0
1587
ASA
SSN
-15bb
II10.2
40.1
30
16.2
00.0
2—
——
——
>16.5
>15.7
12.6
40.0
5*
13.1
80.0
212.9
50.0
32M
ASX
J04061478-0
853112
0.0
3672
ASA
SSN
-15b
cIa
3.6
40.1
19
——
——
——
14.0
20.0
613.3
60.0
713.0
50.1
113.1
10.0
312.9
50.0
3SD
SS
J155438.3
9+
163637.6
0.0
0795
ASA
SSN
-15b
dII
b1.0
80.0
94
—17.7
00.0
216.9
90.0
016.6
50.0
016.5
70.0
116.4
80.0
1>
16.5
>15.7
14.1
90.0
6*
14.7
30.0
314.6
00.0
5G
AL
EX
ASC
J025245.8
30.0
2190
ASA
SSN
-15b
eIa
70.0
54
18.6
10.0
5—
——
——
>16.5
>15.7
15.0
50.0
6*
15.5
90.0
415.4
10.0
72M
ASX
J04384102-4
137212
0.0
4853
ASA
SSN
-15bf
Ia4.7
70.0
69
——
——
——
13.7
70.0
613.2
10.0
812.9
90.1
312.6
20.0
912.5
30.0
2C
GC
G078-0
56
0.0
3428
ASA
SSN
-15bk
Ia6.9
90.1
25
18.2
30.0
217.3
00.0
215.8
00.0
015.0
20.0
014.6
10.0
014.2
70.0
113.4
50.0
512.7
30.0
512.3
70.0
912.5
40.0
212.3
80.0
2G
AL
EX
ASC
J150551.5
60.0
2060
ASA
SSN
-15bm
Ia0.1
40.2
21
17.8
70.0
5—
——
——
12.9
20.0
512.3
50.0
711.8
40.0
912.2
10.0
212.2
00.0
2G
AL
EX
ASC
J155536.5
70.0
2800
ASA
SSN
-15bn
Ia7.6
90.0
86
18.8
30.0
6—
——
——
>16.5
>15.7
14.7
10.0
6*
15.2
50.0
315.1
90.0
5SD
SS
J144455.2
1+
243443.9
0.0
3630
ASA
SSN
-15b
oIa
0.3
20.1
16
20.6
70.2
819.7
30.0
518.7
00.0
118.2
80.0
118.0
50.0
117.8
60.0
3>
16.5
>15.7
15.2
90.0
6*
15.8
30.0
416.0
00.1
2V
CC
1810
0.0
4004
ASA
SSN
-15cb
Ia0.5
10.0
90
17.5
60.0
116.7
90.0
115.6
40.0
015.1
40.0
014.8
60.0
014.6
70.0
113.7
30.0
612.9
60.0
612.9
60.1
212.7
50.0
212.5
60.0
3
This
table
isavailable
init
senti
rety
ina
machin
e-r
eadable
form
inth
eonline
journ
al.
Ap
ort
ion
issh
ow
nhere
for
guid
ance
regard
ing
its
form
and
conte
nt.
Uncert
ain
tyis
giv
en
for
all
magnit
udes,
and
inso
me
case
sis
equal
tozero
.“G
AL
EX
ASC
”gala
xy
nam
es
have
been
abbre
via
ted
for
space
reaso
ns.
aG
ala
cti
cexti
ncti
on
taken
from
Schla
fly
&F
inkb
ein
er
(2011).
bN
om
agnit
ude
islist
ed
for
those
gala
xie
snot
dete
cte
din
GA
LE
Xsu
rvey
data
.c
No
magnit
ude
islist
ed
for
those
gala
xie
snot
dete
cte
din
SD
SS
data
or
those
locate
douts
ide
of
the
SD
SS
footp
rint.
dFor
those
gala
xie
snot
dete
cte
din
2M
ASS
data
,w
eass
um
ean
upp
er
lim
itof
the
fain
test
gala
xy
dete
cte
din
each
band
from
our
sam
ple
.e
KS
-band
magnit
udes
mark
ed
wit
ha
“*”
indic
ate
those
est
imate
dfr
om
the
WIS
EW
1-b
and
data
,as
desc
rib
ed
inth
ete
xt.
Table
4.
Non
-AS
AS
-SN
Su
per
nova
Host
Gala
xie
s
SN
SN
SN
Off
set
Gala
xy
Nam
eR
edsh
ift
Nam
eT
yp
e(a
rcse
c)
AV
am
NU
Vb
muc
mgc
mrc
mic
mzc
mJd
mH
dm
KS
d,e
mW
1m
W2
NG
C4782
0.0
1544
2015B
Ia10.2
00.1
46
16.6
50.0
1—
——
——
8.8
20.0
18.1
00.0
17.8
30.0
29.4
80.0
29.5
40.0
22M
ASX
J13082255-0
844002
0.0
7000
LSQ
15z
Ia3.0
60.0
98
19.5
70.0
7—
——
——
15.0
50.0
914.3
20.1
013.9
30.1
513.5
40.0
313.1
60.0
3IC
4221
0.0
0964
2015C
II12.6
00.2
23
——
——
——
11.4
10.0
310.7
20.0
310.4
80.0
611.6
50.0
211.6
10.0
2N
GC
2955
0.0
2339
2015A
Ia24.7
00.0
30
15.7
10.0
214.6
90.0
013.2
20.0
012.6
00.0
012.1
90.0
011.8
90.0
011.1
60.0
210.4
70.0
410.1
70.0
310.6
70.0
210.5
20.0
2N
GC
5337
0.0
0722
PSN
J13522411
IIn
18.6
50.0
39
16.4
70.0
114.8
20.0
113.2
10.0
012.4
90.0
012.1
20.0
011.8
10.0
010.9
70.0
210.3
20.0
210.0
70.0
311.1
30.0
211.1
90.0
2U
GC
03617
0.0
1329
2015W
II34.8
90.3
80
——
——
——
14.1
80.0
513.5
60.0
713.4
80.1
013.6
90.0
313.5
80.0
3K
UG
0311+
000
0.0
4145
2015E
Ia1.6
10.2
29
19.2
80.0
218.2
10.0
216.8
20.0
016.1
50.0
015.7
70.0
015.4
70.0
114.2
90.0
413.5
90.0
513.4
00.0
713.0
70.0
312.9
30.0
3N
one
0.0
2000
CSS150120:0
53013
IIN
/A
0.1
93
——
——
——
>16.5
>15.7
15.9
40.1
5*
16.5
80.1
416.7
00.3
5N
GC
3549
0.0
0955
PSN
J11105565
II29.1
50.0
35
15.1
90.0
014.6
10.0
112.8
20.0
012.0
40.0
011.6
70.0
011.4
10.0
010.1
50.0
29.4
50.0
29.1
80.0
311.4
50.0
311.5
10.0
2E
SO
569-G
012
0.0
1403
PSN
J10491665
IIP
12.0
40.1
11
16.7
90.0
2—
——
——
10.6
70.0
29.9
30.0
29.6
10.0
39.8
50.0
29.6
90.0
2N
GC
2770
0.0
0649
2015bh
IIn/L
BV
16.4
00.0
62
14.7
90.0
1—
——
——
10.5
20.0
29.8
10.0
39.5
70.0
411.6
40.0
211.5
90.0
2N
GC
3464
0.0
1246
2015H
Ia-0
2cx
33.1
10.1
50
14.9
90.0
115.2
20.0
113.4
50.0
012.6
10.0
012.1
80.0
011.8
70.0
010.6
10.0
39.8
90.0
39.6
50.0
511.2
70.0
211.2
70.0
2E
SO
509-G
108
0.0
1991
PSN
J13471211
Ia6.0
80.2
03
19.1
70.1
0—
——
——
10.9
90.0
210.2
90.0
310.0
30.0
310.4
40.0
210.5
30.0
2U
GC
05623
0.0
3389
PSN
J10234760
IIb
23.0
20.0
67
—16.8
80.0
215.7
80.0
015.3
70.0
015.1
80.0
015.0
20.0
1>
16.5
>15.7
13.7
60.0
7*
14.4
00.0
314.0
90.0
4N
GC
2388
0.0
1379
2015U
Ibn
5.9
20.1
59
18.0
00.0
316.2
10.0
114.2
80.0
013.1
20.0
012.5
60.0
012.0
50.0
010.8
30.0
110.0
30.0
29.6
50.0
29.6
30.0
29.1
60.0
2K
UG
1232+
315
0.0
2818
iPT
F15ku
Ia-9
1T
15.0
00.0
37
18.4
50.0
018.1
10.0
317.0
10.0
116.5
50.0
116.3
10.0
116.1
20.0
2>
16.5
>15.7
14.3
30.0
7*
14.9
70.0
314.7
20.0
6N
GC
5490
0.0
1620
CSS150214:1
40955
Ia-9
1bg
59.0
80.0
73
17.9
20.0
414.7
70.0
112.7
50.0
011.9
10.0
011.4
90.0
011.2
10.0
010.0
10.0
19.3
00.0
29.0
30.0
29.7
10.0
29.7
50.0
2N
GC
6782
0.0
1308
PSN
J19235601
Ia18.6
00.1
63
15.4
80.0
0—
——
——
9.9
00.0
19.2
10.0
28.9
60.0
29.6
20.0
29.5
40.0
2FA
IRA
LL
0927
0.0
1567
PSN
J20580766-
IIb
10.2
00.0
99
——
——
——
11.8
60.0
311.1
20.0
410.8
60.0
511.0
80.0
210.8
50.0
2U
GC
03777
0.0
1072
2015X
II6.2
40.1
62
—21.7
40.1
720.7
50.0
719.3
60.0
219.0
50.0
218.7
60.0
512.0
30.0
411.3
30.0
511.0
40.0
711.9
30.0
211.8
60.0
2
This
table
isavailable
init
senti
rety
ina
machin
e-r
eadable
form
inth
eonline
journ
al.
Ap
ort
ion
issh
ow
nhere
for
guid
ance
regard
ing
its
form
and
conte
nt.
Uncert
ain
tyis
giv
en
for
all
magnit
udes,
and
inso
me
case
sis
equal
tozero
.“P
SN
”and
“C
SS”
sup
ern
ova
nam
es
have
been
abbre
via
ted
for
space
reaso
ns.
aG
ala
cti
cexti
ncti
on
taken
from
Schla
fly
&F
inkb
ein
er
(2011).
bN
om
agnit
ude
islist
ed
for
those
gala
xie
snot
dete
cte
din
GA
LE
Xsu
rvey
data
.c
No
magnit
ude
islist
ed
for
those
gala
xie
snot
dete
cte
din
SD
SS
data
or
those
locate
douts
ide
of
the
SD
SS
footp
rint.
dFor
those
gala
xie
snot
dete
cte
din
2M
ASS
data
,w
eass
um
ean
upp
er
lim
itof
the
fain
test
gala
xy
dete
cte
din
each
band
from
our
sam
ple
.e
KS
-band
magnit
udes
mark
ed
wit
ha
“*”
indic
ate
those
est
imate
dfr
om
the
WIS
EW
1-b
and
data
,as
desc
rib
ed
inth
ete
xt.
MNRAS 000, 000–000 (0000)
![1 arXiv:1803.05448v1 [astro-ph.HE] 14 Mar 2018 · The combined light curve of PG1302-102 from CRTS (black) and ASAS-SN (blue). The ASAS-SN light curve has been offset to match CRTS](https://static.fdocuments.net/doc/165x107/5ccc617388c99335448c0456/1-arxiv180305448v1-astro-phhe-14-mar-2018-the-combined-light-curve-of-pg1302-102.jpg)