Artificial Intelligence and EPRI: What’s Next AI Power Lab Simmins - Grid... · AI Power Lab AI...
69
© 2017 Electric Power Research Institute, Inc. All rights reserved. Dr. Andrew Phillips Vice President, Transmission and Distribution Dr. John Simmins Technical Executive The Applications and Challenges of AI Technology in Power System Forum April 27, 2018 Artificial Intelligence and EPRI: What’s Next AI Power Lab
Transcript of Artificial Intelligence and EPRI: What’s Next AI Power Lab Simmins - Grid... · AI Power Lab AI...

© 2017 Electric Power Research Institute, Inc. All rights reserved.
Dr. Andrew PhillipsVice President,
Transmission and DistributionDr. John Simmins
Technical Executive
The Applications and Challenges of AI Technology in Power System Forum
April 27, 2018
Artificial Intelligence and EPRI: What’s Next
AI Power Lab


3© 2018 Electric Power Research Institute, Inc. All rights reserved.
EPRI.AI/EPRI AI Energy Hub/ EPRI AI Power Lab
4© 2018 Electric Power Research Institute, Inc. All rights reserved.
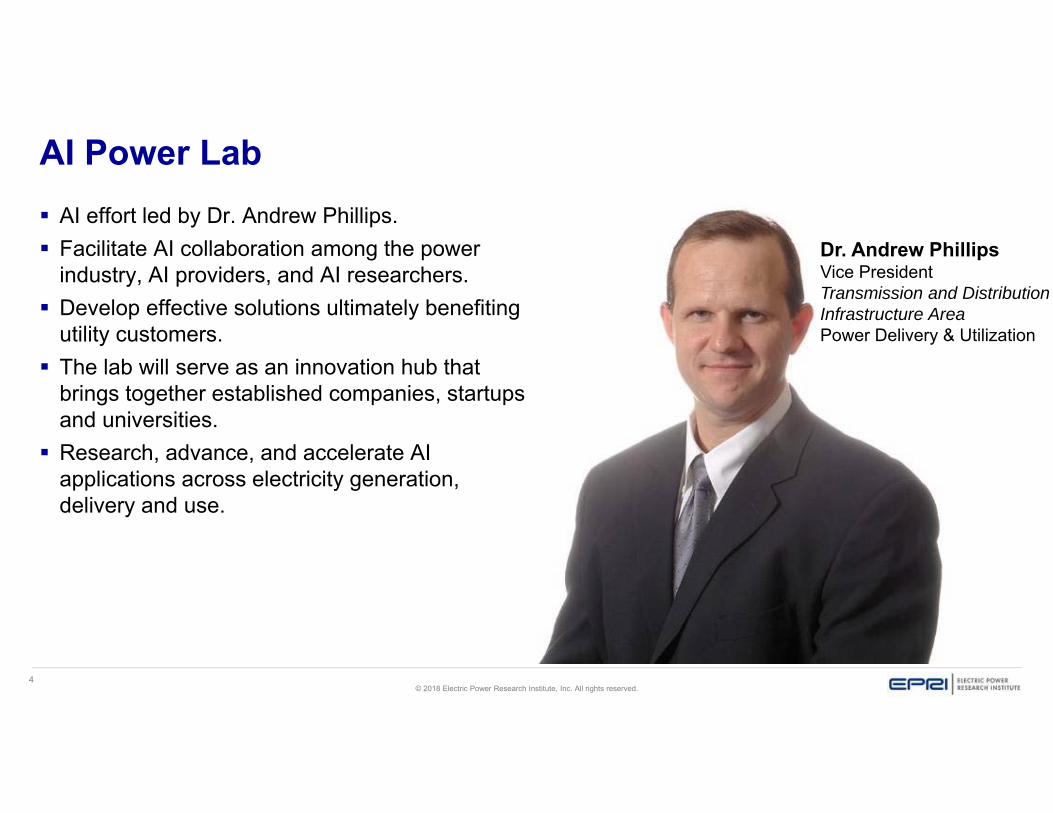
AI Power Lab AI effort led by Dr. Andrew Phillips. Facilitate AI collaboration among the power
industry, AI providers, and AI researchers. Develop effective solutions ultimately benefiting
utility customers. The lab will serve as an innovation hub that
brings together established companies, startups and universities.
Research, advance, and accelerate AI applications across electricity generation, delivery and use.
Dr. Andrew PhillipsVice PresidentTransmission and Distribution Infrastructure AreaPower Delivery & Utilization
5© 2018 Electric Power Research Institute, Inc. All rights reserved.
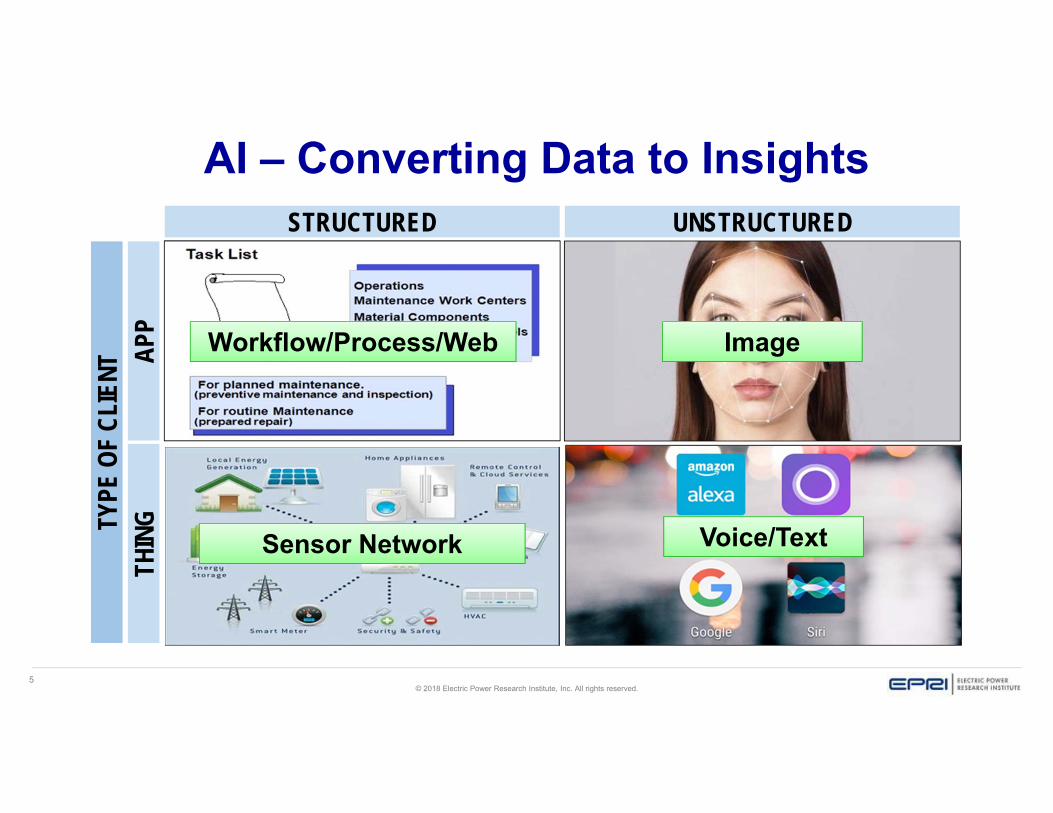
AI – Converting Data to InsightsTY
PE O
F CL
IENT
STRUCTURED UNSTRUCTURED
APP
THIN
G
Image
Voice/Text
Workflow/Process/Web
Sensor Network

6© 2018 Electric Power Research Institute, Inc. All rights reserved.

AI Platforms – Democratization of AI
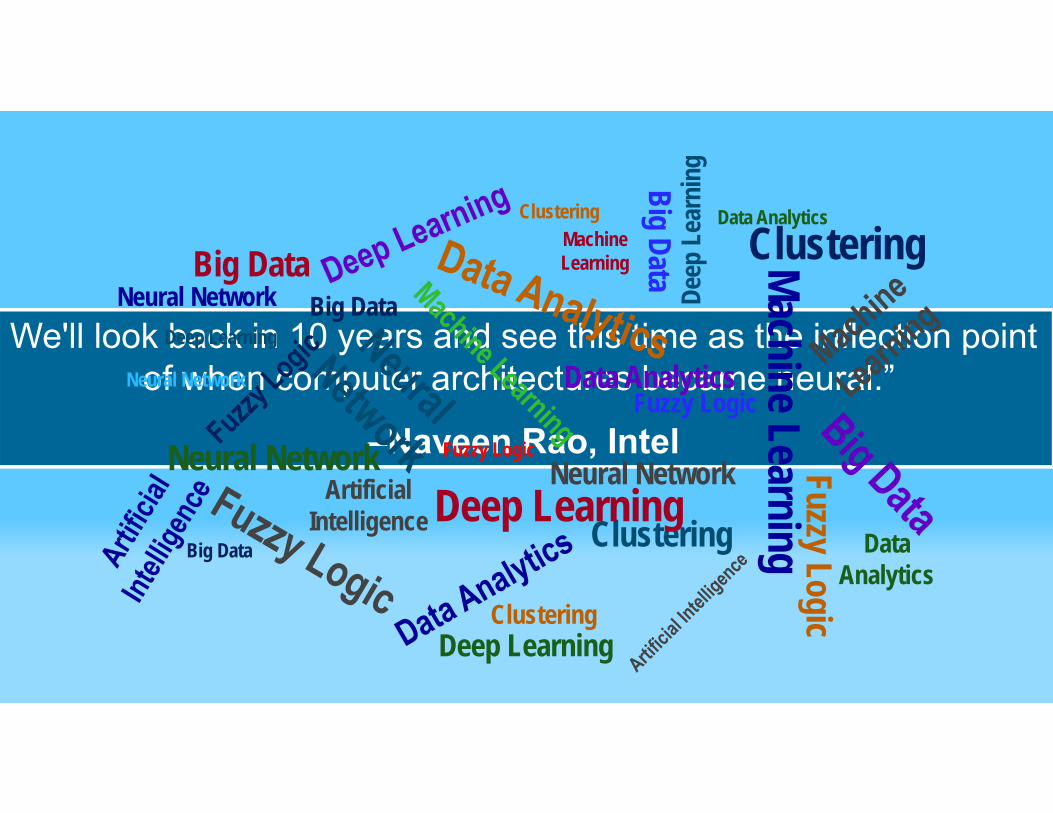
We'll look back in 10 years and see this time as the inflection point of when computer architectures became neural.”
–Naveen Rao, Intel
Big Data
ArtificialIntelligence
Deep
Lea
rnin
g
Neural Network
Fuzzy Logic
Clustering
Data Analytics
Big Data
Deep Learning
Neural Network
Data Analytics
Big Data
Neural Network Fuzzy Logic
Clustering
Machine LearningDeep Learning
Clustering
Big Data
MachineLearning
Deep Learning
Neural Network
Fuzzy Logic
Clustering Data Analytics

How does machine become neural and mimic a human brain?
0
0
0
1/0
1
1
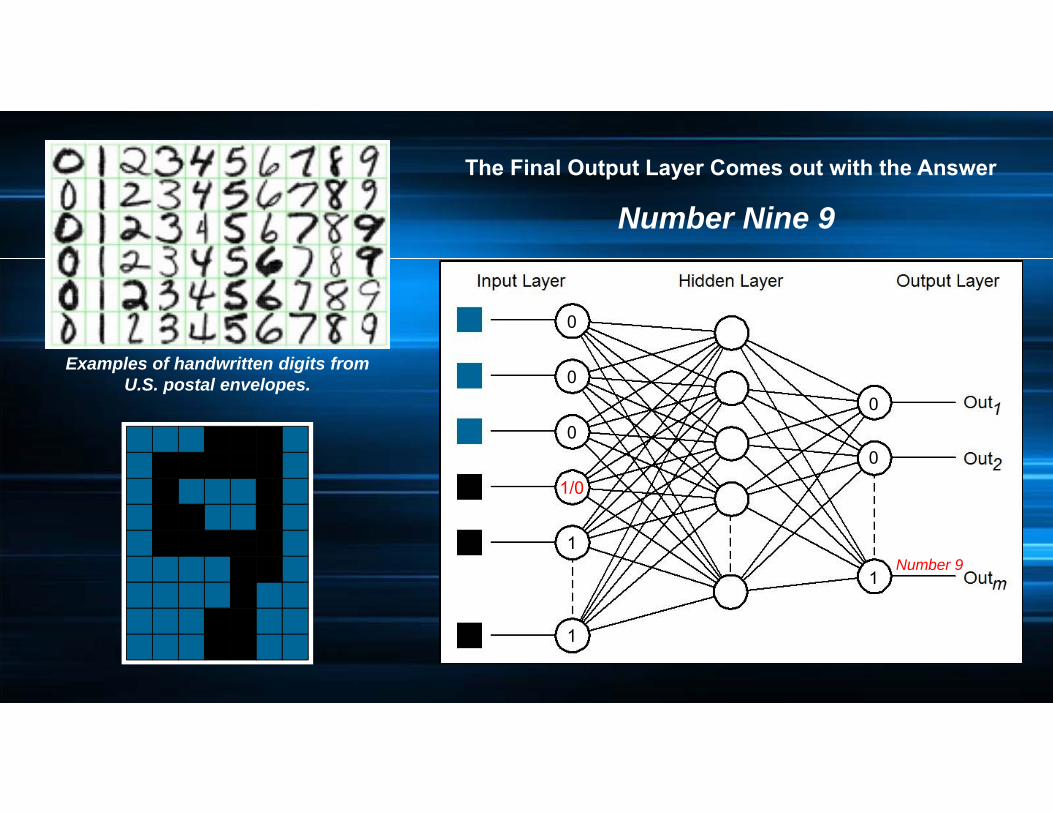
Examples of handwritten digits from U.S. postal envelopes.

0
0
0
1/0
1
1
What are the Hidden Layers Doing?
Feature Extraction
Examples of handwritten digits from U.S. postal envelopes.

What are the Hidden Layers Doing?
Feature Extraction – Feature Vertical Lines
vertical lines

What are the Hidden Layers Doing?
Feature Extraction – Feature Horizontal Lines
horizontal lines

Deep Learning Automates Feature Extraction (Machine is Learning on its own)
small circles
0
0
0
1/0
1
1
The Final Output Layer Comes out with the Answer
Number Nine 9
1
0
0
Number 9
Examples of handwritten digits from U.S. postal envelopes.


A Person on a beach flying a kite


Sandwich Cut in Half
19© 2018 Electric Power Research Institute, Inc. All rights reserved.
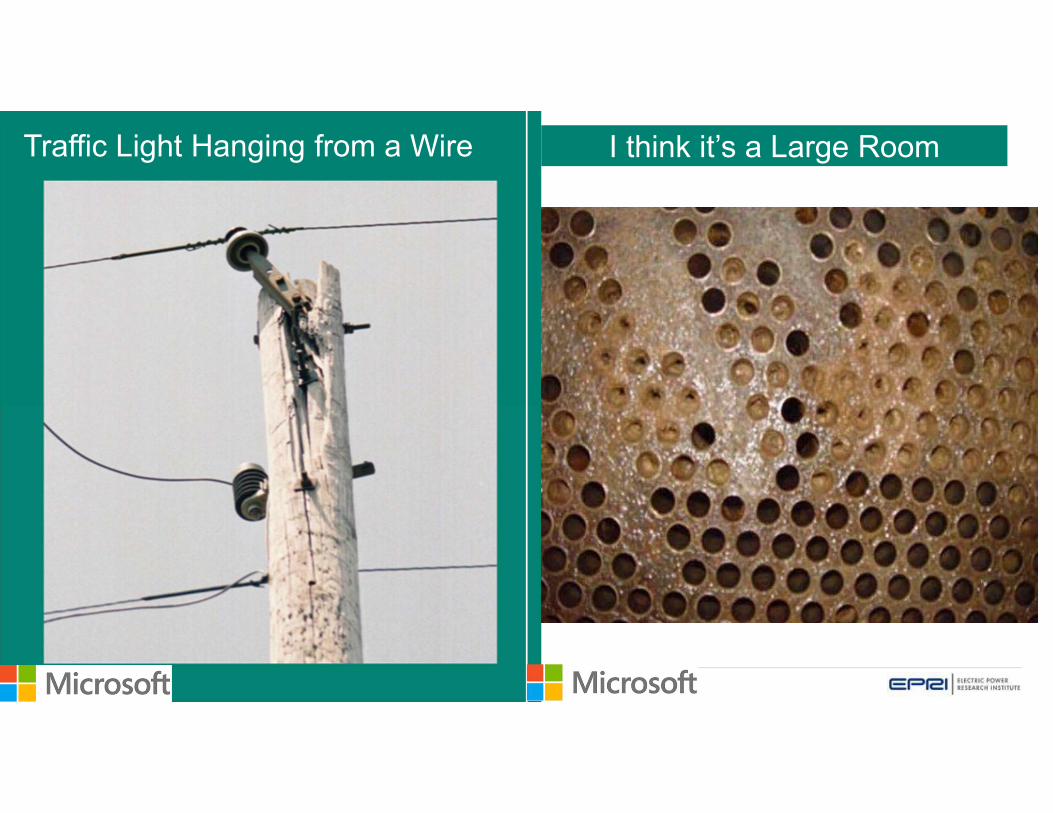
20© 2018 Electric Power Research Institute, Inc. All rights reserved.
Traffic Light Hanging from a Wire I think it’s a Large Room

21© 2018 Electric Power Research Institute, Inc. All rights reserved.

22© 2018 Electric Power Research Institute, Inc. All rights reserved.

23© 2018 Electric Power Research Institute, Inc. All rights reserved.
EPRI Power Vision API

24© 2018 Electric Power Research Institute, Inc. All rights reserved.
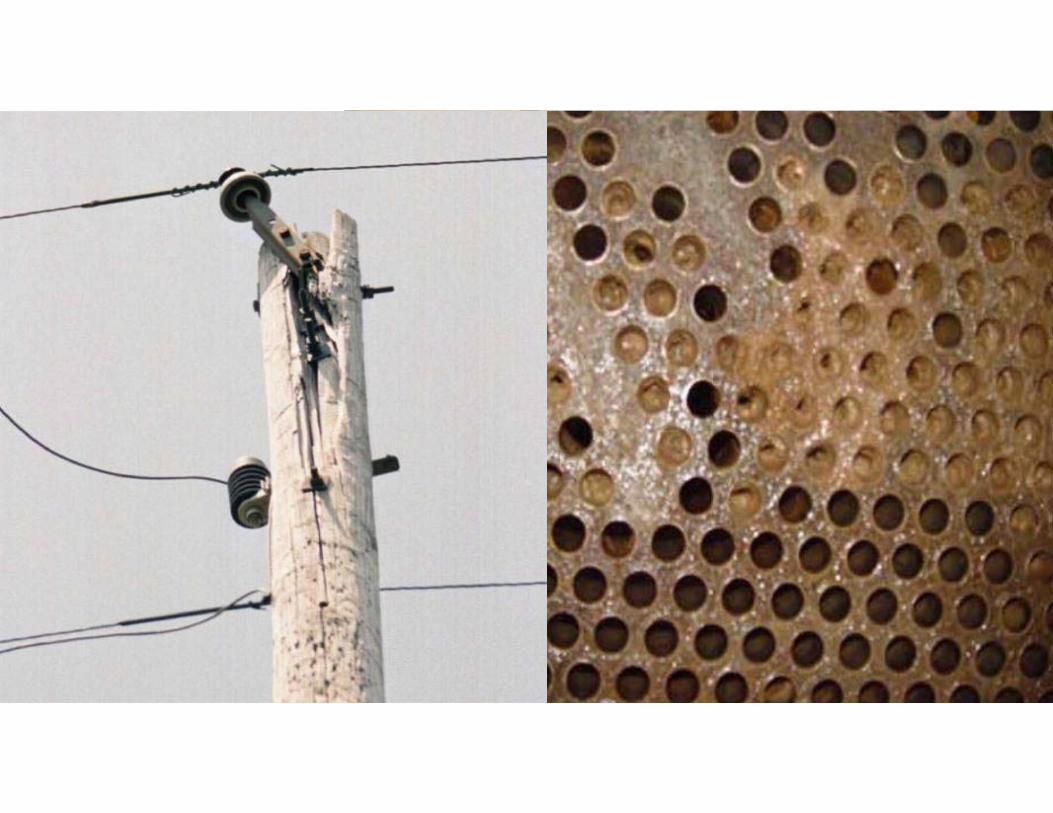
Condenser Tube Calcium ScalingDeteriorated Wooden Pole Top
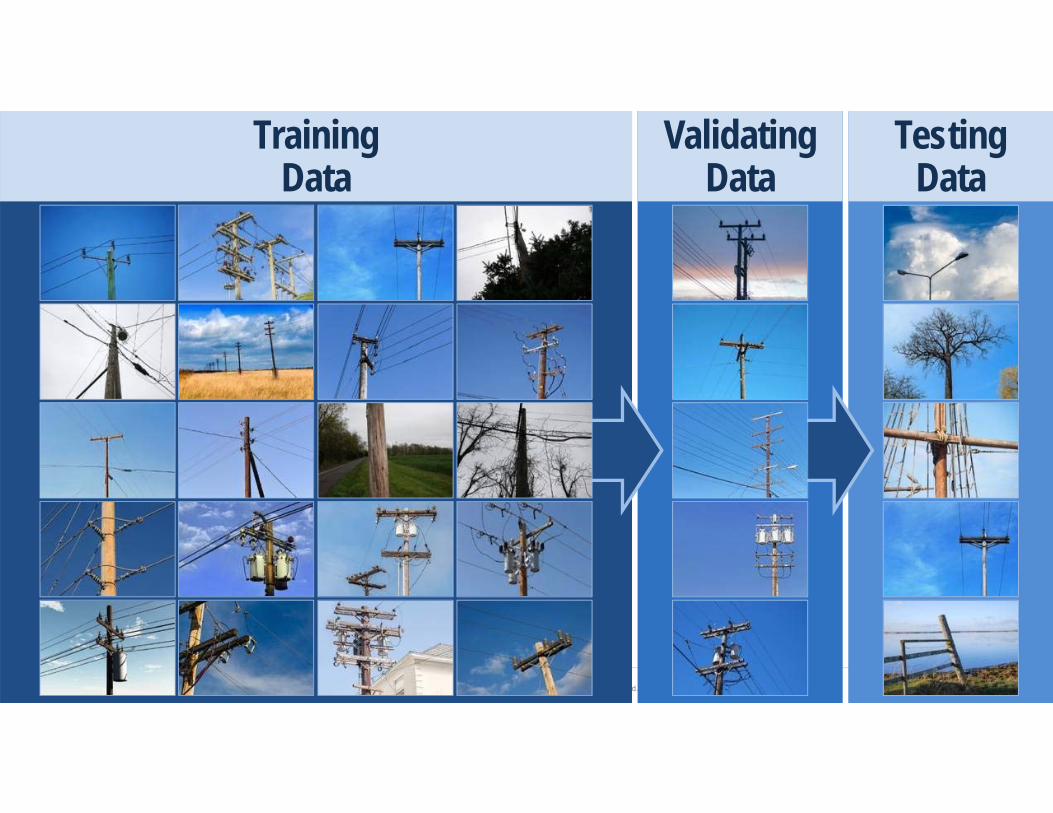
25© 2018 Electric Power Research Institute, Inc. All rights reserved.
TestingData
Validating Data
TrainingData

26© 2018 Electric Power Research Institute, Inc. All rights reserved.
Data Privacy/Security/Governance
Unmasked Data
Masked PII
Data
Masked CEII Data
Masked Grid Ops
Data
Masked Plant Data
Public Data
Masked Load Data
Level 1&2 Data “Single Factor” Clearance?
Level 3&4 Data “Two Factor” Clearance?
EPRI’s Data Analytics
Board Initiative is Building the
Foundation for EPRI AI Lab
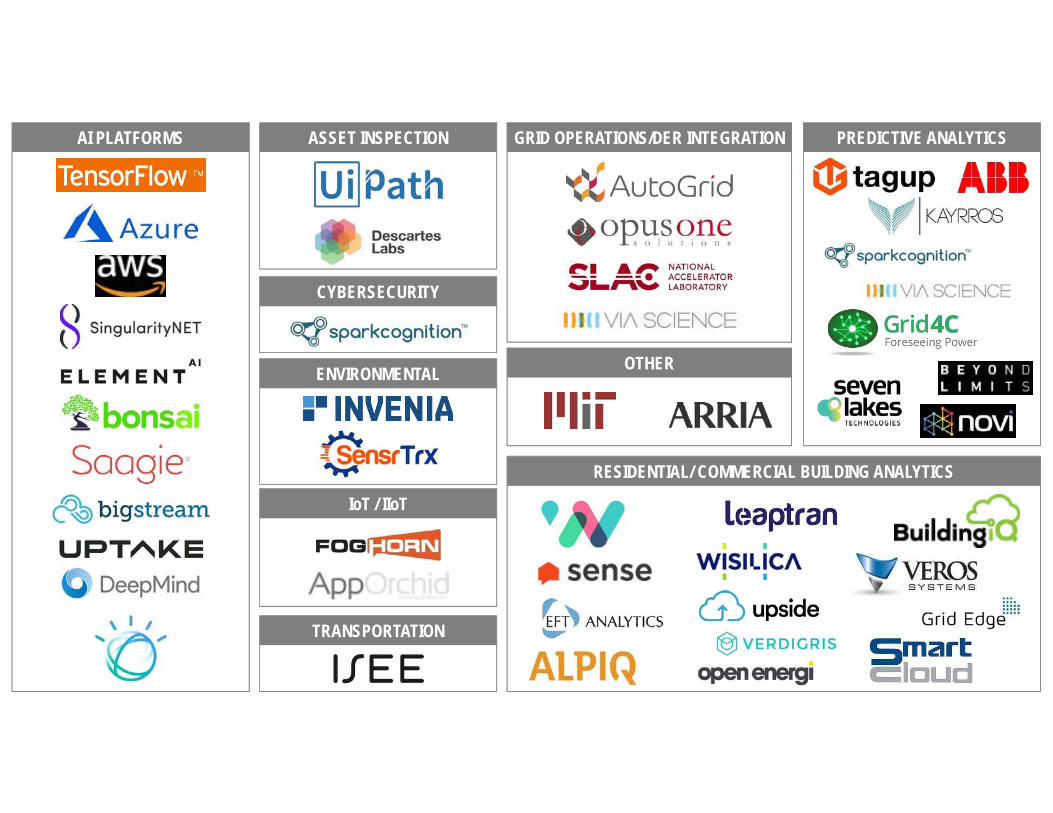
AI PLATFORMS ASSET INSPECTION
CYBERSECURITY
ENVIRONMENTAL
GRID OPERATIONS/DER INTEGRATION
IoT / IIoT
TRANSPORTATION
RESIDENTIAL/ COMMERCIAL BUILDING ANALYTICS
OTHER
PREDICTIVE ANALYTICS

Vision of EPRI.AI/EPRI AI Lab/EPRI AI Energy Hub– Advancing AI for the Electricity Sector
Utility & EPRI Experts Innovators/Startups/UniversitiesData Sets
29© 2018 Electric Power Research Institute, Inc. All rights reserved.
Example Use Case – T&D Infrastructure

30© 2018 Electric Power Research Institute, Inc. All rights reserved.
Opportunities for Distribution Assets
Asset Inspections
Vegetation Management
Storm Assessment
Others?
Acquire
Use
“Street View” Style Images
UAS and Aerial
Crowd-sourced
Images as a Service
AI is the Link

31© 2018 Electric Power Research Institute, Inc. All rights reserved.
Background Existing GIS information on
distribution assets is often incomplete and inaccurate This is bad if we want to rely
on distribution to implement a smart and resilient electric grid Improving the quality of GIS
data is a time-consuming and expensive exercise, unless……we do this in a virtual
world using virtual utility crews

32© 2018 Electric Power Research Institute, Inc. All rights reserved.
How would you rate the completeness of your GIS?
Source: Is Your GIS Smart Grid Ready? Esri 2010

33© 2018 Electric Power Research Institute, Inc. All rights reserved.
How would you rate the completeness of your GIS? Customer –
transformer Customer – phase Topology Street lights Dual use Three phaseOrientation Distributed energy
resources Conflation Type of poles Encroachment

34© 2018 Electric Power Research Institute, Inc. All rights reserved.
Traditional methods
InspectionsLIDAR

35© 2018 Electric Power Research Institute, Inc. All rights reserved.
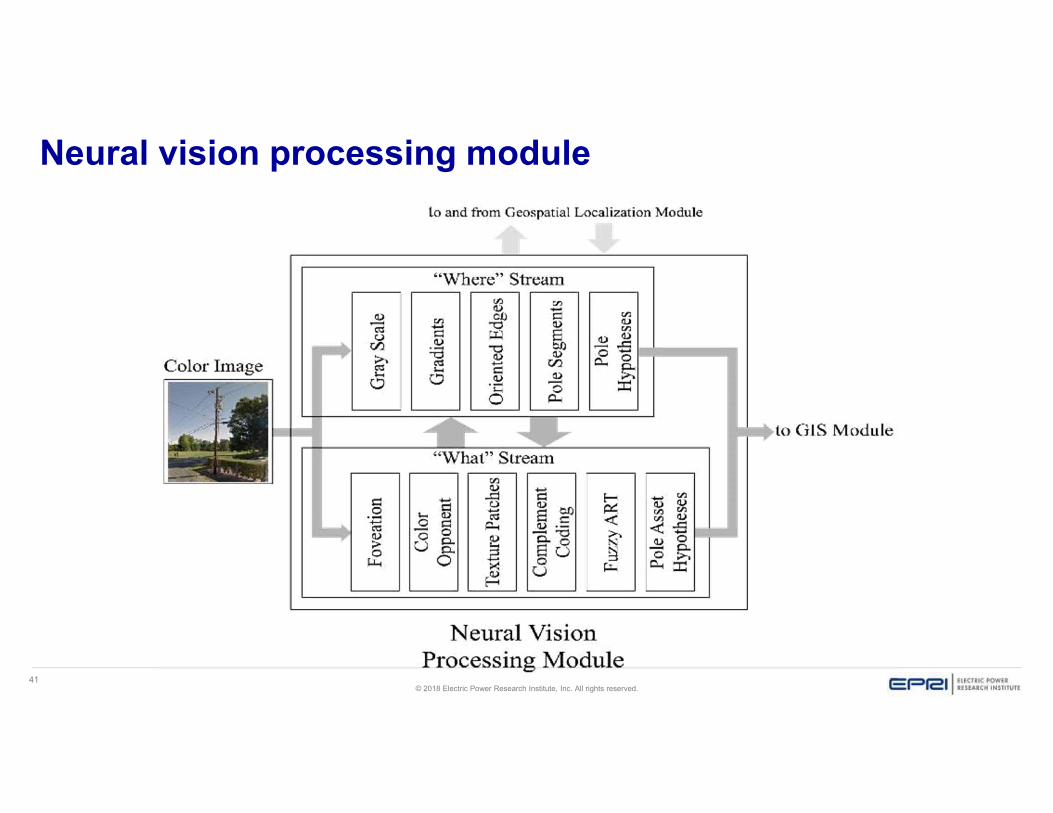
Identifying assets
“Biologically inspired, forward
pass, neural network.
“Using the same visual cues
as a human or animal would
to identify an object.”

36© 2018 Electric Power Research Institute, Inc. All rights reserved.
3 - Things
Source of data Identify
assetsMeasure
location

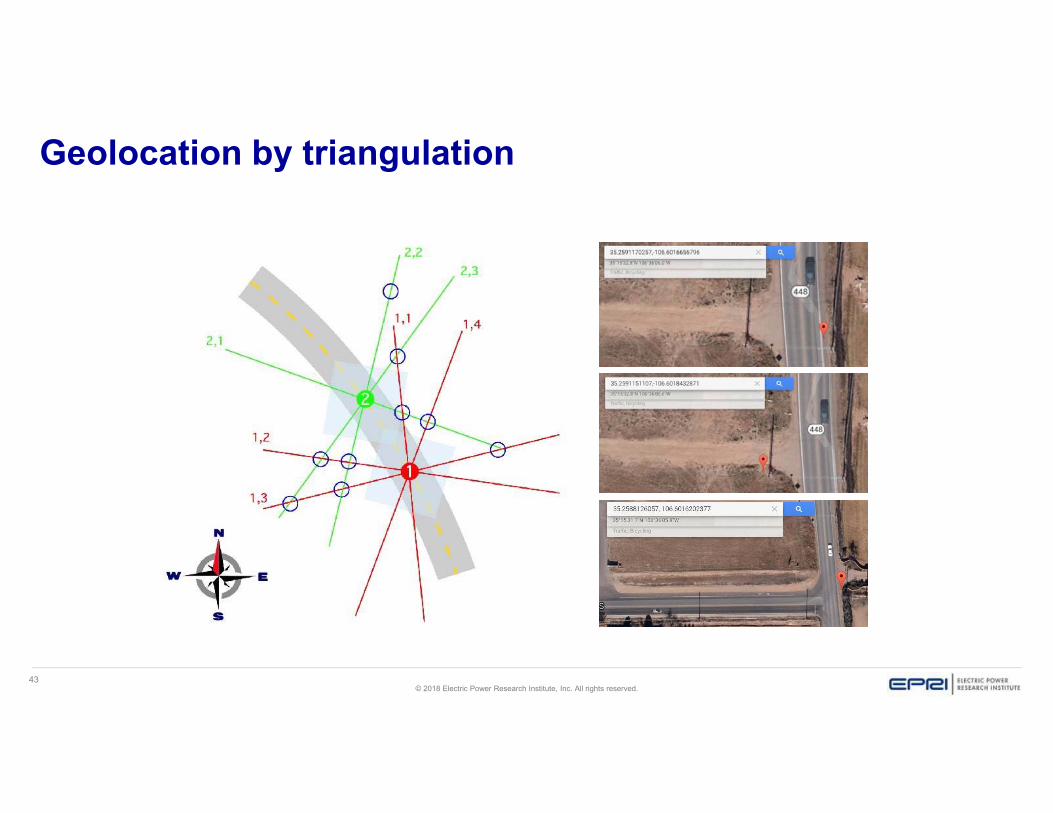
37© 2018 Electric Power Research Institute, Inc. All rights reserved.
Current Steps in AI Based Feasibility Demostration System define street route collect image panoramas at
fixed GPS locations detect vertical structures
using vision system cull false positives to produce
pole hypotheses geolocate producing GPS
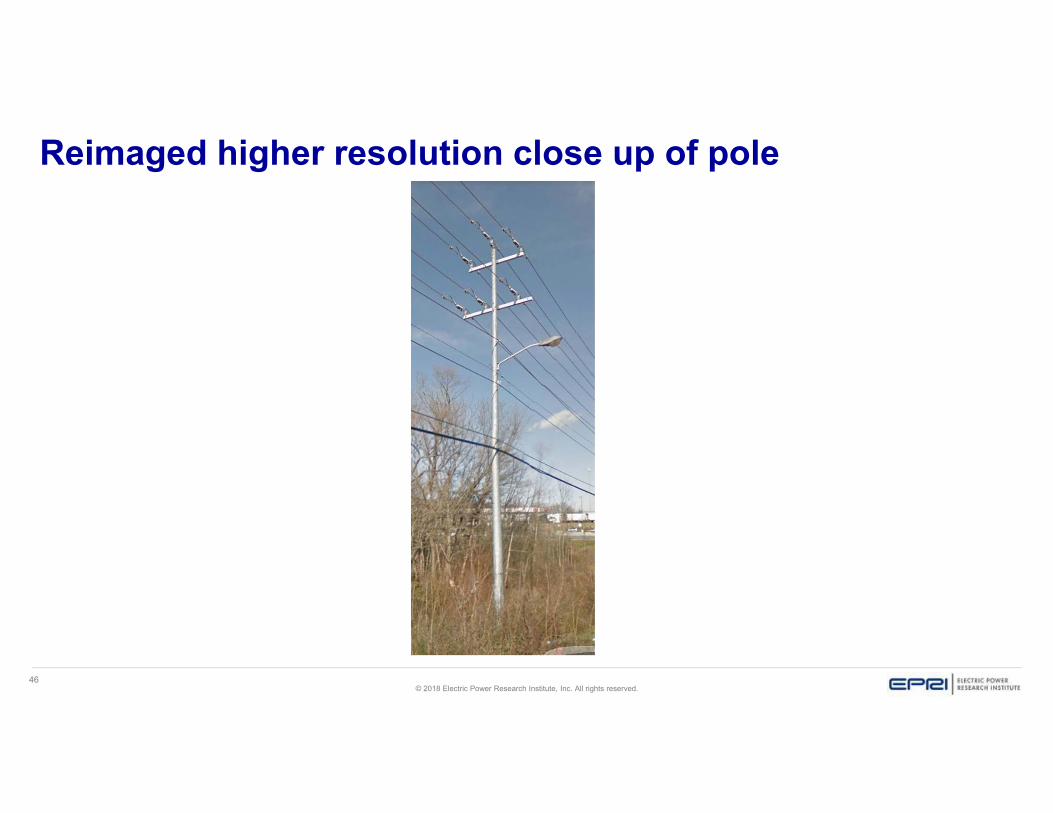
coordinates and log results reimage poles to from optimal
location to increase detail precisely locate pole edges
using vision system foveate along extent of pole
to produce asset hypotheses cull false positives quantify properties of assets
and log results

38© 2018 Electric Power Research Institute, Inc. All rights reserved.
Path definition

39© 2018 Electric Power Research Institute, Inc. All rights reserved.
Image acquisition

40© 2018 Electric Power Research Institute, Inc. All rights reserved.
Typical panorama
41© 2018 Electric Power Research Institute, Inc. All rights reserved.
Neural vision processing module

42© 2018 Electric Power Research Institute, Inc. All rights reserved.
Vertical structure detection and culling
43© 2018 Electric Power Research Institute, Inc. All rights reserved.
Geolocation by triangulation

44© 2018 Electric Power Research Institute, Inc. All rights reserved.
Clustering of multiple image locations

45© 2018 Electric Power Research Institute, Inc. All rights reserved.
Some statistics for pole detection
TT 83.3% TF 16.7% FT 37.5%
46© 2018 Electric Power Research Institute, Inc. All rights reserved.
Reimaged higher resolution close up of pole

47© 2018 Electric Power Research Institute, Inc. All rights reserved.
Precise localization of pole

48© 2018 Electric Power Research Institute, Inc. All rights reserved.
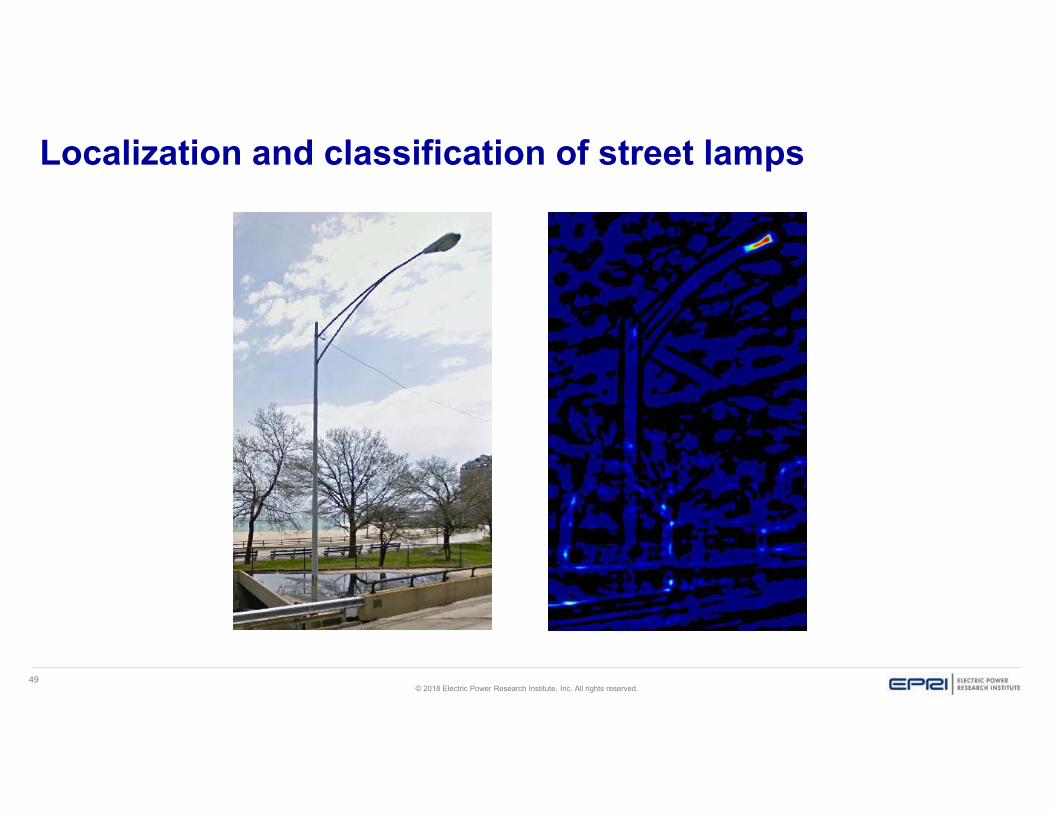
Foveation to locate transverse assests
1- pole height and width
2- cross member location & projected length
3- street light support strut location and length
4- large cable connection locations
49© 2018 Electric Power Research Institute, Inc. All rights reserved.
Localization and classification of street lamps

50© 2018 Electric Power Research Institute, Inc. All rights reserved.
Localization and classification of transformers

51© 2018 Electric Power Research Institute, Inc. All rights reserved.
Why aren’t we doing it?
“Using image processing, we can detect _____% of our most common defects.”
“Ground based imagery works well for _____, but UAS imagery is better for ______.”
“Automated image processing works, we just have to make sure we _____.”
“Image processing is a possibility, but the technology is ____ years away.”
Fill in the blank:
“We already have access to images of ____% of our assets.”
52© 2018 Electric Power Research Institute, Inc. All rights reserved.
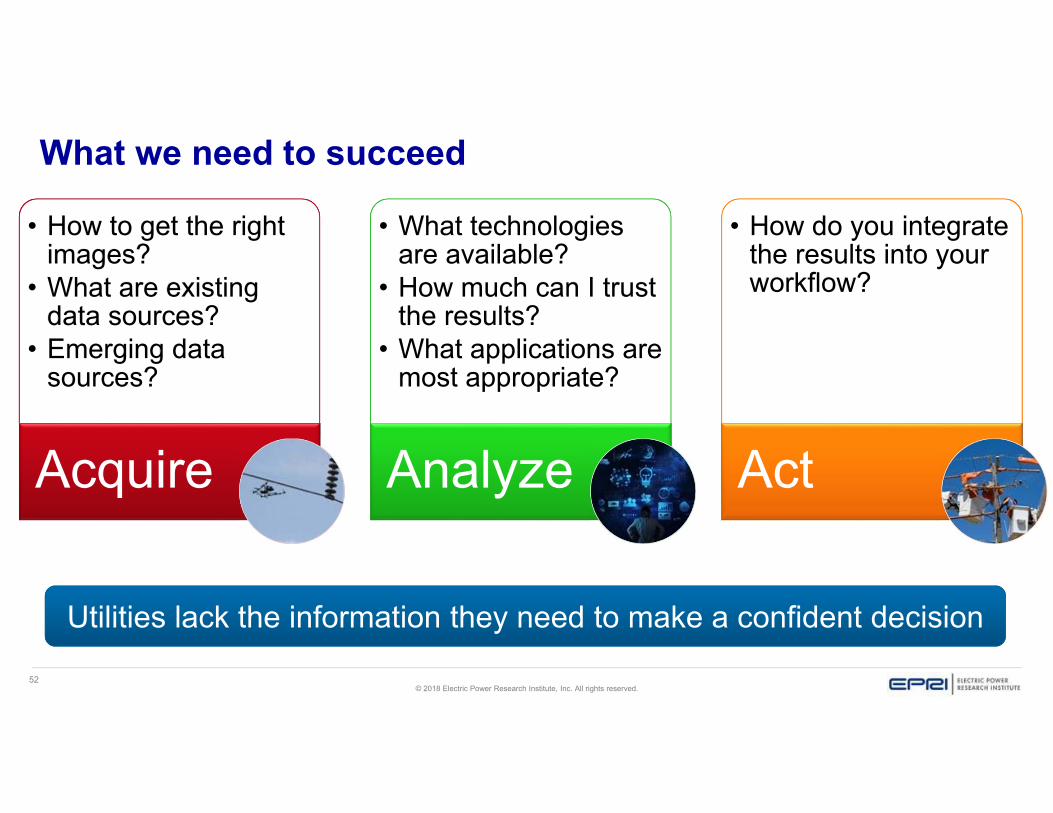
What we need to succeed
• How to get the right images?
• What are existing data sources?
• Emerging data sources?
• How to get the right images?
• What are existing data sources?
• Emerging data sources?
Acquire
• What technologies are available?
• How much can I trust the results?
• What applications are most appropriate?
• What technologies are available?
• How much can I trust the results?
• What applications are most appropriate?
Analyze
• How do you integrate the results into your workflow?
• How do you integrate the results into your workflow?
Act
Utilities lack the information they need to make a confident decision

53© 2018 Electric Power Research Institute, Inc. All rights reserved.
EPRI Approach for Distribution Assets Image Analytics
Get Data Facilitate EvaluateObjective
Performance Information

54© 2018 Electric Power Research Institute, Inc. All rights reserved.
The EPRI Approach
Get Data Facilitate EvaluateObjective
Performance Information
Significant #
Many Scenarios
Various Conditions
Classified
Anonymized
Multiple Technology Providers
“Blind” Data Set
Well defined & implemented approach
Valid Metrics

55© 2018 Electric Power Research Institute, Inc. All rights reserved.
What next?
Build project team
Acquire imagery
Create datasets
Train & evaluate vendors
Analyze output
Report on results
Next Step:1. Share current practices and any AI projects underway2. Brainstorm potential use cases3. Develop ideas for new image sources4. Executives to identify an SME to contribute5. Connect us with the owners of imagery in your organization

56© 2018 Electric Power Research Institute, Inc. All rights reserved.
Executive Advisory Panel
Michael LewisSr. VP Distribution
Greg DudkinPresident
Tom KirkpatrickVP Customer &Distribution
Kenny MercadoSVP Electric Operations
Phil HerringtonSr. VP T&D
Matt KetschkeSr. VP Customer Energy Solutions
Marco BruzzanoVP Distribution Operations
Dave KarafaVP Distribution
Cecily BarnesVP Energy Delivery
Cedric GreenVP Support Services
Danny LindseyVP T&D Infrastructure
Jim PrattSr. Director GridModernization
Heidi BenedictSr. Director Business Innovation
57© 2018 Electric Power Research Institute, Inc. All rights reserved.
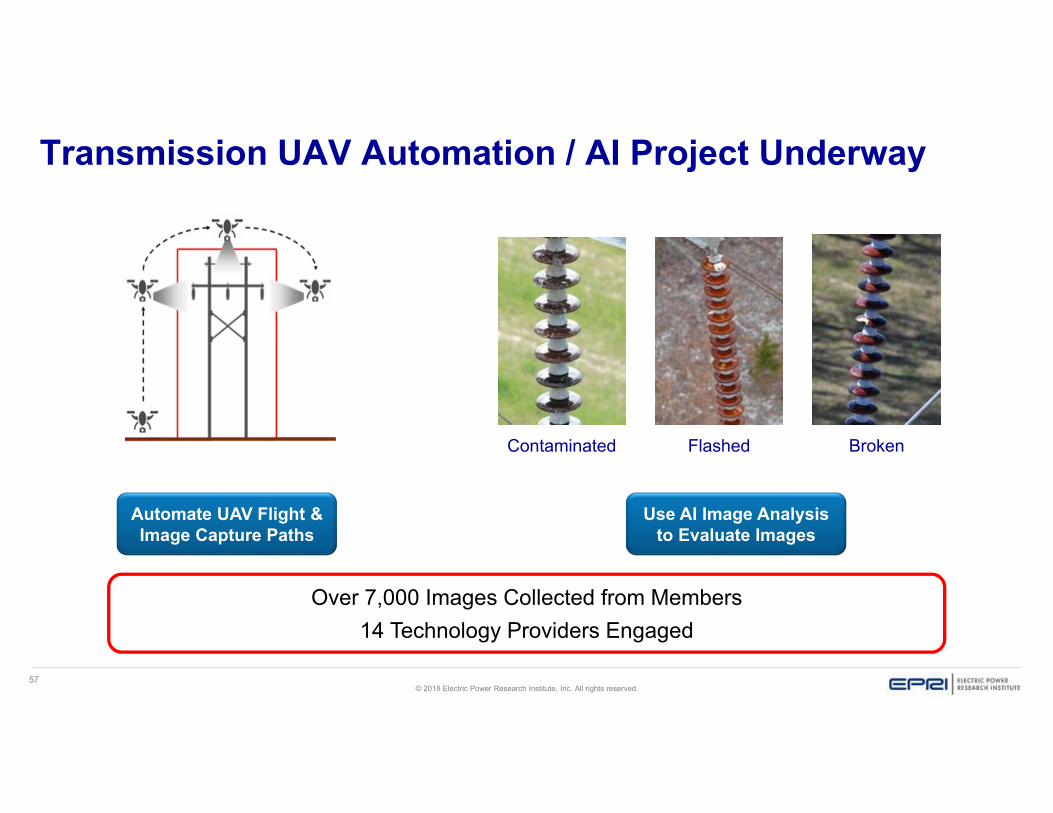
Transmission UAV Automation / AI Project Underway
Contaminated Flashed Broken
Automate UAV Flight & Image Capture Paths
Use AI Image Analysis to Evaluate Images
Over 7,000 Images Collected from Members14 Technology Providers Engaged

58© 2018 Electric Power Research Institute, Inc. All rights reserved.
PARTICIPATING UTILITIES PARTICIPATING TECHNOLOGY PROVIDERS

59© 2018 Electric Power Research Institute, Inc. All rights reserved.
UAV Images Collected from Participants
25 Categories1. No Condition
2. Flashed Insulators
3. Broken Insulators
4. Missing Cotter Pin
5. …
Transmission Image Database
Training Set 1
Test Set 1
Future Training and Testing
Unusable Images7,876 1,069
550
1,665
3,284
4,592
EPRI

60© 2018 Electric Power Research Institute, Inc. All rights reserved.
Identified: Cracked Porcelain Disc- 88% confidence
3 Vendor Tests Completed to Date: Examples from Vendor 1
Not Identified: Wood Pole Cavity
Vendor 1 indicated ability to identify 7 of 25 Categories after Training

61© 2018 Electric Power Research Institute, Inc. All rights reserved.
Performance Quantification: Vendor 1
Weak Negative RelationshipModerate Negative Relationship
Strong Negative Relationship
Very Strong Negative Relationship
Very Strong Positive Relationship
Moderate Positive RelationshipWeak Positive Relationship
Negligible Relationship
Strong Positive Relationship
1
-1
0.7
0.40.30.2
-0.2-0.3-0.4
-0.7
0
Classifier MCC
Wood Pole Cap Defect 0.908
Damaged Damper 0.903
Corroded Connector 0.862
Wood Pole Cavity 0.782
Damaged Conductor 0.774
Broken Porcelain Insulator 0.705
Good Conductor 0
85% of the 7 Condition Categories Identified
Mathews Correlation Coefficient

62© 2018 Electric Power Research Institute, Inc. All rights reserved.
• Advances in AI create an opportunity for utilities.Why• Increased confidence in the technology and industries’
ability to use it effectivelyWhat• Gather images using existing and emerging techniques• Train and evaluate image processing vendorsHow• Engage utility SMEs and acquire imagesWhat Next

63© 2018 Electric Power Research Institute, Inc. All rights reserved.
Example Use Case – Customer

64© 2018 Electric Power Research Institute, Inc. All rights reserved.
Applying Analytics at the Customer LevelUse case – Predicting HVAC Failure Using AMI Data
Objective:Achieve greater accuracy and less latency in predictions of when and where failures are likely to occur.
Approach: Collect industry data Curate data for analysis Run machine learning algorithms to train predictive modelsMake available to innovators to create new algorithms and
applications

65© 2018 Electric Power Research Institute, Inc. All rights reserved.
Beyond AMI & HVAC… Leveraging Multiple Data Sources and Applications
Advanced Energy
Community

66© 2018 Electric Power Research Institute, Inc. All rights reserved.
Hold industry workshops
Developing the Framework for a Customer Data Analytics Platform
Develop use cases
Define data requirements
Define architecture and system requirements
Create Customer Data Analytics Platform
Create data lake and analyze
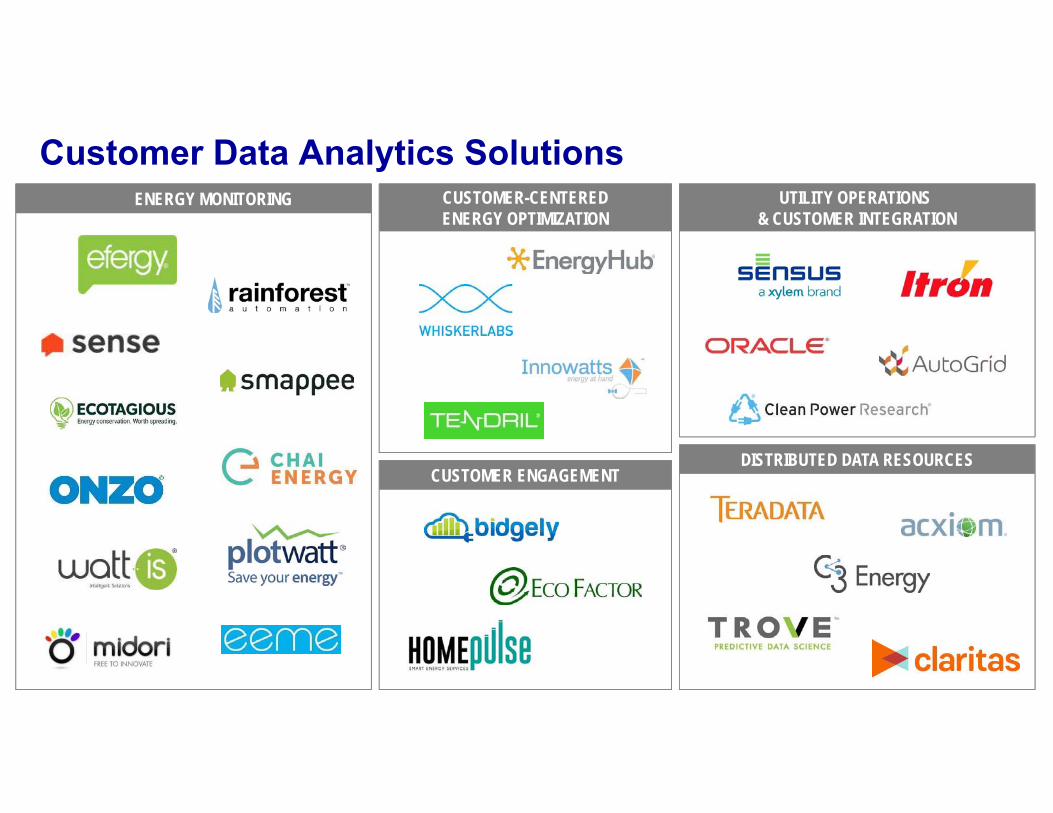
ENERGY MONITORING
Customer Data Analytics SolutionsUTILITY OPERATIONS
& CUSTOMER INTEGRATIONCUSTOMER-CENTEREDENERGY OPTIMIZATION
CUSTOMER ENGAGEMENTDISTRIBUTED DATA RESOURCES

68© 2018 Electric Power Research Institute, Inc. All rights reserved.
Vision of EPRI.AI/EPRI AI Lab/EPRI AI Energy Hub– Advancing AI for the Electricity Sector
Utility & EPRI Experts Innovators/Startups/UniversitiesData Sets

69© 2018 Electric Power Research Institute, Inc. All rights reserved.
EPRI.AI/EPRI AI Energy Hub/ EPRI AI Power Lab