INTERNATIONAL JOURNAL OF PHARMACEUTICAL … 784.pdfAvailable Online at
Upload
hoangnguyetCategory
view
214download
1
Global and Planetary Change xxx (2009) xxx–xxx
GLOBAL-01454; No of Pages 15
Contents lists available at ScienceDirect
Global and Planetary Change
j ourna l homepage: www.e lsev ie r.com/ locate /g lop lacha
ARTICLE IN PRESS
The role of currents and sea ice in both slowly deposited central Arctic and rapidlydeposited Chukchi–Alaskan margin sediments
D.A. Darby a,⁎, J. Ortiz b,1, L. Polyak c,2, S. Lund d, M. Jakobsson e, R.A. Woodgate f
a Department of Ocean, Earth, and Atmospheric Sciences, Old Dominion University, Norfolk, VA 23529, USAb Department of Geology, Kent State University, Kent, OH 44242, USAc Byrd Polar Research Center, Ohio State University, 1090 Carmack Road, Columbus, OH 43210, USAd Department of Earth Sciences, University of Southern California, Los Angeles, CA 90089-0740, USAe Department of Geology and Geochemistry, Stockholm University106 91 Stockholm, Swedenf Applied Physics Laboratory, University of Washington, Seattle, WA 98105-6698, USA
⁎ Corresponding author. Tel.: +1 757 683 4701.E-mail addresses: [email protected] (D.A. Darby), jor
[email protected] (L. Polyak), [email protected] (S. Lund),(M. Jakobsson), [email protected] (R.A. W
1 Tel.: +1 330 672 2225.2 Tel.: +1 614 292 2602.
0921-8181/$ – see front matter © 2009 Elsevier B.V. Adoi:10.1016/j.gloplacha.2009.02.007
Please cite this article as: Darby, D.A., et alChukchi–Alaskan margin sediments, Globa
a b s t r a c t
a r t i c l e i n f oArticle history:Accepted 18 February 2009Available online xxxx
Keywords:Arctic Oceansedimentation ratessedimentologysea icedrift deposits
A study of three long cores from the outer shelf and continental slope north of Alaska in the Arctic Oceanindicate that localized drift deposits occur here with sedimentation rates of more than 1.5 m/kyr during theHolocene. Currents in this area average about 5–20 cm/s but can reach 100 cm/s and these velocitiestransport the sediment found in these cores primarily as intermittent suspended load. These highaccumulation sediments form levee-like deposits associated with margins of canyons cutting across the shelfand slope. Unlike most textural investigations of Arctic sediment that focus on the coarser ice-rafted detritus(IRD), this paper focuses on the N95% of the sediment, which is finer than 45 μm. The mean size of thisfraction varies between 6 and 15 μm in Holocene sediments from the Chukchi–Alaskan shelf and slope withthe higher values closer to shore. Analysis of detailed size distributions of these Holocene deposits arecompared to 34 sediment samples collected from sea ice across the Arctic Ocean and to Holocene sedimentfrom central Arctic Ocean cores and indicate that similar textural parameters occur in all of these sediments.Principal components of these size distributions indicate that sea ice is an important link between theshelves and the central Arctic. Factor scores indicate nearly identical components in the clay and fine silt sizefractions but very different components in the coarse silt for sea ice sediment and central Arctic ridgesediments compared to shelf and continental slope deposits. Sea ice must contribute to sedimentation inboth of these Arctic regions, but bottom currents dominate in the slope region, forming drift deposits.
© 2009 Elsevier B.V. All rights reserved.
1. Introduction
The paleoclimate history of the western Arctic is still elusive due tothe lack of high-resolution sedimentary records. Leg 1 of the Healy–Oden Trans-Arctic Expedition (HOTRAX) of 2005 recovered eightpiston cores with accompanying trigger gravity cores and six multi-core stations nearby each piston core fromwhich seven core tubes andone water sample were recovered (Darby et al., 2005). This newmaterial along with a 20 m long piston core recovered in 2002immediately east of these HOTRAX cores (Keigwin et al., 2006),promises to provide new insights into the paleoenvironment andpaleoclimate of the Beaufort Sea region of the Arctic Ocean. This paperinvestigates the sedimentologic characteristics, primarily sediment
[email protected] (J. Ortiz),[email protected]).
ll rights reserved.
., The role of currents and sel Planet. Change (2009), doi:
texture, of three of these cores with the longest Holocene records andcompares them to size parameters of five central Arctic Holocenesections from across the Arctic.
Sea ice is a dominant transport agent in the Arctic Ocean especiallyfor areas of lower sedimentation (Eicken et al., 1997; Darby et al.,2006). Its role in depositing sediment on the shelf and slope is thoughtto be important but uncertain (Bischof and Darby, 1999; Darby andBischof, 2004). Slope and shelf regions with very high sedimentationrates exist off northern Alaska and the depositional processesresponsible for these high rates are unknown but essential to theproper interpretation of the paleoceanographic record in these areas(Darby and Bischof, 2004). Here we provide analysis of newsedimentary records to elucidate the factors controlling sedimenta-tion in these regions.
2. Regional setting
The Chukchi shelf northwest of Barrow, Alaska receives aconsiderable amount of sediment from the Yukon River and smallerrivers in this part of Alaska, especially when sea level was lower in the
a ice in both slowly deposited central Arctic and rapidly deposited10.1016/j.gloplacha.2009.02.007

2 D.A. Darby et al. / Global and Planetary Change xxx (2009) xxx–xxx
ARTICLE IN PRESS
Please cite this article as: Darby, D.A., et al., The role of currents and sea ice in both slowly deposited central Arctic and rapidly depositedChukchi–Alaskan margin sediments, Global Planet. Change (2009), doi:10.1016/j.gloplacha.2009.02.007
3D.A. Darby et al. / Global and Planetary Change xxx (2009) xxx–xxx
ARTICLE IN PRESS
early Holocene and even today (McManus et al., 1969; Nelson andCreager,1977; Naidu andMowatt,1983; Keigwin et al., 2006; Ortiz et al.,in this issue). Sediment supply to the shelf north of Alaska and Canada isdominated by the Mackenzie River, which provides 1.25×10⁸ t a−1 ofmostly fine-grained sediment and other rivers, which provide another1.5×106 t a−1, and the erosion of coastal bluffs supplies 5.62×10⁶ t a−1
(Hill et al., 1991). The net transport of the Mackenzie plume is generallyeastward away from Alaska and then northward into the Canada Basin(Macdonald and Carmack, 1991; Hwang et al., 2008).
The shelf and slope north of Alaska is at the apex of several currentsthat can transport and deposit sediment under favorable conditions(Weingartner et al., 1998, 2005; Woodgate et al., 2005a). The AlaskanCoastal Current moves north along the western coast of Alaska (Fig. 1).Although some of this current mixes with waters in the central ChukchiSea, a significant part of the flow turns east near Pt. Barrow with nearbottommean velocities of about 5–15 cm/s and maximum velocities of50 cm/s, with a tidal constituent of around 10 cm/s near the head of theBarrow Canyon (Woodgate et al., 2005a; Weingartner et al., 2005).Within the canyon, flows are generally stronger with means of 23 cm/sand up to 95 cm/s episodically (Weingartner et al., 2005). Also there canbe strong up-canyon flows or upwelling flows (Mountain et al., 1976;Aagaard and Roach, 1990) and there is evidence of the upper layers ofthe Atlantic Water being advected up Barrow (and other) canyons, tomix on the Chukchi shelf before returning to their density layer in theArctic Ocean (Woodgate et al., 2005b).
The current structure east of Pt. Barrow is not entirely clear. There is agenerally eastward coastal “shelf break” jet (Aagaard, 1984; Pickart et al.,2005), which is variable, but of comparable strength to the AlaskanCoastalCurrent in theChukchi Sea, and is fedat least inpartby theAlaskanCoastal Current (Fig.1A). Beyond about the 50mcontour on the shelf andextending to the base of the continental slope the dominant flowappearsto be the eastward Beaufort Undercurrent, which is ~10 cm/s becomingstrongerapparentlywithdepth(Aagaard,1984). The relationshipbetweenthese currents is unclear. The coastal/shelf break jet is variable, stronglyinfluenced by the local wind, and shows significant seasonal variability(Pickart, 2004). The Beaufort Undercurrent is less documented – theupper portions likely are strongly influenced by wind, while the deeperportionmaybepart of a basin-wide circulation and thus not locally driven(Aagaard, 1984). Both of these currents flow generally in the oppositedirection to the surface Beaufort Gyre circulation, which is primarilyanticyclonic but variable and stronglywind-influenced (Proshutinsky andJohnson, 1997). West of Barrow, the flow structure is likely similar. Theshallower part of the flow is fed by Pacific waters from Herald Canyon,while thedeeperpartof theflowis likelypartof thebasin-widecirculationof Atlantic Water. The behavior of these typically contour-followingcurrents in the vicinity of canyons is not well known.
All along the Chukchi slope eddies spin off the eastward flowingcoastal current and move offshore into the Canada Basin (Aagaardet al., 1985; D'Asaro, 1988; Plueddemann et al., 1998; Pickart, 2004).These as well as brine enriched density flows from sea ice formationcan move sediment offshore (Weingartner et al., 2005) and especiallythe density flows can transport sediment down the slope (Williamset al., 2008). There is also likely turbulent mixing (probably wind-driven) associated with the upwelling of upper Atlantic water upcanyons onto the shelf (Woodgate et al., 2005b). While this canintroduce coastal sediment from the east to the Barrow Canyon area,this longshore current does not directly impact on the core sites in thisstudy, which are much farther offshore.
The winter coastal or longshore drift is generally negligible alongthe northern Alaska coast (Aagaard, 1984; Reimnitz et al., 1988).During summer storms, this longshore drift can increase to 50 cm/s in
Fig. 1. Location of cores and sea ice samples used in this study. Many of the sea ice samples aslope. The axes of the canyons are indicated with dashed lines. The CHIRP line near JPC8 is alswhite arrows and include the Alaskan Coastal Current (ACC), the Beaufort Gyre surface driftEddies spin off all along the Chukchi and Beaufort slopes and move into the Canada Basin.
Please cite this article as: Darby, D.A., et al., The role of currents and seChukchi–Alaskan margin sediments, Global Planet. Change (2009), doi:
a westward direction building spits to the west (Short et al., 1974; Hilland Nadeau, 1989).
In addition,melt-out fromsea ice contributes anunknownvolumeofsediment to the nearshore and as far offshore as the summer ice front,several hundred kilometers seaward. Occasional storm waves andassociated currents during ice-free intervals can also move sedimentoffshore. To summarize, typical local current activity is likely in the rangeof 5–20 cm/s and on rare occasions during storm events or in focusedcurrents can reach values as high as 50–100 cm/s. Flows of thismagnitude are capable of transporting sediment in the clay throughsand sizes and into the gravel sizes, while most of these currents shouldbe capable of initiating sediment transport in even cohesive silt and sandsize sediments typical of the mid to outer shelf areas.
The sediments of the Chukchi–Alaskan shelf are sandy muds tomuddy sands with spotty occurrences of sand and gravel (Barnes andReimnitz, 1974; Reimnitz et al., 1998). The nearshore (b30 m isobath)is highly variable with mean sizes between 16 and 250 μm that aremoderately to well sorted. The central shelf and slope north of Alaskacontain fairly well-sorted, fine-grained silt (4–45 μm) but the outershelf is poorly sorted with patchy gravelly-mud to muddy gravel(Barnes and Reimnitz, 1974). The coarse nature of these patches ofsediment here are either palimpsest deposits from a time of lower sealevel or due to localized currents that sweep the fines sediments away.The continental slope consists primarily of silty muds except in thechannel axes of canyons where coarser sediments often occur.
3. Materials and methods
The HOTRAX cores studied in this paper are designated HLY0501-JPC5, -JPC8 (Darbyet al., 2005), andHLY0203-JPC16 (Keigwinet al., 2006)herein referred to as JPC5, 8, and16, respectively (Fig.1). All of these coresare missing sediment in the core tops due to bypassing near the surfaceduring core barrel entry. Trigger cores for JPC5 and 8 (TC5& 8) or amulti-core (MC14) for JPC16 are used to obtain the uppermost sedimentsections. These surface sediments are correlated to the piston cores usingradiocarbon dates, core logs (such as density and reflectance logs), andmineral abundance peaks. The estimated offset is 51 cm in JPC8 and TC8,75 cm in JPC5 and TC5, and 25 cm in JPC16 and MC14 (Table 1). TheHolocene sediment of these cores is compared to the Holocene in severalbox-cores obtained during the Arctic Ocean Section expedition (AOS94)(Darby et al., 1997; Poore et al., 1999). Two cores are from theMendeleevRidge (94BC12 and 94BC19, henceforth BC12 and BC19, Fig. 1). One isfrom the Podvodniko Basin (BC21; formerly Wrangel Abyssal Plain)between the twomajor ridge systems in the Amerasian half of the Arctic;and two cores (BC25 andBC28) are from the LomonosovRidge. An addedtube from the samebox core as BC28 (BC28-B) is included for replication.In order to assess the role of sea ice, 34 sediment samples collected frommodern sea ice sampled at 24 locations across the Arctic were analyzed(Fig.1). In 2005, twenty-nine sampleswere collected during theHOTRAXexpedition, including 15 from north of Alaska (Fig. 1a). In 2007, 16samples were collected in the central Arctic mostly near the North Pole,12 samples at six sites between Fram Strait and the North Pole during theLomonosovRidge off Greenland expedition (LOMROG), and four samplesat two sites from the mouth of M'Clure Strait in 2007 (Fig. 1).
Radiocarbon age dating by Accelerator Mass Spectrometry (AMS)was performed on shell material, mostly mollusks and benthicforaminifers from cores JPC 5, 8, and 16 (Table 1). The ages werecorrected for marine reservoir effects and stable carbon isotopefluctuations with CALIB5.0.2 (Stuiver et al., 2005) using ΔR values of 0and 460 for comparison because the magnitude of the Arctic Oceanreservoir effect is poorly constrained (Dyke et al., 1996; Bauch et al.,
re too close together to show separately. 1a. Insert detailed map of the Alaska shelf ando indicated. Base maps used are from Jakobsson et al. (2008). Major current systems are(BG), the Beaufort Undercurrent (BU), the coastal jet (CJ), and the longshore drift (LD).The longshore drift is operative only during ice free conditions.
a ice in both slowly deposited central Arctic and rapidly deposited10.1016/j.gloplacha.2009.02.007

4 D.A. Darby et al. / Global and Planetary Change xxx (2009) xxx–xxx
ARTICLE IN PRESS
2001a,b). The higher ΔR is favored by studies of mollusks from the nearshore or coastal environment near Barrow, Alaska (McNeely et al., 2006)but there is no consensus on samples from farther off shore in theAmerasianhalf of theArcticOcean (Barletta et al., 2008). Several dates inthe lower several meters of JPC16 were close to 40 ka and possiblytransported offshore from older deposits (Table 1). No lithologic changeis observed above this anomalously old interval and the texture alsoremains unchanged, leading us to suspect the old ages here astransported probably by ice-rafting during the waning stages of thelast deglaciation. Only the uppermost unit composed of soft, biotur-bated, olive-gray mud is investigated here. This unit is the Holocenebased on radiocarbon dating discussed later. Most box cores from thecentral Arctic Ocean were sampled so as to include the fine-grained,uppermost interval (typically 0–10 cm), which has abundant foramini-fer andwas identified as Holocene (Darby et al., 1997). These coreswereselected to represent a geographic distribution across the central Arctic(Fig. 1). Paleomagnetic intensity changes were used to supplementradiocarbon dates throughout JPC16 (Table 1).
Samples, more or less evenly spaced down each core, were wet-sieved after thorough dispersal by sonification. Sieving was at 250, 63,and 45 μm and detailed size analyses using a Malvern Mastersizer
Table 1Radiocarbon dates and sedimentation rates for cores JPC8, 5, and 16. Depth adjustments are dudates for JPC16 are included here and other HOTRAX cores are in Lisé-Pronovost et al. (in this(Lund and Schwartz, 1999; Lund, 2007).
* Not used in aged model.
Please cite this article as: Darby, D.A., et al., The role of currents and seChukchi–Alaskan margin sediments, Global Planet. Change (2009), doi
2000 laser particle size analyzer (Syvitsky, 1991; O'Neal et al., 1998)were performed on the b45 μm size fractions in order to remove thehighly variable coarse ice-rafted debris (IRD). While most sedimen-tologic studies in the Arctic Ocean focus on the coarse IRD fractions,the finer fractions can provide valuable insight into the deposition ofthe most abundant fraction—the clay to silt-sized fraction. We set theMastersizer to measure irregularly shaped particles of opaque quartzrather than idealized spheres. Due to the fact that some of the grainssieved through a 45 μm sieve were probably elongated, the laseranalysis measures a small percentage of grains larger than this size.The size distributions were analyzed by principal component analyses(PCA).
4. Results
4.1. Sedimentation rates
Cores from areas of fine sediment deposition on the shelf and slopenorth of Barrow, Alaska, have very high sedimentation rates for theHolocene that exceed 1.5 m/kyr (Table 1). Core JPC8 is from adepositional lens at 90 m water depth on the shelf along the western
e to missing sediment in the piston core tops due to by-passing. Paleomagnetic intensityissue). These dates use magnetic relative paleointensity features correlated to other work
a ice in both slowly deposited central Arctic and rapidly deposited:10.1016/j.gloplacha.2009.02.007

Fig. 3. Renormalized relative paleointensity record for Chukchi Sea piston core JPC16.The paleointensity has been estimated from a ratio of the natural remanent magne-tization (after alternating magnetic field cleaning at 20 mT–NRM20) divided by mag-netic susceptibility (CHI). Selected relative paleointensity highs and lows (RP1-RP10)are noted. These features correlate with other independently dated high-latitudeNorthern-Hemisphere relative paleointensity records. We have estimated the ages offeatures RP1-RP10 in JPC16 (Table 1) based on our paleomagnetic correlations.
5D.A. Darby et al. / Global and Planetary Change xxx (2009) xxx–xxx
ARTICLE IN PRESS
edge of the Barrow Canyon. It has exceptionally high sedimentationrates of 202–1109 cm/kyr from 8 to 4 ka, especially around 5 ka(average of 348 cm/kyr). Then the rate decreases dramatically to37 cm/kyr at 4 ka, although still high by marine standards. This is themost variable rate of the cores studied. JPC5 from the upper slope(415 m) has sedimentation rates that are much more consistentthroughout the Holocene with rates of 159 cm/kyr or 161 cm/kyrdepending on the age model used (Fig. 2).
JPC16 is farther down the slope in 1300 m water depth and islocated on the east side of Barrow Canyon, nearly on the dividebetween this and a smaller canyon immediately east. The dated part ofthe core, ca. 0–8 ka, has a higher average sedimentation rate of234 cm/kyr than core JPC5. There are two 14C calendar ages in JPC16 at32 and 1081 cm that are much older than the paleomagnetic intensityages for these depths (Table 1). In addition the two 14C ages below 6 ka(1356 cm) are both older than 39 ka despite the lack of any lithologicchange or apparent hiatus. The benthic shells used for these olderdates are suspected of being transported and thus they and the datesat 32 and 1081 are not used in the age model (Fig. 2). Thepaleointensity data for this core shows several events that can becorrelated to other independently dated paleointensity records fromhigh latitudes (Fig. 3; Lund and Schwartz, 1999; Lund, 2007; Lisé-Pronovost et al., in this issue). The dates derived from thepaleomagnetic events produce a near linear fit that merges with theradiocarbon age/depth curve below 2–4 ka where a ΔR of 460 isapplied but indicates that the radiocarbon dates are even older than acorrection of this magnitude at 4 and 6 ka (Fig. 2). The averagesedimentation rate for this core using both calendar 14C Ages based onaΔR=460 and the paleomagnetic dated intensity peaks is 234 cm/kyr(Fig. 2).
In summary, the high sedimentation rates north of Alaska varyfrom about 40–1200 cm/kyr with average rates between 150 and313 cm/kyr. There is no indication of rapid sedimentation events suchas turbidites, hyperpycnites (sediment-laden fluvial discharges), massflows, or storm deposits in this core. Correlations to other HOTRAX
Fig. 2. Age models and sedimentation rates calculated for JPC
Please cite this article as: Darby, D.A., et al., The role of currents and seChukchi–Alaskan margin sediments, Global Planet. Change (2009), doi:
cores from the upper slope farther to thewest indicate similar to lowerdeposition rates in the Holocene suggesting patchiness to the areas ofhighest sedimentation (Darby et al., 2005). USGS core P1-92AR-P1
5, 8, and 16. The data used in these models is in Table 1.
a ice in both slowly deposited central Arctic and rapidly deposited10.1016/j.gloplacha.2009.02.007

Fig. 4. Size frequency plots for average down-core Holocene sediments from the threeChukchi–Alaskan margin cores, the average of 34 modern sea ice samples, and theaverage of 59 samples from the Holocene section in central Arctic box cores. All plotsrepresent the b45 μm sieved fractions. Phi scale plots are provided along with themean,sorting (standard deviation), and skewness values for each, where phi (φ)=− log2dmm and dmm is the grain diameter in mm. The phi plots and central parameters arecalculated after the size distributions were converted to phi. The phi plots show the truenature of the skewness, which is nearly symmetrical in all cases.
6 D.A. Darby et al. / Global and Planetary Change xxx (2009) xxx–xxx
ARTICLE IN PRESS
(henceforth P1, Fig. 1) located on the shelf edge near the NorthwindRidge in 205 m water depth shows somewhat lower sedimentationrates of 30–44 cm/kyr except for an interval of low sedimentation(5 cm/kyr) between 2 and 6 ka (Darby et al., 2001; Darby and Bischof,2004). Between the HOTRAX core sites and the Mackenzie River, coreP1-89AR-P45 (henceforth P45, Fig. 1) from the upper slope (405 m) ismissing the uppermost 7 ka sediment interval, possibly due to recentmass movement like slumping, but has early Holocene sedimentationrates of about 110 cm/kyr (Andrews and Dunhill, 2004).
In contrast to the high sedimentation rates found in many sitesalong the Chukchi–Alaskan margin, sedimentation rates in the centralArctic ridges and basins where turbidites are infrequent are usuallyless than 2 cm/kyr (Darby et al., 1997; Bachman et al., 2004).Sedimentation rates increase slightly from the western Arctic orAmerasian half to the eastern, Eurasian half from about 1 cm/kyr onthe Mendeleev–Alpha Ridge to nearly 2 cm/kyr on the LomonosovRidge (Jakobsson et al., 2001).
4.2. Sediment texture
The average Holocene size frequency plots for each of the threecores from the Chukchi–Alaskan Margin (JPC5, 8, & 16) are unimodal,poorly sorted, and nearly symmetrically-skewed, with mean sizesbetween 5 and 8 μm (7–8 φ, very fine silt; Folk, 1974; Fig. 4). JPC8, onthe continental shelf, is slightly coarser with just slightly more fine-skewness than the other two cores. The mean sizes and thesize frequency distributions of these cores are similar to the averageof 34-highly variable sea ice sediment samples collected from theBeaufort Sea off North America and across the central Arctic (Figs. 1and 5). The finest sediment is found in Holocene deposits in the boxcores from the central Arctic. Except for less material between about5–7 φ (8–31 μm) in these central Arctic cores, their average sizedistribution is similar to that of sea ice sediment and JPC5 and 16. Thesea ice sediment is more variable in mean size than any of the cores(Fig. 4).
In general, there is better sorting as the mean grain size decreases(Fig. 5) for all samples from the cores and sea ice. The slightly coarsernature of JPC16 compared to JPC5 is apparent as the samples fromboth cores plot parallel each other. JPC8 is coarser than either of thesecores and more poorly sorted. Holocene sediment from the centralArctic box cores (except for BC25) is finer than any of the coresediments from the Chukchi–Alaskan margin. Core BC25 from theLomonosov Ridge is coarser and more poorly sorted than the othercentral Arctic cores. This is the only central Arctic core with a bimodalsize distribution in the upper 4 cm (Fig. 6). One mode is at 8.3 φ(3 μm) and the coarser at 5.3 φ (25 μm). The preceding Holocenesediment in BC25 is unimodal at 7.5 φ (5.5 μm). Of significance is thedistribution of sea ice samples compared to all the core sediments inthe mean size versus sorting plot (Fig. 5). These sea ice samplesoverlap all of the core samples, particularly the central Arctic coresamples.
The three Chukchi–Alaskan margin cores show fairly uniformmean grain-size down-core in the Holocene unit (Fig. 7). While thereis slightly more variability in the mean size in the lowermost 2 m ofJPC16 and 1 m of JPC5, there is no correlation between the mean sizeof these b45 μm size fractions and the percentage of coarser than63 μm IRD in JPC16 (Fig. 7). In fact, the mean size of the b45 μm sizedistribution is finer in several samples within the lowermost 2 m ofJPC16 where several samples contain more than 4–16%N63 μm. Abovethese intervals the mean size remains mostly unchanged with a slighttrend to increase in size near the top of JPC16 and decrease in JPC5.This independence of the N63 μm and the b45 μm size fractions inJPC16 suggests that the coarser material is added as a separate processto that which deposits the bulk of the sediment finer than 45 μm.
In order to determine the various processes that may be involvedin depositing these Arctic sediments we employed varimax-rotated
Please cite this article as: Darby, D.A., et al., The role of currents and sea ice in both slowly deposited central Arctic and rapidly depositedChukchi–Alaskan margin sediments, Global Planet. Change (2009), doi:10.1016/j.gloplacha.2009.02.007

Fig. 6. Average size distribution for all samples (0–10 cm) compared to the upper half ofthe Holocene (0–4 cm) and the lower half (5–10 cm) in BC25 taken from a small basinon the Lomonosov Ridge. Note the bimodal nature of the distribution in the upperportion of the Holocene.
7D.A. Darby et al. / Global and Planetary Change xxx (2009) xxx–xxx
ARTICLE IN PRESS
Principle Component Analysis (PCA) using the correlation matrix ofgrain size spectra for grain sizes ranging from 0.3 to 60 μmas the inputmatrix. This method allows us to separate out orthogonal modes(independent grain-size spectral components), which we relate topotential input functions. As an initial step we performed separatePCA analysis on the sea ice, central Arctic, and Chukchi–Alaskanmargin data sets. This allowed us to test the null hypothesis thatdifferent processes control the sedimentation in these three data sets.This analysis indicated that while the sea ice and central Arcticsediment had the same data structure as seen by nearly identicalfactor loading models, the Chukchi–Alaskan margin sediment wassomewhat different in that it contained a coarse silt factor componentabsent in the central Arctic Holocene sediment and sea ice. We thuscombined the sea ice and central Arctic data sets, and analyzed theseseparately from the Chukchi–Alaskan margin data set for the analysiswe present.
The combined sea ice and central Arctic sediment PCA analysis isbased on a total of 91 samples. We refer to this as the central ArcticPCA. (Fig. 8). Only the rank of factors changes when the PCA is runseparately on the sea ice and central Arctic Holocene size distribu-tions, probably due to the smaller sample size for these separate runs.The three leading modes in the central Arctic PCA explain 98.7% of thevariance in the data set. The model communality as a function of grainsize was equally high with values that averaged 0.99±0.011, and aminimum communality of 0.95. The first mode accounts for 35.0% ofthe variance; the second for 34.8% and the third for 28.9% of thevariance. The implication is that the processes generating thesemodeshave a similar impact on the overall variance in the data set.
In the central Arctic PCA, the first loading score has a positive broadpeak at 2 μm and an anti-correlated negative peak at 10 μm, thesecond has a positive peak at 5 μm and strongly anti-correlatedloadings at about 45 μm. The third Factor contains a peak at b0.5 μmand moderately strong negative loadings above 8 μm.
Analysis of the 171 Chukchi–Alaskan margin samples by PCAfollowed the same procedure as used for the central Arctic samples(Fig. 9). This model also extracts three PCA modes, which account for98.1% of the variance in the data set. The model communality as afunction of grain size for the Chukchi–Alaskan margin PCA was alsovery high with values that averaged 0.98±0.026, and a minimumcommunality of 0.86. The first mode accounts for 45.3% of thevariance, the second for 38.8% of the variance and the third for 14.1% of
Fig. 5. Plot of mean size versus the sorting coefficient in phi values for the threeChukchi–Alaskanmargin cores, sea ice samples, and the central Arctic cores. BC25 is themost poorly sorted and the remaining central Arctic box cores are the finest sediments.The sea ice samples have the greatest spread, overlapping nearly all samples except forBC25 and most of the other Holocene sediments from the central Arctic box cores. Thecentral Arctic box cores are generally finer (higher φ) than other sediments and poorlysorted (N~1.4).
Please cite this article as: Darby, D.A., et al., The role of currents and seChukchi–Alaskan margin sediments, Global Planet. Change (2009), doi:
the variance in the data set. The leading two modes in the Chukchi–Alaskan margin PCA are very similar in rank and shape to the leadingtwomodes of the central Arctic PCA. The thirdmode in each of the twoPCA models however is distinct (Figs. 8 and 9).
The first two Factors in the two PCAmodels are similar enough thatthey very likely arise from the same processes in each region. Theleading Factor in the Chukchi–Alaskan margin PCA exhibits strongerfactor loadings below 2 μm than the leading factor in the central ArcticPCA. This could arise from a regional difference ormay be a function ofthe small sample size for the Central Arctic data. The coarser, anti-correlated negative peak is anchored near the same grain size (8 vs.10 μm, respectively). The second Factor in the Chukchi–Alaskanmargin PCA has a positive grain size peak similar to that of the secondFactor from the central Arctic (4.2 vs. 4.8 μm). The strong anti-correlated negative loadings in Chukchi–Alaskan margin PCA arebetter resolved as a trough centered on 20 μm, while in the centralArctic PCA there is no indication of decreasing negative loadings withincreasing grain size. As with the first Factor, this difference couldarise from a regional difference indicating that the sea ice samples arefiner than the Chukchi–Alaskan margin samples with respect to thisFactor or the difference may represent a bias resulting from the smallsample size of the central Arctic data set.
The third mode in the two PCA models is unique to each region. Inthe central Arctic, this mode represents extremely fine particles,which peak at 0.3 μm. On the Chukchi–Alaskanmargin, the thirdmoderepresents rare coarse particles, which peak at 53 μm. The onlysimilarity between these twomodes is that their inflection points bothoccur around 6 μm. Alternative PCA models that extracted up to sixmodes from each data set failed to find the coarse mode in the centralArctic data set, or the fine-mode in the Chukchi–Alaskan margin dataset. This indicates a fundamental difference in the grain size spectrafor the two sample sets. When all three Factors are considered, thePCA model for the Chukchi–Alaskan margin exhibits a greatervariation in grain size than the central Arctic PCA. This is consistentwith the observation that the margin sediment is coarser than thecentral Arctic sediment.
5. Discussion
5.1. Sedimentation rates
The extremely high sedimentation rates in the sediment coresfrom the shelf and continental slope north of Alaska suggest someform of current deposition. This was previously inferred based on thespatial distribution of sediments—both surface sediment composition
a ice in both slowly deposited central Arctic and rapidly deposited10.1016/j.gloplacha.2009.02.007
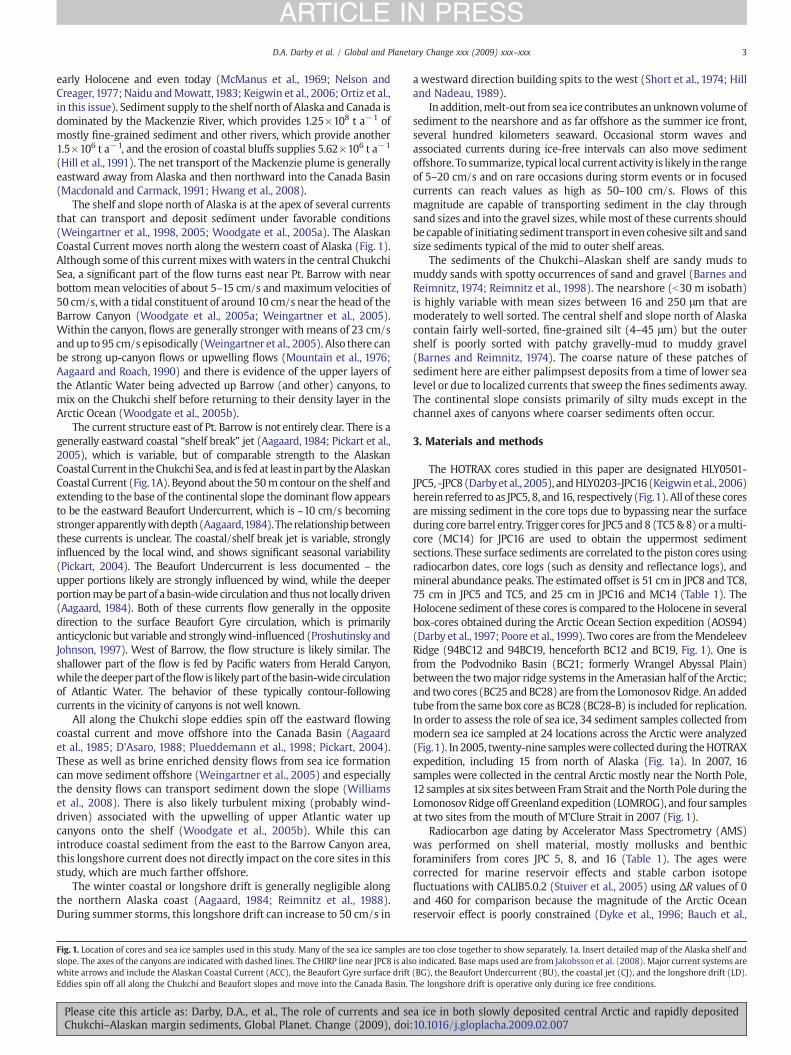
Fig. 7. Down-core change in mean size (b45 μm) for the Chukchi–Alaskan margin cores. The mean size of the bulk sample (all size fractions) is very similar to that of the b45 μm fraction in JPC5. The same is true for the other cores but is notshown. The coarse IRD (N63 μm sand fraction) in JPC16 is generally less than 2–3% except for a few samples, especially in the lowermost 1.5 m of the core. Note that many of the samples with the largest percentage of sand in JPC16 are the finestmean size.
8D.A.D
arbyet
al./Global
andPlanetary
Changexxx
(2009)xxx–xxx
ARTICLE
INPRESS
Pleasecite
thisarticle
as:Darby,D
.A.,et
al.,Therole
ofcurrents
andsea
icein
bothslow
lydeposited
centralArctic
andrapidly
depositedChukchi–A
laskanmargin
sediments,G
lobalPlanet.Change
(2009),doi:10.1016/j.gloplacha.2009.02.007

Fig. 9. PCA analysis combined factor scores for the size distributions (b45 μm) of thethree Alaska Margin cores. Note that Factors 1 (anchor ice) and 2 (nepheloid transport)are the same as for the combined sea ice and central Arctic sediment PCA (Fig. 8a).Factor 3 (suspension freezing) is completely opposite of Factor 3 in the central Arcticcontaining a peak in the coarsest sediment and interpreted as the intermittentsuspended load.
Fig. 8. a: Factor scores from the combined PCA analysis of the size distributions(b45 μm) for the central Arctic cores and sea ice samples. Factor 1 has a broad peakaround 2 μm and negative loadings near 10 μm. Factor 2 peaks at 5 μm and Factor 3peaks in the finest sizes (b0.5 μm). Communality is high throughout. b: Factor scores forthe sea ice samples and central Arctic box cores for separate PCA analysis. The order ofthe factors is different but the three factors from each sample set (box cores and sea ice)are nearly identical.
9D.A. Darby et al. / Global and Planetary Change xxx (2009) xxx–xxx
ARTICLE IN PRESS
(McManus et al., 1969) and sediment thickness (Phillips et al., 1988).Increased melt-out from sea ice is highly unlikely to supply this muchsediment because the sand fraction in these cores is no higher than incores from the central Arctic Ocean where all of the coarse sedimentand nearly all of the finer fraction must be ice-rafted. Yet these centralArctic cores have sedimentation rates of only 1 cm/kyr or less (Darbyet al., 1997). If ice supplied most of the sediment in the margin coresnear Alaska, surely the sand fraction would be higher and the overallsediment would be finer like the central Arctic cores. The percentageof N45 μm sediment in the Chukchi–Alaskan margin cores isconsistently b3% during the Holocene with the exception of intervalsprior to 7 ka when increased ice-rafting from disintegrating glaciers ispossible.
The processes involved in the high deposition rates are notimmediately obvious. First, the one core from the flank of the BarrowCanyon on the mid shelf (JPC8) has extremely high deposition ratesfrom early Holocene until 5 ka when they decrease from an average348 cm/kyr to about 37 cm/kyr for the remainder of the Holocene. Onthe other hand, the two cores from the slope (JPC5 & 16) have fairlyconsistent high sedimentation rates of 150–234 cm/kyr throughoutthe entire Holocene. This difference in variability between the shelfand slope sedimentation rates suggests that JPC8 is influenced by adifferent current regime or system than the two cores on the slope,consistent with the physical oceanography. The location of this core onthe west side of Barrow Canyon suggests that currents funneled downthis canyonmight form eddies that allow for deposition on the flank ofthe canyon where conditions allow for a sudden decrease in current
Please cite this article as: Darby, D.A., et al., The role of currents and seChukchi–Alaskan margin sediments, Global Planet. Change (2009), doi:
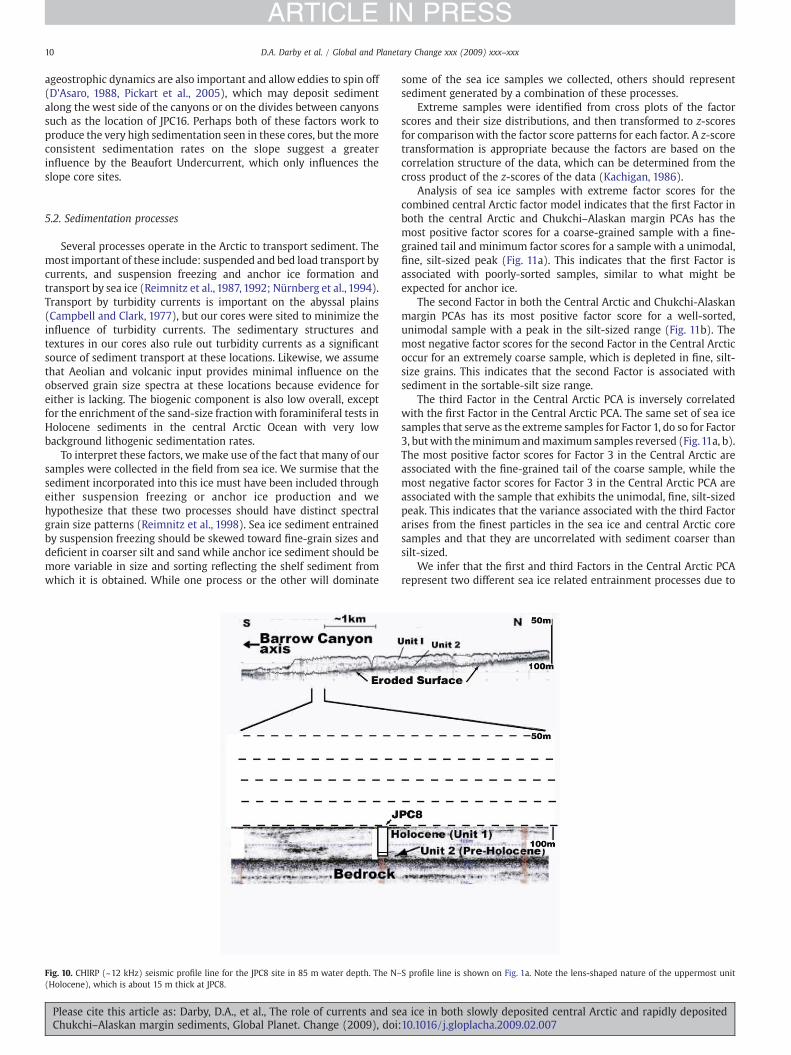
velocity. The upwelling currents noted earlier might mix with thedown-canyon flows to create eddies or decrease net currents thuspromoting deposition. Obviously fine-grained sediment is beingdeposited and not sand so the current regime must be weak enoughat the deposition sites to allow clay-size sediment to settle out (Fig. 4).There is no indication that the canyon axis is shifting position due toinfilling from the west. In contrast, the flank is aggrading, forming a6 kmwide, lens-shaped deposit (Fig. 10). This lens is thickest closer tothe canyon where the bottom begins to slope into the canyon and isakin to a levee deposit.
JPC5 and JPC16 are also located on the sides of canyons but on theupper and mid-slope areas, respectively (Fig. 1a). These cores werealso raised from lens-shaped deposits that are possible levee deposits,although the quality of the CHIRP data does not allow for cleardetermination as to whether these are accreting or aggrading. Thusthe sub-bottom data does not indicate whether deposition is due to aseparation of flow at the edge of these canyons due to an eastwardgeostrophic contour current or a down-canyon density flow that isdepositing in back-eddies at suitable locations along the sides of thecanyon, or a combination of both.
The shelf area near JPC8 is in the physical regime of a shallow shelfsea and is strongly affected by surface forcing (such as wind) and bythe coastal currents that veer offshore and down canyons (AlaskanCoastal Current) or dense brine currents during sea ice formation. Incontrast, sites JPC5 and 16 lie deeper, and in the physical regime ofmostly along- topography, slope currents (the generally eastwardflowing Pacific Waters from Herald and Barrow Canyon, and theBeaufort Undercurrent), although these sites are also influenced byupwelling/downwelling (often wind-related) and dense outflows.Direct wind influence is weaker here, and eddies are more important.It is possible that the deeper Beaufort Undercurrent might be a moreconstant factor during the Holocene and result in more constantsedimentation rates in the slope regions. The location of JPC5 on thewest side of a canyon supports this because the Beaufort Undercurrentflows eastward and would produce a separation of flow as it passesover the canyon margin allowing for deposition. JPC16 is on the eastside of Barrow Canyon but still can receive sediment deposited by theBeaufort Undercurrent if most of the sediment is transported insuspension. Separation of flow in a bottom current would seem to beless important on the east side of a canyon under an eastward current.Besides suspension deposition, eddies from down-canyon flowsmightbe important here. Due to Coriolis effects, the dense outflows movingdown the canyons along the Chukchi–Alaskan margin favor flowdown the east side of the canyon, but the flows are so strong that
a ice in both slowly deposited central Arctic and rapidly deposited10.1016/j.gloplacha.2009.02.007
10 D.A. Darby et al. / Global and Planetary Change xxx (2009) xxx–xxx
ARTICLE IN PRESS
ageostrophic dynamics are also important and allow eddies to spin off(D'Asaro, 1988, Pickart et al., 2005), which may deposit sedimentalong the west side of the canyons or on the divides between canyonssuch as the location of JPC16. Perhaps both of these factors work toproduce the very high sedimentation seen in these cores, but themoreconsistent sedimentation rates on the slope suggest a greaterinfluence by the Beaufort Undercurrent, which only influences theslope core sites.
5.2. Sedimentation processes
Several processes operate in the Arctic to transport sediment. Themost important of these include: suspended and bed load transport bycurrents, and suspension freezing and anchor ice formation andtransport by sea ice (Reimnitz et al., 1987, 1992; Nürnberg et al., 1994).Transport by turbidity currents is important on the abyssal plains(Campbell and Clark, 1977), but our cores were sited to minimize theinfluence of turbidity currents. The sedimentary structures andtextures in our cores also rule out turbidity currents as a significantsource of sediment transport at these locations. Likewise, we assumethat Aeolian and volcanic input provides minimal influence on theobserved grain size spectra at these locations because evidence foreither is lacking. The biogenic component is also low overall, exceptfor the enrichment of the sand-size fractionwith foraminiferal tests inHolocene sediments in the central Arctic Ocean with very lowbackground lithogenic sedimentation rates.
To interpret these factors, we make use of the fact that many of oursamples were collected in the field from sea ice. We surmise that thesediment incorporated into this ice must have been included througheither suspension freezing or anchor ice production and wehypothesize that these two processes should have distinct spectralgrain size patterns (Reimnitz et al., 1998). Sea ice sediment entrainedby suspension freezing should be skewed toward fine-grain sizes anddeficient in coarser silt and sand while anchor ice sediment should bemore variable in size and sorting reflecting the shelf sediment fromwhich it is obtained. While one process or the other will dominate
Fig. 10. CHIRP (~12 kHz) seismic profile line for the JPC8 site in 85 m water depth. The N–(Holocene), which is about 15 m thick at JPC8.
Please cite this article as: Darby, D.A., et al., The role of currents and seChukchi–Alaskan margin sediments, Global Planet. Change (2009), doi
some of the sea ice samples we collected, others should representsediment generated by a combination of these processes.
Extreme samples were identified from cross plots of the factorscores and their size distributions, and then transformed to z-scoresfor comparisonwith the factor score patterns for each factor. A z-scoretransformation is appropriate because the factors are based on thecorrelation structure of the data, which can be determined from thecross product of the z-scores of the data (Kachigan, 1986).
Analysis of sea ice samples with extreme factor scores for thecombined central Arctic factor model indicates that the first Factor inboth the central Arctic and Chukchi–Alaskan margin PCAs has themost positive factor scores for a coarse-grained sample with a fine-grained tail and minimum factor scores for a sample with a unimodal,fine, silt-sized peak (Fig. 11a). This indicates that the first Factor isassociated with poorly-sorted samples, similar to what might beexpected for anchor ice.
The second Factor in both the Central Arctic and Chukchi-Alaskanmargin PCAs has its most positive factor score for a well-sorted,unimodal sample with a peak in the silt-sized range (Fig. 11b). Themost negative factor scores for the second Factor in the Central Arcticoccur for an extremely coarse sample, which is depleted in fine, silt-size grains. This indicates that the second Factor is associated withsediment in the sortable-silt size range.
The third Factor in the Central Arctic PCA is inversely correlatedwith the first Factor in the Central Arctic PCA. The same set of sea icesamples that serve as the extreme samples for Factor 1, do so for Factor3, butwith theminimumandmaximum samples reversed (Fig.11a, b).The most positive factor scores for Factor 3 in the Central Arctic areassociated with the fine-grained tail of the coarse sample, while themost negative factor scores for Factor 3 in the Central Arctic PCA areassociated with the sample that exhibits the unimodal, fine, silt-sizedpeak. This indicates that the variance associated with the third Factorarises from the finest particles in the sea ice and central Arctic coresamples and that they are uncorrelated with sediment coarser thansilt-sized.
We infer that the first and third Factors in the Central Arctic PCArepresent two different sea ice related entrainment processes due to
S profile line is shown on Fig. 1a. Note the lens-shaped nature of the uppermost unit
a ice in both slowly deposited central Arctic and rapidly deposited:10.1016/j.gloplacha.2009.02.007
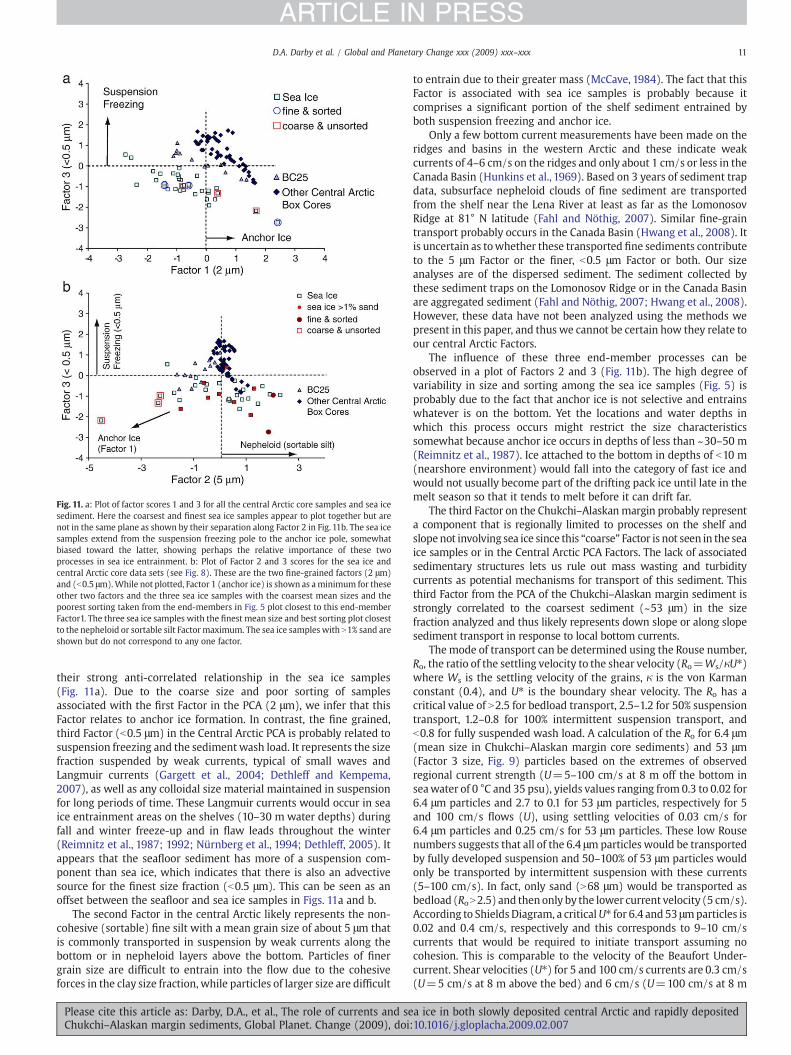
Fig. 11. a: Plot of factor scores 1 and 3 for all the central Arctic core samples and sea icesediment. Here the coarsest and finest sea ice samples appear to plot together but arenot in the same plane as shown by their separation along Factor 2 in Fig. 11b. The sea icesamples extend from the suspension freezing pole to the anchor ice pole, somewhatbiased toward the latter, showing perhaps the relative importance of these twoprocesses in sea ice entrainment. b: Plot of Factor 2 and 3 scores for the sea ice andcentral Arctic core data sets (see Fig. 8). These are the two fine-grained factors (2 μm)and (b0.5 μm).While not plotted, Factor 1 (anchor ice) is shown as aminimum for theseother two factors and the three sea ice samples with the coarsest mean sizes and thepoorest sorting taken from the end-members in Fig. 5 plot closest to this end-memberFactor1. The three sea ice samples with the finest mean size and best sorting plot closestto the nepheloid or sortable silt Factormaximum. The sea ice samples with N1% sand areshown but do not correspond to any one factor.
11D.A. Darby et al. / Global and Planetary Change xxx (2009) xxx–xxx
ARTICLE IN PRESS
their strong anti-correlated relationship in the sea ice samples(Fig. 11a). Due to the coarse size and poor sorting of samplesassociated with the first Factor in the PCA (2 μm), we infer that thisFactor relates to anchor ice formation. In contrast, the fine grained,third Factor (b0.5 μm) in the Central Arctic PCA is probably related tosuspension freezing and the sedimentwash load. It represents the sizefraction suspended by weak currents, typical of small waves andLangmuir currents (Gargett et al., 2004; Dethleff and Kempema,2007), as well as any colloidal size material maintained in suspensionfor long periods of time. These Langmuir currents would occur in seaice entrainment areas on the shelves (10–30 m water depths) duringfall and winter freeze-up and in flaw leads throughout the winter(Reimnitz et al., 1987; 1992; Nürnberg et al., 1994; Dethleff, 2005). Itappears that the seafloor sediment has more of a suspension com-ponent than sea ice, which indicates that there is also an advectivesource for the finest size fraction (b0.5 μm). This can be seen as anoffset between the seafloor and sea ice samples in Figs. 11a and b.
The second Factor in the central Arctic likely represents the non-cohesive (sortable) fine silt with a mean grain size of about 5 μm thatis commonly transported in suspension by weak currents along thebottom or in nepheloid layers above the bottom. Particles of finergrain size are difficult to entrain into the flow due to the cohesiveforces in the clay size fraction, while particles of larger size are difficult
Please cite this article as: Darby, D.A., et al., The role of currents and seChukchi–Alaskan margin sediments, Global Planet. Change (2009), doi:
to entrain due to their greater mass (McCave, 1984). The fact that thisFactor is associated with sea ice samples is probably because itcomprises a significant portion of the shelf sediment entrained byboth suspension freezing and anchor ice.
Only a few bottom current measurements have been made on theridges and basins in the western Arctic and these indicate weakcurrents of 4–6 cm/s on the ridges and only about 1 cm/s or less in theCanada Basin (Hunkins et al., 1969). Based on 3 years of sediment trapdata, subsurface nepheloid clouds of fine sediment are transportedfrom the shelf near the Lena River at least as far as the LomonosovRidge at 81° N latitude (Fahl and Nöthig, 2007). Similar fine-graintransport probably occurs in the Canada Basin (Hwang et al., 2008). Itis uncertain as towhether these transported fine sediments contributeto the 5 μm Factor or the finer, b0.5 μm Factor or both. Our sizeanalyses are of the dispersed sediment. The sediment collected bythese sediment traps on the Lomonosov Ridge or in the Canada Basinare aggregated sediment (Fahl and Nöthig, 2007; Hwang et al., 2008).However, these data have not been analyzed using the methods wepresent in this paper, and thus we cannot be certain how they relate toour central Arctic Factors.
The influence of these three end-member processes can beobserved in a plot of Factors 2 and 3 (Fig. 11b). The high degree ofvariability in size and sorting among the sea ice samples (Fig. 5) isprobably due to the fact that anchor ice is not selective and entrainswhatever is on the bottom. Yet the locations and water depths inwhich this process occurs might restrict the size characteristicssomewhat because anchor ice occurs in depths of less than ~30–50 m(Reimnitz et al., 1987). Ice attached to the bottom in depths of b10 m(nearshore environment) would fall into the category of fast ice andwould not usually become part of the drifting pack ice until late in themelt season so that it tends to melt before it can drift far.
The third Factor on the Chukchi–Alaskan margin probably representa component that is regionally limited to processes on the shelf andslopenot involving sea ice since this “coarse” Factor is not seen in the seaice samples or in the Central Arctic PCA Factors. The lack of associatedsedimentary structures lets us rule out mass wasting and turbiditycurrents as potential mechanisms for transport of this sediment. Thisthird Factor from the PCA of the Chukchi–Alaskan margin sediment isstrongly correlated to the coarsest sediment (~53 μm) in the sizefraction analyzed and thus likely represents down slope or along slopesediment transport in response to local bottom currents.
The mode of transport can be determined using the Rouse number,Ro, the ratio of the settling velocity to the shear velocity (Ro=Ws/κU⁎)where Ws is the settling velocity of the grains, κ is the von Karmanconstant (0.4), and U⁎ is the boundary shear velocity. The Ro has acritical value of N2.5 for bedload transport, 2.5–1.2 for 50% suspensiontransport, 1.2–0.8 for 100% intermittent suspension transport, andb0.8 for fully suspended wash load. A calculation of the Ro for 6.4 μm(mean size in Chukchi–Alaskan margin core sediments) and 53 μm(Factor 3 size, Fig. 9) particles based on the extremes of observedregional current strength (U=5–100 cm/s at 8 m off the bottom inseawater of 0 °C and 35 psu), yields values ranging from 0.3 to 0.02 for6.4 μm particles and 2.7 to 0.1 for 53 μm particles, respectively for 5and 100 cm/s flows (U), using settling velocities of 0.03 cm/s for6.4 μm particles and 0.25 cm/s for 53 μm particles. These low Rousenumbers suggests that all of the 6.4 μmparticles would be transportedby fully developed suspension and 50–100% of 53 μm particles wouldonly be transported by intermittent suspension with these currents(5–100 cm/s). In fact, only sand (N68 μm) would be transported asbedload (RoN2.5) and then only by the lower current velocity (5 cm/s).According to Shields Diagram, a criticalU⁎ for 6.4 and 53 μmparticles is0.02 and 0.4 cm/s, respectively and this corresponds to 9–10 cm/scurrents that would be required to initiate transport assuming nocohesion. This is comparable to the velocity of the Beaufort Under-current. Shear velocities (U⁎) for 5 and 100 cm/s currents are 0.3 cm/s(U=5 cm/s at 8 m above the bed) and 6 cm/s (U=100 cm/s at 8 m
a ice in both slowly deposited central Arctic and rapidly deposited10.1016/j.gloplacha.2009.02.007

Fig. 12. a: The anchor ice Factor (2 μm) in the three margin cores showing the increasefrom early Holocene to Recent. This increase is most pronounced in core BC25. Becausethe sedimentation in these cores is about 1 cm/Kyr (Darby et al., 1997) the depth scale isan approximation for the time scale in Kyr. b: Factor 2, the sortable silt or nepheloidfactor shows the opposite trend in BC25 but either increase slightly or remainunchanged in the other cores. c: All of the cores show a decline in the Factor 3 scores(suspension freezing) toward the Recent.
Table 2Percentage of Fe grains from 400 samples in JPC16 (45–230 μm) matched to pan-Arcticsources (see Darby, 2003). The northern shelf of Alaska contributes less than 1% andmost of the Fe grains in this source group closest to the Chukchi–Alaskanmargin cores isfrom the Chukchi Sea.
N Greenland N Canada N. Alaska E. Siberian Laptev Kara Barents
Chukchi Sea Sea Sea Sea
AVG 3.12 42.81 10.78 8.57 9.31 11.22 13.20Std. Dev. 6.17 45.65 16.34 11.85 11.26 14.19 15.01
12 D.A. Darby et al. / Global and Planetary Change xxx (2009) xxx–xxx
ARTICLE IN PRESS
above bed) assuming a smooth bed (roughness b1 cm). Coarse silt(45–63 μm) in the Chukchi–Alaskan sediment suggests Ro valuesbetween 0.8 and 1.2, the intermittent suspended load at typical veloc-ities for the bottom currents on the shelf and slope here (~10 cm/s).Since this velocity is also the critical entrainment velocity, smallchanges in these currents control both erosion and deposition of thecoarse silt, representing Factor 3.We cannot rule out that this sedimentis not transported by other means such as sea ice, but such an inter-pretation would imply two populations of anchor ice, which seemsimplausible, as we find no evidence for this in the central Arcticsediment samples or the sea ice sediment samples.
Provenance of the sand fraction in these sediments aids in ourinterpretation of depositional processes. Based on 22,700 microprobeanalyses of Fe oxidemineral grains in the 45–250 μm fraction from theentire length of JPC16, only 10% of these grains are traced to theChukchi Sea (mostly near Bering Strait) and a mere 1% to the northerncoastal shelf (inside the 50m isobath) east of Barrow Canyon (Table 2;see Darby, 2003 for details on the Fe grain provenance technique).Thus, the Coastal Jet and the Alaskan Coastal Current that mighttransport such grains from the northern Alaskan coast or the ChukchiSea, respectively (Fig. 1a), only account for 11% of the sand fraction atthis core site. Even this sand may get offshore to JPC16 site via sea ice.The remainder of Fe grains in this core are traced to more distantsources including northern Canada and the Russian shelves indicatingthat sea ice is the primary transport agent for the small amount ofsand in this core.
The clay mineral content of the b2 μm size fraction on theChukchi–Alaskan margin has been related to the Yukon River clays aswell as more local sources (Naidu and Mowatt, 1983). More recentwork suggests that the sediment in a core very near JPC5 changesaround 6 ka from a more illite and smectite rich clay mix to a morechlorite rich claymix suggesting a greater input of clay from the Pacificthrough Bering Strait between ca. 4–6 ka (Ortiz et al., in this issue).The precise sources of the fine fraction in this shelf area are difficult todetermine but available evidence including both the clay mineralogyand Fe grain provenance suggests multiple sources.
5.3. The role of sea ice
If sea ice-rafting played a major role in sedimentation at theChukchi–Alaskan margin core sites, then we should expect to see thesame three size PCA Factors for the sea ice and these margin cores.Factors 1 and 2 are nearly identical but because the third Factors are sodifferent between the central and margin areas, this suggests thatdifferent processes or sources of sediment are involved. Sea iceentrains sediment from the inner shelf (Reimnitz et al., 1998). Thethree Chukchi–Alaskan margin cores probably receive sedimenteroded from these general morphologic areas. However, sea ice canentrain sediment frommany distant shelves including those in Siberia(Nürnberg et al., 1994; Darby, 2003) and the sea ice-rafted componentin JPC16 bears this out (Table 2). We assume that the clays transportedby sea ice are derived from the same source as the sand component.The Chukchi–Alaskan margin cores most likely contain sedimentreworked from nearby on this shelf or the Chukchi Shelf (Darby andBischof, 2004; Keigwin et al., 2006). Previous provenance investiga-
Please cite this article as: Darby, D.A., et al., The role of currents and seChukchi–Alaskan margin sediments, Global Planet. Change (2009), doi
tions of sea ice indicates that most Arctic sea ice sediment is derivedfrom the Siberian shelves such as the Laptev Sea and from northernCanadian shelves and only minor amounts originate from theChukchi–Alaskan shelf (Pfirman et al., 1997; Eicken et al., 1997,2000; Darby, 2003; Eicken et al., 2005). Thus similar sources for thecentral Arctic sea ice and the Chukchi–Alaskan margin cores aredifficult to establish.
The similarity of the PCA factors thought to be due to sea ice in thecentral Arctic and margin core areas must indicate that at least someportion of the shelf sediment is originally deposited from melting sea
a ice in both slowly deposited central Arctic and rapidly deposited:10.1016/j.gloplacha.2009.02.007

Fig. 13. PCA Factors throughout theHolocene in Chukchi–Alaskanmargin cores. a: Factor1 (anchor ice) shows a sharp decline in the early Holocene that probably reflects theinfluence of glacial ice-rafting during the waning stages of the last deglaciation. Thechange henceforth is a slight decrease in this factor except in JPC8, which shows anincrease near the surface. b: The sortable silt Factor declines dramatically in JPC8 in thiscore at 90 mwater depth. The two cores (JPC5 & 16) farther offshore on the continentalslope show an initial increase 7-8 Ka and a decline from 3.5 to 0.5 Ka. c: The currentdeposition Factor varies more in the early Holocene (9–6 Ka).
13D.A. Darby et al. / Global and Planetary Change xxx (2009) xxx–xxx
ARTICLE IN PRESS
ice. PCA factors cannot be related to proportional volumes of sedimentso that the presence of two sea ice factors in the margin cores onlymeans that sea ice melt-out imparts a unique texture to thesesediments, not that it dominates the sediment contributed to thesedrift deposits.
Please cite this article as: Darby, D.A., et al., The role of currents and seChukchi–Alaskan margin sediments, Global Planet. Change (2009), doi:
Only the third Factor in the margin cores, coarse silt, is not presentin the central Arctic or sea ice sediment. This coarse silt fractionaround 53 μm must be enhanced in the margin areas by winnowingbecause this third Factor is not present in sea ice or the central Arcticcores. The presence of the first two Factors in all sea ice sedimentanalyzed further implies that the processes of sea ice entrainmentproduce similar sediment textures, regardless of where they occur(Reimnitz et al., 1998; Stierle and Eicken, 2002). This is especially truefor suspension freezing.
5.4. Holocene changes in grain size factors
The sediment texture in the central Arctic appears to have changedvery little with respect to the anchor ice Factor, with only a slightincrease towards the recent (Fig. 12a). This might be related to thecooling during the last 6 kyr in thewestern Arctic where the Holocenethermal maximum terminated earlier (at 8–10 ka) than in theGreenland and Canadian Archipelago region (Moore et al., 2001;Kaufman et al., 2004). We assume that colder temperatures wouldfavor anchor ice formation, but little is known about the factors criticalfor this process on shelves inwater depths of 10–30m. Like the anchorice Factor, the suspension freezing Factor (Factor 3, associated withabundant fine sediments, b0.5 μm; Fig. 12c) is unchanged during theHolocenewith a possible slight decline toward the recent correspond-ing to the increase in anchor ice (Fig. 12a).
The nepheloid Factor seems to have also remained fairly constantexcept for core BC25 (Fig. 12b). This core is located on the LomonosovRidge in 2125 m water depth in a small intra-ridge basin, the walls ofwhich are swept by currents (Björk et al., 2007). This might explainthe unique texture of BC25 (Figs. 5, 6,11a and 12). The Factor related tothe winnowed silt fraction, which we liken to nepheloid transport byweak currents, is mostly negative in BC25 suggesting that sortable siltis removed (Fig. 12b).
The Chukchi–Alaskan margin cores show a similar flat trend after7.5 ka in the anchor ice Factor as the central Arctic cores, except thatJPC16 and 8 have much lower Factor 1 scores than JPC5, which is moresimilar in this Factor loading to the central cores (Fig. 13a). There is amarked increase in the anchor ice Factor scores prior to 7.5 ka in JPC16(ka) and JPC8. This higher component of anchor ice in the earlyHolocene in JPC8 & 16 and possibly in JPC5might reflect colder bottomtemperatures and more marine permafrost that would promoteanchor ice formation prior to 7.5 ka. The nepheloid or sortable siltFactor (Factor 2) in these cores also shows JPC8 has much lowerloadings for this Factor after 7.5 ka (Fig. 13b). Here near the head of theBarrow Canyon where currents average about 14 cm/s and can reachnearly 100 cm/s, current transport and deposition dominates that ofsea ice as shown by the somewhat higher loadings for the third andcoarsest Factor (Fig. 13c). The fact that all of the margin cores showthis Factor 3 to be unchanged and nearly equal in all three coresthroughout the Holocene suggests that currents have played animportant role in all of these core sites throughout the Holocene.
6. Conclusions
The areas of high sedimentation on the outer shelf and slope northof Alaska appear to be localized and associated with canyons. Many ofthese cores are located on the edge of a canyon (possibly leveedeposits) and thus the rapid sedimentation might be associated witheddies developed from down-canyon flows or to eastward flows alongthe shelf or slope such as the Beaufort Undercurrent (Aagaard, 1984).Regardless of which current system is involved, the sedimentsize distributions in these areas throughout the Holocene indicate acurrent is involved. Nearly all of the sediment is deposited fromintermittent suspension or fully developed suspension and not bedload according to the Rouse numbers for the mean size and coarsestparticle sizes associated with PCA factors from the Chukchi–Alaskan
a ice in both slowly deposited central Arctic and rapidly deposited10.1016/j.gloplacha.2009.02.007

14 D.A. Darby et al. / Global and Planetary Change xxx (2009) xxx–xxx
ARTICLE IN PRESS
margin area sediments (6.4 and 53 μm, respectively) and the range ofcurrents likely encountered. The sand fraction in these margin cores isnearly all deposited from sea ice melt-out even though shelf currentsare strong enough to transport this size fraction because only about11% of the sand is derived from potential sources of entrainment bythese currents. Despite the dominance by current deposition for theclay and silt fractions, sea ice contributes enough sediment to impart aunique textural component as indicated by the similar PCA factorswith sea ice sediment collected from Arctic Ocean pack ice.
The central Arctic Holocene sediment texture appears to have astrong associationwith sea ice sediment. This is not surprising in lightof the high transport capability of sea ice (Eicken et al., 1997). The factthat the anchor ice Factor accounts for the largest amount of variancesuggests that it is more important than previously thought. The mostsurprising result of this study is the fact that Holocene sediment inboth the margin and central Arctic areas share two of the PCA texturefactors and that these factors are found in sea ice sediment. Becausesea ice might entrain this sediment from many different shelves, thesimilarity is probably not source-related but process-related. Thus seaice entrains similar size sediment regardless of the source anddeposits it throughout the Arctic, including other shelves far removedfrom the source.
Acknowledgements
The JPC16 core was partly dated by Lloyd Keigwin and we thankhim for the samples from this core. HOTRAX cores were collected fromthe USCGC Healy and we thank Capt. Dan Oliver and the crew for theirhelp in coring, and the additional help from the helicopter pilots onthe Healy in collecting sea ice samples. Also assisting in the HOTRAXsea ice sampling were J. Bischof, and G. Berger. This expedition wasfunded by NSF (grant OPP-0352395) and was aided by the collabora-tion of the Swedish icebreaker, Oden and the Swedish Polar ResearchSecretariat. The sea ice samples collected in 2007 were from the Odenand we thank Capt. Tomas Arnell, expedition leader A. Karlqvist, chiefscientist M. Jakobsson and the crew of Oden. Also assisting incollection of sea ice samples were G. Akse, D. Hanslik, C. Sjőő, andK. Gårdfeldt. Additional sea ice samples in 2007 from near M'ClureStrait were provided by J. Hutchings collected from the Canadianicebreaker Louis S. St. Laurent. This research was funded by NSF(grants ARC-0612493 and ODP-0525881 to Darby, ARC-0612473 toPolyak, and ARC-0612384 to Ortiz). Finally, we thank M. Scully forhelpful comments on the mode of transport and entrainmentvelocities and G. St-Onge for his constructive comments. We alsothank two anonymous reviewers.
References
Aagaard, K., 1984. The Beaufort undercurrent. In: Barnes, P.W., Schell, D.M., Reimnitz, E.(Eds.), The Alaskan Beaufort Sea, Ecosystems and Environments. Academic PressInc., New York, NY, pp. 47–71.
Aagaard, K., Roach, A.T., 1990. Arctic ocean-shelf exchange: measurements in BarrowCanyon. J. Geophys. Res. 95, 18163–18175.
Aagaard, K., Swift, J., Carmack, E., 1985. Thermohaline circulation in the arcticMediterranean seas, J. Geophys. Res. 90 (C3), 4833–4846.
Andrews, J.T., Dunhill, G., 2004. Early to mid-Holocene Atlantic water influx anddeglacial meltwater events, Beaufort Sea slope, Arctic Ocean. Quat. Res. 61, 14–21.
Bachman, J., Jakobsson, M., Lǿvlie, R., Polyak, L., Febo, L.A., 2004. Is the central ArcticOcean a sediment starved basin? Quat. Sci. Rev. 23, 1435–1454.
Barletta, F., St-Onge, G., Channell, J.E.T., Polyak, L., Darby, D.A., 2008. High-resolutionpaleomagnetic secular variation and relative paleointensity records from thewestern Canadian Arctic: implication for Holocene stratigraphy and geomagneticfield behaviour. Can. J. Earth Sci. 45, 1265–1281.
Barnes, P.W., Reimnitz, E., 1974. Sedimentary processes on Arctic shelves off thenorthern coast of Alaska. In: Reed, J.C., Sater, J.E. (Eds.), The Coast and Shelf of theBeaufort Sea. Arctic Institute of North America, Arlington, VA, pp. 439–476.
Bauch, H.A., Kassens, H., Naidina, O.D., Kunz-Pirrung, M., Thiede, J., 2001a. Compositionand flux of Holocene sediments on the Eastern Laptev Sea Shelf, Arctic Siberia. Quat.Res. 55, 344–351.
Bauch, H.A., Mueller-Lupp, T., Taldenkova, E., Spielhagen, R.F., Kassens, H., Grootes,P.M., Thiede, J., Heinemeier, J., Petryashov, V.V., 2001b. Chronology of the Holo-
Please cite this article as: Darby, D.A., et al., The role of currents and seChukchi–Alaskan margin sediments, Global Planet. Change (2009), doi
cene transgression at the North Siberian margin. Glob. Planet. Change 31 (1–4),125–139.
Bischof, J., Darby, D.A., 1999. Quaternary ice transport in the Canadian Arctic and extentof Late Wisconsinian glaciation in the Queen Elizabeth Islands. Can. J. Earth Sci. 36,2007–2022.
Björk,G., Swift, J.H., Jakobsson, J., Anderson, L., Rudels, B., Darby,D.A., Backman, J., Coakely, B.,Winsor, P., Polyak, L., Edwards, M., 2007. Bathymetry and deep-water exchange acrossthe central Lomonosov Ridge at 88°–89°N. Deep-Sea Res., I 54, 1197–1208.
Campbell, J.S., Clark, D.L., 1977. Pleistocene turbidites of the Canada Abyssal Plain of theArctic Ocean. J. Sediment. Petrol. 47, 657–670.
Darby, D.A., 2003. Sources of sediment found in sea ice from the western Arctic Ocean,new insights into processes of entrainment and drift patterns. J. Geophys. Res. 108(C8), 3257. doi:10.1029/2002JC001350, 13-1 to 13-10.
Darby, D.A., Bischof, J.F., 2004. A Holocene record of changing Arctic Ocean ice drift,analogous to the effects of the Arctic Oscillation. Paleoceanography 19 (PA1027).doi:10.1029/2003PA000961 9 pp.
Darby, D.A., Bischof, J.F., Jones, G.A., 1997. Radiocarbon chronology of depositionalregimes in the western Arctic Ocean. Deep-Sea Res., II 44, 1745–1757.
Darby, D.A., Bischof, J., Cutter, G., de Vernal, A., Hillaire-Marcel, C., Dwyer, G.,McManus, J.,Osterman, L., Polyak, L., Poore, R., 2001. New record of pronounced changes in ArcticOcean circulation and climate. EOS 82 (49), 603–607.
Darby, D.A., Jakobsson, M., Polyak, L., 2005. Icebreaker expedition collects key Arcticseafloor and ice data. EOS 86 (52), 549–552.
Darby, D.A., Polyak, L., Bauch, H., 2006. Past glacial and interglacial conditions in theArctic Ocean and marginal seas, a review. In: Wassman, P. (Ed.), Structure andfunction of contemporary food webs on Arctic shelves: a Pan-Arctic comparison.Prog. Oceanogr., 71, pp. 129–144.
D'Asaro, E.A., 1988. Observations of small eddies in the Beaufort Sea. J. Geophys. Res. 93,6669–6693.
Dethleff, D., 2005. Entrainment and export of Laptev Sea ice sediments, Siberia Arctic.J. Geophys. Res. 110 (C07009). doi:10.1029/2004JC002740.
Dethleff, D., Kempema, E.W., 2007. Langmuir circulation driving sediment entrainmentinto newly formed ice: tank experiment results with application to nature (LakeHattie, United States; Kara Sea, Siberia). J. Geophys. Res. 112 (C02004). doi:10.1029/2005JC003259.
Dyke, A.S., McNeely, R.N., Hooper, J., 1996. Marine reservoir corrections for bowheadwhale radiocarbon age determinations. Can. J. Earth Sci. 33, 1628–1637.
Eicken, H., Reimnitz, E., Alexandrov, V., Martin, T., Kassens, H., Viehoff, T., 1997. Sea-iceprocesses in the Laptev Sea and their importance for sediment export. Cont. ShelfRes. 17, 205–233.
Eicken, H., Kolatschek, J., Freitag, J., Lindemann, F., Kassens, H., Dmitrenko, I., 2000.Identifying a major source area and constraints on entrainment for basin-scalesediment transport by Arctic sea ice. Geophys. Res. Lett. 27, 1919–1922.
Eicken, H., Gradinger, R., Gaylord, A., Mahoney, A., Rigor, I., Melling, H., 2005. Sedimenttransport by sea ice in the Chukchi and Beaufort Seas: increasing importance due tochanging ice conditions? Deep-Sea Res. II 52, 3281–3302.
Fahl, K., Nöthig, E.M., 2007. Lithogenic and biogenic particlefluxes on the LomonosovRidge(central Arctic Ocean) and their relevance for sediment accumulation: vertical vs.lateral transport. Deep Sea Res., I 54 (8), 1256–1272. doi:10.1016/j.dsr.2007.04.014.
Folk, R.L., 1974. Petrology of Sedimentary Rocks. Hemphill Publ. Co., University of Texas,Austin, TX, pp. 182.
Gargett, A., Wells, J., Tejada-Martinez, A.E., Grosch, C.E., 2004. Langmuir supercells: adominant mechanism for sediment resuspension and transport in shallow shelfseas. Science 306, 1925–1928.
Hill, P.R., Nadeau, O.C., 1989. Storm-dominated sedimentation on the inner shelf of theCanadian Beaufort Sea. J. Sediment. Petrol. 59 (3), 455–468.
Hill, P.R., Blasco, S.M., Harper, J.R., Fissel, D.B., 1991. Sedimentation on the CanadianBeaufort Shelf. Cont. Shelf Res. 11, 821–842.
Hunkins, K., Thorndike, E.M., Mathieu, G., 1969. Nepheloid Layers and Bottom Currentsin the Arctic Ocean. J. Geophys. Res. 74 (28), 6995–7008.
Hwang, J., Eglinton, T.I., Krishfield, R.A., Manganini, S.J., Honjo, S., 2008. Lateral organiccarbon supply to the deep Canada Basin. Geophys. Res. Lett. 35 (L11607).doi:10.1029/2008GL034271.
Jakobsson, M., L, ǿ vlie, R., Arnold, E.M., Backman, J., Polyak, L., Knutsen, J.-O., Musatov, E.,2001. Pleistocene stratigraphy and paleoenvironmental variation from LomonosovRidge sediments, central Arctic Ocean. Glob. Planet. Change 31, 1–22.
Jakobsson,M., Macnab, R., Mayer, L., Anderson, R., Edwards,M., Hatzky, J., Schenke, H.W.,Johnson, P., 2008. An improved bathymetric portrayal of the Arctic Ocean:implications for ocean modeling and geological, geophysical and oceanographicanalyses. Geophys. Res. Lett. 35 (L07602). doi:10.1029/2008GL033520.
Kachigan, S., 1986. Statistical Analysis. Radius Press, N.Y. 586 pp.Kaufman, D.S., Ager, T.A., Anderson, N.J., Anderson, P.M., Andrews, J.T., Bartelein, P.J.,
Burbaker, L.B., Coats, L.L., Cwynar, L.C.,Duval,M.L.,Dyke,A.S., Edwards,M.E., Eiser,W.R.,Gajewski, K., Geisodottir, A., Hu, F.S., Jennings, A.E., Kaplan, M.R., Kewin, M.W.,Lozhkin, A.V.,MacDonald,G.M.,Miller,G.H.,Mock,C.J., Oswald,W.W.,Otto-Bliesner, B.L.,Porinchu, D.F., Rühland, K., Smol, J.P., Steig, E.J., Wolfe, B.B., 2004. Holocene thermalmaximum in the western Arctic (0–180° W), Quat. Quat. Sci. Rev. 23, 529–560.
Keigwin, L.D., Donnelly, J.P., Cook, M.S., Driscoll, N.W., Brigham-Grette, J., 2006. Rapidsea-level rise and Holocene climate in the Chukchi Sea. Geology 34 (10), 861–864.
Lisé-Pronovost, A., St-Onge, G., Brachfeld, S., Barletta, F., Darby, D.A., in this issue.Paleomagnetic constraints on the Holocene stratigraphy of the Arctic Alaskanmargin. Global Planet. Change.
Lund, S.P., 2007. Paleomagnetic secularvariation. In:Gubbins,D.,Herrero-Bervera, E. (Eds.),Encyclopedia of Geomagnetism and Paleomagnetism. Springer Publ., pp. 766–775.
Lund, S.P., Schwartz, M., 1999. Environmental factors affecting geomagnetic fieldpaleointensity estimates from sediments. In: Thompson, R., Maher, B. (Eds.),
a ice in both slowly deposited central Arctic and rapidly deposited:10.1016/j.gloplacha.2009.02.007

15D.A. Darby et al. / Global and Planetary Change xxx (2009) xxx–xxx
ARTICLE IN PRESS
Quaternary Climates, Environments, and Magnetism. Cambridge Univ. Press,Cambridge, UK, pp. 323–351.
Macdonald, R.W., Carmack, E.C., 1991. Age of Canada Basin deep waters: a way toestimate primary production for the Arctic Ocean. Science 254, 1348–1350.
McCave, I.N., 1984. Erosion, transport and deposition of fine-grained marine sediments.Spec. publ. - Geol. Soc. Lond. 15, 35–69. doi:10.1144/GSL.SP.1984.015.01.03.
McManus, D.A., Kelley, J.C., Creager, J.S., 1969. Continental shelf sedimentation in anArctic environment. Geol. Soc. Amer. Bull. 80, 1961–1984.
McNeely, R., Dyke, A.S., Southon, J.R., 2006. Canadian marine reservoir ages, preliminarydata assessment. Open File Rep.-Geol. Survey Can. 5049, 3.
Moore, J.J., Hughen, K.A., Miller, G.H., Overpeck, J.T., 2001. Little Ice Age recorded insummer temperature reconstruction from varved sediments of Donard Lake, BaffinIsland. Can. J. Paleolimnol. 25, 503–517.
Mountain, D.G., Coachman, L.K., Aagaard, K., 1976. On the flow through Barrow Canyon.J. Phys. Oceanogr. 6, 461–470.
Naidu, A.S., Mowatt, T.C., 1983. Sources and dispersal patterns of clay minerals in surfacesediments fromthe continental-shelfareasoffAlaska.Geol. Soc.Amer.Bull. 94, 841–854.
Nelson, H., Creager, J.S., 1977. Displacement of Yukon-derived sediment from Bering Seato Chukchi Sea during Holocene time. Geology 5, 141–146.
Nürnberg, D., Wollenburg, I., Dethleff, D., Eichen, H., Kassens, H., Letzig, T., Reimnitz, E.,Thiede, J., 1994. Sediments in Arctic sea ice: implications for entrainment, transport,and release. Mar. Geol. 119, 185–214.
O'Neal, D., Harrip, P., Dragicevic, G., Rae, D., Best, J.D., 1998. A comparison of LDL sizedetermination using gradient gel electrophoresis and light-scattering methods.J. Lipid Res. 39, 2086–2090.
Ortiz, J.D., Orsburn,C., Polyak, L., Grebmeier, J.M., Darby,D.A., Eberl,D.D., Naidu, S., Nof,D., inthis issue. Provenance of Holocene sediment on the Chukchi Shelf, Alaska, based oncombined diffuse spectral reflectance and quantitative X-Ray Diffraction analysis.Global Planet. Change.
Pfirman, S., Colony, R., Nürnberg, D., Eicken, H., Rigor, I., 1997. Reconstructing the originand trajectory of drifting Arctic sea ice. J. Geophys. Res. 102, 12575–12586.
Phillips, R.L., Barnes, P.,Hunter, R.E., Reiss, T.E., Rearic,D.M.,1988.Geologic investigation in theChukchi Sea, 1984, NOAA ship SURVEYOR cruise. USGS Open-file Report 88-25. 82 pp.
Pickart, R.S., 2004. Shelfbreak circulation in the Alaskan Beaufort Sea: mean structureand variability. J. Geophys. Res. 109 (C4). doi:10.1029/2003JC001912.
Pickart, R.S., Weingartner, T.J., Pratt, L.J., Zimmermann, S., Torres, D.J., 2005. Flow ofwinter-transformed Pacific water into the Western Arctic. Deep-Sea Res., II 52,3175–3198. doi:10.1016/j.dsr2.2005.10.009.
Plueddemann, A.J., Krishfield, R., Takizawa, T., Hatakeyama, K., Honjo, S., 1998. UpperOcean Velocities in the Beaufort Gyre. Geophys. Res. Lett. 25, 183–186.
Poore, R.Z., Osterman, L., Curry, W.B., Phillips, R.L., 1999. Late Pleistocene and Holocenemeltwater events in the western Arctic Ocean. Geology 27 (8), 759–762.
Please cite this article as: Darby, D.A., et al., The role of currents and seChukchi–Alaskan margin sediments, Global Planet. Change (2009), doi:
Proshutinsky, A., Johnson, M., 1997. Two circulation regimes of the wind driven ArcticOcean. J. Geophys. Res. 102, 12,493–12,514.
Reimnitz, E., Kempema, E.W., Barnes, P.W., 1987. Anchor ice, seabed freezing, andsediment dynamics in shallow Arctic seas. J. Geophys. Res. 92, 14,671–14,678.
Reimnitz, E., Graves, S.M., Barnes, P.W., 1988. Beaufort Sea coastal erosion, sedimentflux, shoreline evolution, and the erosional shelf profile: U.S. Geol. Survey, Misc.Field Invest. Map I-1182-G, p. 22.
Reimnitz, E., M, arincovich, L., M, c c ormick, M., B, riggs, W.M., 1992. Suspensionfreezing of bottom sediment and biota in the Northwest Passage and implicationsfor Arctic Ocean sedimentation. Can. J. Earth Sci. 29, 693–703.
Reimnitz, E., McCormick, M., Bischof, J., Darby, D.A., 1998. Comparing sea-ice sedimentloadwith Beaufort Sea shelf deposits: is entrainment selective? J. Sediment. Res. 68,777–787.
Short, A.D., Coleman, J.M., Wright, L.D., 1974. Beach dynamics and nearshoremorphology of the Beaufort Sea coast, Alaska. In: Reed, J.C., Sater, J.E. (Eds.), TheCoast and Shelf of the Beaufort Sea. Arctic Institute of North America, Arlington, VA,pp. 477–488.
Stierle, A.P., Eicken, H., 2002. Sediment inclusions in Alaskan Coastal Sea Ice: spatialdistribution, interannual variability and entrainment requirements. Arct. Antarct.Alp. Res. 34 (4), 103–114.
Stuiver, M., Reimer, P.J., Reimer, R.W., 2005. Online radiocarbon calibration programCALIB 5.0.2. http://calib.qub.ac.uk/calib/.
Syvitsky, J.P.M., 1991. Principles, methods, and applications of particle size analysis.Cambridge Univ. Press, Cambridge, p. 368.
Weingartner, T.J., Cavalieri, M.D., Aagaard, K., Sasaki, Y., 1998. Circulation, dense waterformation and outflow on the northeast Chukchi Sea shelf. J. Geophys. Res. 103,7647–7662.
Weingartner, T.J., Aagaard, K., Woodgate, R., Danielson, S., Sasaki, Y., Cavalieri, D., 2005.Circulation on the north central Chukchi Sea Shelf. Deep-Sea Res., II 52, 3150–3174.
Williams, W.J., Melling, H., Carmack, E.C., Ingram, R.G., 2008. Kugmallit Valley as aconduit for cross-shelf exchange on the Mackenzie Shelf in the Beaufort Sea.J. Geophys. Res. 113 (C02007). doi:10.1029/2006JC003591.
Woodgate, R.A., Aagaard, K., Weingartner, T., 2005a. A year in the physical oceanographyof the Chukchi Sea: mooredmeasurements from autumn 1990–91. Deep-Sea Res., II3116–3149. doi:10.1016/j.dsr2.2005.10.016.
Woodgate, R.A., Aagaard, K., Swift, J.H., Falkner, K.K., Smethie, W.M., 2005b. PacificVentilation of the Arctic Ocean's lower halocline by upwelling and diapycnalmixing over the continental margin. Geophys. Res. Lett. 32 (L18609). doi:10.1029/2005GL023999.
a ice in both slowly deposited central Arctic and rapidly deposited10.1016/j.gloplacha.2009.02.007