Arthur D Little Digital Transformation How to Become Digital leader
67
Digital Transformation – How to Become Digital Leader Study 2015 - Results Arthur D. Little www.adlittle.com
-
Upload
fred-zimny -
Category
Documents
-
view
244 -
download
1
description
Turning digital has become a well-understood imperative. Although digital has commonly found its way into corporate strategies, the path to transforming adequately remains unspecified. As part of an international cross-industry study, Arthur D. Little has considered the digital maturity of more than 100 European companies from seven industries in detail and systematically assessed them. The Arthur D. Little Digital Transformation Index (DTI) shows that few firms can be considered "digital oriented" or "digital centric".
Transcript of Arthur D Little Digital Transformation How to Become Digital leader

Digital Transformation – How to Become Digital Leader
Study 2015 - Results
Arthur D. Little www.adlittle.com

2
Table of Contents
1 Executive Summary
2 Deep Dive
3 Appendix (DTI per industry)
Source: Arthur D. Little Digital Transformation Study 2015

3
Arthur D. Little conducted the Digital Transformation Study globally and cross-industry. The key findings are summarized in this document.
Executive Summary – Study Overview
100+ Global players
have participated
Source: Arthur D. Little Digital Transformation Study 2015 1) EPC = Engineering, Procurement & Construction
Automotive Telecom & Media Energy & Utilities Consumer & Life Science Financial Institutions EPC1 & Manufacturing Travel & Transport
120 hrs Expert interviews with
management representatives
7 Major industry clusters
have been covered
1+7 Sections have been assessed

4
+…
The Arthur D. Little Digital Transformation study covers leading companies across all industry segments
Executive Summary – Randomly Selected Participants
Source: Arthur D. Little Digital Transformation Study 2015

5
Turning Digital has become a well understood imperative. Whilst Digital has commonly found its way into corporate strategies, the path to transform adequately remains unspecified
Executive Summary – Study Overview
Source: Arthur D. Little Digital Transformation Study 2015 1 Logic: The higher, the better. Measured on a scale from 0 to 10
80% of surveyed companies are digital adaptive only
Progress in Digital Transformation is measured via the Digital Transformation
Index (DTI)1
3.92 DTI
50% perceive lack of digital knowledge across the value chain as their major challenge to overcome
of companies have comprehensive digital transformation strategies in place
have dedicated central units for Digital strategy development and implementation 15%
17%

6
New entrants and fast-moving competitors increasingly capture digital opportunities,
indicating the potential of “digital” in the market.
Digital Transformation is everywhere and impacts everything and everyone
Executive Summary – Why Digital Transformation?
Source: Arthur D. Little Digital Transformation Study 2015
Products and services need to undergo a digital transformation: we
cannot just take physical products and put them online.
Clients are pushing us towards digital transformation: If
we don't transform they will move to our competitors.
Our biggest challenge is to understand the customer and
his new behaviors. The market is changing: partners are be-
coming competitors.
Our world has been changed by the expectations of our customers, while our basic service continues to be the same:
We need to transform in order to maintain customer satisfaction.
Productivity related to new technologies such as cobots,
predictive analytics and additive manufacturing will increase by a
factor of 100 over the next 5–8 years, while costs will be reduced by a
factor of 100.

7
Some of the below key findings we anticipated beforehand, whereas others have been surprising and astonishing
Executive Summary – Study Overview
Source: Arthur D. Little Digital Transformation Study 2015 1 Also too little imagination for a renewal resp. overhaul of their business model in a future digital world
1. Digitization will change the competitive environment of all industries significantly
2. Most industries are already affected by digital disruption or realize that they will be soon
3. Few companies yet follow a consistent digitization approach for their whole business model
4. Companies underestimate opportunities in Operations and in Business Model Redesign
5. There is a huge demand and backlog for the majority to deal with “Digital” properly
6. No industry can claim to be a digital front-runner; however, each industry has its outperformers
7. Most companies are either not aware of or ignore potential threats from digital disruptors1
8. Companies are too slow in transformation, though facing rapidly evolving digital competition
9. Third-party integration is often underrated as companies still try to solve problems on their own
10. The usage of “smart data”, and thus also personalized offerings, lag behind

8
Some major digital trends change yesterday’s realities – these “game changers” facilitate great opportunities and will inevitably generate some highly digitized champions
Executive Summary – Trends
Source: Arthur D. Little Digital Transformation Study 2015 1 EPC = Engineering, Procurement & Construction
100+ Study Participants
Physical product Product-as-a-service
Consumption Active creation
Points of usage Service everywhere
Personalization Mass production
Shared across community Ownership
Embedded into ecosystem Disconnected
Telecom & Media
Energy & Utilities
Consumer & Life Science
Financial Institutions
EPC1 & Manufacturing
Travel & Transport
Automotive Yesterday’s Realities Digital Trends
No updates Continuous improvement
Vertical integration Value chain disintegration
Digital Disruption

9
Prominent examples of digitalization can be found in every industry. By nature, each trend’s impact varies and so does the industry-specific progress on digital transformation
Executive Summary – Trends Impact on Industries
Source: Arthur D. Little Digital Transformation Study 2015 1 EPC = Engineering, Procurement & Construction
Continuous improvement
Service everywhere
Embedded into ecosystem
Personalization
Shared across community
Product-as-a-service
Active creation
Automotive Telecom & Media
Energy & Utilities
EPC1 & Manufacturing
Travel & Transport
Hybrid Advisory
Model
Smart Home Appl.
Car Sharing
Running Shoes Individ.
Wifi SW- Upgrade for Car
3D- Printer
Cloud Services
8 Digital Trends
Industries Financial Institutions
Value chain disintegration P2P
Money Transfer
Google Car
Consumer & Life Science
Sourcing via
Alibaba

10
Source: Arthur D. Little Digital Transformation Study 2015
The survey followed a holistic approach to analyze the relevant sections for digitalization; the questions raised have been mapped to these sections
Executive Summary – Overview “Digital Transformation Framework”
Workplace & Culture
Drivers & Challenges
A
G
Information Technology
Products & Services
Customer Management
Operations & Supply Chain
Corporate Services & Control
Strategy & Governance
B C
E D
F
Digital client share Share of digital sales and
interaction Digital marketing share,
customer data analytics
Flexibility of IT landscape to provide digital capabilities
Role of IT function in digitalization
Budget dedicated to digital
Impact of digital on transparency
Maturity of digital support processes
…
Maturity of communication and collaboration
Mobility Agile working methods
Maturity of digital operations Target picture and
transformation roadmap Degree of dynamic adaption
Product and service portfolio adaption
Share of digital sales Changes in development process
Maturity of digital strategy KPIs on Digital approach Roles and responsibilities for
concept and implementation
Opportunities and challenges Changes in the firm Changes in competitive
environment
Business Model

11
X-Axis = Indexed at Cross-Industry Ø 3.92
Y-Axis = Company-Specific Deviation to Ø
The Arthur D. Little Digital Transformation Index (DTI) shows that today few firms can be considered “digital oriented” or “digital centric”
Source: Arthur D. Little Digital Transformation Study 2015 1 DTI calculated as average of scores for each section
Executive Summary – Cross-Industry DTI
Digital Transformation Index (DTI)1 10
9
8
7
6
5
4
3
2
1
0
Digital aware [score below 2.5]
Digital oriented [score between 5 and 7.5]
Digital adaptive [score between 2.5 and 5.0]
Digital centric [score above 7.5]
Average Each # represents a specific company
102 100 98 96 94 92 90 88 86 84 82 80 78 76 74 72 70 68 66 64 62 60 58 56 54 52 103 101 99 97 95 93 91 89 87 85 83 81 79 77 75 73 71 69 67 65 63 61 59 57 55 53
51 49 47 45 43 41 39 37 35 33 31 29 27 25 23 21 19 17 15 13 11 9 7 5 3 1 50 48 46 44 42 40 38 36 34 32 30 28 26 24 22 20 18 16 14 12 10 8 6 4 2

12
Average DTI is most advanced in the section “Strategy & Governance” as well as “Information Technology”, with a score of 5 – however, it still lags behind the virtual star performance
Executive Summary – Cross-Industry DTI per Sections
Digital Transformation Index (DTI) per Section
Source: Arthur D. Little Digital Transformation Study 2015
Strategy & Governance
Products & Services
Customer Management
Operations & Supply Chain
Corporate Services & Control
Information Technologies
Workplace & Culture
= Cross-Industry Virtual Star = Cross-Industry Average
10 9 8 7 6 5 4 3 2 1

13
We collected many best practices for each section to share with you
Executive Summary – Case Examples
Source: Arthur D. Little Digital Transformation Study 2015
Strategy & Governance
A Products & Services
B Customer Management
C
Workplace & Culture
G Information Technology
F Corporate Services & Control
E Operations & Supply Chain
D
Nike x-functional Digital Sports Division
Coca Cola “Co-Founders” Network
Cyber-Physical Product
Service with Peer-to-Peer Component
SBB GoodBox Rail-Transport Smartization
Burberry Integrated Customer Experience
Real-Time Dynamic Pricing for Profit Maximization
Quicksilver Personal Pricing & Rewards
Gamification in Project-based/ Knowledge Environment
Coca Cola Brand Dashboard
Digital Business Launch Factory
Cloud-Based Project Staffing
adidas Speedfactory In-Store Production
Cold Chain Quality Management
Vision Picking using Augmented Reality
European Telco
Layered IT Architecture for Quick Process Implementation
ICT to Support Industry 4.0

14
The different progresses of industries in Digital Transformation can be investigated when looking at the radar charts, reflecting the 7 sections of the model
Executive Summary – DTI Views per Industry
Source: Arthur D. Little Digital Transformation Study 2015 1) EPC = Engineering, Procurement & Construction
= (Cross-) Industry Virtual Star = Cross-industry average = Industry average
Cross-industry
Ø 3.92
Automotive Industry
Ø 5.02
Telecom & Media Industry
Ø 4.20
Energy & Utilities Industry
Ø 4.11
Consumer & Life Science
Ø 3.71
Financial Institutions
Ø 3.86
EPC1 & Manufacturing
Ø 3.53
Travel & Transport
Ø 3.51

15
Ø 3.92
Travel & Transport 3.51
EPC & Manufacturing 3.53
Consumer & Life science 3.71
Financial institutions 3.86
Overall average 3.92
Energy & Utilities 4.11
Telecom & Media 4.20
5.02 Automotive
On average, all industries are “digital adaptive” only; however, each industry contains “digital-oriented” companies, whereas two industries contain one “digital-centric” company
Executive Summary – Average DTI per Industry
Source: Arthur D. Little Digital Transformation Study 2015 σ = Standard Deviation; Ø = Average
Average Industry-Specific DTI Insight
On average most companies (~60%) are in the Digital-adaptive area
All industries are impacted by Digital Transformation and show ability to play in the higher leagues of the DTI
Most industries show an extreme spread: Participants score among the weakest and best at the same time
σ = 0.92 min 4.06 max 6.52
min 1.54 max 6.62
min 2.13 max 7.73
min 1.07 max 7.73
min 1.52 max 7.55
min 1.84 max 6.16
min 1.07 max 5.30
min 2.24 max 6.62
σ = 1.18
σ = 1.30
σ = 1.38
σ = 1.54
σ = 1.24
σ = 1.09
σ = 1.51

16
Table of Contents
1 Executive Summary
2 Deep Dive
3 Appendix (DTI per industry)
Source: Arthur D. Little Digital Transformation Study 2015

17
Table of Contents
1 Executive Summary
2 Deep Dive
Drivers & Challenges
A. Strategy & Governance
B. Products & Services
C. Customer Management
D. Operations & Supply Chain
E. Corporate Services & Control
F. Information Technology
G. Workplace & Culture
3 Appendix (DTI per industry)
Source: Arthur D. Little Digital Transformation Study 2015

18
Drivers & Challenges Overview
Deep Dive – Drivers & Challenges
Most critical challenges for Digital Transformation are 1. lack of knowledge, 2. lacking sense of urgency and 3. excessive complexity
Consideration of the continuous increase of digital customer needs and expectations will be key to succeeding in the future competitive landscape
The primary impact of the Digital Transformation is reflected in changes in distribution channels and adaptations to existing products and services
A prevailing number of the surveyed companies see the acquisition of new customers as a major opportunity brought by digitalization
Key Learnings
Source: Arthur D. Little Digital Transformation Study 2015
Workplace & Culture
Drivers & Challenges
Information Technology
Products & Services
Customer Management
Operations & Supply Chain
Corporate Services & Control
Strategy & Governance
Business Model

19
Major Challenges for Digital Transformation
Automotive Telecom & Media
Energy & Utilities
Consumer & Life
Science
Financial Institutions
EPC & Manufac-
turing
Travel & Transport
1
6
8
7
8
5
6
7
8
6
2
3
4
7
8
5
3
1
6
4
2
5
7
8
3
2
1
4
7
8
6
5
1
3
7
2
8
4
6
5
Excessive complexity
45%
Lacking mgmt. Support
50%
Lacking financial resources
40%
Legal requirements
39%
Sense of urgency
23%
Goal definition
23%
Lack of knowledge
27%
Lacking control system 32%
Source: Arthur D. Little Digital Transformation Study 2015 Numbers indicate frequency of answers among companies in given industries
Share of participants
Most critical challenges for Digital Transformation are 1. lack of knowledge, 2. lacking sense of urgency and 3. excessive complexity
Deep Dive – Drivers & Challenges
2
3
7
4
5
1
2
3
4
5
6
1
2
3
4
1
Highest

20
Deep Dive – Drivers & Challenges
Changes in the Competitive Landscape due to Digitalization
New customer groups and markets
New partners within value chain
Existing competitors with new products/business models
New ecosystems
New competitors
Existing customers with new needs resp. behaviors
33
Energy & Utilities
58
Telecom & Media
15
Automotive
39
Travel & Transport
28
EPC & Manufacturing
64
Financial Institutions
20
Consumer & Life Science
x = # of quotes
Source: Arthur D. Little Digital Transformation Study 2015
All Industries
Consideration of the continuous increase of digital customer needs and expectations will be key to succeeding in the future competitive landscape

21
The primary impact of the Digital Transformation is reflected in changes in distribution channels and adaptations to existing products and services
Deep Dive – Drivers & Challenges
Changes of Your Company’s Business Model due to Digitalization
Source: Arthur D. Little Digital Transformation Study 2015 CI = Customer Interaction
Production and logistics
New business segments
Internal processes
Business model overhaul
Existing products & services
Distribution channels and CI
42 57 11
40 32 68 32
All Industries Energy & Utilities Telecom & Media Automotive
Travel & Transport EPC & Manufacturing Financial Institutions Consumer & Life Science
Arthur D. Little perspective: Companies are underestimating potential in new business segments and operations / processes
x = # of quotes

22
Major Opportunities in the Digital Transformation Journey
A prevailing number of the surveyed companies see the acquisition of new customers as a major opportunity brought by digitalization
Automotive Telecom & Media
Energy & Utilities
Consumer & Life
Science
Financial Institutions
EPC & Manufac-
turing
Travel & Transport
5
1
2
3
4
2
5
1
3
6
1
2
3
5
4
1
4
2
3
5
1
2
5
4
3
5
1
2
6
3
3
5
6
1
4
6 4 6 6 6 4 2 Cost savings
Increase of agility and flexibility
Increase of customer loyalty
New sources of revenue
Differentiation from competition
Acquisition of new customers
Source: Arthur D. Little Digital Transformation Study 2015 Numbers indicate frequency of answers among companies in given industries
Average ranking
Deep Dive – Drivers & Challenges
Highest
Arthur D. Little perspective: Companies are underestimating potential for cost improvements, agility and flexibility increase

23
Table of Contents
1 Executive Summary
2 Deep Dive
Drivers & Challenges
A. Strategy & Governance
B. Products & Services
C. Customer Management
D. Operations & Supply Chain
E. Corporate Services & Control
F. Information Technology
G. Workplace & Culture
3 Appendix (DTI per industry)
Source: Arthur D. Little Digital Transformation Study 2015

24
Source: Arthur D. Little Digital Transformation Study 2015
Strategy & Governance Overview
Deep Dive – A. Strategy & Governance
In most cases, CxOs govern both strategy development and implementation for the Digital Transformation – the topic has definitely arrived at the top of their agenda
A cross-functional digital governance unit on corporate level can ensure cross-functional digitalization of the End-to-End value chain
Across all industries, the levers “hiring digital talent” and “training and further education” dominate when it comes to capability building effort in all industries
Going beyond “corporate borders” allows for matching experienced entrepreneurs with corporate resources, e.g. on dedicated venturing platforms
Key Learnings
Workplace & Culture
Drivers & Challenges
A
Information Technology
Products & Services
Customer Management
Operations & Supply Chain
Corporate Services & Control
Strategy & Governance
Business Model

25
In most cases, CxOs govern both strategy development and implementation for the Digital Transformation – the topic has definitely arrived at the top of their agenda
Deep Dive – A. Strategy & Governance
Several departments Top management Dedicated central unit No specific unit
Digital Strategy Development & Implementation
Top management
Central Unit
Dep #1 Dep #2 Dep #3 Dep …
… is/are responsible for developing the Digital Strategy
No specific unit
14%
Several departments 17%
Dedicated central unit 9%
Top management 59%
… steer(s) the implementation of the Digital Strategy
No specific unit
14%
Several departments 26%
Dedicated central unit
15%
Top management 45%
Source: Arthur D. Little Digital Transformation Study 2015
No dedicated responsibilities

26
Measures Applied to Catalyze the Digital Transformation
Automotive Telecom & Media
Energy & Utilities
Consumer & Life
Science
Financial Institutions
EPC & Manufac-
turing
Travel & Transport
3
1
2
3
4
5
2
1
3
4
5
6
3
1
2
4
5
6
1
2
3
4
6
5
1
2
3
4
5
6
1
3
2
4
5
6
1
2
3
4
5
6 VC arm/ capital
provision for incub.
Acquisition of digital co.
5%
11%
Own corp. incubator/ accelarator 31%
Strategic alliances w/ digital co. 44%
Hiring Digital talents 51%
Training and further education 53%
Source: Arthur D. Little Digital Transformation Study 2015 Numbers indicate frequency of answers among companies in given industries
Share of participants
Across all industries, the levers “training and further education” and “hiring digital talents” dominate when it comes to capability building effort in all industries
Deep Dive – A. Strategy & Governance
Highest

27
Table of Contents
1 Executive Summary
2 Deep Dive
Drivers & Challenges
A. Strategy & Governance
B. Products & Services
C. Customer Management
D. Operations & Supply Chain
E. Corporate Services & Control
F. Information Technology
G. Workplace & Culture
3 Appendix (DTI per industry)
Source: Arthur D. Little Digital Transformation Study 2015

28
Source: Arthur D. Little Digital Transformation Study 2015
Products & Services Overview
Deep Dive – B. Products & Services
Key Learnings
Most companies have neither agilized nor digitized their product and service portfolios
The majority of companies only involve their customers in the product development process occasionally – industry leaders typically involve their customers
It is worthwhile to experiment with the smartization of classic “Brick & Mortar” business – in order to protect core business and increase attraction
For digitized products, the user experience can be enhanced through remote SW-upgrades and data collection to automatically inform on repair and service requirements
Introduction of products and services with peer-to-peer components can increase competitiveness and growth of customer base
Workplace & Culture
Drivers & Challenges
Information Technology
Products & Services
Customer Management
Operations & Supply Chain
Corporate Services & Control
Strategy & Governance
B
Business Model

29
In full movement Need for changes in
product development process
More effort required
Need for adaptation of products & service portfolio
2 2
2
3
14
12
2
11
33
6
1
6
6 Travel & Transport
Most companies have neither agilized nor digitized their product and service portfolios
Deep Dive – B. Products & Services
Source: Arthur D. Little Digital Transformation Study 2015
Agilization in P&S Development vs. P&S Digitization
= Bubble size reflects no of companies
Financial Institutions
Energy & Utilities
Automotive Telecom & Media
Consumer & Life Science
EPC & Manufacturing
Dig
itiza
tion
Full adaptation
No adaptation
Simple
Major
+
–
Agilization
No changes planned
Full agilization of development
Selective process acceleration
Agilization of development
– +

30
Customer Involvement in Product Development
Automotive Telecom & Media
Energy & Utilities
Consumer & Life
Science
Financial Institutions
EPC & Manufac-
turing
Travel & Transport
40%
20%
40%
0
77%
9%
5%
9%
60%
20%
13%
7%
27%
56%
17%
0%
60%
16%
24%
0%
72%
10%
18%
0%
46%
46%
8%
0%
Frequent involvement 16%
3% Strong involvement
Occasional involvement
22%
58%
No involvement of customers
Source: Arthur D. Little Digital Transformation Study 2015 Numbers indicate frequency of answers among companies in given industries
Share of participants
The majority of companies only involve their customers in the product development process occasionally – industry leaders typically involve their customers
Deep Dive – B. Products & Services
Highest

31
Table of Contents
1 Executive Summary
2 Deep Dive
Drivers & Challenges
A. Strategy & Governance
B. Products & Services
C. Customer Management
D. Operations & Supply Chain
E. Corporate Services & Control
F. Information Technology
G. Workplace & Culture
3 Appendix (DTI per industry)
Source: Arthur D. Little Digital Transformation Study 2015

32
Source: Arthur D. Little Digital Transformation Study 2015
Overview Customer Management
Deep Dive – C. Customer Management
Key Learnings
Despite a diverse understanding of the nature of the “digital customer”, companies expect a significant increase in the share of digital customers within the next 3 years
The share of customer interactions through digital customer service is constantly growing – great opportunities lie ahead
Digital technology can be leveraged to transform from wholesale to a retail-led growth strategy based on an integrated customer experience across all channels
Current low share of digital marketing expenditure correlates with a low share of digital channel sales – both are mostly still below 25%, but predicted to grow
There is still huge potential for many companies to capture client information from digital interactions and increase the benefit for better business decisions
Real-time dynamic pricing can be used to optimize revenues by driving in an average profit boost of ca. 25%
Integrated solutions with sophisticated analytics are mean-while available across the customer journey and history
Workplace & Culture
Drivers & Challenges
Information Technology
Products & Services
Customer Management
Operations & Supply Chain
Corporate Services & Control
Strategy & Governance
C
Business Model

33
Despite a diverse understanding of the nature of the “digital customer”, companies expect a significant increase in the share of digital customers within the next 3 years
Deep Dive – C. Customer Management
Source: Arthur D. Little Digital Transformation Study 2015 1 Related to a company‘s total customer base; sums may not add up as some participants have voted for n/a
0%
10%
20%
30%
40%
50%
60%
70%
80%
90%
100%
In 3 years Today
30 to 50%
10 to 20%
20 to 30%
Below 10%
Above 50%
10 to 20%
Below 10%
20 to 30%
Above 50%
30 to 50%
… they use self-service and paperless communication
… they are steered and served through digital
channels … they use the internet to consume content
… they use digital hardware and media
… the customer’s lifecycle happens in a
digital environment
… they are attracted and treated online
Companies Consider Customers ‘Digital’ if … Share of ‘Digital’ Customers1
… they manage key processes digitally

34
All industries
Digitalization of Customer Service Interaction
The share of customer interactions through digital customer service is constantly growing – great opportunities lie ahead
Source: Arthur D. Little Digital Transformation Study 2015 Percentage share of companies by given answer in respective industries
Deep Dive – C. Customer Management
Current situation in respective industries
0%
10%
20%
30%
40%
50%
60%
70%
80%
90%
100%
Above 50%
Up to 25%
In 3 years Today
Above 50%
Below 10%
Up to 50%
Below 10%
Below 10%
Up to 50%
Up to 50%
3 years ago
Up to 25%
Up to 25%
Above 50%
Automotive Telecom & Media
Energy & Utilities
Consumer & Life
Science
Financial Institutions
EPC & Manufac-
turing
Travel & Transport
40% 39% 43% 27% 12% 29% 30%
20% 15% 21% 9% 12% 0% 19%
40% 25% 0% 9% 17% 0% 11%
20% 20% 35% 55% 58% 70% 40%
%

35
Shar
e of
mar
ketin
g ex
pens
es fo
r di
gita
l cha
nnel
s
Future Equilibrium
High effort, still low impact
To be improved
area
Low effort, high impact
3
6
3
20
39
1
1
3
2
1
13
Travel & Transport
Current low share of digital marketing expenditure correlates with a low share of digital channel sales – both are mostly still below 25%, but predicted to grow
Deep Dive – C. Customer Management
Source: Arthur D. Little Digital Transformation Study 2015
Impact of Digital Marketing Expenditure on Digital Channel Sales
= Bubble size reflects no. of companies
Financial Institutions
Energy & Utilities
Automotive Telecom & Media
Consumer & Life Science
EPC & Manufacturing
Utilization > Collection +
–
Share of sales through digital channels – +
>50%
<10%
10–25%
25–50%
<10% >50% 10–25% 25–50%

36
Travel & Transport
There is still huge potential for many companies to capture client information from digital interactions and increase the benefit for better business decisions
Deep Dive – C. Customer Management
Source: Arthur D. Little Digital Transformation Study 2015
Obtaining Customer Information and Using it
= Bubble size reflects no of companies
Financial Institutions
Energy & Utilities
Automotive Telecom & Media
Consumer & Life Science
EPC & Manufacturing
Dat
a us
age
with
Bus
ines
s A
naly
tics
Significant (i.e.
Predict)
No usage
Data collection from digital interaction
No collection Total (i.e. Client needs)
Limited (i.e. Transactional)
Advanced (i.e. Informational)
Simple (i.e.
Facilitate)
Advanced (i.e.
Optimize)
Collection > Utilization
Utilization > Collection
– +
3
4
2
2
3
6 8
20
16 39
+
–

37
Table of Contents
1 Executive Summary
2 Deep Dive
Drivers & Challenges
A. Strategy & Governance
B. Products & Services
C. Customer Management
D. Operations & Supply Chain
E. Corporate Services & Control
F. Information Technology
G. Workplace & Culture
3 Appendix (DTI per industry)
Source: Arthur D. Little Digital Transformation Study 2015

38
Source: Arthur D. Little Digital Transformation Study 2015
Overview Operations & Supply Chain
Deep Dive – D. Operations & Supply Chain
70% of the participants have no clear view and perspectives on trends and the impact of new digital technologies on their Operations & Supply Chain
Most companies underestimate radical innovation capabilities and full digitalization of technological components in Operations & Supply Chain
Leading Companies have a clear understanding of how digital and new technologies will impact Operations & Supply Chain and have set up a process for rapid deployment
Prototypes already allow for de-central in-store and just-in-time productions, i.e. customized products with individual colors, sizes, etc. with a few minutes’ delivery time
Tests of Augmented Reality in warehousing resulted in significant efficiency increases and reductions in errors
Cloud-based Machine-to-Machine (M2M) solution and RFID-based asset tracking solution can help ensure product quality
Key Learnings
Workplace & Culture
Drivers & Challenges
Information Technology
Products & Services
Customer Management
Operations & Supply Chain
Corporate Services & Control
Strategy & Governance
D
Business Model

39
Target Picture & Transformation Roadmap
Continuous and incremental optimization 25%
Current work on Digital agenda and roadmap 44%
Clear view on trends and industry impacts (5-10 yrs) 26%
Target picture and roadmap for E2E operations (5-10 yrs) 5%
Source: Arthur D. Little Digital Transformation Study 2015
Share of participants
70% of the participants have no clear view and perspectives on trends and the impact of new digital technologies on their Operations & Supply Chains
Deep Dive – D. Operations & Supply Chain
Leverage of Technologies & Digital Methods
Share of participants
Focus on well established technologies and processes 12%
Increase of digitalization is planned 52%
Performance already high and on peer-level 24%
Competitive advantage through state-of-the art 12%

40
Leading Companies have a clear understanding of how digital and new technologies will impact Operations & Supply Chain and have set up a process for rapid deployment
Source: Arthur D. Little Digital Transformation Study 2015, Company Information
Deep Dive – D. Operations & Supply Chain
Strategic plan for Innovating Operations
A manufacturing company has developed a 10-year vision about technology usage in operations & supply chain
A self-financing project pipeline for deployment is set up and will be frequently updated to extend coverage and to leverage new technology opportunities
Partner-Networks have been set up for mission-critical technologies and applications to create competitive advantages
Description
Cost improvement potential above 20% in relation to value add
Higher customer and staff satisfaction
Implications & Benefits
Best Practice

41
Table of Contents
1 Executive Summary
2 Deep Dive
Drivers & Challenges
A. Strategy & Governance
B. Products & Services
C. Customer Management
D. Operations & Supply Chain
E. Corporate Services & Control
F. Information Technology
G. Workplace & Culture
3 Appendix (DTI per industry)
Source: Arthur D. Little Digital Transformation Study 2015

42
Source: Arthur D. Little Digital Transformation Study 2015
Overview Corporate Services & Control
Deep Dive – E. Corporate Services & Control
Participants expect their companies to heavily invest in advanced digital solutions to create transparency and comprehensive controlling
Companies plan to utilize complex digital solutions to support and automate their processes
Brand dashboards can integrate Web Analytics, CRM and share of voice at a single glance
Highly standardized and thus professionalized “launch factory” approach can be seen as starting point for mastering execution
A cloud-based HR model can foster high employee performance and efficient global staffing
Key Learnings
Workplace & Culture
Drivers & Challenges
Information Technology
Products & Services
Customer Management
Operations & Supply Chain
Corporate Services & Control
Strategy & Governance
E
Business Model

43
Participants expect their companies to heavily invest in advanced digital solutions to create transparency and comprehensive controlling
Deep Dive – E. Corporate Services & Control
Source: Arthur D. Little Digital Transformation Study 2015 Percentage share of companies by given answer in respective industries
All industries
Use of Digital Solutions to Achieve Transparency and Control Current Situation in Respective Industries
0%
10%
20%
30%
40%
50%
60%
70%
80%
90%
100%
In 3 years
Complex use
Advanced use
Simple use
Today
Complex use
Advanced use
Simple use
Marginal use
Marginal use
Automotive Telecom & Media
Energy & Utilities
Consumer & Life
Science
Financial Institutions
EPC & Manufac-
turing
Travel & Transport
20% 41% 47% 50% 32% 36% 23%
0% 5% 13% 8% 8% 9% 0%
60% 13% 27% 33% 32% 10% 31%
20% 41% 13% 9% 28% 45% 46%
%

44
Companies plan to utilize complex digital solutions to support and automate their processes
Deep Dive – E. Corporate Services & Control
Source: Arthur D. Little Digital Transformation Study 2015 Percentage share of companies by given answer in respective industries
All industries
Use of Digital Solutions to Automate Management Processes Current Situation in Respective Industries
0%
10%
20%
30%
40%
50%
60%
70%
80%
90%
100%
In 3 years
Complex use
Advanced use
Simple use
Marginal use
Today
Complex use
Advanced use
Simple use
Marginal use
Automotive Telecom & Media
Energy & Utilities
Consumer & Life
Science
Financial Institutions
EPC & Manufac-
turing
Travel & Transport
20% 50% 35% 50% 44% 19% 16%
0% 5% 14% 8% 8% 0% 0%
80% 18% 43% 25% 20% 45% 46%
0% 27% 8% 17% 28% 36% 38%
%

45
Table of Contents
1 Executive Summary
2 Deep Dive
Drivers & Challenges
A. Strategy & Governance
B. Products & Services
C. Customer Management
D. Operations & Supply Chain
E. Corporate Services & Control
F. Information Technology
G. Workplace & Culture
3 Appendix (DTI per industry)
Source: Arthur D. Little Digital Transformation Study 2015

46
Source: Arthur D. Little Digital Transformation Study 2015
Overview Information Technology
Deep Dive – F. Information Technology
Key Learnings
The role of IT departments is still passive – The majority “enables” Digital Transformation only. The leaders also have a budget share of 50% dedicated for Digital
IT departments need to balance their technical capabilities and redefine their operating models in order to become co-leaders in the digitalization process
Layered IT architectures enable even large companies to realize an omnichannel solution in less than 6 months, with a massive impact on footfall and revenues
IT infrastructure-enabled Industry 4.0 solutions can help to increase productivity and profits for contractors
Workplace & Culture
Drivers & Challenges
Information Technology
Products & Services
Customer Management
Operations & Supply Chain
Corporate Services & Control
Strategy & Governance
F
Business Model

47
The Role of IT in the Context of Digitalization
N/a 2%
Reactive 15%
Enabler 55%
Driver 21%
Leader 7%
Source: Arthur D. Little Digital Transformation Study 2015
Share of participants
The role of IT departments is still passive – The majority “enables” Digital Transformation only. The leaders also have a budget share of 50% dedicated for Digital
Deep Dive – F. Information Technology
IT Budget Dedicated to Digital
None 21%
Up to 10% 19%
Up to 25% 26%
Up to half 21%
More than half 13%
Share of participants

48
Flexibility of the IT Landscape
Flexible 6%
Balanced 22%
Complex 58%
Rigid 13%
Source: Arthur D. Little Digital Transformation Study 2015
IT departments need to balance their technical capabilities and redefine their operating models in order to become co-leaders in the digitalization process
Deep Dive – F. Information Technology
Maturity of the IT Operating Model
28%
50% Medium
Low 13%
8% Very high
High
Share of participants Share of participants

49
Table of Contents
1 Executive Summary
2 Deep Dive
Drivers & Challenges
A. Strategy & Governance
B. Products & Services
C. Customer Management
D. Operations & Supply Chain
E. Corporate Services & Control
F. Information Technology
G. Workplace & Culture
3 Appendix (DTI per industry)
Source: Arthur D. Little Digital Transformation Study 2015

50
Source: Arthur D. Little Digital Transformation Study 2015
Overview Workplace & Culture
Deep Dive – G. Workplace & Culture
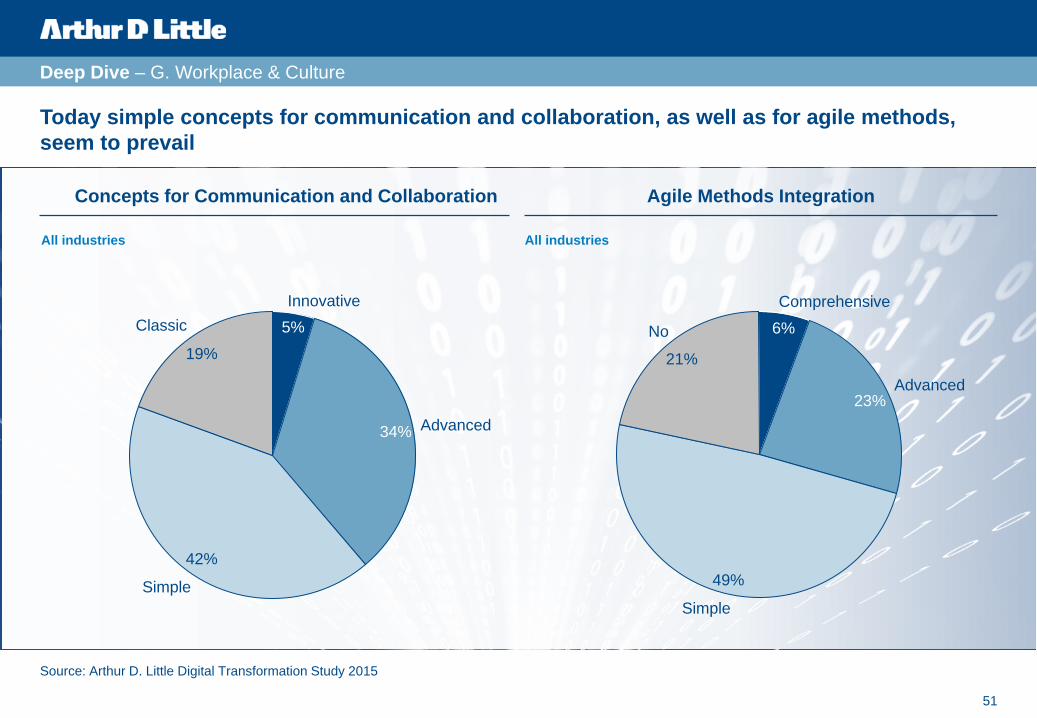
Today simple concepts for communication and collaboration, as well as for agile methods, seem to prevail
This is unfortunately not yet the adequate playground for catalyzing the digitalization of business
Internal innovation capability generally lags behind due to little usage of agile methods
A gamification-based workplace culture can attract talent from all over the world
Key Learnings
Workplace & Culture
Drivers & Challenges
Information Technology
Products & Services
Customer Management
Operations & Supply Chain
Corporate Services & Control
Strategy & Governance
Business Model
G
51
All industries
Today simple concepts for communication and collaboration, as well as for agile methods, seem to prevail
Deep Dive – G. Workplace & Culture
Source: Arthur D. Little Digital Transformation Study 2015
Innovative 5%
34%
42%
19%
Advanced
Simple
Classic
All industries
Comprehensive
6%
23%
49%
21% Advanced
No
Simple
Agile Methods Integration Concepts for Communication and Collaboration

52
Table of Contents
Source: Arthur D. Little Digital Transformation Study 2015
1 Executive Summary
2 Deep Dive
3 Appendix (DTI per industry)

53
Source: Arthur D. Little Digital Transformation Study 2015 Note: DTI calculated as average of scores for each section
DTI for Automotive Industry: 5,02
Appendix – Automotive Industry
10
9
8
7
6
5
4
3
2
1
0
Digital aware [score below 2.5]
Digital oriented [score between 5 and 7.5]
Digital adaptive [score between 2.5 and 5.0]
Digital centric [score above 7.5]
Average Each # represents a specific company
The Arthur D. Little Digital Transformation Index (DTI) shows that today few firms can be considered “digital oriented” or “digital centric”
102 100 98 96 94 92 90 88 86 84 82 80 78 76 74 72 70 68 66 64 62 60 58 56 54 52 103 101 99 97 95 93 91 89 87 85 83 81 79 77 75 73 71 69 67 65 63 61 59 57 55 53
51 49 47 45 43 41 39 37 35 33 31 29 27 25 23 21 19 17 15 13 11 9 7 5 3 1 50 48 46 44 42 40 38 36 34 32 30 28 26 24 22 20 18 16 14 12 10 8 6 4 2
X-Axis = Indexed at Cross-Industry Ø 3.92
Y-Axis = Company-Specific Deviation to Ø

54
Automotive belongs to the most developed industries in terms of digitalization. The field of Operations & Supply Chain is perceived as the weakest point
Appendix – Automotive Industry
DTI for Automotive Industry per Section
Source: Arthur D. Little Digital Transformation Study 2015
= Automotive Virtual Star = Automotive average
10 9 8 7 6 5 4 3 2 1
Strategy & Governance
Products & Services
Customer Management
Operations & Supply Chain
Corp. Services & Control
Information Technologies
Workplace & Culture

55
Source: Arthur D. Little Digital Transformation Study 2015 Note: DTI calculated as average of scores for each section
DTI for Telecom & Media Industry: 4,20
The Arthur D. Little Digital Transformation Index (DTI) shows that today few firms can be considered “digital oriented” or “digital centric”
Appendix – Telecom & Media Industry
10
9
8
7
6
5
4
3
2
1
0
Digital aware [score below 2.5]
Digital oriented [score between 5 and 7.5]
Digital adaptive [score between 2.5 and 5.0]
Digital centric [score above 7.5]
Average Each # represents a specific company
102 100 98 96 94 92 90 88 86 84 82 80 78 76 74 72 70 68 66 64 62 60 58 56 54 52 103 101 99 97 95 93 91 89 87 85 83 81 79 77 75 73 71 69 67 65 63 61 59 57 55 53
51 49 47 45 43 41 39 37 35 33 31 29 27 25 23 21 19 17 15 13 11 9 7 5 3 1 50 48 46 44 42 40 38 36 34 32 30 28 26 24 22 20 18 16 14 12 10 8 6 4 2
X-Axis = Indexed at Cross-Industry Ø 3.92
Y-Axis = Company-Specific Deviation to Ø

56
Although the Telecom & Media Industry is strong in digital strategy there is no clear industry pattern, but significant room for improvement in some sections for each company
Appendix – Telecom & Media Industry
DTI for Telecom & Media Industry per Section
Source: Arthur D. Little Digital Transformation Study 2015
= Telecom & Media Virtual Star = Telecom & Media average
10 9 8 7 6 5 4 3 2 1
Strategy & Governance
Products & Services
Customer Management
Operations & Supply Chain
Corp. Services & Control
Information Technologies
Workplace & Culture

57
Source: Arthur D. Little Digital Transformation Study 2015 Note: DTI calculated as average of scores for each section
The Arthur D. Little Digital Transformation Index (DTI) shows that today few firms can be considered “digital oriented” or “digital centric”
Appendix – Energy & Utilities Industry
DTI for Energy & Utilities Industry: 4,11
9
8
7
6
5
4
3
2
1
0
Digital aware [score below 2.5]
Digital oriented [score between 5 and 7.5]
Digital adaptive [score between 2.5 and 5.0]
Digital centric [score above 7.5]
Average Each # represents a specific company
102 100 98 96 94 92 90 88 86 84 82 80 78 76 74 72 70 68 66 64 62 60 58 56 54 52 103 101 99 97 95 93 91 89 87 85 83 81 79 77 75 73 71 69 67 65 63 61 59 57 55 53
51 49 47 45 43 41 39 37 35 33 31 29 27 25 23 21 19 17 15 13 11 9 7 5 3 1 50 48 46 44 42 40 38 36 34 32 30 28 26 24 22 20 18 16 14 12 10 8 6 4 2
X-Axis = Indexed at Cross-Industry Ø 3.92
Y-Axis = Company-Specific Deviation to Ø

58
There are rather strong differences between respective enterprises in Energy & Utilities, but the industry generally lags behind in terms of products and operations
Appendix – Energy & Utilities Industry
DTI for Energy & Utilities Industry per Section
Source: Arthur D. Little Digital Transformation Study 2015
= Energy & Utilities Virtual Star = Energy & Utilities average
10 9 8 7 6 5 4 3 2 1
Strategy & Governance
Products & Services
Customer Management
Operations & Supply Chain
Corp. Services & Control
Information Technologies
Workplace & Culture

59
10
9
8
7
6
5
4
3
2
1
0
Digital aware [score below 2.5]
Digital oriented [score between 5 and 7.5]
Digital adaptive [score between 2.5 and 5.0]
Digital centric [score above 7.5]
Average Each # represents a specific company
Source: Arthur D. Little Digital Transformation Study 2015 Note: DTI calculated as average of scores for each section
The Arthur D. Little Digital Transformation Index (DTI) shows that today few firms can be considered “digital oriented” or “digital centric”
Appendix – Financial Institutions Industry
DTI for Financial Institutions Industry: 3,86
102 100 98 96 94 92 90 88 86 84 82 80 78 76 74 72 70 68 66 64 62 60 58 56 54 52 103 101 99 97 95 93 91 89 87 85 83 81 79 77 75 73 71 69 67 65 63 61 59 57 55 53
51 49 47 45 43 41 39 37 35 33 31 29 27 25 23 21 19 17 15 13 11 9 7 5 3 1 50 48 46 44 42 40 38 36 34 32 30 28 26 24 22 20 18 16 14 12 10 8 6 4 2
X-Axis = Indexed at Cross-Industry Ø 3.92
Y-Axis = Company Specific Deviation to Ø

60
Financial Institutions focus on digital strategy, governance and IT while only few actually have adapted products and operations
Appendix – Financial Institutions Industry
DTI for Financial Institutions Industry per Section:
Source: Arthur D. Little Digital Transformation Study 2015
= Financial Institutions Virtual Star = Financial Institutions average
10 9 8 7 6 5 4 3 2 1
Strategy & Governance
Products & Services
Customer Management
Operations & Supply Chain
Corp. Services & Control
Information Technologies
Workplace & Culture

61
Source: Arthur D. Little Digital Transformation Study 2015 Note: DTI calculated as average of scores for each section
10
The Arthur D. Little Digital Transformation Index (DTI) shows that today few firms can be considered “digital oriented” or “digital centric”
Appendix – Consumer & Life Science Industry
DTI for Consumer & Life Science Industry: 3,71
9
8
7
6
5
4
3
2
1
0
Digital aware [score below 2.5]
Digital oriented [score between 5 and 7.5]
Digital adaptive [score between 2.5 and 5.0]
Digital centric [score above 7.5]
Average Each # represents a specific company
102 100 98 96 94 92 90 88 86 84 82 80 78 76 74 72 70 68 66 64 62 60 58 56 54 52 103 101 99 97 95 93 91 89 87 85 83 81 79 77 75 73 71 69 67 65 63 61 59 57 55 53
51 49 47 45 43 41 39 37 35 33 31 29 27 25 23 21 19 17 15 13 11 9 7 5 3 1 50 48 46 44 42 40 38 36 34 32 30 28 26 24 22 20 18 16 14 12 10 8 6 4 2
X-Axis = Indexed at Cross-Industry Ø 3.92
Y-Axis = Company-Specific Deviation to Ø

62
The Consumer & Life Science industry has large potential to digitize customer management, operations and corporate services
Appendix – Consumer & Life Science Industry
DTI for Consumer & Life Science Industry per Section
Source: Arthur D. Little Digital Transformation Study 2015
= Consumer & Life Science Virtual Star = Consumer & Life Science average
10 9 8 7 6 5 4 3 2 1
Strategy & Governance
Products & Services
Customer Management
Operations & Supply Chain
Corp. Services & Control
Information Technologies
Workplace & Culture

63
10
9
8
7
6
5
4
3
2
1
0
Digital aware [score below 2.5]
Digital oriented [score between 5 and 7.5]
Digital adaptive [score between 2.5 and 5.0]
Digital centric [score above 7.5]
Average Each # represents a specific company
Source: Arthur D. Little Digital Transformation Study 2015 Note: DTI calculated as average of scores for each section 1) EPC = Engineering, Procurement & Construction
10
The Arthur D. Little Digital Transformation Index (DTI) shows that today few firms can be considered “digital oriented” or “digital centric”
Appendix – EPC & Manufacturing Industry
DTI for EPC1 & Manufacturing Industry: 3,53
102 100 98 96 94 92 90 88 86 84 82 80 78 76 74 72 70 68 66 64 62 60 58 56 54 52 103 101 99 97 95 93 91 89 87 85 83 81 79 77 75 73 71 69 67 65 63 61 59 57 55 53
51 49 47 45 43 41 39 37 35 33 31 29 27 25 23 21 19 17 15 13 11 9 7 5 3 1 50 48 46 44 42 40 38 36 34 32 30 28 26 24 22 20 18 16 14 12 10 8 6 4 2
X-Axis = Indexed at Cross-Industry Ø 3.92
Y-Axis = Company-Specific Deviation to Ø

64
Few EPC1 & Manufacturing companies have set a digital strategy, while no company in our sample has significantly transformed its products or operating model
Appendix – EPC & Manufacturing Industry
DTI for EPC1 & Manufacturing Industry per Section
Source: Arthur D. Little Digital Transformation Study 2015 1) EPC = Engineering, Procurement & Construction
= EPC & Manufacturing Virtual Star = EPC & Manufacturing average
10 9 8 7 6 5 4 3 2 1
Strategy & Governance
Products & Services
Customer Management
Operations & Supply Chain
Corp. Services & Control
Information Technologies
Workplace & Culture

65
Source: Arthur D. Little Digital Transformation Study 2015 Note: DTI calculated as average of scores for each section
10
The Arthur D. Little Digital Transformation Index (DTI) shows that today few firms can be considered “digital oriented” or “digital centric”
Appendix – Travel & Transport Industry
DTI for Travel & Transport Industry: 3,51
10
9
8
7
6
5
4
3
2
1
0
Digital aware [score below 2.5]
Digital oriented [score between 5 and 7.5]
Digital adaptive [score between 2.5 and 5.0]
Digital centric [score above 7.5]
Average Each # represents a specific company
102 100 98 96 94 92 90 88 86 84 82 80 78 76 74 72 70 68 66 64 62 60 58 56 54 52 103 101 99 97 95 93 91 89 87 85 83 81 79 77 75 73 71 69 67 65 63 61 59 57 55 53
51 49 47 45 43 41 39 37 35 33 31 29 27 25 23 21 19 17 15 13 11 9 7 5 3 1 50 48 46 44 42 40 38 36 34 32 30 28 26 24 22 20 18 16 14 12 10 8 6 4 2
X-Axis = Indexed at Cross-Industry Ø 3.92
Y-Axis = Company-Specific Deviation to Ø

66
Travel & Transport is lagging behind in Digital Transformation – products and services as well as operations have especially not seen relevant changes
Appendix – Travel & Transport Industry
DTI for Travel & Transport Industry per Section
Source: Arthur D. Little Digital Transformation Study 2015
= Travel & Transport Virtual Star = Travel & Transport average
10 9 8 7 6 5 4 3 2 1
Strategy & Governance
Products & Services
Customer Management
Operations & Supply Chain
Corp. Services & Control
Information Technologies
Workplace & Culture

67
Contact Details
Authors: Michael Opitz, Bernd Schreiber, Volker Pfirsching, Alejandro Gonzalez, Thomas Gnirs, Gabriel Mohr, Stefan Peintner, Oliver Krause
Contact:
Dr. Michael Opitz Head of TIME Practice Central Europe Nymphenburger Str. 4 80335 Munich Germany M: +49 175 5806 187 E: [email protected] www.adlittle.com
Arthur D. Little has been at the forefront of innovation since 1886. We are an acknowledged thought leader in linking strategy, innovation and transformation in technology-intensive and converging industries. We navigate our clients through changing business ecosystems to uncover new growth opportunities. We enable our clients to build innovation capabilities and transform their organization.
Our consultants have strong practical industry experience combined with excellent knowledge of key trends and dynamics. Arthur D. Little is present in the most important business centers around the world. We are proud to serve most of the Fortune 1000 companies, in addition to other leading firms and public sector organizations.
For further information please visit www.adlittle.com
Copyright © Arthur D. Little 2015. All rights reserved.