Arrow Dow Jones Global Yield ETF · 2016-10-07 · Arrow Dow Jones Global Yield ETF . GYLD ....
24
Arrow Dow Jones Global Yield ETF GYLD Semi-Annual Report July 31, 2016 1-877-277-6933 1-877-ARROW-FD www.ArrowShares.com
Transcript of Arrow Dow Jones Global Yield ETF · 2016-10-07 · Arrow Dow Jones Global Yield ETF . GYLD ....

Arrow Dow Jones Global Yield ETF
GYLD
Semi-Annual Report July 31, 2016
1-877-277-6933 1-877-ARROW-FD
www.ArrowShares.com


The Fund's performance figures* for the periods ended July 31, 2016, as compared to its benchmark:
Annualized
Annualized Since Inception** -
Six Months One Year Three Years July 31, 2016
Arrow Dow Jones Global Yield ETF - NAV 21.71% (5.26)% (2.50)% 1.15%
Arrow Dow Jones Global Yield ETF - Market Price 23.47% (4.27)% (2.69)% 0.67%
Dow Jones Global Composite Yield Index *** 22.85% (4.05)% (1.31)% 2.06%
The Fund’s Top Asset Classes are as follows:
Please refer to the Portfolio of Investments in this Semi-Annual report for a detailed analysis of the Fund's holdings.
*The Fund’s past performance does not guarantee future results. The investment return and principal value of an investment in the Fund will fluctuate so that an
investor’s shares, when redeemed, may be worth more or less than their original cost. Current performance of the Fund may be lower or higher than the performance
quoted. Performance data current to the most recent month end may be obtained by visiting www.ArrowShares.com or by calling 1-877-277-6933.
** Commencement of trading is May 8, 2012.
Arrow Dow Jones Global Yield ETF
PORTFOLIO REVIEW (Unaudited)
July 31, 2016
*** The Dow Jones Global Composite Yield Index is constructed by equally weighting the five global high-yield index baskets, each of which is made up of 30 equally
weighted components.
The Fund’s per share net asset value or “NAV” is the value of one share of the Fund as calculated in accordance with the standard formula for valuing mutual fund
shares. The NAV return is based on the NAV of the Fund and the market return is based on the market price per share of the Fund. The price used to calculate
market return (“Market Price”) is determined by using the midpoint between the highest bid and the lowest offer on the primary stock exchange on which shares of
the Fund are listed for trading, as of the time that the Fund’s NAV is calculated. Since shares of the Fund did not trade in the secondary market until after the Fund's
inception, for the period from inception (5/2/2012) to the first day of secondary market trading shares of the Fund, the NAV of the Fund is used as a proxy for the
Market Price to calculate market returns. Market and NAV returns assume that dividends and capital gain distributions have been reinvested in the Fund at Market
Price and NAV, respectively. The Fund's total annual operating expense are 0.75% per the June 1, 2016 prospectus.
Asset Class % of Net Assets
Financial 24.5%
Energy 23.5%
Government 19.2%
Communications 7.3%
Utilities 6.5%
Basic Materials 6.1%
Industrial 5.8%
Consumer, Non-Cyclical 2.8%
Consumer, Cyclical 2.3%
Diversified 0.7%
Other, Cash & Cash Equivalents 1.3%
100.0%
1

Principal ($) Value
BONDS & NOTES - 38.7%
AGRICULTURE - 0.6%
598,000 Vector Group Ltd., 7.750%, due 2/15/2021 $ 625,657
CHEMICALS - 1.3%
772,000 The Chemours Co., 6.625%, due 5/15/2023 665,850
795,000 The Chemours Co., 7.000%, due 5/15/2025 675,750
1,341,600
COMMERCIAL SERVICES - 0.7%
665,000 Avis Budget Finance, Inc., 5.500%, due 4/1/2023 660,012
DIVERSIFIED FINANCAL SERVICES - 1.3%
680,000 Navient Corp., 5.000%, due 10/26/2020 663,000
760,000 Navient Corp., 5.875%, due 10/25/2024 701,100
1,364,100
ELECTRIC - 2.0%
640,000 Emera, Inc., 6.750%, due 6/15/2076 691,840
664,000 NRG Energy, Inc., 6.250%, due 7/15/2022 667,320
887,000 PPL Energy Supply LLC, 4.600%, due 12/15/2021 709,600
2,068,760
FOREST PRODUCTS & PAPER - 0.7%
824,000 Resolute Forest Products, Inc., 5.875%, due 5/15/2023 675,680
IRON & STEEL - 0.7%
704,000 Vale Overseas Ltd., 4.375%, due 1/11/2022 683,760
MACHINERY-CONSTRUCTION & MINING - 0.7%
681,000 Joy Global Inc., 5.125%, due 10/15/2021 736,679
MEDIA - 0.7%
700,000 Dish DBS Corp., 5.875%, due 11/15/2024 675,500
MINING - 0.6%
731,000 Freeport-McMoRan Inc., 3.875%, due 3/15/2023 628,697
OIL & GAS - 6.3%
696,000 Continental Resources, Inc., 4.500%, due 4/15/2023 629,880
741,000 CVR Refining LLC, 6.500%, due 11/1/2022 629,850
766,000 Ensco PLC., 4.700%, due 3/15/2021 651,100
698,000 Murphy Oil Corp., 4.700%, due 12/1/2022 629,921
602,000 PBF Holding Co LLC, 8.250%, due 2/15/2020 624,575
681,000 Petrobras Global Finance BV., 4.875%, due 3/17/2020 663,369
720,000 Petrobras Global Finance BV., 6.250%, due 3/17/2024 675,000
687,000 QEP Resources Inc., 5.25%, due 5/1/2023 647,498
750,000 Rowan Cos Inc., 4.875%, due 6/1/2022 635,625
665,000 Southwestern Energy Co., 6.700%, due 1/23/2025 645,050
6,431,868
Arrow Dow Jones Global Yield ETF
PORTFOLIO OF INVESTMENTS (Unaudited)
July 31, 2016
2See accompanying notes to financial statements.
Principal ($) Value
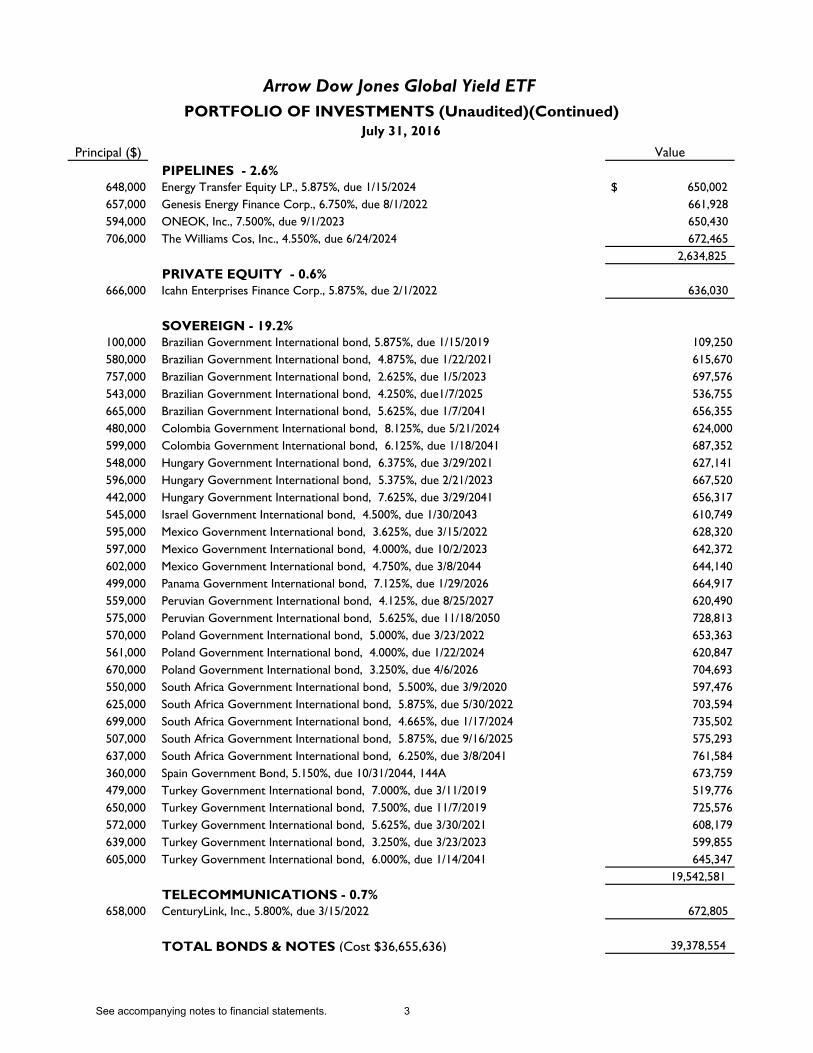
PIPELINES - 2.6%
648,000 Energy Transfer Equity LP., 5.875%, due 1/15/2024 $ 650,002
657,000 Genesis Energy Finance Corp., 6.750%, due 8/1/2022 661,928
594,000 ONEOK, Inc., 7.500%, due 9/1/2023 650,430
706,000 The Williams Cos, Inc., 4.550%, due 6/24/2024 672,465
2,634,825
PRIVATE EQUITY - 0.6%
666,000 Icahn Enterprises Finance Corp., 5.875%, due 2/1/2022 636,030
SOVEREIGN - 19.2%
100,000 Brazilian Government International bond, 5.875%, due 1/15/2019 109,250
580,000 Brazilian Government International bond, 4.875%, due 1/22/2021 615,670
757,000 Brazilian Government International bond, 2.625%, due 1/5/2023 697,576
543,000 Brazilian Government International bond, 4.250%, due1/7/2025 536,755
665,000 Brazilian Government International bond, 5.625%, due 1/7/2041 656,355
480,000 Colombia Government International bond, 8.125%, due 5/21/2024 624,000
599,000 Colombia Government International bond, 6.125%, due 1/18/2041 687,352
548,000 Hungary Government International bond, 6.375%, due 3/29/2021 627,141
596,000 Hungary Government International bond, 5.375%, due 2/21/2023 667,520
442,000 Hungary Government International bond, 7.625%, due 3/29/2041 656,317
545,000 Israel Government International bond, 4.500%, due 1/30/2043 610,749
595,000 Mexico Government International bond, 3.625%, due 3/15/2022 628,320
597,000 Mexico Government International bond, 4.000%, due 10/2/2023 642,372
602,000 Mexico Government International bond, 4.750%, due 3/8/2044 644,140
499,000 Panama Government International bond, 7.125%, due 1/29/2026 664,917
559,000 Peruvian Government International bond, 4.125%, due 8/25/2027 620,490
575,000 Peruvian Government International bond, 5.625%, due 11/18/2050 728,813
570,000 Poland Government International bond, 5.000%, due 3/23/2022 653,363
561,000 Poland Government International bond, 4.000%, due 1/22/2024 620,847
670,000 Poland Government International bond, 3.250%, due 4/6/2026 704,693
550,000 South Africa Government International bond, 5.500%, due 3/9/2020 597,476
625,000 South Africa Government International bond, 5.875%, due 5/30/2022 703,594
699,000 South Africa Government International bond, 4.665%, due 1/17/2024 735,502
507,000 South Africa Government International bond, 5.875%, due 9/16/2025 575,293
637,000 South Africa Government International bond, 6.250%, due 3/8/2041 761,584
360,000 Spain Government Bond, 5.150%, due 10/31/2044, 144A 673,759
479,000 Turkey Government International bond, 7.000%, due 3/11/2019 519,776
650,000 Turkey Government International bond, 7.500%, due 11/7/2019 725,576
572,000 Turkey Government International bond, 5.625%, due 3/30/2021 608,179
639,000 Turkey Government International bond, 3.250%, due 3/23/2023 599,855
605,000 Turkey Government International bond, 6.000%, due 1/14/2041 645,347
19,542,581
TELECOMMUNICATIONS - 0.7%
658,000 CenturyLink, Inc., 5.800%, due 3/15/2022 672,805
TOTAL BONDS & NOTES (Cost $36,655,636) 39,378,554
Arrow Dow Jones Global Yield ETF
PORTFOLIO OF INVESTMENTS (Unaudited)(Continued)
July 31, 2016
3See accompanying notes to financial statements.

Shares Value
COMMON STOCKS - 41.7%
BANKS - 0.7%
38,033 National Australia Bank Ltd. $ 767,646
COMMERCIAL SERVICES - 0.8%
45,072 RR Donnelley & Sons Co. 807,690
ELECTRIC - 3.7%
41,366 CEZ AS 781,181
220,125 EDP - Energias de Portugal SA 755,574
44,251 Engie SA 729,006
45,764 Fortum OYJ 760,331
17,299,400 Unipro PJSC 784,326
3,810,418
ELECTRONICS - 0.8%
697,500 Synnex Technology International Corp. 822,951
ENTERTAINMENT - 0.8%
98,368 OPAP SA 786,887
HOLDING COMPANIES - DIVERSIFIED - 0.7%
182,400 Keppel Corp Ltd. 713,402
INSURANCE - 1.3%
91,220 Powszechny Zaklad Ubezpieczen SA 660,522
8,332 Swiss Re AG 702,465
1,362,987
IRON/STEEL - 1.5%
523,410 Eregli Demir ve Celik Fabrikalari TAS 795,275
39,054 Russel Metals, Inc. 708,218
1,503,493
LODGING - 0.8%
1,242,169 SJM Holdings Ltd. 774,665
MACHINERY - DIVERSIFIED - 0.7%
24,972 Turk Traktor ve Ziraat Makineleri AS 697,010
MEDIA - 0.8%
39,690 Vivendi SA 780,865
MINING - 0.8%
54,412 MMC Norilsk Nickel PJSC- ARD 795,503
July 31, 2016
Arrow Dow Jones Global Yield ETF
PORTFOLIO OF INVESTMENTS (Unaudited)(Continued)
4See accompanying notes to financial statements.

Shares Value
OIL & GAS - 2.0%
275,852 SandRidge Permian Trust $ 700,664
114,354 Surgutneftegas OJSC - ADR 567,196
36,515 Woodside Petroleum Ltd 736,729
2,004,589
REAL ESTATE - 1.3%
149,879 Argosy Property Ltd. 660,174
809,931 Atrium European Real Estate Ltd. 671,927
1,332,101
REAL ESTATE INVESTMENT TRUSTS (REITS) - 19.1%
63,792 Artis Real Estate Investment Trust 669,095
116,966 Ashford Hospitality Trust 697,117
9,704 Befimmo SCA 659,444
239,350 BWP Trust 697,158
1,610,800 Cambridge Industrial Trust 660,016
25,834 Care Capital Properties, Inc. 764,170
67,004 CBL & Associates Properties, Inc. 823,479
181,522 Charter Hall Retail REIT 664,008
5,281 Cofinimmo SA 659,671
54,686 Crombie Real Estate Investment Trust 662,670
7,115 Fonciere Des Regions 669,776
53,571 Franklin Street Properties Corp. 686,780
692,600 Frasers Commercial Trust 691,413
717,482 Goodman Property Trust 688,397
37,947 H&R Real Estate Investment Trust 677,937
23,527 Hospitality Properties Trust 750,747
195,469 Investa Office Fund 680,836
629,548 Kiwi Property Group Ltd. 708,483
901,900 Mapletree Logistics Trust 708,861
29,418 Mercialys SA 687,879
1,653,957 Prosperity REIT 737,375
1,897,632 SA Corporate Real Estate Fund Nominees Pty Ltd. 765,180
32,532 Senior Housing Properties Trust 722,536
1,122,600 Starhill Global REIT 669,061
522,000 Suntec Real Estate Investment Trust 649,438
15,112 Vastned Retail NV 634,531
13,180 Wereldhave NV 638,198
58,785 WP Glimcher, Inc. 745,394
19,469,650
PORTFOLIO OF INVESTMENTS (Unaudited)(Continued)
July 31, 2016
Arrow Dow Jones Global Yield ETF
5See accompanying notes to financial statements.

Shares Value
TELECOMMUNICATIONS - 5.2%
25,602 CenturyLink, Inc. $ 804,927
79,336 Mobile TeleSystems PJSC-ADR 705,297
539,410 Orange Polska SA 746,545
297,521 Spark New Zealand Ltd. 846,722
178,940 Telstra Corp Ltd. 785,204
347,274 Turk Telekomunikasyon AS 701,986
67,096 VTech Holdings Ltd. 729,239
5,319,920
TRANSPORTATION - 0.7%
1,368,900 Wan Hai Lines Ltd. 706,877
TOTAL COMMON STOCKS (Cost $43,763,235) 42,456,654
MASTER LIMITED PARTNERSHIPS - 18.3%
CHEMICALS - 0.6%
86,898 CVR Partners LP 635,224
COAL - 3.8%
34,586 Alliance Holdings GP LP 879,868
425,660 Foresight Energy LP 1,064,150
42,429 Natural Resource Partners LP 1,034,419
64,504 SunCoke Energy Partners LP 924,987
3,903,424
COMMERCIAL SERVICES - 0.7%
28,434 Stonemor Partners LP 749,805
GAS - 0.7%
50,566 Global Partners LP 682,641
OIL & GAS - 6.0%
72,670 Alon USA Partners LP 710,713
144,621 Calumet Specialty Products Partners LP 681,165
85,741 CVR Refining LP 550,457
270,256 EV Energy Partners LP 659,425
372,230 Legacy Reserves LP 643,958
375,706 Memorial Production Partners LP 571,073
127,224 Seadrill Partners LLC 530,524
21,391 Suburban Propane Partners LP 729,005
582,629 Vanguard Natural Resources LLC 1,019,601
6,095,921
OIL & GAS SERVICES - 0.7%
50,868 Archrock Partners LP 721,817
Arrow Dow Jones Global Yield ETF
PORTFOLIO OF INVESTMENTS (Unaudited)(Continued)
July 31, 2016
6See accompanying notes to financial statements.

Shares Value
PIPELINES - 2.1%
56,322 American Midstream Partners LP $ 676,990
33,584 Crestwood Equity Partners LP 743,886
14,304 NuStar Energy LP 717,346
2,138,222
RETAIL - 0.8%
40,999 Ferrellgas Partners LP 806,860
TRANSPORTATION - 2.9%
232,042 Capital Product Partners LP 874,798
38,650 Golar LNG Partners LP 738,215
30,045 Martin Midstream Partners LP 674,811
121,599 Teekay Offshore Partners LP 677,306
2,965,130
TOTAL MASTER LIMITED PARTNERSHIPS (Cost $21,313,402) 18,699,044
TOTAL INVESTMENTS - 98.7% (Cost $101,732,273)(a) $ 100,534,252
OTHER ASSETS LESS LIABILITIES - 1.3% 1,346,119
NET ASSETS - 100.0% $ 101,880,371
Unrealized Appreciation: 8,096,015$
Unrealized Depreciation: (20,979,853)
Net Unrealized Depreciation: (12,883,838)$
+ Variable rate security; the rate shown represents the rate at July 31, 2016.
* Non-income producing security.
ADR - American Depositary Receipt
LLC - Limited Liability Corporation
LP - Limited Partnership
PLC - Public Limited Company
REIT - Real Estate Investment Trust
144A - Security was purchased pursuant to Rule 144A under the Securities Act of 1933 and may not be resold subject to that rule,
except to qualified institutional buyers. At July 31, 2016 144A securities amounted to $1,015,970 or 0.7% of net assets.
PORTFOLIO OF INVESTMENTS (Unaudited)(Continued)
July 31, 2016
(a) Represents cost for financial reporting purposes. Aggregate cost for Federal tax purposes is $113,418,090 and differs from
value by net unrealized appreciation (depreciation) of securities as follows:
Arrow Dow Jones Global Yield ETF
7See accompanying notes to financial statements.

ASSETS
Investment securities:
At cost 101,732,273$
At value 100,534,252$
Cash 107,009
Foreign cash (cost $264,986) 209,051
Dividends and interest receivable 1,052,464
TOTAL ASSETS 101,902,776
LIABILITIES
Investment advisory fees payable 22,405
TOTAL LIABILITIES 22,405
NET ASSETS 101,880,371$
Net Assets Consist Of:
Paid in capital 165,358,800$
Undistributed net investment loss (146,652)
Accumulated net realized loss from investments and foreign currency transactions (62,132,275)
Net unrealized depreciation of investments and foreign currency translations (1,199,502)
NET ASSETS 101,880,371$
Net Asset Value Per Share:
Net Assets 101,880,371$
Shares of beneficial interest outstanding ($0 par value, unlimited shares authorized) 5,325,000
Net asset value (Net Assets ÷ Shares Outstanding) 19.13$
Arrow Dow Jones Global Yield ETF
STATEMENT OF ASSETS AND LIABILITIES (Unaudited)
July 31, 2016
8See accompanying notes to financial statements.

INVESTMENT INCOME
Dividends (net of foreign withholding tax of $164,014) 2,546,220$
Interest 1,256,218
TOTAL INVESTMENT INCOME 3,802,438
EXPENSES
Investment advisory fees 350,744
TOTAL EXPENSES 350,744
NET INVESTMENT INCOME 3,451,694
REALIZED AND UNREALIZED GAIN (LOSS) ON INVESTMENTS AND
FOREIGN CURRENCY
Net realized loss on:
In-kind redemptions (44,309)
Investments (9,328,214)
Foreign currency transactions (1,436,846)
(10,809,369)
Net change in unrealized appreciation on:
Investments 25,581,842
Foreign currency translations 20,154
25,601,996
14,792,627
NET INCREASE IN NET ASSETS RESULTING FROM OPERATIONS 18,244,321$
Arrow Dow Jones Global Yield ETF
STATEMENT OF OPERATIONS (Unaudited)
For the Six Months Ended July 31, 2016
NET REALIZED AND UNREALIZED GAIN ON INVESTMENTS AND
FOREIGN CURRENCY
9See accompanying notes to financial statements.

For the
Six Months Ended For the Year
July 31, 2016 Ended
(Unaudited) January 31, 2016
FROM OPERATIONS
Net investment income 3,451,694$ 12,355,286$
Net realized loss on investments
and foreign currency transactions (10,809,369) (50,308,988)
Net change in unrealized appreciation (depreciation) on investments
and foreign currency translations 25,601,996 (13,456,937)
Net increase (decrease) in net assets resulting from operations 18,244,321 (51,410,639)
DISTRIBUTIONS TO SHAREHOLDERS
From net investment income (3,918,803) (10,722,166)
From return of capital - (3,319,252)
Net decrease in net assets resulting from distributions to shareholders (3,918,803) (14,041,418)
FROM SHARES OF BENEFICIAL INTEREST
Proceeds from shares sold 2,767,348 74,724,145
Cost of shares redeemed (2,522,840) (82,320,467)
Net increase (decrease) in net assets resulting from shares of beneficial interest 244,508 (7,596,322)
TOTAL INCREASE (DECREASE) IN NET ASSETS 14,570,026 (73,048,379)
NET ASSETS
Beginning of Period 87,310,345 160,358,724
End of Period* 101,880,371$ 87,310,345$
*Includes undistributed net investment income (loss) of: (146,652)$ 320,457$
SHARE ACTIVITY
Shares sold 150,000 3,000,000
Shares redeemed (150,000) (4,275,000)
Net decrease in shares of beneficial interest outstanding - (1,275,000)
Arrow Dow Jones Global Yield ETF
STATEMENTS OF CHANGES IN NET ASSETS
10See accompanying notes to financial statements.
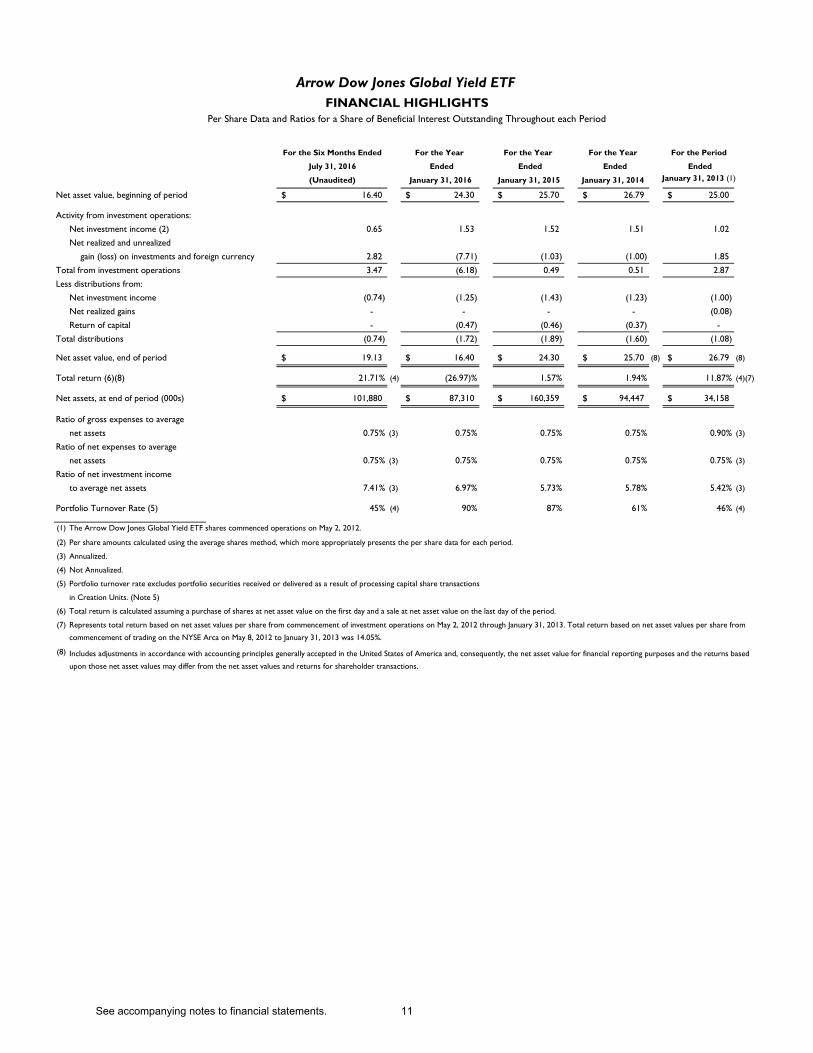
For the Six Months Ended For the Year For the Year For the Year For the Period
July 31, 2016 Ended Ended Ended Ended
(Unaudited) January 31, 2016 January 31, 2015 January 31, 2014 January 31, 2013 (1)
Net asset value, beginning of period 16.40$ 24.30$ 25.70$ 26.79$ 25.00$
Activity from investment operations:
Net investment income (2) 0.65 1.53 1.52 1.51 1.02
Net realized and unrealized
gain (loss) on investments and foreign currency 2.82 (7.71) (1.03) (1.00) 1.85
Total from investment operations 3.47 (6.18) 0.49 0.51 2.87
Less distributions from:
Net investment income (0.74) (1.25) (1.43) (1.23) (1.00)
Net realized gains - - - - (0.08)
Return of capital - (0.47) (0.46) (0.37) -
Total distributions (0.74) (1.72) (1.89) (1.60) (1.08)
Net asset value, end of period 19.13$ 16.40$ 24.30$ 25.70$ (8) 26.79$ (8)
Total return (6)(8) 21.71% (4) (26.97)% 1.57% 1.94% 11.87% (4)(7)
Net assets, at end of period (000s) 101,880$ 87,310$ 160,359$ 94,447$ 34,158$
Ratio of gross expenses to average
net assets 0.75% (3) 0.75% 0.75% 0.75% 0.90% (3)
Ratio of net expenses to average
net assets 0.75% (3) 0.75% 0.75% 0.75% 0.75% (3)
Ratio of net investment income
to average net assets 7.41% (3) 6.97% 5.73% 5.78% 5.42% (3)
Portfolio Turnover Rate (5) 45% (4) 90% 87% 61% 46% (4)
(1) The Arrow Dow Jones Global Yield ETF shares commenced operations on May 2, 2012.
(2) Per share amounts calculated using the average shares method, which more appropriately presents the per share data for each period.
(3) Annualized.
(4) Not Annualized.
(5) Portfolio turnover rate excludes portfolio securities received or delivered as a result of processing capital share transactions
in Creation Units. (Note 5)
(6)
(7)
(8)
FINANCIAL HIGHLIGHTS
Arrow Dow Jones Global Yield ETF
Total return is calculated assuming a purchase of shares at net asset value on the first day and a sale at net asset value on the last day of the period.
Represents total return based on net asset values per share from commencement of investment operations on May 2, 2012 through January 31, 2013. Total return based on net asset values per share from
commencement of trading on the NYSE Arca on May 8, 2012 to January 31, 2013 was 14.05%.
Includes adjustments in accordance with accounting principles generally accepted in the United States of America and, consequently, the net asset value for financial reporting purposes and the returns based
upon those net asset values may differ from the net asset values and returns for shareholder transactions.
Per Share Data and Ratios for a Share of Beneficial Interest Outstanding Throughout each Period
11See accompanying notes to financial statements.
ARROW DOW JONES GLOBAL YIELD ETF NOTES TO FINANCIAL STATEMENTS (Unaudited)
July 31, 2016
1. ORGANIZATION
The Arrow Dow Jones Global Yield ETF (the “Fund”) is a diversified series of shares of beneficial interest of Arrow ETF Trust, (formerly Northern Lights ETF Trust) (the “Trust”), a statutory trust organized under the laws of the State of Delaware on August 29, 2011, and is registered under the Investment Company Act of 1940, as amended (the "1940 Act"), as an open-end management investment company. The Fund’s investment objective is to seek investment results that generally correspond (before fees and expenses) to the price and yield performance of the Dow Jones Global Yield Index (the “Index”). The investment objective is non-fundamental. The Fund commenced operation on May 2, 2012. 2. SIGNIFICANT ACCOUNTING POLICIES The following is a summary of significant accounting policies followed by the Fund in preparation of its financial statements. These policies are in conformity with accounting principles generally accepted in the United States of America (“GAAP”). The preparation of financial statements requires management to make estimates and assumptions that affect the reported amounts of assets and liabilities and disclosure of contingent assets and liabilities at the date of the financial statements and the reported amounts of income and expenses for the period. Actual results could differ from those estimates. The Fund follows the specialized accounting and reporting requirements under GAAP that are applicable to investment companies. Securities valuation – Securities listed on an exchange are valued at the last reported sale price at the close of the regular trading session of the exchange on the business day the value is being determined, or in the case of securities listed on NASDAQ at the NASDAQ Official Closing Price (“NOCP”). In the absence of a sale such securities shall be valued at the last bid price on the day of valuation. Debt securities (other than short-term obligations) are valued each day by an independent pricing service approved by the Trust’s Board of Trustees (the “Board”) using methods which include current market quotations from a major market maker in the securities and based on methods which include the consideration of yields or prices of securities of comparable quality, coupon, maturity and type. Investments valued in currencies other than the U.S. dollar are converted to U.S. dollars using exchange rates obtained from pricing services. If market quotations are not readily available or if the Advisor believes the market quotations are not reflective of market value, securities will be valued at their fair value as determined in good faith by the Trust’s Fair Value Committee and in accordance with the Trust’s Portfolio Securities Valuation Procedures (the “Procedures”). The Board will review the fair value method in use for securities requiring a fair value determination at least quarterly. The Procedures consider, among others, the following factors to determine a security’s fair value: the nature and pricing history (if any) of the security; whether any dealer quotations for the security are available; and possible valuation methodologies that could be used to determine the fair value of the security. Fair value may also be used by the Board if extraordinary events occur after the close of the relevant world market but prior to the NYSE close. Short-term debt obligations having 60 days or less remaining until maturity, at time of purchase, may be valued at amortized cost.
12

ARROW DOW JONES GLOBAL YIELD ETF NOTES TO FINANCIAL STATEMENTS (Unaudited)(Continued)
July 31, 2016
The Fund utilizes various methods to measure the fair value of all of its investments on a recurring basis. GAAP establishes a hierarchy that prioritizes inputs to valuation methods. The three levels of input are: Level 1 – Unadjusted quoted prices in active markets for identical assets and liabilities that the Fund has the ability to access. Level 2 – Observable inputs other than quoted prices included in Level 1 that are observable for the asset or liability, either directly or indirectly. These inputs may include quoted prices for the identical instrument in an inactive market, prices for similar instruments, interest rates, prepayment speeds, credit risk, yield curves, default rates and similar data. Level 3 – Unobservable inputs for the asset or liability, to the extent relevant observable inputs are not available, representing the Fund’s own assumptions about the assumptions a market participant would use in valuing the asset or liability, and would be based on the best information available. The availability of observable inputs can vary from security to security and is affected by a wide variety of factors, including, for example, the type of security, whether the security is new and not yet established in the marketplace, the liquidity of markets, and other characteristics particular to the security. To the extent that valuation is based on models or inputs that are less observable or unobservable in the market, the determination of fair value requires more judgment. Accordingly, the degree of judgment exercised in determining fair value is greatest for instruments categorized in Level 3. The inputs used to measure fair value may fall into different levels of the fair value hierarchy. In such cases, for disclosure purposes, the level in the fair value hierarchy within which the fair value measurement falls in its entirety, is determined based on the lowest level input that is significant to the fair value measurement in its entirety. The inputs or methodology used for valuing securities are not necessarily an indication of the risk associated with investing in those securities. The following tables summarize the inputs used as of July 31, 2016 for the Fund’s assets measured at fair value: Arrow Dow Jones Global Yield ETF
Assets * Level 1 Level 2 Level 3 Total
Common Stocks 42,456,654$ -$ -$ 42,456,654$
Master Limited Partnerships 18,699,044 - - 18,699,044
Bonds & Notes - 39,378,554 - 39,378,554
Total 61,155,698$ 39,378,554$ -$ 100,534,252$ There were no transfers into or out of Level 1 and Level 2 during the current period presented. It is the Fund’s policy to record transfers into or out of Level 1 and Level 2 at the end of the reporting period. The Fund did not hold any Level 3 securities during the period.
* See Portfolio of Investments for industry classification.
13
ARROW DOW JONES GLOBAL YIELD ETF NOTES TO FINANCIAL STATEMENTS (Unaudited)(Continued)
July 31, 2016
Security transactions and related income – Security transactions are accounted for on trade date. Interest income is recognized on an accrual basis. Discounts are accreted and premiums are amortized on securities purchased over the lives of the respective securities. Dividend income is recorded on the ex-dividend date. Realized gains or losses from sales of securities are determined by comparing the identified cost of the security lot sold with the net sales proceeds. Dividends and distributions to shareholders – Dividends from net investment income, if any, are declared and paid monthly. Distributable net realized capital gains, if any, are declared and distributed annually. Dividends from net investment income and distributions from net realized gains are determined in accordance with federal income tax regulations, which may differ from GAAP. These “book/tax” differences are considered either temporary (e.g., deferred losses) or permanent in nature. To the extent these differences are permanent in nature, such amounts are reclassified within the composition of net assets based on their federal tax-basis treatment; temporary differences do not require reclassification. Monthly distributions in excess of ordinary taxable income are treated as returns of capital. Dividends and distributions to shareholders are recorded on ex-dividend date. Federal Income Taxes – The Fund intends to continue to comply with the requirements of the Internal Revenue Code applicable to regulated investment companies and to distribute all of its taxable income to its shareholders. Therefore, no provision for federal income tax is required. The Fund recognizes the tax benefits of uncertain tax positions only where the position is “more likely than not” to be sustained assuming examination by tax authorities. Management has analyzed the Fund’s tax positions, and has concluded that no liability for unrecognized tax benefits should be recorded related to uncertain tax positions taken in the Fund’s 2013 – 2015 tax returns or expected to be taken in the Fund’s 2016 tax returns. The Fund identified its major tax jurisdictions as U.S. Federal, Nebraska and foreign jurisdictions where the Fund makes significant investments. The Fund is not aware of any tax positions for which it is reasonably possible that the total amounts of unrecognized tax benefits will change materially in the next twelve months.
Foreign Currency – The accounting records of the Fund are maintained in U.S. dollars. Investment securities and other assets and liabilities denominated in a foreign currency, and income receipts and expense payments are translated into U.S. dollars using the prevailing exchange rate at the London market close. Purchases and sales of securities are translated into U.S. dollars at the contractual currency rates established at the approximate time of the trade. Net realized gains and losses on foreign currency transactions represent net gains and losses from currency realized between the trade and settlement dates on securities transactions, gains and losses on the purchase and sale of foreign currencies and the difference between income accrued versus income received. The effects of changes in foreign currency exchange rates on investments in securities are included with the net realized and unrealized gain or loss on investment securities. Indemnification – The Trust indemnifies its officers and Trustees for certain liabilities that may arise from the performance of their duties to the Trust. Additionally, in the normal course of business, the Fund enters into contracts that contain a variety of representations and warranties and which provide general indemnities. The Fund’s maximum exposure under these arrangements is unknown, as this would involve future claims that may be made against the Fund that have not yet occurred. However,
14

ARROW DOW JONES GLOBAL YIELD ETF NOTES TO FINANCIAL STATEMENTS (Unaudited)(Continued)
July 31, 2016
based on experience, the risk of loss due to these warranties and indemnities appears to be remote.
3. INVESTMENT TRANSACTIONS For the six months ended July 31, 2016, cost of purchases and proceeds from sales of portfolio securities (excluding in-kind transactions and short-term investments), amounted to $43,543,791 and $42,122,693, respectively. For the six months ended July 31, 2016, cost of purchases and proceeds from sales of portfolio securities for in-kind transactions, amounted to $0 and $1,460,470, respectively. 4. INVESTMENT ADVISORY AGREEMENT / TRANSACTIONS WITH RELATED PARTIES The business activities of the Fund are overseen by the Board, which is responsible for the overall management of the Fund. Arrow Investment Advisors, LLC serves as the Fund’s Investment Adviser (the “Adviser”) pursuant to an Investment Advisory Agreement with the Trust (the “Advisory Agreement”). The Trust has entered into a Global Custody Agreement with Brown Brothers Harriman & Co. to serve as Custodian and to act as transfer and shareholder services agent. The Trust has also entered into an Underwriting Agreement with Northern Lights Distributors, LLC to serve as the principal underwriter and distributor for the Trust. Pursuant to the Advisory Agreement, the Adviser, under the oversight of the Board, directs the daily operations of the Fund and supervises the performance of administrative and professional services provided by others. As compensation for its services and the related expenses borne by the Adviser, the Fund pays the Adviser a unitary management fee, computed and accrued daily and paid monthly, at an annual rate of 0.75% of the Fund’s average daily net assets. The Adviser’s unitary management fee is designed to pay the Fund’s expenses and to compensate the Adviser for providing service for the Fund. Out of the unitary management fee, the Adviser pays substantially all expenses of the Fund, including the costs of transfer agency, custody, fund administration, legal, audit and other services, acquired fund fees and expenses, and Independent Trustees’ fees, except for payments under each Fund’s 12b-1 plan, brokerage expenses, taxes, interest (including borrowing costs and dividend expenses on securities sold short), litigation expense and other extraordinary expenses (including litigation to which the Trust or the Fund may be a party and indemnification of the Trustees and officers with respect thereto). The Adviser, and not the Fund’s shareholders, would benefit from any reduction in fees paid for third-party services, including reductions based on increases in net assets. The Trust, with respect to the Fund, has adopted a distribution and service plan (“Plan”) pursuant to Rule 12b-1 under the 1940 Act. Under the Plan, the Fund is authorized to pay distribution fees to the distributor and other firms that provide distribution and shareholder services (“Service Providers”). If a Service Provider provides these services, the Fund may pay fees at an annual rate not to exceed 0.25% of average daily net assets, pursuant to Rule 12b-1 under the 1940 Act. No distribution or service fees are currently paid by the Fund and there are no current plans to
15
ARROW DOW JONES GLOBAL YIELD ETF NOTES TO FINANCIAL STATEMENTS (Unaudited)(Continued)
July 31, 2016
impose these fees. In the event Rule 12b-1 fees were charged, over time they would increase the cost of an investment in the Fund. 5. CAPITAL SHARE TRANSACTIONS Shares are not individually redeemable and may be redeemed by the Fund at NAV only in large blocks known as “Creation Units.” Shares are created and redeemed by the Fund only in Creation Unit size aggregations of 75,000 shares. Only Authorized Participants are permitted to purchase or redeem Creation Units from the Fund. An Authorized Participant is either (i) a broker-dealer or other participant in the clearing process through the Continuous Net Settlement System of the National Securities Clearing Corporation or (ii) a DTC participant and, in each case, must have executed a Participant Agreement with the Distributor. Such transactions are generally permitted on an in-kind basis, with a balancing cash component to equate the transaction to the NAV per share of the Fund on the transaction date. Cash may be substituted equivalent to the value of certain securities generally when they are not available in sufficient quantity for delivery, not eligible for trading by the Authorized Participant or as a result of other market circumstances. In addition, the Fund may impose transaction fees on purchases and redemptions of Fund shares to cover the custodial and other costs incurred by the Fund in effecting trades. A fixed fee payable to the Custodian may be imposed on each creation and redemption transaction regardless of the number of Creation Units involved in the transaction (“Fixed Fee”). Purchases and redemptions of Creation Units for cash or involving cash-in-lieu are required to pay an additional variable charge to compensate the Fund and its ongoing shareholders for brokerage and market impact expenses relating to Creation Unit transactions (“Variable Charge,” and together with the Fixed Fee, the “Transaction Fees”). Transactions in capital shares for the Fund are disclosed in the Statements of Changes in Net Assets. The Transaction Fees for the Fund are listed in the table below:
Fixed Fee Variable Charge Fund $3,170 2.00%*
* The maximum Transaction Fee may be up to 2.00% of the amount invested.
6. DISTRIBUTIONS TO SHAREHOLDERS AND TAX COMPONENTS OF CAPITAL
The tax character of distributions paid during the following years was as follows:
Fiscal Year Ended Fiscal Year Ended
January 31, 2016 January 31, 2015
Ordinary Income 10,722,166$ 7,777,222$
Long-Term Capital Gain - 148,174
Return of Capital 3,319,252 2,891,072
14,041,418$ 10,816,468$
16

ARROW DOW JONES GLOBAL YIELD ETF NOTES TO FINANCIAL STATEMENTS (Unaudited)(Continued)
July 31, 2016
As of January 31, 2016, the components of accumulated earnings/(deficit) on a tax basis were as follows:
The difference between book basis and tax basis unrealized depreciation, accumulated net investment income (loss) and accumulated net realized loss from investments and foreign currency transactions is primarily attributable to the tax deferral of losses on wash sales, mark-to-market on passive foreign investment companies, and tax adjustments for real estate investment trusts, partnerships and C-Corporation return of capital distributions. Capital losses incurred after October 31 within the fiscal year are deemed to arise on the first business day of the following fiscal year for tax purposes. The Fund incurred and elected to defer such capital losses of $22,800,662. At January 31, 2016, the Fund had capital loss carry forwards for federal income tax purposes available to offset future capital gains as follows:
Permanent book and tax differences, primarily attributable to the book/ tax basis treatment of foreign currency gains and tax adjustments for passive foreign investment companies, real estate investment trusts, royalty trusts, partnerships, realized gain (loss) on in-kind redemptions, and C-Corporation return of capital distributions, resulted in reclassification for the year ended January 31, 2016 as follows:
7. NEW ACCOUNTING PRONOUNCEMENT
In May 2015, the Financial Accounting Standards Board (“FASB”) issued Accounting Standards Update (“ASU”) 2015-07, “Disclosures for Investments in Certain Entities That Calculate Net Asset Value per Share (or Its Equivalent)”, modifying ASC 946 “Financial Services – Investment Companies”. Under the modifications, investments in affiliated and private investment funds valued at Net Asset Value are no longer included in the fair value hierarchy disclosed in Footnote 2. ASU 2015-07 is effective for fiscal
Undistributed Undistributed Capital Loss Other Post October Loss Unrealized Total
Ordinary Long-Term Carry Book/Tax and Appreciation/ Accumulated
Income Gains Forwards Differences Late Year Loss (Depreciation) Earnings/(Deficits)
-$ -$ (16,515,970)$ -$ (22,800,662)$ (38,487,315)$ (77,803,947)$
Non-Expiring
Short-Term
Non-Expiring
Long-Term Total
6,423,610$ 10,092,360$ 16,515,970$
Paid Undistributed AccumulatedIn Net Investment Net Realized Loss From Investments
Capital Income And Foreign Currency Transactions(3,011,331)$ (1,946,757)$ 4,958,088$
17

ARROW DOW JONES GLOBAL YIELD ETF NOTES TO FINANCIAL STATEMENTS (Unaudited)(Continued)
July 31, 2016
years beginning on or after December 15, 2015, and interim periods within those annual periods. Early application is permitted. Management is currently evaluating the implications of ASU 2015-07 and its impact on financial statement disclosures. 8. SUBSEQUENT EVENTS The Fund is required to recognize in the financial statements the effects of all subsequent events that provide additional evidence about conditions that existed at the date of the Statement of Assets and Liabilities. For non-recognized subsequent events that must be disclosed to keep the financial statement from being misleading, the Fund is required to disclose the nature of the event as well as an estimate of its financial effect, or a statement that such an estimate cannot be made. Subsequent events after the date of the Statement of Assets and Liabilities have been evaluated through the date the financial statements were issued. Distributions: The Fund’s Board of Trustees declared the following distributions after July 31, 2016:
Management has determined that there were no other subsequent events to report through the issuance of these financial statements.
Fund Distribution Per Share Record Date Payable DateArrow Dow Jones Global Yield ETF $0.1340 8/18/2016 8/23/2016
Arrow Dow Jones Global Yield ETF $0.1095 9/20/2016 9/26/2016
18

Arrow Dow Jones Global Yield ETF EXPENSE EXAMPLES (Unaudited)
July 31, 2016
As a shareholder of the Fund, you incur two types of costs: (1) transaction costs, including brokerage commissions on purchases and sales of Fund shares; (2) ongoing costs, including a unitary management fee and other Fund expenses. This example is intended to help you understand your ongoing costs (in dollars) of investing in the Fund and to compare these costs with the ongoing costs of investing in other mutual funds.
The example is based on an investment of $1,000 invested at the beginning of the period and held for the entire period from February 1, 2016 through July 31, 2016.
Actual Expenses
The “Actual” expenses line in the table below provides information about actual account values and actual expenses. You may use the information below, together with the amount you invested, to estimate the expenses that you paid over the period. Simply divide your account value by $1,000 (for example, an $8,600 account value divided by $1,000 = 8.6), then multiply the result by the number in the table under the heading entitled “Expenses Paid During Period” to estimate the expenses you paid on your account during this period.
Hypothetical Example for Comparison Purposes
The “Hypothetical” line in the table below provides information about hypothetical account values and hypothetical expenses based on the Fund’s actual expense ratio and an assumed rate of return of 5% per year before expenses, which is not the Fund’s actual return. The hypothetical account values and expenses may not be used to estimate the actual ending account balances or expenses you paid for the period. You may use this information to compare this 5% hypothetical example with the 5% hypothetical examples that appear in the shareholder reports of other funds. Please note that the expenses shown in the table are meant to highlight your ongoing costs only and do not reflect any transactional costs, such as brokerage commissions paid on purchases and sales of Fund shares. Therefore, the table is useful in comparing ongoing costs only, and will not help you determine the relative total costs of owning different funds. In addition, if these transactional costs were included, your costs would have been higher.
Beginning
Account Value
Ending
Account Value
Expenses Paid
During Period*
Expenses Ratio
During Period**
2/1/16 7/31/16 2/1/16– 7/31/16 2/1/16 – 7/31/16
Actual $ 1,000.00 $ 1,217.10 $ 4.13 0.75%
Hypothetical
(5% return before expenses) $ 1,000.00 $ 1,021.13 $ 3.77 0.75% *Expenses are equal to the average account value over the period, multiplied by the Fund’s annualized expense ratio, multiplied by the number of days in the period (182) divided by the number of days in the fiscal year (366). ** Annualized.
19

PRIVACY NOTICE
FACTS WHAT DOES ARROW ETF TRUST DO WITH YOUR PERSONAL INFORMATION?
Why? Financial companies choose how they share your personal information. Federal law gives consumers the right to limit some but not all sharing. Federal law also requires us to tell you how we collect, share, and protect your personal information. Please read this notice carefully to understand what we do.
What? The types of personal information we collect and share depend on the product or service you have with us. This information can include: Social Security number Purchase History Assets Account Balances Retirement Assets Account Transactions Transaction History Wire Transfer Instructions Checking Account Information
When you are no longer our customer, we continue to share your information as described in this notice.
How? All financial companies need to share customers’ personal information to run their everyday
business. In the section below, we list the reasons financial companies can share their customers’ personal information; the reasons Arrow ETF Trust chooses to share; and whether you can limit this sharing.
Reasons we can share your personal information Does Arrow ETF
Trust share? Can you limit this sharing?
For our everyday business purposes – such as to process your transactions, maintain your account(s), respond to court orders and legal investigations, or report to credit bureaus
Yes No
For our marketing purposes – to offer our products and services to you No We don’t share
For joint marketing with other financial companies No We don’t share
For our affiliates’ everyday business purposes – information about your transactions and experiences No We don’t share
For our affiliates’ everyday business purposes – information about your creditworthiness No We don’t share
For nonaffiliates to market to you No We don’t share
Questions? Call 1-877-277-6933 Who we are
20
Who is providing this notice?
Arrow ETF Trust
What we do
How does Arrow ETF Trust protect my personal information?
To protect your personal information from unauthorized access and use, we use security measures that comply with federal law. These measures include computer safeguards and secured files and buildings. Our service providers are held accountable for adhering to strict policies and procedures to prevent any misuse of your nonpublic personal information.
How does Arrow ETF Trust collect my personal information?
We collect your personal information, for example, when you Open an account Provide account information Give us your contact information Make deposits or withdrawals from your account Make a wire transfer Tell us where to send the money Tells us who receives the money Show your government-issued ID Show your driver’s license We also collect your personal information from other companies.
Why can’t I limit all sharing?
Federal law gives you the right to limit only ▪ Sharing for affiliates’ everyday business purposes – information about your
creditworthiness ▪ Affiliates from using your information to market to you ▪ Sharing for nonaffiliates to market to you
State laws and individual companies may give you additional rights to limit sharing.
Definitions
Affiliates Companies related by common ownership or control. They can be financial and nonfinancial companies. Arrow ETF Trust does not share with our affiliates.
Nonaffiliates Companies not related by common ownership or control. They can be financial and nonfinancial companies Arrow ETF Trust does not share with nonaffiliates so they can market to
you.
Joint marketing A formal agreement between nonaffiliated financial companies that together market financial products or services to you. Arrow ETF Trust does not jointly market.
21

PROXY VOTING POLICY Information regarding how the Fund voted proxies relating to portfolio securities for the most recent twelve-month period ended June 30 as well as a description of the policies and procedures that the Fund uses to determine how to vote proxies is available without charge, upon request, by calling 1-877-277-6933 or by referring to the Securities and Exchange Commission’s (“SEC”) website at http://www.sec.gov. PORTFOLIO HOLDINGS The Fund files its complete schedules of portfolio holdings with the SEC for the first and third quarters of each fiscal year on Form N-Q. Form N-Q is available on the SEC’s website at http://www.sec.gov and may be reviewed and copied at the SEC’s Public Reference Room in Washington, DC (1-800-SEC-0330). The information on Form N-Q is available without charge, upon request, by calling 1-877-277-6933.
INVESTMENT ADVISOR Arrow Investment Advisors, LLC 6100 Chevy Chase Drive Suite 100 Laurel, MD 20707 ADMINISTRATOR Gemini Fund Services, LLC 80 Arkay Drive, Suite 110 Hauppauge, NY 11788