2018 ANNUAL REPORT - BlackRock · iShares Dow Jones U.S. ETF ... leading to fears of a broader...
88
APRIL 30, 2018 2018 ANNUAL REPORT iShares Trust iShares Dow Jones U.S. ETF | IYY | NYSE Arca iShares Transportation Average ETF | IYT | Cboe BZX iShares U.S. Energy ETF | IYE | NYSE Arca iShares U.S. Healthcare ETF | IYH | NYSE Arca iShares U.S. Technology ETF | IYW | NYSE Arca iShares U.S. Utilities ETF | IDU | NYSE Arca
Transcript of 2018 ANNUAL REPORT - BlackRock · iShares Dow Jones U.S. ETF ... leading to fears of a broader...

APRIL 30, 2018
2018 ANNUAL REPORT
iShares Trust
� iShares Dow Jones U.S. ETF | IYY | NYSE Arca
� iShares Transportation Average ETF | IYT | Cboe BZX
� iShares U.S. Energy ETF | IYE | NYSE Arca
� iShares U.S. Healthcare ETF | IYH | NYSE Arca
� iShares U.S. Technology ETF | IYW | NYSE Arca
� iShares U.S. Utilities ETF | IDU | NYSE Arca


Table of Contents
Management’s Discussions of Fund Performance . . . . . . . . . . . . . . . . . . . . . . . . . . . . . . . . . . . . . . . . . . . . . . . . . . . . . . . . . . . . . . . . . 5
About Fund Performance . . . . . . . . . . . . . . . . . . . . . . . . . . . . . . . . . . . . . . . . . . . . . . . . . . . . . . . . . . . . . . . . . . . . . . . . . . . . . . . . . . . . 18
Shareholder Expenses . . . . . . . . . . . . . . . . . . . . . . . . . . . . . . . . . . . . . . . . . . . . . . . . . . . . . . . . . . . . . . . . . . . . . . . . . . . . . . . . . . . . . . 18
Schedules of Investments . . . . . . . . . . . . . . . . . . . . . . . . . . . . . . . . . . . . . . . . . . . . . . . . . . . . . . . . . . . . . . . . . . . . . . . . . . . . . . . . . . . . 19
iShares Dow Jones U.S. ETF . . . . . . . . . . . . . . . . . . . . . . . . . . . . . . . . . . . . . . . . . . . . . . . . . . . . . . . . . . . . . . . . . . . . . . . . . . . . . . . 19
iShares Transportation Average ETF . . . . . . . . . . . . . . . . . . . . . . . . . . . . . . . . . . . . . . . . . . . . . . . . . . . . . . . . . . . . . . . . . . . . . . . . . 36
iShares U.S. Energy ETF . . . . . . . . . . . . . . . . . . . . . . . . . . . . . . . . . . . . . . . . . . . . . . . . . . . . . . . . . . . . . . . . . . . . . . . . . . . . . . . . . . 38
iShares U.S. Healthcare ETF . . . . . . . . . . . . . . . . . . . . . . . . . . . . . . . . . . . . . . . . . . . . . . . . . . . . . . . . . . . . . . . . . . . . . . . . . . . . . . . 40
iShares U.S. Technology ETF . . . . . . . . . . . . . . . . . . . . . . . . . . . . . . . . . . . . . . . . . . . . . . . . . . . . . . . . . . . . . . . . . . . . . . . . . . . . . . . 43
iShares U.S. Utilities ETF . . . . . . . . . . . . . . . . . . . . . . . . . . . . . . . . . . . . . . . . . . . . . . . . . . . . . . . . . . . . . . . . . . . . . . . . . . . . . . . . . . 47
Financial Statements . . . . . . . . . . . . . . . . . . . . . . . . . . . . . . . . . . . . . . . . . . . . . . . . . . . . . . . . . . . . . . . . . . . . . . . . . . . . . . . . . . . . . . . . 49
Financial Highlights . . . . . . . . . . . . . . . . . . . . . . . . . . . . . . . . . . . . . . . . . . . . . . . . . . . . . . . . . . . . . . . . . . . . . . . . . . . . . . . . . . . . . . . . . 56
Notes to Financial Statements . . . . . . . . . . . . . . . . . . . . . . . . . . . . . . . . . . . . . . . . . . . . . . . . . . . . . . . . . . . . . . . . . . . . . . . . . . . . . . . . 62
Report of Independent Registered Public Accounting Firm . . . . . . . . . . . . . . . . . . . . . . . . . . . . . . . . . . . . . . . . . . . . . . . . . . . . . . . . . . 74
Tax Information . . . . . . . . . . . . . . . . . . . . . . . . . . . . . . . . . . . . . . . . . . . . . . . . . . . . . . . . . . . . . . . . . . . . . . . . . . . . . . . . . . . . . . . . . . . . 75
Supplemental Information . . . . . . . . . . . . . . . . . . . . . . . . . . . . . . . . . . . . . . . . . . . . . . . . . . . . . . . . . . . . . . . . . . . . . . . . . . . . . . . . . . . . 76
Trustee and Officer Information . . . . . . . . . . . . . . . . . . . . . . . . . . . . . . . . . . . . . . . . . . . . . . . . . . . . . . . . . . . . . . . . . . . . . . . . . . . . . . . 79
General Information . . . . . . . . . . . . . . . . . . . . . . . . . . . . . . . . . . . . . . . . . . . . . . . . . . . . . . . . . . . . . . . . . . . . . . . . . . . . . . . . . . . . . . . . . 83

THIS PAGE INTENTIONALLY LEFT BLANK.

Management’s Discussion of Fund PerformanceiSHARES® TRUST
U.S. EQUITY MARKET OVERVIEW
U.S. stocks advanced for the 12 months ended April 30, 2018 (“reporting period”). The Russell 3000® Index, a broad measure of
U.S. equity market performance, returned 13.05% for the reporting period.
An improving U.S. economy was one contributing factor to the positive performance of U.S. stocks during the reporting period.
The final nine months of 2017 featured the strongest three consecutive quarters of U.S. economic growth in more than 12 years.
Key economic drivers included a meaningful increase in manufacturing activity and the lowest unemployment rate since
December 2000. The healthy job market contributed to a recovery in wages.
Another beneficial factor for the U.S. equity market during the reporting period was U.S. income tax reform legislation. Passed in
December 2017, the tax reform legislation included a steep reduction in corporate tax rates, which translated directly into higher
corporate profits, and a modest decrease in individual tax rates. In addition, tax reform incentivized companies to repatriate cash
held outside of the U.S., raising expectations for capital spending, acquisitions, dividends, and stock repurchases by U.S.
companies. However, the tax changes also led to concerns about reduced government tax revenues and higher federal budget
deficits.
The stronger economy and tax code changes contributed to record corporate profit growth across virtually all sectors of the U.S.
stock market. Deregulation in selected segments of the economy and a recovery in commodities prices also benefited corporate
earnings. In addition, there was a significant international element to increases in corporate profits, as the sectors that posted the
largest gains in profitability (energy, materials, and information technology) were also those with the largest exposure to improving
global economic activity.
After rising steadily for much of the reporting period, reaching record highs in January 2018, stocks declined during the last three
months as market volatility increased markedly, largely related to expectations of higher interest rates and inflation. Increases in
interest rates lead to higher borrowing costs for companies, consumers, and the U.S. government, which can have a negative
impact on economic growth, corporate profits, and stock prices. Higher inflation prompted the U.S. Federal Reserve Bank (“Fed”)
to increase the short-term interest rate target to its highest level in a decade, leading to a four-year high for U.S. Treasury bond
yields. The Fed also began to reduce its balance sheet in October 2017. The interest rate increases and balance sheet reduction
were part of the Fed’s plan to gradually reverse the unprecedented economic stimulus measures, implemented in response to the
2008 credit crisis, and re-establish more normal monetary policy conditions.
Geopolitical issues also weighed on the U.S. equity market late in the reporting period. In addition to ongoing geopolitical turmoil
in North Korea and the Middle East, the U.S. government announced plans to implement tariffs on steel, aluminum, and some
Chinese products, leading to fears of a broader trade war and corresponding economic disruption.
For the reporting period, large-capitalization stocks outperformed mid- and small-capitalization equities, while growth-oriented
stocks outperformed value-oriented equities across all market capitalizations. Consequently, large-capitalization growth stocks
were the best-performing segment of the market, largely due to the significant outperformance of information technology
companies, which benefited from strengthening international demand and an ongoing shift toward e-commerce, digital
advertising, cloud computing, mobile devices, and streaming services. In contrast, the underperforming value-oriented stocks
tended to be those with less international business and little or no exposure to these technological trends.
M A N A G E M E N T ’ S D I S C U S S I O N S O F F U N D P E R F O R M A N C E 5

Management’s Discussion of Fund PerformanceiSHARES® DOW JONES U.S. ETFPerformance as of April 30, 2018
Average Annual Total Returns Cumulative Total Returns
NAV MARKET INDEX NAV MARKET INDEX
1 Year 12.81% 12.79% 13.06% 12.81% 12.79% 13.06%
5 Years 12.49% 12.50% 12.71% 80.15% 80.20% 81.86%
10 Years 8.97% 8.97% 9.16% 136.04% 136.15% 140.28%
GROWTH OF $10 ,000 INVESTMENT
(AT NET ASSET VALUE)
$24,028$23,604
$4,000
$10,000
$16,000
$22,000
$28,000
IndexFund
Apr 18Apr 13 Apr 14 Apr 15 Apr 16 Apr 17Apr 12Apr 11Apr 10Apr 09
Past performance is no guarantee of future results. Performance results do not reflect the deduction of taxes that a shareholder would pay on fund distributions or on
the redemption or sale of fund shares. See “About Fund Performance” on page 18 for more information.
Shareholder Expenses
Actual Hypothetical 5% Return
BeginningAccount Value
(11/1/17)
EndingAccount Value
(4/30/18)
Expenses PaidDuringPeriod a
BeginningAccount Value
(11/1/17)
EndingAccount Value
(4/30/18)Expenses Paid
During Period aAnnualized
Expense Ratio
$ 1,000.00 $ 1,036.90 $ 1.01 $ 1,000.00 $ 1,023.80 $ 1.00 0.20%
a Expenses are calculated using the Fund’s annualized expense ratio (as disclosed in the table), multiplied by the average account value for the period, multipliedby the number of days in the period (181 days) and divided by the number of days in the year (365 days). See “Shareholder Expenses” on page 18 for moreinformation.
6 2 0 1 8 i S H A R E S A N N U A L R E P O R T T O S H A R E H O L D E R S
Management’s Discussion of Fund Performance (Continued)
iSHARES® DOW JONES U.S. ETF
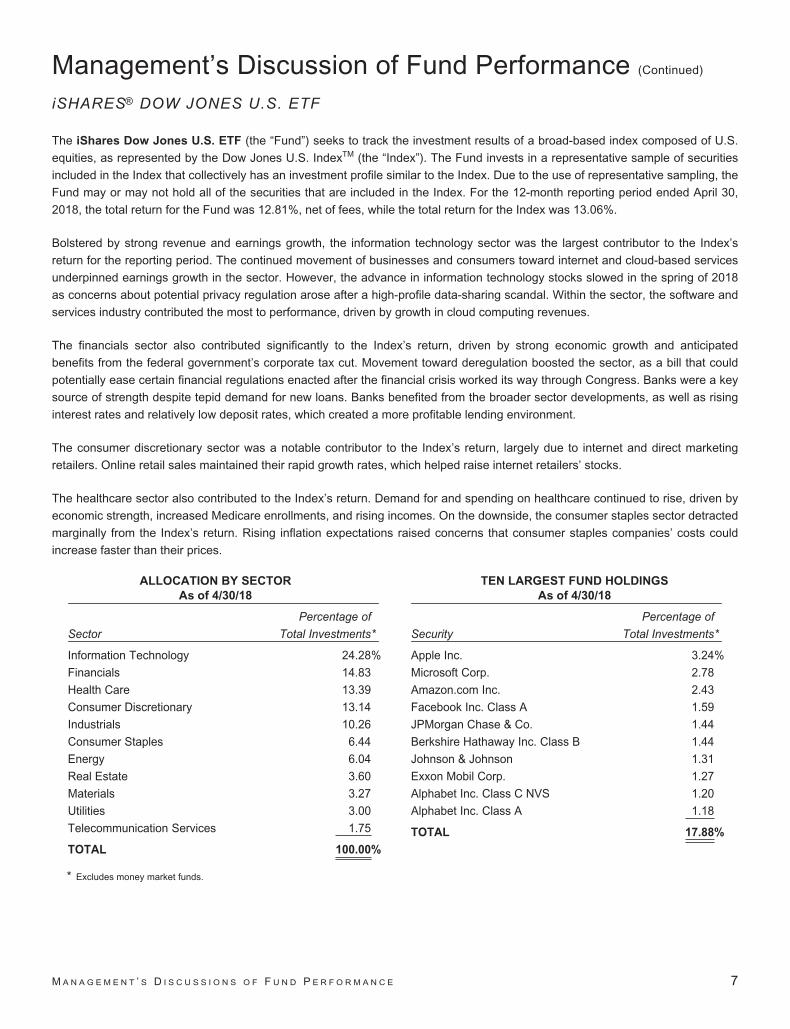
The iShares Dow Jones U.S. ETF (the “Fund”) seeks to track the investment results of a broad-based index composed of U.S.
equities, as represented by the Dow Jones U.S. IndexTM (the “Index”). The Fund invests in a representative sample of securities
included in the Index that collectively has an investment profile similar to the Index. Due to the use of representative sampling, the
Fund may or may not hold all of the securities that are included in the Index. For the 12-month reporting period ended April 30,
2018, the total return for the Fund was 12.81%, net of fees, while the total return for the Index was 13.06%.
Bolstered by strong revenue and earnings growth, the information technology sector was the largest contributor to the Index’s
return for the reporting period. The continued movement of businesses and consumers toward internet and cloud-based services
underpinned earnings growth in the sector. However, the advance in information technology stocks slowed in the spring of 2018
as concerns about potential privacy regulation arose after a high-profile data-sharing scandal. Within the sector, the software and
services industry contributed the most to performance, driven by growth in cloud computing revenues.
The financials sector also contributed significantly to the Index’s return, driven by strong economic growth and anticipated
benefits from the federal government’s corporate tax cut. Movement toward deregulation boosted the sector, as a bill that could
potentially ease certain financial regulations enacted after the financial crisis worked its way through Congress. Banks were a key
source of strength despite tepid demand for new loans. Banks benefited from the broader sector developments, as well as rising
interest rates and relatively low deposit rates, which created a more profitable lending environment.
The consumer discretionary sector was a notable contributor to the Index’s return, largely due to internet and direct marketing
retailers. Online retail sales maintained their rapid growth rates, which helped raise internet retailers’ stocks.
The healthcare sector also contributed to the Index’s return. Demand for and spending on healthcare continued to rise, driven by
economic strength, increased Medicare enrollments, and rising incomes. On the downside, the consumer staples sector detracted
marginally from the Index’s return. Rising inflation expectations raised concerns that consumer staples companies’ costs could
increase faster than their prices.
ALLOCATION BY SECTOR
As of 4/30/18
Sector
Percentage of
Total Investments*
Information Technology 24.28%
Financials 14.83
Health Care 13.39
Consumer Discretionary 13.14
Industrials 10.26
Consumer Staples 6.44
Energy 6.04
Real Estate 3.60
Materials 3.27
Utilities 3.00
Telecommunication Services 1.75
TOTAL 100.00%
TEN LARGEST FUND HOLDINGS
As of 4/30/18
Security
Percentage of
Total Investments*
Apple Inc. 3.24%
Microsoft Corp. 2.78
Amazon.com Inc. 2.43
Facebook Inc. Class A 1.59
JPMorgan Chase & Co. 1.44
Berkshire Hathaway Inc. Class B 1.44
Johnson & Johnson 1.31
Exxon Mobil Corp. 1.27
Alphabet Inc. Class C NVS 1.20
Alphabet Inc. Class A 1.18
TOTAL 17.88%
* Excludes money market funds.
M A N A G E M E N T ’ S D I S C U S S I O N S O F F U N D P E R F O R M A N C E 7

Management’s Discussion of Fund PerformanceiSHARES® TRANSPORTATION AVERAGE ETFPerformance as of April 30, 2018
Average Annual Total Returns Cumulative Total Returns
NAV MARKET INDEX NAV MARKET INDEX
1 Year 15.88% 15.86% 16.23% 15.88% 15.86% 16.23%
5 Years 12.42% 12.43% 12.58% 79.59% 79.62% 80.83%
10 Years 8.67% 8.67% 8.98% 129.67% 129.61% 136.40%
GROWTH OF $10 ,000 INVESTMENT
(AT NET ASSET VALUE)
$23,640$22,967
$5,000
$10,000
$15,000
$20,000
$25,000
$30,000
IndexFund
Apr 18Apr 17Apr 16Apr 14 Apr 15Apr 13Apr 12Apr 11Apr 10Apr 09
Past performance is no guarantee of future results. Performance results do not reflect the deduction of taxes that a shareholder would pay on fund distributions or on
the redemption or sale of fund shares. See “About Fund Performance” on page 18 for more information.
Shareholder Expenses
Actual Hypothetical 5% Return
BeginningAccount Value
(11/1/17)
EndingAccount Value
(4/30/18)Expenses Paid
During Period a
BeginningAccount Value
(11/1/17)
EndingAccount Value
(4/30/18)Expenses Paid
During Period aAnnualized
Expense Ratio
$ 1,000.00 $ 1,074.80 $ 2.16 $ 1,000.00 $ 1,022.70 $ 2.11 0.42%
a Expenses are calculated using the Fund’s annualized expense ratio (as disclosed in the table), multiplied by the average account value for the period, multipliedby the number of days in the period (181 days) and divided by the number of days in the year (365 days). See “Shareholder Expenses” on page 18 for moreinformation.
8 2 0 1 8 i S H A R E S A N N U A L R E P O R T T O S H A R E H O L D E R S

Management’s Discussion of Fund Performance (Continued)
iSHARES® TRANSPORTATION AVERAGE ETF
The iShares Transportation Average ETF (the “Fund”) seeks to track the investment results of an index composed of U.S.
equities in the transportation sector, as represented by the Dow Jones Transportation Average IndexTM (the “Index”). The Fund
invests in a representative sample of securities included in the Index that collectively has an investment profile similar to the
Index. Due to the use of representative sampling, the Fund may or may not hold all of the securities that are included in the Index.
For the 12-month reporting period ended April 30, 2018, the total return for the Fund was 15.88%, net of fees, while the total
return for the Index was 16.23%.
The road and rail industry was the largest contributor to the Index’s return, bolstered in part by anticipated benefits from U.S. tax
reform. In particular, the new tax laws allow for higher deductions on capital expenditures, potentially lowering tax bills
significantly, especially for railroads. Within the industry, both railroad and trucking companies were meaningful contributors.
Demand for truck transportation surged in 2017 and remained high through the first quarter of 2018, tightening capacity and
allowing for price increases from trucking companies. The trucking industry also benefited from increased merger and acquisition
activity. For rail companies, a key revenue driver was intermodal operations, which combine more than one form of carrier (for
example, truck, ship, and rail) and are generally slower but cheaper than trucking. Growth in those operations benefited rail
stocks, along with broad improvement in operational efficiency and cost-cutting measures.
The air freight and logistics industry was another notable contributor to the Index’s return. The industry benefited from ongoing
rapid growth in e-commerce shipments, although earnings for some key players were affected by the challenge of matching
capacity to demand, particularly during the busy holiday season. The marine transportation industry also modestly contributed as
some investors anticipated an increase in demand that could help the industry recover from a long-term oversupply of shipping
vessels.
On the downside, airlines detracted from the Index’s performance. Concerns about potential excess capacity, geopolitical
developments, and rising fuel costs adversely affected investor sentiment. Nonetheless, demand for both passenger and freight
segments continued to grow, and load factors (the percentage of seats filled by passengers) reached record highs in early 2018.
ALLOCATION BY SECTOR
As of 4/30/18
Sector
Percentage of
Total Investments*
Road & Rail 44.53%
Air Freight & Logistics 30.39
Airlines 18.54
Marine 6.54
TOTAL 100.00%
TEN LARGEST FUND HOLDINGS
As of 4/30/18
Security
Percentage of
Total Investments*
FedEx Corp. 14.82%
Norfolk Southern Corp. 8.76
Union Pacific Corp. 8.15
JB Hunt Transport Services Inc. 7.24
United Parcel Service Inc. Class B 7.01
CH Robinson Worldwide Inc. 4.78
Landstar System Inc. 4.78
Kirby Corp. 4.69
Kansas City Southern 4.66
United Continental Holdings Inc. 3.95
TOTAL 68.84%
* Excludes money market funds.
M A N A G E M E N T ’ S D I S C U S S I O N S O F F U N D P E R F O R M A N C E 9

Management’s Discussion of Fund PerformanceiSHARES® U.S. ENERGY ETFPerformance as of April 30, 2018
Average Annual Total Returns Cumulative Total Returns
NAV MARKET INDEX NAV MARKET INDEX
1 Year 11.92% 11.95% 12.42% 11.92% 11.95% 12.42%
5 Years 0.39% 0.42% 0.80% 1.98% 2.12% 4.08%
10 Years 0.33% 0.34% 0.78% 3.36% 3.47% 8.11%
GROWTH OF $10 ,000 INVESTMENT
(AT NET ASSET VALUE)
$10,811$10,336
$4,000
$6,000
$8,000
$10,000
$12,000
$14,000
IndexFund
Apr 18Apr 13 Apr 14 Apr 15 Apr 16 Apr 17Apr 12Apr 11Apr 10Apr 09
Past performance is no guarantee of future results. Performance results do not reflect the deduction of taxes that a shareholder would pay on fund distributions or on
the redemption or sale of fund shares. See “About Fund Performance” on page 18 for more information.
Shareholder Expenses
Actual Hypothetical 5% Return
BeginningAccount Value
(11/1/17)
EndingAccount Value
(4/30/18)Expenses Paid
During Period a
BeginningAccount Value
(11/1/17)
EndingAccount Value
(4/30/18)Expenses Paid
During Period aAnnualized
Expense Ratio
$ 1,000.00 $ 1,104.30 $ 2.19 $ 1,000.00 $ 1,022.70 $ 2.11 0.42%
a Expenses are calculated using the Fund’s annualized expense ratio (as disclosed in the table), multiplied by the average account value for the period, multipliedby the number of days in the period (181 days) and divided by the number of days in the year (365 days). See “Shareholder Expenses” on page 18 for moreinformation.
10 2 0 1 8 i S H A R E S A N N U A L R E P O R T T O S H A R E H O L D E R S

Management’s Discussion of Fund Performance (Continued)
iSHARES® U.S. ENERGY ETF
The iShares U.S. Energy ETF (the “Fund”) seeks to track the investment results of an index composed of U.S. equities in the
energy sector, as represented by the Dow Jones U.S. Oil & Gas IndexTM (the “Index”). The Fund invests in a representative
sample of securities included in the Index that collectively has an investment profile similar to the Index. Due to the use of
representative sampling, the Fund may or may not hold all of the securities that are included in the Index. For the 12-month
reporting period ended April 30, 2018, the total return for the Fund was 11.92%, net of fees, while the total return for the Index
was 12.42%.
Prices for oil and related energy products generally rose, with crude oil, gasoline, and heating oil all ending the reporting period
significantly higher. Natural gas prices were volatile before ultimately declining for the reporting period.
Crude oil prices benefited from positive supply-and-demand conditions, with prices reaching a three-year high above $70 per
barrel in early 2018 as OPEC reiterated its intention to limit supply. Output was further limited by economic and political crises in
Libya and Venezuela, where production hit a 28-year low in 2017. U.S. oil production and inventories declined in early 2018; at
the same time global oil demand reached a record high. Solid global economic growth and a weaker U.S. dollar contributed to
strong foreign demand for U.S. oil. Crude oil is priced in U.S. dollars, so a lower U.S. dollar means cheaper U.S. oil for foreign
buyers. In this environment, both realized earnings and analysts’ estimates of future earnings growth improved significantly for
U.S. energy stocks into the first quarter of 2018. Oil and gas refining and marketing and transportation stocks were the leading
contributors to the Index’s performance, with refiners benefiting from the wide spread between the cost of crude oil and the price
at which companies sell the refined output. The Index’s performance was further supported by oil and gas exploration and
production stocks, which are closely tied to oil price fluctuations.
Integrated oil and gas companies also contributed meaningfully to the Index’s performance. Their refining businesses benefited
from rising oil prices, while higher production volumes led to stronger overall earnings.
Oil and gas storage and transportation stocks detracted fractionally from the Index’s return.
ALLOCATION BY SECTOR
As of 4/30/18
Sector
Percentage of
Total Investments*
Oil, Gas & Consumable Fuels 84.85%
Energy Equipment & Services 14.36
Other** 0.79
TOTAL 100.00%
TEN LARGEST FUND HOLDINGS
As of 4/30/18
Security
Percentage of
Total Investments*
Exxon Mobil Corp. 20.95%
Chevron Corp. 15.20
Schlumberger Ltd. 6.03
ConocoPhillips 4.89
EOG Resources Inc. 4.35
Occidental Petroleum Corp. 3.76
Valero Energy Corp. 3.06
Phillips 66 2.97
Halliburton Co. 2.94
Marathon Petroleum Corp. 2.26
TOTAL 66.41%
* Excludes money market funds.** Other includes sectors and/or investment types which individually represent less than 1% of total investments.
M A N A G E M E N T ’ S D I S C U S S I O N S O F F U N D P E R F O R M A N C E 11

Management’s Discussion of Fund PerformanceiSHARES® U.S. HEALTHCARE ETFPerformance as of April 30, 2018
Average Annual Total Returns Cumulative Total Returns
NAV MARKET INDEX NAV MARKET INDEX
1 Year 10.93% 10.98% 11.40% 10.93% 10.98% 11.40%
5 Years 13.32% 13.33% 13.80% 86.86% 86.92% 90.90%
10 Years 12.26% 12.28% 12.73% 217.97% 218.42% 231.43%
GROWTH OF $10 ,000 INVESTMENT
(AT NET ASSET VALUE)
$33,143$31,797
$5,000
$10,000
$15,000
$20,000
$25,000
$30,000
$35,000
$40,000
IndexFund
Apr 18Apr 13 Apr 14 Apr 15 Apr 16 Apr 17Apr 12Apr 11Apr 10Apr 09
Past performance is no guarantee of future results. Performance results do not reflect the deduction of taxes that a shareholder would pay on fund distributions or on
the redemption or sale of fund shares. See “About Fund Performance” on page 18 for more information.
Shareholder Expenses
Actual Hypothetical 5% Return
BeginningAccount Value
(11/1/17)
EndingAccount Value
(4/30/18)Expenses Paid
During Period a
BeginningAccount Value
(11/1/17)
EndingAccount Value
(4/30/18)Expenses Paid
During Period aAnnualized
Expense Ratio
$ 1,000.00 $ 1,024.90 $ 2.11 $ 1,000.00 $ 1,022.70 $ 2.11 0.42%
a Expenses are calculated using the Fund’s annualized expense ratio (as disclosed in the table), multiplied by the average account value for the period, multipliedby the number of days in the period (181 days) and divided by the number of days in the year (365 days). See “Shareholder Expenses” on page 18 for moreinformation.
12 2 0 1 8 i S H A R E S A N N U A L R E P O R T T O S H A R E H O L D E R S

Management’s Discussion of Fund Performance (Continued)
iSHARES® U.S. HEALTHCARE ETF
The iShares U.S. Healthcare ETF (the “Fund”) seeks to track the investment results of an index composed of U.S. equities in the
healthcare sector, as represented by the Dow Jones U.S. Health Care IndexTM (the “Index”). The Fund invests in a representative
sample of securities included in the Index that collectively has an investment profile similar to the Index. Due to the use of
representative sampling, the Fund may or may not hold all of the securities that are included in the Index. For the 12-month
reporting period ended April 30, 2018, the total return for the Fund was 10.93%, net of fees, while the total return for the Index
was 11.40%.
The U.S. healthcare sector benefited from corporate tax reform during the reporting period. By lowering the corporate tax rate and
encouraging corporations to repatriate capital held overseas, the new tax laws created opportunity for increased cash flow and
acquisition activity in the sector.
Healthcare providers and services companies contributed the most to the Index’s return. Managed care companies benefited
from slower growth in medical services costs, as well as increased demand from an aging population. With more than 10,000
Americans per day aging into Medicare, the Medicare Advantage program offered by private companies represented a growth
opportunity for managed care companies.
The healthcare equipment and supplies industry benefited from the unexpected two-year suspension of an excise tax on medical
devices. Originally enacted as a funding measure for the Affordable Care Act and scheduled to take effect late during the
reporting period, the tax had been expected to significantly impede the industry; the suspension created opportunity for more
research and development, as well as capital investment.
The biotechnology industry contributed meaningfully to the Index’s performance amid a rapid pace of innovation. Large
pharmaceutical companies confronting patent expirations and rising competition looked to smaller biotechnology companies for
innovative therapies and experimental drugs. U.S. Food and Drug Administration (“FDA”) approvals reached their highest level in
21 years, reflecting 46 new medicines, including a breakthrough approval of the first gene therapy.
Life sciences tools and services companies contributed to the Index’s return amid strategic acquisitions, product launches, and an
expanding international presence. The pharmaceuticals industry benefited from corporate tax reform and an increase in FDA
approvals. However, a government investigation and consumer backlash regarding drug prices led to weaker drug price
increases.
ALLOCATION BY SECTOR
As of 4/30/18
Sector
Percentage of
Total Investments*
Pharmaceuticals 30.74%
Health Care Providers & Services 21.52
Health Care Equipment & Supplies 21.33
Biotechnology 20.23
Life Sciences Tools & Services 6.18
TOTAL 100.00%
TEN LARGEST FUND HOLDINGS
As of 4/30/18
Security
Percentage of
Total Investments*
Johnson & Johnson 10.02%
UnitedHealth Group Inc. 6.75
Pfizer Inc. 6.44
Merck & Co. Inc. 4.69
AbbVie Inc. 4.54
Amgen Inc. 3.44
Medtronic PLC 3.21
Abbott Laboratories 2.99
Gilead Sciences Inc. 2.79
Bristol-Myers Squibb Co. 2.51
TOTAL 47.38%
* Excludes money market funds.
M A N A G E M E N T ’ S D I S C U S S I O N S O F F U N D P E R F O R M A N C E 13

Management’s Discussion of Fund PerformanceiSHARES® U.S. TECHNOLOGY ETFPerformance as of April 30, 2018
Average Annual Total Returns Cumulative Total Returns
NAV MARKET INDEX NAV MARKET INDEX
1 Year 22.62% 22.62% 23.25% 22.62% 22.62% 23.25%
5 Years 19.26% 19.27% 19.81% 141.26% 141.34% 146.85%
10 Years 12.53% 12.53% 12.97% 225.47% 225.58% 238.61%
GROWTH OF $10 ,000 INVESTMENT
(AT NET ASSET VALUE)
$33,861$32,547
$10,000
$15,000
$20,000
$5,000
$25,000
$30,000
$35,000
$40,000
IndexFund
Apr 18Apr 13 Apr 14 Apr 15 Apr 16 Apr 17Apr 12Apr 11Apr 10Apr 09
Past performance is no guarantee of future results. Performance results do not reflect the deduction of taxes that a shareholder would pay on fund distributions or on
the redemption or sale of fund shares. See “About Fund Performance” on page 18 for more information.
Shareholder Expenses
Actual Hypothetical 5% Return
BeginningAccount Value
(11/1/17)
EndingAccount Value
(4/30/18)Expenses Paid
During Period a
BeginningAccount Value
(11/1/17)
EndingAccount Value
(4/30/18)Expenses Paid
During Period aAnnualized
Expense Ratio
$ 1,000.00 $ 1,044.00 $ 2.13 $ 1,000.00 $ 1,022.70 $ 2.11 0.42%
a Expenses are calculated using the Fund’s annualized expense ratio (as disclosed in the table), multiplied by the average account value for the period, multipliedby the number of days in the period (181 days) and divided by the number of days in the year (365 days). See “Shareholder Expenses” on page 18 for moreinformation.
14 2 0 1 8 i S H A R E S A N N U A L R E P O R T T O S H A R E H O L D E R S
Management’s Discussion of Fund Performance (Continued)
iSHARES® U.S. TECHNOLOGY ETF
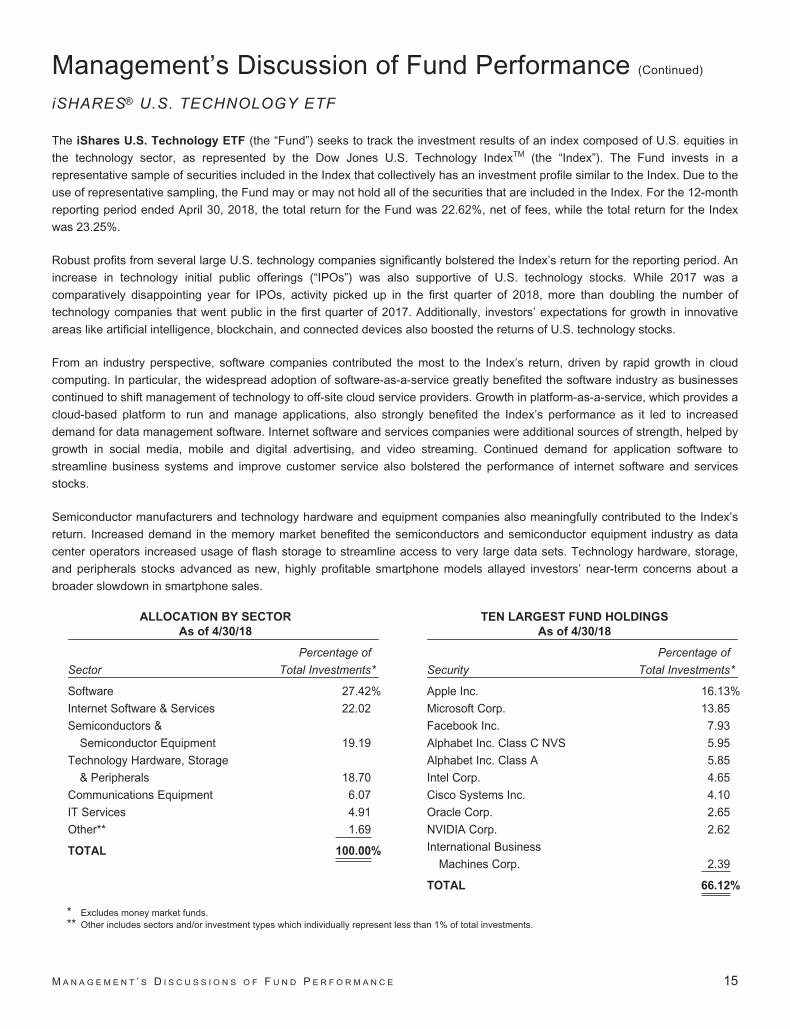
The iShares U.S. Technology ETF (the “Fund”) seeks to track the investment results of an index composed of U.S. equities in
the technology sector, as represented by the Dow Jones U.S. Technology IndexTM (the “Index”). The Fund invests in a
representative sample of securities included in the Index that collectively has an investment profile similar to the Index. Due to the
use of representative sampling, the Fund may or may not hold all of the securities that are included in the Index. For the 12-month
reporting period ended April 30, 2018, the total return for the Fund was 22.62%, net of fees, while the total return for the Index
was 23.25%.
Robust profits from several large U.S. technology companies significantly bolstered the Index’s return for the reporting period. An
increase in technology initial public offerings (“IPOs”) was also supportive of U.S. technology stocks. While 2017 was a
comparatively disappointing year for IPOs, activity picked up in the first quarter of 2018, more than doubling the number of
technology companies that went public in the first quarter of 2017. Additionally, investors’ expectations for growth in innovative
areas like artificial intelligence, blockchain, and connected devices also boosted the returns of U.S. technology stocks.
From an industry perspective, software companies contributed the most to the Index’s return, driven by rapid growth in cloud
computing. In particular, the widespread adoption of software-as-a-service greatly benefited the software industry as businesses
continued to shift management of technology to off-site cloud service providers. Growth in platform-as-a-service, which provides a
cloud-based platform to run and manage applications, also strongly benefited the Index’s performance as it led to increased
demand for data management software. Internet software and services companies were additional sources of strength, helped by
growth in social media, mobile and digital advertising, and video streaming. Continued demand for application software to
streamline business systems and improve customer service also bolstered the performance of internet software and services
stocks.
Semiconductor manufacturers and technology hardware and equipment companies also meaningfully contributed to the Index’s
return. Increased demand in the memory market benefited the semiconductors and semiconductor equipment industry as data
center operators increased usage of flash storage to streamline access to very large data sets. Technology hardware, storage,
and peripherals stocks advanced as new, highly profitable smartphone models allayed investors’ near-term concerns about a
broader slowdown in smartphone sales.
ALLOCATION BY SECTOR
As of 4/30/18
Sector
Percentage of
Total Investments*
Software 27.42%
Internet Software & Services 22.02
Semiconductors &
Semiconductor Equipment 19.19
Technology Hardware, Storage
& Peripherals 18.70
Communications Equipment 6.07
IT Services 4.91
Other** 1.69
TOTAL 100.00%
TEN LARGEST FUND HOLDINGS
As of 4/30/18
Security
Percentage of
Total Investments*
Apple Inc. 16.13%
Microsoft Corp. 13.85
Facebook Inc. 7.93
Alphabet Inc. Class C NVS 5.95
Alphabet Inc. Class A 5.85
Intel Corp. 4.65
Cisco Systems Inc. 4.10
Oracle Corp. 2.65
NVIDIA Corp. 2.62
International Business
Machines Corp. 2.39
TOTAL 66.12%
* Excludes money market funds.** Other includes sectors and/or investment types which individually represent less than 1% of total investments.
M A N A G E M E N T ’ S D I S C U S S I O N S O F F U N D P E R F O R M A N C E 15

Management’s Discussion of Fund PerformanceiSHARES® U.S. UTILITIES ETFPerformance as of April 30, 2018
Average Annual Total Returns Cumulative Total Returns
NAV MARKET INDEX NAV MARKET INDEX
1 Year 3.59% 3.59% 4.04% 3.59% 3.59% 4.04%
5 Years 8.43% 8.42% 8.90% 49.87% 49.84% 53.15%
10 Years 6.57% 6.58% 7.02% 89.02% 89.12% 97.00%
GROWTH OF $10 ,000 INVESTMENT
(AT NET ASSET VALUE)
$19,700$18,902
$4,000
$8,000
$10,000
$12,000
$6,000
$14,000
$16,000
$18,000
$20,000
$22,000
IndexFund
Apr 18Apr 13 Apr 14 Apr 15 Apr 16 Apr 17Apr 12Apr 11Apr 10Apr 09
Past performance is no guarantee of future results. Performance results do not reflect the deduction of taxes that a shareholder would pay on fund distributions or on
the redemption or sale of fund shares. See “About Fund Performance” on page 18 for more information.
Shareholder Expenses
Actual Hypothetical 5% Return
BeginningAccount Value
(11/1/17)
EndingAccount Value
(4/30/18)Expenses Paid
During Period a
BeginningAccount Value
(11/1/17)
EndingAccount Value
(4/30/18)Expenses Paid
During Period aAnnualized
Expense Ratio
$ 1,000.00 $ 955.90 $ 2.04 $ 1,000.00 $ 1,022.70 $ 2.11 0.42%
a Expenses are calculated using the Fund’s annualized expense ratio (as disclosed in the table), multiplied by the average account value for the period, multipliedby the number of days in the period (181 days) and divided by the number of days in the year (365 days). See “Shareholder Expenses” on page 18 for moreinformation.
16 2 0 1 8 i S H A R E S A N N U A L R E P O R T T O S H A R E H O L D E R S

Management’s Discussion of Fund Performance (Continued)
iSHARES® U.S. UTILITIES ETF
The iShares U.S. Utilities ETF (the “Fund”) seeks to track the investment results of an index composed of U.S. equities in the
utilities sector, as represented by the Dow Jones U.S. Utilities IndexTM (the “Index”). The Fund invests in a representative sample
of securities included in the Index that collectively has an investment profile similar to the Index. Due to the use of representative
sampling, the Fund may or may not hold all of the securities that are included in the Index. For the 12-month reporting period
ended April 30, 2018, the total return for the Fund was 3.59%, net of fees, while the total return for the Index was 4.04%.
Customer growth and cost-cutting measures contributed to the Index’s positive return for the reporting period, even as demand
for electricity softened. U.S. utilities stocks benefited from increased demand for new technologies, such as smart metering
products that consumers can monitor with mobile devices. The declining cost of power storage was another positive factor for
utilities as the sector shifts toward batteries for storage during times of low demand. Increased adoption of electric vehicles also
benefited utilities as these vehicles get energy from the power grid rather than from gasoline. Some utilities began partnering with
electric car manufacturers to incentivize drivers to switch to electric vehicles.
Despite their positive overall performance, utilities stocks had several challenges that limited their advance. Rising interest rates
weighed on the sector by increasing the cost of capital needed for infrastructure investments while making utilities’ relatively high
dividend yields less attractive compared with bond yields. In addition, utilities were not expected to benefit from federal tax reform
because regulations stipulate that any savings from the tax bill must be passed on to consumers in the form of lower rates.
From an industry perspective, the largest contributor to the sector’s gains were electric utilities as they continued to benefit from a
shift from coal to lower-cost natural gas as a source of power. Although capital expenditures have increased in recent years,
these costs have been offset by reductions in the wholesale cost of power, enabling electric utilities to keep rates steady.
Independent power and renewable electricity producers, which produce power but don’t typically sell directly to consumers, also
performed well. Multi-utilities, which provide a variety of services to their customers, and water utilities also contributed modestly
to the Index’s return.
ALLOCATION BY SECTOR
As of 4/30/18
Sector
Percentage of
Total Investments*
Electric Utilities 57.76%
Multi-Utilities 30.41
Gas Utilities 5.66
Independent Power and Renewable
Electricity Producers 3.36
Water Utilities 2.81
TOTAL 100.00%
TEN LARGEST FUND HOLDINGS
As of 4/30/18
Security
Percentage of
Total Investments*
NextEra Energy Inc. 9.99%
Duke Energy Corp. 7.27
Southern Co. (The) 6.03
Dominion Energy Inc. 5.62
Exelon Corp. 4.96
American Electric Power Co. Inc. 4.46
Sempra Energy 3.70
Public Service Enterprise Group Inc. 3.41
Consolidated Edison Inc. 3.22
Xcel Energy Inc. 3.08
TOTAL 51.74%
* Excludes money market funds.
M A N A G E M E N T ’ S D I S C U S S I O N S O F F U N D P E R F O R M A N C E 17

About Fund PerformancePast performance is no guarantee of future results. Current performance may be lower or higher than the performance data
quoted. Performance data current to the most recent month-end is available at www.ishares.com. Performance results assume
reinvestment of all dividends and capital gain distributions and do not reflect the deduction of taxes that a shareholder would pay
on fund distributions or on the redemption or sale of fund shares. The investment return and principal value of shares will vary
with changes in market conditions. Shares may be worth more or less than their original cost when they are redeemed or sold in
the market. Performance for certain funds may reflect a waiver of a portion of investment advisory fees. Without such a waiver,
performance would have been lower.
Net asset value or “NAV” is the value of one share of a fund as calculated in accordance with the standard formula for valuing
mutual fund shares. The price used to calculate market return (“Market Price”) is determined by using the midpoint between the
highest bid and the lowest offer on the primary stock exchange on which shares of a fund are listed for trading, as of the time that
such fund’s NAV is calculated. Certain funds may have a NAV which is determined prior to the opening of regular trading on its
listed exchange and their market returns are calculated using the midpoint of the bid/ask spread as of the opening of regular
trading on the exchange. Market and NAV returns assume that dividends and capital gain distributions have been reinvested at
Market Price and NAV, respectively.
An index is a statistical composite that tracks a specified financial market or sector. Unlike a fund, an index does not actually hold
a portfolio of securities and therefore does not incur the expenses incurred by a fund. These expenses negatively impact fund
performance. Also, market returns do not include brokerage commissions that may be payable on secondary market transactions.
If brokerage commissions were included, market returns would be lower.
Shareholder ExpensesAs a shareholder of a Fund, you incur two types of costs: (1) transaction costs, including brokerage commissions on purchases
and sales of fund shares and (2) ongoing costs, including management fees and other fund expenses. The expense example,
which is based on an investment of $1,000 invested on November 1, 2017 and held through April 30, 2018, is intended to help
you understand your ongoing costs (in dollars and cents) of investing in a Fund and to compare these costs with the ongoing
costs of investing in other funds.
Actual Expenses — The table provides information about actual account values and actual expenses. Annualized expense
ratios reflect contractual and voluntary fee waivers, if any. To estimate the expenses that you paid on your account over the
period, simply divide your account value by $1,000 (for example, an $8,600 account value divided by $1,000 = 8.6), then multiply
the result by the number corresponding to your Fund under the heading entitled “Expenses Paid During Period.”
Hypothetical Example for Comparison Purposes — The table also provides information about hypothetical account values and
hypothetical expenses based on each Fund’s actual expense ratio and an assumed rate of return of 5% per year before
expenses. You may use this information to compare the ongoing costs of investing in your Fund and other funds. To do so,
compare this 5% hypothetical example with the 5% hypothetical examples that appear in the shareholder reports of the other
funds.
Please note that the expenses shown in the table are meant to highlight your ongoing costs only and do not reflect any
transactional costs, such as brokerage commissions paid on purchases and sales of fund shares. Therefore, the hypothetical
examples are useful in comparing ongoing costs only and will not help you determine the relative total costs of owning different
funds. In addition, if these transactional costs were included, your costs would have been higher.
18 2 0 1 8 i S H A R E S A N N U A L R E P O R T T O S H A R E H O L D E R S

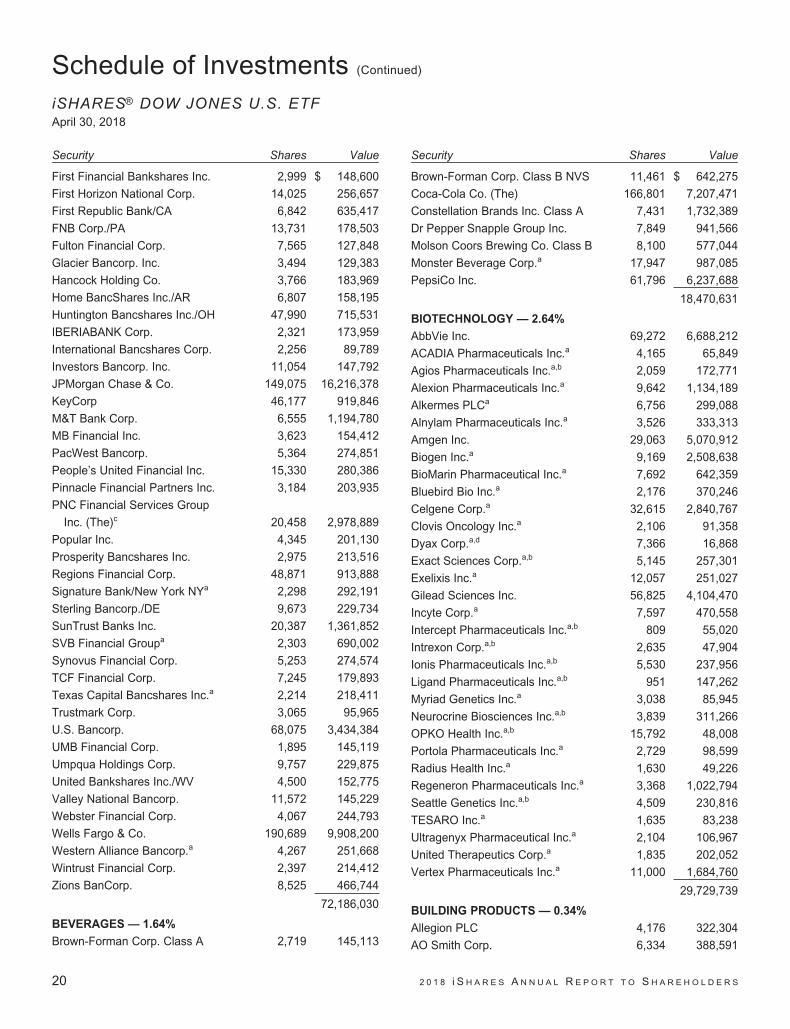
Schedule of InvestmentsiSHARES® DOW JONES U.S. ETFApril 30, 2018
Security Shares Value
COMMON STOCKS — 99.87%
AEROSPACE & DEFENSE — 2.65%
Arconic Inc. 18,225 $ 324,587
Boeing Co. (The) 24,031 8,015,780
BWX Technologies Inc. 4,393 297,845
Curtiss-Wright Corp. 1,955 250,318
Esterline Technologies Corp.a 1,137 81,693
General Dynamics Corp. 11,979 2,411,493
Harris Corp. 5,176 809,630
HEICO Corp.b 1,367 120,091
HEICO Corp. Class A 2,506 180,808
Hexcel Corp. 3,971 263,952
Huntington Ingalls Industries Inc. 1,957 475,962
KLX Inc.a 2,256 176,487
L3 Technologies Inc. 3,374 660,899
Lockheed Martin Corp. 10,778 3,458,014
Moog Inc. Class Aa 1,402 114,922
Northrop Grumman Corp. 7,551 2,431,724
Orbital ATK Inc. 2,551 337,701
Raytheon Co. 12,532 2,568,308
Rockwell Collins Inc. 7,161 949,119
Spirit AeroSystems Holdings Inc.
Class A 4,959 398,555
Teledyne Technologies Inc.a 1,523 284,938
Textron Inc. 11,434 710,509
TransDigm Group Inc. 2,126 681,532
United Technologies Corp. 32,265 3,876,640
29,881,507
AIR FREIGHT & LOGISTICS — 0.67%
CH Robinson Worldwide Inc. 6,093 560,739
Expeditors International of
Washington Inc. 7,640 487,890
FedEx Corp. 10,691 2,642,815
United Parcel Service Inc. Class B 29,855 3,388,543
XPO Logistics Inc.a,b 4,369 424,492
7,504,479
AIRLINES — 0.45%
Alaska Air Group Inc. 5,364 348,284
Allegiant Travel Co. 563 90,221
American Airlines Group Inc. 18,262 783,988
Delta Air Lines Inc. 28,212 1,473,231
JetBlue Airways Corp.a 13,907 266,875
Southwest Airlines Co. 23,548 1,244,041
Spirit Airlines Inc.a,b 3,013 107,624
Security Shares Value
United Continental Holdings Inc.a 10,535 $ 711,534
5,025,798
AUTO COMPONENTS — 0.34%
Adient PLC 4,004 245,405
Aptiv PLC 11,522 974,531
Autoliv Inc. 3,754 503,224
BorgWarner Inc. 8,562 419,024
Cooper Tire & Rubber Co. 2,348 57,409
Dana Inc. 6,411 152,133
Delphi Technologies PLC 3,840 185,894
Gentex Corp. 11,888 270,333
Goodyear Tire & Rubber Co. (The) 10,400 261,144
Lear Corp. 2,904 542,961
Tenneco Inc. 2,305 103,010
Visteon Corp.a 1,388 172,723
3,887,791
AUTOMOBILES — 0.55%
Ford Motor Co. 169,972 1,910,485
General Motors Co. 54,954 2,019,010
Harley-Davidson Inc. 7,370 303,128
Tesla Inc.a,b 5,810 1,707,559
Thor Industries Inc. 2,139 227,034
6,167,216
BANKS — 6.41%
Associated Banc-Corp. 7,312 193,402
BancorpSouth Bank 3,735 123,442
Bank of America Corp. 415,574 12,433,974
Bank of Hawaii Corp. 1,829 154,020
Bank of the Ozarks Inc. 5,188 242,798
BankUnited Inc. 4,639 183,751
BB&T Corp. 33,855 1,787,544
BOK Financial Corp. 1,074 108,130
Cathay General Bancorp. 3,244 129,792
Chemical Financial Corp. 3,073 168,677
CIT Group Inc. 5,623 297,738
Citigroup Inc. 111,651 7,622,414
Citizens Financial Group Inc. 21,081 874,651
Comerica Inc. 7,448 704,432
Commerce Bancshares Inc./MO 4,045 256,938
Cullen/Frost Bankers Inc. 2,540 290,703
East West Bancorp. Inc. 6,234 415,309
Fifth Third Bancorp. 30,204 1,001,867
First Citizens BancShares Inc./NC
Class A 377 162,973
S C H E D U L E S O F I N V E S T M E N T S 19
Schedule of Investments (Continued)
iSHARES® DOW JONES U.S. ETFApril 30, 2018
Security Shares Value
First Financial Bankshares Inc. 2,999 $ 148,600
First Horizon National Corp. 14,025 256,657
First Republic Bank/CA 6,842 635,417
FNB Corp./PA 13,731 178,503
Fulton Financial Corp. 7,565 127,848
Glacier Bancorp. Inc. 3,494 129,383
Hancock Holding Co. 3,766 183,969
Home BancShares Inc./AR 6,807 158,195
Huntington Bancshares Inc./OH 47,990 715,531
IBERIABANK Corp. 2,321 173,959
International Bancshares Corp. 2,256 89,789
Investors Bancorp. Inc. 11,054 147,792
JPMorgan Chase & Co. 149,075 16,216,378
KeyCorp 46,177 919,846
M&T Bank Corp. 6,555 1,194,780
MB Financial Inc. 3,623 154,412
PacWest Bancorp. 5,364 274,851
People’s United Financial Inc. 15,330 280,386
Pinnacle Financial Partners Inc. 3,184 203,935
PNC Financial Services Group
Inc. (The)c 20,458 2,978,889
Popular Inc. 4,345 201,130
Prosperity Bancshares Inc. 2,975 213,516
Regions Financial Corp. 48,871 913,888
Signature Bank/New York NYa 2,298 292,191
Sterling Bancorp./DE 9,673 229,734
SunTrust Banks Inc. 20,387 1,361,852
SVB Financial Groupa 2,303 690,002
Synovus Financial Corp. 5,253 274,574
TCF Financial Corp. 7,245 179,893
Texas Capital Bancshares Inc.a 2,214 218,411
Trustmark Corp. 3,065 95,965
U.S. Bancorp. 68,075 3,434,384
UMB Financial Corp. 1,895 145,119
Umpqua Holdings Corp. 9,757 229,875
United Bankshares Inc./WV 4,500 152,775
Valley National Bancorp. 11,572 145,229
Webster Financial Corp. 4,067 244,793
Wells Fargo & Co. 190,689 9,908,200
Western Alliance Bancorp.a 4,267 251,668
Wintrust Financial Corp. 2,397 214,412
Zions BanCorp. 8,525 466,744
72,186,030
BEVERAGES — 1.64%
Brown-Forman Corp. Class A 2,719 145,113
Security Shares Value
Brown-Forman Corp. Class B NVS 11,461 $ 642,275
Coca-Cola Co. (The) 166,801 7,207,471
Constellation Brands Inc. Class A 7,431 1,732,389
Dr Pepper Snapple Group Inc. 7,849 941,566
Molson Coors Brewing Co. Class B 8,100 577,044
Monster Beverage Corp.a 17,947 987,085
PepsiCo Inc. 61,796 6,237,688
18,470,631
BIOTECHNOLOGY — 2.64%
AbbVie Inc. 69,272 6,688,212
ACADIA Pharmaceuticals Inc.a 4,165 65,849
Agios Pharmaceuticals Inc.a,b 2,059 172,771
Alexion Pharmaceuticals Inc.a 9,642 1,134,189
Alkermes PLCa 6,756 299,088
Alnylam Pharmaceuticals Inc.a 3,526 333,313
Amgen Inc. 29,063 5,070,912
Biogen Inc.a 9,169 2,508,638
BioMarin Pharmaceutical Inc.a 7,692 642,359
Bluebird Bio Inc.a 2,176 370,246
Celgene Corp.a 32,615 2,840,767
Clovis Oncology Inc.a 2,106 91,358
Dyax Corp.a,d 7,366 16,868
Exact Sciences Corp.a,b 5,145 257,301
Exelixis Inc.a 12,057 251,027
Gilead Sciences Inc. 56,825 4,104,470
Incyte Corp.a 7,597 470,558
Intercept Pharmaceuticals Inc.a,b 809 55,020
Intrexon Corp.a,b 2,635 47,904
Ionis Pharmaceuticals Inc.a,b 5,530 237,956
Ligand Pharmaceuticals Inc.a,b 951 147,262
Myriad Genetics Inc.a 3,038 85,945
Neurocrine Biosciences Inc.a,b 3,839 311,266
OPKO Health Inc.a,b 15,792 48,008
Portola Pharmaceuticals Inc.a 2,729 98,599
Radius Health Inc.a 1,630 49,226
Regeneron Pharmaceuticals Inc.a 3,368 1,022,794
Seattle Genetics Inc.a,b 4,509 230,816
TESARO Inc.a 1,635 83,238
Ultragenyx Pharmaceutical Inc.a 2,104 106,967
United Therapeutics Corp.a 1,835 202,052
Vertex Pharmaceuticals Inc.a 11,000 1,684,760
29,729,739
BUILDING PRODUCTS — 0.34%
Allegion PLC 4,176 322,304
AO Smith Corp. 6,334 388,591
20 2 0 1 8 i S H A R E S A N N U A L R E P O R T T O S H A R E H O L D E R S

Schedule of Investments (Continued)
iSHARES® DOW JONES U.S. ETFApril 30, 2018
Security Shares Value
Armstrong World Industries Inc.a 2,371 $ 132,776
Fortune Brands Home & Security Inc. 6,657 364,071
Johnson Controls International PLC 40,266 1,363,809
Lennox International Inc. 1,631 315,387
Masco Corp. 13,726 519,804
Owens Corning 4,923 322,407
USG Corp.a 3,978 160,035
3,889,184
CAPITAL MARKETS — 3.09%
Affiliated Managers Group Inc. 2,384 393,026
Ameriprise Financial Inc. 6,386 895,381
Bank of New York Mellon Corp. (The) 43,968 2,396,696
BGC Partners Inc. Class A 11,081 148,042
BlackRock Inc.c 5,366 2,798,369
Cboe Global Markets Inc. 4,870 520,019
Charles Schwab Corp. (The) 51,963 2,893,300
CME Group Inc. 14,754 2,326,411
E*TRADE Financial Corp.a 11,595 703,585
Eaton Vance Corp. NVS 5,150 280,108
Evercore Inc. Class A 1,817 183,971
FactSet Research Systems Inc. 1,671 316,003
Federated Investors Inc. Class B 3,963 104,901
Financial Engines Inc. 2,635 117,653
Franklin Resources Inc. 14,207 477,923
Goldman Sachs Group Inc. (The) 15,326 3,652,646
Intercontinental Exchange Inc. 25,254 1,829,905
Invesco Ltd. 17,847 517,028
Janus Henderson Group PLC 7,760 245,138
Lazard Ltd. Class A 5,596 304,534
Legg Mason Inc. 3,575 141,928
LPL Financial Holdings Inc. 3,885 235,314
MarketAxess Holdings Inc. 1,623 322,376
Moody’s Corp. 7,225 1,171,895
Morgan Stanley 59,850 3,089,457
MSCI Inc. 3,877 580,891
Nasdaq Inc. 5,089 449,460
Northern Trust Corp. 9,229 985,196
Raymond James Financial Inc. 5,652 507,267
S&P Global Inc. 11,010 2,076,486
SEI Investments Co. 5,670 358,514
State Street Corp. 16,006 1,597,079
Stifel Financial Corp. 3,128 182,300
T Rowe Price Group Inc. 10,648 1,211,955
TD Ameritrade Holding Corp. 11,803 685,636
Security Shares Value
Waddell & Reed Financial Inc. Class A 3,661 $ 74,099
34,774,492
CHEMICALS — 2.22%
Air Products & Chemicals Inc. 9,532 1,546,948
Albemarle Corp. 4,757 461,239
Ashland Global Holdings Inc. 2,702 178,818
Axalta Coating Systems Ltd.a 9,432 291,449
Cabot Corp. 2,737 152,889
Celanese Corp. Series A 5,942 645,717
CF Industries Holdings Inc. 10,059 390,289
Chemours Co. (The) 8,110 392,605
DowDuPont Inc. 101,677 6,430,054
Eastman Chemical Co. 6,191 631,977
Ecolab Inc. 11,310 1,637,349
FMC Corp. 5,902 470,567
GCP Applied Technologies Inc.a 3,193 91,479
HB Fuller Co. 2,205 109,081
Huntsman Corp. 9,119 271,473
Ingevity Corp.a 1,792 137,679
International Flavors & Fragrances Inc. 3,404 480,849
LyondellBasell Industries NV Class A 14,016 1,481,912
Minerals Technologies Inc. 1,555 107,373
Monsanto Co. 19,185 2,405,223
Mosaic Co. (The) 15,088 406,622
NewMarket Corp. 394 149,543
Olin Corp. 7,191 217,096
Platform Specialty Products Corp.a,b 9,420 94,859
PolyOne Corp. 3,439 143,922
PPG Industries Inc. 11,068 1,171,880
Praxair Inc. 12,452 1,899,179
RPM International Inc. 5,702 275,407
Scotts Miracle-Gro Co. (The) 1,769 147,853
Sensient Technologies Corp. 1,942 129,434
Sherwin-Williams Co. (The) 3,601 1,323,944
Trinseo SA 1,891 137,948
Valvoline Inc. 8,754 177,531
Westlake Chemical Corp. 1,615 172,757
WR Grace & Co. 2,926 200,255
24,963,200
COMMERCIAL SERVICES & SUPPLIES — 0.44%
Brink’s Co. (The) 2,179 160,810
Cintas Corp. 3,753 639,136
Clean Harbors Inc.a 2,297 105,203
Copart Inc.a 8,659 442,302
Covanta Holding Corp. 5,365 79,938
S C H E D U L E S O F I N V E S T M E N T S 21

Schedule of Investments (Continued)
iSHARES® DOW JONES U.S. ETFApril 30, 2018
Security Shares Value
Deluxe Corp. 2,062 $ 141,329
Healthcare Services Group Inc. 3,237 125,045
Herman Miller Inc. 2,471 75,860
HNI Corp. 1,892 63,174
KAR Auction Services Inc. 5,865 304,921
MSA Safety Inc. 1,534 133,213
Pitney Bowes Inc. 8,284 84,662
Republic Services Inc. 9,742 630,113
Rollins Inc. 4,192 203,396
Stericycle Inc.a 3,660 214,879
Tetra Tech Inc. 2,410 116,644
Waste Management Inc. 17,388 1,413,470
4,934,095
COMMUNICATIONS EQUIPMENT — 1.22%
Arista Networks Inc.a 2,044 540,740
ARRIS International PLCa 7,618 205,686
Ciena Corp.a 6,203 159,727
Cisco Systems Inc. 209,261 9,268,170
CommScope Holding Co. Inc.a 8,509 325,214
EchoStar Corp. Class Aa 2,034 106,866
F5 Networks Inc.a 2,687 438,223
Finisar Corp.a,b 4,845 75,485
InterDigital Inc./PA 1,517 112,941
Juniper Networks Inc. 14,965 367,989
Lumentum Holdings Inc.a 2,652 133,793
Motorola Solutions Inc. 7,055 774,851
NetScout Systems Inc.a 3,640 98,826
Palo Alto Networks Inc.a 4,005 771,003
Plantronics Inc. 1,503 97,921
ViaSat Inc.a,b 2,340 149,713
Viavi Solutions Inc.a 9,696 91,627
13,718,775
CONSTRUCTION & ENGINEERING — 0.17%
AECOMa,b 6,907 237,877
Chicago Bridge & Iron Co. NV 4,374 66,047
Dycom Industries Inc.a 1,404 145,819
EMCOR Group Inc. 2,565 188,758
Fluor Corp. 6,010 354,290
Jacobs Engineering Group Inc. 5,255 305,263
KBR Inc. 6,065 101,225
MasTec Inc.a 2,895 127,380
Quanta Services Inc.a 6,824 221,780
Valmont Industries Inc. 1,006 142,953
1,891,392
Security Shares Value
CONSTRUCTION MATERIALS — 0.13%
Eagle Materials Inc. 2,131 $ 210,884
Martin Marietta Materials Inc. 2,701 526,074
Summit Materials Inc. Class Aa 4,709 132,511
Vulcan Materials Co. 5,784 646,015
1,515,484
CONSUMER FINANCE — 0.74%
Ally Financial Inc. 18,860 492,246
American Express Co. 31,242 3,085,147
Capital One Financial Corp. 21,171 1,918,516
Credit Acceptance Corp.a,b 552 182,624
Discover Financial Services 15,444 1,100,385
LendingClub Corp.a 16,499 44,382
Navient Corp. 11,541 153,034
PRA Group Inc.a,b 2,052 73,051
SLM Corp.a 18,655 214,159
Synchrony Financial 31,110 1,031,919
8,295,463
CONTAINERS & PACKAGING — 0.45%
AptarGroup Inc. 2,743 256,471
Avery Dennison Corp. 3,767 394,819
Ball Corp. 15,190 608,967
Bemis Co. Inc. 3,964 171,522
Berry Global Group Inc.a 5,648 310,640
Crown Holdings Inc.a 5,786 288,374
Graphic Packaging Holding Co. 13,689 195,753
International Paper Co. 17,943 925,141
Owens-Illinois Inc.a 7,207 146,518
Packaging Corp. of America 4,141 479,072
Sealed Air Corp. 7,287 319,535
Silgan Holdings Inc. 3,201 89,852
Sonoco Products Co. 4,317 221,721
WestRock Co. 11,134 658,688
5,067,073
DISTRIBUTORS — 0.11%
Genuine Parts Co. 6,360 561,715
LKQ Corp.a 13,415 416,133
Pool Corp. 1,764 244,861
1,222,709
DIVERSIFIED CONSUMER SERVICES — 0.14%
Adtalem Global Education Inc.a 2,679 127,520
Bright Horizons Family Solutions Inc.a 2,491 236,346
Graham Holdings Co. Class B 206 124,228
Grand Canyon Education Inc.a 2,049 213,076
22 2 0 1 8 i S H A R E S A N N U A L R E P O R T T O S H A R E H O L D E R S

Schedule of Investments (Continued)
iSHARES® DOW JONES U.S. ETFApril 30, 2018
Security Shares Value
H&R Block Inc. 8,920 $ 246,638
Service Corp. International/U.S. 8,094 295,512
ServiceMaster Global Holdings Inc.a 5,908 298,945
Sotheby’sa 1,613 85,166
1,627,431
DIVERSIFIED FINANCIAL SERVICES — 1.50%
Berkshire Hathaway Inc. Class Ba 83,600 16,195,828
Leucadia National Corp. 13,484 324,156
Voya Financial Inc. 7,758 406,131
16,926,115
DIVERSIFIED TELECOMMUNICATION SERVICES — 1.66%
AT&T Inc. 266,706 8,721,286
CenturyLink Inc. 42,561 790,783
Verizon Communications Inc. 179,308 8,848,850
Zayo Group Holdings Inc.a 7,958 288,876
18,649,795
ELECTRIC UTILITIES — 1.74%
ALLETE Inc. 2,152 164,434
Alliant Energy Corp. 10,055 431,862
American Electric Power Co. Inc. 21,310 1,491,274
Duke Energy Corp. 30,369 2,434,379
Edison International 14,181 929,139
El Paso Electric Co. 1,829 93,370
Entergy Corp. 7,905 644,969
Eversource Energy 13,687 824,642
Exelon Corp. 41,777 1,657,711
FirstEnergy Corp. 19,385 666,844
Great Plains Energy Inc. 9,220 301,771
Hawaiian Electric Industries Inc. 4,647 161,204
IDACORP Inc. 2,200 204,600
NextEra Energy Inc. 20,405 3,344,584
OGE Energy Corp. 8,515 279,888
PG&E Corp. 22,373 1,031,395
Pinnacle West Capital Corp. 4,806 386,883
PNM Resources Inc. 3,513 139,291
Portland General Electric Co. 3,889 165,205
PPL Corp. 30,215 879,257
Southern Co. (The) 43,877 2,023,607
Westar Energy Inc. 6,093 330,119
Xcel Energy Inc. 22,167 1,038,302
19,624,730
ELECTRICAL EQUIPMENT — 0.54%
Acuity Brands Inc. 1,815 217,383
AMETEK Inc. 10,099 704,910
Security Shares Value
Eaton Corp. PLC 19,165 $ 1,437,950
Emerson Electric Co. 27,639 1,835,506
EnerSys 1,812 124,231
Generac Holdings Inc.a 2,730 122,877
Hubbell Inc. 2,362 245,317
Regal Beloit Corp. 1,972 140,406
Rockwell Automation Inc. 5,519 908,041
Sensata Technologies Holding PLCa 7,416 376,140
6,112,761
ELECTRONIC EQUIPMENT, INSTRUMENTS &
COMPONENTS — 0.74%
Amphenol Corp. Class A 13,298 1,113,176
Anixter International Inc.a 1,252 73,743
Arrow Electronics Inc.a 3,855 288,123
Avnet Inc. 5,208 204,310
Belden Inc. 1,827 112,543
CDW Corp./DE 6,691 477,001
Cognex Corp. 7,437 343,961
Coherent Inc.a 1,066 179,323
Corning Inc. 37,692 1,018,438
Dolby Laboratories Inc. Class A 2,649 158,463
FLIR Systems Inc. 6,046 323,763
IPG Photonics Corp.a 1,622 345,535
Itron Inc.a 1,416 92,606
Jabil Inc. 7,793 207,294
Keysight Technologies Inc.a 8,320 429,978
Littelfuse Inc. 1,074 200,752
National Instruments Corp. 4,660 190,547
SYNNEX Corp. 1,284 128,618
TE Connectivity Ltd. 15,260 1,400,105
Tech Data Corp.a 1,541 117,501
Trimble Inc.a 10,787 373,230
VeriFone Systems Inc.a 4,757 109,459
Vishay Intertechnology Inc. 5,445 96,104
Zebra Technologies Corp. Class Aa 2,320 312,806
8,297,379
ENERGY EQUIPMENT & SERVICES — 0.87%
Baker Hughes a GE Co. 18,372 663,413
Core Laboratories NV 1,958 239,757
Dril-Quip Inc.a,b 1,680 69,636
Ensco PLC Class A 18,637 105,299
Halliburton Co. 37,814 2,003,764
Helmerich & Payne Inc. 4,799 333,770
Nabors Industries Ltd. 14,263 108,541
National Oilwell Varco Inc.b 16,612 642,386
S C H E D U L E S O F I N V E S T M E N T S 23

Schedule of Investments (Continued)
iSHARES® DOW JONES U.S. ETFApril 30, 2018
Security Shares Value
Oceaneering International Inc. 4,191 $ 89,017
Patterson-UTI Energy Inc. 9,747 208,781
Rowan Companies PLCa 4,639 66,987
Schlumberger Ltd. 60,033 4,115,863
Superior Energy Services Inc.a 6,675 71,623
TechnipFMC PLC 18,963 625,020
Transocean Ltd.a,b 18,567 229,674
U.S. Silica Holdings Inc. 3,504 105,505
Weatherford International PLCa 41,782 123,257
9,802,293
EQUITY REAL ESTATE INVESTMENT TRUSTS
(REITS) — 3.48%
Acadia Realty Trust 3,503 82,671
Alexander & Baldwin Inc. 2,726 62,425
Alexandria Real Estate Equities Inc. 4,381 545,741
American Campus Communities Inc. 5,866 229,419
American Homes 4 Rent Class A 10,879 219,756
American Tower Corp. 19,113 2,606,249
Apartment Investment & Management
Co. Class A 6,897 280,018
Apple Hospitality REIT Inc. 9,057 162,935
AvalonBay Communities Inc. 5,984 975,392
Boston Properties Inc. 6,725 816,482
Brandywine Realty Trust 7,323 117,974
Brixmor Property Group Inc. 13,171 196,116
Camden Property Trust 3,981 339,977
CBL & Associates Properties Inc.b 7,656 32,002
Colony NorthStar Inc. Class A 23,881 145,913
Columbia Property Trust Inc. 5,087 108,658
CoreCivic Inc. 5,167 104,167
CoreSite Realty Corp. 1,507 156,879
Corporate Office Properties Trustb 4,309 118,541
Cousins Properties Inc. 17,933 159,424
Crown Castle International Corp. 18,055 1,821,208
CubeSmart 7,993 235,314
CyrusOne Inc. 4,184 224,221
DCT Industrial Trust Inc. 4,046 265,296
DDR Corp. 13,363 96,882
DiamondRock Hospitality Co. 8,563 94,621
Digital Realty Trust Inc. 8,911 941,804
Douglas Emmett Inc. 6,994 260,666
Duke Realty Corp. 15,701 425,497
EastGroup Properties Inc. 1,521 136,555
Education Realty Trust Inc. 3,349 110,216
EPR Properties 2,765 152,130
Security Shares Value
Equinix Inc. 3,449 $ 1,451,305
Equity Commonwealtha 5,484 169,949
Equity LifeStyle Properties Inc. 3,896 347,367
Equity Residential 16,018 988,471
Essex Property Trust Inc. 2,847 682,397
Extra Space Storage Inc. 5,515 494,089
Federal Realty Investment Trust 3,157 365,738
First Industrial Realty Trust Inc. 5,208 162,021
Forest City Realty Trust Inc. Class A 11,518 231,051
Four Corners Property Trust Inc. 2,606 59,052
Gaming and Leisure Properties Inc. 8,715 298,663
GEO Group Inc. (The) 5,276 118,710
GGP Inc. 27,594 551,604
Gramercy Property Trust 6,931 162,878
HCP Inc. 20,312 474,488
Healthcare Realty Trust Inc. 5,416 150,727
Healthcare Trust of America Inc.
Class A 9,028 225,610
Highwoods Properties Inc. 4,505 198,310
Hospitality Properties Trust 6,965 173,289
Host Hotels & Resorts Inc. 31,794 621,891
Hudson Pacific Properties Inc. 6,634 218,060
Iron Mountain Inc. 12,169 413,016
JBG SMITH Properties 4,030 148,586
Kilroy Realty Corp. 4,307 308,683
Kimco Realty Corp. 18,373 266,592
Kite Realty Group Trust 3,826 56,319
Lamar Advertising Co. Class A 3,561 226,871
LaSalle Hotel Properties 4,903 144,982
Lexington Realty Trust 9,323 74,957
Liberty Property Trust 6,375 266,602
Life Storage Inc. 2,025 179,091
Macerich Co. (The) 4,700 270,814
Mack-Cali Realty Corp. 3,968 68,131
Medical Properties Trust Inc. 16,292 208,212
Mid-America Apartment
Communities Inc. 4,900 448,154
National Health Investors Inc. 1,767 120,633
National Retail Properties Inc. 6,819 259,395
Omega Healthcare Investors Inc.b 8,465 219,921
Outfront Media Inc. 6,022 112,913
Paramount Group Inc.b 8,772 125,878
Park Hotels & Resorts Inc. 8,737 251,451
Pebblebrook Hotel Trustb 3,035 106,195
Physicians Realty Trust 7,684 114,799
24 2 0 1 8 i S H A R E S A N N U A L R E P O R T T O S H A R E H O L D E R S
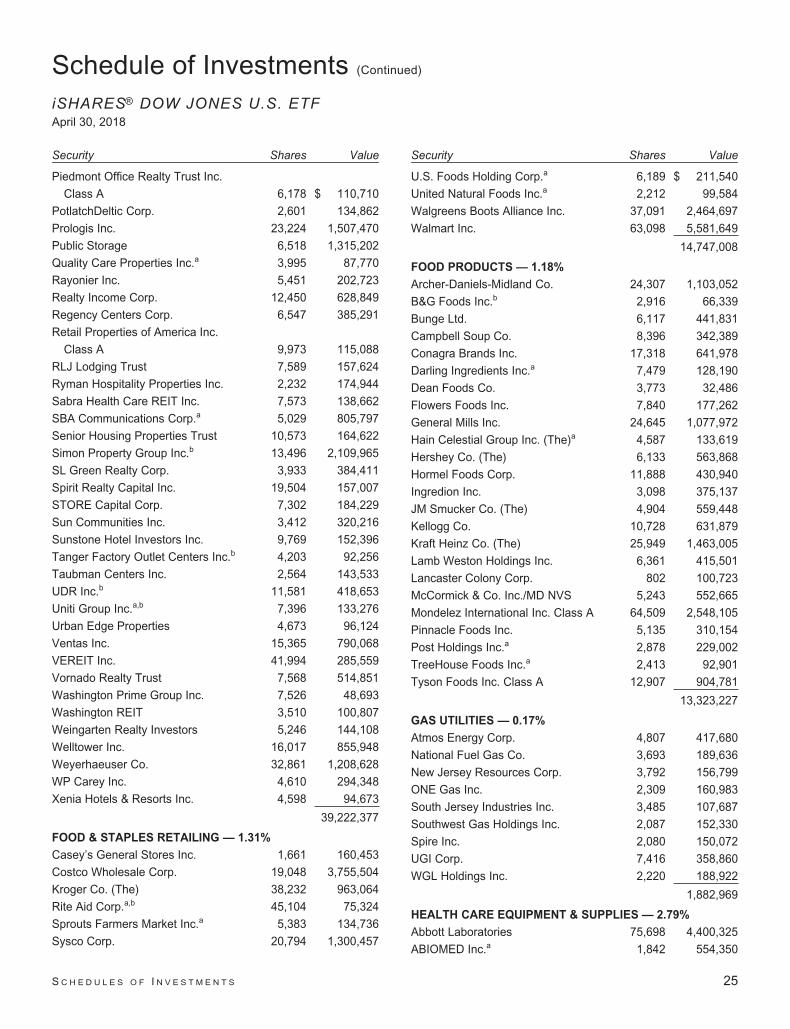
Schedule of Investments (Continued)
iSHARES® DOW JONES U.S. ETFApril 30, 2018
Security Shares Value
Piedmont Office Realty Trust Inc.
Class A 6,178 $ 110,710
PotlatchDeltic Corp. 2,601 134,862
Prologis Inc. 23,224 1,507,470
Public Storage 6,518 1,315,202
Quality Care Properties Inc.a 3,995 87,770
Rayonier Inc. 5,451 202,723
Realty Income Corp. 12,450 628,849
Regency Centers Corp. 6,547 385,291
Retail Properties of America Inc.
Class A 9,973 115,088
RLJ Lodging Trust 7,589 157,624
Ryman Hospitality Properties Inc. 2,232 174,944
Sabra Health Care REIT Inc. 7,573 138,662
SBA Communications Corp.a 5,029 805,797
Senior Housing Properties Trust 10,573 164,622
Simon Property Group Inc.b 13,496 2,109,965
SL Green Realty Corp. 3,933 384,411
Spirit Realty Capital Inc. 19,504 157,007
STORE Capital Corp. 7,302 184,229
Sun Communities Inc. 3,412 320,216
Sunstone Hotel Investors Inc. 9,769 152,396
Tanger Factory Outlet Centers Inc.b 4,203 92,256
Taubman Centers Inc. 2,564 143,533
UDR Inc.b 11,581 418,653
Uniti Group Inc.a,b 7,396 133,276
Urban Edge Properties 4,673 96,124
Ventas Inc. 15,365 790,068
VEREIT Inc. 41,994 285,559
Vornado Realty Trust 7,568 514,851
Washington Prime Group Inc. 7,526 48,693
Washington REIT 3,510 100,807
Weingarten Realty Investors 5,246 144,108
Welltower Inc. 16,017 855,948
Weyerhaeuser Co. 32,861 1,208,628
WP Carey Inc. 4,610 294,348
Xenia Hotels & Resorts Inc. 4,598 94,673
39,222,377
FOOD & STAPLES RETAILING — 1.31%
Casey’s General Stores Inc. 1,661 160,453
Costco Wholesale Corp. 19,048 3,755,504
Kroger Co. (The) 38,232 963,064
Rite Aid Corp.a,b 45,104 75,324
Sprouts Farmers Market Inc.a 5,383 134,736
Sysco Corp. 20,794 1,300,457
Security Shares Value
U.S. Foods Holding Corp.a 6,189 $ 211,540
United Natural Foods Inc.a 2,212 99,584
Walgreens Boots Alliance Inc. 37,091 2,464,697
Walmart Inc. 63,098 5,581,649
14,747,008
FOOD PRODUCTS — 1.18%
Archer-Daniels-Midland Co. 24,307 1,103,052
B&G Foods Inc.b 2,916 66,339
Bunge Ltd. 6,117 441,831
Campbell Soup Co. 8,396 342,389
Conagra Brands Inc. 17,318 641,978
Darling Ingredients Inc.a 7,479 128,190
Dean Foods Co. 3,773 32,486
Flowers Foods Inc. 7,840 177,262
General Mills Inc. 24,645 1,077,972
Hain Celestial Group Inc. (The)a 4,587 133,619
Hershey Co. (The) 6,133 563,868
Hormel Foods Corp. 11,888 430,940
Ingredion Inc. 3,098 375,137
JM Smucker Co. (The) 4,904 559,448
Kellogg Co. 10,728 631,879
Kraft Heinz Co. (The) 25,949 1,463,005
Lamb Weston Holdings Inc. 6,361 415,501
Lancaster Colony Corp. 802 100,723
McCormick & Co. Inc./MD NVS 5,243 552,665
Mondelez International Inc. Class A 64,509 2,548,105
Pinnacle Foods Inc. 5,135 310,154
Post Holdings Inc.a 2,878 229,002
TreeHouse Foods Inc.a 2,413 92,901
Tyson Foods Inc. Class A 12,907 904,781
13,323,227
GAS UTILITIES — 0.17%
Atmos Energy Corp. 4,807 417,680
National Fuel Gas Co. 3,693 189,636
New Jersey Resources Corp. 3,792 156,799
ONE Gas Inc. 2,309 160,983
South Jersey Industries Inc. 3,485 107,687
Southwest Gas Holdings Inc. 2,087 152,330
Spire Inc. 2,080 150,072
UGI Corp. 7,416 358,860
WGL Holdings Inc. 2,220 188,922
1,882,969
HEALTH CARE EQUIPMENT & SUPPLIES — 2.79%
Abbott Laboratories 75,698 4,400,325
ABIOMED Inc.a 1,842 554,350
S C H E D U L E S O F I N V E S T M E N T S 25
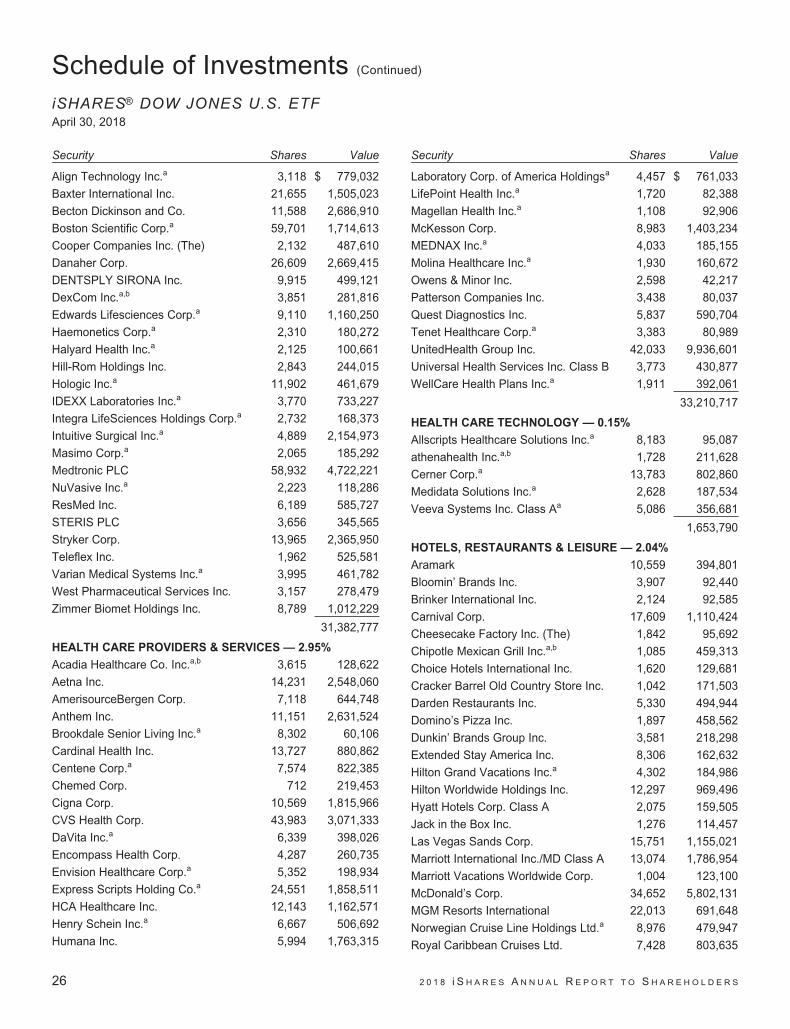
Schedule of Investments (Continued)
iSHARES® DOW JONES U.S. ETFApril 30, 2018
Security Shares Value
Align Technology Inc.a 3,118 $ 779,032
Baxter International Inc. 21,655 1,505,023
Becton Dickinson and Co. 11,588 2,686,910
Boston Scientific Corp.a 59,701 1,714,613
Cooper Companies Inc. (The) 2,132 487,610
Danaher Corp. 26,609 2,669,415
DENTSPLY SIRONA Inc. 9,915 499,121
DexCom Inc.a,b 3,851 281,816
Edwards Lifesciences Corp.a 9,110 1,160,250
Haemonetics Corp.a 2,310 180,272
Halyard Health Inc.a 2,125 100,661
Hill-Rom Holdings Inc. 2,843 244,015
Hologic Inc.a 11,902 461,679
IDEXX Laboratories Inc.a 3,770 733,227
Integra LifeSciences Holdings Corp.a 2,732 168,373
Intuitive Surgical Inc.a 4,889 2,154,973
Masimo Corp.a 2,065 185,292
Medtronic PLC 58,932 4,722,221
NuVasive Inc.a 2,223 118,286
ResMed Inc. 6,189 585,727
STERIS PLC 3,656 345,565
Stryker Corp. 13,965 2,365,950
Teleflex Inc. 1,962 525,581
Varian Medical Systems Inc.a 3,995 461,782
West Pharmaceutical Services Inc. 3,157 278,479
Zimmer Biomet Holdings Inc. 8,789 1,012,229
31,382,777
HEALTH CARE PROVIDERS & SERVICES — 2.95%
Acadia Healthcare Co. Inc.a,b 3,615 128,622
Aetna Inc. 14,231 2,548,060
AmerisourceBergen Corp. 7,118 644,748
Anthem Inc. 11,151 2,631,524
Brookdale Senior Living Inc.a 8,302 60,106
Cardinal Health Inc. 13,727 880,862
Centene Corp.a 7,574 822,385
Chemed Corp. 712 219,453
Cigna Corp. 10,569 1,815,966
CVS Health Corp. 43,983 3,071,333
DaVita Inc.a 6,339 398,026
Encompass Health Corp. 4,287 260,735
Envision Healthcare Corp.a 5,352 198,934
Express Scripts Holding Co.a 24,551 1,858,511
HCA Healthcare Inc. 12,143 1,162,571
Henry Schein Inc.a 6,667 506,692
Humana Inc. 5,994 1,763,315
Security Shares Value
Laboratory Corp. of America Holdingsa 4,457 $ 761,033
LifePoint Health Inc.a 1,720 82,388
Magellan Health Inc.a 1,108 92,906
McKesson Corp. 8,983 1,403,234
MEDNAX Inc.a 4,033 185,155
Molina Healthcare Inc.a 1,930 160,672
Owens & Minor Inc. 2,598 42,217
Patterson Companies Inc. 3,438 80,037
Quest Diagnostics Inc. 5,837 590,704
Tenet Healthcare Corp.a 3,383 80,989
UnitedHealth Group Inc. 42,033 9,936,601
Universal Health Services Inc. Class B 3,773 430,877
WellCare Health Plans Inc.a 1,911 392,061
33,210,717
HEALTH CARE TECHNOLOGY — 0.15%
Allscripts Healthcare Solutions Inc.a 8,183 95,087
athenahealth Inc.a,b 1,728 211,628
Cerner Corp.a 13,783 802,860
Medidata Solutions Inc.a 2,628 187,534
Veeva Systems Inc. Class Aa 5,086 356,681
1,653,790
HOTELS, RESTAURANTS & LEISURE — 2.04%
Aramark 10,559 394,801
Bloomin’ Brands Inc. 3,907 92,440
Brinker International Inc. 2,124 92,585
Carnival Corp. 17,609 1,110,424
Cheesecake Factory Inc. (The) 1,842 95,692
Chipotle Mexican Grill Inc.a,b 1,085 459,313
Choice Hotels International Inc. 1,620 129,681
Cracker Barrel Old Country Store Inc. 1,042 171,503
Darden Restaurants Inc. 5,330 494,944
Domino’s Pizza Inc. 1,897 458,562
Dunkin’ Brands Group Inc. 3,581 218,298
Extended Stay America Inc. 8,306 162,632
Hilton Grand Vacations Inc.a 4,302 184,986
Hilton Worldwide Holdings Inc. 12,297 969,496
Hyatt Hotels Corp. Class A 2,075 159,505
Jack in the Box Inc. 1,276 114,457
Las Vegas Sands Corp. 15,751 1,155,021
Marriott International Inc./MD Class A 13,074 1,786,954
Marriott Vacations Worldwide Corp. 1,004 123,100
McDonald’s Corp. 34,652 5,802,131
MGM Resorts International 22,013 691,648
Norwegian Cruise Line Holdings Ltd.a 8,976 479,947
Royal Caribbean Cruises Ltd. 7,428 803,635
26 2 0 1 8 i S H A R E S A N N U A L R E P O R T T O S H A R E H O L D E R S
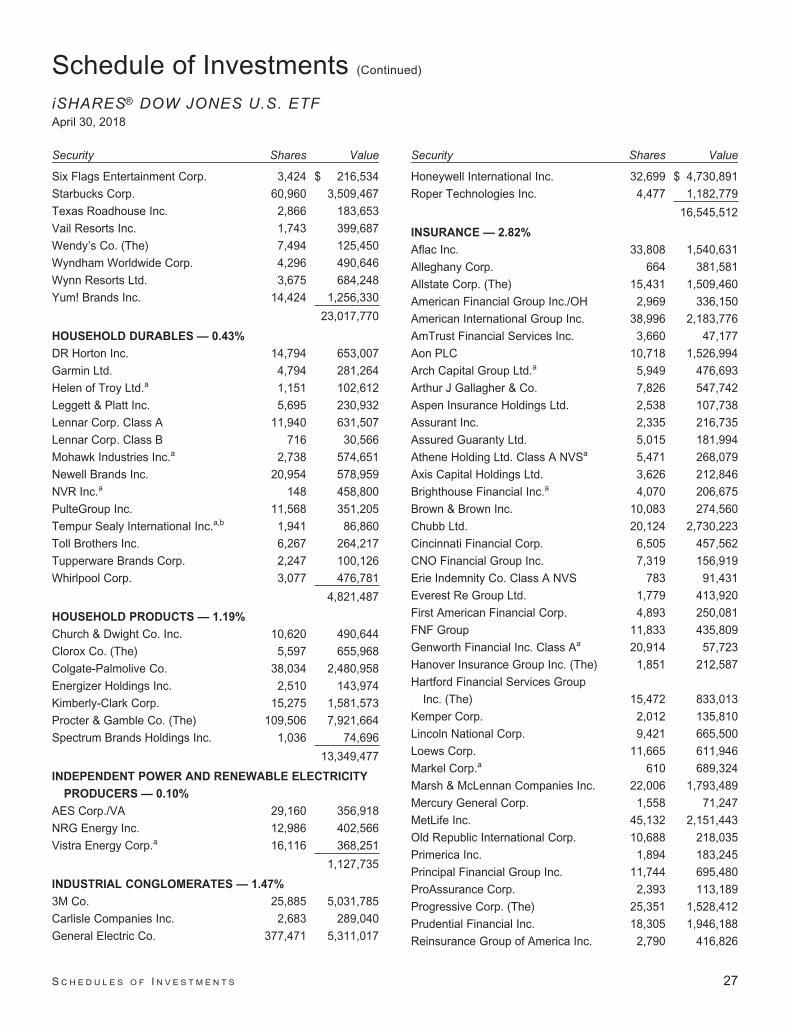
Schedule of Investments (Continued)
iSHARES® DOW JONES U.S. ETFApril 30, 2018
Security Shares Value
Six Flags Entertainment Corp. 3,424 $ 216,534
Starbucks Corp. 60,960 3,509,467
Texas Roadhouse Inc. 2,866 183,653
Vail Resorts Inc. 1,743 399,687
Wendy’s Co. (The) 7,494 125,450
Wyndham Worldwide Corp. 4,296 490,646
Wynn Resorts Ltd. 3,675 684,248
Yum! Brands Inc. 14,424 1,256,330
23,017,770
HOUSEHOLD DURABLES — 0.43%
DR Horton Inc. 14,794 653,007
Garmin Ltd. 4,794 281,264
Helen of Troy Ltd.a 1,151 102,612
Leggett & Platt Inc. 5,695 230,932
Lennar Corp. Class A 11,940 631,507
Lennar Corp. Class B 716 30,566
Mohawk Industries Inc.a 2,738 574,651
Newell Brands Inc. 20,954 578,959
NVR Inc.a 148 458,800
PulteGroup Inc. 11,568 351,205
Tempur Sealy International Inc.a,b 1,941 86,860
Toll Brothers Inc. 6,267 264,217
Tupperware Brands Corp. 2,247 100,126
Whirlpool Corp. 3,077 476,781
4,821,487
HOUSEHOLD PRODUCTS — 1.19%
Church & Dwight Co. Inc. 10,620 490,644
Clorox Co. (The) 5,597 655,968
Colgate-Palmolive Co. 38,034 2,480,958
Energizer Holdings Inc. 2,510 143,974
Kimberly-Clark Corp. 15,275 1,581,573
Procter & Gamble Co. (The) 109,506 7,921,664
Spectrum Brands Holdings Inc. 1,036 74,696
13,349,477
INDEPENDENT POWER AND RENEWABLE ELECTRICITY
PRODUCERS — 0.10%
AES Corp./VA 29,160 356,918
NRG Energy Inc. 12,986 402,566
Vistra Energy Corp.a 16,116 368,251
1,127,735
INDUSTRIAL CONGLOMERATES — 1.47%
3M Co. 25,885 5,031,785
Carlisle Companies Inc. 2,683 289,040
General Electric Co. 377,471 5,311,017
Security Shares Value
Honeywell International Inc. 32,699 $ 4,730,891
Roper Technologies Inc. 4,477 1,182,779
16,545,512
INSURANCE — 2.82%
Aflac Inc. 33,808 1,540,631
Alleghany Corp. 664 381,581
Allstate Corp. (The) 15,431 1,509,460
American Financial Group Inc./OH 2,969 336,150
American International Group Inc. 38,996 2,183,776
AmTrust Financial Services Inc. 3,660 47,177
Aon PLC 10,718 1,526,994
Arch Capital Group Ltd.a 5,949 476,693
Arthur J Gallagher & Co. 7,826 547,742
Aspen Insurance Holdings Ltd. 2,538 107,738
Assurant Inc. 2,335 216,735
Assured Guaranty Ltd. 5,015 181,994
Athene Holding Ltd. Class A NVSa 5,471 268,079
Axis Capital Holdings Ltd. 3,626 212,846
Brighthouse Financial Inc.a 4,070 206,675
Brown & Brown Inc. 10,083 274,560
Chubb Ltd. 20,124 2,730,223
Cincinnati Financial Corp. 6,505 457,562
CNO Financial Group Inc. 7,319 156,919
Erie Indemnity Co. Class A NVS 783 91,431
Everest Re Group Ltd. 1,779 413,920
First American Financial Corp. 4,893 250,081
FNF Group 11,833 435,809
Genworth Financial Inc. Class Aa 20,914 57,723
Hanover Insurance Group Inc. (The) 1,851 212,587
Hartford Financial Services Group
Inc. (The) 15,472 833,013
Kemper Corp. 2,012 135,810
Lincoln National Corp. 9,421 665,500
Loews Corp. 11,665 611,946
Markel Corp.a 610 689,324
Marsh & McLennan Companies Inc. 22,006 1,793,489
Mercury General Corp. 1,558 71,247
MetLife Inc. 45,132 2,151,443
Old Republic International Corp. 10,688 218,035
Primerica Inc. 1,894 183,245
Principal Financial Group Inc. 11,744 695,480
ProAssurance Corp. 2,393 113,189
Progressive Corp. (The) 25,351 1,528,412
Prudential Financial Inc. 18,305 1,946,188
Reinsurance Group of America Inc. 2,790 416,826
S C H E D U L E S O F I N V E S T M E N T S 27
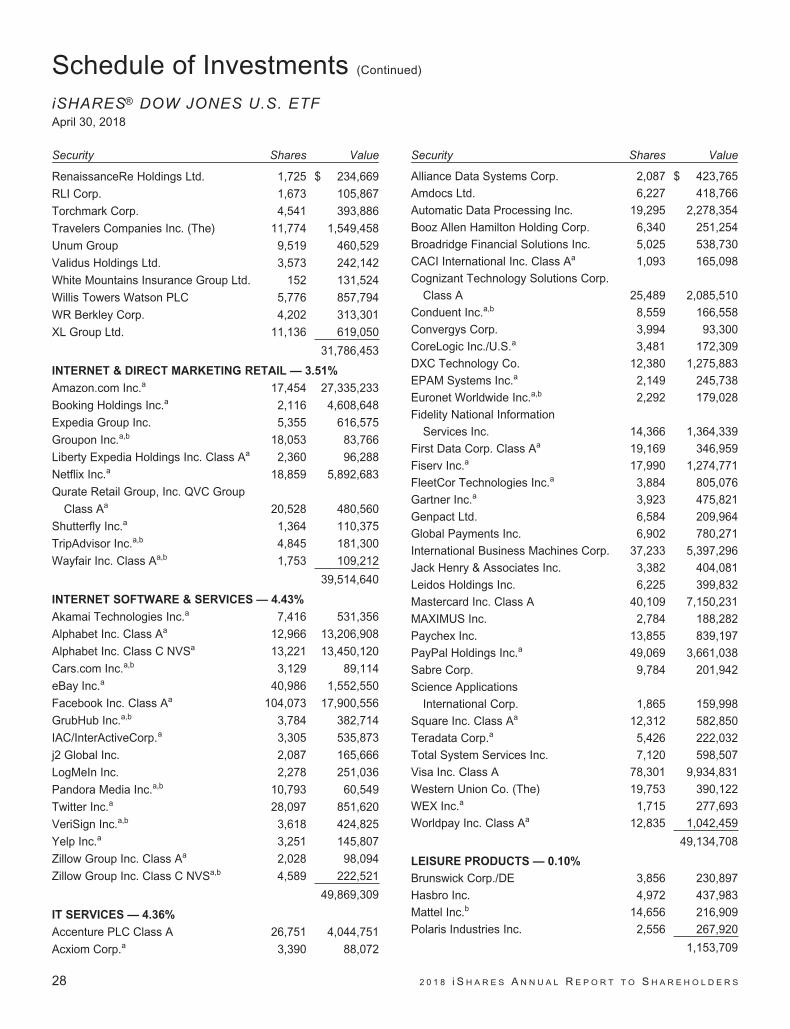
Schedule of Investments (Continued)
iSHARES® DOW JONES U.S. ETFApril 30, 2018
Security Shares Value
RenaissanceRe Holdings Ltd. 1,725 $ 234,669
RLI Corp. 1,673 105,867
Torchmark Corp. 4,541 393,886
Travelers Companies Inc. (The) 11,774 1,549,458
Unum Group 9,519 460,529
Validus Holdings Ltd. 3,573 242,142
White Mountains Insurance Group Ltd. 152 131,524
Willis Towers Watson PLC 5,776 857,794
WR Berkley Corp. 4,202 313,301
XL Group Ltd. 11,136 619,050
31,786,453
INTERNET & DIRECT MARKETING RETAIL — 3.51%
Amazon.com Inc.a 17,454 27,335,233
Booking Holdings Inc.a 2,116 4,608,648
Expedia Group Inc. 5,355 616,575
Groupon Inc.a,b 18,053 83,766
Liberty Expedia Holdings Inc. Class Aa 2,360 96,288
Netflix Inc.a 18,859 5,892,683
Qurate Retail Group, Inc. QVC Group
Class Aa 20,528 480,560
Shutterfly Inc.a 1,364 110,375
TripAdvisor Inc.a,b 4,845 181,300
Wayfair Inc. Class Aa,b 1,753 109,212
39,514,640
INTERNET SOFTWARE & SERVICES — 4.43%
Akamai Technologies Inc.a 7,416 531,356
Alphabet Inc. Class Aa 12,966 13,206,908
Alphabet Inc. Class C NVSa 13,221 13,450,120
Cars.com Inc.a,b 3,129 89,114
eBay Inc.a 40,986 1,552,550
Facebook Inc. Class Aa 104,073 17,900,556
GrubHub Inc.a,b 3,784 382,714
IAC/InterActiveCorp.a 3,305 535,873
j2 Global Inc. 2,087 165,666
LogMeIn Inc. 2,278 251,036
Pandora Media Inc.a,b 10,793 60,549
Twitter Inc.a 28,097 851,620
VeriSign Inc.a,b 3,618 424,825
Yelp Inc.a 3,251 145,807
Zillow Group Inc. Class Aa 2,028 98,094
Zillow Group Inc. Class C NVSa,b 4,589 222,521
49,869,309
IT SERVICES — 4.36%
Accenture PLC Class A 26,751 4,044,751
Acxiom Corp.a 3,390 88,072
Security Shares Value
Alliance Data Systems Corp. 2,087 $ 423,765
Amdocs Ltd. 6,227 418,766
Automatic Data Processing Inc. 19,295 2,278,354
Booz Allen Hamilton Holding Corp. 6,340 251,254
Broadridge Financial Solutions Inc. 5,025 538,730
CACI International Inc. Class Aa 1,093 165,098
Cognizant Technology Solutions Corp.
Class A 25,489 2,085,510
Conduent Inc.a,b 8,559 166,558
Convergys Corp. 3,994 93,300
CoreLogic Inc./U.S.a 3,481 172,309
DXC Technology Co. 12,380 1,275,883
EPAM Systems Inc.a 2,149 245,738
Euronet Worldwide Inc.a,b 2,292 179,028
Fidelity National Information
Services Inc. 14,366 1,364,339
First Data Corp. Class Aa 19,169 346,959
Fiserv Inc.a 17,990 1,274,771
FleetCor Technologies Inc.a 3,884 805,076
Gartner Inc.a 3,923 475,821
Genpact Ltd. 6,584 209,964
Global Payments Inc. 6,902 780,271
International Business Machines Corp. 37,233 5,397,296
Jack Henry & Associates Inc. 3,382 404,081
Leidos Holdings Inc. 6,225 399,832
Mastercard Inc. Class A 40,109 7,150,231
MAXIMUS Inc. 2,784 188,282
Paychex Inc. 13,855 839,197
PayPal Holdings Inc.a 49,069 3,661,038
Sabre Corp. 9,784 201,942
Science Applications
International Corp. 1,865 159,998
Square Inc. Class Aa 12,312 582,850
Teradata Corp.a 5,426 222,032
Total System Services Inc. 7,120 598,507
Visa Inc. Class A 78,301 9,934,831
Western Union Co. (The) 19,753 390,122
WEX Inc.a 1,715 277,693
Worldpay Inc. Class Aa 12,835 1,042,459
49,134,708
LEISURE PRODUCTS — 0.10%
Brunswick Corp./DE 3,856 230,897
Hasbro Inc. 4,972 437,983
Mattel Inc.b 14,656 216,909
Polaris Industries Inc. 2,556 267,920
1,153,709
28 2 0 1 8 i S H A R E S A N N U A L R E P O R T T O S H A R E H O L D E R S

Schedule of Investments (Continued)
iSHARES® DOW JONES U.S. ETFApril 30, 2018
Security Shares Value
LIFE SCIENCES TOOLS & SERVICES — 0.84%
Agilent Technologies Inc. 14,005 $ 920,689
Bio-Rad Laboratories Inc. Class Aa 859 217,937
Bio-Techne Corp. 1,637 247,039
Bruker Corp. 4,380 129,341
Charles River Laboratories
International Inc.a 2,088 217,549
Illumina Inc.a 6,403 1,542,675
IQVIA Holdings Inc.a 6,315 604,724
Mettler-Toledo International Inc.a 1,103 617,603
PerkinElmer Inc. 4,787 351,174
PRA Health Sciences Inc.a 2,134 175,351
Syneos Health Inc.a 2,430 92,583
Thermo Fisher Scientific Inc. 17,428 3,665,980
Waters Corp.a 3,432 646,623
9,429,268
MACHINERY — 1.84%
Actuant Corp. Class Ab 2,557 60,217
AGCO Corp. 2,803 175,692
Allison Transmission Holdings Inc. 5,814 226,688
Barnes Group Inc. 2,136 118,612
Caterpillar Inc. 25,925 3,742,533
Colfax Corp.a 4,257 132,010
Crane Co. 2,220 185,681
Cummins Inc. 6,736 1,076,817
Deere & Co. 14,102 1,908,424
Donaldson Co. Inc. 5,570 246,528
Dover Corp. 6,715 622,480
Flowserve Corp. 5,567 247,230
Fortive Corp. 13,336 937,654
Graco Inc. 7,463 328,297
Hillenbrand Inc. 2,788 129,224
IDEX Corp. 3,353 448,162
Illinois Tool Works Inc. 13,383 1,900,654
Ingersoll-Rand PLC 10,791 905,257
ITT Inc. 3,812 186,369
Kennametal Inc. 3,518 128,231
Lincoln Electric Holdings Inc. 2,707 224,329
Middleby Corp. (The)a,b 2,467 310,447
Mueller Industries Inc. 2,539 69,010
Nordson Corp. 2,192 281,891
Oshkosh Corp. 3,297 237,912
PACCAR Inc. 15,284 973,132
Parker-Hannifin Corp. 5,761 948,376
Pentair PLC 7,245 487,444
Security Shares Value
Snap-on Inc. 2,494 $ 362,253
Stanley Black & Decker Inc. 6,633 939,166
Terex Corp. 3,417 124,789
Timken Co. (The) 2,913 124,531
Toro Co. (The) 4,710 275,017
Trinity Industries Inc. 6,450 205,562
WABCO Holdings Inc.a 2,181 281,327
Wabtec Corp./DEb 3,707 329,219
Welbilt Inc.a 6,046 115,841
Woodward Inc. 2,469 177,620
Xylem Inc./NY 7,801 568,693
20,743,319
MARINE — 0.02%
Kirby Corp.a 2,312 197,214
197,214
MEDIA — 2.57%
AMC Networks Inc. Class Aa 2,238 116,376
Cable One Inc. 203 128,929
CBS Corp. Class A 309 15,292
CBS Corp. Class B NVS 15,026 739,279
Charter Communications Inc. Class Aa 8,064 2,187,683
Cinemark Holdings Inc. 4,560 178,615
Comcast Corp. Class A 201,408 6,322,197
Discovery Inc. Class Aa,b 6,832 161,577
Discovery Inc. Class C NVSa 13,373 297,148
DISH Network Corp. Class Aa 9,846 330,333
GCI Liberty Inc. Class Aa 4,253 189,684
Interpublic Group of Companies
Inc. (The) 16,549 390,391
John Wiley & Sons Inc. Class A 1,902 125,437
Liberty Broadband Corp. Class Aa 1,143 80,559
Liberty Broadband Corp. Class C NVSa 6,606 468,299
Liberty Global PLC Series Aa 9,726 293,142
Liberty Global PLC Series C NVSa,b 25,718 748,394
Liberty Latin America Ltd. Class Aa 2,363 43,479
Liberty Latin America Ltd.
Class C NVSa 4,953 89,451
Liberty Media Corp.-Liberty Formula
One Class Aa 1,021 28,700
Liberty Media Corp.-Liberty Formula
One Class C NVSa,b 8,672 255,998
Liberty Media Corp.-Liberty SiriusXM
Class Aa 3,695 154,340
Liberty Media Corp.-Liberty SiriusXM
Class C NVSa 7,330 305,368
S C H E D U L E S O F I N V E S T M E N T S 29
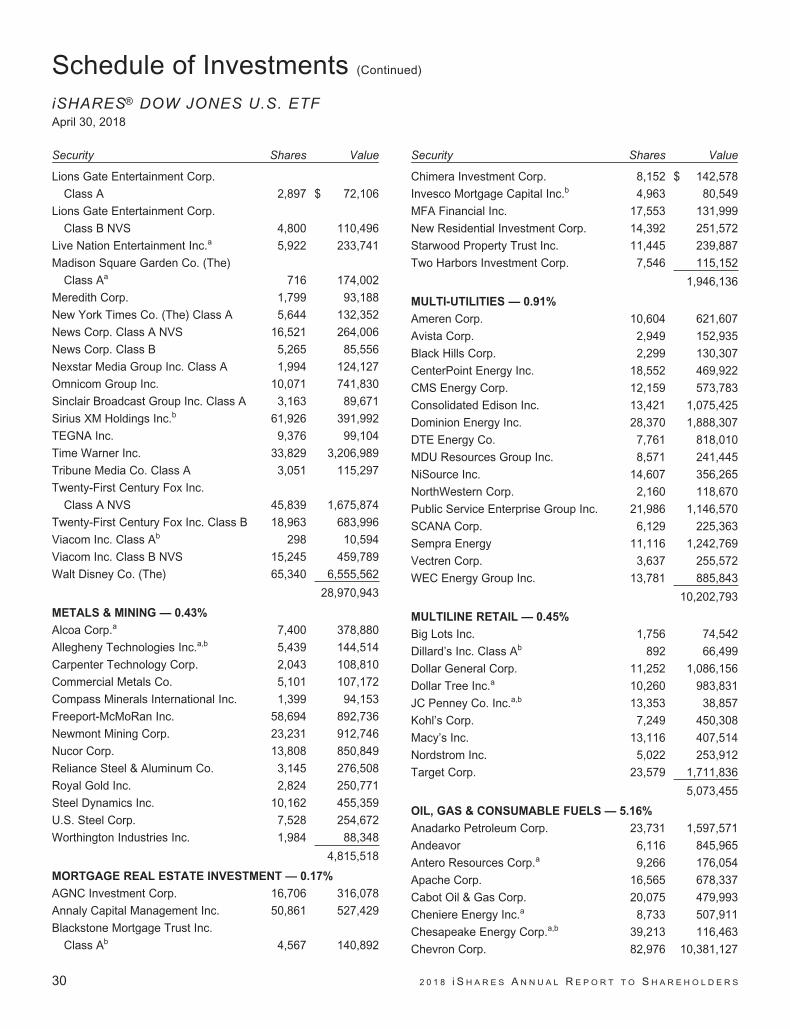
Schedule of Investments (Continued)
iSHARES® DOW JONES U.S. ETFApril 30, 2018
Security Shares Value
Lions Gate Entertainment Corp.
Class A 2,897 $ 72,106
Lions Gate Entertainment Corp.
Class B NVS 4,800 110,496
Live Nation Entertainment Inc.a 5,922 233,741
Madison Square Garden Co. (The)
Class Aa 716 174,002
Meredith Corp. 1,799 93,188
New York Times Co. (The) Class A 5,644 132,352
News Corp. Class A NVS 16,521 264,006
News Corp. Class B 5,265 85,556
Nexstar Media Group Inc. Class A 1,994 124,127
Omnicom Group Inc. 10,071 741,830
Sinclair Broadcast Group Inc. Class A 3,163 89,671
Sirius XM Holdings Inc.b 61,926 391,992
TEGNA Inc. 9,376 99,104
Time Warner Inc. 33,829 3,206,989
Tribune Media Co. Class A 3,051 115,297
Twenty-First Century Fox Inc.
Class A NVS 45,839 1,675,874
Twenty-First Century Fox Inc. Class B 18,963 683,996
Viacom Inc. Class Ab 298 10,594
Viacom Inc. Class B NVS 15,245 459,789
Walt Disney Co. (The) 65,340 6,555,562
28,970,943
METALS & MINING — 0.43%
Alcoa Corp.a 7,400 378,880
Allegheny Technologies Inc.a,b 5,439 144,514
Carpenter Technology Corp. 2,043 108,810
Commercial Metals Co. 5,101 107,172
Compass Minerals International Inc. 1,399 94,153
Freeport-McMoRan Inc. 58,694 892,736
Newmont Mining Corp. 23,231 912,746
Nucor Corp. 13,808 850,849
Reliance Steel & Aluminum Co. 3,145 276,508
Royal Gold Inc. 2,824 250,771
Steel Dynamics Inc. 10,162 455,359
U.S. Steel Corp. 7,528 254,672
Worthington Industries Inc. 1,984 88,348
4,815,518
MORTGAGE REAL ESTATE INVESTMENT — 0.17%
AGNC Investment Corp. 16,706 316,078
Annaly Capital Management Inc. 50,861 527,429
Blackstone Mortgage Trust Inc.
Class Ab 4,567 140,892
Security Shares Value
Chimera Investment Corp. 8,152 $ 142,578
Invesco Mortgage Capital Inc.b 4,963 80,549
MFA Financial Inc. 17,553 131,999
New Residential Investment Corp. 14,392 251,572
Starwood Property Trust Inc. 11,445 239,887
Two Harbors Investment Corp. 7,546 115,152
1,946,136
MULTI-UTILITIES — 0.91%
Ameren Corp. 10,604 621,607
Avista Corp. 2,949 152,935
Black Hills Corp. 2,299 130,307
CenterPoint Energy Inc. 18,552 469,922
CMS Energy Corp. 12,159 573,783
Consolidated Edison Inc. 13,421 1,075,425
Dominion Energy Inc. 28,370 1,888,307
DTE Energy Co. 7,761 818,010
MDU Resources Group Inc. 8,571 241,445
NiSource Inc. 14,607 356,265
NorthWestern Corp. 2,160 118,670
Public Service Enterprise Group Inc. 21,986 1,146,570
SCANA Corp. 6,129 225,363
Sempra Energy 11,116 1,242,769
Vectren Corp. 3,637 255,572
WEC Energy Group Inc. 13,781 885,843
10,202,793
MULTILINE RETAIL — 0.45%
Big Lots Inc. 1,756 74,542
Dillard’s Inc. Class Ab 892 66,499
Dollar General Corp. 11,252 1,086,156
Dollar Tree Inc.a 10,260 983,831
JC Penney Co. Inc.a,b 13,353 38,857
Kohl’s Corp. 7,249 450,308
Macy’s Inc. 13,116 407,514
Nordstrom Inc. 5,022 253,912
Target Corp. 23,579 1,711,836
5,073,455
OIL, GAS & CONSUMABLE FUELS — 5.16%
Anadarko Petroleum Corp. 23,731 1,597,571
Andeavor 6,116 845,965
Antero Resources Corp.a 9,266 176,054
Apache Corp. 16,565 678,337
Cabot Oil & Gas Corp. 20,075 479,993
Cheniere Energy Inc.a 8,733 507,911
Chesapeake Energy Corp.a,b 39,213 116,463
Chevron Corp. 82,976 10,381,127
30 2 0 1 8 i S H A R E S A N N U A L R E P O R T T O S H A R E H O L D E R S

Schedule of Investments (Continued)
iSHARES® DOW JONES U.S. ETFApril 30, 2018
Security Shares Value
Cimarex Energy Co. 4,205 $ 422,981
CNX Resources Corp.a 8,938 132,819
Concho Resources Inc.a 6,457 1,015,105
ConocoPhillips 51,097 3,346,854
CONSOL Energy Inc.a 1,116 35,098
Continental Resources Inc./OKa,b 3,726 246,140
Devon Energy Corp. 23,004 835,735
Diamondback Energy Inc.a 4,224 542,573
Energen Corp.a 4,277 279,887
EOG Resources Inc. 25,181 2,975,639
EQT Corp. 10,640 534,022
Exxon Mobil Corp. 184,056 14,310,354
Gulfport Energy Corp.a 7,340 68,262
Hess Corp. 11,589 660,457
HollyFrontier Corp. 7,770 471,561
Kinder Morgan Inc./DE 82,595 1,306,653
Marathon Oil Corp. 36,965 674,611
Marathon Petroleum Corp. 20,653 1,547,116
Murphy Oil Corp. 6,915 208,211
Newfield Exploration Co.a 8,613 256,667
Noble Energy Inc. 21,428 724,909
Oasis Petroleum Inc.a 11,645 128,444
Occidental Petroleum Corp. 33,191 2,564,337
ONEOK Inc. 17,773 1,070,290
Parsley Energy Inc. Class Aa 10,259 308,078
PBF Energy Inc. Class A 4,676 179,231
PDC Energy Inc.a 2,843 152,214
Phillips 66 18,264 2,032,966
Pioneer Natural Resources Co. 7,372 1,485,827
QEP Resources Inc.a 10,003 121,837
Range Resources Corp. 9,754 135,093
RSP Permian Inc.a 5,409 268,340
SemGroup Corp. Class A 2,852 71,728
SM Energy Co. 4,633 110,960
Southwestern Energy Co.a 22,553 92,467
Targa Resources Corp. 9,285 436,116
Valero Energy Corp. 18,844 2,090,365
Whiting Petroleum Corp.a 3,916 159,851
Williams Companies Inc. (The) 35,880 923,192
World Fuel Services Corp. 2,948 63,294
WPX Energy Inc.a 17,393 297,246
58,070,951
PAPER & FOREST PRODUCTS — 0.04%
Domtar Corp. 2,748 120,637
KapStone Paper and Packaging Corp. 3,926 135,133
Security Shares Value
Louisiana-Pacific Corp. 6,234 $ 176,609
432,379
PERSONAL PRODUCTS — 0.21%
Avon Products Inc.a 19,038 48,166
Coty Inc. Class A 20,368 353,385
Edgewell Personal Care Co.a 2,468 108,715
Estee Lauder Companies Inc. (The)
Class A 9,725 1,440,175
Herbalife Nutrition Ltd.a,b 2,685 283,885
Nu Skin Enterprises Inc. Class A 2,178 154,965
2,389,291
PHARMACEUTICALS — 4.01%
Akorn Inc.a 4,170 60,173
Allergan PLC 14,329 2,201,651
Bristol-Myers Squibb Co. 70,819 3,691,795
Catalent Inc.a 5,756 236,629
Eli Lilly & Co. 41,817 3,390,104
Endo International PLCa 8,762 50,206
Horizon Pharma PLCa 6,857 90,787
Impax Laboratories Inc.a,b 2,993 56,269
Jazz Pharmaceuticals PLCa 2,634 400,473
Johnson & Johnson 116,538 14,740,892
Mallinckrodt PLCa 3,510 45,630
Medicines Co. (The)a 2,758 82,988
Merck & Co. Inc. 117,151 6,896,679
Mylan NVa 22,411 868,650
Nektar Therapeuticsa 7,006 586,122
Pacira Pharmaceuticals Inc./DEa 1,751 57,958
Perrigo Co. PLC 5,724 447,273
Pfizer Inc. 258,577 9,466,504
Prestige Brands Holdings Inc.a 2,174 64,003
Zoetis Inc. 21,163 1,766,687
45,201,473
PROFESSIONAL SERVICES — 0.39%
CoStar Group Inc.a 1,580 579,323
Dun & Bradstreet Corp. (The) 1,578 181,959
Equifax Inc. 5,227 585,685
FTI Consulting Inc.a 1,656 96,710
IHS Markit Ltd.a 15,691 770,899
ManpowerGroup Inc. 2,868 274,525
Nielsen Holdings PLC 14,509 456,308
Robert Half International Inc. 5,434 330,116
TransUniona 6,441 418,085
Verisk Analytics Inc. Class Aa 6,758 719,389
4,412,999
S C H E D U L E S O F I N V E S T M E N T S 31
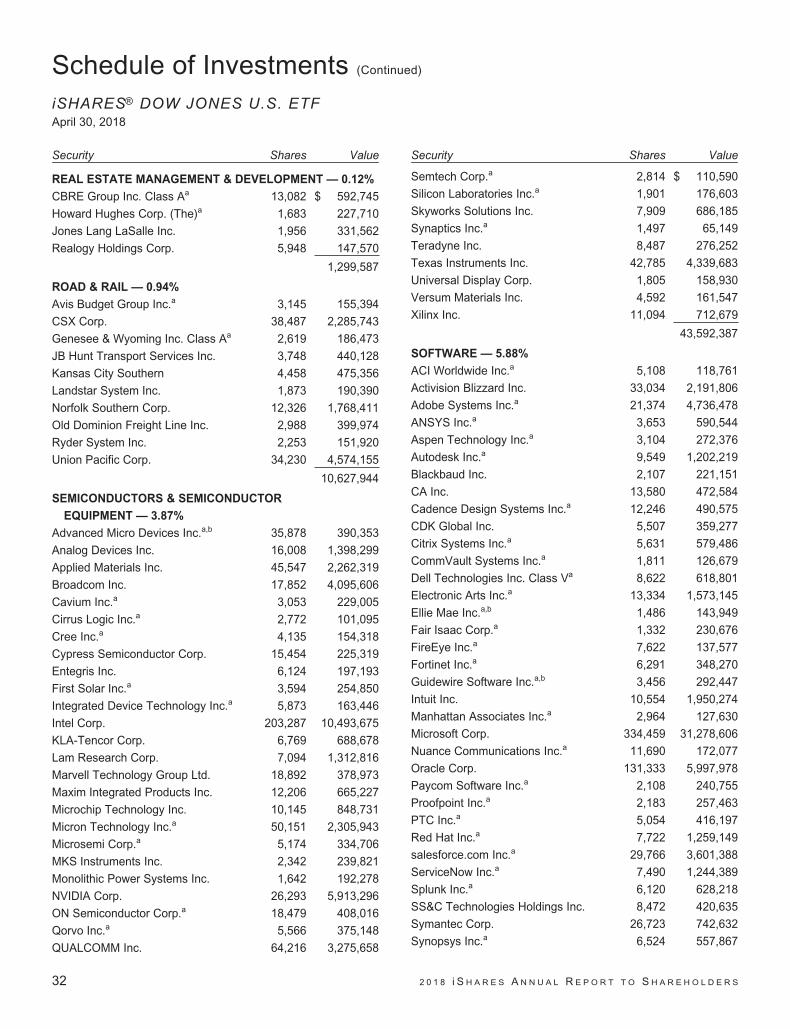
Schedule of Investments (Continued)
iSHARES® DOW JONES U.S. ETFApril 30, 2018
Security Shares Value
REAL ESTATE MANAGEMENT & DEVELOPMENT — 0.12%
CBRE Group Inc. Class Aa 13,082 $ 592,745
Howard Hughes Corp. (The)a 1,683 227,710
Jones Lang LaSalle Inc. 1,956 331,562
Realogy Holdings Corp. 5,948 147,570
1,299,587
ROAD & RAIL — 0.94%
Avis Budget Group Inc.a 3,145 155,394
CSX Corp. 38,487 2,285,743
Genesee & Wyoming Inc. Class Aa 2,619 186,473
JB Hunt Transport Services Inc. 3,748 440,128
Kansas City Southern 4,458 475,356
Landstar System Inc. 1,873 190,390
Norfolk Southern Corp. 12,326 1,768,411
Old Dominion Freight Line Inc. 2,988 399,974
Ryder System Inc. 2,253 151,920
Union Pacific Corp. 34,230 4,574,155
10,627,944
SEMICONDUCTORS & SEMICONDUCTOR
EQUIPMENT — 3.87%
Advanced Micro Devices Inc.a,b 35,878 390,353
Analog Devices Inc. 16,008 1,398,299
Applied Materials Inc. 45,547 2,262,319
Broadcom Inc. 17,852 4,095,606
Cavium Inc.a 3,053 229,005
Cirrus Logic Inc.a 2,772 101,095
Cree Inc.a 4,135 154,318
Cypress Semiconductor Corp. 15,454 225,319
Entegris Inc. 6,124 197,193
First Solar Inc.a 3,594 254,850
Integrated Device Technology Inc.a 5,873 163,446
Intel Corp. 203,287 10,493,675
KLA-Tencor Corp. 6,769 688,678
Lam Research Corp. 7,094 1,312,816
Marvell Technology Group Ltd. 18,892 378,973
Maxim Integrated Products Inc. 12,206 665,227
Microchip Technology Inc. 10,145 848,731
Micron Technology Inc.a 50,151 2,305,943
Microsemi Corp.a 5,174 334,706
MKS Instruments Inc. 2,342 239,821
Monolithic Power Systems Inc. 1,642 192,278
NVIDIA Corp. 26,293 5,913,296
ON Semiconductor Corp.a 18,479 408,016
Qorvo Inc.a 5,566 375,148
QUALCOMM Inc. 64,216 3,275,658
Security Shares Value
Semtech Corp.a 2,814 $ 110,590
Silicon Laboratories Inc.a 1,901 176,603
Skyworks Solutions Inc. 7,909 686,185
Synaptics Inc.a 1,497 65,149
Teradyne Inc. 8,487 276,252
Texas Instruments Inc. 42,785 4,339,683
Universal Display Corp. 1,805 158,930
Versum Materials Inc. 4,592 161,547
Xilinx Inc. 11,094 712,679
43,592,387
SOFTWARE — 5.88%
ACI Worldwide Inc.a 5,108 118,761
Activision Blizzard Inc. 33,034 2,191,806
Adobe Systems Inc.a 21,374 4,736,478
ANSYS Inc.a 3,653 590,544
Aspen Technology Inc.a 3,104 272,376
Autodesk Inc.a 9,549 1,202,219
Blackbaud Inc. 2,107 221,151
CA Inc. 13,580 472,584
Cadence Design Systems Inc.a 12,246 490,575
CDK Global Inc. 5,507 359,277
Citrix Systems Inc.a 5,631 579,486
CommVault Systems Inc.a 1,811 126,679
Dell Technologies Inc. Class Va 8,622 618,801
Electronic Arts Inc.a 13,334 1,573,145
Ellie Mae Inc.a,b 1,486 143,949
Fair Isaac Corp.a 1,332 230,676
FireEye Inc.a 7,622 137,577
Fortinet Inc.a 6,291 348,270
Guidewire Software Inc.a,b 3,456 292,447
Intuit Inc. 10,554 1,950,274
Manhattan Associates Inc.a 2,964 127,630
Microsoft Corp. 334,459 31,278,606
Nuance Communications Inc.a 11,690 172,077
Oracle Corp. 131,333 5,997,978
Paycom Software Inc.a 2,108 240,755
Proofpoint Inc.a 2,183 257,463
PTC Inc.a 5,054 416,197
Red Hat Inc.a 7,722 1,259,149
salesforce.com Inc.a 29,766 3,601,388
ServiceNow Inc.a 7,490 1,244,389
Splunk Inc.a 6,120 628,218
SS&C Technologies Holdings Inc. 8,472 420,635
Symantec Corp. 26,723 742,632
Synopsys Inc.a 6,524 557,867
32 2 0 1 8 i S H A R E S A N N U A L R E P O R T T O S H A R E H O L D E R S

Schedule of Investments (Continued)
iSHARES® DOW JONES U.S. ETFApril 30, 2018
Security Shares Value
Tableau Software Inc. Class Aa 2,950 $ 250,897
Take-Two Interactive Software Inc.a 4,928 491,371
Tyler Technologies Inc.a 1,531 335,166
Ultimate Software Group Inc. (The)a 1,273 305,418
Verint Systems Inc.a 2,804 118,048
VMware Inc. Class Aa,b 2,964 394,983
Workday Inc. Class Aa 5,964 744,546
66,242,488
SPECIALTY RETAIL — 2.10%
Aaron’s Inc. 2,576 107,600
Advance Auto Parts Inc. 3,194 365,553
American Eagle Outfitters Inc. 7,340 151,791
AutoNation Inc.a 2,572 118,801
AutoZone Inc.a 1,193 745,052
Bed Bath & Beyond Inc. 6,186 108,008
Best Buy Co. Inc. 11,030 844,126
Burlington Stores Inc.a 2,947 400,350
CarMax Inc.a 7,904 494,000
Dick’s Sporting Goods Inc. 3,435 113,664
Five Below Inc.a 2,472 174,548
Foot Locker Inc. 5,378 231,684
GameStop Corp. Class A 4,340 59,241
Gap Inc. (The) 9,380 274,271
Home Depot Inc. (The) 50,724 9,373,795
L Brands Inc. 10,584 369,487
Lithia Motors Inc. Class A 1,078 103,337
Lowe’s Companies Inc. 36,077 2,973,827
Murphy USA Inc.a 1,450 90,727
O’Reilly Automotive Inc.a 3,630 929,534
Office Depot Inc. 23,058 52,803
Ross Stores Inc. 16,637 1,345,101
Sally Beauty Holdings Inc.a 5,677 98,155
Signet Jewelers Ltd. 2,614 101,632
Tiffany & Co. 4,409 453,378
TJX Companies Inc. (The) 27,429 2,327,351
Tractor Supply Co. 5,463 371,484
Ulta Salon Cosmetics & Fragrance Inc.a 2,527 634,050
Urban Outfitters Inc.a 3,375 135,911
Williams-Sonoma Inc. 3,286 157,071
23,706,332
TECHNOLOGY HARDWARE, STORAGE &
PERIPHERALS — 3.75%
3D Systems Corp.a,b 4,861 48,804
Apple Inc. 220,402 36,423,634
Diebold Nixdorf Inc. 3,163 48,552
Security Shares Value
Electronics For Imaging Inc.a,b 2,111 $ 58,475
Hewlett Packard Enterprise Co. 68,220 1,163,151
HP Inc. 71,287 1,531,958
NCR Corp.a 5,122 157,604
NetApp Inc. 11,584 771,263
Seagate Technology PLC 12,400 717,836
Western Digital Corp. 12,867 1,013,791
Xerox Corp. 9,426 296,448
42,231,516
TEXTILES, APPAREL & LUXURY GOODS — 0.77%
Carter’s Inc. 2,064 207,061
Deckers Outdoor Corp.a 1,405 131,030
Hanesbrands Inc. 15,755 290,995
Lululemon Athletica Inc.a 4,164 415,567
Michael Kors Holdings Ltd.a 6,631 453,693
NIKE Inc. Class B 56,300 3,850,357
PVH Corp. 3,361 536,651
Ralph Lauren Corp. 2,396 263,201
Skechers U.S.A. Inc. Class Aa 5,960 169,860
Steven Madden Ltd. 2,297 110,830
Tapestry Inc. 12,446 669,221
Under Armour Inc. Class Aa,b 7,914 140,553
Under Armour Inc. Class C NVSa 8,041 123,429
VF Corp. 14,267 1,153,772
Wolverine World Wide Inc. 4,088 122,477
8,638,697
THRIFTS & MORTGAGE FINANCE — 0.08%
Capitol Federal Financial Inc. 5,708 71,179
Essent Group Ltd.a 3,570 117,667
MGIC Investment Corp.a 15,952 159,839
New York Community Bancorp. Inc. 21,408 254,327
Radian Group Inc. 9,294 132,904
Washington Federal Inc. 3,748 118,999
854,915
TOBACCO — 0.90%
Altria Group Inc. 82,619 4,635,752
Philip Morris International Inc. 67,485 5,533,770
10,169,522
TRADING COMPANIES & DISTRIBUTORS — 0.31%
Air Lease Corp. 4,258 177,516
Applied Industrial Technologies Inc. 1,758 112,424
Beacon Roofing Supply Inc.a 2,885 141,221
Fastenal Co. 12,383 619,026
GATX Corp. 1,709 111,495
HD Supply Holdings Inc.a 8,029 310,803
S C H E D U L E S O F I N V E S T M E N T S 33

Schedule of Investments (Continued)
iSHARES® DOW JONES U.S. ETFApril 30, 2018
Security Shares Value
MRC Global Inc.a 4,156 $ 77,842
MSC Industrial Direct Co. Inc.
Class A 2,017 174,350
NOW Inc.a 4,387 53,214
United Rentals Inc.a 3,656 548,400
Univar Inc.a 4,933 135,953
Watsco Inc. 1,394 233,384
WESCO International Inc.a 2,073 123,447
WW Grainger Inc. 2,215 623,190
3,442,265
TRANSPORTATION INFRASTRUCTURE — 0.01%
Macquarie Infrastructure Corp. 3,350 126,965
126,965
WATER UTILITIES — 0.08%
American Water Works Co. Inc. 7,733 669,523
Aqua America Inc. 7,603 267,246
936,769
WIRELESS TELECOMMUNICATION SERVICES — 0.09%
Sprint Corp.a,b 29,766 166,987
T-Mobile U.S. Inc.a 13,019 787,780
Telephone & Data Systems Inc. 4,118 112,545
1,067,312
TOTAL COMMON STOCKS
(Cost: $732,718,495) 1,124,731,665
SHORT-TERM INVESTMENTS — 1.16%
MONEY MARKET FUNDS — 1.16%
BlackRock Cash Funds: Institutional,
SL Agency Shares
1.93%c,e,f 12,287,014 12,288,242
BlackRock Cash Funds: Treasury,
SL Agency Shares
1.61%c,e 709,079 709,079
12,997,321
TOTAL SHORT-TERM INVESTMENTS
(Cost: $12,996,149) 12,997,321
Value
TOTAL INVESTMENTS
IN SECURITIES — 101.03%
(Cost: $745,714,644) $1,137,728,986
Other Assets Less Liabilities — (1.03)% (11,558,520)
NET ASSETS — 100.00% $1,126,170,466
NVS — Non-Voting Shares
a Non-income producing security.b All or a portion of this security is on loan.c Affiliate of the Fund.d Security is valued using significant unobservable inputs and is classified as
Level 3 in the fair value hierarchy.e Annualized 7-day yield as of period end.f All or a portion of this security was purchased with cash collateral received
from loaned securities.
34 2 0 1 8 i S H A R E S A N N U A L R E P O R T T O S H A R E H O L D E R S

Schedule of Investments (Continued)
iSHARES® DOW JONES U.S. ETFApril 30, 2018
Affiliates (Note 2)
Investments in issuers considered to be affiliates of the Fund during the year ended April 30, 2018, for purposes of
Section 2(a)(3) of the 1940 Act were as follows:
Affiliated issuer
Sharesheld at
04/30/17Shares
purchasedShares
sold
Sharesheld at
04/30/18Value at04/30/18 Income
Net realizedgain (loss) a
Change inunrealized
appreciation(depreciation)
BlackRock Cash Funds: Institutional,SL Agency Shares 22,121,552 — (9,834,538)b12,287,014 $12,288,242 $114,281c $ (6,523) $ (4,229)
BlackRock Cash Funds: Treasury,SL Agency Shares 1,579,277 — (870,198)b 709,079 709,079 14,895 — —
BlackRock Inc. 5,699 329 (662) 5,366 2,798,369 56,658 155,323 589,388PNC Financial Services Group
Inc. (The) 22,797 772 (3,111) 20,458 2,978,889 63,215 163,427 390,914
$18,774,579 $249,049 $ 312,227 $ 976,073
a Includes realized capital gain distributions from an affiliated fund, if any.b Net of purchases and sales.c Includes securities lending income earned from the reinvestment of cash collateral from loaned securities (excluding collateral investment fees), net of fees
and other payments to and from borrowers of securities, and less fees paid to BTC as securities lending agent.
Fair Value Measurements
Various inputs are used in determining the fair value of financial instruments. For description of the input levels and information about the Fund’spolicy regarding valuation of financial instruments, see Note 1.
The following table summarizes the value of the Fund’s investments according to the fair value hierarchy as of April 30, 2018. The breakdown ofthe Fund’s investments into major categories is disclosed in the Schedule of Investments above.
Level 1 Level 2 Level 3 Total
InvestmentsAssets
Common stocks $1,124,714,797 $ — $16,868 $1,124,731,665Money market funds 12,997,321 — — 12,997,321
Total $1,137,712,118 $ — $16,868 $1,137,728,986
See notes to financial statements.
S C H E D U L E S O F I N V E S T M E N T S 35

Schedule of InvestmentsiSHARES® TRANSPORTATION AVERAGE ETFApril 30, 2018
Security Shares Value
COMMON STOCKS — 99.99%
AIR FREIGHT & LOGISTICS — 30.39%
CH Robinson Worldwide Inc. 419,471 $ 38,603,916
Expeditors International of
Washington Inc. 477,364 30,484,465
FedEx Corp. 484,062 119,660,126
United Parcel Service Inc. Class B 498,613 56,592,576
245,341,083
AIRLINES — 18.53%
Alaska Air Group Inc. 472,080 30,652,154
American Airlines Group Inc. 504,080 21,640,154
Delta Air Lines Inc. 519,455 27,125,940
JetBlue Airways Corp.a 566,455 10,870,272
Southwest Airlines Co. 520,373 27,491,306
United Continental Holdings Inc.a 471,737 31,861,117
149,640,943
MARINE — 6.54%
Kirby Corp.a,b 443,302 37,813,661
Matson Inc. 511,611 14,954,389
52,768,050
ROAD & RAIL — 44.53%
Avis Budget Group Inc.a,b 518,332 25,610,784
CSX Corp. 520,297 30,900,439
JB Hunt Transport Services Inc. 497,618 58,435,282
Kansas City Southern 352,925 37,632,393
Landstar System Inc. 379,686 38,595,082
Norfolk Southern Corp. 492,764 70,696,851
Ryder System Inc. 471,984 31,825,881
Union Pacific Corp. 492,588 65,824,534
359,521,246
TOTAL COMMON STOCKS
(Cost: $875,534,775) 807,271,322
Security Shares Value
SHORT-TERM INVESTMENTS — 0.70%
MONEY MARKET FUNDS — 0.70%
BlackRock Cash Funds: Institutional,
SL Agency Shares
1.93%c,d,e 4,552,013 $ 4,552,468
BlackRock Cash Funds: Treasury,
SL Agency Shares
1.61%c,d 1,104,321 1,104,321
5,656,789
TOTAL SHORT-TERM INVESTMENTS
(Cost: $5,656,349) 5,656,789
TOTAL INVESTMENTS
IN SECURITIES — 100.69%
(Cost: $881,191,124) 812,928,111
Other Assets, Less Liabilities — (0.69)% (5,578,983)
NET ASSETS — 100.00% $807,349,128
a Non-income producing security.b All or a portion of this security is on loan.c Affiliate of the Fund.d Annualized 7-day yield as of period end.e All or a portion of this security was purchased with cash collateral received
from loaned securities.
36 2 0 1 8 i S H A R E S A N N U A L R E P O R T T O S H A R E H O L D E R S

Schedule of Investments (Continued)
iSHARES® TRANSPORTATION AVERAGE ETFApril 30, 2018
Affiliates (Note 2)
Investments in issuers considered to be affiliates of the Fund during the year ended April 30, 2018, for purposes of
Section 2(a)(3) of the 1940 Act were as follows:
Affiliated issuer
Sharesheld at
04/30/17Shares
purchasedShares
sold
Sharesheld at
04/30/18Value at04/30/18 Income
Net realizedgain (loss) a
Change inunrealized
appreciation(depreciation)
BlackRock Cash Funds: Institutional,SL Agency Shares 3,329,255 1,222,758b — 4,552,013 $4,552,468 $49,913c $ (3,445) $ (47)
BlackRock Cash Funds: Treasury,SL Agency Shares 1,356,987 — (252,666)b 1,104,321 1,104,321 10,315 — —
$5,656,789 $60,228 $ (3,445) $ (47)
a Includes realized capital gain distributions from an affiliated fund, if any.b Net of purchases and sales.c Includes securities lending income earned from the reinvestment of cash collateral from loaned securities (excluding collateral investment fees), net of fees
and other payments to and from borrowers of securities, and less fees paid to BTC as securities lending agent.
Fair Value Measurements
Various inputs are used in determining the fair value of financial instruments. For description of the input levels and information
about the Fund’s policy regarding valuation of financial instruments, see Note 1.
The following table summarizes the value of the Fund’s investments according to the fair value hierarchy as of April 30, 2018. The
breakdown of the Fund’s investments into major categories is disclosed in the Schedule of Investments above.
Level 1 Level 2 Level 3 Total
InvestmentsAssets
Common stocks $807,271,322 $ — $ — $807,271,322Money market funds 5,656,789 — — 5,656,789
Total $812,928,111 $ — $ — $812,928,111
See notes to financial statements.
S C H E D U L E S O F I N V E S T M E N T S 37

Schedule of InvestmentsiSHARES® U.S. ENERGY ETFApril 30, 2018
Security Shares Value
COMMON STOCKS — 99.85%
ELECTRIC UTILITIES — 0.42%
OGE Energy Corp. 138,143 $ 4,540,760
4,540,760
ENERGY EQUIPMENT & SERVICES — 14.34%
Baker Hughes a GE Co. 292,106 10,547,948
Core Laboratories NVa 30,542 3,739,868
Dril-Quip Inc.a,b 26,322 1,091,047
Ensco PLC Class Aa 300,924 1,700,221
Halliburton Co. 603,134 31,960,071
Helmerich & Payne Inc. 75,290 5,236,420
Nabors Industries Ltd. 217,779 1,657,298
National Oilwell Varco Inc.a 262,694 10,158,377
Oceaneering International Inc. 67,936 1,442,961
Patterson-UTI Energy Inc. 153,413 3,286,106
Rowan Companies PLCb 78,437 1,132,630
Schlumberger Ltd. 956,627 65,586,347
Superior Energy Services Inc.b 106,680 1,144,676
TechnipFMC PLC 303,064 9,988,989
Transocean Ltd.a,b 300,890 3,722,009
U.S. Silica Holdings Inc. 55,580 1,673,514
Weatherford International PLCa,b 685,014 2,020,791
156,089,273
OIL, GAS & CONSUMABLE FUELS — 84.72%
Anadarko Petroleum Corp. 356,257 23,983,221
Andeavor 97,790 13,526,313
Antero Resources Corp.b 148,549 2,822,431
Apache Corp. 263,670 10,797,286
Cabot Oil & Gas Corp. 318,513 7,615,646
Cheniere Energy Inc.b 139,649 8,121,986
Chesapeake Energy Corp.a,b 627,510 1,863,705
Chevron Corp. 1,320,435 165,199,623
Cimarex Energy Co. 65,984 6,637,331
CNX Resources Corp.b 138,983 2,065,287
Concho Resources Inc.a,b 103,050 16,200,490
ConocoPhillips 811,912 53,180,236
Continental Resources Inc./OKa,b 59,726 3,945,500
Devon Energy Corp. 363,662 13,211,840
Diamondback Energy Inc.b 67,854 8,715,846
Energen Corp.b 67,245 4,400,513
EOG Resources Inc. 399,968 47,264,219
EQT Corp. 169,243 8,494,306
Exxon Mobil Corp. 2,928,961 227,726,718
Security Shares Value
Gulfport Energy Corp.b 113,655 $ 1,056,992
Hess Corp. 185,109 10,549,362
HollyFrontier Corp. 122,608 7,441,080
Kinder Morgan Inc./DE 1,311,438 20,746,949
Marathon Oil Corp. 587,327 10,718,718
Marathon Petroleum Corp. 327,926 24,564,937
Murphy Oil Corp. 112,339 3,382,527
Newfield Exploration Co.b 138,254 4,119,969
Noble Energy Inc. 340,216 11,509,507
Oasis Petroleum Inc.a,b 182,807 2,016,361
Occidental Petroleum Corp. 528,899 40,862,737
ONEOK Inc. 283,853 17,093,628
Parsley Energy Inc. Class Ab 172,970 5,194,289
PBF Energy Inc. Class A 76,384 2,927,799
PDC Energy Inc.a,b 45,479 2,434,946
Phillips 66 290,208 32,303,052
Pioneer Natural Resources Co. 117,723 23,727,071
QEP Resources Inc.b 166,180 2,024,072
Range Resources Corp. 156,095 2,161,916
RSP Permian Inc.b 86,702 4,301,286
SemGroup Corp. Class A 45,610 1,147,091
SM Energy Co.a 71,243 1,706,270
Southwestern Energy Co.a,b 354,035 1,451,543
Targa Resources Corp. 149,053 7,001,019
Valero Energy Corp. 299,436 33,216,435
Whiting Petroleum Corp.b 62,591 2,554,965
Williams Companies Inc. (The) 571,882 14,714,524
World Fuel Services Corp. 46,615 1,000,824
WPX Energy Inc.b 275,565 4,709,406
922,411,772
SEMICONDUCTORS & SEMICONDUCTOR
EQUIPMENT — 0.37%
First Solar Inc.b 56,389 3,998,544
3,998,544
TOTAL COMMON STOCKS
(Cost: $1,298,093,407) 1,087,040,349
38 2 0 1 8 i S H A R E S A N N U A L R E P O R T T O S H A R E H O L D E R S
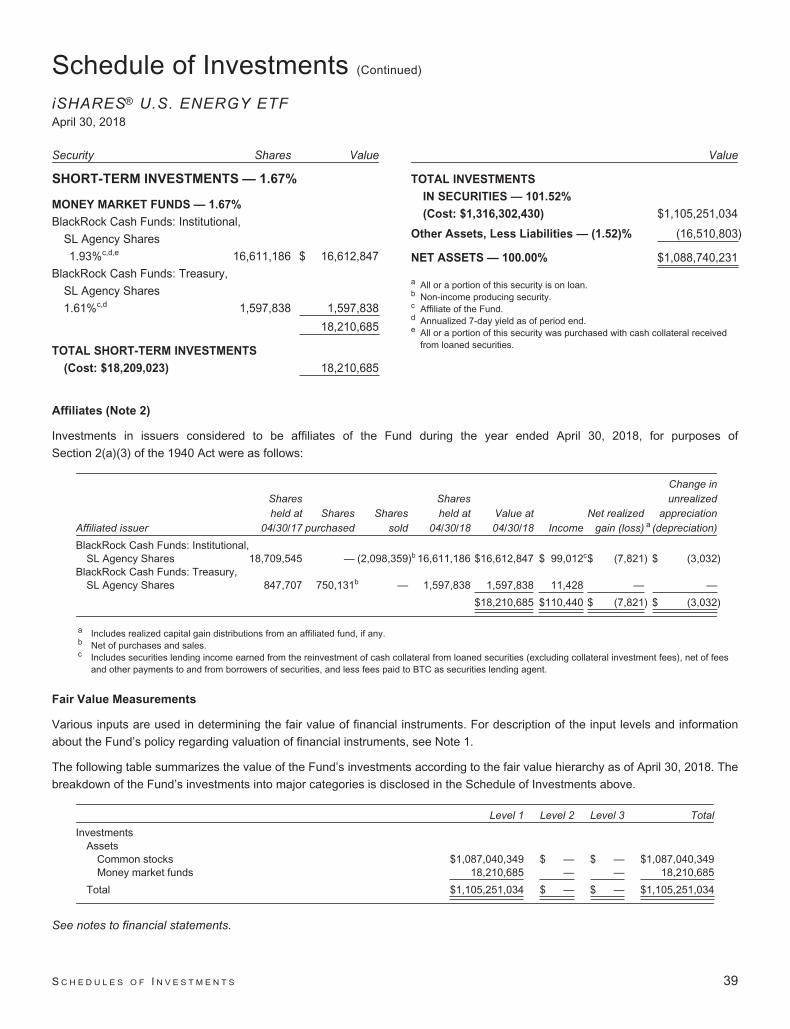
Schedule of Investments (Continued)
iSHARES® U.S. ENERGY ETFApril 30, 2018
Security Shares Value
SHORT-TERM INVESTMENTS — 1.67%
MONEY MARKET FUNDS — 1.67%
BlackRock Cash Funds: Institutional,
SL Agency Shares
1.93%c,d,e 16,611,186 $ 16,612,847
BlackRock Cash Funds: Treasury,
SL Agency Shares
1.61%c,d 1,597,838 1,597,838
18,210,685
TOTAL SHORT-TERM INVESTMENTS
(Cost: $18,209,023) 18,210,685
Value
TOTAL INVESTMENTS
IN SECURITIES — 101.52%
(Cost: $1,316,302,430) $1,105,251,034
Other Assets, Less Liabilities — (1.52)% (16,510,803)
NET ASSETS — 100.00% $1,088,740,231
a All or a portion of this security is on loan.b Non-income producing security.c Affiliate of the Fund.d Annualized 7-day yield as of period end.e All or a portion of this security was purchased with cash collateral received
from loaned securities.
Affiliates (Note 2)
Investments in issuers considered to be affiliates of the Fund during the year ended April 30, 2018, for purposes of
Section 2(a)(3) of the 1940 Act were as follows:
Affiliated issuer
Sharesheld at
04/30/17Shares
purchasedShares
sold
Sharesheld at
04/30/18Value at04/30/18 Income
Net realizedgain (loss) a
Change inunrealized
appreciation(depreciation)
BlackRock Cash Funds: Institutional,SL Agency Shares 18,709,545 — (2,098,359)b 16,611,186 $16,612,847 $ 99,012c$ (7,821) $ (3,032)
BlackRock Cash Funds: Treasury,SL Agency Shares 847,707 750,131b — 1,597,838 1,597,838 11,428 — —
$18,210,685 $110,440 $ (7,821) $ (3,032)
a Includes realized capital gain distributions from an affiliated fund, if any.b Net of purchases and sales.c Includes securities lending income earned from the reinvestment of cash collateral from loaned securities (excluding collateral investment fees), net of fees
and other payments to and from borrowers of securities, and less fees paid to BTC as securities lending agent.
Fair Value Measurements
Various inputs are used in determining the fair value of financial instruments. For description of the input levels and information
about the Fund’s policy regarding valuation of financial instruments, see Note 1.
The following table summarizes the value of the Fund’s investments according to the fair value hierarchy as of April 30, 2018. The
breakdown of the Fund’s investments into major categories is disclosed in the Schedule of Investments above.
Level 1 Level 2 Level 3 Total
InvestmentsAssets
Common stocks $1,087,040,349 $ — $ — $1,087,040,349Money market funds 18,210,685 — — 18,210,685
Total $1,105,251,034 $ — $ — $1,105,251,034
See notes to financial statements.
S C H E D U L E S O F I N V E S T M E N T S 39

Schedule of InvestmentsiSHARES® U.S. HEALTHCARE ETFApril 30, 2018
Security Shares Value
COMMON STOCKS — 99.95%
BIOTECHNOLOGY — 20.22%
AbbVie Inc. 846,906 $ 81,768,774
ACADIA Pharmaceuticals Inc.a,b 52,130 824,175
Agios Pharmaceuticals Inc.a,b 25,453 2,135,761
Alexion Pharmaceuticals Inc.a 117,774 13,853,756
Alkermes PLCa 82,956 3,672,462
Alnylam Pharmaceuticals Inc.a,b 43,360 4,098,821
Amgen Inc. 355,139 61,964,653
Biogen Inc.a 112,399 30,752,366
BioMarin Pharmaceutical Inc.a 93,303 7,791,734
Bluebird Bio Inc.a,b 26,555 4,518,333
Celgene Corp.a 399,614 34,806,379
Clovis Oncology Inc.a 26,627 1,155,079
Dyax Corp.a,c 95,647 219,032
Exact Sciences Corp.a,b 63,610 3,181,136
Exelixis Inc.a 149,321 3,108,863
Gilead Sciences Inc. 695,956 50,268,902
Incyte Corp.a 93,335 5,781,170
Intercept Pharmaceuticals Inc.a,b 9,680 658,337
Intrexon Corp.a,b 36,054 655,462
Ionis Pharmaceuticals Inc.a,b 66,301 2,852,932
Ligand Pharmaceuticals Inc.a,b 11,213 1,736,333
Myriad Genetics Inc.a,b 37,110 1,049,842
Neurocrine Biosciences Inc.a,b 47,014 3,811,895
OPKO Health Inc.a,b 197,536 600,509
Portola Pharmaceuticals Inc.a 34,667 1,252,519
Radius Health Inc.a,b 22,045 665,759
Regeneron Pharmaceuticals Inc.a 41,027 12,459,079
Seattle Genetics Inc.a,b 56,224 2,878,107
TESARO Inc.a,b 20,224 1,029,604
Ultragenyx Pharmaceutical Inc.a,b 24,770 1,259,307
United Therapeutics Corp.a 22,972 2,529,447
Vertex Pharmaceuticals Inc.a 134,887 20,659,293
363,999,821
HEALTH CARE EQUIPMENT & SUPPLIES — 21.32%
Abbott Laboratories 924,742 53,755,252
ABIOMED Inc.a 22,348 6,725,631
Align Technology Inc.a 38,317 9,573,502
Baxter International Inc. 264,006 18,348,417
Becton Dickinson and Co. 141,448 32,797,548
Boston Scientific Corp.a 730,459 20,978,782
Cooper Companies Inc. (The) 26,044 5,956,523
Danaher Corp. 326,130 32,717,362
Security Shares Value
DENTSPLY SIRONA Inc. 122,025 $ 6,142,738
DexCom Inc.a,b 46,170 3,378,721
Edwards Lifesciences Corp.a 111,581 14,210,956
Haemonetics Corp.a 28,396 2,216,024
Halyard Health Inc.a 24,928 1,180,839
Hill-Rom Holdings Inc. 35,157 3,017,525
Hologic Inc.a 146,914 5,698,794
IDEXX Laboratories Inc.a 46,286 9,002,164
Integra LifeSciences
Holdings Corp.a 33,771 2,081,307
Intuitive Surgical Inc.a 59,662 26,297,816
Masimo Corp.a 25,238 2,264,606
Medtronic PLC 720,019 57,695,122
NuVasive Inc.a 27,232 1,449,015
ResMed Inc. 75,934 7,186,394
STERIS PLC 45,078 4,260,773
Stryker Corp. 171,173 29,000,130
Teleflex Inc. 23,934 6,411,440
Varian Medical Systems Inc.a 48,506 5,606,809
West Pharmaceutical
Services Inc. 39,307 3,467,270
Zimmer Biomet Holdings Inc. 107,927 12,429,953
383,851,413
HEALTH CARE PROVIDERS & SERVICES — 21.51%
Acadia Healthcare Co. Inc.a 43,456 1,546,164
Aetna Inc. 173,697 31,100,448
Anthem Inc. 135,860 32,061,601
Brookdale Senior Living Inc.a,b 101,358 733,832
Centene Corp.a 92,174 10,008,253
Chemed Corp. 8,586 2,646,377
Cigna Corp. 129,034 22,170,622
CVS Health Corp. 538,998 37,638,230
DaVita Inc.a 77,354 4,857,058
Encompass Health Corp. 52,139 3,171,094
Envision Healthcare Corp.a 64,277 2,389,176
Express Scripts Holding Co.a 299,825 22,696,752
HCA Healthcare Inc. 148,717 14,238,166
Henry Schein Inc.a,b 81,654 6,205,704
Humana Inc. 73,148 21,518,679
Laboratory Corp. of
America Holdingsa 54,137 9,243,893
LifePoint Health Inc.a 20,708 991,913
Magellan Health Inc.a 12,923 1,083,594
McKesson Corp. 109,623 17,124,209
MEDNAX Inc.a 49,832 2,287,787
Molina Healthcare Inc.a 24,433 2,034,047
40 2 0 1 8 i S H A R E S A N N U A L R E P O R T T O S H A R E H O L D E R S

Schedule of Investments (Continued)
iSHARES® U.S. HEALTHCARE ETFApril 30, 2018
Security Shares Value
Owens & Minor Inc. 33,422 $ 543,107
Patterson Companies Inc. 43,325 1,008,606
Quest Diagnostics Inc. 72,061 7,292,573
Tenet Healthcare Corp.a,b 42,973 1,028,774
UnitedHealth Group Inc. 514,097 121,532,531
Universal Health Services
Inc. Class B 46,216 5,277,867
WellCare Health Plans Inc.a 23,657 4,853,470
387,284,527
LIFE SCIENCES TOOLS & SERVICES — 6.17%
Agilent Technologies Inc. 171,452 11,271,254
Bio-Rad Laboratories Inc.
Class Aa 10,740 2,724,845
Bio-Techne Corp. 19,909 3,004,467
Bruker Corp. 53,721 1,586,381
Charles River Laboratories
International Inc.a 25,198 2,625,380
Illumina Inc.a 78,098 18,816,151
IQVIA Holdings Inc.a 77,447 7,416,325
Mettler-Toledo International Inc.a 13,533 7,577,533
PRA Health Sciences Inc.a 26,597 2,185,475
Syneos Health Inc.a 29,936 1,140,562
Thermo Fisher Scientific Inc. 213,459 44,901,101
Waters Corp.a 41,856 7,886,089
111,135,563
PHARMACEUTICALS — 30.73%
Akorn Inc.a 51,034 736,421
Allergan PLC 175,491 26,964,192
Bristol-Myers Squibb Co. 867,354 45,215,164
Catalent Inc.a 70,829 2,911,780
Eli Lilly & Co. 512,218 41,525,513
Endo International PLCa,b 109,198 625,704
Horizon Pharma PLCa 87,069 1,152,794
Impax Laboratories Inc.a,b 40,167 755,140
Jazz Pharmaceuticals PLCa 31,850 4,842,474
Johnson & Johnson 1,425,365 180,294,419
Mallinckrodt PLCa,b 46,909 609,817
Medicines Co. (The)a,b 34,262 1,030,944
Merck & Co. Inc. 1,432,425 84,326,860
Mylan NVa 273,492 10,600,550
Nektar Therapeuticsa 85,495 7,152,512
Pacira Pharmaceuticals Inc./DEa 22,043 729,623
Perrigo Co. PLC 69,588 5,437,606
Pfizer Inc. 3,162,622 115,783,591
Prestige Brands Holdings Inc.a,b 28,178 829,560
Security Shares Value
Zoetis Inc. 258,885 $ 21,611,720
553,136,384
TOTAL COMMON STOCKS
(Cost: $1,736,683,241) 1,799,407,708
SHORT-TERM INVESTMENTS — 1.70%
MONEY MARKET FUNDS — 1.70%
BlackRock Cash Funds: Institutional,
SL Agency Shares
1.93%d,e,f 28,674,780 28,677,648
BlackRock Cash Funds: Treasury,
SL Agency Shares
1.61%d,e 1,934,255 1,934,255
30,611,903
TOTAL SHORT-TERM INVESTMENTS
(Cost: $30,609,158) 30,611,903
TOTAL INVESTMENTS
IN SECURITIES — 101.65%
(Cost: $1,767,292,399) 1,830,019,611
Other Assets, Less Liabilities — (1.65)% (29,683,685)
NET ASSETS — 100.00% $1,800,335,926
a Non-income producing security.b All or a portion of this security is on loan.c Security is valued using significant unobservable inputs and is classified as
Level 3 in the fair value hierarchy.d Affiliate of the Fund.e Annualized 7-day yield as of period end.f All or a portion of this security was purchased with cash collateral received
from loaned securities.
S C H E D U L E S O F I N V E S T M E N T S 41

Schedule of Investments (Continued)
iSHARES® U.S. HEALTHCARE ETFApril 30, 2018
Affiliates (Note 2)
Investments in issuers considered to be affiliates of the Fund during the year ended April 30, 2018, for purposes of
Section 2(a)(3) of the 1940 Act were as follows:
Affiliated issuer
Sharesheld at
04/30/17Shares
purchasedShares
sold
Sharesheld at
04/30/18Value at04/30/18 Income
Net realizedgain (loss) a
Change inunrealized
appreciation(depreciation)
BlackRock Cash Funds: Institutional,SL Agency Shares 36,258,180 — (7,583,400)b 28,674,780 $28,677,648 $166,266c$ (6,125) $ (9,563)
BlackRock Cash Funds: Treasury,SL Agency Shares 936,859 997,396b — 1,934,255 1,934,255 20,768 — —
$30,611,903 $187,034 $ (6,125) $ (9,563)
a Includes realized capital gain distributions from an affiliated fund, if any.b Net of purchases and sales.c Includes securities lending income earned from the reinvestment of cash collateral from loaned securities (excluding collateral investment fees), net of fees
and other payments to and from borrowers of securities, and less fees paid to BTC as securities lending agent.
Fair Value Measurements
Various inputs are used in determining the fair value of financial instruments. For description of the input levels and information
about the Fund’s policy regarding valuation of financial instruments, see Note 1.
The following table summarizes the value of the Fund’s investments according to the fair value hierarchy as of April 30, 2018. The
breakdown of the Fund’s investments into major categories is disclosed in the Schedule of Investments above.
Level 1 Level 2 Level 3 Total
InvestmentsAssets
Common stocks $1,799,188,676 $ — $219,032 $1,799,407,708Money market funds 30,611,903 — — 30,611,903
Total $1,829,800,579 $ — $219,032 $1,830,019,611
See notes to financial statements.
42 2 0 1 8 i S H A R E S A N N U A L R E P O R T T O S H A R E H O L D E R S

Schedule of InvestmentsiSHARES® U.S. TECHNOLOGY ETFApril 30, 2018
Security Shares Value
COMMON STOCKS — 99.91%
COMMERCIAL SERVICES & SUPPLIES — 0.04%
Pitney Bowes Inc. 144,115 $ 1,472,855
1,472,855
COMMUNICATIONS EQUIPMENT — 6.07%
Arista Networks Inc.a 36,697 9,708,191
ARRIS International PLCa 134,724 3,637,548
Ciena Corp.a 112,002 2,884,051
Cisco Systems Inc. 3,731,780 165,280,536
CommScope Holding Co. Inc.a 149,099 5,698,564
EchoStar Corp. Class Aa 37,078 1,948,078
F5 Networks Inc.a 47,996 7,827,668
Finisar Corp.a,b 87,883 1,369,217
InterDigital Inc./PA 26,790 1,994,515
Juniper Networks Inc. 266,823 6,561,178
Lumentum Holdings Inc.a 48,424 2,442,991
Motorola Solutions Inc. 125,537 13,787,729
NetScout Systems Inc.a,b 67,260 1,826,109
Palo Alto Networks Inc.a 71,219 13,710,370
Plantronics Inc. 25,517 1,662,433
ViaSat Inc.a,b 42,494 2,718,766
Viavi Solutions Inc.a,b 175,480 1,658,286
244,716,230
DIVERSIFIED TELECOMMUNICATION SERVICES — 0.48%
CenturyLink Inc. 753,870 14,006,905
Zayo Group Holdings Inc.a,b 144,471 5,244,297
19,251,202
ELECTRONIC EQUIPMENT, INSTRUMENTS &
COMPONENTS — 0.32%
CDW Corp./DE 118,804 8,469,537
SYNNEX Corp. 22,519 2,255,728
Tech Data Corp.a 26,797 2,043,272
12,768,537
HEALTH CARE TECHNOLOGY — 0.73%
Allscripts Healthcare
Solutions Inc.a 139,470 1,620,641
athenahealth Inc.a 31,203 3,821,432
Cerner Corp.a 244,601 14,248,008
Medidata Solutions Inc.a,b 45,964 3,279,991
Veeva Systems Inc. Class Aa 90,420 6,341,155
29,311,227
Security Shares Value
HOUSEHOLD DURABLES — 0.12%
Garmin Ltd. 85,700 $ 5,028,019
5,028,019
INTERNET SOFTWARE & SERVICES — 21.99%
Akamai Technologies Inc.a,b 131,954 9,454,504
Alphabet Inc. Class Aa 231,218 235,514,031
Alphabet Inc. Class C NVSa 235,771 239,856,911
Cars.com Inc.a,b 55,236 1,573,121
eBay Inc.a 729,106 27,618,535
Facebook Inc. Class Aa 1,855,944 319,222,368
GrubHub Inc.a,b 67,527 6,829,681
IAC/InterActiveCorp.a 59,131 9,587,500
j2 Global Inc. 38,104 3,024,696
LogMeIn Inc. 40,686 4,483,597
Pandora Media Inc.a,b 191,787 1,075,925
Twitter Inc.a 500,289 15,163,760
VeriSign Inc.a,b 64,822 7,611,399
Zillow Group Inc. Class Aa 37,230 1,800,815
Zillow Group Inc. Class C NVSa,b 81,045 3,929,872
886,746,715
IT SERVICES — 4.91%
Amdocs Ltd. 111,482 7,497,164
Booz Allen Hamilton
Holding Corp. 112,352 4,452,510
CACI International Inc. Class Aa 19,000 2,869,950
Cognizant Technology Solutions
Corp. Class A 455,481 37,267,455
DXC Technology Co. 220,981 22,774,302
EPAM Systems Inc.a 38,684 4,423,515
Gartner Inc.a,b 70,373 8,535,541
International Business
Machines Corp. 663,609 96,196,761
Leidos Holdings Inc. 110,491 7,096,837
Science Applications
International Corp. 33,378 2,863,499
Teradata Corp.a 94,681 3,874,347
197,851,881
SEMICONDUCTORS & SEMICONDUCTOR
EQUIPMENT — 19.17%
Advanced Micro Devices Inc.a,b 639,265 6,955,203
Analog Devices Inc. 286,459 25,022,194
Applied Materials Inc. 813,889 40,425,867
Broadcom Inc. 317,851 72,921,376
Cavium Inc.a 54,112 4,058,941
Cirrus Logic Inc.a 49,149 1,792,464
S C H E D U L E S O F I N V E S T M E N T S 43

Schedule of Investments (Continued)
iSHARES® U.S. TECHNOLOGY ETFApril 30, 2018
Security Shares Value
Cree Inc.a,b 75,757 $ 2,827,251
Cypress Semiconductor Corp. 275,456 4,016,148
Entegris Inc. 109,190 3,515,918
Integrated Device
Technology Inc.a,b 102,569 2,854,495
Intel Corp. 3,625,256 187,135,715
KLA-Tencor Corp. 121,433 12,354,593
Lam Research Corp. 126,227 23,359,569
Marvell Technology Group Ltd. 334,813 6,716,349
Maxim Integrated Products Inc. 218,141 11,888,685
Microchip Technology Inc.b 181,436 15,178,936
Micron Technology Inc.a 895,715 41,184,976
Microsemi Corp.a 90,838 5,876,310
MKS Instruments Inc. 42,286 4,330,086
Monolithic Power Systems Inc. 30,077 3,522,017
NVIDIA Corp. 468,653 105,400,060
ON Semiconductor Corp.a 329,380 7,272,710
Qorvo Inc.a 98,164 6,616,254
QUALCOMM Inc. 1,146,731 58,494,748
Semtech Corp.a 51,092 2,007,916
Silicon Laboratories Inc.a 32,879 3,054,459
Skyworks Solutions Inc. 141,236 12,253,635
Synaptics Inc.a 27,145 1,181,350
Teradyne Inc. 151,499 4,931,292
Texas Instruments Inc. 762,067 77,296,456
Universal Display Corp. 32,538 2,864,971
Versum Materials Inc. 84,000 2,955,120
Xilinx Inc. 197,191 12,667,550
772,933,614
SOFTWARE — 27.40%
ACI Worldwide Inc.a,b 89,784 2,087,478
Adobe Systems Inc.a 380,794 84,383,950
ANSYS Inc.a 65,087 10,521,964
Aspen Technology Inc.a 55,498 4,869,949
Autodesk Inc.a 170,629 21,482,191
Blackbaud Inc. 37,144 3,898,634
CA Inc. 242,217 8,429,152
Cadence Design Systems Inc.a 219,185 8,780,551
CDK Global Inc. 98,161 6,404,024
Citrix Systems Inc.a 100,042 10,295,322
CommVault Systems Inc.a 32,380 2,264,981
Dell Technologies Inc. Class Va 154,182 11,065,642
Ellie Mae Inc.a 26,659 2,582,457
Fair Isaac Corp.a 23,408 4,053,797
FireEye Inc.a,b 135,353 2,443,122
Security Shares Value
Fortinet Inc.a 112,145 $ 6,208,347
Guidewire Software Inc.a,b 58,206 4,925,392
Intuit Inc. 188,468 34,827,002
Manhattan Associates Inc.a,b 52,255 2,250,100
Microsoft Corp. 5,964,475 557,797,702
Nuance Communications Inc.a 209,519 3,084,120
Oracle Corp. 2,340,854 106,906,802
Paycom Software Inc.a,b 36,891 4,213,321
Proofpoint Inc.a 38,857 4,582,795
PTC Inc.a 90,242 7,431,429
Red Hat Inc.a 137,091 22,354,058
salesforce.com Inc.a 531,541 64,311,146
ServiceNow Inc.a,b 133,776 22,225,545
Splunk Inc.a 109,393 11,229,191
SS&C Technologies
Holdings Inc. 151,163 7,505,243
Symantec Corp. 480,514 13,353,484
Synopsys Inc.a 115,427 9,870,163
Tableau Software Inc. Class Aa 48,433 4,119,227
Tyler Technologies Inc.a,b 27,354 5,988,338
Ultimate Software Group
Inc. (The)a,b 22,538 5,407,317
Verint Systems Inc.a 49,196 2,071,152
VMware Inc. Class Aa,b 52,578 7,006,544
Workday Inc. Class Aa,b 105,998 13,232,790
1,104,464,422
TECHNOLOGY HARDWARE, STORAGE &
PERIPHERALS — 18.68%
3D Systems Corp.a,b 87,775 881,261
Apple Inc. 3,930,477 649,550,629
Diebold Nixdorf Inc. 58,254 894,199
Electronics For Imaging Inc.a,b 35,242 976,203
Hewlett Packard Enterprise Co. 1,213,841 20,695,989
HP Inc. 1,268,423 27,258,410
NCR Corp.a,b 91,895 2,827,609
NetApp Inc. 207,260 13,799,371
Seagate Technology PLC 220,347 12,755,888
Western Digital Corp. 230,500 18,161,095
Xerox Corp. 166,291 5,229,852
753,030,506
TOTAL COMMON STOCKS
(Cost: $3,181,332,344) 4,027,575,208
44 2 0 1 8 i S H A R E S A N N U A L R E P O R T T O S H A R E H O L D E R S

Schedule of Investments (Continued)
iSHARES® U.S. TECHNOLOGY ETFApril 30, 2018
Security Shares Value
SHORT-TERM INVESTMENTS — 1.81%
MONEY MARKET FUNDS — 1.81%
BlackRock Cash Funds: Institutional,
SL Agency Shares
1.93%c,d,e 65,394,472 $ 65,401,012
BlackRock Cash Funds: Treasury,
SL Agency Shares
1.61%c,d 7,668,848 7,668,848
73,069,860
TOTAL SHORT-TERM INVESTMENTS
(Cost: $73,063,320) 73,069,860
TOTAL INVESTMENTS
IN SECURITIES — 101.72%
(Cost: $3,254,395,664) 4,100,645,068
Other Assets, Less Liabilities — (1.72)% (69,273,247)
NET ASSETS — 100.00% $4,031,371,821
NVS — Non-Voting Shares
a Non-income producing security.b All or a portion of this security is on loan.c Affiliate of the Fund.d Annualized 7-day yield as of period end.e All or a portion of this security was purchased with cash collateral received
from loaned securities.
Affiliates (Note 2)
Investments in issuers considered to be affiliates of the Fund during the year ended April 30, 2018, for purposes of
Section 2(a)(3) of the 1940 Act were as follows:
Affiliated issuer
Sharesheld at
04/30/17Shares
purchasedShares
sold
Sharesheld at
04/30/18Value at04/30/18 Income
Net realizedgain (loss) a
Change inunrealized
appreciation(depreciation)
BlackRock Cash Funds:Institutional,SL Agency Shares 92,564,009 — (27,169,537)b 65,394,472 $65,401,012 $329,267c $ (15,430) $ (13,592)
BlackRock Cash Funds:Treasury,SL Agency Shares 1,741,261 5,927,587b — 7,668,848 7,668,848 39,470 — —
$73,069,860 $368,737 $ (15,430) $ (13,592)
a Includes realized capital gain distributions from an affiliated fund, if any.b Net of purchases and sales.c Includes securities lending income earned from the reinvestment of cash collateral from loaned securities (excluding collateral investment fees), net of fees
and other payments to and from borrowers of securities, and less fees paid to BTC as securities lending agent.
S C H E D U L E S O F I N V E S T M E N T S 45

Schedule of Investments (Continued)
iSHARES® U.S. TECHNOLOGY ETFApril 30, 2018
Fair Value Measurements
Various inputs are used in determining the fair value of financial instruments. For description of the input levels and information
about the Fund’s policy regarding valuation of financial instruments, see Note 1.
The following table summarizes the value of the Fund’s investments according to the fair value hierarchy as of April 30, 2018. The
breakdown of the Fund’s investments into major categories is disclosed in the Schedule of Investments above.
Level 1 Level 2 Level 3 Total
InvestmentsAssets
Common stocks $4,027,575,208 $ — $ — $4,027,575,208Money market funds 73,069,860 — — 73,069,860
Total $4,100,645,068 $ — $ — $4,100,645,068
See notes to financial statements.
46 2 0 1 8 i S H A R E S A N N U A L R E P O R T T O S H A R E H O L D E R S

Schedule of InvestmentsiSHARES® U.S. UTILITIES ETFApril 30, 2018
Security Shares Value
COMMON STOCKS — 99.84%
ELECTRIC UTILITIES — 57.67%
ALLETE Inc. 39,869 $ 3,046,390
Alliant Energy Corp. 181,508 7,795,769
American Electric Power Co. Inc. 385,999 27,012,210
Duke Energy Corp. 549,253 44,028,120
Edison International 255,612 16,747,698
El Paso Electric Co. 31,943 1,630,690
Entergy Corp. 141,822 11,571,257
Eversource Energy 248,611 14,978,813
Exelon Corp. 757,107 30,042,006
FirstEnergy Corp. 350,735 12,065,284
Great Plains Energy Inc. 169,193 5,537,687
Hawaiian Electric Industries Inc. 85,329 2,960,063
IDACORP Inc. 39,516 3,674,988
NextEra Energy Inc. 369,048 60,490,658
PG&E Corp. 404,016 18,625,138
Pinnacle West Capital Corp. 87,712 7,060,816
PNM Resources Inc. 62,572 2,480,980
Portland General Electric Co. 69,857 2,967,525
PPL Corp. 544,513 15,845,328
Southern Co. (The) 790,944 36,478,337
Westar Energy Inc. 111,588 6,045,838
Xcel Energy Inc. 398,599 18,670,377
349,755,972
GAS UTILITIES — 5.64%
Atmos Energy Corp. 87,051 7,563,861
National Fuel Gas Co. 67,285 3,455,085
New Jersey Resources Corp. 68,665 2,839,298
ONE Gas Inc. 40,971 2,856,498
South Jersey Industries Inc. 65,759 2,031,953
Southwest Gas Holdings Inc. 37,831 2,761,285
Spire Inc. 37,897 2,734,269
UGI Corp. 135,736 6,568,265
WGL Holdings Inc. 40,275 3,427,402
34,237,916
INDEPENDENT POWER AND RENEWABLE ELECTRICITY
PRODUCERS — 3.35%
AES Corp./VA 518,185 6,342,584
NRG Energy Inc. 236,740 7,338,940
Vistra Energy Corp.a 291,081 6,651,201
20,332,725
Security Shares Value
MULTI-UTILITIES — 30.37%
Ameren Corp. 190,357 $ 11,158,727
Avista Corp. 51,555 2,673,642
Black Hills Corp. 42,063 2,384,131
CenterPoint Energy Inc. 338,157 8,565,517
CMS Energy Corp. 221,572 10,455,983
Consolidated Edison Inc. 243,520 19,513,258
Dominion Energy Inc. 511,150 34,022,144
DTE Energy Co. 140,738 14,833,785
MDU Resources Group Inc. 153,212 4,315,982
NiSource Inc. 264,714 6,456,375
NorthWestern Corp. 38,805 2,131,947
Public Service Enterprise Group Inc. 396,011 20,651,974
SCANA Corp. 111,896 4,114,416
Sempra Energy 200,313 22,394,993
Vectren Corp. 65,142 4,577,528
WEC Energy Group Inc. 247,558 15,913,028
184,163,430
WATER UTILITIES — 2.81%
American Water Works Co. Inc. 140,082 12,128,299
Aqua America Inc. 139,453 4,901,773
17,030,072
TOTAL COMMON STOCKS
(Cost: $659,411,730) 605,520,115
SHORT-TERM INVESTMENTS — 0.17%
MONEY MARKET FUNDS — 0.17%
BlackRock Cash Funds: Treasury,
SL Agency Shares
1.61%b,c 1,006,390 1,006,390
1,006,390
TOTAL SHORT-TERM INVESTMENTS
(Cost: $1,006,390) 1,006,390
TOTAL INVESTMENTS
IN SECURITIES — 100.01%
(Cost: $660,418,120) 606,526,505
Other Assets, Less Liabilities — (0.01)% (40,095)
NET ASSETS — 100.00% $606,486,410
a Non-income producing security.b Affiliate of the Fund.c Annualized 7-day yield as of period end.
S C H E D U L E S O F I N V E S T M E N T S 47
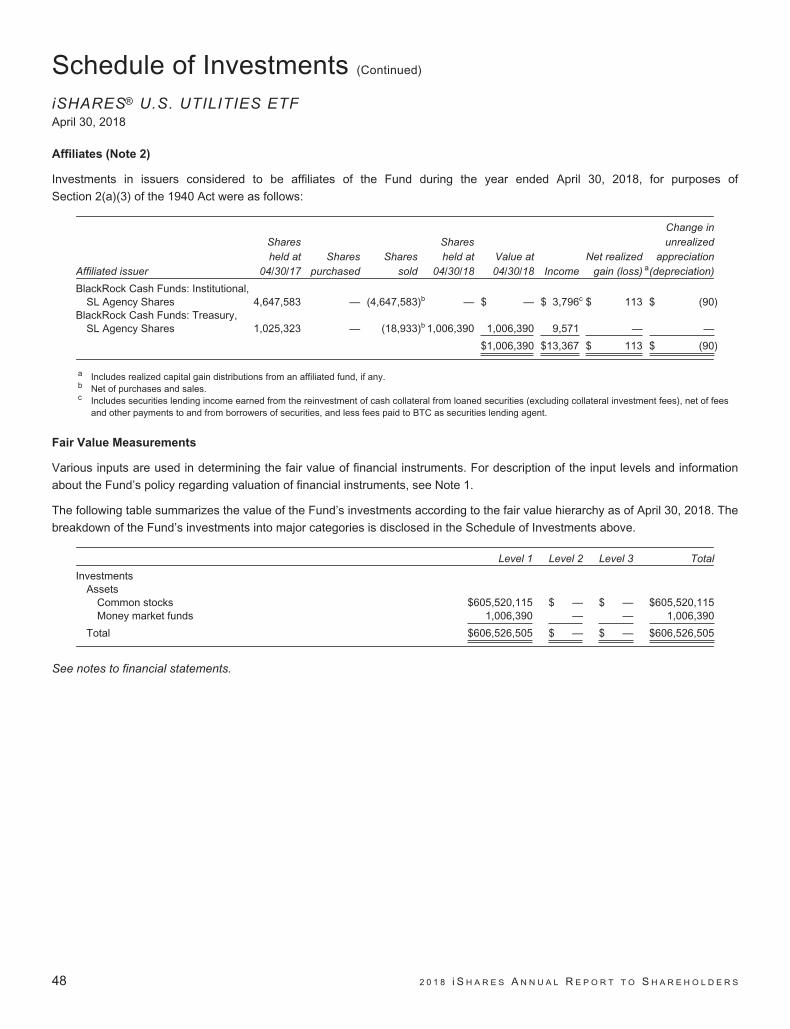
Schedule of Investments (Continued)
iSHARES® U.S. UTILITIES ETFApril 30, 2018
Affiliates (Note 2)
Investments in issuers considered to be affiliates of the Fund during the year ended April 30, 2018, for purposes of
Section 2(a)(3) of the 1940 Act were as follows:
Affiliated issuer
Sharesheld at
04/30/17Shares
purchasedShares
sold
Sharesheld at
04/30/18Value at04/30/18 Income
Net realizedgain (loss) a
Change inunrealized
appreciation(depreciation)
BlackRock Cash Funds: Institutional,SL Agency Shares 4,647,583 — (4,647,583)b — $ — $ 3,796c $ 113 $ (90)
BlackRock Cash Funds: Treasury,SL Agency Shares 1,025,323 — (18,933)b 1,006,390 1,006,390 9,571 — —
$1,006,390 $13,367 $ 113 $ (90)
a Includes realized capital gain distributions from an affiliated fund, if any.b Net of purchases and sales.c Includes securities lending income earned from the reinvestment of cash collateral from loaned securities (excluding collateral investment fees), net of fees
and other payments to and from borrowers of securities, and less fees paid to BTC as securities lending agent.
Fair Value Measurements
Various inputs are used in determining the fair value of financial instruments. For description of the input levels and information
about the Fund’s policy regarding valuation of financial instruments, see Note 1.
The following table summarizes the value of the Fund’s investments according to the fair value hierarchy as of April 30, 2018. The
breakdown of the Fund’s investments into major categories is disclosed in the Schedule of Investments above.
Level 1 Level 2 Level 3 Total
InvestmentsAssets
Common stocks $605,520,115 $ — $ — $605,520,115Money market funds 1,006,390 — — 1,006,390
Total $606,526,505 $ — $ — $606,526,505
See notes to financial statements.
48 2 0 1 8 i S H A R E S A N N U A L R E P O R T T O S H A R E H O L D E R S
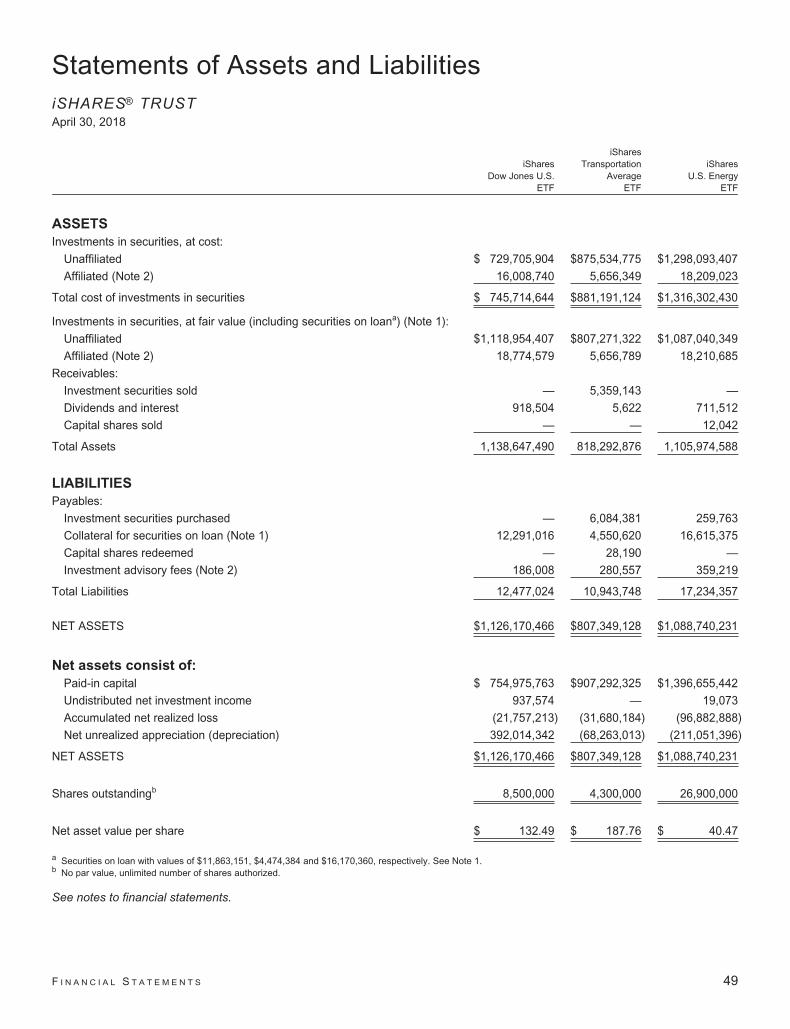
Statements of Assets and LiabilitiesiSHARES® TRUSTApril 30, 2018
iSharesDow Jones U.S.
ETF
iSharesTransportation
AverageETF
iSharesU.S. Energy
ETF
ASSETS
Investments in securities, at cost:
Unaffiliated $ 729,705,904 $875,534,775 $1,298,093,407
Affiliated (Note 2) 16,008,740 5,656,349 18,209,023
Total cost of investments in securities $ 745,714,644 $881,191,124 $1,316,302,430
Investments in securities, at fair value (including securities on loana) (Note 1):
Unaffiliated $1,118,954,407 $807,271,322 $1,087,040,349
Affiliated (Note 2) 18,774,579 5,656,789 18,210,685
Receivables:
Investment securities sold — 5,359,143 —
Dividends and interest 918,504 5,622 711,512
Capital shares sold — — 12,042
Total Assets 1,138,647,490 818,292,876 1,105,974,588
LIABILITIES
Payables:
Investment securities purchased — 6,084,381 259,763
Collateral for securities on loan (Note 1) 12,291,016 4,550,620 16,615,375
Capital shares redeemed — 28,190 —
Investment advisory fees (Note 2) 186,008 280,557 359,219
Total Liabilities 12,477,024 10,943,748 17,234,357
NET ASSETS $1,126,170,466 $807,349,128 $1,088,740,231
Net assets consist of:
Paid-in capital $ 754,975,763 $907,292,325 $1,396,655,442
Undistributed net investment income 937,574 — 19,073
Accumulated net realized loss (21,757,213) (31,680,184) (96,882,888)
Net unrealized appreciation (depreciation) 392,014,342 (68,263,013) (211,051,396)
NET ASSETS $1,126,170,466 $807,349,128 $1,088,740,231
Shares outstandingb 8,500,000 4,300,000 26,900,000
Net asset value per share $ 132.49 $ 187.76 $ 40.47
a Securities on loan with values of $11,863,151, $4,474,384 and $16,170,360, respectively. See Note 1.b No par value, unlimited number of shares authorized.
See notes to financial statements.
F I N A N C I A L S T A T E M E N T S 49

Statements of Assets and Liabilities (Continued)
iSHARES® TRUSTApril 30, 2018
iSharesU.S. Healthcare
ETF
iSharesU.S. Technology
ETF
iSharesU.S. Utilities
ETF
ASSETS
Investments in securities, at cost:
Unaffiliated $1,736,683,241 $3,181,332,344 $659,411,730
Affiliated (Note 2) 30,609,158 73,063,320 1,006,390
Total cost of investments in securities $1,767,292,399 $3,254,395,664 $660,418,120
Investments in securities, at fair value (including securities on loana) (Note 1):
Unaffiliated $1,799,407,708 $4,027,575,208 $605,520,115
Affiliated (Note 2) 30,611,903 73,069,860 1,006,390
Receivables:
Investment securities sold 35,755,496 — —
Dividends and interest 1,513,142 496,982 270,505
Total Assets 1,867,288,249 4,101,142,050 606,797,010
LIABILITIES
Payables:
Investment securities purchased 37,640,302 2,865,146 99,909
Collateral for securities on loan (Note 1) 28,677,921 65,409,711 —
Capital shares redeemed — 40,222 —
Investment advisory fees (Note 2) 634,100 1,455,150 210,691
Total Liabilities 66,952,323 69,770,229 310,600
NET ASSETS $1,800,335,926 $4,031,371,821 $606,486,410
Net assets consist of:
Paid-in capital $1,766,482,495 $3,234,522,085 $676,202,669
Undistributed net investment income 1,396,100 — 485,288
Accumulated net realized loss (30,269,881) (49,399,668) (16,309,932)
Net unrealized appreciation (depreciation) 62,727,212 846,249,404 (53,891,615)
NET ASSETS $1,800,335,926 $4,031,371,821 $606,486,410
Shares outstandingb 10,350,000 24,000,000 4,650,000
Net asset value per share $ 173.95 $ 167.97 $ 130.43
a Securities on loan with values of $27,728,733, $63,683,351 and $ —, respectively. See Note 1.b No par value, unlimited number of shares authorized.
See notes to financial statements.
50 2 0 1 8 i S H A R E S A N N U A L R E P O R T T O S H A R E H O L D E R S

Statements of OperationsiSHARES® TRUSTYear ended April 30, 2018
iSharesDow Jones U.S.
ETF
iSharesTransportation
AverageETF
iSharesU.S. Energy
ETF
NET INVESTMENT INCOME
Dividends — unaffiliateda $ 21,205,694 $ 13,242,959 $ 36,120,373
Dividends — affiliated (Note 2) 134,768 10,315 11,428
Securities lending income — affiliated — net (Note 2) 114,281 49,913 99,012
Total investment income 21,454,743 13,303,187 36,230,813
EXPENSESInvestment advisory fees (Note 2) 2,254,571 3,788,974 4,691,938
Proxy fees 24,177 20,936 24,963
Total expenses 2,278,748 3,809,910 4,716,901
Net investment income 19,175,995 9,493,277 31,513,912
NET REALIZED AND UNREALIZED GAIN (LOSS)
Net realized gain (loss) from:
Investments — unaffiliated 1,573,535 (6,779,513) (50,616,390)
Investments — affiliated (Note 2) (7,037) (3,445) (7,821)
In-kind redemptions — unaffiliated 63,574,361 118,011,943 1,401,866
In-kind redemptions — affiliated (Note 2) 319,264 — —
Net realized gain (loss) 65,460,123 111,228,985 (49,222,345)
Net change in unrealized appreciation/depreciation on:
Investments — unaffiliated 48,142,659 388,848 126,176,674
Investments — affiliated (Note 2) 976,073 (47) (3,032)
Net change in unrealized appreciation/depreciation 49,118,732 388,801 126,173,642
Net realized and unrealized gain 114,578,855 111,617,786 76,951,297
NET INCREASE IN NET ASSETS RESULTING FROM OPERATIONS $133,754,850 $121,111,063 $108,465,209
a Net of foreign withholding tax of $1,243, $ — and $10,929, respectively.
See notes to financial statements.
F I N A N C I A L S T A T E M E N T S 51

Statements of Operations (Continued)
iSHARES® TRUSTYear ended April 30, 2018
iSharesU.S. Healthcare
ETF
iSharesU.S. Technology
ETF
iSharesU.S. Utilities
ETF
NET INVESTMENT INCOME
Dividends — unaffiliated $ 31,298,291 $ 47,312,053 $ 24,821,177
Dividends — affiliated (Note 2) 20,768 39,470 9,571
Securities lending income — affiliated — net (Note 2) 166,266 329,267 3,796
Total investment income 31,485,325 47,680,790 24,834,544
EXPENSESInvestment advisory fees (Note 2) 8,466,674 16,590,784 3,231,176
Proxy fees 40,470 74,679 17,322
Total expenses 8,507,144 16,665,463 3,248,498
Net investment income 22,978,181 31,015,327 21,586,046
NET REALIZED AND UNREALIZED GAIN (LOSS)
Net realized gain (loss) from:
Investments — unaffiliated (13,790,306) (7,967,625) (8,994,508)
Investments — affiliated (Note 2) (6,125) (15,430) 113
In-kind redemptions — unaffiliated 134,780,687 439,720,358 28,525,829
Net realized gain 120,984,256 431,737,303 19,531,434
Net change in unrealized appreciation/depreciation on:
Investments — unaffiliated 58,790,704 296,212,399 (34,065,693)
Investments — affiliated (Note 2) (9,563) (13,592) (90)
Net change in unrealized appreciation/depreciation 58,781,141 296,198,807 (34,065,783)
Net realized and unrealized gain (loss) 179,765,397 727,936,110 (14,534,349)
NET INCREASE IN NET ASSETS RESULTING FROM OPERATIONS $202,743,578 $758,951,437 $ 7,051,697
See notes to financial statements.
52 2 0 1 8 i S H A R E S A N N U A L R E P O R T T O S H A R E H O L D E R S

Statements of Changes in Net AssetsiSHARES® TRUST
iSharesDow Jones U.S.
ETF
iSharesTransportation
AverageETF
Year endedApril 30, 2018
Year endedApril 30, 2017
Year endedApril 30, 2018
Year endedApril 30, 2017
INCREASE (DECREASE) IN NET ASSETS
OPERATIONS:
Net investment income $ 19,175,995 $ 17,941,736 $ 9,493,277 $ 8,132,816
Net realized gain 65,460,123 11,828,394 111,228,985 65,334,280
Net change in unrealized appreciation/depreciation 49,118,732 134,033,913 388,801 51,399,806
Net increase in net assets resulting from operations 133,754,850 163,804,043 121,111,063 124,866,902
DISTRIBUTIONS TO SHAREHOLDERS:
From net investment income (19,044,585) (18,010,104) (9,873,738) (8,584,148)
Total distributions to shareholders (19,044,585) (18,010,104) (9,873,738) (8,584,148)
CAPITAL SHARE TRANSACTIONS:
Proceeds from shares sold 20,261,251 74,257,888 1,488,736,785 1,935,091,399
Cost of shares redeemed (119,673,037) (26,413,681) (1,759,222,952) (1,649,499,268)
Net increase (decrease) in net assets from
capital share transactions (99,411,786) 47,844,207 (270,486,167) 285,592,131
INCREASE (DECREASE) IN NET ASSETS 15,298,479 193,638,146 (159,248,842) 401,874,885
NET ASSETSBeginning of year 1,110,871,987 917,233,841 966,597,970 564,723,085
End of year $1,126,170,466 $1,110,871,987 $ 807,349,128 $ 966,597,970
Undistributed net investment income included in net
assets at end of year $ 937,574 $ 680,558 $ — $ —
SHARES ISSUED AND REDEEMEDShares sold 150,000 650,000 8,250,000 12,600,000
Shares redeemed (950,000) (250,000) (9,850,000) (10,700,000)
Net increase (decrease) in shares outstanding (800,000) 400,000 (1,600,000) 1,900,000
See notes to financial statements.
F I N A N C I A L S T A T E M E N T S 53

Statements of Changes in Net Assets (Continued)
iSHARES® TRUST
iSharesU.S. Energy
ETF
iSharesU.S. Healthcare
ETFYear ended
April 30, 2018Year ended
April 30, 2017Year ended
April 30, 2018Year ended
April 30, 2017
INCREASE (DECREASE) IN NET ASSETS
OPERATIONS:
Net investment income $ 31,513,912 $ 27,355,810 $ 22,978,181 $ 22,497,681
Net realized gain (loss) (49,222,345) (13,290,628) 120,984,256 20,613,874
Net change in unrealized appreciation/depreciation 126,173,642 (11,220,016) 58,781,141 130,548,641
Net increase in net assets resulting from operations 108,465,209 2,845,166 202,743,578 173,660,196
DISTRIBUTIONS TO SHAREHOLDERS:
From net investment income (31,781,233) (27,753,775) (22,513,635) (24,154,405)
Total distributions to shareholders (31,781,233) (27,753,775) (22,513,635) (24,154,405)
CAPITAL SHARE TRANSACTIONS:
Proceeds from shares sold 442,825,205 744,590,274 458,301,611 643,518,210
Cost of shares redeemed (589,894,431) (809,559,508) (749,581,753) (690,074,440)
Net decrease in net assets from
capital share transactions (147,069,226) (64,969,234) (291,280,142) (46,556,230)
INCREASE (DECREASE) IN NET ASSETS (70,385,250) (89,877,843) (111,050,199) 102,949,561
NET ASSETSBeginning of year 1,159,125,481 1,249,003,324 1,911,386,125 1,808,436,564
End of year $1,088,740,231 $1,159,125,481 $1,800,335,926 $1,911,386,125
Undistributed net investment income included in net
assets at end of year $ 19,073 $ — $ 1,396,100 $ 931,554
SHARES ISSUED AND REDEEMEDShares sold 11,550,000 18,900,000 2,650,000 4,250,000
Shares redeemed (15,750,000) (20,750,000) (4,350,000) (4,700,000)
Net decrease in shares outstanding (4,200,000) (1,850,000) (1,700,000) (450,000)
See notes to financial statements.
54 2 0 1 8 i S H A R E S A N N U A L R E P O R T T O S H A R E H O L D E R S
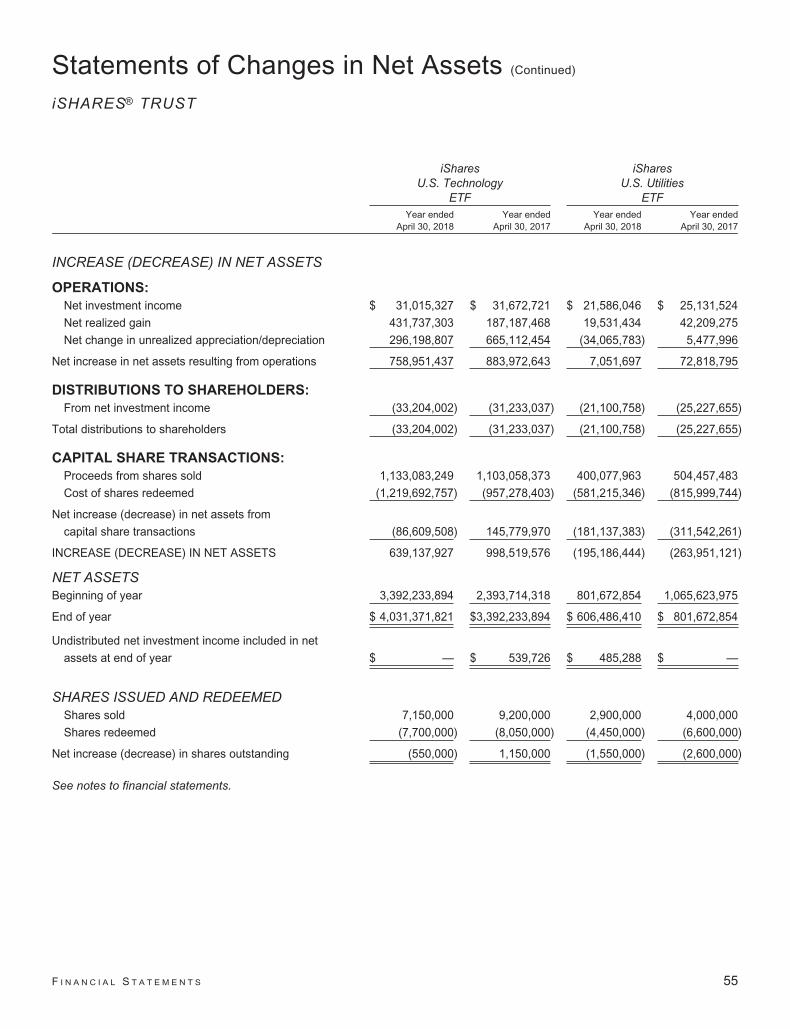
Statements of Changes in Net Assets (Continued)
iSHARES® TRUST
iSharesU.S. Technology
ETF
iSharesU.S. Utilities
ETFYear ended
April 30, 2018Year ended
April 30, 2017Year ended
April 30, 2018Year ended
April 30, 2017
INCREASE (DECREASE) IN NET ASSETS
OPERATIONS:
Net investment income $ 31,015,327 $ 31,672,721 $ 21,586,046 $ 25,131,524
Net realized gain 431,737,303 187,187,468 19,531,434 42,209,275
Net change in unrealized appreciation/depreciation 296,198,807 665,112,454 (34,065,783) 5,477,996
Net increase in net assets resulting from operations 758,951,437 883,972,643 7,051,697 72,818,795
DISTRIBUTIONS TO SHAREHOLDERS:
From net investment income (33,204,002) (31,233,037) (21,100,758) (25,227,655)
Total distributions to shareholders (33,204,002) (31,233,037) (21,100,758) (25,227,655)
CAPITAL SHARE TRANSACTIONS:
Proceeds from shares sold 1,133,083,249 1,103,058,373 400,077,963 504,457,483
Cost of shares redeemed (1,219,692,757) (957,278,403) (581,215,346) (815,999,744)
Net increase (decrease) in net assets from
capital share transactions (86,609,508) 145,779,970 (181,137,383) (311,542,261)
INCREASE (DECREASE) IN NET ASSETS 639,137,927 998,519,576 (195,186,444) (263,951,121)
NET ASSETSBeginning of year 3,392,233,894 2,393,714,318 801,672,854 1,065,623,975
End of year $ 4,031,371,821 $3,392,233,894 $ 606,486,410 $ 801,672,854
Undistributed net investment income included in net
assets at end of year $ — $ 539,726 $ 485,288 $ —
SHARES ISSUED AND REDEEMEDShares sold 7,150,000 9,200,000 2,900,000 4,000,000
Shares redeemed (7,700,000) (8,050,000) (4,450,000) (6,600,000)
Net increase (decrease) in shares outstanding (550,000) 1,150,000 (1,550,000) (2,600,000)
See notes to financial statements.
F I N A N C I A L S T A T E M E N T S 55

Financial HighlightsiSHARES® TRUST(For a share outstanding throughout each period)
iShares Dow Jones U.S. ETFYear ended
Apr. 30, 2018Year ended
Apr. 30, 2017Year ended
Apr. 30, 2016Year ended
Apr. 30, 2015Year ended
Apr. 30, 2014
Net asset value, beginning of year $ 119.45 $ 103.06 $ 105.32 $ 95.10 $ 80.50
Income from investment operations:
Net investment incomea 2.19 2.01 1.92 1.77 1.57
Net realized and unrealized gain (loss)b 13.03 16.40 (2.11) 10.22 14.58
Total from investment operations 15.22 18.41 (0.19) 11.99 16.15
Less distributions from:
Net investment income (2.18) (2.02) (2.07) (1.77) (1.55)
Total distributions (2.18) (2.02) (2.07) (1.77) (1.55)
Net asset value, end of year $ 132.49 $ 119.45 $ 103.06 $ 105.32 $ 95.10
Total return 12.81% 18.04% (0.14)% 12.68% 20.23%
Ratios/Supplemental data:
Net assets, end of year (000s) $1,126,170 $1,110,872 $917,234 $968,917 $889,168
Ratio of expenses to average net assets 0.20% 0.20% 0.20% 0.20% 0.20%
Ratio of net investment income to average net assets 1.70% 1.82% 1.88% 1.74% 1.78%
Portfolio turnover ratec 4% 4% 4% 4% 5%
a Based on average shares outstanding throughout each period.b The amounts reported for a share outstanding may not accord with the change in aggregate gains and losses in securities for the fiscal period due to the timing of
capital share transactions in relation to the fluctuating market values of the Fund’s underlying securities.c Portfolio turnover rates exclude portfolio securities received or delivered as a result of processing capital share transactions in Creation Units.
See notes to financial statements.
56 2 0 1 8 i S H A R E S A N N U A L R E P O R T T O S H A R E H O L D E R S
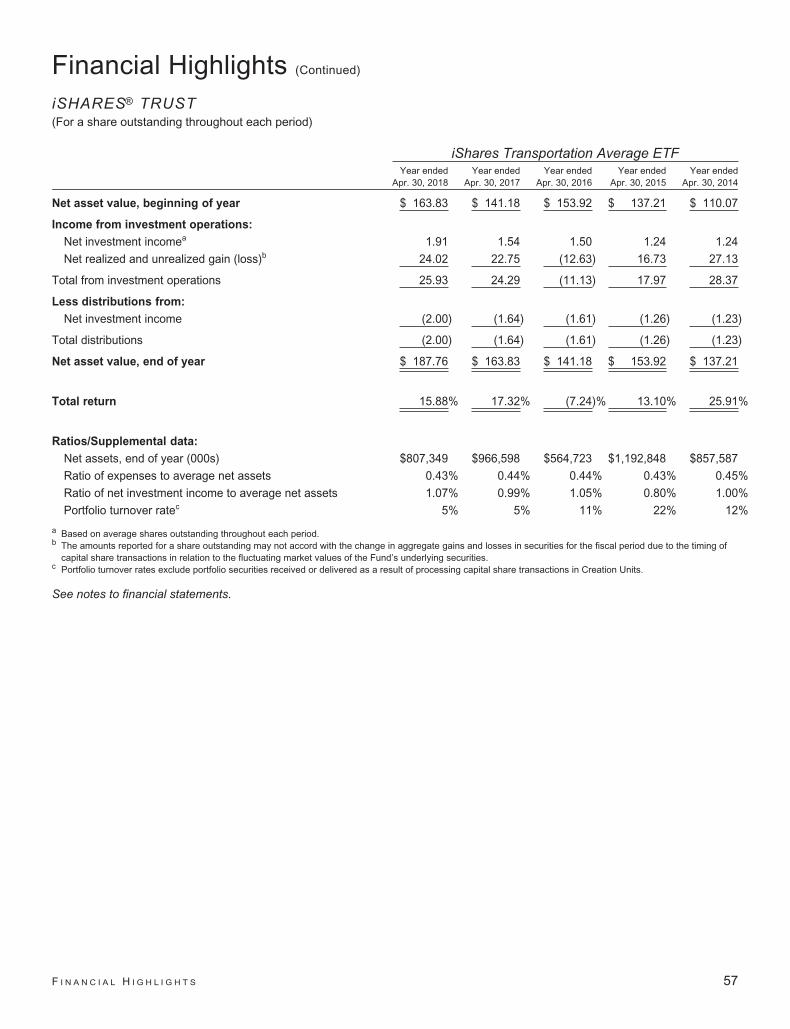
Financial Highlights (Continued)
iSHARES® TRUST(For a share outstanding throughout each period)
iShares Transportation Average ETFYear ended
Apr. 30, 2018Year ended
Apr. 30, 2017Year ended
Apr. 30, 2016Year ended
Apr. 30, 2015Year ended
Apr. 30, 2014
Net asset value, beginning of year $ 163.83 $ 141.18 $ 153.92 $ 137.21 $ 110.07
Income from investment operations:
Net investment incomea 1.91 1.54 1.50 1.24 1.24
Net realized and unrealized gain (loss)b 24.02 22.75 (12.63) 16.73 27.13
Total from investment operations 25.93 24.29 (11.13) 17.97 28.37
Less distributions from:
Net investment income (2.00) (1.64) (1.61) (1.26) (1.23)
Total distributions (2.00) (1.64) (1.61) (1.26) (1.23)
Net asset value, end of year $ 187.76 $ 163.83 $ 141.18 $ 153.92 $ 137.21
Total return 15.88% 17.32% (7.24)% 13.10% 25.91%
Ratios/Supplemental data:
Net assets, end of year (000s) $807,349 $966,598 $564,723 $1,192,848 $857,587
Ratio of expenses to average net assets 0.43% 0.44% 0.44% 0.43% 0.45%
Ratio of net investment income to average net assets 1.07% 0.99% 1.05% 0.80% 1.00%
Portfolio turnover ratec 5% 5% 11% 22% 12%
a Based on average shares outstanding throughout each period.b The amounts reported for a share outstanding may not accord with the change in aggregate gains and losses in securities for the fiscal period due to the timing of
capital share transactions in relation to the fluctuating market values of the Fund’s underlying securities.c Portfolio turnover rates exclude portfolio securities received or delivered as a result of processing capital share transactions in Creation Units.
See notes to financial statements.
F I N A N C I A L H I G H L I G H T S 57

Financial Highlights (Continued)
iSHARES® TRUST(For a share outstanding throughout each period)
iShares U.S. Energy ETFYear ended
Apr. 30, 2018Year ended
Apr. 30, 2017Year ended
Apr. 30, 2016Year ended
Apr. 30, 2015Year ended
Apr. 30, 2014
Net asset value, beginning of year $ 37.27 $ 37.91 $ 46.62 $ 53.49 $ 44.70
Income from investment operations:
Net investment incomea 1.07 0.84 1.06 1.02 0.77
Net realized and unrealized gain (loss)b 3.25 (0.62) (8.66) (6.87) 8.77
Total from investment operations 4.32 0.22 (7.60) (5.85) 9.54
Less distributions from:
Net investment income (1.12) (0.86) (1.11) (1.02) (0.75)
Total distributions (1.12) (0.86) (1.11) (1.02) (0.75)
Net asset value, end of year $ 40.47 $ 37.27 $ 37.91 $ 46.62 $ 53.49
Total return 11.92% 0.52% (16.20)% (11.03)% 21.57%
Ratios/Supplemental data:
Net assets, end of year (000s) $1,088,740 $1,159,125 $1,249,003 $2,219,116 $2,414,897
Ratio of expenses to average net assets 0.43% 0.44% 0.44% 0.43% 0.45%
Ratio of net investment income to average net assets 2.87% 2.17% 2.80% 2.04% 1.58%
Portfolio turnover ratec 6% 18% 15% 7% 6%
a Based on average shares outstanding throughout each period.b The amounts reported for a share outstanding may not accord with the change in aggregate gains and losses in securities for the fiscal period due to the timing of
capital share transactions in relation to the fluctuating market values of the Fund’s underlying securities.c Portfolio turnover rates exclude portfolio securities received or delivered as a result of processing capital share transactions in Creation Units.
See notes to financial statements.
58 2 0 1 8 i S H A R E S A N N U A L R E P O R T T O S H A R E H O L D E R S
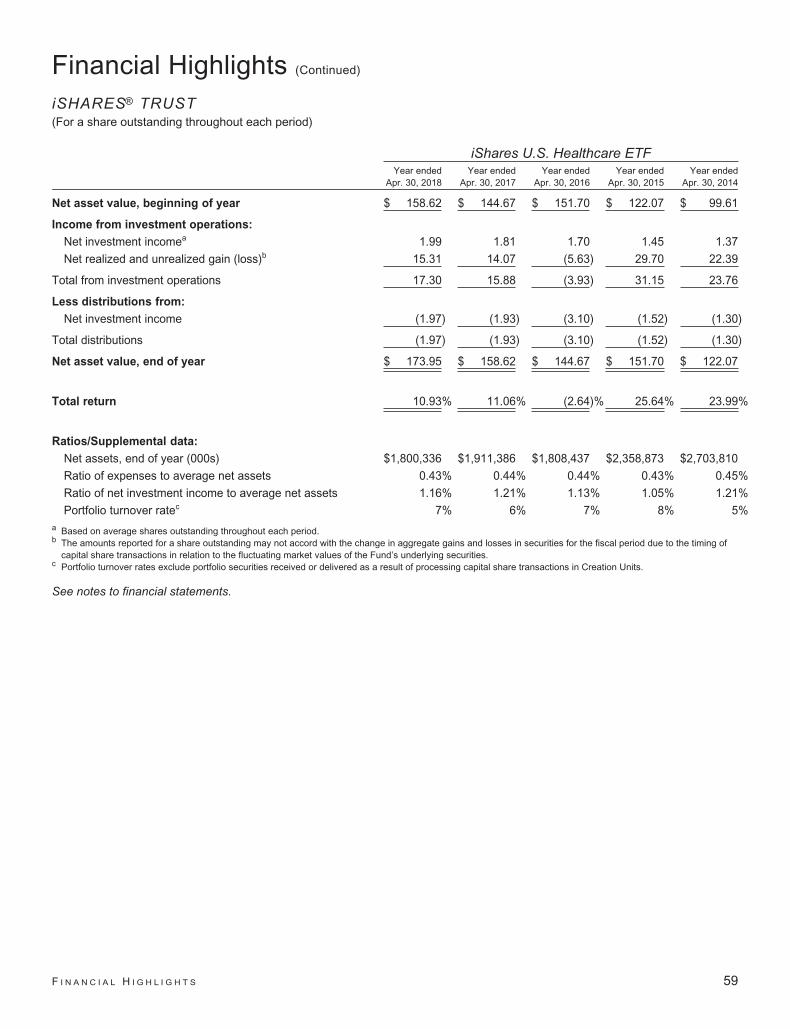
Financial Highlights (Continued)
iSHARES® TRUST(For a share outstanding throughout each period)
iShares U.S. Healthcare ETFYear ended
Apr. 30, 2018Year ended
Apr. 30, 2017Year ended
Apr. 30, 2016Year ended
Apr. 30, 2015Year ended
Apr. 30, 2014
Net asset value, beginning of year $ 158.62 $ 144.67 $ 151.70 $ 122.07 $ 99.61
Income from investment operations:
Net investment incomea 1.99 1.81 1.70 1.45 1.37
Net realized and unrealized gain (loss)b 15.31 14.07 (5.63) 29.70 22.39
Total from investment operations 17.30 15.88 (3.93) 31.15 23.76
Less distributions from:
Net investment income (1.97) (1.93) (3.10) (1.52) (1.30)
Total distributions (1.97) (1.93) (3.10) (1.52) (1.30)
Net asset value, end of year $ 173.95 $ 158.62 $ 144.67 $ 151.70 $ 122.07
Total return 10.93% 11.06% (2.64)% 25.64% 23.99%
Ratios/Supplemental data:
Net assets, end of year (000s) $1,800,336 $1,911,386 $1,808,437 $2,358,873 $2,703,810
Ratio of expenses to average net assets 0.43% 0.44% 0.44% 0.43% 0.45%
Ratio of net investment income to average net assets 1.16% 1.21% 1.13% 1.05% 1.21%
Portfolio turnover ratec 7% 6% 7% 8% 5%a Based on average shares outstanding throughout each period.b The amounts reported for a share outstanding may not accord with the change in aggregate gains and losses in securities for the fiscal period due to the timing of
capital share transactions in relation to the fluctuating market values of the Fund’s underlying securities.c Portfolio turnover rates exclude portfolio securities received or delivered as a result of processing capital share transactions in Creation Units.
See notes to financial statements.
F I N A N C I A L H I G H L I G H T S 59
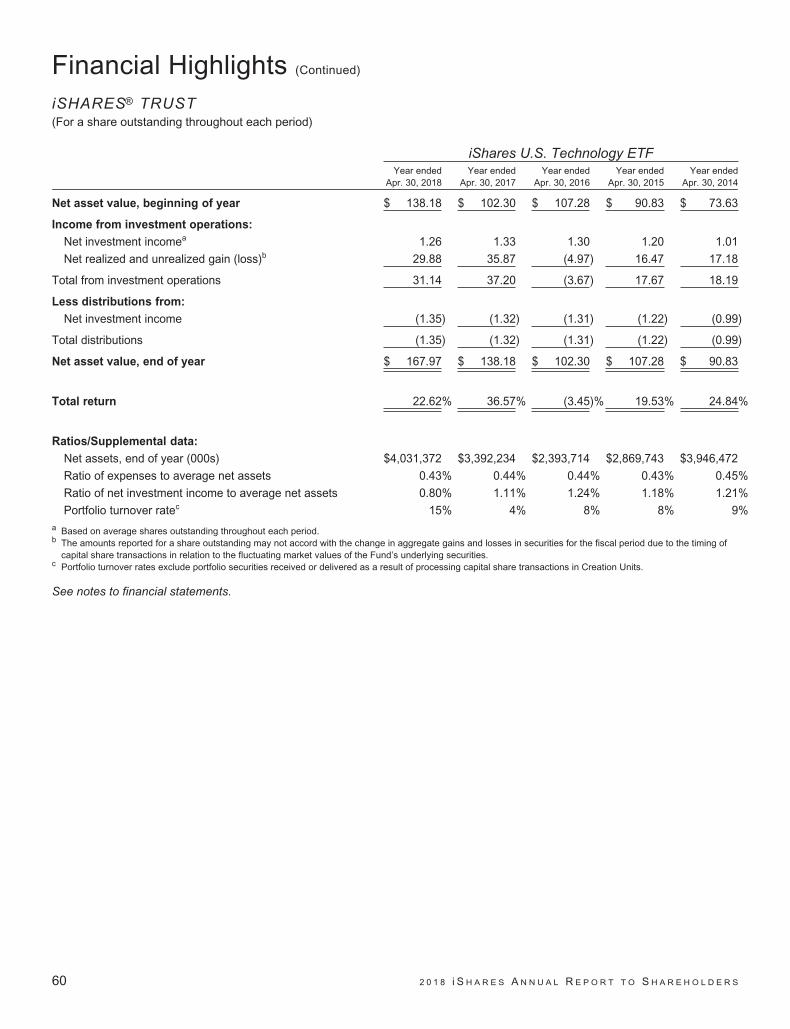
Financial Highlights (Continued)
iSHARES® TRUST(For a share outstanding throughout each period)
iShares U.S. Technology ETFYear ended
Apr. 30, 2018Year ended
Apr. 30, 2017Year ended
Apr. 30, 2016Year ended
Apr. 30, 2015Year ended
Apr. 30, 2014
Net asset value, beginning of year $ 138.18 $ 102.30 $ 107.28 $ 90.83 $ 73.63
Income from investment operations:
Net investment incomea 1.26 1.33 1.30 1.20 1.01
Net realized and unrealized gain (loss)b 29.88 35.87 (4.97) 16.47 17.18
Total from investment operations 31.14 37.20 (3.67) 17.67 18.19
Less distributions from:
Net investment income (1.35) (1.32) (1.31) (1.22) (0.99)
Total distributions (1.35) (1.32) (1.31) (1.22) (0.99)
Net asset value, end of year $ 167.97 $ 138.18 $ 102.30 $ 107.28 $ 90.83
Total return 22.62% 36.57% (3.45)% 19.53% 24.84%
Ratios/Supplemental data:
Net assets, end of year (000s) $4,031,372 $3,392,234 $2,393,714 $2,869,743 $3,946,472
Ratio of expenses to average net assets 0.43% 0.44% 0.44% 0.43% 0.45%
Ratio of net investment income to average net assets 0.80% 1.11% 1.24% 1.18% 1.21%
Portfolio turnover ratec 15% 4% 8% 8% 9%a Based on average shares outstanding throughout each period.b The amounts reported for a share outstanding may not accord with the change in aggregate gains and losses in securities for the fiscal period due to the timing of
capital share transactions in relation to the fluctuating market values of the Fund’s underlying securities.c Portfolio turnover rates exclude portfolio securities received or delivered as a result of processing capital share transactions in Creation Units.
See notes to financial statements.
60 2 0 1 8 i S H A R E S A N N U A L R E P O R T T O S H A R E H O L D E R S

Financial Highlights (Continued)
iSHARES® TRUST(For a share outstanding throughout each period)
iShares U.S. Utilities ETFYear ended
Apr. 30, 2018Year ended
Apr. 30, 2017Year ended
Apr. 30, 2016Year ended
Apr. 30, 2015Year ended
Apr. 30, 2014
Net asset value, beginning of year $ 129.30 $ 121.09 $ 111.09 $ 108.15 $ 102.50
Income from investment operations:
Net investment incomea 3.79 3.69 3.37 3.31 3.28
Net realized and unrealized gainb 0.84 8.46 11.18 3.11 5.60
Total from investment operations 4.63 12.15 14.55 6.42 8.88
Less distributions from:
Net investment income (3.50) (3.94) (4.55) (3.48) (3.23)
Total distributions (3.50) (3.94) (4.55) (3.48) (3.23)
Net asset value, end of year $ 130.43 $ 129.30 $ 121.09 $ 111.09 $ 108.15
Total return 3.59% 10.16% 13.61% 5.97% 9.08%
Ratios/Supplemental data:
Net assets, end of year (000s) $606,486 $801,673 $1,065,624 $649,849 $740,802
Ratio of expenses to average net assets 0.43% 0.44% 0.44% 0.43% 0.45%
Ratio of net investment income to average net assets 2.86% 2.96% 3.02% 2.96% 3.38%
Portfolio turnover ratec 5% 9% 6% 3% 8%a Based on average shares outstanding throughout each period.b The amounts reported for a share outstanding may not accord with the change in aggregate gains and losses in securities for the fiscal period due to the timing of
capital share transactions in relation to the fluctuating market values of the Fund’s underlying securities.c Portfolio turnover rates exclude portfolio securities received or delivered as a result of processing capital share transactions in Creation Units.
See notes to financial statements.
F I N A N C I A L H I G H L I G H T S 61

Notes to Financial StatementsiSHARES® TRUST
iShares Trust (the “Trust”) is registered under the Investment Company Act of 1940, as amended (the “1940 Act”), as an
open-end management investment company. The Trust was established as a Delaware statutory trust pursuant to an Agreement
and Declaration of Trust dated December 16, 1999.
These financial statements relate only to the following funds (each, a “Fund,” and collectively, the “Funds”):
iShares ETF
Diversification
Classification
Dow Jones U.S. Diversified
Transportation Average Non-diversified
U.S. Energy Non-diversified
U.S. Healthcare Non-diversified
U.S. Technology Non-diversified
U.S. Utilities Non-diversified
The investment objective of each Fund is to seek investment results that correspond generally to the price and yield performance,
before fees and expenses, of its underlying index. The investment adviser uses a “passive” or index approach to try to achieve
each Fund’s investment objective.
Pursuant to the Trust’s organizational documents, the Funds’ officers and trustees are indemnified against certain liabilities that
may arise out of the performance of their duties to the Funds. Additionally, in the normal course of business, the Funds enter into
contracts with service providers that contain general indemnification clauses. The Funds’ maximum exposure under these
arrangements is unknown as this would involve future claims that may be made against the Funds that have not yet occurred.
1. SIGNIFICANT ACCOUNTING POLICIES
The following significant accounting policies are consistently followed by each Fund in the preparation of its financial statements
in conformity with accounting principles generally accepted in the United States of America (“U.S. GAAP”). The preparation of
financial statements in conformity with U.S. GAAP requires management to make certain estimates and assumptions that affect
the reported amounts of assets and liabilities and disclosures of contingent assets and liabilities at the date of the financial
statements and the reported amounts of revenue and expenses during the reporting period. Actual results could differ from those
estimates. Each Fund is considered an investment company under U.S. GAAP and follows the accounting and reporting guidance
applicable to investment companies.
SECURITY VALUATION
Each Fund’s investments are valued at fair value each day that the Fund’s listing exchange is open and, for financial reporting
purposes, as of the report date should the reporting period end on a day that the Fund’s listing exchange is not open. U.S. GAAP
defines fair value as the price a fund would receive to sell an asset or pay to transfer a liability in an orderly transaction between
market participants at the measurement date. The BlackRock Global Valuation Methodologies Committee (the “Global Valuation
Committee”) provides oversight of the valuation of investments for the Funds. The investments of each Fund are valued pursuant
to policies and procedures developed by the Global Valuation Committee and approved by the Board of Trustees of the Trust (the
“Board”).
62 2 0 1 8 i S H A R E S A N N U A L R E P O R T T O S H A R E H O L D E R S

Notes to Financial Statements (Continued)
iSHARES® TRUST
• Equity investments traded on a recognized securities exchange are valued at that day’s last reported trade price or the
official closing price, as applicable, on the exchange where the stock is primarily traded. Equity investments traded on a
recognized exchange for which there were no sales on that day are valued at the last traded price.
• Open-end U.S. mutual funds (including money market funds) are valued at that day’s published net asset value (“NAV”).
In the event that application of these methods of valuation results in a price for an investment which is deemed not to be
representative of the fair value of such investment or if a price is not available, the investment will be valued by the Global
Valuation Committee, in accordance with policies approved by the Board. The fair valuation approaches that may be utilized by
the Global Valuation Committee to determine fair value include market approach, income approach and the cost approach. The
valuation techniques used under these approaches take into consideration inputs that include but are not limited to (i) attributes
specific to the investment; (ii) the principal market for the investment; (iii) the customary participants in the principal market for the
investment; (iv) data assumptions by market participants for the investment, if reasonably available; (v) quoted prices for similar
investments in active markets; and (vi) other inputs, such as future cash flows, interest rates, yield curves, volatilities, prepayment
speeds, loss severities, credit risks and/or default rates. Valuations based on such inputs are reported to the Board on a quarterly
basis.
The Global Valuation Committee employs various methods for calibrating valuation approaches for investments where an active
market does not exist, including regular due diligence of the Trust’s pricing vendors, a regular review of key inputs and
assumptions, transactional back-testing or disposition analysis to compare unrealized gains and losses to realized gains and
losses, reviews of missing or stale prices, reviews of large movements in market values, and reviews of market related activity.
Fair value pricing could result in a difference between the prices used to calculate a Fund’s NAV and the prices used by the
Fund’s underlying index, which in turn could result in a difference between the Fund’s performance and the performance of the
Fund’s underlying index.
Various inputs are used in determining the fair value of financial instruments. Inputs may be based on independent market data
(“observable inputs”) or they may be internally developed (“unobservable inputs”). These inputs to valuation techniques are
categorized into a fair value hierarchy consisting of three broad levels for financial reporting purposes as follows:
• Level 1 — Unadjusted quoted prices in active markets for identical assets or liabilities;
• Level 2 — Inputs other than quoted prices included within Level 1 that are observable for the asset or liability either directly
or indirectly, including quoted prices for similar assets or liabilities in active markets, quoted prices for identical or similar
assets or liabilities in markets that are not considered to be active, inputs other than quoted prices that are observable for
the asset or liability (such as exchange rates, financing terms, interest rates, yield curves, volatilities, prepayment speeds,
loss severities, credit risks and default rates) or other market-corroborated inputs; and
• Level 3 — Unobservable inputs for the asset or liability based on the best information available in the circumstances, to the
extent observable inputs are not available, including the Global Valuation Committee’s assumptions used in determining the
fair value of investments.
The hierarchy gives the highest priority to unadjusted quoted prices in active markets for identical assets or liabilities (Level 1
measurements) and the lowest priority to unobservable inputs (Level 3 measurements). Accordingly, the degree of judgement
exercised in determining fair value is greatest for instruments categorized in Level 3. The inputs used to measure fair value may
fall into different levels of the fair value hierarchy. In such cases, for disclosure purposes, the fair value hierarchy classification is
determined based on the lowest level input that is significant to the fair value measurement in its entirety. The fair value hierarchy
for each Fund’s investments is included in its schedule of investments.
N O T E S T O F I N A N C I A L S T A T E M E N T S 63

Notes to Financial Statements (Continued)
iSHARES® TRUST
Changes in valuation techniques may result in transfers in or out of an assigned level within the fair value hierarchy. In
accordance with the Trust’s policy, transfers between different levels of the fair value hierarchy are deemed to have occurred as
of the beginning of the reporting period. The categorization of values determined for financial instruments are based on the pricing
transparency of the financial instruments and are not necessarily an indication of the risks associated with investing in those
securities.
SECURITY TRANSACTIONS AND INCOME RECOGNITION
Security transactions are accounted for on trade date. Realized gains and losses on investment transactions are determined
using the specific identification method. Dividend income and capital gain distributions, if any, are recognized on the ex-dividend
date, net of any foreign taxes withheld at source. Any taxes withheld that are reclaimable from foreign tax authorities as of
April 30, 2018 are reflected in tax reclaims receivable. Upon notification from issuers, some of the dividend income received from
a real estate investment trust may be re-designated as a return of capital or capital gain. Non-cash dividends, if any, are
recognized on the ex-dividend date and recorded as non-cash dividend income at fair value. Distributions received by the Funds
may include a return of capital that is estimated by management. Such amounts are recorded as a reduction of the cost of
investments or reclassified to capital gains. Interest income is accrued daily.
DISTRIBUTIONS TO SHAREHOLDERS
Dividends and distributions paid by each Fund are recorded on the ex-dividend dates. Distributions are determined on a tax basis
and may differ from net investment income and net realized capital gains for financial reporting purposes. Dividends and
distributions are paid in U.S. dollars and cannot be automatically reinvested in additional shares of the Funds.
LOANS OF PORTFOLIO SECURITIES
Each Fund may lend its investment securities to approved borrowers, such as brokers, dealers and other financial institutions.
The borrower pledges and maintains with the Fund collateral consisting of cash, an irrevocable letter of credit issued by an
approved bank, or securities issued or guaranteed by the U.S. government. The initial collateral received by each Fund is
required to have a value of at least 102% of the current value of the loaned securities for securities traded on U.S. exchanges and
a value of at least 105% for all other securities. The collateral is maintained thereafter at a value equal to at least 100% of the
current value of the securities on loan. The market value of the loaned securities is determined at the close of each business day
of the Funds. Any additional required collateral is delivered to the Funds and any excess collateral is returned by the Funds on
the next business day. During the term of the loan, each Fund is entitled to all distributions made on or in respect of the loaned
securities but does not receive interest income on securities received as collateral. Loans of securities are terminable at any time
and the borrower, after notice, is required to return borrowed securities within the standard time period for settlement of securities
transactions.
Cash received as collateral for securities on loan may be reinvested in certain short-term instruments either directly on behalf of a
fund or through one or more joint accounts or money market funds, including those managed by BlackRock Fund Advisors
(“BFA”), the Funds’ investment adviser, or its affiliates. As of April 30, 2018, any securities on loan were collateralized by cash
and/or U.S. government obligations. Cash collateral received was invested in money market funds managed by BFA and is
disclosed in the schedules of investments. Any non-cash collateral received cannot be sold, re-invested or pledged by the Fund,
except in the event of borrower default. The securities on loan for each Fund are also disclosed in its schedule of investments.
The total value of any securities on loan as of April 30, 2018 and the total value of the related cash collateral are disclosed in the
statements of assets and liabilities. Income earned by the Funds from securities lending is disclosed in the statements of
operations.
64 2 0 1 8 i S H A R E S A N N U A L R E P O R T T O S H A R E H O L D E R S

Notes to Financial Statements (Continued)
iSHARES® TRUST
The risks of securities lending include the risk that the borrower may not provide additional collateral when required or may not
return the securities when due. To mitigate these risks, the Funds benefit from a borrower default indemnity provided by
BlackRock, Inc. (“BlackRock”). BlackRock’s indemnity allows for full replacement of securities loaned if the collateral received
does not cover the value of the securities loaned in the event of borrower default. Each Fund could incur a loss if the value of an
investment purchased with cash collateral falls below the value of the loaned securities or if the value of an investment purchased
with cash collateral falls below the value of the original cash collateral received.
Securities lending transactions are entered into by the Funds under Master Securities Lending Agreements (“MSLA”) which
provide the right, in the event of default (including bankruptcy or insolvency) for the non-defaulting party to liquidate the collateral
and calculate a net exposure to the defaulting party or request additional collateral. In the event that a borrower defaults, a Fund,
as lender, would offset the market value of the collateral received against the market value of the securities loaned. The value of
the collateral is typically greater than that of the market value of the securities loaned, leaving the lender with a net amount
payable to the defaulting party. However, bankruptcy or insolvency laws of a particular jurisdiction may impose restrictions on or
prohibitions against such a right of offset in the event of an MSLA counterparty’s bankruptcy or insolvency. Under the MSLA, the
borrower can resell or re-pledge the loaned securities, and a Fund can reinvest cash collateral, or, upon an event of default, resell
or re-pledge the collateral.
The following table is a summary of securities lending agreements which are subject to offset under an MSLA as of
April 30, 2018:
iShares ETF
and Counterparty
Market Value of
Securities on Loan
Cash Collateral
Received a
Net
Amount b
Dow Jones U.S.Barclays Capital Inc. $ 392,464 $ 392,464 $ —BMO Capital Markets 42,333 42,333 —BNP Paribas Prime Brokerage International Ltd. 643 643 —BNP Paribas Securities Corp. 451,032 451,032 —Citigroup Global Markets Inc. 228,153 228,153 —Credit Suisse Securities (USA) LLC 608,565 608,565 —Deutsche Bank Securities Inc. 498,313 498,313 —Goldman Sachs & Co. 1,241,461 1,241,461 —HSBC Bank PLC 157,208 151,909 (5,299)Jefferies LLC 1,012,210 1,012,210 —JPMorgan Securities LLC 844,672 844,672 —Merrill Lynch, Pierce, Fenner & Smith 237,877 237,877 —Mizuho Securities USA Inc. 161,577 161,577 —Morgan Stanley & Co. LLC (U.S. Equity Securities Lending) 2,555,172 2,555,172 —National Financial Services LLC 16,471 16,471 —SG Americas Securities LLC 66,400 66,400 —State Street Bank & Trust Company 485,795 485,795 —UBS AG 1,586,678 1,586,678 —Wells Fargo Securities LLC 1,276,127 1,276,127 —
$ 11,863,151 $ 11,857,852 $(5,299)
Transportation AverageGoldman Sachs & Co. $ 699,460 $ 699,460 $ —Scotia Capital (USA) Inc. 3,774,924 3,774,924 —
$ 4,474,384 $ 4,474,384 $ —
N O T E S T O F I N A N C I A L S T A T E M E N T S 65
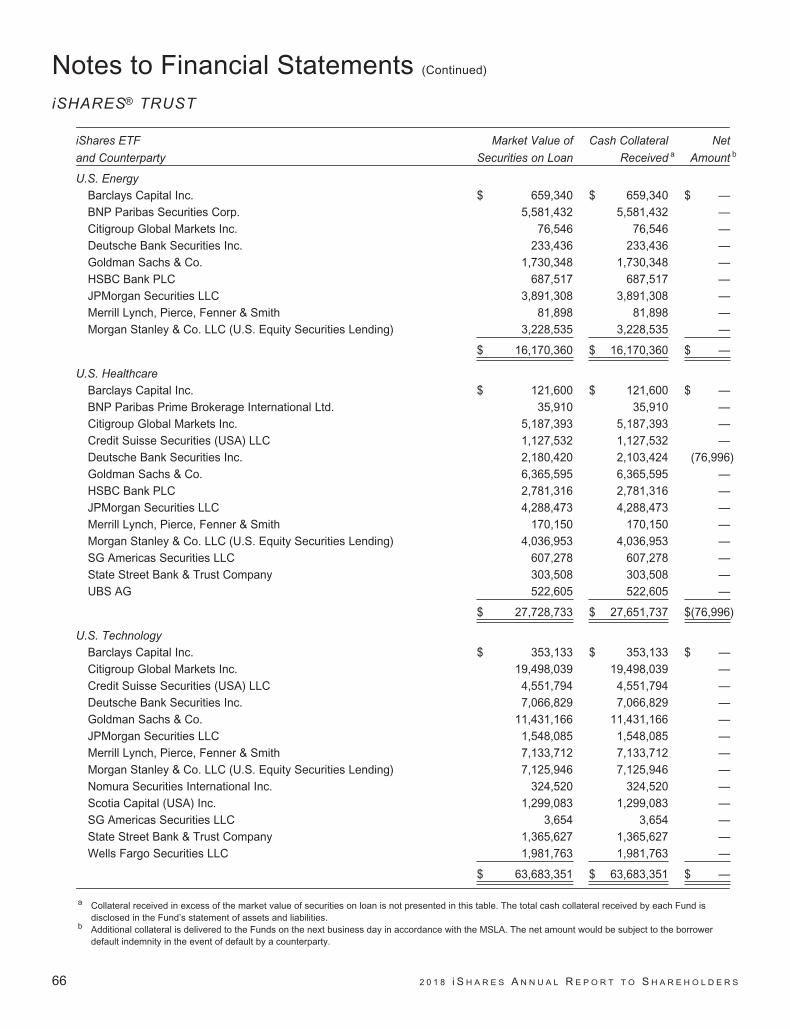
Notes to Financial Statements (Continued)
iSHARES® TRUST
iShares ETF
and Counterparty
Market Value of
Securities on Loan
Cash Collateral
Received a
Net
Amount b
U.S. EnergyBarclays Capital Inc. $ 659,340 $ 659,340 $ —BNP Paribas Securities Corp. 5,581,432 5,581,432 —Citigroup Global Markets Inc. 76,546 76,546 —Deutsche Bank Securities Inc. 233,436 233,436 —Goldman Sachs & Co. 1,730,348 1,730,348 —HSBC Bank PLC 687,517 687,517 —JPMorgan Securities LLC 3,891,308 3,891,308 —Merrill Lynch, Pierce, Fenner & Smith 81,898 81,898 —Morgan Stanley & Co. LLC (U.S. Equity Securities Lending) 3,228,535 3,228,535 —
$ 16,170,360 $ 16,170,360 $ —
U.S. HealthcareBarclays Capital Inc. $ 121,600 $ 121,600 $ —BNP Paribas Prime Brokerage International Ltd. 35,910 35,910 —Citigroup Global Markets Inc. 5,187,393 5,187,393 —Credit Suisse Securities (USA) LLC 1,127,532 1,127,532 —Deutsche Bank Securities Inc. 2,180,420 2,103,424 (76,996)Goldman Sachs & Co. 6,365,595 6,365,595 —HSBC Bank PLC 2,781,316 2,781,316 —JPMorgan Securities LLC 4,288,473 4,288,473 —Merrill Lynch, Pierce, Fenner & Smith 170,150 170,150 —Morgan Stanley & Co. LLC (U.S. Equity Securities Lending) 4,036,953 4,036,953 —SG Americas Securities LLC 607,278 607,278 —State Street Bank & Trust Company 303,508 303,508 —UBS AG 522,605 522,605 —
$ 27,728,733 $ 27,651,737 $(76,996)
U.S. TechnologyBarclays Capital Inc. $ 353,133 $ 353,133 $ —Citigroup Global Markets Inc. 19,498,039 19,498,039 —Credit Suisse Securities (USA) LLC 4,551,794 4,551,794 —Deutsche Bank Securities Inc. 7,066,829 7,066,829 —Goldman Sachs & Co. 11,431,166 11,431,166 —JPMorgan Securities LLC 1,548,085 1,548,085 —Merrill Lynch, Pierce, Fenner & Smith 7,133,712 7,133,712 —Morgan Stanley & Co. LLC (U.S. Equity Securities Lending) 7,125,946 7,125,946 —Nomura Securities International Inc. 324,520 324,520 —Scotia Capital (USA) Inc. 1,299,083 1,299,083 —SG Americas Securities LLC 3,654 3,654 —State Street Bank & Trust Company 1,365,627 1,365,627 —Wells Fargo Securities LLC 1,981,763 1,981,763 —
$ 63,683,351 $ 63,683,351 $ —
a Collateral received in excess of the market value of securities on loan is not presented in this table. The total cash collateral received by each Fund isdisclosed in the Fund’s statement of assets and liabilities.
b Additional collateral is delivered to the Funds on the next business day in accordance with the MSLA. The net amount would be subject to the borrowerdefault indemnity in the event of default by a counterparty.
66 2 0 1 8 i S H A R E S A N N U A L R E P O R T T O S H A R E H O L D E R S
Notes to Financial Statements (Continued)
iSHARES® TRUST
2. INVESTMENT ADVISORY AGREEMENT AND OTHER TRANSACTIONS WITH AFFILIATES
Pursuant to an Investment Advisory Agreement with the Trust, BFA manages the investment of each Fund’s assets. BFA is a
California corporation indirectly owned by BlackRock. Under the Investment Advisory Agreement, BFA is responsible for
substantially all expenses of the Funds, except (i) interest and taxes; (ii) brokerage commissions and other expenses connected
with the execution of portfolio transactions; (iii) distribution fees; (iv) the advisory fee payable to BFA; and (v) litigation expenses
and any extraordinary expenses (in each case as determined by a majority of the independent trustees).
For its investment advisory services to the iShares Dow Jones U.S. ETF, BFA is entitled to an annual investment advisory fee of
0.20%, accrued daily and paid monthly by the Fund, based on the average daily net assets of the Fund.
For its investment advisory services to each of the iShares Transportation Average, iShares U.S. Energy, iShares U.S.
Healthcare, iShares U.S. Technology and iShares U.S. Utilities ETFs, BFA is entitled to an annual investment advisory fee,
accrued daily and paid monthly by the Funds, based on each Fund’s allocable portion of the aggregate of the average daily net
assets of the Fund and certain other iShares funds, as follows:
Investment Advisory Fee Aggregate Average Daily Net Assets
0.48% First $10 billion
0.43 Over $10 billion, up to and including $20 billion
0.38 Over $20 billion, up to and including $30 billion
0.34 Over $30 billion, up to and including $40 billion
0.33 Over $40 billion, up to and including $50 billion
0.31 Over $50 billion
The U.S. Securities and Exchange Commission has issued an exemptive order which permits BlackRock Institutional Trust
Company, N.A. (“BTC”), an affiliate of BFA, to serve as securities lending agent for the Funds, subject to applicable conditions. As
securities lending agent, BTC bears all operational costs directly related to securities lending. Each Fund is responsible for fees in
connection with the investment of cash collateral received for securities on loan in a money market fund managed by BFA,
however, BTC has agreed to reduce the amount of securities lending income it receives in order to effectively limit the collateral
investment fees each Fund bears to an annual rate of 0.04% (the “collateral investment fees”). Securities lending income is equal
to the total of income earned from the reinvestment of cash collateral (excluding collateral investment fees), net of fees and other
payments to and from borrowers of securities. The Funds retain a portion of securities lending income and remit the remaining
portion to BTC as compensation for its services as securities lending agent.
Pursuant to a securities lending agreement, each Fund retains 71.5% of securities lending income and the amount retained can
never be less than 65% of the total of securities lending income plus the collateral investment fees. In addition, commencing the
business day following the date that the aggregate securities lending income plus the collateral investment fees generated across
all 1940 Act iShares exchange-traded funds (the “iShares ETF Complex”) in a given calendar year exceeds the aggregate
securities lending income generated across the iShares ETF Complex in the calendar year 2013, each Fund, pursuant to a
securities lending agreement, will retain for the remainder of that calendar year 75% of securities lending income and the amount
retained can never be less than 65% of the total of securities lending income plus the collateral investment fees.
N O T E S T O F I N A N C I A L S T A T E M E N T S 67
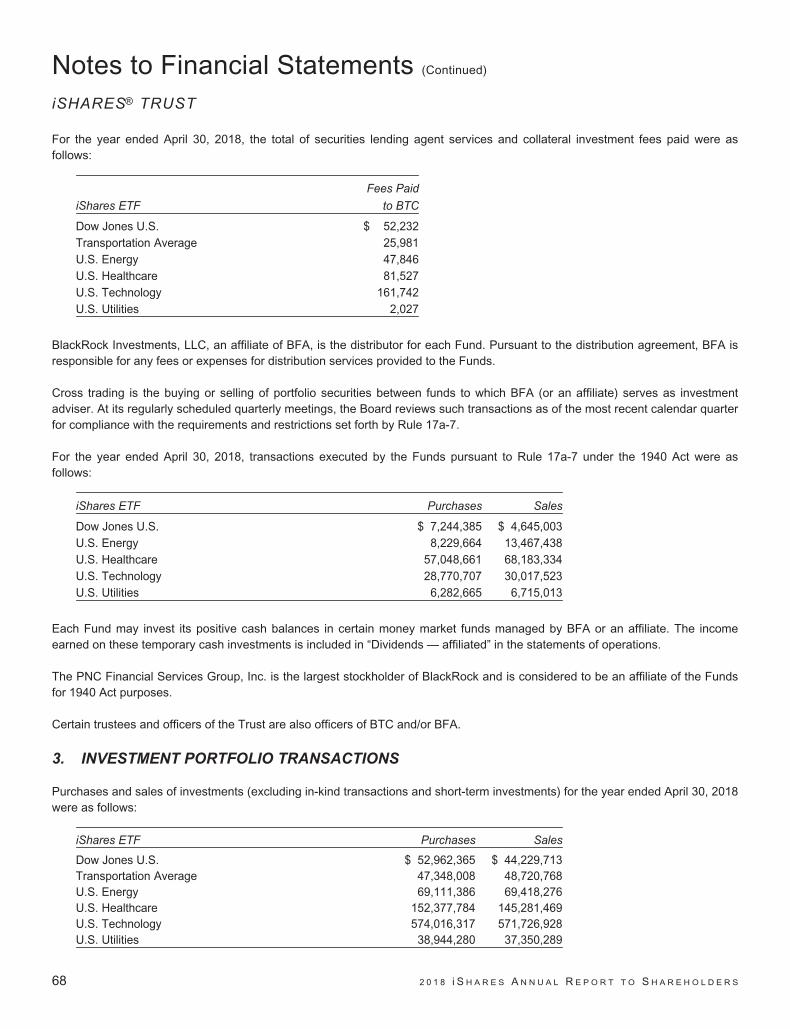
Notes to Financial Statements (Continued)
iSHARES® TRUST
For the year ended April 30, 2018, the total of securities lending agent services and collateral investment fees paid were asfollows:
iShares ETF
Fees Paid
to BTC
Dow Jones U.S. $ 52,232Transportation Average 25,981U.S. Energy 47,846U.S. Healthcare 81,527U.S. Technology 161,742U.S. Utilities 2,027
BlackRock Investments, LLC, an affiliate of BFA, is the distributor for each Fund. Pursuant to the distribution agreement, BFA isresponsible for any fees or expenses for distribution services provided to the Funds.
Cross trading is the buying or selling of portfolio securities between funds to which BFA (or an affiliate) serves as investmentadviser. At its regularly scheduled quarterly meetings, the Board reviews such transactions as of the most recent calendar quarterfor compliance with the requirements and restrictions set forth by Rule 17a-7.
For the year ended April 30, 2018, transactions executed by the Funds pursuant to Rule 17a-7 under the 1940 Act were asfollows:
iShares ETF Purchases Sales
Dow Jones U.S. $ 7,244,385 $ 4,645,003U.S. Energy 8,229,664 13,467,438U.S. Healthcare 57,048,661 68,183,334U.S. Technology 28,770,707 30,017,523U.S. Utilities 6,282,665 6,715,013
Each Fund may invest its positive cash balances in certain money market funds managed by BFA or an affiliate. The incomeearned on these temporary cash investments is included in “Dividends — affiliated” in the statements of operations.
The PNC Financial Services Group, Inc. is the largest stockholder of BlackRock and is considered to be an affiliate of the Fundsfor 1940 Act purposes.
Certain trustees and officers of the Trust are also officers of BTC and/or BFA.
3. INVESTMENT PORTFOLIO TRANSACTIONS
Purchases and sales of investments (excluding in-kind transactions and short-term investments) for the year ended April 30, 2018were as follows:
iShares ETF Purchases Sales
Dow Jones U.S. $ 52,962,365 $ 44,229,713Transportation Average 47,348,008 48,720,768U.S. Energy 69,111,386 69,418,276U.S. Healthcare 152,377,784 145,281,469U.S. Technology 574,016,317 571,726,928U.S. Utilities 38,944,280 37,350,289
68 2 0 1 8 i S H A R E S A N N U A L R E P O R T T O S H A R E H O L D E R S

Notes to Financial Statements (Continued)
iSHARES® TRUST
In-kind transactions (see Note 4) for the year ended April 30, 2018 were as follows:
iShares ETF
In-kind
Purchases
In-kind
Sales
Dow Jones U.S. $ 20,191,579 $ 118,814,484
Transportation Average 1,486,312,408 1,755,670,417
U.S. Energy 441,337,538 587,198,146
U.S. Healthcare 457,423,162 745,138,806
U.S. Technology 1,130,240,714 1,216,927,696
U.S. Utilities 397,848,417 579,768,250
4. CAPITAL SHARE TRANSACTIONS
Capital shares are issued and redeemed by each Fund only in aggregations of a specified number of shares or multiples thereof
(“Creation Units”) at NAV. Except when aggregated in Creation Units, shares of each Fund are not redeemable. Transactions in
capital shares for each Fund are disclosed in detail in the statements of changes in net assets.
The consideration for the purchase of Creation Units of a fund in the Trust generally consists of the in-kind deposit of a
designated portfolio of securities and a specified amount of cash. Certain funds in the Trust may be offered in Creation Units
solely or partially for cash in U.S. dollars. Investors purchasing and redeeming Creation Units may pay a purchase transaction fee
and a redemption transaction fee directly to State Street Bank and Trust Company, the Trust’s administrator, to offset transfer and
other transaction costs associated with the issuance and redemption of Creation Units, including Creation Units for cash.
Investors transacting in Creation Units for cash may also pay an additional variable charge to compensate the relevant fund for
certain transaction costs (i.e., stamp taxes, taxes on currency or other financial transactions, and brokerage costs) and market
impact expenses relating to investing in portfolio securities. Such variable charges, if any, are included in “Proceeds from shares
sold” in the statements of changes in net assets.
5. PRINCIPAL RISKS
In the normal course of business, each Fund invests in securities or other instruments and may enter into certain transactions,
and such activities subject the Fund to various risks, including, among others, fluctuations in the market (market risk) or failure of
an issuer to meet all of its obligations. The value of securities or other instruments may also be affected by various factors,
including, without limitation: (i) the general economy; (ii) the overall market as well as local, regional or global political and/or
social instability; (iii) regulation, taxation or international tax treaties between various countries; or (iv) currency, interest rate or
price fluctuations. Each Fund’s prospectus provides details of the risks to which the Fund is subject.
BFA uses a “passive” or index approach to try to achieve each Fund’s investment objective following the securities included in its
underlying index during upturns as well as downturns. BFA does not take steps to reduce market exposure or to lessen the
effects of a declining market. Divergence from the underlying index and the composition of the portfolio is monitored by BFA.
MARKET RISK
Market risk arises mainly from uncertainty about future values of financial instruments influenced by price, currency and interest
rate movements. It represents the potential loss a fund may suffer through holding market positions in the face of market
movements. A fund is exposed to market risk by its investment in equity, fixed income and/or financial derivative instruments or
by its investment in underlying funds. The fair value of securities held by a fund may decline due to general market conditions,
economic trends or events that are not specifically related to the issuers of the securities including local, regional or global
N O T E S T O F I N A N C I A L S T A T E M E N T S 69

Notes to Financial Statements (Continued)
iSHARES® TRUST
political, social or economic instability or to factors that affect a particular industry or group of industries. The extent of a fund’s
exposure to market risk is the market value of the investments held as shown in the fund’s schedule of investments.
A diversified portfolio, where this is appropriate and consistent with a fund’s objectives, minimizes the risk that a price change of a
particular investment will have a material impact on the NAV of a fund. The investment concentrations within each Fund’s portfolio
are disclosed in its schedule of investments.
When a fund concentrates its investments in securities within a single or limited number of market sectors, it assumes the risk
that economic, political and social conditions affecting those market sectors may have a significant impact on its investment
performance.
CREDIT RISK
Credit risk is the risk that an issuer or guarantor of debt instruments or the counterparty to a financial transaction, including
derivatives contracts, repurchase agreements or loans of portfolio securities, is unable or unwilling to make timely interest and/or
principal payments or to otherwise honor its obligations. BFA and its affiliates manage counterparty credit risk by entering into
transactions only with counterparties that they believe have the financial resources to honor their obligations and by monitoring
the financial stability of those counterparties. Financial assets, which potentially expose a fund to issuer and counterparty credit
risks, consist principally of financial instruments and receivables due from counterparties. The extent of a fund’s exposure to
credit and counterparty risks with respect to those financial assets is approximated by their value recorded in its statement of
assets and liabilities.
6. INCOME TAX INFORMATION
Each Fund is treated as an entity separate from the Trust’s other funds for federal income tax purposes. It is the policy of eachFund to qualify as a regulated investment company by complying with the provisions applicable to regulated investmentcompanies, as defined under Subchapter M of the Internal Revenue Code of 1986, as amended, and to annually distributesubstantially all of its ordinary income and any net capital gains (taking into account any capital loss carryforwards) sufficient torelieve it from all, or substantially all, federal income and excise taxes. Accordingly, no provision for federal income taxes isrequired.
U.S. GAAP requires that certain components of net assets be adjusted to reflect permanent differences between financial and taxreporting. These reclassifications have no effect on net assets or NAV per share. The following permanent differences as ofApril 30, 2018, attributable to the characterization of corporate actions, the expiration of capital loss carryforwards, distributionspaid in excess of taxable income and realized gains (losses) from in-kind redemptions, were reclassified to the followingaccounts:
iShares ETF
Paid-in
Capital
Undistributed
Net Investment
Income/Distributions
in Excess of Net
Investment Income
Undistributed
Net Realized
Gain/Accumulated
Net Realized Loss
Dow Jones U.S. $ 34,378,470 $ 125,606 $ (34,504,076)
Transportation Average 109,135,915 380,461 (109,516,376)
U.S. Energy (93,356,796) 286,394 93,070,402
U.S. Healthcare 118,549,648 — (118,549,648)
U.S. Technology 401,982,836 1,648,949 (403,631,785)
U.S. Utilities 4,801,140 — (4,801,140)
70 2 0 1 8 i S H A R E S A N N U A L R E P O R T T O S H A R E H O L D E R S

Notes to Financial Statements (Continued)
iSHARES® TRUST
The tax character of distributions paid during the years ended April 30, 2018 and April 30, 2017 was as follows:
iShares ETF 2018 2017
Dow Jones U.S.
Ordinary income $19,044,585 $18,010,104
Transportation Average
Ordinary income $ 9,873,738 $ 8,584,148
U.S. Energy
Ordinary income $31,781,233 $27,753,775
U.S. Healthcare
Ordinary income $22,513,635 $24,154,405
U.S. Technology
Ordinary income $33,204,002 $31,233,037
U.S. Utilities
Ordinary income $21,100,758 $25,227,655
As of April 30, 2018, the tax components of accumulated net earnings (losses) were as follows:
iShares ETF
Undistributed
Ordinary
Income
Capital
Loss
Carryforwards
Net
Unrealized
Gains (Losses) a Total
Dow Jones U.S. $ 932,063 $ (2,653,096) $ 372,915,736 $ 371,194,703
Transportation Average — (27,866,718) (72,076,479) (99,943,197)
U.S. Energy 19,073 (66,443,550) (241,490,734) (307,915,211)
U.S. Healthcare 1,396,100 (13,876,434) 46,333,765 33,853,431
U.S. Technology — (15,418,116) 812,267,852 796,849,736
U.S. Utilities 485,288 (15,051,981) (55,149,566) (69,716,259)
a The difference between book-basis and tax-basis unrealized gains (losses) was attributable primarily to the tax deferral of losses on wash sales, the timingand recognition of partnership income and the characterization of corporate actions.
As of April 30, 2018, the Funds had capital loss carryforwards available to offset future realized capital gains through the indicated
expiration dates as follows:
iShares ETF
Non-
Expiring a
Expiring
2019 Total
Dow Jones U.S. $ — $ 2,653,096 $ 2,653,096
Transportation Average 23,015,684 4,851,034 27,866,718
U.S. Energy 55,658,360 10,785,190 66,443,550
U.S. Healthcare 11,633,268 2,243,166 13,876,434
U.S. Technology 9,036,658 6,381,458 15,418,116
U.S. Utilities 9,554,854 5,497,127 15,051,981
a Must be utilized prior to losses subject to expiration.
N O T E S T O F I N A N C I A L S T A T E M E N T S 71

Notes to Financial Statements (Continued)
iSHARES® TRUST
For the year ended April 30, 2018, the following Funds utilized their capital loss carryforwards as follows:
iShares ETF Utilized
Dow Jones U.S. $ 2,688,353
U.S. Healthcare 1,546,427
U.S. Technology 21,110,852
As of April 30, 2018, gross unrealized appreciation and depreciation based on cost of investments (including short positions and
derivatives, if any) for U.S. federal income tax purposes were as follows:
iShares ETF
Tax
Cost
Gross
Unrealized
Appreciation
Gross
Unrealized
Depreciation
Net
Unrealized
Appreciation
(Depreciation)
Dow Jones U.S. $ 764,813,250 $432,422,524 $ (59,506,788) $ 372,915,736
Transportation Average 885,004,590 2,916,165 (74,992,644) (72,076,479)
U.S. Energy 1,346,741,768 51,191,900 (292,682,634) (241,490,734)
U.S. Healthcare 1,783,685,846 245,622,391 (199,288,626) 46,333,765
U.S. Technology 3,288,377,216 926,673,727 (114,405,875) 812,267,852
U.S. Utilities 661,676,071 12,822,028 (67,971,594) (55,149,566)
Management has analyzed tax laws and regulations and their application to the Funds as of April 30, 2018, inclusive of the open
tax return years, and does not believe there are any uncertain tax positions that require recognition of a tax liability in the Funds’
financial statements.
The Tax Cuts and Jobs Act (the “Act”) was enacted on December 22, 2017. Certain provisions of the Act were effective upon
enactment with the remainder becoming effective for tax years beginning after December 31, 2017. Although the Act does not
amend any provisions directly related to the qualification or taxation of regulated investment companies (“RICs”), the Act does
change the taxation of entities in which some RICs invest, the tax treatment of income derived from those entities and the taxation
of RIC shareholders. While management does not anticipate significant impact to the funds or to their shareholders, there is
uncertainty in the application of certain provisions in the Act. Specifically, provisions in the Act may increase the amount of or
accelerate the recognition of taxable income and may limit the deductibility of certain expenses by RICs. Until full clarity around
these provisions is obtained, the impact on the Funds’ financial statements, if any, cannot be fully determined.
7. LEGAL PROCEEDINGS
On June 16, 2016, investors (the “Plaintiffs”) in certain iShares funds (iShares Core S&P Small-Cap ETF, iShares Russell 1000
Growth ETF, iShares Core S&P 500 ETF, iShares Russell Mid-Cap Growth ETF, iShares Russell Mid-Cap ETF, iShares Russell
Mid-Cap Value ETF, iShares Select Dividend ETF, iShares Morningstar Mid-Cap ETF, iShares Morningstar Large-Cap ETF,
iShares U.S. Aerospace & Defense ETF and iShares U.S. Preferred Stock ETF) filed a putative class action lawsuit against
iShares Trust, BlackRock, Inc. and certain of its advisory affiliates, and certain directors/trustees and officers of the Funds
(collectively, “Defendants”) in California State Court. The lawsuit alleges the Defendants violated federal securities laws by failing
to adequately disclose in the prospectuses issued by the funds noted above the risks of using stop-loss orders in the event of a
‘flash crash’, such as the one that occurred on May 6, 2010. On September 18, 2017, the court issued a Statement of Decision
holding that the Plaintiffs lack standing to assert their claims. On October 11, 2017, the court entered final judgment dismissing all
of the Plaintiffs’ claims with prejudice. Plaintiffs have appealed the court’s decision.
72 2 0 1 8 i S H A R E S A N N U A L R E P O R T T O S H A R E H O L D E R S
Notes to Financial Statements (Continued)
iSHARES® TRUST
Certain iShares funds (the “Impacted Funds”), along with thousands of other former shareholders of Tribune Company
(“Tribune”), were named as defendants in one or more lawsuits (the “Litigation”) arising out of Tribune’s 2007 leveraged buyout
transaction (“LBO”). The Litigation seeks to “claw back” from former Tribune shareholders, including the Impacted Funds,
proceeds received in connection with the LBO. The iShares Dow Jones U.S. ETF received proceeds of $118,354 in the LBO. The
claims that were originally brought against the Impacted Funds were dismissed but are currently subject to appeals in multiple
appellate courts. The outcome of these appeals could result in new claims being brought against the Impacted Funds and/or
previously dismissed claims being revived and subject to continuing litigation. The Impacted Funds intend to vigorously defend
the Litigation.
8. SUBSEQUENT EVENTS
Management has evaluated the impact of all subsequent events on the Funds through the date the financial statements were
available to be issued and has determined that there were no subsequent events requiring adjustment or disclosure in the
financial statements.
N O T E S T O F I N A N C I A L S T A T E M E N T S 73

Report of Independent Registered Public Accounting Firm
To the Board of Trustees of iShares Trust and
Shareholders of iShares Dow Jones U.S. ETF, iShares Transportation Average ETF,
iShares U.S. Energy ETF, iShares U.S. Healthcare ETF, iShares U.S. Technology ETF and
iShares U.S. Utilities ETF
Opinions on the Financial Statements
We have audited the accompanying statements of assets and liabilities, including the schedules of investments, of iShares Dow
Jones U.S. ETF, iShares Transportation Average ETF, iShares U.S. Energy ETF, iShares U.S. Healthcare ETF, iShares U.S.
Technology ETF and iShares U.S. Utilities ETF (six of the funds constituting iShares Trust, hereafter collectively referred to as the
“Funds”) as of April 30, 2018, the related statements of operations for the year ended April 30, 2018, the statements of changes in
net assets for each of the two years in the period ended April 30, 2018, including the related notes, and the financial highlights for
each of the five years in the period ended April 30, 2018 (collectively referred to as the “financial statements”). In our opinion, the
financial statements present fairly, in all material respects, the financial position of each of the Funds as of April 30, 2018, the
results of each of their operations for the year then ended, the changes in each of their net assets for each of the two years in the
period ended April 30, 2018 and each of the financial highlights for each of the five years in the period ended April 30, 2018 in
conformity with accounting principles generally accepted in the United States of America.
Basis for Opinions
These financial statements are the responsibility of the Funds’ management. Our responsibility is to express an opinion on the
Funds’ financial statements based on our audits. We are a public accounting firm registered with the Public Company Accounting
Oversight Board (United States) (“PCAOB”) and are required to be independent with respect to the Funds in accordance with the
U.S. federal securities laws and the applicable rules and regulations of the Securities and Exchange Commission and the
PCAOB.
We conducted our audits of these financial statements in accordance with the standards of the PCAOB. Those standards require
that we plan and perform the audit to obtain reasonable assurance about whether the financial statements are free of material
misstatement, whether due to error or fraud.
Our audits included performing procedures to assess the risks of material misstatement of the financial statements, whether due
to error or fraud, and performing procedures that respond to those risks. Such procedures included examining, on a test basis,
evidence regarding the amounts and disclosures in the financial statements. Our audits also included evaluating the accounting
principles used and significant estimates made by management, as well as evaluating the overall presentation of the financial
statements. Our procedures included confirmation of securities owned as of April 30, 2018 by correspondence with the custodian,
transfer agent and brokers; when replies were not received from brokers, we performed other auditing procedures. We believe
that our audits provide a reasonable basis for our opinions.
PricewaterhouseCoopers LLP
San Francisco, California
June 21, 2018
We have served as the auditor of one or more BlackRock investment companies since 2000.
74 2 0 1 8 i S H A R E S A N N U A L R E P O R T T O S H A R E H O L D E R S

Tax Information (Unaudited)
iSHARES® TRUST
The following maximum amounts are hereby designated as qualified dividend income for individuals for the fiscal year ended
April 30, 2018:
iShares ETF
Qualified
Dividend
Income
Dow Jones U.S. $20,033,223
Transportation Average 12,734,296
U.S. Energy 35,974,398
U.S. Healthcare 31,199,409
U.S. Technology 47,052,360
U.S. Utilities 24,727,744
For corporate shareholders, the percentage of income dividends paid during the fiscal year ended April 30, 2018 that qualified for
the dividends-received deduction were as follows:
iShares ETF
Dividends-
Received
Deduction
Dow Jones U.S. 96.73%
Transportation Average 100.00
U.S. Energy 88.17
U.S. Healthcare 100.00
U.S. Technology 100.00
U.S. Utilities 100.00
T A X I N F O R M A T I O N 75
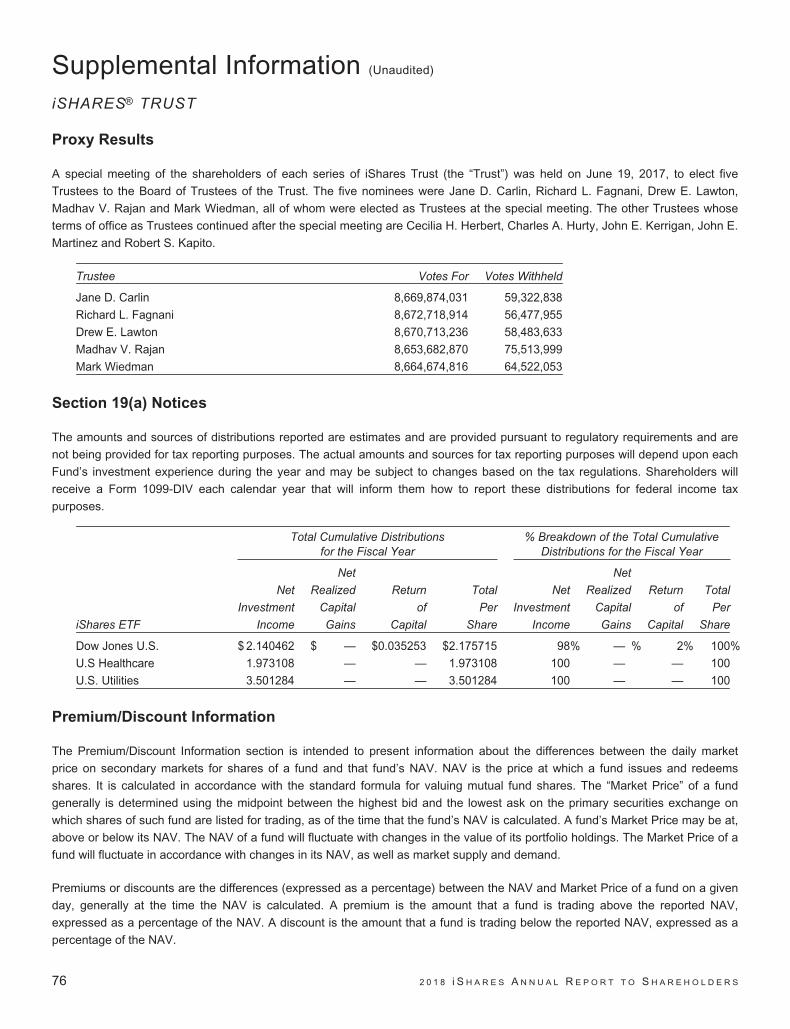
Supplemental Information (Unaudited)
iSHARES® TRUST
Proxy Results
A special meeting of the shareholders of each series of iShares Trust (the “Trust”) was held on June 19, 2017, to elect five
Trustees to the Board of Trustees of the Trust. The five nominees were Jane D. Carlin, Richard L. Fagnani, Drew E. Lawton,
Madhav V. Rajan and Mark Wiedman, all of whom were elected as Trustees at the special meeting. The other Trustees whose
terms of office as Trustees continued after the special meeting are Cecilia H. Herbert, Charles A. Hurty, John E. Kerrigan, John E.
Martinez and Robert S. Kapito.
Trustee Votes For Votes Withheld
Jane D. Carlin 8,669,874,031 59,322,838
Richard L. Fagnani 8,672,718,914 56,477,955
Drew E. Lawton 8,670,713,236 58,483,633
Madhav V. Rajan 8,653,682,870 75,513,999
Mark Wiedman 8,664,674,816 64,522,053
Section 19(a) Notices
The amounts and sources of distributions reported are estimates and are provided pursuant to regulatory requirements and are
not being provided for tax reporting purposes. The actual amounts and sources for tax reporting purposes will depend upon each
Fund’s investment experience during the year and may be subject to changes based on the tax regulations. Shareholders will
receive a Form 1099-DIV each calendar year that will inform them how to report these distributions for federal income tax
purposes.
Total Cumulative Distributionsfor the Fiscal Year
% Breakdown of the Total CumulativeDistributions for the Fiscal Year
iShares ETF
Net
Investment
Income
Net
Realized
Capital
Gains
Return
of
Capital
Total
Per
Share
Net
Investment
Income
Net
Realized
Capital
Gains
Return
of
Capital
Total
Per
Share
Dow Jones U.S. $ 2.140462 $ — $0.035253 $2.175715 98% — % 2% 100%
U.S Healthcare 1.973108 — — 1.973108 100 — — 100
U.S. Utilities 3.501284 — — 3.501284 100 — — 100
Premium/Discount Information
The Premium/Discount Information section is intended to present information about the differences between the daily market
price on secondary markets for shares of a fund and that fund’s NAV. NAV is the price at which a fund issues and redeems
shares. It is calculated in accordance with the standard formula for valuing mutual fund shares. The “Market Price” of a fund
generally is determined using the midpoint between the highest bid and the lowest ask on the primary securities exchange on
which shares of such fund are listed for trading, as of the time that the fund’s NAV is calculated. A fund’s Market Price may be at,
above or below its NAV. The NAV of a fund will fluctuate with changes in the value of its portfolio holdings. The Market Price of a
fund will fluctuate in accordance with changes in its NAV, as well as market supply and demand.
Premiums or discounts are the differences (expressed as a percentage) between the NAV and Market Price of a fund on a given
day, generally at the time the NAV is calculated. A premium is the amount that a fund is trading above the reported NAV,
expressed as a percentage of the NAV. A discount is the amount that a fund is trading below the reported NAV, expressed as a
percentage of the NAV.
76 2 0 1 8 i S H A R E S A N N U A L R E P O R T T O S H A R E H O L D E R S

Supplemental Information (Unaudited) (Continued)
iSHARES® TRUST
Premium/discount information for the Funds covering the most recently completed calendar year and the most recently completed
calendar quarters since that year (or the life of the Fund, if shorter) is publicly accessible, free of charge, at www.iShares.com.
The following information shows the frequency of distributions of premiums and discounts for the Funds for the immediately
preceding five calendar years (or from the inception date of the Fund, if less than five years) through the date of the most recent
calendar quarter-end. Each line in each table shows the number of trading days in which the Fund traded within the premium/
discount range indicated. The number of trading days in each premium/discount range is also shown as a percentage of the total
number of trading days in the period covered by each table. All data presented here represents past performance, which cannot
be used to predict future results.
iShares Dow Jones U.S. ETFPeriod Covered: January 1, 2013 through March 31, 2018
Premium/Discount Range
Number
of Days
Percentage of
Total Days
Greater than 0.0% and Less than 0.5% . . . . . . . . . . . . . . . . . . . . . . . . . . . . . . . . . . . . . . . . . . . . . . . . . . . . . . 554 41.97%
At NAV . . . . . . . . . . . . . . . . . . . . . . . . . . . . . . . . . . . . . . . . . . . . . . . . . . . . . . . . . . . . . . . . . . . . . . . . . . . . . . . . 205 15.53
Less than 0.0% and Greater than –0.5% . . . . . . . . . . . . . . . . . . . . . . . . . . . . . . . . . . . . . . . . . . . . . . . . . . . . . 561 42.50
1,320 100.00%
iShares Transportation Average ETFPeriod Covered: January 1, 2013 through March 31, 2018
Premium/Discount Range
Number
of Days
Percentage of
Total Days
Greater than 0.5% . . . . . . . . . . . . . . . . . . . . . . . . . . . . . . . . . . . . . . . . . . . . . . . . . . . . . . . . . . . . . . . . . . . . . . . 5 0.38%
Greater than 0.0% and Less than 0.5% . . . . . . . . . . . . . . . . . . . . . . . . . . . . . . . . . . . . . . . . . . . . . . . . . . . . . . 550 41.66
At NAV . . . . . . . . . . . . . . . . . . . . . . . . . . . . . . . . . . . . . . . . . . . . . . . . . . . . . . . . . . . . . . . . . . . . . . . . . . . . . . . . 285 21.59
Less than 0.0% and Greater than –0.5% . . . . . . . . . . . . . . . . . . . . . . . . . . . . . . . . . . . . . . . . . . . . . . . . . . . . . 476 36.05
Less than –0.5% and Greater than –1.0% . . . . . . . . . . . . . . . . . . . . . . . . . . . . . . . . . . . . . . . . . . . . . . . . . . . . 1 0.08
Less than –1.0% and Greater than –1.5% . . . . . . . . . . . . . . . . . . . . . . . . . . . . . . . . . . . . . . . . . . . . . . . . . . . . 1 0.08
Less than –1.5% and Greater than –2.0% . . . . . . . . . . . . . . . . . . . . . . . . . . . . . . . . . . . . . . . . . . . . . . . . . . . . 1 0.08
Less than –2.0% . . . . . . . . . . . . . . . . . . . . . . . . . . . . . . . . . . . . . . . . . . . . . . . . . . . . . . . . . . . . . . . . . . . . . . . . 1 0.08
1,320 100.00%
iShares U.S. Energy ETFPeriod Covered: January 1, 2013 through March 31, 2018
Premium/Discount Range
Number
of Days
Percentage of
Total Days
Greater than 0.0% and Less than 0.5% . . . . . . . . . . . . . . . . . . . . . . . . . . . . . . . . . . . . . . . . . . . . . . . . . . . . . . 532 40.30%
At NAV . . . . . . . . . . . . . . . . . . . . . . . . . . . . . . . . . . . . . . . . . . . . . . . . . . . . . . . . . . . . . . . . . . . . . . . . . . . . . . . . 236 17.88
Less than 0.0% and Greater than –0.5% . . . . . . . . . . . . . . . . . . . . . . . . . . . . . . . . . . . . . . . . . . . . . . . . . . . . . 552 41.82
1,320 100.00%
S U P P L E M E N T A L I N F O R M A T I O N 77
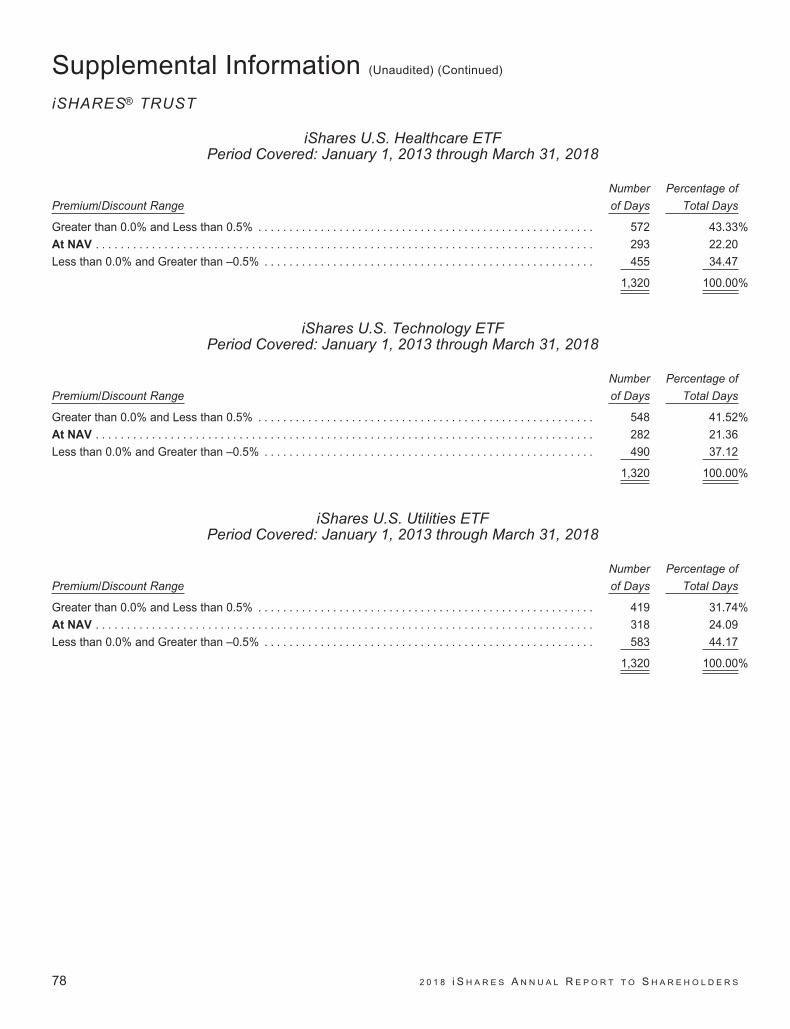
Supplemental Information (Unaudited) (Continued)
iSHARES® TRUST
iShares U.S. Healthcare ETFPeriod Covered: January 1, 2013 through March 31, 2018
Premium/Discount Range
Number
of Days
Percentage of
Total Days
Greater than 0.0% and Less than 0.5% . . . . . . . . . . . . . . . . . . . . . . . . . . . . . . . . . . . . . . . . . . . . . . . . . . . . . . 572 43.33%
At NAV . . . . . . . . . . . . . . . . . . . . . . . . . . . . . . . . . . . . . . . . . . . . . . . . . . . . . . . . . . . . . . . . . . . . . . . . . . . . . . . . 293 22.20
Less than 0.0% and Greater than –0.5% . . . . . . . . . . . . . . . . . . . . . . . . . . . . . . . . . . . . . . . . . . . . . . . . . . . . . 455 34.47
1,320 100.00%
iShares U.S. Technology ETFPeriod Covered: January 1, 2013 through March 31, 2018
Premium/Discount Range
Number
of Days
Percentage of
Total Days
Greater than 0.0% and Less than 0.5% . . . . . . . . . . . . . . . . . . . . . . . . . . . . . . . . . . . . . . . . . . . . . . . . . . . . . . 548 41.52%
At NAV . . . . . . . . . . . . . . . . . . . . . . . . . . . . . . . . . . . . . . . . . . . . . . . . . . . . . . . . . . . . . . . . . . . . . . . . . . . . . . . . 282 21.36
Less than 0.0% and Greater than –0.5% . . . . . . . . . . . . . . . . . . . . . . . . . . . . . . . . . . . . . . . . . . . . . . . . . . . . . 490 37.12
1,320 100.00%
iShares U.S. Utilities ETFPeriod Covered: January 1, 2013 through March 31, 2018
Premium/Discount Range
Number
of Days
Percentage of
Total Days
Greater than 0.0% and Less than 0.5% . . . . . . . . . . . . . . . . . . . . . . . . . . . . . . . . . . . . . . . . . . . . . . . . . . . . . . 419 31.74%
At NAV . . . . . . . . . . . . . . . . . . . . . . . . . . . . . . . . . . . . . . . . . . . . . . . . . . . . . . . . . . . . . . . . . . . . . . . . . . . . . . . . 318 24.09
Less than 0.0% and Greater than –0.5% . . . . . . . . . . . . . . . . . . . . . . . . . . . . . . . . . . . . . . . . . . . . . . . . . . . . . 583 44.17
1,320 100.00%
78 2 0 1 8 i S H A R E S A N N U A L R E P O R T T O S H A R E H O L D E R S
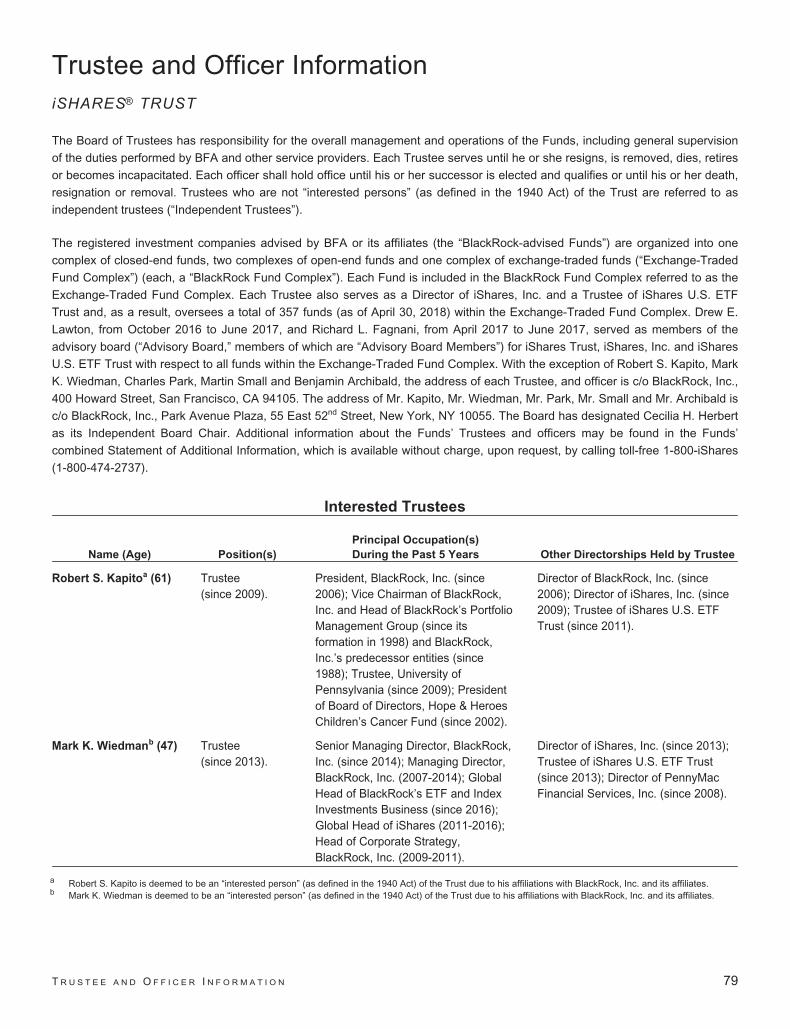
Trustee and Officer InformationiSHARES® TRUST
The Board of Trustees has responsibility for the overall management and operations of the Funds, including general supervision
of the duties performed by BFA and other service providers. Each Trustee serves until he or she resigns, is removed, dies, retires
or becomes incapacitated. Each officer shall hold office until his or her successor is elected and qualifies or until his or her death,
resignation or removal. Trustees who are not “interested persons” (as defined in the 1940 Act) of the Trust are referred to as
independent trustees (“Independent Trustees”).
The registered investment companies advised by BFA or its affiliates (the “BlackRock-advised Funds”) are organized into one
complex of closed-end funds, two complexes of open-end funds and one complex of exchange-traded funds (“Exchange-Traded
Fund Complex”) (each, a “BlackRock Fund Complex”). Each Fund is included in the BlackRock Fund Complex referred to as the
Exchange-Traded Fund Complex. Each Trustee also serves as a Director of iShares, Inc. and a Trustee of iShares U.S. ETF
Trust and, as a result, oversees a total of 357 funds (as of April 30, 2018) within the Exchange-Traded Fund Complex. Drew E.
Lawton, from October 2016 to June 2017, and Richard L. Fagnani, from April 2017 to June 2017, served as members of the
advisory board (“Advisory Board,” members of which are “Advisory Board Members”) for iShares Trust, iShares, Inc. and iShares
U.S. ETF Trust with respect to all funds within the Exchange-Traded Fund Complex. With the exception of Robert S. Kapito, Mark
K. Wiedman, Charles Park, Martin Small and Benjamin Archibald, the address of each Trustee, and officer is c/o BlackRock, Inc.,
400 Howard Street, San Francisco, CA 94105. The address of Mr. Kapito, Mr. Wiedman, Mr. Park, Mr. Small and Mr. Archibald is
c/o BlackRock, Inc., Park Avenue Plaza, 55 East 52nd Street, New York, NY 10055. The Board has designated Cecilia H. Herbert
as its Independent Board Chair. Additional information about the Funds’ Trustees and officers may be found in the Funds’
combined Statement of Additional Information, which is available without charge, upon request, by calling toll-free 1-800-iShares
(1-800-474-2737).
Interested Trustees
Name (Age) Position(s)
Principal Occupation(s)
During the Past 5 Years Other Directorships Held by Trustee
Robert S. Kapitoa (61) Trustee(since 2009).
President, BlackRock, Inc. (since2006); Vice Chairman of BlackRock,Inc. and Head of BlackRock’s PortfolioManagement Group (since itsformation in 1998) and BlackRock,Inc.’s predecessor entities (since1988); Trustee, University ofPennsylvania (since 2009); Presidentof Board of Directors, Hope & HeroesChildren’s Cancer Fund (since 2002).
Director of BlackRock, Inc. (since2006); Director of iShares, Inc. (since2009); Trustee of iShares U.S. ETFTrust (since 2011).
Mark K. Wiedmanb (47) Trustee(since 2013).
Senior Managing Director, BlackRock,Inc. (since 2014); Managing Director,BlackRock, Inc. (2007-2014); GlobalHead of BlackRock’s ETF and IndexInvestments Business (since 2016);Global Head of iShares (2011-2016);Head of Corporate Strategy,BlackRock, Inc. (2009-2011).
Director of iShares, Inc. (since 2013);Trustee of iShares U.S. ETF Trust(since 2013); Director of PennyMacFinancial Services, Inc. (since 2008).
a Robert S. Kapito is deemed to be an “interested person” (as defined in the 1940 Act) of the Trust due to his affiliations with BlackRock, Inc. and its affiliates.b Mark K. Wiedman is deemed to be an “interested person” (as defined in the 1940 Act) of the Trust due to his affiliations with BlackRock, Inc. and its affiliates.
T R U S T E E A N D O F F I C E R I N F O R M A T I O N 79

Trustee and Officer Information (Continued)
iSHARES® TRUST
Independent Trustees
Name (Age) Position(s)
Principal Occupation(s)
During the Past 5 Years Other Directorships Held by Trustee
Cecilia H. Herbert (69) Trustee(since 2005);IndependentBoard Chair(since 2016).
Trustee and Member of the Finance,Technology and Quality Committee ofStanford Health Care (since 2016);Trustee and Member of the InvestmentCommittee, WNET, a New York publicmedia company (since 2011); Chair(1994-2005) and Member (since 1992)of the Investment Committee,Archdiocese of San Francisco;Director (1998-2013) and President(2007-2011) of the Board of Directors,Catholic Charities CYO; Trustee(2002-2011) and Chair of the Financeand Investment Committee (2006-2010) of the Thacher School.
Director of iShares, Inc. (since 2005);Trustee of iShares U.S. ETF Trust(since 2011); Independent Board Chairof iShares, Inc. and iShares U.S. ETFTrust (since 2016); Trustee of ForwardFunds (14 portfolios) (since 2009);Trustee of Salient MF Trust (4portfolios) (since 2015).
Jane D. Carlin (62) Trustee(since 2015); RiskCommittee Chair(since 2016).
Consultant (since 2012); ManagingDirector and Global Head of FinancialHolding Company Governance &Assurance and the Global Head ofOperational Risk Management ofMorgan Stanley (2006-2012).
Director of iShares, Inc. (since 2015);Trustee of iShares U.S. ETF Trust(since 2015); Director of PHHCorporation (mortgage solutions)(since 2012); Director of The HanoverInsurance Group, Inc. (since 2016).
Richard L. Fagnani (63) Trustee(since 2017);Equity PlusCommittee Chair(since 2017).
Partner, KPMG LLP (2002-2016). Director of iShares, Inc. (since 2017);Trustee of iShares U.S. ETF Trust(since 2017).
Charles A. Hurty (74) Trustee(since 2005);Audit CommitteeChair(since 2006).
Retired; Partner, KPMG LLP(1968-2001).
Director of iShares, Inc. (since 2005);Trustee of iShares U.S. ETF Trust(since 2011); Director of SkyBridgeAlternative Investments Multi-AdviserHedge Fund Portfolios LLC (2portfolios) (since 2002).
John E. Kerrigan (62) Trustee(since 2005);SecuritiesLendingCommittee Chair(since 2016).
Chief Investment Officer, Santa ClaraUniversity (since 2002).
Director of iShares, Inc. (since 2005);Trustee of iShares U.S. ETF Trust(since 2011).
Drew E. Lawton (59) Trustee(since 2017);15(c) CommitteeChair(since 2017).
Senior Managing Director of New YorkLife Insurance Company (2010-2015).
Director of iShares, Inc. (since 2017);Trustee of iShares U.S. ETF Trust(since 2017).
80 2 0 1 8 i S H A R E S A N N U A L R E P O R T T O S H A R E H O L D E R S
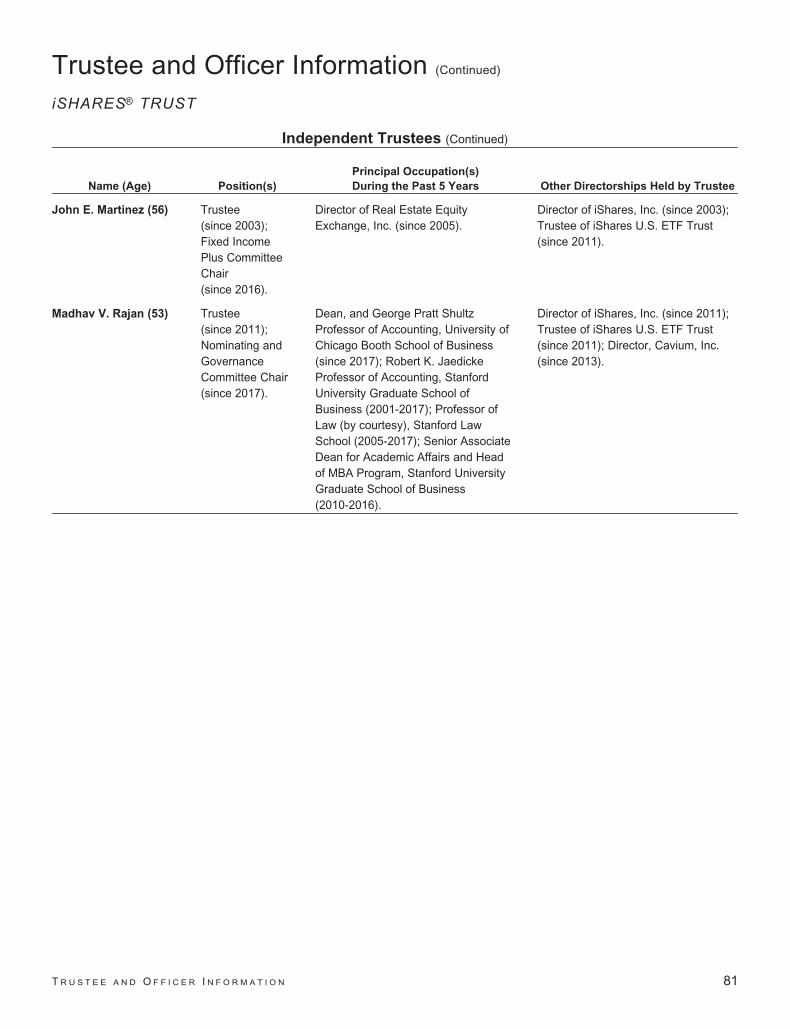
Trustee and Officer Information (Continued)
iSHARES® TRUST
Independent Trustees (Continued)
Name (Age) Position(s)
Principal Occupation(s)
During the Past 5 Years Other Directorships Held by Trustee
John E. Martinez (56) Trustee(since 2003);Fixed IncomePlus CommitteeChair(since 2016).
Director of Real Estate EquityExchange, Inc. (since 2005).
Director of iShares, Inc. (since 2003);Trustee of iShares U.S. ETF Trust(since 2011).
Madhav V. Rajan (53) Trustee(since 2011);Nominating andGovernanceCommittee Chair(since 2017).
Dean, and George Pratt ShultzProfessor of Accounting, University ofChicago Booth School of Business(since 2017); Robert K. JaedickeProfessor of Accounting, StanfordUniversity Graduate School ofBusiness (2001-2017); Professor ofLaw (by courtesy), Stanford LawSchool (2005-2017); Senior AssociateDean for Academic Affairs and Headof MBA Program, Stanford UniversityGraduate School of Business(2010-2016).
Director of iShares, Inc. (since 2011);Trustee of iShares U.S. ETF Trust(since 2011); Director, Cavium, Inc.(since 2013).
T R U S T E E A N D O F F I C E R I N F O R M A T I O N 81

Trustee and Officer Information (Continued)
iSHARES® TRUST
Officers
Name (Age) Position(s)
Principal Occupation(s)
During the Past 5 Years
Martin Small (42) President(since 2016).
Managing Director, BlackRock, Inc. (since 2010); Head of U.S. iShares (since2015); Co-Head of the U.S. Financial Markets Advisory Group, BlackRock, Inc.(2008-2014).
Jack Gee (58) Treasurer andChief FinancialOfficer(since 2008).
Managing Director, BlackRock, Inc. (since 2009); Senior Director of FundAdministration of Intermediary Investor Business, BGI (2009).
Benjamin Archibald (42) Secretary(since 2015).
Managing Director, BlackRock, Inc. (since 2014); Director, BlackRock, Inc.(2010-2013): Secretary of the BlackRock-advised mutual funds (since 2012).
Alan Mason (57) Executive VicePresident(since 2016).
Managing Director, BlackRock, Inc. (since 2009).
Steve Messinger (55) Executive VicePresident(since 2016).
Managing Director, BlackRock, Inc. (2007-2014 and since 2016); ManagingDirector, Beacon Consulting Group (2014-2016).
Charles Park (50) Chief ComplianceOfficer(since 2006).
Chief Compliance Officer of BlackRock Advisors, LLC and the BlackRock-advisedFunds in the Equity-Bond Complex, the Equity-Liquidity Complex and theClosed-End Complex (since 2014); Chief Compliance Officer of BFA (since 2006).
Scott Radell (49) Executive VicePresident(since 2012).
Managing Director, BlackRock, Inc. (since 2009); Head of Portfolio Solutions,BlackRock, Inc. (since 2009).
82 2 0 1 8 i S H A R E S A N N U A L R E P O R T T O S H A R E H O L D E R S
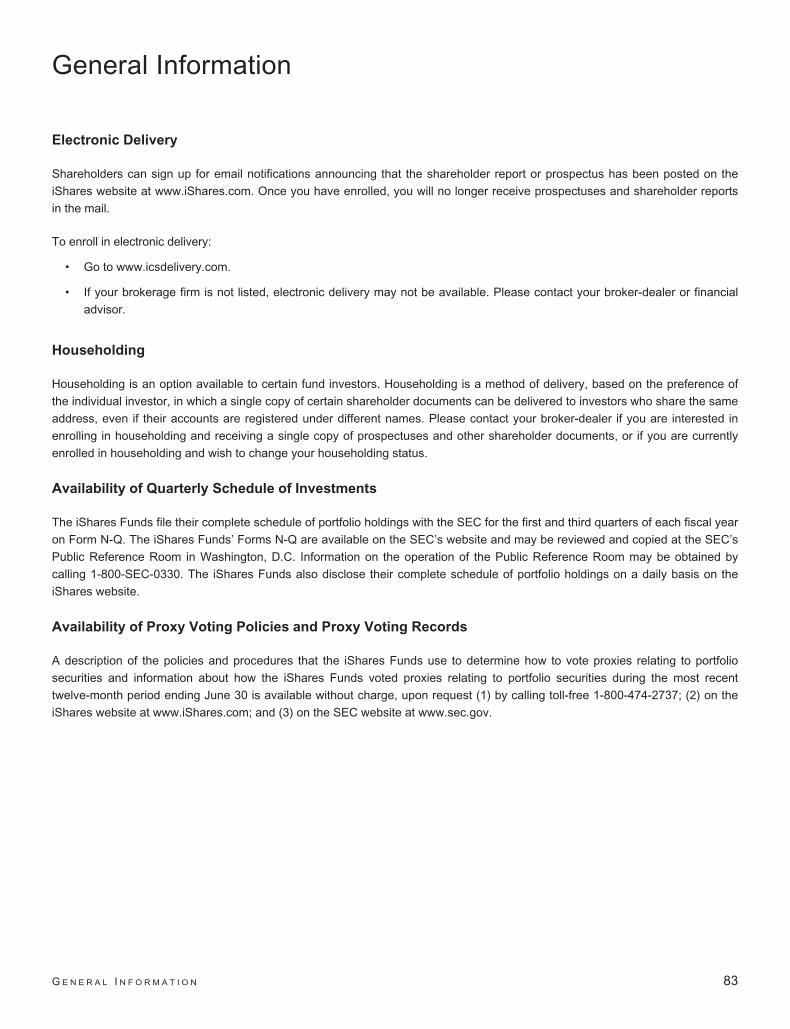
General Information
Electronic Delivery
Shareholders can sign up for email notifications announcing that the shareholder report or prospectus has been posted on the
iShares website at www.iShares.com. Once you have enrolled, you will no longer receive prospectuses and shareholder reports
in the mail.
To enroll in electronic delivery:
• Go to www.icsdelivery.com.
• If your brokerage firm is not listed, electronic delivery may not be available. Please contact your broker-dealer or financial
advisor.
Householding
Householding is an option available to certain fund investors. Householding is a method of delivery, based on the preference of
the individual investor, in which a single copy of certain shareholder documents can be delivered to investors who share the same
address, even if their accounts are registered under different names. Please contact your broker-dealer if you are interested in
enrolling in householding and receiving a single copy of prospectuses and other shareholder documents, or if you are currently
enrolled in householding and wish to change your householding status.
Availability of Quarterly Schedule of Investments
The iShares Funds file their complete schedule of portfolio holdings with the SEC for the first and third quarters of each fiscal year
on Form N-Q. The iShares Funds’ Forms N-Q are available on the SEC’s website and may be reviewed and copied at the SEC’s
Public Reference Room in Washington, D.C. Information on the operation of the Public Reference Room may be obtained by
calling 1-800-SEC-0330. The iShares Funds also disclose their complete schedule of portfolio holdings on a daily basis on the
iShares website.
Availability of Proxy Voting Policies and Proxy Voting Records
A description of the policies and procedures that the iShares Funds use to determine how to vote proxies relating to portfolio
securities and information about how the iShares Funds voted proxies relating to portfolio securities during the most recent
twelve-month period ending June 30 is available without charge, upon request (1) by calling toll-free 1-800-474-2737; (2) on the
iShares website at www.iShares.com; and (3) on the SEC website at www.sec.gov.
G E N E R A L I N F O R M A T I O N 83

Notes:
84 2 0 1 8 i S H A R E S A N N U A L R E P O R T T O S H A R E H O L D E R S

Notes:
N O T E S 85

Notes:
86 2 0 1 8 i S H A R E S A N N U A L R E P O R T T O S H A R E H O L D E R S


For more information visit www.iShares.com or call 1-800-iShares (1-800-474-2737)
This report is intended for the Funds’ shareholders. It may not be distributed to prospective investors unless it is preceded or accompanied by
the current prospectus.
Investing involves risk, including possible loss of principal.
The iShares Funds are distributed by BlackRock Investments, LLC (together with its affiliates, “BlackRock”).
The iShares Funds are not sponsored, endorsed, issued, sold or promoted by S&P Dow Jones Indices, LLC, nor does this company make anyrepresentation regarding the advisability of investing in the iShares Funds. BlackRock is not affiliated with the company listed above.
©2018 BlackRock, Inc. All rights reserved. iSHARES and BLACKROCK are registered trademarks of BlackRock, Inc. or its subsidiaries. All other marks arethe property of their respective owners.iS
-AR
-401
-041
8