AREA PROFILE 15-COUNTY METRO AREA - data.mo.gov · Kansas City, MO Planning and Development...
24
AREA PROFILE 15-COUNTY METRO AREA May 2, 2014 NOTE: Data in shaded cells are based upon data from the 2008-2012 American Community Survey. Absolute numbers have been proportioned to conform with numbers of 2010 Census population, households and housing units. Percentages are assumed to approximate 2010 percentages. Data are not shown for years in which data are not available for all or part of the area being examined. Prepared For: Complimentary Copy Prepared By: City Planning and Development Department City of Kansas City, Missouri 15th Floor - City Hall 414 East 12th Street Kansas City, Missouri 64106-2795 Phone (816) 513-2817 Fax (816) 513-2838
Transcript of AREA PROFILE 15-COUNTY METRO AREA - data.mo.gov · Kansas City, MO Planning and Development...

AREA PROFILE
15-COUNTY METRO AREA
May 2, 2014
NOTE: Data in shaded cells are based upon data from the
2008-2012 American Community Survey.
Absolute numbers have been proportioned to conform with numbers of
2010 Census population, households and housing units.
Percentages are assumed to approximate 2010 percentages.
Data are not shown for years in which data are not available
for all or part of the area being examined.
Prepared For:
Complimentary Copy
Prepared By:
City Planning and Development Department
City of Kansas City, Missouri
15th Floor - City Hall
414 East 12th Street
Kansas City, Missouri 64106-2795
Phone (816) 513-2817
Fax (816) 513-2838

TABLE OF CONTENTS
SUBJECT PAGE
REPORT 1 - SUMMARY 1
REPORT 2 - GENERAL POPULATION CHARACTERISTICS 2
CHART 1 - POPULATION 3
REPORT 3 - HOUSING UNIT CHARACTERISTICS 4
CHART 2 - HOUSING 5
REPORT 4 - HOUSING UNIT OCCUPANCY 6
REPORT 5 - LIVING ARRANGEMENTS 7
CHART 3 - HOUSEHOLDS 8
REPORT 6 - EMPLOYMENT OF RESIDENTS 9
REPORT 7 - INCOME 10
REPORT 8 - TRANSPORTATION, EDUCATION AND HEALTH 11
CHART 4 - INCOME AND EDUCATION 12
REPORT 9 - LAND USE AND DENSITY 13
REPORT 10 - HISTORY AND FORECASTS OF POPULATION AND HOUSEHOLDS 14
REPORT 11 - HISTORY OF BASIC HOUSING CHARACTERISTICS 15
REPORT 12 - FORECASTS OF EMPLOYMENT BY PLACE OF WORK 16
POPULATION CHARACTERISTICS 1980 1990 2000 2010 1980 1990 2000 2010
Persons (%'s are % change from
10 yrs previous) 1,504,209 1,636,528 1,836,038 2,035,334 4.7 8.8 12.2 10.9
Sex
Male - - - 996,319 - - - 49.0
Female - - - 1,039,015 - - - 51.0
Race and Ethnicity
White - - - 1,596,643 - - - 78.4
African American - - - 254,509 - - - 12.5
Other Races - - - 184,182 - - - 9.0
Hispanic Origin (of any race) - - - 166,683 - - - 8.2
Median Age (percents are % of
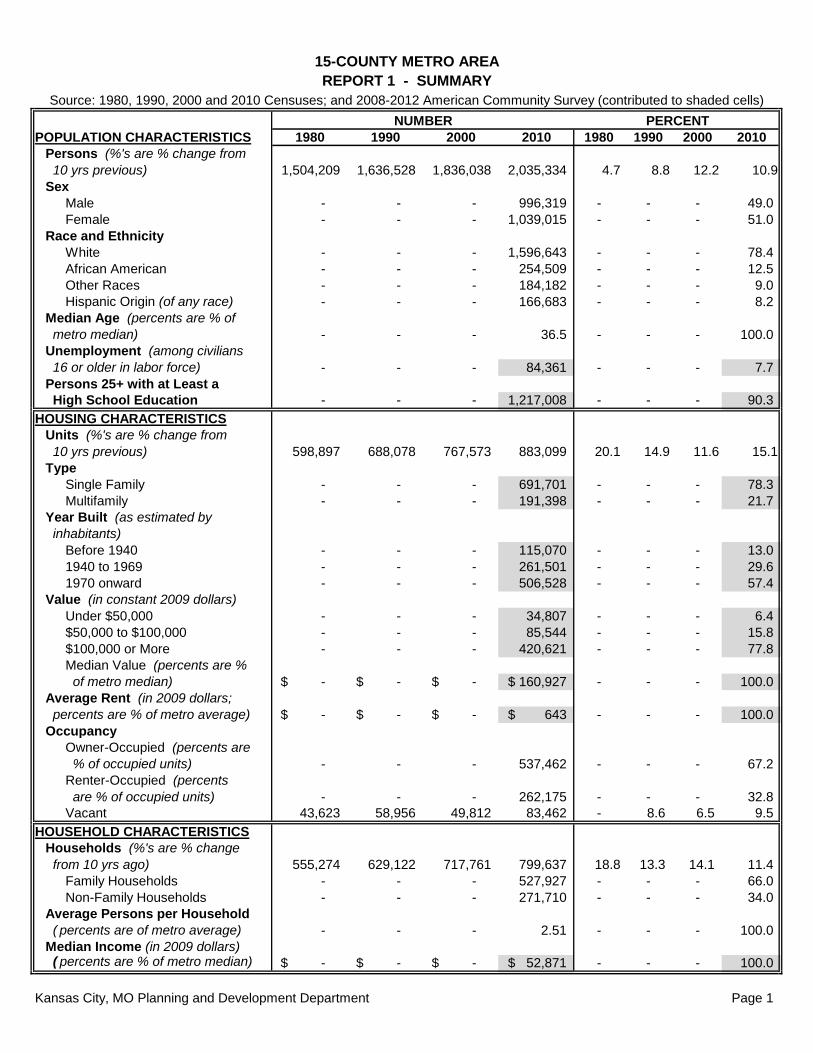
metro median) - - - 36.5 - - - 100.0
Unemployment (among civilians
16 or older in labor force) - - - 84,361 - - - 7.7
Persons 25+ with at Least a
High School Education - - - 1,217,008 - - - 90.3
HOUSING CHARACTERISTICS
Units (%'s are % change from
10 yrs previous) 598,897 688,078 767,573 883,099 20.1 14.9 11.6 15.1
Type
Single Family - - - 691,701 - - - 78.3
Multifamily - - - 191,398 - - - 21.7
Year Built (as estimated by
inhabitants)
Before 1940 - - - 115,070 - - - 13.0
1940 to 1969 - - - 261,501 - - - 29.6
1970 onward - - - 506,528 - - - 57.4
Value (in constant 2009 dollars)
Under $50,000 - - - 34,807 - - - 6.4
$50,000 to $100,000 - - - 85,544 - - - 15.8
$100,000 or More - - - 420,621 - - - 77.8
Median Value (percents are %
of metro median) -$ -$ -$ 160,927$ - - - 100.0
Average Rent (in 2009 dollars;
percents are % of metro average) -$ -$ -$ 643$ - - - 100.0
Occupancy
Owner-Occupied (percents are
% of occupied units) - - - 537,462 - - - 67.2
Renter-Occupied (percents
are % of occupied units) - - - 262,175 - - - 32.8
Vacant 43,623 58,956 49,812 83,462 - 8.6 6.5 9.5
HOUSEHOLD CHARACTERISTICS
Households (%'s are % change
from 10 yrs ago) 555,274 629,122 717,761 799,637 18.8 13.3 14.1 11.4
Family Households - - - 527,927 - - - 66.0
Non-Family Households - - - 271,710 - - - 34.0
Average Persons per Household
( percents are of metro average) - - - 2.51 - - - 100.0
Median Income (in 2009 dollars) ( percents are % of metro median) -$ -$ -$ 52,871$ - - - 100.0
Kansas City, MO Planning and Development Department Page 1
15-COUNTY METRO AREA
REPORT 1 - SUMMARY
Source: 1980, 1990, 2000 and 2010 Censuses; and 2008-2012 American Community Survey (contributed to shaded cells)
NUMBER PERCENT

CHARACTERISTIC 1980 1990 2000 2010 1980 1990 2000 2010
POPULATION (%'s are % change from
10 years previous) 1,504,209 1,636,528 1,836,038 2,035,334 4.7 8.8 12.2 10.9
SEX
Male - - - 996,319 - - - 49.0
Female - - - 1,039,015 - - - 51.0
RACE AND ETHNICITY
All Persons
Race
White - - - 1,596,643 - - - 78.4
African American - - - 254,509 - - - 12.5
Native American - - - 10,437 - - - 0.5
Asian (pre-2000 includes Pacific) - - - 46,221 - - - 2.3
Pacific Islander - - - 3,213 - - - 0.2
Other Races (pre-2000 includes
More than One Race) - - - 68,068 - - - 3.3
More than One Race - - - 56,243 - - - 2.8
Hispanic Origin (of any race) - - - 166,683 - - - 8.2
Minority (non-white and / or of
Hispanic Origin) - - - 520,446 - - - 25.6
Persons Under 18 Years Old
Race
White - - - 375,127 - - - 71.9
African American - - - 75,443 - - - 14.5
Native American - - - 2,659 - - - 0.5
Asian - - - 12,566 - - - 2.4
Pacific Islander - - - 1,071 - - - 0.2
Other Races - - - 24,817 - - - 4.8
More than One Race - - - 30,177 - - - 5.8
Hispanic Origin (of any race) - - - 64,673 - - - 12.4
Minority (non-white and / or of Hispanic Origin) - - - 177,948 - - - 34.1
AGE
Under 5 Years - - - 145,822 - - - 7.2
5 to 9 Years - - - 146,336 - - - 7.2
10 to 14 Years - - - 143,726 - - - 7.1
15 to 19 Years - - - 134,724 - - - 6.6
20 to 24 Years - - - 119,810 - - - 5.9
25 to 34 Years - - - 285,929 - - - 14.0
35 to 44 Years - - - 275,455 - - - 13.5
45 to 54 Years - - - 303,991 - - - 14.9
55 to 64 Years - - - 235,917 - - - 11.6
65 to 74 Years - - - 130,423 - - - 6.4
75 Years or Older - - - 113,201 - - - 5.6
Median Age (number is in years,
percent is this median's percent
of the metropolitan area median) - - - 36.5 - - - 100.0
School-Aged Children (5 to 17) - - - 376,038 - - - 18.5
Households with Children Under 18 - - - 272,465 - - - 34.1
Elderly (65 years or older) - - - 243,624 - - - 12.0
Elderly Householder Households - - - 158,975 - - - 19.9
Kansas City, MO Planning and Development Department Page 2
15-COUNTY METRO AREA
NUMBER PERCENT
Source: 1980, 1990, 2000 and 2010 Censuses
REPORT 2 - GENERAL POPULATION CHARACTERISTICS

Kansas City, MO Planning and Development Department Page 3
POPULATIONSelected Area = 15-COUNTY METRO AREA
-
500,000
1,000,000
1,500,000
2,000,000
2,500,000
1940 1950 1960 1970 1980 1990 2000 2010
Nu
mb
er
of
Pe
op
le
Year
NUMBER OF PEOPLE Source: 1940 through 2010 Censuses
0%
5%
10
%
15
%
20
%
25
%
30
%
65 Plus
55 to 64
45 to 54
35 to 44
20 to 35
10 to 19
0 to 9
Percent of People
Ag
e G
rou
p
AGE Source: 2010 Census
Selected Area City
RACE Source: 2010 Census
White African American Native American Asian
Pacific Islander Other Race Multiracial

Page 3

CHARACTERISTIC 1980 1990 2000 2010 1980 1990 2000 2010
HOUSING UNITS (percents are % change
from 10 years previous) 598,897 688,078 767,573 883,099 20.1 14.9 11.6 15.1
TYPE
Single Family - - - 691,701 - - - 78.3
Mobile Homes - - - 18,809 - - - 2.1
Other Single Family - - - 672,892 - - - 76.2
Multifamily - - - 191,398 - - - 21.2
YEAR BUILT (among housing
still existing in data source year)
Before 1940 - - - 115,070 - - - 13.0
1940 to 1949 - - - 44,936 - - - 5.1
1950 to 1959 - - - 109,026 - - - 12.3
1960 to 1969 - - - 107,540 - - - 12.2
1970 to 1979 - - - 140,357 - - - 15.9
1980 to 1989 (for 1980 only
first three months reflected) - - - 113,143 - - - 12.8
1990 to 1999 (for 1990 only
first three months reflected) - - - 126,664 - - - 14.3
2000 to 2010 (for 2000 only
first three months reflected) - - - 126,364 - - - 14.3
VALUE (in year 2009 housing value dollars*
for owner-occupied, non-mobile, single
family homes on fewer than 10 acres,
without a business or medical office)
Under $25,000 - - - 15,821 - - - 2.9
$25,000 to $50,000 - - - 18,986 - - - 3.5
$50,000 to $80,000 - - - 41,510 - - - 7.7
$80,000 to $100,000 - - - 44,034 - - - 8.1
$100,000 to $150,000 - - - 123,912 - - - 22.9
$150,000 to $200,000 - - - 116,481 - - - 21.5
$200,000 or More - - - 180,228 - - - 33.3
$200,000 to $250,000 - - - 67,087 - - - 12.4
$250,000 to $300,000 - - - 39,957 - - - 7.4
$300,000 to $400,000 - - - 36,070 - - - 6.7
$400,000 to $500,000 - - - 15,890 - - - 2.9
$500,000 to $750,000 - - - 11,989 - - - 2.2
$750,000 to $1,000,000 - - - 4,142 - - - 0.8
$1,000,000 or More - - - 3,557 - - - 0.7
Median Value (percent is this
median's % of the metro median) -$ -$ -$ 160,927$ - - - 100.0
AVERAGE RENT (in 2009 dollars.
% is this average's % of metro) -$ -$ -$ 643$ - - - 100.0
HOUSING COSTS AS % OF INCOME
Owned units paying 35% or more - - - 94,878 - - - 17.7
Rented units paying 35% or more - - - 93,558 - - - 38.4
Total paying 35% or more - - - 188,435 - - - 24.1
* 1980, 1990 and 2000 figures were derived as follows: Value category thresholds for those years' census data
were multiplied by factors reflecting home value inflation from 1980 to 1990, 1990 to 2000, and 2000 to 2009. These
thresholds were compared with 2008-12 value thresholds. Numbers of homes falling in each 2008-12 category
were interpolated according to where the inflated 1980, 1990 and 2000 thresholds fell.
Kansas City, MO Planning and Development Department Page 4
15-COUNTY METRO AREA
Source: 1980, 1990, 2000 and 2010 Censuses; and 2008-2012 ACS (contributed to shaded cells)
REPORT 3 - HOUSING UNIT CHARACTERISTICS
NUMBER PERCENT

Kansas City, MO Planning and Development Department Page 5
HOUSINGSelected Area = 15-COUNTY METRO AREA
-
100,000
200,000
300,000
400,000
500,000
600,000
700,000
800,000
900,000
1,000,000
1940 1950 1960 1970 1980 1990 2000 2010
Nu
mb
er
of
Ho
us
ing
Un
its
Year
HOUSING UNITS Source: 1940 through 2010 Censuses
0%
5%
10%
15%
20%
25%
30%
1000 Plus
750 to 1000
500 to 750
400 to 500
300 to 400
250 to 300
200 to 250
150 to 200
100 to 150
80 to 100
50 to 80
25 to 50
Under 25
Percent of Housing Units
Va
lue
in
Th
ou
sa
nd
s o
f D
olla
rs
VALUE OF OWNED HOMES Source: 2008-2012 American Community
Survey
Selected Area City
0%
5%
10%
15%
20%
25%
30%
2000-09
1990-99
1980-89
1970-79
1960-69
1950-59
1940-49
Pre-1940
Percent of Housing Units
Pe
rio
d o
f C
on
str
uc
tio
n
YEAR CREATED Source: 2008-2012 American Community
Survey
Selected Area City

Page 5

CHARACTERISTIC 1980 1990 2000 2010 1980 1990 2000 2010
OCCUPIED (percents are % of all
housing units) 555,274 629,122 717,761 799,637 92.7 91.4 93.5 90.5
Tenure (percents are % of all
occupied units)
Owner-Occupied - - - 537,462 - - - 67.2
Renter-Occupied - - - 262,175 - - - 32.8
Owner-Occupied Single Family
Homes (percents are % of
occupied single family homes) - - - 531,427 - - - 83.0
VACANT (percents are % of all
housing units) 43,623 58,956 49,812 83,462 7.1 8.6 6.5 9.5
Tenure Sought (percents are %
of all vacant units)
For Sale - - - 14,707 - - - 17.6
For Rent - - - 34,810 - - - 41.7
Not on the Market - - - 33,945 - - - 40.7
Proportion of Tenure Type
For Sale (percents are % of all
units that either are owner-
occupied or offered for sale) - - - 14,707 - - - 2.7
For Rent (percents are % of all
units that either are renter-
occupied or offered for rent) - - - 34,810 - - - 11.7
TENURE BY ETHNICITY
White Householder Units
Owner-Occupied - - - 471,227 - - - 72.5
Renter-Occupied - - - 178,786 - - - 27.5
African American Hhr. Units
Owner-Occupied - - - 40,754 - - - 41.1
Renter-Occupied - - - 58,400 - - - 58.9
Hispanic Householder Units
Owner-Occupied - - - 22,092 - - - 50.0
Renter-Occupied - - - 22,050 - - - 50.0
OVERCROWDED (Occupied units
with more than one person per
room. Percents are % of all
occupied units) - - - 13,318 - - - 1.7
Kansas City, MO Planning and Development Department Page 6
NUMBER PERCENT
Source: 1980, 1990, 2000 and 2010 Censuses; and 2008-2012 ACS (contributed to shaded cells)
15-COUNTY METRO AREA
REPORT 4 - HOUSING UNIT OCCUPANCY

CHARACTERISTIC 1980 1990 2000 2010 1980 1990 2000 2010
HOUSEHOLDS (%'s are % change from
10 years previous) 555,274 629,122 717,761 799,637 18.8 13.3 14.1 11.4
TYPES OF HOUSEHOLDS (percents are
among total households)
Families - - - 527,927 - - - 66.0
Married Couples - - - 392,071 - - - 49.0
With Own Children Under 18 - - - 168,850 - - - 21.1
Without Own Children Under 18 - - - 223,221 - - - 27.9
Female Householder, No Husband - - - 99,022 - - - 12.4
With Own Children Under 18 - - - 59,013 - - - 7.4
Without Own Children Under 18 - - - 40,009 - - - 5.0
Male Householder, No Wife - - - 36,834 - - - 4.6
With Own Children Under 18 - - - 19,964 - - - 2.5
Without Own Children Under 18 - - - 16,870 - - - 2.1
Non-Family Households - - - 271,710 - - - 34.0
SIZE OF HOUSEHOLDS
1 Person - - - 221,927 - - - 27.8
2 Persons - - - 265,778 - - - 33.2
3 Persons - - - 126,124 - - - 15.8
4 Persons - - - 106,504 - - - 13.3
5 Persons - - - 49,611 - - - 6.2
6 Persons or More - - - 29,693 - - - 3.7
Average (Number is in persons. Percent
is this average's percent of the
metropolitan area average) - - - 2.51 - - - 100.0
Owner-Occupied - - - 2.62 - - - 100.0
Renter-Occupied - - - 2.26 - - - 100.0
GROUP QUARTERS POPULATION
(percents are % of total population) 25,809 33,536 33,203 32,031 1.6 2.0 1.8 1.6
Kansas City, MO Planning and Development Department Page 7
15-COUNTY METRO AREA
REPORT 5 - LIVING ARRANGEMENTS
Source: 1980, 1990, 2000 and 2010 Census
NUMBER PERCENT

Kansas City, MO Planning and Development Department Page 8
HOUSEHOLDSSelected Area = 15-COUNTY METRO AREA
0%
5%
10%
15%
20%
25%
30%
35%
40%
45%
50%
Non-Family Households
Male Householder (no wife) Without Children
Male Householder (no wife) With Children
Female Householder (no husband) Without Children
Female Householder (no husband) With Children
Married Couples Without Children
Married Couples With Children
Percent of Households
Typ
e o
f H
ou
se
ho
ld
TYPES OF HOUSEHOLDS Source: 2010 Census
Selected Area City
0%
5%
10%
15%
20%
25%
30%
35%
40%
1 2 3 4 5 6 Plus
Pe
rce
nt
of
Ho
us
eh
old
s
Persons per Household
SIZE OF HOUSEHOLDS Source: 2010 Census
Selected Area City

Page 8

CHARACTERISTIC 1980 1990 2000 2010 1980 1990 2000 2010
LABOR FORCE STATUS (for civilians 16
or older)
Male
In Labor Force and Employed - - - 519,060 - - - 33.1
In Labor Force but Unemployed - - - 45,757 - - - 2.9
Not in Labor Force - - - 192,908 - - - 12.3
Female
In Labor Force and Employed - - - 487,213 - - - 31.0
In Labor Force but Unemployed - - - 38,604 - - - 2.5
Not in Labor Force - - - 286,899 - - - 18.3
Total Unemployed (percents are % of
the total labor force) - - - 84,361 - - - 7.7
TYPE OF WORK (employed 16 or older)
Industrial Classification
Agriculture, Fishing, Forestry, Mining - - - 7,858 - - - 0.8
Construction - - - 64,092 - - - 6.4
Manufacturing - - - 97,249 - - - 9.7
Trans., Communication, Utilities - - - - - - - -
Transportation, Warehousing, Utilities,
Information - - - 85,259 - - - 8.5
Wholesale Trade - - - 34,347 - - - 3.4
Retail Trade - - - 114,042 - - - 11.3
Finance, Insurance, Real Estate - - - 84,410 - - - 8.4
Professional and Related Services - - - - - - - -
Professional and Managerial Services - - - 120,412 - - - 12.0
Education, Health and Social Services - - - 221,627 - - - 22.0
Personal, Entertainment and
Recreational Services - - - - - - - -
Entertainment, Accommodation, and
Food Services - - - 82,006 - - - 8.1
Business and Repair Services - - - - - - - -
Other Services (repair, personal, etc.) - - - 48,474 - - - 4.8
Public Administration - - - 46,496 - - - 4.6
Occupation
Managerial and Professional - - - 386,148 - - - 38.4
Technical, Sales, Admin. Support - - - - - - - -
Sales, Office, Administrative Support - - - 261,980 - - - 26.0
Service - - - 159,518 - - - 15.9
Farming, Forestry, and Fishing - - - 2,425 - - - 0.2
Construction, Extraction, Maintenance - - - 79,956 - - - 7.9
Precision Production, Craft, Repair - - - - - - - -
Operators, Fabricators, Laborers - - - - - - - -
Production, Transportation, Moving - - - 116,246 - - - 11.6
Class of Employment
Wage or Salary - - - 786,286 - - - 78.1
Private For-Profit - - - 697,509 - - - 69.3
Private Not-For-Profit - - - 88,777 - - - 8.8
Government Worker - - - 133,100 - - - 13.2
Self-Employed - - - 85,614 - - - 8.5
Unpaid Family Worker - - - 1,273 - - - 0.1
* Data on this page apply to persons residing in the area, NOT to persons working in the area
Kansas City, MO Planning and Development Department Page 9
15-COUNTY METRO AREA
REPORT 6 - EMPLOYMENT OF RESIDENTS *
Source: 1980, 1990, 2000 and 2010 Census; and 2008-2012 American Community Survey (contributed to shaded cells)
NUMBER PERCENT

CHARACTERISTIC 1980 1990 2000 2010 1980 1990 2000 2010
INCOME OF HOUSEHOLDS (in constant
2009 dollars)*
Under $10,000 - - - 55,774 - - - 7.0
$10,000 to $19,999 - - - 80,406 - - - 10.1
$20,000 to $29,999 - - - 86,242 - - - 10.8
$30,000 to $39,999 - - - 83,021 - - - 10.4
$40,000 to $49,999 - - - 74,904 - - - 9.4
$50,000 to $59,999 - - - 67,684 - - - 8.5
$60,000 to $74,999 - - - 84,354 - - - 10.6
$75,000 to $99,999 - - - 104,700 - - - 13.1
$100,000 to $124,999 - - - 66,497 - - - 8.3
$125,000 to $149,999 - - - 34,455 - - - 4.3
$150,000 to $199,999 - - - 34,840 - - - 4.4
$200,000 or More - - - 26,685 - - - 3.3
Median Income (percent is this
median's percent of the
metropolitan area median) -$ -$ -$ 52,871$ - - - 100.0
Aggregate Income (millions) - - -$ 54,656$ - - - -
Income per Acre - - -$ 40,882$ - - - -
SUPPLEMENTAL INCOME SOURCES
(for households)
Interest, Dividends and Net Rental
Income - - - 187,938 - - - 23.5
Social Security - - - 205,689 - - - 25.7
Public Assistance - - - 18,624 - - - 2.3
POVERTY STATUS (percents are % of
persons below poverty level among all
persons in each respective group)
All Persons - - - 242,828 - - - 12.1
Whites - - - 146,177 - - - 9.1
African Americans - - - 70,899 - - - 21.7
Hispanic Origin Persons - - - 40,569 - - - 25.0
Elderly Persons (65 years old or
older) - - - 16,431 - - - 7.0
* 1980, 1990 and 2000 figures were derived as follows: Income category thresholds for those years' census data
were multiplied by factors to reflect inflation from 1979 to 1989, from 1989 to 1999 and from 1999 to 2009. These
thresholds were compared with 2008-12 income thresholds. Numbers of households falling within each 2008-12
category were interpolated according to where the inflated 1980, 1990 and 2000 thresholds fell.
Kansas City, MO Planning and Development Department Page 10
15-COUNTY METRO AREA
REPORT 7 - INCOME
Source: 1980, 1990, 2000 and 2010 Census; and 2008-2012 American Community Survey (contributed to shaded cells)
NUMBER PERCENT

CHARACTERISTIC 1980 1990 2000 2010 1980 1990 2000 2010
AVERAGE TRAVEL TIME TO WORK*
(Number is in minutes. Percent is this
average's % of the metro average) - - - 21.5 - - - 100.0
MEANS OF TRANSPORTATION TO
WORK*
Drove Alone - - - 820,610 - - - 82.9
Car Pool - - - 91,138 - - - 9.2
Public Transit - - - 12,159 - - - 1.2
Bicycle - - - 1,689 - - - 0.2
Walked - - - 13,120 - - - 1.3
Other Means - - - 10,457 - - - 1.1
Worked At Home - - - 40,691 - - - 4.1
VEHICLES AVAILABLE (for households)
0 - - - 50,498 - - - 6.3
1 - - - 262,957 - - - 32.9
2 - - - 321,759 - - - 40.2
3 or more - - - 164,348 - - - 20.6 average (% is % of metro average) - - - 1.79 - - - 100.0
STUDENTS (percents are of total persons)
Public Pre-Primary - - - 45,655 - - - 2.2
Private Pre-Primary - - - 22,286 - - - 1.1
Public Kindergarten or Elementary - - - - - - - -
Private Kindergarten or Elementary - - - - - - - -
Public Elementary or High School - - - 303,027 - - - 14.9
Private Elementary or High School - - - 38,293 - - - 1.9
Public High School - - - - - - - -
Private High School - - - - - - - -
EDUCATION ATTAINED (for persons 25
or older)
Less than 9th Grade - - - 42,609 - - - 3.2
9th to 12th Grade, No Diploma - - - 87,887 - - - 6.5
High School Graduate, No College - - - 364,494 - - - 27.0
College, but Less than BA Degree - - - 411,446 - - - 30.5
College, BA Degree or More - - - 441,067 - - - 32.7
STATUS OF TEENAGERS 16 TO 19
YEARS OLD
Enrolled in School
Working* - - - 29,541 - - - 28.0
Not Working - - - 59,397 - - - 56.2
Not Enrolled in School
Working* - - - 8,336 - - - 7.9
Not Working - - - 8,322 - - - 7.9
LANGUAGE
Households without anyone 14 or
older who speaks English "very well" - - - 17,225 - - - 2.2
DISABLED (persons) - - - 227,862 - - - 11.3
WITHOUT HEALTH INSURANCE (persons) - - - 256,450 - - - 12.8
* Data on this page apply to persons residing in the area, NOT to persons working in the area
Kansas City, MO Planning and Development Department Page 11
15-COUNTY METRO AREA
REPORT 8 - TRANSPORTATION*, EDUCATION AND HEALTH
Source: 1980, 1990, 2000 and 2010 Censuses; and 2008-2012 ACS (contributed to shaded cells)
NUMBER PERCENT
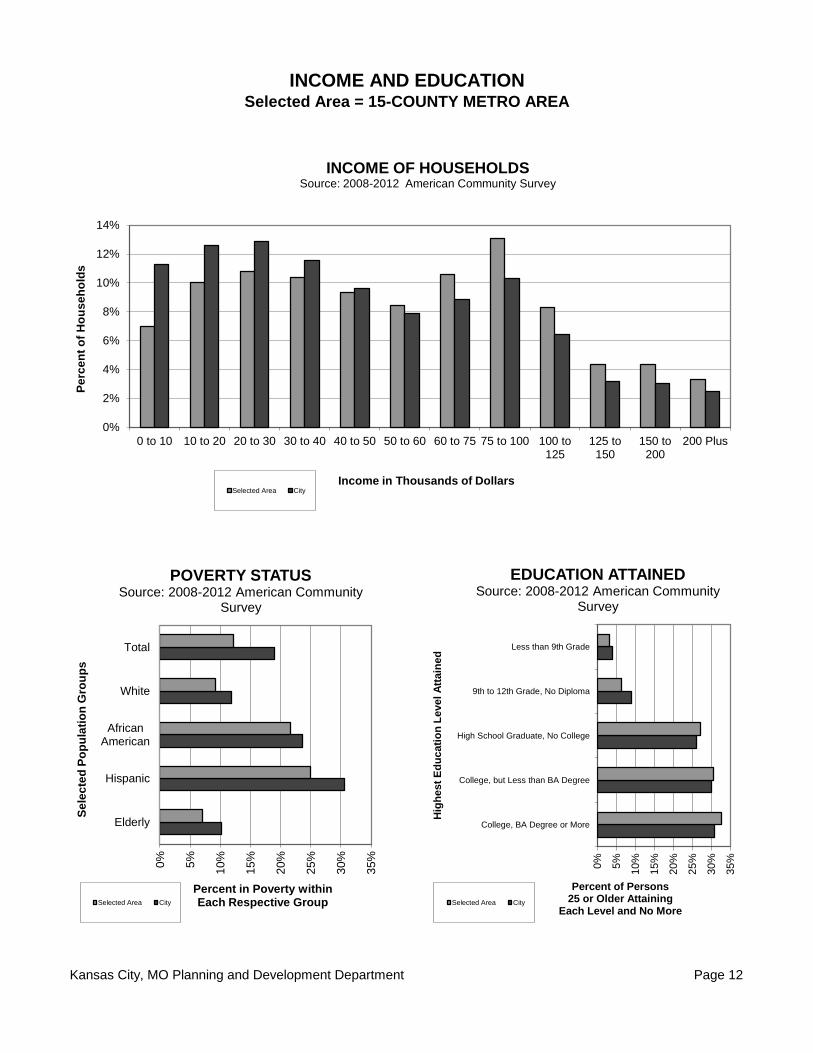
Kansas City, MO Planning and Development Department Page 12
INCOME AND EDUCATIONSelected Area = 15-COUNTY METRO AREA
0%
2%
4%
6%
8%
10%
12%
14%
0 to 10 10 to 20 20 to 30 30 to 40 40 to 50 50 to 60 60 to 75 75 to 100 100 to125
125 to150
150 to200
200 Plus
Pe
rce
nt
of
Ho
us
eh
old
s
Income in Thousands of Dollars
INCOME OF HOUSEHOLDS Source: 2008-2012 American Community Survey
Selected Area City
0%
5%
10%
15%
20%
25%
30%
35%
Elderly
Hispanic
AfricanAmerican
White
Total
Percent in Poverty within Each Respective Group
Se
lec
ted
Po
pu
lati
on
Gro
up
s
POVERTY STATUS Source: 2008-2012 American Community
Survey
Selected Area City
0%
5%
10%
15%
20%
25%
30%
35%
College, BA Degree or More
College, but Less than BA Degree
High School Graduate, No College
9th to 12th Grade, No Diploma
Less than 9th Grade
Percent of Persons 25 or Older Attaining
Each Level and No More
Hig
he
st
Ed
uc
ati
on
Le
vel A
ttain
ed
EDUCATION ATTAINED Source: 2008-2012 American Community
Survey
Selected Area City

Page 12
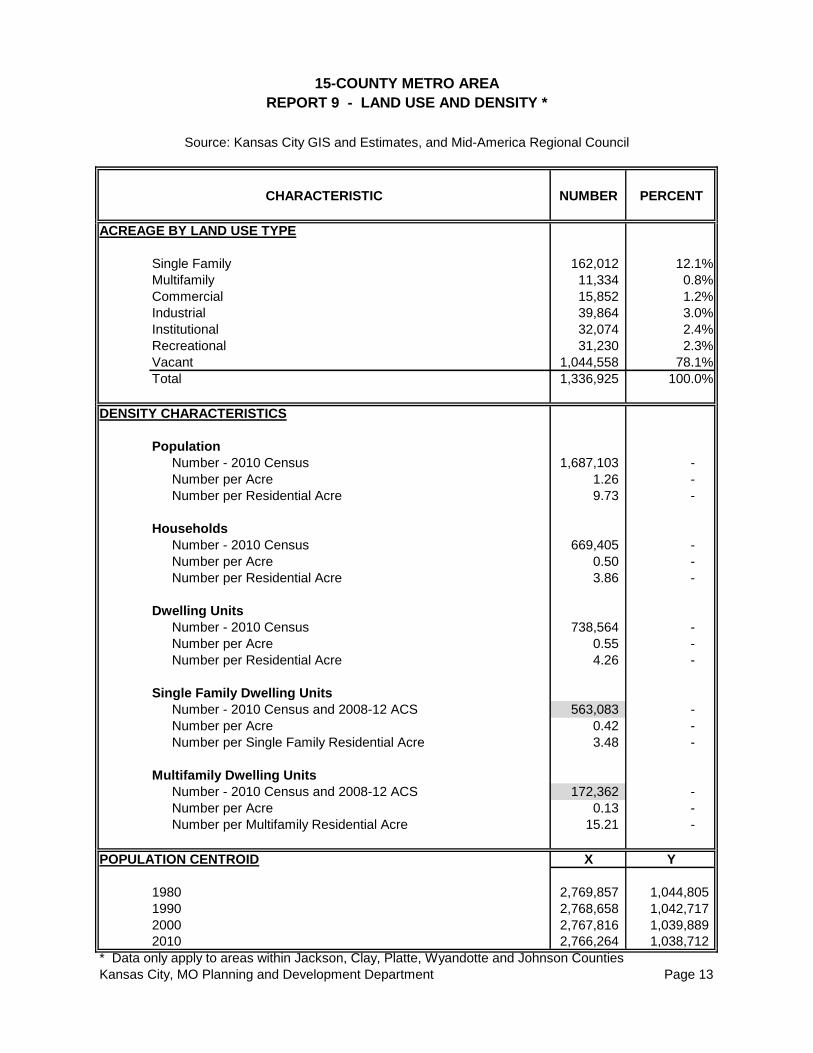
15-COUNTY METRO AREA
REPORT 9 - LAND USE AND DENSITY *
Source: Kansas City GIS and Estimates, and Mid-America Regional Council
CHARACTERISTIC NUMBER PERCENT
ACREAGE BY LAND USE TYPE
Single Family 162,012 12.1%
Multifamily 11,334 0.8%
Commercial 15,852 1.2%
Industrial 39,864 3.0%
Institutional 32,074 2.4%
Recreational 31,230 2.3%
Vacant 1,044,558 78.1%
Total 1,336,925 100.0%
DENSITY CHARACTERISTICS
Population
Number - 2010 Census 1,687,103 -
Number per Acre 1.26 -
Number per Residential Acre 9.73 -
Households
Number - 2010 Census 669,405 -
Number per Acre 0.50 -
Number per Residential Acre 3.86 -
Dwelling Units
Number - 2010 Census 738,564 -
Number per Acre 0.55 -
Number per Residential Acre 4.26 -
Single Family Dwelling Units
Number - 2010 Census and 2008-12 ACS 563,083 -
Number per Acre 0.42 -
Number per Single Family Residential Acre 3.48 -
Multifamily Dwelling Units
Number - 2010 Census and 2008-12 ACS 172,362 -
Number per Acre 0.13 -
Number per Multifamily Residential Acre 15.21 -
POPULATION CENTROID X
1980 2,769,857 1,044,805
1990 2,768,658 1,042,717
2000 2,767,816 1,039,889
2010 2,766,264 1,038,712
* Data only apply to areas within Jackson, Clay, Platte, Wyandotte and Johnson Counties
Kansas City, MO Planning and Development Department Page 13
Y

15-COUNTY METRO AREA
REPORT 10 - HISTORY AND FORECASTS OF POPULATION AND HOUSEHOLDS *
Source: Censuses 1940-2010 and 2010 Mid-America Regional Council Forecasts
CHARACTERISTIC NUMBER NUMBER PERCENT
CHANGE CHANGE
POPULATION *
1940 (Census) 761,183
129,862 17.1%
1950 (Census) 891,045
250,053 28.1%
1960 (Census) 1,141,098
168,600 14.8%
1970 (Census) 1,309,697
50,874 3.9%
1980 (Census) 1,360,571
129,200 9.5%
1990 (Census) 1,489,771
182,690 12.3%
2000 (Census) 1,672,462
190,346 11.4%
2010 (Census) 1,862,808
248,354 13.3%
2020 (Forecast) 2,111,162
248,354 11.8%
2030 (Forecast) 2,359,517
248,354 10.5%
2040 (Forecast) 2,607,871
HOUSEHOLDS *
1970 (Census) 423,924
79,088 18.7%
1980 (Census) 503,011
71,191 14.2%
1990 (Census) 574,202
81,448 14.2%
2000 (Census) 655,650
77,352 11.8%
2010 (Census) 733,002
113,641 15.5%
2020 (Forecast) 846,643
113,641 13.4%
2030 (Forecast) 960,284
113,641 11.8%
2040 (Forecast) 1,073,925
* No data are included for Ray, Lafayette, Miami, Clinton, Franklin, Linn, Bates or Caldwell Counties
Forecasts are City Planning and Development Department estimates based upon MARC forecasts of
change from 2000 to 2040.
Kansas City, MO Planning and Development Department Page 14

15-COUNTY METRO AREA
REPORT 11 - HISTORY OF BASIC HOUSING CHARACTERISTICS
Source: Censuses 1940-2010
CHARACTERISTIC NUMBER NUMERICAL PERCENT
CHANGE CHANGE
HOUSING UNITS
1940 (Census) 284,357
48,148 16.9%
1950 (Census) 332,505
98,048 29.5%
1960 (Census) 430,553
67,913 15.8%
1970 (Census) 498,466
100,431 20.1%
1980 (Census) 598,897
89,181 14.9%
1990 (Census) 688,078
79,495 11.6%
2000 (Census) 767,573
115,526 15.1%
2010 (Census) 883,099
OCCUPIED HOUSING UNITS
1970 (Census) 467,429
87,845 18.8%
1980 (Census) 555,274
73,848 13.3%
1990 (Census) 629,122
88,639 14.1%
2000 (Census) 717,761
81,876 11.4%
2010 (Census) 799,637
VACANT HOUSING UNITS
1970 (Census) 31,037
12,586 40.6%
1980 (Census) 43,623
15,333 35.1%
1990 (Census) 58,956
-9,144 -15.5%
2000 (Census) 49,812
33,650 67.6%
2010 (Census) 83,462
GROUP QUARTERS POPULATION
1970 (Census) 28,453
-2,645 -9.3%
1980 (Census) 25,809
7,727 29.9%
1990 (Census) 33,536
-333 -1.0%
2000 (Census) 33,203
-1,172 -3.5%
2010 (Census) and 2007-2011 ACS 32,031
Kansas City, MO Planning and Development Department Page 15

EMPLOYMENT FORECAST *
SECTOR 1990 2000 2010 2020 2030 2040
Services
No. of Jobs 479,746 465,362 492,167 621,148 750,128 879,109
% Change -3.0% 5.8% 26.2% 20.8% 17.2%
Retail
No. of Jobs 156,592 209,644 205,683 234,095 262,507 290,918
% Change 33.9% -1.9% 13.8% 12.1% 10.8%
Other
No. of Jobs 303,760 223,758 201,574 204,422 207,270 210,117
% Change -26.3% -9.9% 1.4% 1.4% 1.4%
Total
No. of Jobs 940,097 898,764 899,424 1,059,664 1,219,904 1,380,145
% Change -4.4% 0.1% 17.8% 15.1% 13.1%
* No data are included for Ray, Lafayette, Miami, Clinton, Franklin, Linn, Bates or Caldwell Counties
Kansas City, MO Planning and Development Department Page 16
ACTUAL *
15-COUNTY METRO AREA
REPORT 12 - FORECASTS OF EMPLOYMENT BY PLACE OF WORK *
Source: City Planning & Development Department estimates
based upon 2010 MARC forecasts of 2000-40 total employment change

PARAMETERS AND TRACTS SELECTED
COUNTIES CIRCLE CITY / NON-CITY AREAS
Cass, MO Miami, KS Radius (miles) Kansas City, MO
Clay, MO Wyandotte, KS X coordinate Outside KCMO
Jackson, MO Bates, MO Y coordinate 1 All areas
Platte, MO Caldwell, MO
Franklin, KS Clinton, MO RECTANGLE
Johnson, KS Lafayette, MO North East 579 TRACTS
Leavenworth, KS Ray, MO South West CHOSEN
Linn, KS 1 All counties
TRACTS
TR
AC
T
INC
LU
DE
D
EX
CLU
DE
D
SE
LE
CT
ED
TR
AC
T
INC
LU
DE
D
EX
CLU
DE
D
SE
LE
CT
ED
TR
AC
T
INC
LU
DE
D
EX
CLU
DE
D
SE
LE
CT
ED
TR
AC
T
INC
LU
DE
D
EX
CLU
DE
D
SE
LE
CT
ED
TR
AC
T
INC
LU
DE
D
EX
CLU
DE
D
SE
LE
CT
ED
TR
AC
T
INC
LU
DE
D
EX
CLU
DE
D
SE
LE
CT
ED
INSIDE KCMO 38.00 1 94.00 1 155.00 1 303.08 1 521.01 1
601.00 1 43.00 1 95.00 1 156.00 1 306.00 1 521.02 1
202.01 1 44.00 1 96.00 1 157.00 1 OUTSIDE KCMO 522.01 1
202.02 1 46.00 1 97.00 1 158.00 1 9541.00 1 522.02 1
203.00 1 51.00 1 98.00 1 159.00 1 9542.00 1 523.03 1
204.00 1 52.00 1 99.00 1 160.00 1 9543.00 1 523.04 1
205.00 1 53.00 1 100.01 1 161.00 1 9544.00 1 523.05 1
206.02 1 54.00 1 100.02 1 162.00 1 9545.00 1 523.06 1
206.03 1 55.00 1 101.03 1 163.00 1 500.00 1 524.05 1
206.04 1 56.01 1 101.05 1 164.00 1 501.00 1 524.10 1
209.01 1 56.02 1 102.01 1 165.00 1 502.00 1 524.11 1
209.02 1 57.00 1 102.03 1 166.00 1 503.01 1 524.14 1
212.04 1 58.01 1 102.04 1 167.00 1 503.02 1 524.15 1
212.05 1 60.00 1 105.00 1 168.00 1 504.00 1 524.16 1
212.06 1 61.00 1 106.00 1 169.00 1 505.00 1 524.17 1
212.07 1 63.00 1 107.02 1 170.00 1 506.00 1 524.18 1
212.08 1 65.00 1 110.00 1 171.00 1 507.00 1 524.19 1
213.03 1 66.00 1 119.00 1 172.00 1 508.00 1 524.21 1
213.05 1 67.00 1 124.00 1 173.00 1 509.00 1 525.02 1
213.06 1 69.00 1 128.02 1 174.00 1 510.00 1 525.04 1
213.07 1 71.00 1 129.03 1 175.00 1 511.00 1 526.01 1
213.09 1 72.00 1 129.04 1 176.00 1 512.00 1 526.03 1
213.10 1 73.00 1 129.06 1 178.00 1 513.00 1 526.04 1
218.03 1 74.00 1 130.03 1 181.00 1 514.00 1 526.06 1
218.04 1 75.00 1 131.00 1 182.00 1 515.00 1 526.07 1
219.00 1 76.00 1 132.03 1 9801.01 1 516.00 1 527.00 1
221.00 1 77.00 1 132.08 1 9808.02 1 517.00 1 528.01 1
222.00 1 78.02 1 132.10 1 9883.00 1 518.01 1 528.02 1
3.00 1 79.00 1 134.01 1 300.01 1 518.02 1 528.03 1
6.00 1 80.00 1 134.05 1 300.02 1 518.03 1 529.04 1
7.00 1 81.00 1 134.07 1 301.01 1 518.04 1 529.05 1
8.00 1 82.00 1 134.08 1 301.02 1 518.05 1 529.06 1
9.00 1 83.00 1 135.04 1 301.03 1 518.06 1 529.07 1
10.00 1 84.00 1 136.12 1 302.01 1 519.02 1 529.08 1
11.00 1 85.00 1 142.03 1 302.05 1 519.03 1 529.10 1
18.00 1 86.00 1 142.04 1 302.07 1 519.04 1 530.02 1
19.00 1 87.00 1 143.00 1 302.08 1 519.06 1 530.04 1
20.00 1 88.00 1 144.00 1 302.09 1 519.07 1 530.05 1
21.00 1 89.00 1 145.01 1 302.10 1 519.08 1 530.06 1
22.00 1 90.00 1 145.02 1 302.11 1 519.09 1 530.07 1
23.00 1 91.00 1 152.00 1 303.05 1 520.01 1 530.08 1
34.00 1 92.00 1 153.00 1 303.06 1 520.03 1 530.09 1
37.00 1 93.00 1 154.00 1 303.07 1 520.04 1 530.10 1
-
-
-

TR
AC
T
INC
LU
DE
D
EX
CLU
DE
D
SE
LE
CT
ED
TR
AC
T
INC
LU
DE
D
EX
CLU
DE
D
SE
LE
CT
ED
TR
AC
T
INC
LU
DE
D
EX
CLU
DE
D
SE
LE
CT
ED
TR
AC
T
INC
LU
DE
D
EX
CLU
DE
D
SE
LE
CT
ED
TR
AC
T
INC
LU
DE
D
EX
CLU
DE
D
SE
LE
CT
ED
TR
AC
T
INC
LU
DE
D
EX
CLU
DE
D
SE
LE
CT
ED
OUTSIDE KCMO (continued) 430.00 1 605.00 1 119.00 1 146.04 1
530.11 1 703.00 1 433.01 1 606.00 1 120.00 1 147.01 1
531.01 1 704.00 1 434.00 1 607.00 1 121.00 1 147.02 1
531.02 1 705.00 1 435.00 1 608.00 1 122.00 1 148.04 1
531.05 1 707.00 1 436.00 1 609.04 1 123.00 1 148.06 1
531.08 1 709.00 1 437.00 1 610.01 1 124.00 1 149.02 1
531.09 1 710.00 1 438.02 1 610.02 1 125.01 1 149.03 1
531.10 1 711.01 1 438.03 1 611.00 1 125.02 1 149.04 1
532.01 1 711.02 1 438.04 1 612.00 1 126.00 1 149.05 1
532.02 1 712.02 1 439.03 1 613.00 1 127.01 1 150.00 1
532.03 1 712.03 1 439.04 1 614.00 1 128.02 1 151.00 1
533.01 1 714.00 1 439.05 1 202.02 1 128.03 1 155.00 1
533.02 1 716.00 1 440.01 1 203.00 1 128.04 1 156.00 1
534.03 1 718.00 1 440.03 1 205.00 1 129.03 1 176.00 1
534.06 1 9819.00 1 440.04 1 206.02 1 129.04 1 177.00 1
534.09 1 9551.00 1 441.01 1 208.01 1 133.01 1 179.00 1
534.10 1 9552.00 1 441.02 1 210.01 1 133.07 1 180.00 1
534.11 1 1001.00 1 441.03 1 210.03 1 133.09 1 181.00 1
534.13 1 1002.00 1 441.04 1 210.04 1 133.13 1 182.00 1
534.14 1 1003.00 1 442.01 1 211.01 1 134.01 1 185.00 1
534.15 1 1004.00 1 442.02 1 211.02 1 134.10 1 186.00 1
534.17 1 1005.00 1 443.01 1 211.03 1 134.16 1 193.00 1
534.18 1 1006.01 1 443.02 1 213.09 1 135.02 1 9883.00 1
534.19 1 1006.02 1 443.03 1 214.01 1 135.04 1 9891.00 1
534.21 1 1007.00 1 444.00 1 214.03 1 136.06 1 9892.00 1
534.22 1 400.01 1 445.00 1 214.04 1 136.08 1 901.00 1
534.23 1 400.02 1 446.01 1 216.00 1 136.12 1 902.00 1
534.24 1 402.00 1 446.02 1 217.01 1 137.03 1 903.00 1
535.02 1 403.00 1 446.03 1 217.02 1 137.04 1 904.00 1
535.05 1 404.00 1 447.02 1 218.03 1 138.01 1 905.00 1
535.06 1 405.00 1 447.03 1 218.04 1 138.02 1 906.01 1
535.07 1 406.00 1 447.04 1 218.05 1 139.01 1 906.02 1
535.08 1 407.00 1 448.03 1 218.06 1 139.02 1 300.02 1
535.09 1 408.00 1 448.04 1 219.00 1 139.04 1 301.01 1
535.10 1 409.00 1 448.05 1 220.00 1 139.16 1 301.03 1
535.55 1 410.00 1 448.06 1 221.00 1 140.02 1 302.07 1
535.56 1 411.00 1 449.00 1 222.00 1 140.04 1 302.08 1
535.57 1 412.00 1 450.00 1 223.01 1 140.05 1 302.09 1
536.01 1 413.00 1 451.00 1 223.02 1 140.06 1 303.05 1
536.02 1 415.00 1 452.00 1 9601.00 1 140.07 1 303.06 1
537.01 1 416.00 1 701.00 1 9602.00 1 141.01 1 303.07 1
537.03 1 417.00 1 702.00 1 9603.00 1 141.05 1 303.08 1
537.05 1 418.00 1 703.00 1 9604.00 1 141.08 1 304.01 1
537.07 1 419.00 1 704.00 1 106.00 1 141.11 1 305.00 1
537.09 1 420.01 1 9501.00 1 110.00 1 141.12 1 306.00 1
537.11 1 420.02 1 9502.00 1 111.00 1 141.14 1 307.00 1
537.12 1 421.00 1 600.01 1 112.00 1 141.20 1 800.00 1
538.01 1 422.00 1 600.03 1 113.00 1 142.03 1 801.00 1
538.03 1 423.00 1 600.04 1 114.01 1 142.04 1 802.00 1
538.04 1 424.00 1 601.00 1 114.05 1 143.00 1 803.00 1
9800.01 1 425.01 1 602.02 1 114.06 1 144.00 1
9800.02 1 425.02 1 603.01 1 115.00 1 145.01 1
9800.03 1 426.00 1 603.02 1 116.00 1 145.02 1
701.00 1 427.00 1 603.05 1 117.00 1 146.01 1
702.00 1 428.00 1 604.00 1 118.00 1 146.03 1
PARAMETERS AND TRACTS SELECTED (continued)