The Determinants of Dropouts from Voluntary Pension Scheme: Evidence from Sri Lanka
DI
SC
US
SI
ON
P
AP
ER
S
ER
IE
S
Forschungsinstitut zur Zukunft der ArbeitInstitute for the Study of Labor
Are Voluntary Agreements Better?Evidence from Baseball Arbitration
IZA DP No. 8098
April 2014
John W. BuddAaron J. SojournerJaewoo Jung
Are Voluntary Agreements Better? Evidence from Baseball Arbitration
John W. Budd University of Minnesota
Aaron J. Sojourner
University of Minnesota and IZA
Jaewoo Jung Korea Labor Institute
Discussion Paper No. 8098 April 2014
IZA
P.O. Box 7240 53072 Bonn
Germany
Phone: +49-228-3894-0 Fax: +49-228-3894-180
E-mail: [email protected]
Any opinions expressed here are those of the author(s) and not those of IZA. Research published in this series may include views on policy, but the institute itself takes no institutional policy positions. The IZA research network is committed to the IZA Guiding Principles of Research Integrity. The Institute for the Study of Labor (IZA) in Bonn is a local and virtual international research center and a place of communication between science, politics and business. IZA is an independent nonprofit organization supported by Deutsche Post Foundation. The center is associated with the University of Bonn and offers a stimulating research environment through its international network, workshops and conferences, data service, project support, research visits and doctoral program. IZA engages in (i) original and internationally competitive research in all fields of labor economics, (ii) development of policy concepts, and (iii) dissemination of research results and concepts to the interested public. IZA Discussion Papers often represent preliminary work and are circulated to encourage discussion. Citation of such a paper should account for its provisional character. A revised version may be available directly from the author.
IZA Discussion Paper No. 8098 April 2014
ABSTRACT
Are Voluntary Agreements Better? Evidence from Baseball Arbitration*
This paper empirically examines the widespread belief that voluntarily negotiated agreements produce better long-run relationships than third-party imposed settlements, such as arbitrator decisions or court judgments. Two key outcomes are analyzed – subsequent player performance and the durability of club-player relationship. Major League Baseball provides a compelling setting for these analyses because individual performance is well measured, there is the possibility of relationship breakdown, and both voluntary and imposed settlements are routinely used. While the results clearly show that a third-party imposed settlement is not better than a voluntary one, the evidence in support of the widespread belief is mixed. JEL Classification: dispute resolution, arbitration, negotiation, salary, sports, baseball Keywords: J52, M12, M5 Corresponding author: John W. Budd Center for Human Resources and Labor Studies University of Minnesota 321 19th Ave S, 3-300 Minneapolis, MN 55455 USA E-mail: [email protected]
* We are grateful to Bijun Zhang and John Clawson for their research assistance.
1
A central tenet of conflict resolution theory and practice in employment relations, the
legal arena, and elsewhere has been that a voluntary settlement among disputants with a
continuing relationship is better than an imposed one. The process of negotiation, perhaps
assisted by mediation, is seen as allowing the participants to “craft individualized justice on their
own terms based on their own interests and values” (Nolan-Haley 2012: 69). The parties to the
resulting consensual agreement should, therefore, be more satisfied (Welsh 2001) and have
stronger feelings of procedural justice and control over the process and outcomes (Shapiro and
Brett 1993), which means that post-settlement compliance should be higher (Lipsky, Seeber, and
Fincher 2003) and, in ongoing relationships, the relationship is expected to be more durable than
when a settlement is imposed (Fuller 1971). Litigation, arbitration, and other non-consensual
methods are important, but their ideal roles are to provide an incentive to reach a consensual
agreement in order to avoid the uncertainty of an imposed settlement and to provide a final
resolution when all else fails. As noted by Farber and Katz (1979: 55), “it is commonly thought
that a good procedure is one that is seldom used and that provides an incentive for the parties to
reach a negotiated settlement” (also, Chelius and Dworkin 1980). Indeed, the Ontario Labour
Relations Board has explained that “the real labour-relations goal” of Ontario’s first contract
arbitration statute “is to ‘encourage’ the parties to reach that initial collective bargaining
agreement on their own, and not have the Board impose third-party determination” (Great Lakes
Community Credit Union Limited [1991] OLRB Rep. June 758).
Yet there is little empirical evidence to indicate whether consensual agreements are better
than imposed settlements. A lot of research compares mediation to arbitration and litigation
(Wall and Dunne 2012; Wissler 2004), but it largely focuses on settlement rates, costs, and
participant evaluations. Wall and Dunne’s (2012) review article cites twelve studies claiming to
2
show that mediation results in an improved relationship, but seven lack data and the other five
lack a comparison group. Empirical evidence on compliance is also limited. McEwen and
Maiman (1981) find that mediated settlements of small-claims disputes are significantly more
likely to result in full payment than imposed, adjudicated settlements while Wissler (1995) finds
no differences. So the empirical record shows that participants in a consensual rather than
imposed dispute resolution process are more satisfied and report greater levels of fairness (e.g.,
Shapiro and Brett 1993), but there is a need for careful empirical analyses of the widely-held
belief that post-settlement behaviors and outcomes will also be better.
This paper, then, uses data from Major League Baseball spanning 1988 to 2011 to test
whether voluntarily-negotiated agreements produce better long-run relationships than third-party
imposed settlements. Baseball players with between three (sometimes two) and six years of
service are eligible for salary arbitration with their current team. In any given year, some go to
arbitration while many settle voluntarily. If voluntarily-negotiated agreements are meaningfully
better, then in the following season we would expect to see better on-field performance and more
lasting relationships for those who reached a salary agreement voluntarily compared to those
who went to arbitration. Analyzing these two propositions is the focus of this paper. Major
League Baseball provides a compelling setting for these analyses because individual
performance is well measured, the possibility of relationship breakdown is quite real, and both
voluntary and imposed settlements are routinely used. The ramifications, however, extend
beyond professional sports because a better understanding of the lasting effects of alternative
dispute resolution methods can have important implications for how to best resolve bargaining
impasses and grievances and how to design alternative dispute resolution (ADR) systems within
organizations, the legal arena, social work, and elsewhere.
3
The Presumed Superiority of Voluntary Agreements
The belief that a voluntary, consensual dispute resolution process is superior to a non-
consensual process that results in an imposed agreement is widespread. In the words of Dworkin
(1997: 79), “anybody who knows anything about labor-management relations will tell you that
the best settlement in any matter is one reached by the parties bilaterally, not one imposed by an
arbitrator or government intervention.” In other areas, this sentiment might be most explicitly
articulated in comparing mediation to arbitration or adjudication, but many of the perceived
benefits of mediation are rooted in participation, voluntariness, and self-determination (Nolan-
Haley 2012)—in contrast to the foundations of “authority and imposition of judgment” that
underlie arbitration and adjudication (McEwen and Maiman 1981: 238)—and therefore extend to
unassisted negotiations.1 It is widely assumed that parties involved in a dispute resolution
method characterized by participation, voluntariness, and self-determination will be much more
likely to be satisfied with this process than one that is non-consensual, and will view it as having
higher degrees of procedural justice. Empirical analyses, such as Shapiro and Brett’s (1993)
comparison of unionized miners whose grievances were settled via mediation or arbitration,
generally support this assumption (also, Brett, Barsness, and Goldberg 1996).
These higher levels of satisfaction and procedural justice, in turn, are believed to have
positive effects that last beyond the immediacy of the settlement of the dispute. For example,
Edwards (2009: 77) claims that meditation of child protection disputes
1 Mediation can have benefits beyond those present in unassisted negotiations because a mediator can help the negotiators with their relationship (Fuller 1971), but this is beyond the scope of this paper. On the hand, forms of legal mediation that are “less-than-voluntary, not-so-confidential, and adversarial” are more like arbitration than negotiation (Nolan-Haley 2012: 73).
4
produces better, more detailed, nuanced, and longer-lasting results than litigated
cases; it creates a problem-solving atmosphere in the court environment (an
atmosphere that better serves all parties); it engages the parents in the decision-
making process, thus making it more likely that they will follow any plan that
they have helped draft.
In the context of workplace conflicts, Lipsky, Seeber, and Fincher (2003: 78) assert that
“compliance with the eventual settlement is less likely to be a problem when the disputants have
controlled the process that produced the outcome.” In their practical guide for resolving
workplace conflicts, Cloke and Goldsmith (2000: 236) claim that “agreements reached in
mediation face fewer enforcement problems because they are reached voluntarily.” However, no
data or sources are provided to support this claim.
We translate these hypotheses about the lasting positive effects of voluntary, negotiated
settlements over imposed ones into the context of salary arbitration in Major League Baseball. In
particular, if greater satisfaction with a negotiated salary settlement than an arbitrated one has
long run effects, we expect that players who avoided arbitration through a voluntary settlement
will perform better than those whose dispute went all the way to arbitration. We also hypothesize
that greater satisfaction by both the player and the club with a voluntary, negotiated settlement
results in a stronger player-club relationship such that players who go to arbitration will be more
likely to be released or traded than players who avoided arbitration.
In terms of the rhetorical emphasis on compliance with a negotiated agreement in the
above quotes and elsewhere, we are not asserting that there will be problems with literal
compliance in terms of not paying the imposed salaries. Rather, we can think of our hypotheses
as a lack of full substantive compliance in that the players who experienced arbitration may not
5
deliver full effort on the field and may not exhibit a positive attitude off the field while club
management that experienced arbitration might seek to end the relationship. Note that these
hypotheses are not comparisons between those who won arbitration and those who lost (Bretz
and Thomas 1992; Hauenstein and Lord 1989; Mas 2006). Rather, we compare those who
experienced arbitration—win or lose—with those who reached voluntary settlement instead. The
(claimed) benefits of a consensual agreement derive from the nature of the process, not strictly
from the specific terms of the outcomes. Superiority of a consensual dispute resolution process
suggests that player performance may suffer even if a player wins his arbitration hearing and that
the player-club relationship will be worsened regardless of which side wins the hearing owing to
the adversarial nature of the process and the loss of control over the outcome. As argued by Tulis
(2010: 92), voluntary agreements in baseball are important for
maintaining a congenial relationship between the player and management. In an
arbitration proceeding, the player would have to witness his team’s management
questioning his value to the team. As the player likely will remain on the team
preserving a good relationship is of great importance.
Voluntary agreements can also promote an ongoing relationship by allowing players and clubs to
reach agreements that the club believes are affordable. In 1974, Minnesota Twins pitcher Dick
Woodson won the very first arbitration hearing but was traded to the richer New York Yankees
less than three months later. In sum, “the risks of injury to the relationship between the club and
its player from a salary arbitration hearing are immense” (Abrams 2000: 164).
On the other hand, we might not systematically observe these hypothesized differences.
Even if participants to a consensual dispute resolution process are more satisfied with the process
than those in a non-consensual process, this satisfaction might be short-lived or might not be
6
strong enough to lead to changes in employee performance or relationship quality. Moreover,
superiority of a consensual process is not universally accepted. During the rise of the alternative
dispute resolution movement in the legal arena, Fiss (1984: 1075) famously argued against the
presumed universal benefits of voluntary settlements because “justice may not be done.” A non-
consensual process also provides the opportunities for the negotiators to save face and pass the
buck (McCall 1990). Indeed, in the U.S. unionized sector, grievance mediation is barely used
while grievance arbitration is nearly universal suggesting that there are nuanced trade-offs
between consensual and non-consensual processes (Feuille 1999). Furthermore, it is not
necessarily the case that consensual processes are less adversarial than non-consensual processes.
For example, in baseball arbitration hearings, players’ “agents extol their virtues and their clubs
present a litany of their failures” (Abrams 2000: 164), but the same might be true in their
negotiations outside of the arbitration process. The benefits of a particular dispute resolution
system, therefore, might depend on the particular characteristics of the dispute and the disputants
rather than being universal (Wissler 1995). So more research is needed, especially research with
comparison groups (Wall and Dunne 2012).
Salary Arbitration in Major League Baseball
Major League Baseball has used final-offer arbitration to resolve salary disputes between
eligible players and clubs since 1974 (Abrams 2000; Dworkin 1981). Except in the earliest years
that pre-dated free agency, arbitration has been available to players who have accumulated some
years of service, but not enough years to qualify for free agency, which would allow them to sign
with another club of their own choosing. The specific eligibility criteria and service definitions
vary across successive collective bargaining agreements between the players union and the
7
owners association, but arbitration is primarily available to out-of-contract players with at least
three but less than six years of service. Before 1985 out-of-contract players with two years of
service were also eligible, and since 1990 out-of-contract players with two years of service are
also arbitration eligible if their playing time is among the top 17-22 percent of two-year players
(the “Super Two rule”). Moreover, players with six or more years of service whose contracts are
expiring (free agents) and their clubs can agree to arbitration as part of the re-negotiation
process.
The typical scenario therefore involves a player with 3-5 years of service whose contract
ended at the conclusion of the playing season in October. If the club wants to retain the player,
the player and the club try to negotiate a new contract for one or more years. If these negotiations
fail to result in a new agreement by early January, the player and the club can file for arbitration
before a deadline specified by the collective bargaining agreement. Each side then has three days
to exchange figures—that is, to specify their final salary demand (player) or offer (club) for the
upcoming season. The only figure submitted, and the only issue to be decided by the arbitration
panel, is the upcoming season’s salary. Arbitration hearings then occur in early February. This is
a final-offer arbitration procedure such that the arbitration panel must select either the player’s or
the club’s figure. The format of the hearing (e.g., one hour for each side’s initial presentation,
half-hour for rebuttal), inadmissible evidence (e.g., the financial positions of the player and the
club), and decision-making criteria (e.g., “the quality of the Player’s contribution to his Club
during the past season”) are specified by the collective bargaining agreement. Each side
advocates for its final offer so the hearings are likely adversarial, including the player witnessing
and rebutting the club’s presentation as to why he’s not worth what he’s asking. After reaching
its decision—usually within 24 hours of the hearing—the arbitration panel informs the player
8
and the club as to which figure was selected. The arbitration panel enters this figure into a pre-
executed contract that was submitted with a blank salary line by the player and the club, and the
contract becomes binding. The club, however, can subsequently release or trade a player. As
such, the player can switch teams only with his current club’s consent.
At any time prior to the announcement of the arbitration panel’s decision, the club and
player can voluntarily agree to a new contract. So for each offseason’s negotiation/arbitration
round, there are five classes of players: 1) eligible for arbitration but avoided arbitration by
reaching a new agreement before filing for arbitration, 2) filed for arbitration but negotiated a
new agreement before exchanging salary figures, 3) filed for arbitration and exchanged salary
figures but negotiated a new agreement before the arbitration hearing, 4) went to arbitration and
the player won, and 5) went to arbitration and the player lost.
The public nature of the final-offer salary arbitration process in Major League Baseball,
especially in being able to identify winners and losers, combined with extensive performance
indicators makes this a popular setting for scholarly research. Some of this research focuses on
the effects of the presence of the salary arbitration process. Chelius and Dworkin (1980), for
example, find that the process encourages voluntary settlements. Kahn (1993) finds that
eligibility for arbitration increases a player’s salary. Other research examines the parties’
behavior within the arbitration process, such as the parties’ decision to file, their offers, and the
arbitrators’ decisions (Burger and Walter 2005; Burgess and Marburger 1993; Faurot and
McAllister 1992; Fizel, Krautmann, and Hadley 2002).
Closest to our research are analyses of the effect of arbitration on subsequent player
performance (Bretz and Thomas 1992; Hauenstein and Lord 1989). These analyses use equity
theory to hypothesize that baseball players who win an arbitration hearing will perform better
9
and be less likely to move teams than those who lose an arbitration hearing. Empirical
comparisons of winners and losers support these hypotheses. This research supports ours in that
the theorizing and empirical results are consistent with the existence of measurable behavioral
reactions to the arbitration process.2 But note carefully that this previous research only focuses
on players who go to arbitration and analyzes differences between winner and losers. Our
research is rooted more in procedural justice than distributive justice, and we make fuller use of
the different classes of players noted above to compare those who reach a consensual agreement
to those who have an arbitrated settlement imposed.
Data
To analyze whether performance and relationship duration are systematically different for
players who have a settlement imposed by arbitration compared to those who voluntarily agree to
a new salary, we collected comprehensive performance and arbitration data for 1988-2011. Data
on arbitration winners and losers goes back to 1974, but 1988 is the first year that we can reliably
identify all of the players filing for arbitration. The primary sources for the data are the Biz of
Baseball (bizofbaseball.com) and Lahman’s Baseball Database (www.seanlahman.com/baseball-
archive/statistics/), supplemented by data from the official Major League Baseball website and
various media reports.
Each observation in the data set is a player who filed for arbitration between 1988 and
2011. The data include pitchers and position players. The arbitration process occurs during
January and February so the year of the arbitration filing is also the year of the upcoming
2 More generally, Stadler (2007) documents the wide-ranging psychological aspects of baseball performance which further reinforces the utility of analyzing post-arbitration performance and relationship duration.
10
baseball season that generally runs from April through October. We only include players in three
of the five classes listed above: 1) exchanged salary figures but negotiated a new agreement
before the arbitration hearing, 2) won in arbitration, or 3) lost in arbitration. These are the
negotiating pairs that went through all of the steps to get to arbitration and we focus our analyses
in this way in order to reduce the unobservable differences across observations. In other words,
by excluding pairs that settled earlier in the process, we are trying to make the sample as
homogeneous as possible.
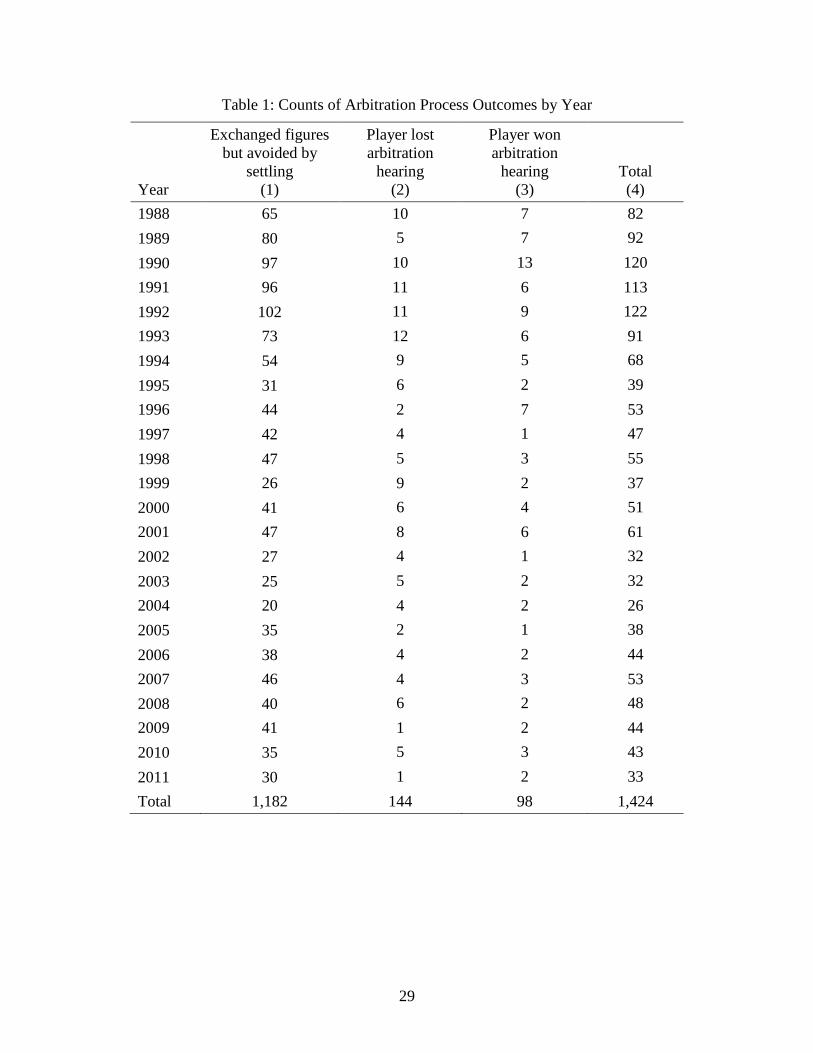
Table 1 shows the frequency of each category by year. There are 1,424 cases with
complete data across the 24-year time span. In recent years, the numbers of post-exchange
settlements and arbitration hearings have declined. Overall, 83 percent of the pairs that
exchanged offers settled on a new contract before arbitration; the remainder went to arbitration
with clubs winning about two-thirds of the hearings.
In order to analyze whether there are post-settlement performance differences across
these categories, we merged performance statistics for each player for the season that
immediately follows the arbitration process. As key measures of performance, we use earned run
average (ERA) for pitchers and we use batting average for position players. These are the most
widely-used statistics for pitching and hitting performance, respectively. A pitcher’s ERA
indicates the average number earned runs allowed per nine innings pitched. A batter’s batting
average is the fraction of official at-bats in which the player gets a hit. Both have been used for
more than 100 years and are widely discussed by analysts, the media, and fans. As a robustness
check, we also use a more sophisticated performance measure from the sabermetrics movement
(James 1985). For pitchers, we use the defense-independent ERA that only uses events that are
11
solely within the pitcher’s control. For batters, we use runs created which was devised because a
batter’s job is ultimately to create runs, not hits per se.
For comparability across pitchers and hitters, each measure is converted into a
standardized measure with mean zero and standard deviation one within each season and league
using most players, not just the 1,424 players in the arbitration sample.3 Our key performance
measure is therefore a pooled measure that includes standardized ERA and batting average. A
value of 0.50, for example, indicates that a player’s performance was 0.50 standard deviations
above the mean for that metric in that year with positive values indicating better performance.4
The sabermetrics measure used in robustness checks was created in the same manner and
combines reverse-coded standardized defense-independent ERA and standardized runs created.
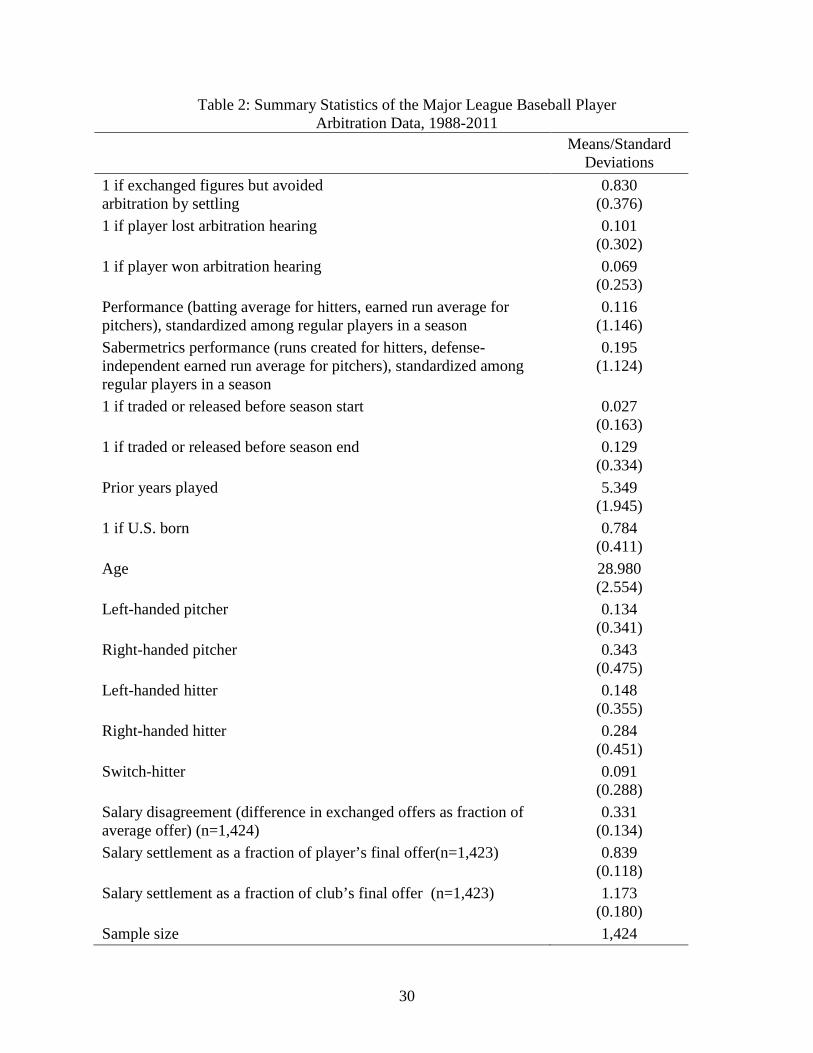
Summary statistics for these two measures are presented in Table 2. We also use the previous
two season’s values of these same performance measures to control for player quality. All
performance measures are for each player’s entire season irrespective of the number of teams he
played on.5
In addition to performance, we also analyze whether the durability of the player-club
relationship systematically differs by settlement type. To do this, we construct two measures.
First, we create a variable that indicates if a player was traded or released before the start of the
season. Second, we create a similar variable that captures whether a player was traded or
released before the end of the season, including pre-season trades and releases. In other words,
3 To remove artificially high and low values, we exclude batters with fewer than 50 at bats and pitchers with fewer than 50 outs pitched when calculating the means and standard deviation by season that are used to create standardized measures of performance. 4 After standardization, the pitching performance variable is multiplied by -1 to correct for the fact that a lower ERA indicates fewer runs conceded and therefore a stronger pitching performance. 5 Limiting the performance analyses to each player’s performance solely with his arbitration team does not change the results.
12
the first variable reflects players who are not with their arbitration club at the start of the regular
season that immediately follows the arbitration process while the second variable reflects players
who are not with their arbitration club at the end of the regular season following the arbitration
process. In our sample, 2.7 percent are traded or released before the season starts and 12.9
percent are traded or released before the season ends.
Summary statistics for additional control variables are also presented in Table 2. This
includes number of prior years played, whether the player was born in the United States, and the
player’s age. For pitchers, we also control for whether he pitches left- or right-handed, and for
batters, we control for whether he bats left, right, or is a switch hitter. Club and year effects will
be included in the multivariate models to control for club-specific and year-specific influences.
Lastly, we also observe the player’s salary demand, the club’s final offer, and the subsequent
agreed-upon or imposed salary. We use this information to construct the three variables on
disagreement and settlement compromise that are shown in the last three rows of Table 2. These
variables will be described in more detail later in the paper.
Does Arbitration Affect Subsequent On-Field Performance?
If the oft-assumed benefits of a voluntary dispute resolution process were strong and
lasting, then baseball players who settle their salary disputes prior to an arbitration hearing would
perform better in the next season compared to those who have a new salary imposed by an
arbitration award, ceteris paribus. To analyze this, we estimate regression models in which player
performance for the season following the arbitration process is the dependent variable. The
primary independent variables of interest are dummy variables that indicate that the player and
club went to arbitration. The results will be reported with two primary specifications—one in
13
which separate dummy variables are included for arbitration winners and arbitration losers, and
an alternative specification in which a single dummy variable indicates that the dispute went to
arbitration. The former specification allows the relationship between performance and arbitration
to differ between winning and losing; the latter specification more directly tests the hypothesis
that a non-consensual process, irrespective of winning or losing, is different from a consensual
settlement. Recall that the data set only includes those who filed for arbitration and exchanged
salary offers, so the comparison group consists of those who filed for arbitration and settled after
exchanging salary figures. Players ineligible for arbitration, already under contract, settling prior
to filing for arbitration, or settling before exchanging offers in the arbitration process are
excluded from the data.
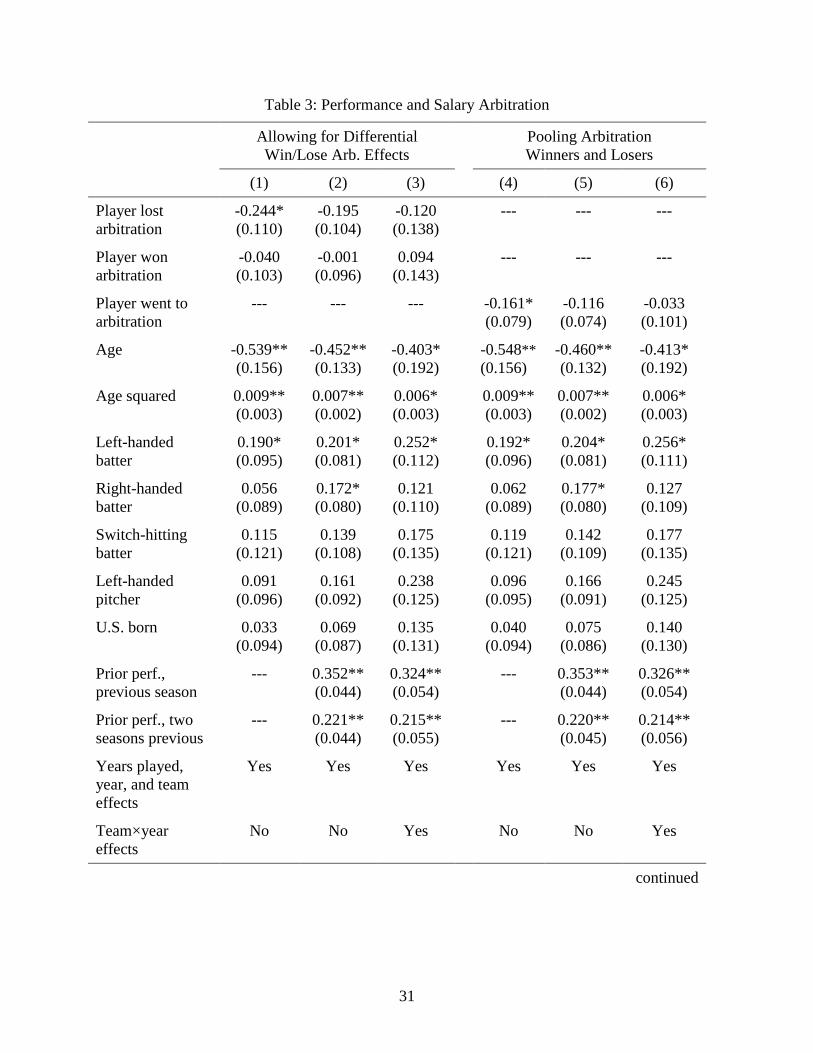
Table 3 reports the regression results for using standardized performance as the
dependent variable. Recall that this standardized performance measure is derived from each
pitcher’s ERA and each position player’s batting average. Columns 1-3 include separate
variables for arbitration winners and losers, but with varying levels of control variables to
account for player quality and other influences on performance. In column 1, the control
variables are player characteristics as well as fixed year and team effects; column 2 adds the
player’s standardized performance for the previous two seasons; column three adds team-by-year
interactions. By construction, positive values of the dependent variable reflect better levels of
performance—a higher batting average or a lower ERA—so the statistically-significant, negative
coefficient for the player losing arbitration in column 1 indicates that such players perform worse
(a lower batting average or a higher ERA) compared to those who settle voluntarily in the step
prior to arbitration, though the effect is only marginally statistically significant after controlling
for prior performance (column 2). The negative estimate for arbitration winners in column 1
14
suggests that arbitration winners perform worse, but this effect is not statistically significant and
it varies depending upon the control variables included. Column 3 adds team-by-year effects
which absorb many degrees of freedom, so the estimates become noisier, and the estimate for
arbitration winners is no longer negative.
The penultimate row on Table 3 presents the p-values from a test for the equality of two
arbitration estimates; given the imprecise estimates, it is not surprising that we cannot reject that
these coefficients are the same at conventional levels of significance. Columns 4-6 therefore
report the results of repeating the regressions reported in columns 1-3 with the two arbitration
variables replaced by a single variable that indicates that the player’s salary dispute was resolved
by an arbitration hearing. In each of the models, the point estimate is negative—that is, players
who go to arbitration perform worse afterwards compared to players who filed for arbitration and
exchanged offers but settled. This estimate is statistically significant in column 4 , but not when
controlling for lagged performance (column 5) and team-by-year effects (column 6). The models
in Table 3, therefore, provide, at best, weak evidence that players who experienced arbitration
performed worse than those who settled voluntarily immediately prior to a hearing. Rather, the
significant results appear driven by arbitration losers so if there is a negative performance effect,
it appears more likely to reflect player dissatisfaction with losing rather than dissatisfaction with
a non-consensual process.
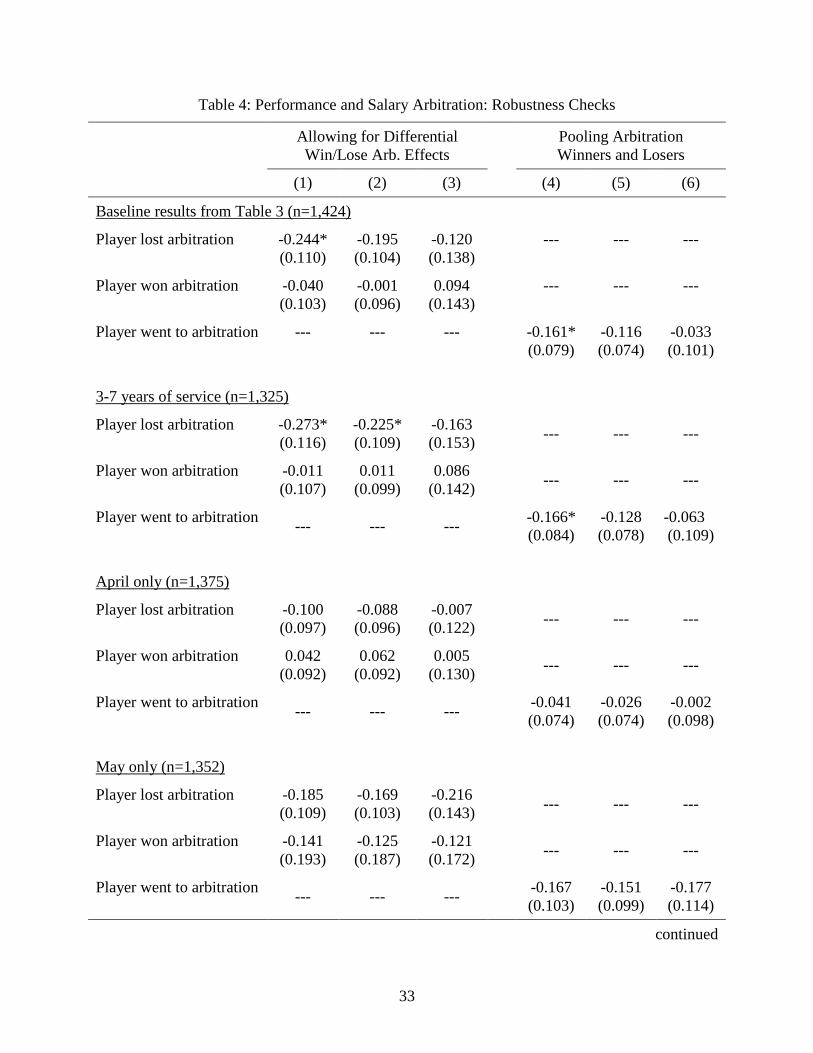
Table 4 reports the results of a series of robustness checks. The columns in Table 4
follow the same specifications as the columns in Table 3, but only the results for the key
arbitration variables are reported. The first three rows in Table 4 repeat the key results from
Table 3 for ease of comparison. One might question whether very experienced free agents who
end up in arbitration and the Super-Twos are different from the players who are normally
15
covered by the arbitration process. The second three-row block of Table 4 therefore repeats the
analyses for the subsample of players with between three and seven years of service. Given that
this captures 93 percent of the sample, it is unsurprising that the results are qualitatively similar
to the baseline results.
One might also think that if there is dissatisfaction with the arbitration process that carries
over to the season that this would be most likely to be evident at the beginning of the season. So
the next two blocks of Table 4 reports the analyses for the first (April) and second (May) months
of the season. Many of the estimates are negative, including the estimates for arbitration winners
in May, but the estimates are imprecisely-estimated and therefore lack statistical significance. As
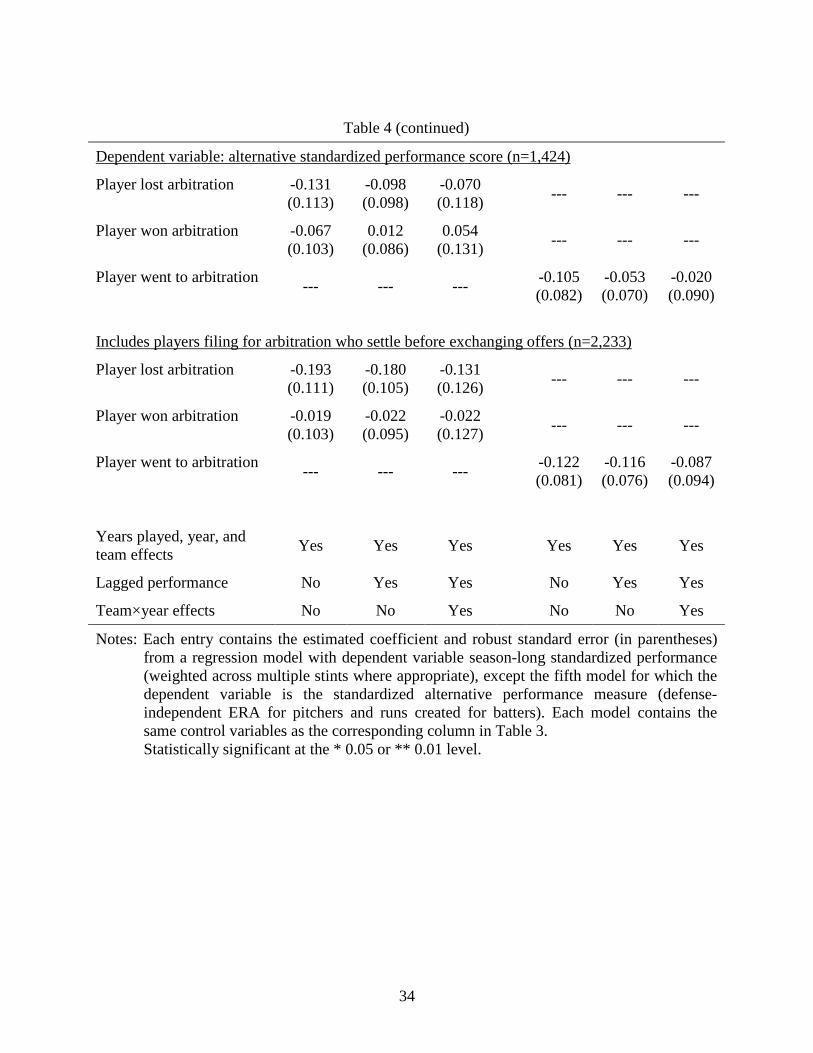
an additional check, the next block of Table 4 uses a sabermetric rather than traditional
performance measure that combines reverse-coded standardized defense-independent ERA and
standardized runs created. The qualitative pattern of results follows a similar pattern to the
baseline results, though the magnitude of the estimates are smaller and none are statistically
significant.
The results reported to this point compare players who went to arbitration with those who
avoided arbitration in the immediately-preceding step—that is, after exchanging salary offers.
We can also comprehensively identify players who filed for arbitration and settled before
exchanging. The last block in Table 4, therefore, expands the comparison category to include all
those who settled after filing for arbitration, irrespective of whether they exchanged salary offers.
The pattern of results is similar to the baseline results. Specifically, the coefficients for players
losing arbitration are negative and of meaningful magnitude, though statistically insignificant,
the coefficients for arbitration winners are much smaller (in absolute value) and very imprecisely
estimated (columns 1-3), and the coefficients for those who went to arbitration (columns 4-6)
16
follow the pattern of the arbitration losers coefficients, but are smaller and also not statistically
significant.
So these robustness results do little to alter the conclusion derived from the baseline
result that there is, at best, weak evidence that baseball players who experienced arbitration
performed significantly differently from those who exchanged arbitration offers but settled
voluntarily. In other words, the results fails to produce evidence of strong performance effects of
imposed outcome compared to voluntary agreement.
Does Arbitration Affect Relationship Durability?
Proponents of voluntary dispute resolution procedures also assert that such procedures
will promote a stronger relationship between the parties. We test this by analyzing whether
relationship durability is systematically different for players who have a settlement imposed by
arbitration compared to those who voluntarily agree to a new salary. In other words, are players
who arbitrated more likely to change teams than players who settled after filing for arbitration?
To address this, we estimate linear probability models where the dichotomous dependent
variable equals 1 if the player is with a team different from his arbitration club when the season
following the arbitration process ends, and 0 otherwise. The independent variables are the same
as in the player performance models.
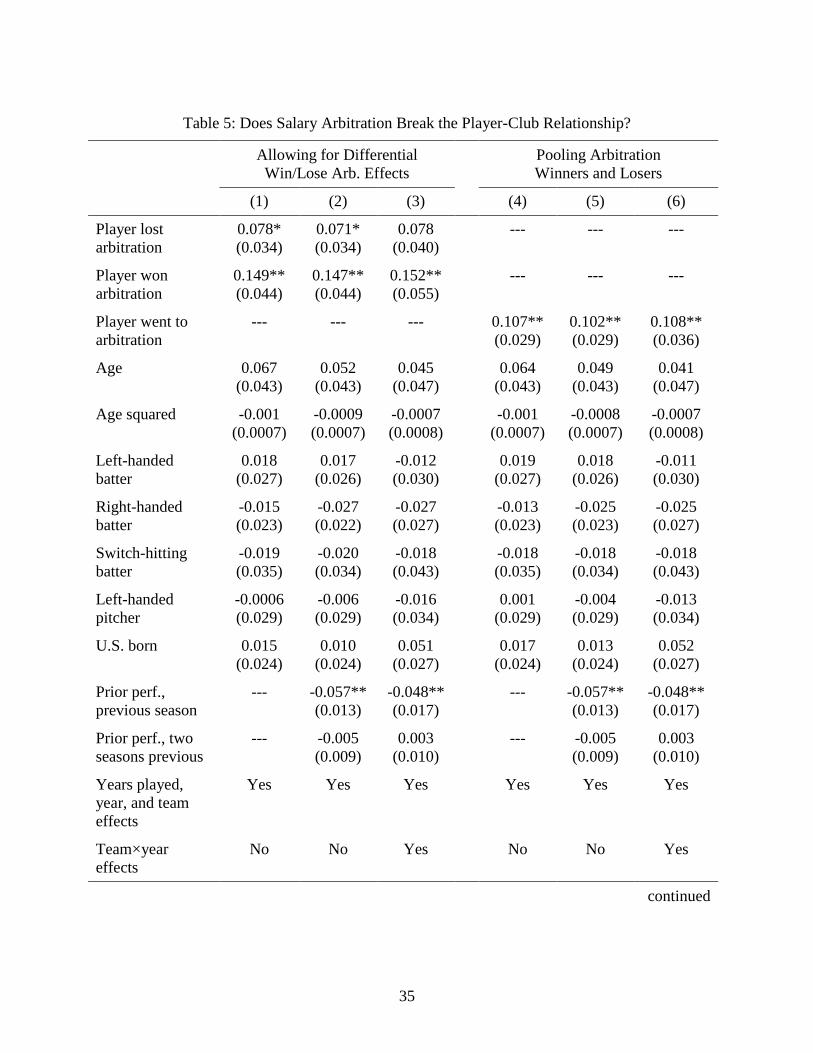
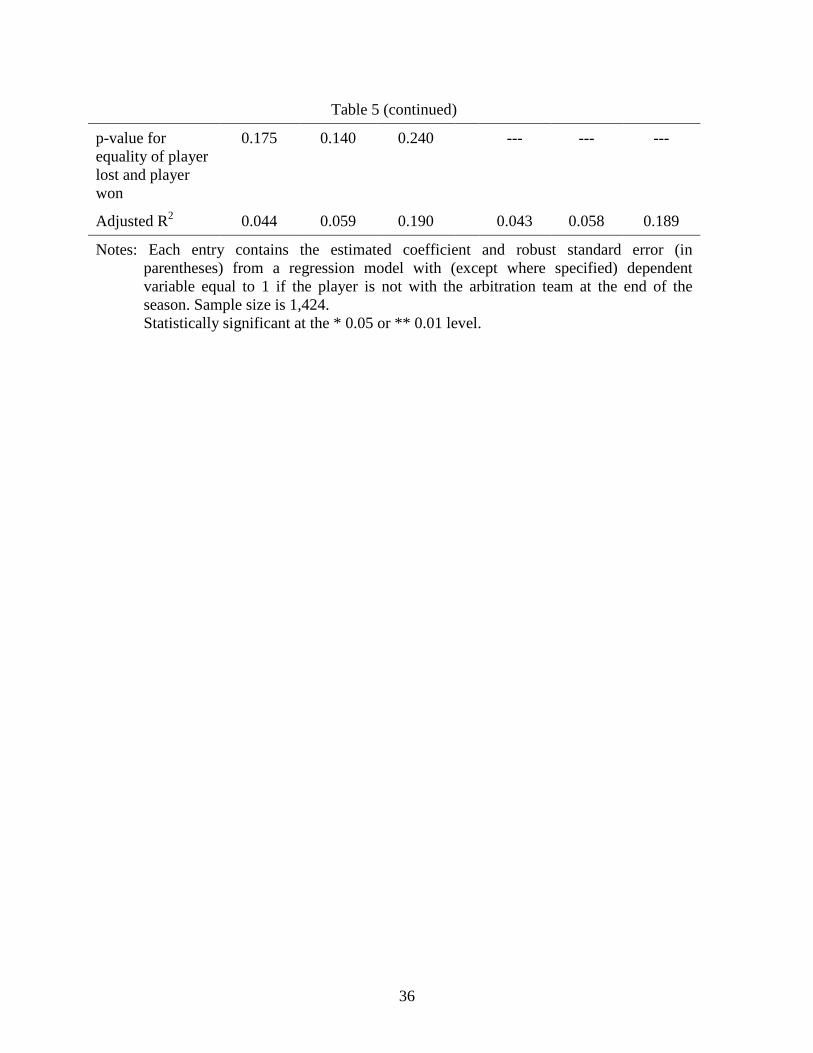
The results for the baseline specifications are reported in Table 5. The estimates in
column 1 indicate that, on average, a player who loses an arbitration hearing is 7.8 percentage
points more likely to be released or traded before the end of the season than a player who settles
voluntary. Moreover, a player who wins an arbitration hearing is also more likely to be released
or traded—on average, by 14.9 percentage points. Both of these estimates are statistically
17
significant at conventional levels. In terms of practical significance, the probability of a
relationship break-up among those who settled voluntarily is 11 percent. So the results in column
1 indicate that losing arbitration increases the likelihood of relationship break-up by roughly 70
percent while winning arbitration increases it by 135 percent. The results are robust to
controlling for player quality via the addition of two lagged years of prior performance (column
2), and is essentially robust to the inclusion of team×year interactions (column 3).6
Moreover, a simple t-test fails to reject the null hypothesis that the arbitration losing and
winning coefficients are statistically different from each other so the specifications reported in
columns 4-6 compare those who went to arbitration with those who settled voluntarily. The
results are what one would expect given the results in columns 1-3—that is, positive and
statistically significant estimates in all three specifications. The estimates imply that controlling
for a variety of characteristics, the relationship between a player and a club that have an
arbitration settlement imposed upon them is, on average, twice as likely to end before the end of
the season compared to a relationship that settles voluntarily in the step prior to arbitration.
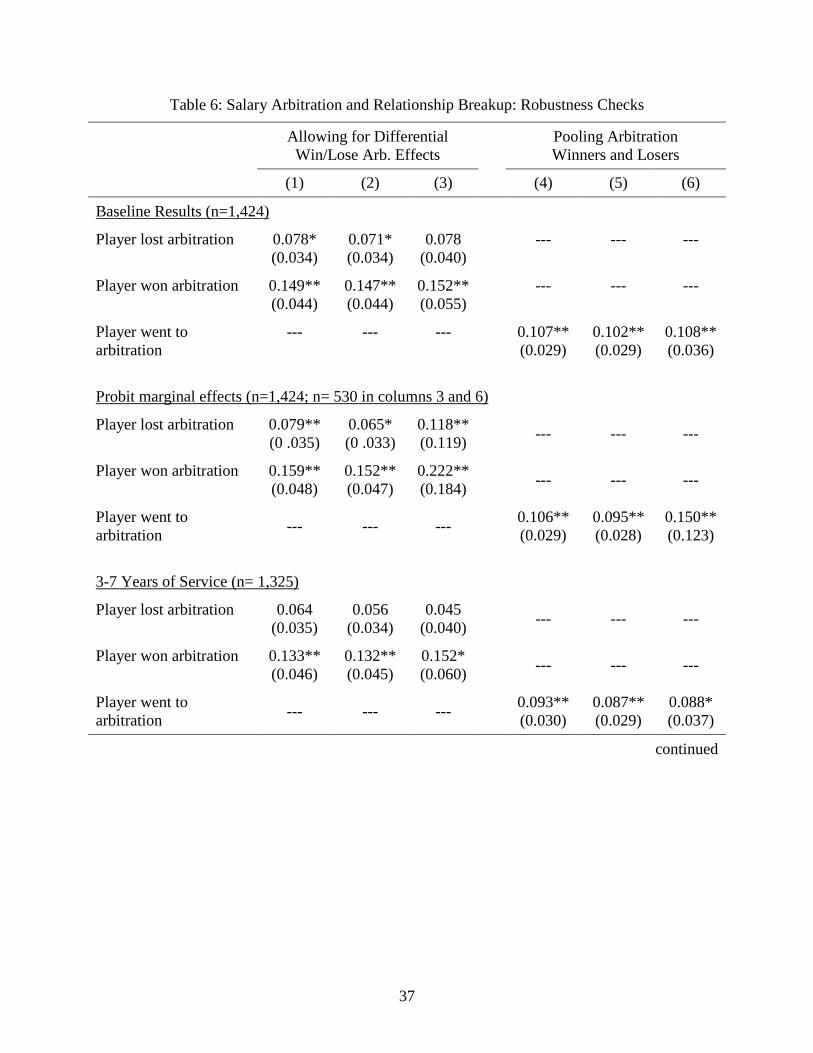
The first robustness check in Table 6 is to confirm that we obtain the same results using
probit estimation that formally models the dichotomous nature of the dependent variable. The
probit estimates, which have been converted to marginal effects in Table 6, are positive and
statistically significant. Given the overall similarity, we use linear probability models for the
remainder of our estimations.7 The next robustness check limits the sample to players with 3-7
years of service. The coefficients are uniformly slightly smaller. While the coefficients for
6 While the losing arbitration coefficient in column 3 is technically not significant at the five percent level, its p-value is only 0.054. 7 The magnitudes of the coefficients in columns 3 and 6 are somewhat different. This is because the sample composition changes because many of the team×year effects perfectly predict the dependent variable and observations in these cells are excluded from the probit estimation.
18
arbitration losers are not statistically significant at conventional levels, the overall pattern is quite
similar, including statistically significant, positive estimates for those going to arbitration
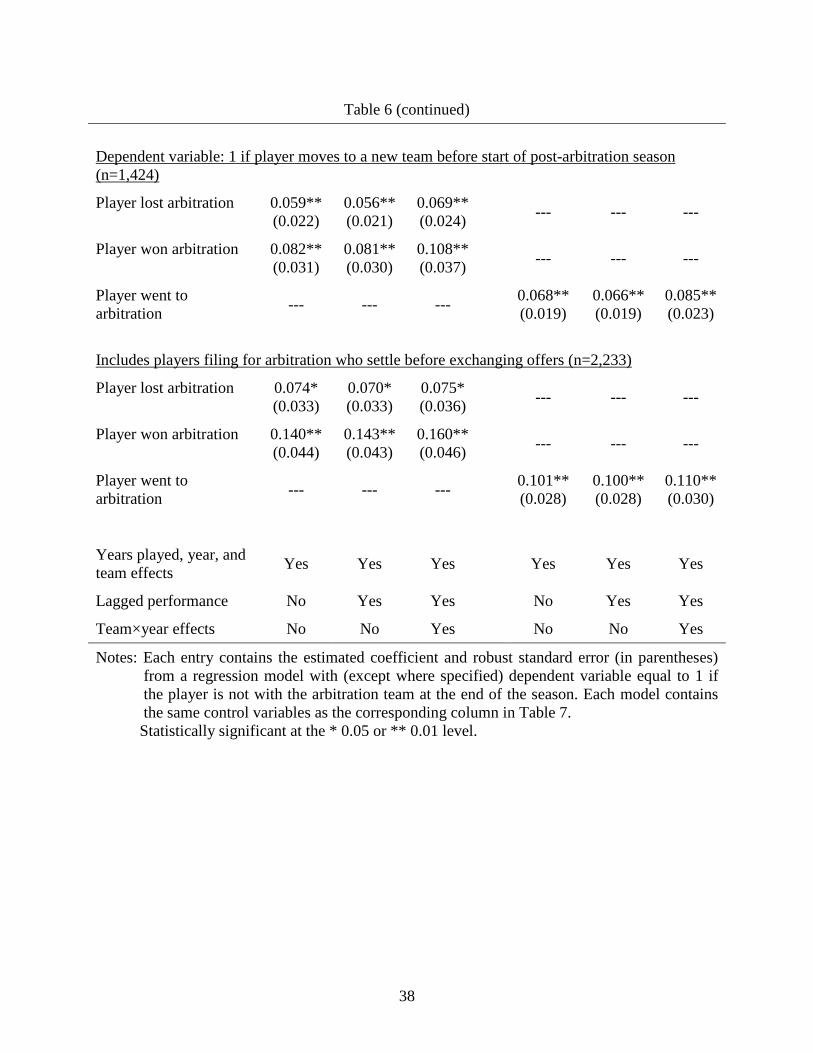
(columns 4-6). As an alternative measure of relationship stability, we look at whether a player is
with a new team at the start rather than end of the first season following the arbitration process.
The next block of results in Table 6 shows that these results are very similar to the results for
switching by the end of the season. In effect, these estimates are even larger than in the baseline
specification because only 1.6 percent of the consensual settlement players are released or traded
before the start of the season. So the estimates in columns 4-6 imply that the likelihood of a pre-
season break-up is approximately four times larger when a settlement is imposed. Lastly, the
results are also unchanged when the comparison group is expanded to include those who settled
after filing for arbitration but before exchanging offers.
These are important results on relationship deterioration. It is typical to assume that good
things will come from winning a dispute, but this result reminds us that in final-offer arbitration,
there is always a loser. In other words, these results indicate that when the player loses, he is
significantly less likely to stay with that club, and when the club loses, the player is significantly
less likely to be retained by the club. Consequently, in this setting for these types of players, it
appears that a consensual resolution does have the benefits often claimed.
The Intensity of the Dispute and the Margin of Victory
The analyses to this point have focused on the stage of the salary arbitration process in
Major League Baseball that results in a new salary. In effect, these analyses uncover the average
effect of settlement stage across negotiations and disputes that have different intensities and
varying degrees of compromise in the resulting salary. In a final set of analyses we explore
19
whether the intensity of the dispute and the margin of victory are significantly related to
subsequent player performance and relationship durability or alter the relationship between these
outcomes and settlement stage. To do this, recall that our data consists of player-club pairs that
exchanged offers so we are able to use three salary figures: the club’s offered salary, the player’s
demanded salary, and the actual salary that results from the process. Recall further that the actual
salary results from consensual negotiations 83 percent of the time, the player losing arbitration
10 percent of the time, and the player winning arbitration 7 percent of the time.
It can be difficult to observe the intensity of a dispute, but it seems reasonable to believe
that it will be related to the divergence between what the club offers and the player demands.
That is, disputes with a larger gap are expected to typically be more intense. To formalize this,
we create a salary disagreement measure which is the difference between the player’s demand
and the club’s offer expressed as a fraction of the average of the two offers. For example, in a
2010 case, Angels catcher Jeff Mathis requested a new salary of $1.3 million whereas the club
offered $700,000. Our disagreement measures this $600,000 difference given a $1 million
average offer, as 0.60. In that same round, Angels pitcher Joe Saunders requested $3.85 million
while the club offered $3.6 million. This is a $250,000 difference relative to an average of
$3.725—that is, a disagreement of only 0.067. We assume that, on average, differences like the
Mathis case reflect more intense disputes than differences like the Saunders case.8
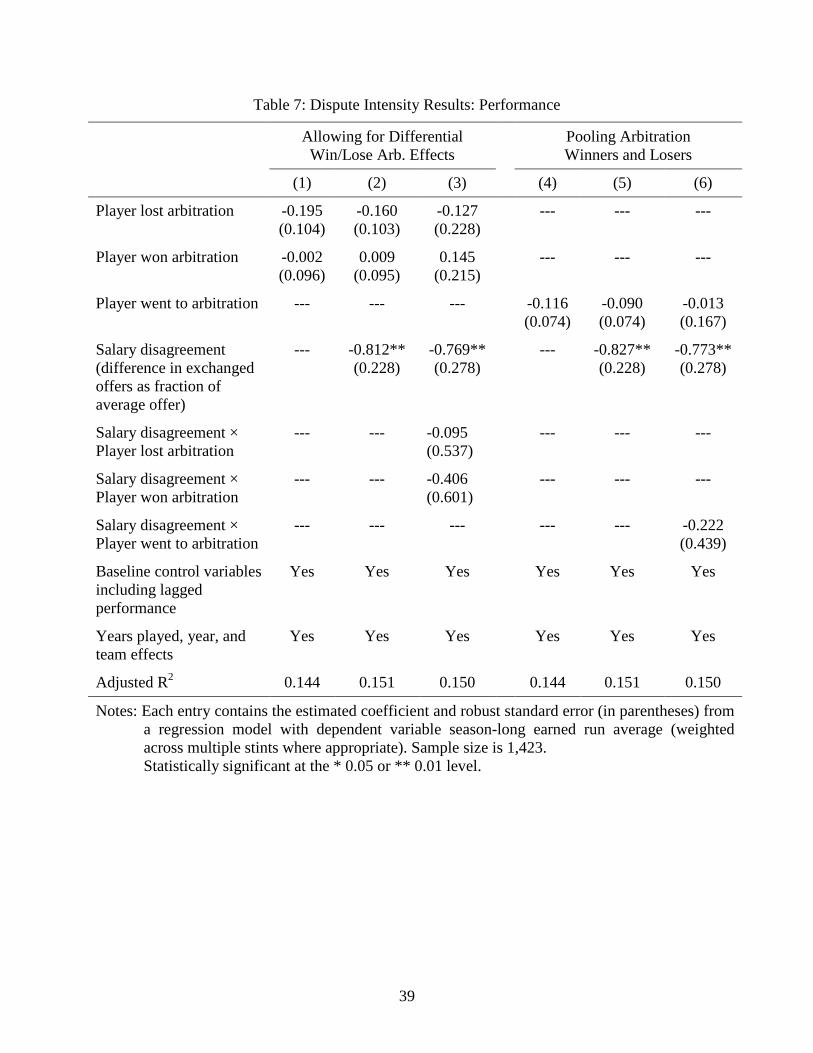
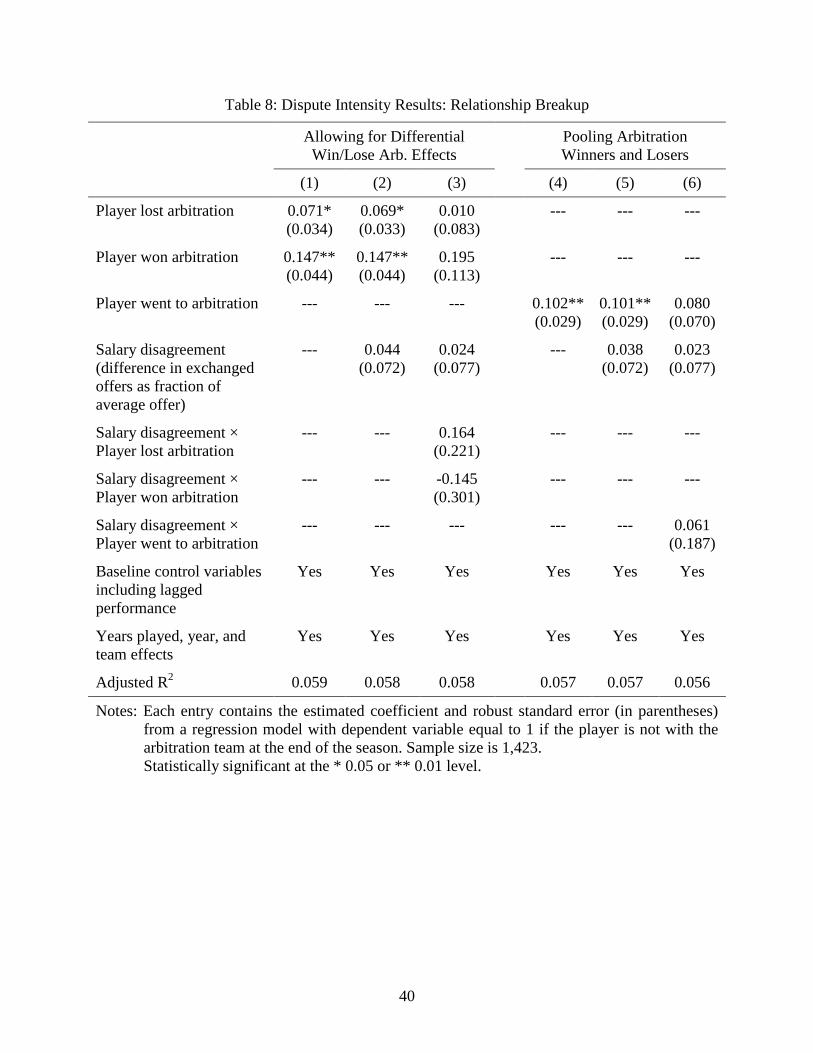
Tables 7-8 report the results of augmenting the player performance and relationship
break-up regression models with this salary disagreement measure. All of these results use the
8 Indeed, in these particular cases, Mathis went to arbitration (and lost) whereas Saunders and the Angels settled prior to the hearing. To look at this more systematically, we estimated a regression with going to arbitration as the dependent variable and using the same controls as in column 5 in the previous tables as well as the disagreement measure. Disagreement is positively related to the likelihood of arbitration (p-value 0.002).
20
specification from the earlier tables that include the demographic controls, lagged performance,
and years played, team, and, year effects. Columns 1 and 4 in each of these tables reports a
baseline specifications for ease of comparison. Columns 2 and 5 in Tables 7-8 add the salary
disagreement variable to each model to assess whether controlling for this proxy of dispute
intensity alters the earlier results. While the negative performance effect of losing in arbitration
is dampened slightly, the overall pattern of results is unchanged. Interestingly, however, higher
levels of salary disagreement are associated with lower performance. Lastly, columns 3 and 6 of
Tables 7-8 add interactions between the disagreement and the arbitration variables to see if the
arbitration effects are impacted by the intensity of the dispute. None of the interaction terms are
statistically significant.
Finally, we also use the salary data to construct measures of the degree of compromise
and victory in the final settlement. Specifically, we create a variable that measures the player’s
new salary as fraction of the player’s final offer and a variable that indicates the player’s new
salary as fraction of club’s final offer. Returning to the examples above, the arbitration panel
ruled in favor of Mathis. His salary as a fraction of what he demanded is therefore 1. From the
club’s perspective, however, his new salary of $1.3 million is 1.857 times their final offer. In
contrast, after exchanging salary offers, Saunders and his club avoided arbitration by agreeing to
a new salary of $3.7 million. From the player’s perspective, this represents 0.961 of his demand;
from the club’s perspective, this represents 1.028 of its offer.
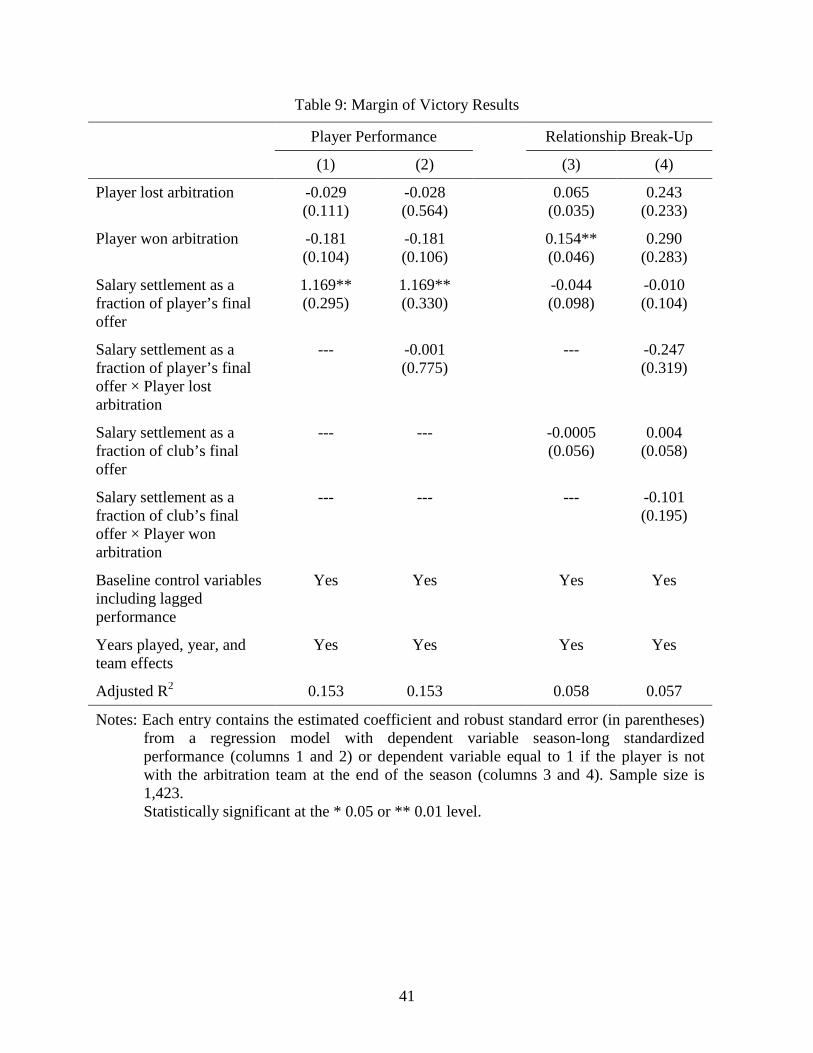
One might think that the player’s margin of victory will affect subsequent performance—
that is, the larger the margin of victory, the greater satisfaction and therefore a larger
performance increase. To analyze this, we start with the baseline performance regression using
the demographic controls, lagged performance, and years played, team, and year effects as
21
reported in column 1 of Table 7. To this model we add the player’s new salary as a fraction of
the player’s final offer. The estimated coefficient for this variable is significantly positive
(column 1 in Table 9) which indicates that the better the player did in the salary determination
process, the better he performed in the subsequent season. Interestingly, controlling for this
salary outcome also makes the coefficients for losing and winning arbitration both negative and
of similar magnitude, but neither are statistically significant. Column 2 in Table 9 adds an
interaction between the salary settlement from the player’s perspective and an indicator that the
player lost his arbitration hearing.9 The interaction, however, is estimated to be essentially zero.
Lastly, columns 3 and 4 of Table 9 analyze the relationship between the margin of victory
(or defeat) and whether the player-club relationship breaks-up. In column 3, the player’s new
salary as fraction of player’s final offer and as a fraction of the club’s final offer are added to the
baseline specification. Comparing these results to those reported in column 1 of Table 8 indicates
that controlling for these additional variables does not change the qualitative pattern of the
results. That is, going to arbitration has negative consequences for relationship durability, even
after controlling for how well or poorly the player and club fared in the final salary outcome
relative to their demand.
But perhaps the effect of arbitration varies by the extent to which the player or club feel
that they did well in the final outcome. So column 4 of Table 9 adds interactions. If a player
loses in arbitration, we expect that the player-club relationship might be weakened by player
frustration, and that this would be stronger the worse the player fares in terms of final salary. So
we interact a player loss with the settlement as a fraction of the player’s demand. If a player wins
9 Column 2 does not include an interaction with the player winning arbitration because the settlement as a fraction of the player’s final offer is always one when the player wins. Also, because columns 1 and 2 analyze player performance, the salary settlement as a fraction of the club’s offer is excluded.
22
in arbitration, we expect that the relationship might be more likely to end the more expensive the
settlement is from the club’s perspective. So we interact a player victory with the settlement as a
fraction of the club’s demand. None of the interactions are significant.
Conclusions
Many dispute resolution researchers and practitioners believe that dispute resolution
procedures that result in consensual, negotiated agreements, perhaps assisted by mediation, are
better than procedures such as arbitration and litigation that impose an agreement upon the
disputants. Though it seems logical that parties would be more likely to abide by an agreement
they voluntary consented to and that such relationships would be more lasting, this might not
always be the case. For example, if an arbitration or court hearing is seen as more fair by one of
the disputants then the benefits might be reversed. So what happens in practice? Beyond
measures of satisfaction with the dispute resolution procedure, systematic evidence on more
lasting and important effects comparing real-world outcomes that result from actual behavior
across alternative dispute resolution procedures is scant.
This paper therefore analyzes over 1,400 salary re-negotiations from Major League
Baseball between 1988 and 2011 to examine whether negotiated or arbitrated settlements are
associated with differential levels of subsequent player performance and player-club relationship
durability. With respect to player performance, the evidence suggests that only one conclusion
can be stated confidently: experiencing final-offer arbitration does not substantially improve
performance relative to settling voluntarily just prior to an arbitration hearing. But does
arbitration reduce performance? In some specifications, a consensual negotiated settlement is
associated with higher performance, but this result is not very robust. So there is not sufficient
23
evidence to conclude that consensual, negotiated settlements are better than settlements imposed
by arbitration with respect to subsequent player performance. Turning to relationship durability,
the results are stronger. Specifically, players who experience arbitration—win or lose—are
significantly less likely to still be with the arbitration team at the end of the season immediately
following arbitration. Putting all of this together, then, leads us to conclude that there is some
support for the conventional wisdom (consensual agreements improve relationship quality), but
not as robust as the conventional wisdom would predict (little effect on performance).
The mixed support for the claimed superiority of voluntary dispute resolution procedures
is further clouded by the possibility that ending up in arbitration is an endogenous event. We
have controlled for prior performance and other observable or fixed effects, but in some cases
there might be unobservable, idiosyncratic factors that lead to the deterioration of the
relationship and also to arbitration. In such cases, arbitration reflects rather than causes
relationship quality and durability. We are unable to formally estimate an endogenous model due
to a lack of good identifying instruments and so it is possible that even the evidence that
seemingly supports the conventional wisdom actually reflects some unobservable set of factors
surrounding the nature of the disputants’ relationship. However, recall that we have restricted our
analyses to only those player-club pairs that went all the way to exchanging offers in order to
make the arbitration and non-arbitration observations as similar as possible. Moreover, adding
important independent variables, such as prior performance, club fixed effects and disagreement
intensity, to the models do not change results. But even if our strategies for addressing
endogeneity are imperfect, the results are nevertheless important for revealing an association
between how disputes are resolved and relationship durability that is worthy of further study.
24
While the data come from the context of professional baseball, these results are important
for dispute resolution researchers and practitioners with implications beyond professional
baseball. The claimed superiority of voluntary dispute resolution procedures is neither uniformly
rejected nor supported. Additional research and perhaps some re-thinking of longstanding
assumptions are therefore needed. This includes questioning whether voluntary methods are
always superior as well as whether non-consensual methods provide the desired incentives for
voluntary settlement. Additional research into these types of questions should follow this paper
and find real-world settings in which there are observable performance measures, the possibility
of relationship breakdown, and non-trivial use of both voluntary and imposed settlement
procedures. Moreover, the intensity of a dispute and the margin of victory can be difficult to
measure in real-world disputes. The final offer process used in Major League Baseball provides a
unique opportunity to assess these issues. In this case, these factors did not change the arbitration
results, which is itself an important result, though they do seem associated with subsequent
performance. So elements of both distributive and procedural are important in some of the
results.
Lastly, to the extent that the results suggest that, at least in some cases, the nature of the
dispute resolution process affects subsequent outcomes, then organizational dispute resolution
systems need to be designed in ways that support rather than undermine other organizational
objectives (Reuben 2005). In designing these systems, and in the research that underlies this, it is
easy to focus on employee reactions to winning, losing, and perceived injustice. But these
analyses remind us that the employment relationship is two-sided. In final-offer arbitration,
especially, every winner has a loser such that players are less likely to remain with their team
when they lose and when they win—that is, when the organization loses. We therefore need to be
25
careful not to overlook the reactions of managers and organizational leaders. These reactions are
equally important in determining the conditions under which voluntary dispute resolution
procedures are superior to imposed settlement procedures.
26
References
Abrams, Roger I. (2000) The Money Pitch: Baseball Free Agency and Salary Arbitration (Philadelphia: Temple University Press).
Brett, Jeanne M., Zoe I. Barsness, and Stephen B. Goldberg (1996) “The Effectiveness of
Mediation: An Independent Analysis of Cases Handled by Four Major Service Providers,” Negotiation Journal, vol. 12, no. 3 (July): 259-69.
Bretz, Robert D., Jr., and Steven L. Thomas (1992) “Perceived Equity, Motivation, and Final-
Offer Arbitration in Major League Baseball,” Journal of Applied Psychology, vol. 77, no. 3 (June): 280-87.
Burger, John D., and Stephen J. K. Walters (2005) “Arbitrator Bias and Self-Interest: Lessons
from the Baseball Labor Market,” Journal of Labor Research, vol. 26, no. 2 (Spring): 267-80.
Burgess, Paul L., and Daniel R. Marburger (1993) “Do Negotiated and Arbitrated Salaries Differ
under Final-Offer Arbitration?” Industrial and Labor Relations Review, vol. 46, no. 3 (April): 548-59.
Chelius, James R., and James B. Dworkin (1980) “An Economic Analysis of Final-Offer
Arbitration as a Conflict Resolution Device,” Journal of Conflict Resolution, vol. 24, no. 2 (June): 293-310.
Cloke, Kenneth and Joan Goldsmith (2000) Resolving Conflicts at Work: A Complete Guide for
Everyone on the Job (San Francisco: Jossey-Bass). Dworkin, James B. (1981) Owners Versus Players: Baseball and Collective Bargaining (Boston:
Auburn House). Dworkin, James B. (1997) “Final Offer Salary Arbitration (FOSA)—a.k.a. Franchise Owners’
Self Annihilation,” Daniel R. Marburger (ed.), Stee-rike Four! What’s Wrong with the Business of Baseball? (Westport, CT: Praeger): 73-83.
Edwards, Leonard (2009) “Child Protection Mediation: A 25‐Year Perspective,” Family Court
Review, vol. 47, no. 1 (January): 69-80. Farber, Henry S., and Harry C. Katz (1979) “Interest Arbitration, Outcomes, and the Incentive to
Bargain,” Industrial and Labor Relations Review, vol. 33, no. 1 (October): 55-63. Faurot, David J., and Stephen McAllister (1992) “Salary Arbitration and Pre-Arbitration
Negotiation in Major League Baseball,” Industrial and Labor Relations Review, vol. 45, no. 4 (July): 697-710.
27
Feuille, Peter (1999) “Grievance Mediation,” in Adrienne E. Eaton and Jeffrey H. Keefe (eds.), Employment Dispute Resolution and Worker Rights in the Changing Workplace (Champaign, IL: Industrial Relations Research Association): 187-217.
Fiss, Owen M. (1984) “Against Settlement,” Yale Law Journal, vol. 93, no. 6 (May): 1073-90. Fizel, John, Anthony C. Krautmann, and Lawrence Hadley (2002) “Equity and Arbitration in
Major League Baseball,” Managerial and Decision Economics, vol. 23, no. 7 (October-November): pp. 427-35.
Fuller, Lon L. (1971) “Mediation—Its Forms and Functions,” Southern California Law Review,
vol. 44, no. 2 (Winter): 305-39. Hauenstein, Neil M. A., and Robert G. Lord (1989) “The Effects of Final-Offer Arbitration on
the Performance of Major League Baseball Players: A Test of Equity Theory,” Human Performance, vol. 2, no. 3: 147-65.
James, Bill (1985) The Bill James Historical Baseball Abstract (New York: Villard Books). Kahn, Lawrence M. (1993) “Free Agency, Long-Term Contracts and Compensation in Major
League Baseball: Estimates from Panel Data,” Review of Economics and Statistics, vol. 75, no. 1 (February): 157-64.
Lipsky, David B., Ronald L. Seeber, and Richard D. Fincher (2003) Emerging Systems for
Managing Workplace Conflict: Lessons from American Corporations for Managers and Dispute Resolution Professionals (San Francisco: Jossey-Bass).
Mas, Alexandre. (2006) “Pay, Reference Points, and Police Performance,” Quarterly Journal of
Economics, vol. 71, no. 3 (August): 783-821. McCall, Brian P. (1990) “Interest Arbitration and the Incentive to Bargain: A Principal-Agent
Approach,” Journal of Conflict Resolution, vol. 34, no. 1 (March): 151-67. McEwen, Craig A., and Richard J. Maiman (1981) “Small Claims Mediation in Maine: An
Empirical Assessment,” Maine Law Review, vol. 33: 237-68. Nolan-Haley, Jacqueline (2012) “Mediation: The ‘New Arbitration,’” Harvard Negotiation Law
Review, vol. 17 (Spring): 61-95. Reuben, Richard C. (2005) “Democracy and Dispute Resolution: Systems Design and the New
Workplace, Harvard Negotiation Law Review, vol. 10 (Spring): 11-68. Shapiro, Debra L., and Jeanne M. Brett (1993) “Comparing Three Processes Underlying
Judgments of Procedural Justice: A Field Study of Mediation and Arbitration,” Journal of Personality and Social Psychology, vol. 65, no. 6 (December): 1167-77.
28
Stadler, Mike (2007) The Psychology of Baseball: Inside the Mental Game of the Major League Player (New York: Penguin).
Tulis, Benjamin A. (2010) “Final-Offer ‘Baseball’ Arbitration: Contexts, Mechanics and
Applications,” Seton Hall Journal of Sports and Entertainment Law, vol. 20, no. 1: 85-130.
Wall, James A., and Timothy C. Dunne (2012) “Mediation Research: A Current Review,”
Negotiation Journal, vol. 28, no. 2 (April): 217–44. Welsh, Nancy A. (2001) “The Thinning Vision of Self-Determination in Court-Connected
Mediation: The Inevitable Price of Institutionalization?” Harvard Negotiation Law Review, vol. 6 (Spring): 1-96.
Wissler, Roselle L. (1995) “Mediation and Adjudication in the Small Claims Court: The Effects
of Process and Case Characteristics,” Law and Society Review, vol. 29, no. 2: 323-58. Wissler, Roselle L. (2004) “The Effectiveness of Court-Connected Dispute Resolution in Civil
Cases,” Conflict Resolution Quarterly, vol. 22, no. 1-2 (Fall-Winter): 55-88.
29
Table 1: Counts of Arbitration Process Outcomes by Year
Year
Exchanged figures but avoided by
settling (1)
Player lost arbitration
hearing (2)
Player won arbitration
hearing (3)
Total (4)
1988 65 10 7 82 1989 80 5 7 92 1990 97 10 13 120 1991 96 11 6 113 1992 102 11 9 122 1993 73 12 6 91 1994 54 9 5 68 1995 31 6 2 39 1996 44 2 7 53 1997 42 4 1 47 1998 47 5 3 55 1999 26 9 2 37 2000 41 6 4 51 2001 47 8 6 61 2002 27 4 1 32 2003 25 5 2 32 2004 20 4 2 26 2005 35 2 1 38 2006 38 4 2 44 2007 46 4 3 53 2008 40 6 2 48 2009 41 1 2 44 2010 35 5 3 43 2011 30 1 2 33 Total 1,182 144 98 1,424
30
Table 2: Summary Statistics of the Major League Baseball Player Arbitration Data, 1988-2011
Means/Standard Deviations
1 if exchanged figures but avoided arbitration by settling
0.830 (0.376)
1 if player lost arbitration hearing 0.101 (0.302)
1 if player won arbitration hearing 0.069 (0.253)
Performance (batting average for hitters, earned run average for pitchers), standardized among regular players in a season
0.116 (1.146)
Sabermetrics performance (runs created for hitters, defense-independent earned run average for pitchers), standardized among regular players in a season
0.195 (1.124)
1 if traded or released before season start 0.027 (0.163)
1 if traded or released before season end 0.129 (0.334)
Prior years played 5.349 (1.945)
1 if U.S. born 0.784 (0.411)
Age 28.980 (2.554)
Left-handed pitcher 0.134 (0.341)
Right-handed pitcher 0.343 (0.475)
Left-handed hitter 0.148 (0.355)
Right-handed hitter 0.284 (0.451)
Switch-hitter 0.091 (0.288)
Salary disagreement (difference in exchanged offers as fraction of average offer) (n=1,424)
0.331 (0.134)
Salary settlement as a fraction of player’s final offer(n=1,423) 0.839 (0.118)
Salary settlement as a fraction of club’s final offer (n=1,423) 1.173 (0.180)
Sample size 1,424
31
Table 3: Performance and Salary Arbitration
Allowing for Differential Win/Lose Arb. Effects
Pooling Arbitration Winners and Losers
(1) (2) (3) (4) (5) (6)
Player lost arbitration
-0.244* (0.110)
-0.195 (0.104)
-0.120 (0.138)
--- --- ---
Player won arbitration
-0.040 (0.103)
-0.001 (0.096)
0.094 (0.143)
--- --- ---
Player went to arbitration
--- --- --- -0.161* (0.079)
-0.116 (0.074)
-0.033 (0.101)
Age -0.539** (0.156)
-0.452** (0.133)
-0.403* (0.192)
-0.548** (0.156)
-0.460** (0.132)
-0.413* (0.192)
Age squared 0.009** (0.003)
0.007** (0.002)
0.006* (0.003)
0.009** (0.003)
0.007** (0.002)
0.006* (0.003)
Left-handed batter
0.190* (0.095)
0.201* (0.081)
0.252* (0.112)
0.192* (0.096)
0.204* (0.081)
0.256* (0.111)
Right-handed batter
0.056 (0.089)
0.172* (0.080)
0.121 (0.110)
0.062 (0.089)
0.177* (0.080)
0.127 (0.109)
Switch-hitting batter
0.115 (0.121)
0.139 (0.108)
0.175 (0.135)
0.119 (0.121)
0.142 (0.109)
0.177 (0.135)
Left-handed pitcher
0.091 (0.096)
0.161 (0.092)
0.238 (0.125)
0.096 (0.095)
0.166 (0.091)
0.245 (0.125)
U.S. born 0.033 (0.094)
0.069 (0.087)
0.135 (0.131)
0.040 (0.094)
0.075 (0.086)
0.140 (0.130)
Prior perf., previous season
--- 0.352** (0.044)
0.324** (0.054)
--- 0.353** (0.044)
0.326** (0.054)
Prior perf., two seasons previous
--- 0.221** (0.044)
0.215** (0.055)
--- 0.220** (0.045)
0.214** (0.056)
Years played, year, and team effects
Yes Yes Yes Yes Yes Yes
Team×year effects
No No Yes No No Yes
continued

32
Table 3 (continued)
p-value for equality of player lost and player won
0.167 0.164 0.275 --- --- ---
Adjusted R2 0.045 0.144 0.086 0.044 0.144 0.086
Notes: Each entry contains the estimated coefficient and robust standard error (in parentheses) from a regression model with dependent variable season-long earned run average (weighted across multiple stints where appropriate). Sample size is 1,424. Statistically significant at the * 0.05 or ** 0.01 level.
33
Table 4: Performance and Salary Arbitration: Robustness Checks
Allowing for Differential Win/Lose Arb. Effects
Pooling Arbitration Winners and Losers
(1) (2) (3) (4) (5) (6)
Baseline results from Table 3 (n=1,424)
Player lost arbitration -0.244* (0.110)
-0.195 (0.104)
-0.120 (0.138)
--- --- ---
Player won arbitration -0.040 (0.103)
-0.001 (0.096)
0.094 (0.143)
--- --- ---
Player went to arbitration --- --- --- -0.161* (0.079)
-0.116 (0.074)
-0.033 (0.101)
3-7 years of service (n=1,325)
Player lost arbitration -0.273* (0.116)
-0.225* (0.109)
-0.163 (0.153) --- --- ---
Player won arbitration -0.011 (0.107)
0.011 (0.099)
0.086 (0.142) --- --- ---
Player went to arbitration --- --- --- -0.166* (0.084)
-0.128 (0.078)
-0.063 (0.109)
April only (n=1,375)
Player lost arbitration -0.100 (0.097)
-0.088 (0.096)
-0.007 (0.122) --- --- ---
Player won arbitration 0.042 (0.092)
0.062 (0.092)
0.005 (0.130) --- --- ---
Player went to arbitration --- --- --- -0.041 (0.074)
-0.026 (0.074)
-0.002 (0.098)
May only (n=1,352)
Player lost arbitration -0.185 (0.109)
-0.169 (0.103)
-0.216 (0.143) --- --- ---
Player won arbitration -0.141 (0.193)
-0.125 (0.187)
-0.121 (0.172) --- --- ---
Player went to arbitration --- --- --- -0.167 (0.103)
-0.151 (0.099)
-0.177 (0.114)
continued
34
Table 4 (continued)
Dependent variable: alternative standardized performance score (n=1,424)
Player lost arbitration -0.131 (0.113)
-0.098 (0.098)
-0.070 (0.118) --- --- ---
Player won arbitration -0.067 (0.103)
0.012 (0.086)
0.054 (0.131) --- --- ---
Player went to arbitration --- --- --- -0.105 (0.082)
-0.053 (0.070)
-0.020 (0.090)
Includes players filing for arbitration who settle before exchanging offers (n=2,233)
Player lost arbitration -0.193 (0.111)
-0.180 (0.105)
-0.131 (0.126) --- --- ---
Player won arbitration -0.019 (0.103)
-0.022 (0.095)
-0.022 (0.127) --- --- ---
Player went to arbitration --- --- --- -0.122 (0.081)
-0.116 (0.076)
-0.087 (0.094)
Years played, year, and team effects Yes Yes Yes Yes Yes Yes
Lagged performance No Yes Yes No Yes Yes
Team×year effects No No Yes No No Yes
Notes: Each entry contains the estimated coefficient and robust standard error (in parentheses) from a regression model with dependent variable season-long standardized performance (weighted across multiple stints where appropriate), except the fifth model for which the dependent variable is the standardized alternative performance measure (defense-independent ERA for pitchers and runs created for batters). Each model contains the same control variables as the corresponding column in Table 3. Statistically significant at the * 0.05 or ** 0.01 level.
35
Table 5: Does Salary Arbitration Break the Player-Club Relationship?
Allowing for Differential Win/Lose Arb. Effects
Pooling Arbitration Winners and Losers
(1) (2) (3) (4) (5) (6)
Player lost arbitration
0.078* (0.034)
0.071* (0.034)
0.078 (0.040)
--- --- ---
Player won arbitration
0.149** (0.044)
0.147** (0.044)
0.152** (0.055)
--- --- ---
Player went to arbitration
--- --- --- 0.107** (0.029)
0.102** (0.029)
0.108** (0.036)
Age 0.067 (0.043)
0.052 (0.043)
0.045 (0.047)
0.064 (0.043)
0.049 (0.043)
0.041 (0.047)
Age squared -0.001 (0.0007)
-0.0009 (0.0007)
-0.0007 (0.0008)
-0.001 (0.0007)
-0.0008 (0.0007)
-0.0007 (0.0008)
Left-handed batter
0.018 (0.027)
0.017 (0.026)
-0.012 (0.030)
0.019 (0.027)
0.018 (0.026)
-0.011 (0.030)
Right-handed batter
-0.015 (0.023)
-0.027 (0.022)
-0.027 (0.027)
-0.013 (0.023)
-0.025 (0.023)
-0.025 (0.027)
Switch-hitting batter
-0.019 (0.035)
-0.020 (0.034)
-0.018 (0.043)
-0.018 (0.035)
-0.018 (0.034)
-0.018 (0.043)
Left-handed pitcher
-0.0006 (0.029)
-0.006 (0.029)
-0.016 (0.034)
0.001 (0.029)
-0.004 (0.029)
-0.013 (0.034)
U.S. born 0.015 (0.024)
0.010 (0.024)
0.051 (0.027)
0.017 (0.024)
0.013 (0.024)
0.052 (0.027)
Prior perf., previous season
--- -0.057** (0.013)
-0.048** (0.017)
--- -0.057** (0.013)
-0.048** (0.017)
Prior perf., two seasons previous
--- -0.005 (0.009)
0.003 (0.010)
--- -0.005 (0.009)
0.003 (0.010)
Years played, year, and team effects
Yes Yes Yes Yes Yes Yes
Team×year effects
No No Yes No No Yes
continued
36
Table 5 (continued)
p-value for equality of player lost and player won
0.175 0.140 0.240 --- --- ---
Adjusted R2 0.044 0.059 0.190 0.043 0.058 0.189
Notes: Each entry contains the estimated coefficient and robust standard error (in parentheses) from a regression model with (except where specified) dependent variable equal to 1 if the player is not with the arbitration team at the end of the season. Sample size is 1,424. Statistically significant at the * 0.05 or ** 0.01 level.
37
Table 6: Salary Arbitration and Relationship Breakup: Robustness Checks
Allowing for Differential Win/Lose Arb. Effects
Pooling Arbitration Winners and Losers
(1) (2) (3) (4) (5) (6)
Baseline Results (n=1,424)
Player lost arbitration 0.078* (0.034)
0.071* (0.034)
0.078 (0.040)
--- --- ---
Player won arbitration 0.149** (0.044)
0.147** (0.044)
0.152** (0.055)
--- --- ---
Player went to arbitration
--- --- --- 0.107** (0.029)
0.102** (0.029)
0.108** (0.036)
Probit marginal effects (n=1,424; n= 530 in columns 3 and 6)
Player lost arbitration 0.079** (0 .035)
0.065* (0 .033)
0.118** (0.119) --- --- ---
Player won arbitration 0.159** (0.048)
0.152** (0.047)
0.222** (0.184) --- --- ---
Player went to arbitration --- --- --- 0.106**
(0.029) 0.095** (0.028)
0.150** (0.123)
3-7 Years of Service (n= 1,325)
Player lost arbitration 0.064 (0.035)
0.056 (0.034)
0.045 (0.040) --- --- ---
Player won arbitration 0.133** (0.046)
0.132** (0.045)
0.152* (0.060) --- --- ---
Player went to arbitration --- --- --- 0.093**
(0.030) 0.087** (0.029)
0.088* (0.037)
continued
38
Table 6 (continued)
Dependent variable: 1 if player moves to a new team before start of post-arbitration season (n=1,424)
Player lost arbitration 0.059** (0.022)
0.056** (0.021)
0.069** (0.024) --- --- ---
Player won arbitration 0.082** (0.031)
0.081** (0.030)
0.108** (0.037) --- --- ---
Player went to arbitration --- --- --- 0.068**
(0.019) 0.066** (0.019)
0.085** (0.023)
Includes players filing for arbitration who settle before exchanging offers (n=2,233)
Player lost arbitration 0.074* (0.033)
0.070* (0.033)
0.075* (0.036) --- --- ---
Player won arbitration 0.140** (0.044)
0.143** (0.043)
0.160** (0.046) --- --- ---
Player went to arbitration --- --- --- 0.101**
(0.028) 0.100** (0.028)
0.110** (0.030)
Years played, year, and team effects Yes Yes Yes Yes Yes Yes
Lagged performance No Yes Yes No Yes Yes
Team×year effects No No Yes No No Yes
Notes: Each entry contains the estimated coefficient and robust standard error (in parentheses) from a regression model with (except where specified) dependent variable equal to 1 if the player is not with the arbitration team at the end of the season. Each model contains the same control variables as the corresponding column in Table 7.
Statistically significant at the * 0.05 or ** 0.01 level.
39
Table 7: Dispute Intensity Results: Performance
Allowing for Differential Win/Lose Arb. Effects
Pooling Arbitration Winners and Losers
(1) (2) (3) (4) (5) (6)
Player lost arbitration -0.195 (0.104)
-0.160 (0.103)
-0.127 (0.228)
--- --- ---
Player won arbitration -0.002 (0.096)
0.009 (0.095)
0.145 (0.215)
--- --- ---
Player went to arbitration --- --- --- -0.116 (0.074)
-0.090 (0.074)
-0.013 (0.167)
Salary disagreement (difference in exchanged offers as fraction of average offer)
--- -0.812** (0.228)
-0.769** (0.278)
--- -0.827** (0.228)
-0.773** (0.278)
Salary disagreement × Player lost arbitration
--- --- -0.095 (0.537)
--- --- ---
Salary disagreement × Player won arbitration
--- --- -0.406 (0.601)
--- --- ---
Salary disagreement × Player went to arbitration
--- --- --- --- --- -0.222 (0.439)
Baseline control variables including lagged performance
Yes Yes Yes Yes Yes Yes
Years played, year, and team effects
Yes Yes Yes Yes Yes Yes
Adjusted R2 0.144 0.151 0.150 0.144 0.151 0.150
Notes: Each entry contains the estimated coefficient and robust standard error (in parentheses) from a regression model with dependent variable season-long earned run average (weighted across multiple stints where appropriate). Sample size is 1,423. Statistically significant at the * 0.05 or ** 0.01 level.
40
Table 8: Dispute Intensity Results: Relationship Breakup
Allowing for Differential Win/Lose Arb. Effects
Pooling Arbitration Winners and Losers
(1) (2) (3) (4) (5) (6)
Player lost arbitration 0.071* (0.034)
0.069* (0.033)
0.010 (0.083)
--- --- ---
Player won arbitration 0.147** (0.044)
0.147** (0.044)
0.195 (0.113)
--- --- ---
Player went to arbitration --- --- --- 0.102** (0.029)
0.101** (0.029)
0.080 (0.070)
Salary disagreement (difference in exchanged offers as fraction of average offer)
--- 0.044 (0.072)
0.024 (0.077)
--- 0.038 (0.072)
0.023 (0.077)
Salary disagreement × Player lost arbitration
--- --- 0.164 (0.221)
--- --- ---
Salary disagreement × Player won arbitration
--- --- -0.145 (0.301)
--- --- ---
Salary disagreement × Player went to arbitration
--- --- --- --- --- 0.061 (0.187)
Baseline control variables including lagged performance
Yes Yes Yes Yes Yes Yes
Years played, year, and team effects
Yes Yes Yes Yes Yes Yes
Adjusted R2 0.059 0.058 0.058 0.057 0.057 0.056
Notes: Each entry contains the estimated coefficient and robust standard error (in parentheses) from a regression model with dependent variable equal to 1 if the player is not with the arbitration team at the end of the season. Sample size is 1,423. Statistically significant at the * 0.05 or ** 0.01 level.
41
Table 9: Margin of Victory Results
Player Performance Relationship Break-Up
(1) (2) (3) (4)
Player lost arbitration -0.029 (0.111)
-0.028 (0.564)
0.065 (0.035)
0.243 (0.233)
Player won arbitration -0.181 (0.104)
-0.181 (0.106)
0.154** (0.046)
0.290 (0.283)
Salary settlement as a fraction of player’s final offer
1.169** (0.295)
1.169** (0.330)
-0.044 (0.098)
-0.010 (0.104)
Salary settlement as a fraction of player’s final offer × Player lost arbitration
--- -0.001 (0.775)
--- -0.247 (0.319)
Salary settlement as a fraction of club’s final offer
--- --- -0.0005 (0.056)
0.004 (0.058)
Salary settlement as a fraction of club’s final offer × Player won arbitration
--- --- --- -0.101 (0.195)
Baseline control variables including lagged performance
Yes Yes Yes Yes
Years played, year, and team effects
Yes Yes Yes Yes
Adjusted R2 0.153 0.153 0.058 0.057
Notes: Each entry contains the estimated coefficient and robust standard error (in parentheses) from a regression model with dependent variable season-long standardized performance (columns 1 and 2) or dependent variable equal to 1 if the player is not with the arbitration team at the end of the season (columns 3 and 4). Sample size is 1,423. Statistically significant at the * 0.05 or ** 0.01 level.