Consumer Choice and Utility Maximization 1. The Law of Diminishing “ADDITIONAL” “SATISFACTION” 2.

March 2, 2006 11:21 Proceedings Trim Size: 9in x 6in GECON06
ARE UTILITY, PRICE, AND SATISFACTION RESOURCEALLOCATION MODELS SUITABLE FOR LARGE-SCALE
DISTRIBUTED SYSTEMS?
XIN BAI, LADISLAU BOLONI, AND DAN C. MARINESCU
School of Electrical Engineering and Computer ScienceUniversity of Central Florida
Orlando, FL 32816-2362, USAEmail: (xbai, lboloni, dcm)@cs.ucf.edu
HOWARD JAY SIEGEL
Department of Electrical and Computer Engineeringand Department of Computer Science
Colorado State UniversityFort Collins, CO 80523-1373, USA
Email: [email protected]
ROSE A. DALEY AND I-JENG WANG
Applied Physics LaboratoryJohns Hopkins University
11100 Johns Hopkins Road Laurel, MD 20723-6099, USAEmail: (Rose.Daley, I-Jeng.Wang)@jhuapl.edu
Computational, data, and service grids, peer to peer systems, and wireless com-munication systems are examples of open systems where the distinction betweenproviders and consumers of resources is blurred. Individual members of the commu-nity contribute computing cycles, storage, services, and communication bandwidthto the pool of resources available to the entire community. While the popularityof such systems increases, their resource management models seldom take into ac-count the utility for the consumers of the resources, and the incentives to provideresources. In this paper, we discuss a resource allocation model that takes intoaccount the utility of the resources for the consumers and the pricing structureimposed by the providers. We show how a satisfaction function can express thepreferences of the consumer both regarding the utility and the price of the re-sources. In our model, the brokers are mediating among the selfish interests of theconsumers and the providers, and societal interests, such as efficient resource uti-lization in the system. We report on a simulation experiment to study the behaviorof the system in steady state and in transient state.
1

March 2, 2006 11:21 Proceedings Trim Size: 9in x 6in GECON06
2
1. Introduction and Motivation
In many social and man-made systems, scarce resources have to be sharedamong a large population of consumers. To study possible resource man-agement policies, we have to develop resource consumption models thattake into account different, possibly contradictory, views of the benefitsassociated with resource consumption as well as the rewards for provid-ing resources to the consumer population. Such models tend to be verycomplex and only seldom amenable to analytical solutions.
Computational, service, and data grids, peer-to-peer systems, and ad-hoc wireless networks are examples of open systems where the distinctionbetween resource providers and consumers is blurred. Individual mem-bers of the community contribute computing cycles, storage, services, andcommunication bandwidth to the pool of resources available to the entirecommunity. The same individual could be both a provider and consumer ofresources: a provider in some instances and/or for some types of resources,or a consumer in other instances and/or for different types of resources. Anefficient and fair utilization of the resources can be obtained only througha scheme that gives incentives to the providers to share their resources andthat encourages the consumers to maximize the utility of the received re-sources. A well-tested model for such a scheme is based on an economicmodel, in which the resources need to be paid for in a real or virtual cur-rency. This model has the advantage of being provably scalable, and wecan successfully reuse or adapt the models that govern the economy in oursociety.
Economic models are attractive for resource providers, beneficial forthe consumers of resources, and have societal benefits. Indeed, providersbenefit from contributing their resources and are encouraged to re-investsome of their profits into additional resources. Consumers enjoy fair treat-ment as the resource allocation is governed by rules that do not depend onthe individual consumer. Moreover, providers and consumers have a sayin the market and can make their own decisions to maximize their utilityand/or profits. When system-centric scheduling policies are replaced byconsumer-centric policies the system becomes more responsive to consumerneeds and important problems are solved with higher priority. Economicmodels allow resource allocation and management to be more efficient, thedemand and supply is regulated through economic activities and fewer re-sources are wasted, and excess capacity and overloading are averaged overa very large number of providers and consumers. Resources, e.g., CPU

March 2, 2006 11:21 Proceedings Trim Size: 9in x 6in GECON06
3
cycles, main memory, secondary storage, and network bandwidth/latency,are treated uniformly and this can facilitate the design of large-scale dis-tributed systems, such as computational grids. The system is more scalableand decision-making is distributed.
In an economic model, all the participants are considered self-interested.The resource providers are trying to maximize their revenues. The con-sumers want to obtain the maximum possible resources for the minimumpossible price. The large number of participants makes one-to-one negoti-ations expensive and unproductive.
It is desirable to have a middleman, a broker, mediate access to sys-tem resources and consider multiple objectives. The role of a broker isto reconcile the selfish objectives of individual resource providers and con-sumers with some global, societal objectives, e.g., to maximize the resourceutilization of the system.
Several projects proposed approaches based on economic models. Radiobandwidth management for wireless and mobile systems takes advantageof utility and price concepts 2. The models used to study the benefits anddrawbacks of different bandwidth allocation schemes take into account theindividual consumer utility as well as pricing structures.
Several systems, including Enhanced MOSIX 1, Nimrod/G 5,Rexec/Anemone 7, Condor 8, Mungi 9, Mariposa 10, Mojo Nation 11, Pop-corn 12, SETI@home 13, and Spawn 16, use market-based models for tradingcomputational resources 6. The efficiency of resource allocation under twodifferent market schemes, commodities markets and auctions are discussedin 17 and 18. These papers define concepts such as price stability, marketequilibrium, consumer efficiency, and producer efficiency and show that thecommodities markets are better choices for controlling grid resources thanauction strategies. In this paper, we discuss a resource allocation modelthat takes into account the utility of the resources for the consumers andthe pricing structure imposed by the providers. We show how a satisfac-tion function can express the preferences of the consumer both regardingthe utility and the price of the resources. In our model, the brokers aremediating among the selfish interests of the consumers and the providers,and societal interests, such as efficient resource utilization in the system.We report on a simulation experiment to study the behavior of the systemin steady state and in transient state. In 3 we use a simpler model basedupon a synthetic quantity to represent resource vectors and in 4 we expandthe model for a network of resource managers with a tree topology.
This paper is organized as follows. In Section 2, we introduce utility-

March 2, 2006 11:21 Proceedings Trim Size: 9in x 6in GECON06
4
price based models for resource allocation in large-scale distributed systems,and in Section 3 present a simulation study for evaluation of such models.
2. Utility, Price, and Satisfaction Functions
We propose to use: (i) a utility function, 0 ≤ u(r) ≤ 1, to represent theutility provided to an individual consumer, where r represents the amountof allocated resources; (ii) a price function, p(r), imposed by a resourceprovider, and (iii) a satisfaction function, s(u(r), p(r)), 0 ≤ s ≤ 1, to quan-tify the level of satisfaction; the consumer satisfaction depends on both theprovided utility and the paid price.
The utility function should be an non-decreasing function of r, i.e., weassume that the more resources are allocated to the consumer, the higherthe consumer utility is. However, when enough resources have been al-located to the consumer, i.e., some threshold is reached, an increase ofallocated resources would bring no improvement on the utility. For exam-ple, if a parallel application could use at most 100 nodes of a cluster, itsutility reflected by a utility function does not increase if its allocation in-creases from 100 to 110 nodes. The above requirements are reflected by thefollowing equations:
du(r)dr
≥ 0, limr→∞
du(r)dr
= 0 (1)
Sigmoid functions follow Equation (1) and are often used to model util-ity. A sigmoid is a tilted S-shaped curve that could be used to represent thelife-cycles of living, as well as man-made, social, or economical systems. Ithas three distinct phases: an incipient or starting phase, a maturing phase,and a declining or aging phase, as shown in Figure 1.
In the context of resource allocation, a sigmoid quantifies the utilityprovided to an individual when the amount of resources allocated to theconsumer increases. We expect the utility to be a concave function andreaches saturation as the consumer gets all the resources it can use effec-tively. The utility function could be a sigmoid
u(r) =(r/ω)ζ
1 + (r/ω)ζ
where ζ and ω are constants provided by the consumer, ζ ≥ 2, and ω > 0.Clearly, 0 ≤ u(r) < 1 and u(ω) = 1/2.
The price could be a linear function of the amount of resources:
p(r) = ξ · r

March 2, 2006 11:21 Proceedings Trim Size: 9in x 6in GECON06
5
0
1
r
u
StartingPhase
MaturingPhase
AgingPhase
Figure 1. A sigmoid includes three phases: the starting phase, the maturing phase, andthe aging phase. Normally consumers do not want the amount of allocated resource tobe at the starting phase because the utility is too low; they also do not want the amountof allocated resource to be at the aging phase because they can get a little lower utilitywhile saving a large amount of resources.
where ξ is the unit price. The unit price of the resources can be set byconvention to a constant, or it can vary based on supply and demand. Thevariable unit price ξ might be (a) subject to a peer-to-peer negotiationbetween the consumer and the provider, (b) set in a centralized way similarto a commodity exchange, requiring global information about the supplyand demand, or (c) determined by local estimate of the supply and demand.For example, based on the ratio of the allocated resources to the totalresources of the provider, a function could give a lower price for the lowratio and a higher price for the high ratio.
A consumer satisfaction function takes into account both the utilityprovided and the price paid. For a given utility, the satisfaction func-tion should increase when the price decreases and, for a given price, thesatisfaction function should increase when the utility u increases. Theserequirements are reflected in Equation (2).
∂s
∂p≤ 0,
∂s
∂u≥ 0 (2)
Furthermore, a normalized satisfaction function should satisfy the fol-lowing conditions:
• the degree of satisfaction, s(u(r), p(r)), for a given price p(r), ap-proaches the minimum, 0, when the utility, u(r), approaches 0;
• the degree of satisfaction, s(u(r), p(r)), for a given price p(r), ap-proaches the maximum, 1, when the utility, u(r), approaches infin-ity;

March 2, 2006 11:21 Proceedings Trim Size: 9in x 6in GECON06
6
• the degree of satisfaction, s(u(r), p(r)), for a given utility u(r),approaches the maximum, 1, when the price, p(r), approaches 0;and
• the degree of satisfaction, s(u(r), p(r)), for a given utility u(r), ap-proaches the minimum, 0, when the price, p(r), approaches infinity.
These requirements are reflected by Equation (3) and (4).
∀p > 0, limu→0
s(u, p) = 0, limu→∞
s(u, p) = 1 (3)
∀u > 0, limp→0
s(u, p) = 1, limp→∞
s(u, p) = 0 (4)
A candidate satisfaction function that conforms to the Equation (2),(3), and (4) could be:
s(u, p) = 1− e−κ·uµ·p−ε
(5)
where µ and ε control the sensitivity of s to utility and price, and κ =− log α, with α a reference value for the satisfaction function. Similar func-tions are widely used in the field of microeconomics 15. A typical shapeof the satisfaction function for a sigmoid utility function and a linear pricefunction is shown in Figure 2. Satisfaction decreases after a peak valuebecause continuing to pay more as resources increase after that point doesnot increase utilization.
0.0
1.0
r
s
Low Unit PriceMedium Unit Price
High Unit Price
Figure 2. The satisfaction function of the amount of resources r for a sigmoid utilityfunction and linear price functions, 0 ≤ s ≤ 1. For the same amount of resources, thehigher is the price, the lower is the satisfaction.

March 2, 2006 11:21 Proceedings Trim Size: 9in x 6in GECON06
7
Consider a system with n providers offering computing resources and m
consumers. For the sake of simplifying the model, we assume that the twosets are disjoint. Call U the set of consumers and R the set of providers.The n providers are labeled 1 to n and the m consumers are labeled 1 tom. Consider provider Rj , 1 ≤ j ≤ n, and consumer Ui, 1 ≤ i ≤ m, thatcould potentially use resources of that provider.
Let rij denote the resource of Rj allocated to consumer Ui and let uij
denote its utility for consumer Ui. Let pij denote the price paid by Ui toprovider Rj . Let tij denote the time Ui uses the resource provided by Rj .Let cj denote the resource capacity of Rj .
The term “resource” here means a vector with components indicatingthe actual amount of each type of resource:
rij = (r1ij r2
ij . . . rlij)
where l is a positive integer and rkij corresponds to the amount of resource of
the k-th type. The structure of rij may reflect the rate of CPU cycles, thephysical memory required by the application, the secondary storage, thenumber of nodes and the interconnection bandwidth (for a multiprocessorsystem or a cluster), the network bandwidth (required to transfer datato/from the site), the graphics capabilities, and so on.
The utility of resource of the k-th type provided by Rj for consumer Ui
is a sigmoid:
ukij = u(rk
ij) =(rk
ij/ωki )ζk
i
1 + (rkij/ωk
i )ζki
where ζki and ωk
i are constants provided by consumer Ui, ζki ≥ 2, and
ωki > 0. Clearly, 0 < u(rk
ij) < 1 and u(ωki ) = 1/2.
The overall utility of resources provided by Rj to Ui could be definedas:
• the product over the set of resources provided by Rj , i.e., uij =∏lk=1 uk
ij , or• the weighted average over the set of resources provided by Rj , i.e.,
uij = 1l
∑lk=1 ak
ijukij , where ak
ij values are provided by consumerUi.
We consider a linear pricing scheme pkij = ξk
j · rkij , though more sophis-
ticated pricing structures are possible. Here ξkj represents the unit price
for resource of type k provided by provider Rj . The amount consumer Ui
March 2, 2006 11:21 Proceedings Trim Size: 9in x 6in GECON06
8
pays to provider Rj for a resource of type k is pkij × tij . The total cost for
consumer Ui for resources provided by provider Rj is
pij =l∑
k=1
pkij × tij
Based on Equation 5, we define the degree of satisfaction of Ui for aresource of the k-th type provided by provider Rj as
skij(u
kij , p
kij) = 1− e−κk
i ukij
µki (pk
ij/φki )−εk
i, κk
i , φki , µk
i , εki > 0
where µki and εk
i control the sensitivity of skij to utility and price; φk
i andκk
i are normalization constants; φki is a reference price; and κk
i = − log α,with α a reference value for the satisfaction function. Additional detailsregarding these parameters can be found in Section 3.
The overall satisfaction of consumer Ui for resources provided by Rj
could be defined as:
• the product over the set of resources provided by Rj , i.e., sij =∏lk=1 sk
ij , or• the weighted average over the set of resources provided by Rj , i.e.,
sij = 1l
∑lk=1 bk
ijskij , where bk
ij values are provided by consumer Ui.
The role of a broker is to mitigate access to resources. In this paper, weconsider a provider-broker-consumer model that involves the set of resourceproviders R, the set of consumers U , and broker B. This model assumesthat a consumer must get all of its resources from a single provider. Bro-kers have “societal goals” and attempt to maximize the average utility andrevenue, as opposed to providers and consumers that have individualisticgoals; each provider wishes to maximize its revenue, while each consumerwishes to maximize its utility and do so for as little cost as possible. Toreconcile the requirements of a consumer and the candidate providers, abroker chooses a subset of providers such that the satisfaction is above ahigh water mark and all providers in the subset have equal chances to bechosen by the consumer. We call the size of this subset satisficing size,where the word “satisfice” was coined by Nobel Prize winner Herbert Si-mon in 1957 to describe a behavior of attempting to achieve at least someminimum level of a particular variable instead of striving to achieve itsmaximum possible value 14. We denote the satisficing size as σ.
The resource negotiation protocol consists of the following steps (Figure3):

March 2, 2006 11:21 Proceedings Trim Size: 9in x 6in GECON06
9
(1) All providers reveal their capacity and pricing parameters to thebroker: ∀Rj ∈ R send vectors cj and ξj where each element corre-sponds to one type of resource.
(2) A consumer Ui sends to the broker:
(a) the parameters of its utility function: vectors ζi and ωi whereeach element corresponds to one type of resource,
(b) the parameters of its satisfaction function: vectors µi, εi,κi and φi where each element corresponds to one type ofresource, and
(c) the number of candidate resource providers to be returned.
(3) The broker performs a matchmaking algorithm and returns a list ofcandidate resource providers Ri to consumer Ui.
(4) Consumer Ui selects the first provider from Ri and verifies if theprovider can allocate the required resources. If it can not, the con-sumer moves to the next provider from the list until the resourcesare allocated by a provider Rj .
(5) Rj notifies the broker about the resource allocation to Ui.
1. Advertise resource capacity
and pricing parameters
2. Send the utility function parameter,
the satisfaction function parameter, and the number of resource providers
to be returned
3. Return a set of ordered resource
providers
4. Claim resources
5. Notify resource allocation
Figure 3. The brokering process: 1) Providers send to the broker their resource capacityand pricing parameters; 2) A consumer sends to the broker a request; 3) The brokerexecutes a brokering algorithm and returns to the consumer a list of resource providers;4) The consumer selects the first provider from the returned list and confirms that it cansatisfy the resource requirements; if it can not, chooses the next provider, until one ofthe providers allocates the needed resources. 5) If a resource provider allocates resourcesto the consumer, it notifies the broker about this allocation.
The algorithm performed by the broker is summarized in Figure 4. Theamount of resources to be allocated is determined during the algorithm ac-cording to a broker strategy. Simple strategies would be to allocate the sameamount of resources to every consumer, or to allocate to every consumer

March 2, 2006 11:21 Proceedings Trim Size: 9in x 6in GECON06
10
a random amount of resources. A better strategy, used by our system, isto allocate an amount of resources such that the utility of each type of re-source to the consumer reaches a certain target utility τ . To determine theamount of resources allocated to the consumer, the broker uses Equation6(a) derived from the definition of u(r), Equation 6(b):
r = eln( τ
1−τ)
ζ +ln(ω) (a) u(r) =(r/ω)ζ
1 + (r/ω)ζ(b) (6)
BROKERING ALGORITHMINPUT request req, , , a finite set of resource providers psOUTPUT a finite set of suggested resource providers ssBEGIN
determine amountso that req.u(amount) = FOR each resource provider rp in ps
r = min (amount,available resources of rp)satisfaction= req.s (req.u(r), rp.p(r))
END FOR sort elements in ps according to their satisfactions randomize the sequences of the first items in ps keep the elements in ps that have the highest req.cardinalitysatisfaction degrees and remove the rest
ss = psEND
Figure 4. The brokering algorithm performed by the broker. req contains a utilityfunction u, a satisfaction function s, and a cardinality that specifies the number ofresource providers to be returned by the broker. τ is the target utility. σ is the satisficingsize.
Several quantities are used in the next section to characterize the re-source management policy for broker B and its associated providers andconsumers:
(a) The average hourly revenue for providers. The revenue is the sum ofrevenues for all of its resource types. This average is over the set of allproviders connected to broker B.
(b) The consumer admission ratio. This ratio is the number of admittedconsumers over the number of all consumers connected to B. A consumer isadmitted into the system when there is a provider able to allocate resources,otherwise the consumer is dropped.
(c) The average consumer overall utility. This average is over the set of alladmitted consumers connected to broker B.

March 2, 2006 11:21 Proceedings Trim Size: 9in x 6in GECON06
11
(d) The average consumer overall satisfaction. This average is over the setof all admitted consumers connected to broker B.
3. A Simulation Study
To evaluate the model presented in Section 2, we present the results ofa simulation study of the provider-broker-consumer model, conducted inthe YAES simulation environment 19. The model used for simulation isrelatively complex and requires a fair number of choices for the distributionand the range of several random variables.
The behavior of the model is determined by two parameters, τ and σ,chosen by the controlling authority, in our case the broker. σ = 1 meansthat the consumer accepts only the best match; when σ > 1, all providersin the subset chosen by the broker based on a high water mark have anequal chance to be selected.
We compare the system performance of our scheme for several σ valueswith a random strategy where we randomly choose a provider from the setof all providers, without considering the satisfaction function.
Recall the resource types allocated by provider Rj to consumer Ui aredenoted as a resource vector rij = (r1
ij r2ij . . . rl
ij). For example, if thek-th component is secondary storage, then rk
ij = 20GB is the amount ofsecondary storage provided by Rj to consumer Ui. The associated utilityvector is uij = (u1
ij u2ij . . . ul
ij) and the associated satisfaction vector sij =(s1
ij s2ij . . . sl
ij).The demand-capacity ratio for a resource type k is the ratio of the
amount of resources requested by the consumers to the total capacity ofresource providers for resource type k,
∑j ck
j . The level of demand is prac-tically limited by the sigmoid shape of the utility curve and the finite finan-cial resources of the consumers. In our model, the consumers do not providethe precise amount of resources needed, they only specify their utility func-tion. In the computation of the demand-capacity ratio, for each consumerand each resource, it is assumed that for the requested rij value the corre-sponding uij value is 0.9. The demand-capacity ratio vector for all resourcetypes is ηj = (η1
j η2j . . . ηl
j). To simplify the interpretation of the results ofour simulation we only consider the case when η1
j = η2j = · · · = ηl
j = η.We simulate a system of 100 clusters and one broker. The number of
nodes of these clusters is a random variable normally distributed with themean of 50 and the standard deviation of 30. Each node is characterized bya resource vector containing the CPU rate, the amount of main memory,

March 2, 2006 11:21 Proceedings Trim Size: 9in x 6in GECON06
12
and the disk capacity. For example, the resource vector for a node with one2 GHz CPU, 1 GB of memory, and a 40 GB disk is (2GHz, 1GB, 40GB).Initially, there is no consumer in the system. Consumers arrive with aninter-arrival time exponentially distributed with the mean of 2 seconds. Theservice time tij is exponentially distributed with the mean of λ seconds. Byvarying the λ value we modify demand-capacity ratio so that we can studythe behavior of the system under different loads.
The parameters of the utility function of consumers, i.e., ukij , are uni-
formly distributed in the intervals shown in Table 1. The CPU rate, mem-ory space, and disk space of a request, rk
ij , are exponentially distributedwith the mean of 2GHz, 4GB, and 80GB, and in the range of [0.1GHz,100GHz], [0.1GB, 200GB], and [0.1GB, 1000GB], respectively.
Table 1. The parameters for the simulation are uni-formly distributed in the intervals displayed in this table.
Parameter CPU Memory Disk
ξ [5, 10] [5, 10] [5, 10]ω [0.4, 0.9] [0.5, 1.5] [10, 30]κ [0.02, 0.04] [0.02, 0.04] [0.02, 0.04]µ [2, 4] [2, 4] [2, 4]ε [2, 4] [2, 4] [2, 4]φ [40, 60] [80, 120] [1800, 2200]
A consumer request specifies only the parameters of the utility function,ω and ζ, for each element of the resource vector (CPU, Memory, Disk).More precisely, for each element: (a) we generate the amount rij ; (b) wechoose a value for ω; (c) set u = 0.9 and compute the corresponding valueof ζ.
We investigate the performance of the model under various scenarios ofdemand-capacity ratio, for different target utility and satisficing size. Westudy the evolution in time and assume that the system reaches steady-state after of a transient period of the first 104 seconds. When we studythe effect of τ , we use σ = 1, and when we study the effect of σ, we useτ = 0.9. In each case, we run the simulation 50 times and show the averagevalue and a 95% confidence interval.
We report the average hourly revenue, the consumer admission ratio, theaverage consumer satisfaction, and the average consumer utility collectedover the most recent one hour interval:
(a) As function of time for several levels of target utility, τ , Figures 5, 6, 7,
March 2, 2006 11:21 Proceedings Trim Size: 9in x 6in GECON06
13
and 8. We choose λ so that the demand-capacity ratio is 1.0.
(b) As function of time for several levels of satisficing size, σ, Figure 9,10, and 11. We choose λ so that the demand-capacity ratio is 0.5. Thesystem is capable of handling all consumer requests for all values of σ andthe consumer admission ratio is approximately 1.0 for all cases.
(c) As function of time for several levels of demand-capacity ratio, η, Fig-ures 12 and 13.
For a multi-dimensional resource, we let the overall utility be the prod-uct of the utility of all types of resource, and we let the overall satisfactionbe the product of the satisfaction of all types of resource.
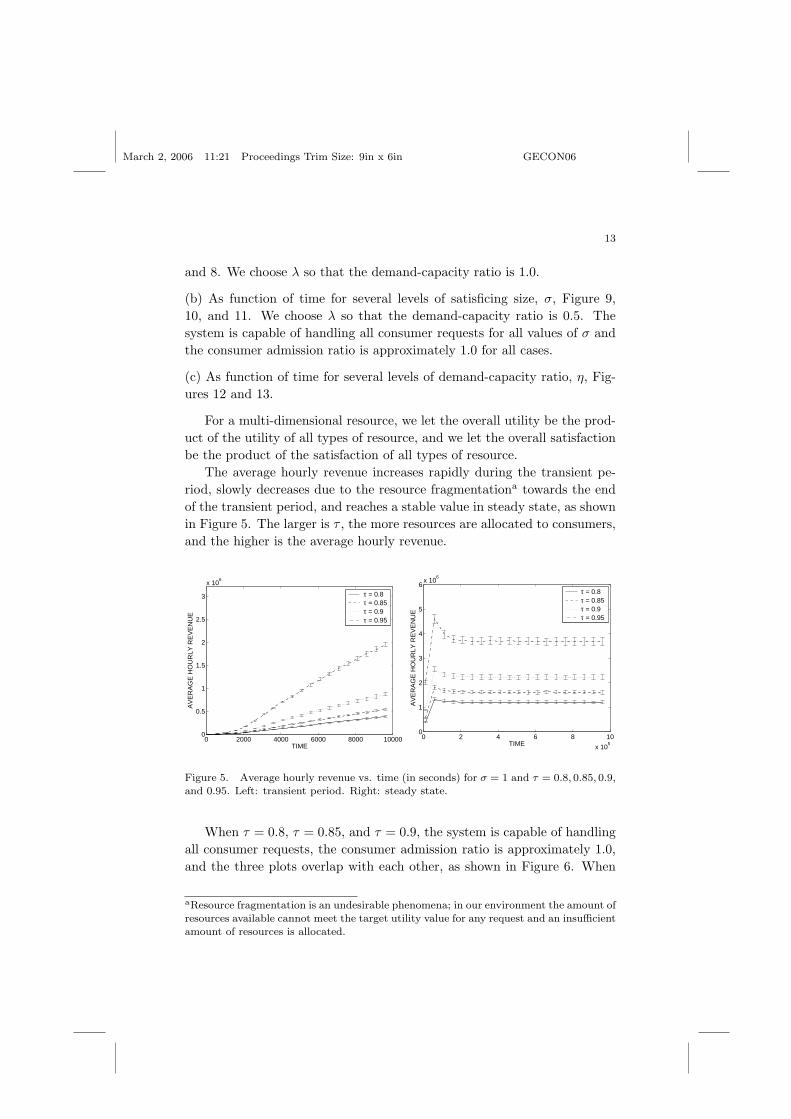
The average hourly revenue increases rapidly during the transient pe-riod, slowly decreases due to the resource fragmentationa towards the endof the transient period, and reaches a stable value in steady state, as shownin Figure 5. The larger is τ , the more resources are allocated to consumers,and the higher is the average hourly revenue.
0 2000 4000 6000 8000 100000
0.5
1
1.5
2
2.5
3
x 106
TIME
AV
ER
AG
E H
OU
RLY
RE
VE
NU
E
τ = 0.8τ = 0.85τ = 0.9τ = 0.95
0 2 4 6 8 10
x 105
0
1
2
3
4
5
6x 10
6
TIME
AV
ER
AG
E H
OU
RLY
RE
VE
NU
E
τ = 0.8τ = 0.85τ = 0.9τ = 0.95
Figure 5. Average hourly revenue vs. time (in seconds) for σ = 1 and τ = 0.8, 0.85, 0.9,and 0.95. Left: transient period. Right: steady state.
When τ = 0.8, τ = 0.85, and τ = 0.9, the system is capable of handlingall consumer requests, the consumer admission ratio is approximately 1.0,and the three plots overlap with each other, as shown in Figure 6. When
aResource fragmentation is an undesirable phenomena; in our environment the amount ofresources available cannot meet the target utility value for any request and an insufficientamount of resources is allocated.

March 2, 2006 11:21 Proceedings Trim Size: 9in x 6in GECON06
14
τ = 0.95, during the transient period some consumer requests are dropped.As time goes on, the consumer admission ratio slowly increases. Moreconsumers can be admitted into the system due to the fragmentation of theresources because the system is no longer capable of ensuring the requiredlevels for τ = 0.95 and allocates lower amounts of resources. The resourcefragmentation effect is noticeable in other graphs as well. In steady statethe admission ratio is 1.
0 2000 4000 6000 8000 100000.96
0.97
0.98
0.99
1
1.01
1.02
1.03
TIME
CO
NS
UM
ER
AD
MIS
SIO
N R
AT
IO
τ = 0.8τ = 0.85τ = 0.9τ = 0.95
0 2 4 6 8 10
x 105
0.97
0.975
0.98
0.985
0.99
0.995
1
1.005
1.01
1.015
1.02
TIME
CO
NS
UM
ER
AD
MIS
SIO
N R
AT
IOτ = 0.8τ = 0.85τ = 0.9τ = 0.95
Figure 6. Consumer admission ratio vs. time (in seconds) for σ = 1 and τ =0.8, 0.85, 0.9, and 0.95. Left: transient period. Right: steady state.
The average consumer satisfaction decreases slowly during the tran-sient period and then increases and reaches a stable value in steady state,as shown in Figure 7. The average consumer satisfaction is higher whenτ is smaller; the smaller is τ , the more consumers can be admitted by re-source providers with cheaper prices and these consumers experience highersatisfaction.
The average consumer utility decreases slowly during the transient pe-riod because of the resource fragmentation; some resources are allocatedto consumers due to their cheaper price although they are not enough toallow the utility to reach the specified τ value, as shown in Figure 8. Theaverage utility reaches a stable value during the steady state. The averageconsumer utility is lower when τ is smaller.
Figure 9 shows that the average hourly revenue increases rapidly duringthe transient period. It decreases slowly due to resource fragmentation afterthe transient period and leads to a stable value in steady state. A smallvalue of σ limits the number of choices the broker has and this restrictionleads to lower average hourly revenues. The larger is σ, the higher is the

March 2, 2006 11:21 Proceedings Trim Size: 9in x 6in GECON06
15
0 2000 4000 6000 8000 100000
0.5
1
1.5
TIME
AV
ER
AG
E C
ON
SU
ME
R S
AT
ISF
AC
TIO
N
τ = 0.8τ = 0.85τ = 0.9τ = 0.95
0 2 4 6 8 10
x 105
0.2
0.4
0.6
0.8
1
1.2
TIME
AV
ER
AG
E C
ON
SU
ME
R S
AT
ISF
AC
TIO
N
τ = 0.8τ = 0.85τ = 0.9τ = 0.95
Figure 7. Average consumer satisfaction vs. time (in seconds) for σ = 1 and τ =0.8, 0.85, 0.9, and 0.95. Left: transient period. Right: steady state.
0 2000 4000 6000 8000 100000.75
0.8
0.85
0.9
0.95
1
1.05
TIME
AV
ER
AG
E C
ON
SU
ME
R U
TIL
ITY
τ = 0.8τ = 0.85τ = 0.9τ = 0.95
0 2 4 6 8 10
x 105
0.65
0.7
0.75
0.8
0.85
0.9
0.95
1
TIME
AV
ER
AG
E C
ON
SU
ME
R U
TIL
ITY
τ = 0.8τ = 0.85τ = 0.9τ = 0.95
Figure 8. Average consumer utility vs. time (in seconds) for σ = 1 and τ = 0.8, 0.85, 0.9,and 0.95. Left: transient period. Right: steady state.
average hourly provider revenue. The random strategy, which correspondsto the maximum value of σ =| R | has the highest average hourly providerrevenue. As we shall see shortly the random strategy leads to the lowestconsumer satisfaction.
We notice from Figure 10 that the average consumer satisfaction de-creases slowly during the transient period and then increases and leads toa stable value in steady state. The average consumer satisfaction is higherwhen σ is smaller. Indeed, when σ = 1 we direct the consumer to that re-source provider that best matches the request. When we select at randomone provider from the set of all providers we observe the lowest average con-sumer satisfaction. Indeed, when we resort to a random strategy we havea high probability to select a less than optimal match for a given request.

March 2, 2006 11:21 Proceedings Trim Size: 9in x 6in GECON06
16
0 2000 4000 6000 8000 100000
0.5
1
1.5
2
2.5x 10
6
TIME
AV
ER
AG
E H
OU
RLY
RE
VE
NU
E
σ = 1σ = 10σ = 20RANDOM
0 2 4 6 8 10
x 105
0
1
2
3
4
5
6
7
8
9
10
11x 10
6
TIME
AV
ER
AG
E H
OU
RLY
RE
VE
NU
E
σ = 1σ = 10σ = 20RANDOM
Figure 9. Average hourly revenue vs. time (in seconds) for τ = 0.9 and σ = 1, 10, 20,and 50. For the random strategy, σ =| R |= 50. Left: transient period. Right: steadystate.
The optimal match is the top ranked element of the candidate resourceprovider list.
0 2000 4000 6000 8000 100000.2
0.3
0.4
0.5
0.6
0.7
0.8
0.9
1
TIME
AV
ER
AG
E C
ON
SU
ME
R S
AT
ISF
AC
TIO
N
σ = 1σ = 10σ = 20RANDOM
0 2 4 6 8 10
x 105
0.1
0.2
0.3
0.4
0.5
0.6
0.7
0.8
0.9
1
1.1
TIME
AV
ER
AG
E C
ON
SU
ME
R S
AT
ISF
AC
TIO
N σ = 1σ = 10σ = 20RANDOM
Figure 10. Average consumer satisfaction vs. time (in seconds) for τ = 0.9 and σ =1, 10, 20, and 50. For the random strategy, σ =| R |= 50. Left: transient period. Right:steady state.
Figure 11 shows that the average consumer utility drops slowly duringthe transient period because of system fragmentation; some resources areallocated to consumers due to their cheaper price, although they are notenough to allow the utility to reach the target value, τ . In steady state theaverage utility reaches a stable value. The average consumer utility is lowerwhen σ is smaller. The random strategy has the highest average consumer

March 2, 2006 11:21 Proceedings Trim Size: 9in x 6in GECON06
17
utility; when σ is large consumers have a better chance to get resourcesaccording to the τ values.
0 2000 4000 6000 8000 100000.85
0.86
0.87
0.88
0.89
0.9
0.91
0.92
TIME
AV
ER
AG
E C
ON
SU
ME
R U
TIL
ITY
σ = 1σ = 10σ = 20RANDOM
0 2 4 6 8 10
x 105
0.7
0.75
0.8
0.85
0.9
0.95
1
TIME
AV
ER
AG
E C
ON
SU
ME
R U
TIL
ITY
σ = 1σ = 10σ = 20RANDOM
Figure 11. Average consumer utility vs. time (in seconds) for τ = 0.9 and σ = 1, 10, 20,and 50. For the random strategy, σ =| R |= 50. Left: transient period. Right: steadystate.
Figure 12 (Left) shows that the average hourly revenue at first increasesrapidly during the transient period. It decreases slowly due to resourcefragmentation after some 105 seconds, at the beginning of the steady-stateperiod, and then it reaches a steady value. The larger is η, the higher is theaverage hourly revenue. Figure 12 (Right) shows that when η is set to 0.25,0.50, or 0.75, the system is capable of handling all requests and the corre-sponding plots overlap with each other. When η = 1.0 some requests aredropped. As time goes on, the consumer admission ratio slowly increasesdue to resource fragmentation. During the steady state the consumer ad-mission ratio is 1.
The average consumer satisfaction drops during the transient period,then increases, and converges to a steady value, as shown in Figure 13(Left). The smaller is η, the earlier the system reaches the steady stateand the higher is the average consumer satisfaction. The average consumerutility drops during the transient period and reaches a steady value, asshown in Figure 13 (Right). The smaller is η, the earlier the system reachesthe steady state and the higher is the average consumer utility.
4. Conclusions and Future Work
Economic models have significant advantages over other models of resourcesharing among a large user population. Scalability, fairness, distributed-

March 2, 2006 11:21 Proceedings Trim Size: 9in x 6in GECON06
18
0 2 4 6 8 10
x 105
0
2
4
6
8
10
12x 10
6
TIME
AV
ER
AG
E H
OU
RLY
RE
VE
NU
E
η = 0.25η = 0.50η = 0.75η = 1.00
0 2 4 6 8 10
x 105
0.85
0.9
0.95
1
1.05
1.1
TIME
CO
NS
UM
ER
AD
MIS
SIO
N R
AT
IO
η = 0.25η = 0.50η = 0.75η = 1.00
Figure 12. Left: average hourly revenue vs. time (in seconds) for τ = 0.9 and σ = 1.Right: consumer admission ratio vs. time (in seconds) for τ = 0.9 and σ = 1.
0 2 4 6 8 10
x 105
0.4
0.5
0.6
0.7
0.8
0.9
1
1.1
1.2
TIME
AV
ER
AG
E C
ON
SU
ME
R S
AT
ISF
AC
TIO
N
η = 0.25η = 0.50η = 0.75η = 1.00
0 2 4 6 8 10
x 105
0.72
0.74
0.76
0.78
0.8
0.82
0.84
0.86
0.88
0.9
TIME
AV
ER
AG
E C
ON
SU
ME
R U
TIL
ITY
η = 0.25η = 0.50η = 0.75η = 1.00
Figure 13. Left: average consumer satisfaction vs. time (in seconds) for τ = 0.9 andσ = 1. Right: average consumer utility vs. time (in seconds) for τ = 0.9 and σ = 1.
decision making, and the ability to automate the resource allocation, areonly a few of the advantages of economic models. The interest of thedistributed systems community in economic models for resource allocationis reflected by a fair number of studies 1,5,6,7,8,9,10,11,12,16,17,18 published inrecent years.
The research reported in this paper is part of our effort to introduce re-source allocation models based upon utility, price, and satisfaction function3,4 for large-scale distributed systems. Such models have proved their po-tential in a different context, when the only resource is the radio bandwidth,the size of the population is limited, and each participant has a unique role,is a consumer 2. The heterogeneity of a large-scale distributed system, the

March 2, 2006 11:21 Proceedings Trim Size: 9in x 6in GECON06
19
large spectrum of resources and demands placed upon these resources, thescale of the system, the autonomy of individual resource providers, and thedual role of individual actors, consumer of some resources and provider forothers, add complexity to the models we study. Due to space limitations wecannot fully analyze the properties of utility, price, and satisfaction func-tions. We only show that the satisfaction reaches an optimum for somelevel of resource allocation for linear price functions. In this paper and in3 we consider a model based upon a three party system, provider-broker-consumer while in 4 we consider hierarchical models when the optimizationcriteria is the optimization of the satisfaction function.
Economic models are notoriously difficult to study. The complexity ofthe utility, price, and satisfaction-based models precludes analytical stud-ies and in this paper we report on a simulation study. The goal of oursimulation study is to validate our choice of utility, price, and satisfactionfunction, to study the effect of the many parameters which characterize ourmodel, and to get some feeling regarding the transient and the steady-statebehavior of our models. We are primarily interested in qualitative ratherthan quantitative results, we are interested in trends, rather than actualnumbers. It is too early to compare our model with other economic modelsproposed for resource allocation in distributed systems, but we are confidentthat a model that formalizes the selfish goals of consumers and providers,as well as societal goals, has a significant potential. This is a preliminarystudy that cannot provide a definite answer to the question posed in thetitle of the paper. Our intention is to draw the attention of the communityto the potential of utility, price, and satisfaction-based resource allocationmodels.
The function of a broker is to monitor the system and set τ and σ foroptimal performance. For example, if the broker perceives that the averageconsumer utility is too low, it has two choices: increase τ or increase σ. Atthe same time, the system experiences an increase of average hourly avenueand a decrease of average consumer satisfaction. The fact that increasingutility could result in lower satisfaction seems counterintuitive, but reflectsthe consequences of allocating more resource; we increase the total costpossibly beyond the optimum predicated by the satisfaction function. Thesimulation results shown in this paper are consistent with those in 3 wherewe use a much simpler model based upon a synthetic quantity to representvector resources.
Backward utility functions allow us to describe the behavior of systemswhen the amount of allocated resources is reduced. Models supporting

March 2, 2006 11:21 Proceedings Trim Size: 9in x 6in GECON06
20
elastic resource allocation using backward utility functions could provideadditional insights. In our study we ignored the fact that when the utilityor the satisfaction are low, the consumer may reject the allocation. Morerefined models should take such rejection into account.
A fair number of questions require further investigations including: (a)Are there better alternatives to the utility, price and satisfaction functionswe introduced? (b) Is the policy aiming to achieve maximum satisfactionsound, how should we take into account the societal importance of activitiescarried out by individual resource consumers? (c) How can we apply themodels to more complex networks of resource managers? (d) What com-position rules should be used to describe the utility and/or the satisfactionfor a group of consumers? (e) How can we define more complex utilityfunctions that take into account additional constraints related to quality ofservice, system reliability, and deadlines?
5. Acknowledgments
This research was supported in part by National Science Foundation grantsMCB9527131, DBI0296035, ACI0296035, and EIA0296179, the ColoradoState University George T. Abell Endowment, and the DARPA InformationExploitation Office under contract No. NBCHC030137.
References
1. Y. Amir, B. Awerbuch, A. Barak, R. S. Borgstrom, and A. Keren. An op-portunity cost approach for job assignment in a scalable computing cluster.IEEE Transactions on Parallel and Distributed Systems, 11(7):760–768, 2000.
2. L. Badia and M. Zorzi. On utility-based radio resource management withand without service guarantees. In Proc. ACM MSWiM 2004, Modelling,Analysis, and Simulation of Wireless and Mobile Systems, pages 244–251.ACM Press, 2004.
3. X. Bai, L. Boloni, D. C. Marinescu, H. J. Siegel, R. A. Daley, and I.-J. Wang.A brokering framework for large-scale heterogeneous systems. to appear inProc. of the 20th IEEE Int. Parallel and Distributed Processing Symp., 2006.
4. X. Bai, L. Boloni, D. C. Marinescu, H. J. Siegel, R. A. Daley, and I.-J.Wang. Utility, price, and satisfaction-based models for resource allocation inlarge-scale distributed systems. In preparation.
5. R. Buyya, D. Abramson, and J. Giddy. Nimrod/g: An architecture of a re-source management and scheduling system in a global computational grid.In Proc. of the 4 th Int. Conf. on High Performance Computing in the Asi-aPacific Region, volume 1, pages 283–289, 2001.
6. R. Buyya, H. Stockinger, J. Giddy, and D. Abramson. Economic modelsfor management of resources in peer-to-peer and grid computing. In Proc.

March 2, 2006 11:21 Proceedings Trim Size: 9in x 6in GECON06
21
of the SPIE Int. Conf. on Commercial Applications for High-PerformanceComputing, pages 13–25, Denver, USA, August 20-24 2001.
7. B. Chun and D. Culler. Market-based proportional resource sharing for clus-ters. Technical report, University of California, Berkeley, September 1999.
8. CONDOR. URL http://www.cs.wisc.edu/condor/.9. G. Heiser, F. Lam, and S. Russel. Resource management in the mungi single-
address-space operating system. In Proc. of the 21 st Australasian ComputerScience Conf., pages 417–428, February 1998.
10. Mariposa. URL http://mariposa.cs.berkeley.edu/.11. Mojo Nation. URL http://www.mojonation.net/.12. N. Nisan, S. London, O. Regev, and N. Camiel. Globally distributed compu-
tation over the internet - the popcorn project. In ICDCS ’98: Proc. of The18th Int. Conf. on Distributed Computing Systems, pages 592–601, Washing-ton, DC, USA, 1998. IEEE Computer Society.
13. SETI@home. URL http://setiathome.ssl.berkeley.edu/.14. H. A. Simon. Models of Man. Wiley, 1957.15. H. R. Varian. Intermediate Microeconomics: A Modern Approach. Norton,
New York, March 1999.16. C. A. Waldspurger, T. Hogg, B. A. Huberman, J. O. Kephart, and W. S.
Stornetta. Spawn: A distributed computational economy. Software Engineer-ing, 18(2):103–117, 1992.
17. R. Wolski, J. S. Plank, J. Brevik, and T. Bryan. Analyzing market-basedresource allocation strategies for the computational Grid. The Int. Journalof High Performance Computing Applications, 15(3):258–281, Fall 2001.
18. R. Wolski, J. S. Plank, J. Brevik, and T. Bryan. G-commerce: Market for-mulations controlling resource allocation on the computational grid. In Proc.of the 15th Int. Parallel & Distributed Processing Symposium (IPDPS-01),pages 23–27, San Francisco, CA, April 2001.
19. YAES. URL http://netmoc.cpe.ucf.edu/.