Are investors rational and does it matter · Are investors rational and does it matter? ... in a...
29
Are investors rational and does it matter? Paper presented to the 14th Colloquium of Superannuation Researchers “Choice in Retirement Funding” 20–21st July 2006 Centre for Pensions and Superannuation University of New South Wales John Livanas B.Sc. (Eng), M.B.A., F.Finsia John Livanas is General Manager: Client Services of FuturePlus Financial Services, an Australian Superannuation Funds group with over $12bn in assets. He has over 20 years management experience in investment and financial services, and prior to arriving in Australia, was Director of Investments for SEBO, a $3bn South African Superannuation and Pension Fund. He joined SEBO from Deloitte Haskins and Sells where he was a Principal Consultant in Financial Services. John is Fellow of Finsia, and a member of the Funds Executive Association of Australia. John holds a Master of Business Administration, a Bachelor of Science in Electrical Engineering and a Post Graduate Diploma in Finance and Investments. John is a regular Finsia presenter on Financial Services and Investments topics and has published several papers on Behavioral Finance, Superannuation and Funds Choice. His main focus and area of interest is utilising the theories of behavioural finance to understand the interplay of investor behaviour within a model of efficient markets. Abstract The principle of ‘utility’ underpins many contemporary models that aim to represent the operation of financial markets. Various models of utility have been proposed and debated over time and, more recently behavioural finance has started to offer a more individualised model of utility or value. Australia, with nearly AU$1,000 billion in financial assets invested through the highly regulated superannuation system and with over 90% of the working population as participants, provides a large basis for study into investor utility. This paper presents findings of research into investor behaviour when selecting between portfolios with predetermined risk-return and time-horizon characteristics. The research is based on quantitative data analysis of demographics, value and timing of investment selection and of market performance. More importantly, the paper presents results of investor perceptions of their selection activities, a catalogue of events purported to trigger these decisions, and presents results of choice modelling of risk-return and time horizon options - these latter results being used to derive investor utility curves. Investor behaviour was modelled based on results of on an extensive telephonic survey of 238 investors who actively had made (or hadn’t made) an investment decision within the previous 12 months. A further study of a superset of over 4,000 members who made an investment selection over a period of 5 years provided the demographic and trend data.
Transcript of Are investors rational and does it matter · Are investors rational and does it matter? ... in a...

Are investors rational and does it matter? Paper presented to the 14th Colloquium of Superannuation Researchers
“Choice in Retirement Funding” 20–21st July 2006
Centre for Pensions and Superannuation
University of New South Wales
John Livanas B.Sc. (Eng), M.B.A., F.Finsia John Livanas is General Manager: Client Services of FuturePlus Financial Services, an Australian Superannuation Funds group with over $12bn in assets. He has over 20 years management experience in investment and financial services, and prior to arriving in Australia, was Director of Investments for SEBO, a $3bn South African Superannuation and Pension Fund. He joined SEBO from Deloitte Haskins and Sells where he was a Principal Consultant in Financial Services. John is Fellow of Finsia, and a member of the Funds Executive Association of Australia. John holds a Master of Business Administration, a Bachelor of Science in Electrical
Engineering and a Post Graduate Diploma in Finance and Investments. John is a regular Finsia presenter on Financial Services and Investments topics and has published several papers on Behavioral Finance, Superannuation and Funds Choice. His main focus and area of interest is utilising the theories of behavioural finance to understand the interplay of investor behaviour within a model of efficient markets.
Abstract The principle of ‘utility’ underpins many contemporary models that aim to represent the operation of financial markets. Various models of utility have been proposed and debated over time and, more recently behavioural finance has started to offer a more individualised model of utility or value. Australia, with nearly AU$1,000 billion in financial assets invested through the highly regulated superannuation system and with over 90% of the working population as participants, provides a large basis for study into investor utility. This paper presents findings of research into investor behaviour when selecting between portfolios with predetermined risk-return and time-horizon characteristics. The research is based on quantitative data analysis of demographics, value and timing of investment selection and of market performance. More importantly, the paper presents results of investor perceptions of their selection activities, a catalogue of events purported to trigger these decisions, and presents results of choice modelling of risk-return and time horizon options - these latter results being used to derive investor utility curves. Investor behaviour was modelled based on results of on an extensive telephonic survey of 238 investors who actively had made (or hadn’t made) an investment decision within the previous 12 months. A further study of a superset of over 4,000 members who made an investment selection over a period of 5 years provided the demographic and trend data.

1. Introduction The principle of ‘utility’ is at the cornerstone of the debate concerning the model that best predicts market behaviour. Bernoulli, in 1738 proposed that people's utility of wealth, u(w), is not linearly related to wealth (w). Instead it increases at an ever decreasing rate. This provides the basis for the concept of diminishing marginal utility. These concepts have been under continual challenge from those who argue that behaviour cannot be accurately modelled as ‘rational’ in the economic sense. Kahneman (2003) developed the notion of ‘bounded rationality’ as the model to represent decision making, based in part on the notion of a ‘value function’ as a modification of the utility curve (Kahneman (1979)). Fama (1997) argued that behavioural finance has as yet, not provided a model to better describe the functioning of the market that EMH, notwithstanding the behaviour of individual investors. Livanas (2006) in a comparative analysis of the seminal theories of behavioural finance and EMH highlighted that the EMH does not necessarily preclude investors from behaving in ways different to that predicted by rational market behaviour, provided that arbitrageurs operate continuously and efficiently to bring market prices back to equilibrium. The Australian Superannuation system, with nearly AU$1,000 billion assets invested (the largest per capita investible pool of assets in the world), and with over 86% iof employed Australians between the ages of 15 and 69 participating in these assets, provides a very stable and regular population for analysis. With around 50% of assets subject to investment choice by members, the influence of investors in Australia should be keenly reflected in the market. Consequently it may be argued that these ‘non-professional’ investor decisions may be able to impact the market. Furthermore if these ‘non-professional’ investors behave in ways outside of those predicted by rational market models, the market in Australia may become less efficient. This line of argument is however readily shown to be perhaps too ambitious in the context of influence on individual securities. As it is, only around third of superannuation assets (in the default options at least) are held in Australian Equities and that in total, of these Australian Equitiesii, only a further third are directly invested in equities (i.e. where superannuation investors chose to invest directly in specific shares rather than through an Australian-Equities portfolio). As such the effect by Superannuation Investors on individual shares in the Australian market through their investment decisions is likely to be limited by the small proportion of individual shares held and the even much smaller percentage on which choice is actually exercised. Consequently the effect on the pricing of Australian equities by individual investors, while existing, is likely to be limited. Of much greater importance to the functioning of the market, is the impact that investors have on the risk-return equilibrium of the market, by selecting between portfolios of assets. The most common availability of investment choice in Superannuation in Australia is the choice available to select between different, distinct, pre-constructed investment portfolios with different risk-return characteristics.

Consequently, it can be argued, that the Australian market for Superannuation provides a unique and significant example to study the effects of investors on the risk-return characteristics of the market, or of the market model. There are a number of benefits to studying the Superannuation Industry in Australia:
1. Firstly, Australia has an extensive investor education approach with significant media and government support for professional education in investments. The implications of this are that investors are more likely to be informed than many other markets.
2. Secondly, the Australian Superannuation market has come to have similar product offerings for a large part of the market, in part driven by regulatory demands. These products have readily recognisable names such as ‘High Growth’, ‘Balanced’ etc.
3. Thirdly, with a level of investment in Superannuation approaching AU$1,000 billion, and given that Superannuation is now the second most important source of individual wealth, superannuation is becoming top-of-mind for many investors.
Therefore, an analysis of investor behaviour in the Australian market is an analysis of the perceptions of investors of risk, their assessment of return, and their investment time horizon. Fundamentally, it is a record of investors’ perception of their ‘utility curve’ or perhaps their ‘value function’ and therefore provides us with significant information as to the core assumptions underlying the ‘market model’. This paper analyses the behaviour of over 100,000 investors who participate in Superannuation through two large Australian Industry ‘mutual’ funds; The Local Government Superannuation Scheme (LGSS), and the Energy Industries Superannuation Scheme (EISS), both currently managed by FuturePlus Financial Services on behalf of members.
1.1 Using Standardised Portfolio Choices in assessing investor behaviour
The research underlying this paper looked at investor choices between five standardised risk-return portfolios that ranged from a ‘high-risk, high-growth’ portfolio to a ‘low risk, cash’ portfolio. The paper approaches the analysis in two ways:
1 Firstly, it reviews the way investors adjusted their risk profiles, in reviewing over 4,000 investment decisions taken over a 5 year period and comparing these decisions with the performance of ‘the market’. Importantly it analyses a subset of investors that have made a decision to adjust risk profile of their portfolio the first time and contrasts these decisions with investors who had always had the option to change their risk profile.
2 Secondly, the paper provides an analysis of the behaviour of investors derived from an extensive telephonic survey of a sample of investors who made an intentional investment choice and switched portfolios, thereby shifting their portfolio risk profile. This sample was contrasted with a control group of investors who had not made such a choice. Importantly, the survey also tested

investors’ relative utility with regard to risk, return and investment horizon, assessed the importance of events and people as influences on their decisions, and assessed whether personality profile is a factor.
1.1.1 The Portfolio options The Superannuation market in Australia requires significant disclosure of investment options, with regards to risk, return and investment horizon. As a result, a significant proportion of superannuation investments are implemented through portfolios with defined risk-return profiles. Consequently, the available options for investors who elect to make a change are largely between portfolios with distinctive risk return characteristics, providing researchers with clues as to investor thinking with regards to their utility. The available options for Superannuation members in LGSS, and EISS are named as follows: High Growth, Diversified, Balanced, Capital Guarded and Cash. In Australia these names have a certain meaning to investors, and with supporting communication as to their construction, are fairly common in their meaning and construction to the market in general. The specific characteristics of these portfolios for the LGSS and EISS investors are shown in Table 1 belowiii: Table 1 Portfolio Characteristics
Portfolio Risk & Return Objectives Investment Option Description
Portfolio Names “High Growth” “Diversified” “Balanced” “Capital
Guarded” “Cash”
Typical Assets held 85-90% Equities, Property
65-70% Equities, Property
45-55% Equities,
Property, with the remainder in Bonds, Cash
<25% Equities, Property, with the remainder in Bonds, Cash
Largely Cash with possibly some short-dated Bonds
Time Horizon 5 - 10 yrs 5 yrs 3 yrs 3 yrs 1 yr
Return Objective – Percentage Return above inflation
5.5% - 6.5% p.a.
4.7 – 5.6% p.a.
4.0 – 4.7% p.a.
3.5 – 3.8% p.a.
1.3 - 1.5% p.a.
Return Objective – Total Return - assuming inflation of 2.5% p.a. over the period of the portfolio.
8.0% - 9.0% p.a.
7.2% – 8.1% p.a.
6.5% – 7.2% p.a.
6.0% – 6.3% p.a.
3.8% - 4.0% p.a.
Risk – Expressed as the chance of a negative return for the year, per number of years.
1:3 1:4 1:5 1:7 to 1:8 Nil
Risk – Expressed as the number of years of negative return in a 10 year period.
3.33 2.5 2.0 1.3 – 1.45 nil

1.2 Research Design LGSS and EISS have a combined membership of over 100,000 investors and assets of over AU$7bn. This membership base has on aggregate, a similar profile to that of the Australian workforce in general, with an average income level similar to that of the Australian Average Weekly Ordinary Time Earnings (AWOTE), and with an age profile and gender profile largely reflective of the Australian Working populationiv.
1.2.1 Research Methodology The research data was generated from a number of sources: Firstly, a history of investor (member) choices of investment switches since July 1999 was analysed. A total of over 4,000 decisions were examined. Investors had the option to choose between five investment portfolios with standardised risk return characteristics. A subset of the decisions of investors who were offered the option to choose between investment portfolios for the first time, was also analysed. This was to assess whether the ‘event’ of offering choice for the first time, was in itself a factor in decision making. Only the investors relating to LGSS were analysed to ensure that the sample size was adequate. Secondly, a sample of investors was selected for an extensive telephonic survey. The telephonic interviews were conducted by Woolcott Research Pty Ltd, and a total of 236 members were interviewed. The sample included members who had made an investment choice decision in the last 12 months prior to the survey (‘switchers’) , and a smaller ‘control’ sample of members who had specifically elected not to make a choice (‘non-switchers’), to act as a reference sample and to allow comparisons. The sample used is shown in Table 2 belowv: Table 2 Survey sample size
Fund
LGSS EISS
Switchers 127 59 186
Non-Switchers 36 14 50
TOTAL 163 73 236

1.2.2 The majority of investors didn’t make a choice at all It must be noted that while the sample of investment choices (particularly the longitudinal study) is quite large, the majority of investors did not elect to make a decision about their investment options at all! This is consistent with industry finding, and reflects the common perception that investors by and large are either content to allow the ‘default’ or prevailing choice to be retained, or that they are not engaged. The first finding of this paper then is that, whatever the investment predilections of individual investors, whether rational or not, their impact in aggregate can only be felt if sufficient weight of funds is shifted in response to their decision making.
1.3 Assigning values to Risk In order to normalise the way that the research was conducted, a consistent method had to be established to assign ‘risk’ profiles. To ensure simplicity and to avoid confusion, each ascending risk-return characteristic was assigned an ascending number. However to account for the second subgroup who had never made a choice but (prior to having been given choice) were in a portfolio with a risk-return characteristic between ‘High Growth’ and ‘Diversified’, this portfolio was assigned a risk characteristic of 0. On this basis ‘High Growth’ was assigned +1, ‘Diversified’: -1, etc. The summary of the risk assignments is shown in Table 3 below: Table 3 Assignment of ‘Risk Values’ to portfolios
Portfolio Names ‘High Growth’
‘Trustee Selection’vi ‘Diversified’ ‘Balanced’ ‘Capital
Guarded’ ‘Cash’
Typical Assets held 85-90% Equities, Property
75% - 85% Equities, Property
65-70% Equities, Property
45-55% Equities,
Property, with the remainder in Bonds, Cash
<15% Equities,
Property, with the remainder in Bonds, Cash
Largely Cash with possibly some short-dated Bonds
Relative Risk ‘Value’ +1 0 -1 -2 -3 -4
Consequently an investor who elected to move from “Capital Guarded” to “High Growth” would have a net risk increase of +4. (While this approach can be refined further by assigning variables that move with better gradations, the data is sufficiently robust to accommodate even this presumption. Further suggestions for refinement are welcome).

2. Quantitative Research: A review of Risk Shifts as a result of Investment Decisions made between 1 July 2002 and 20 April 2006
In the first analysis, decisions made by investors in the defined contribution funds (LGSS and EISS) from 1 July 2002 to 20 April 2006 were reviewed. Each investment decision was assigned a value for the risk of the portfolio before the switch and a value for the risk of the portfolio after the switch. For example, an investor switching funds from a ‘Diversified’ portfolio to a ‘Cash’ Portfolio would move from a ‘Risk’ of ‘-1’ for ‘Diversified’ to a ‘Risk’ of ‘-4’ for ‘Cash’, thereby shifting their overall ‘Risk’ by ‘-3’. The risk ‘values’ used are described in Chapter 1.3. The change in the risk assumed by the investor was then plotted against time to establish any correlation of risk shifts against the performance of the market and against age and gender variations. The results of these analyses are shown below:
2.1 Was there any correlation between risk shifts and the direction of the market?
The first analysis attempted to assess whether, for investors who had exercised choice, there was any correlation between the resulting shifts in risks and the direction of the market. The risk shifts, calculated for each investor in the manner described above, were aggregated for all investors for each day. This provided a composite view of the aggregate shift in investor attitudes on a daily basis. To understand whether the absolute value of investment had any impact on decision making, the analysis was also modified to account for money flows, providing a money weighted basis of assessing risk shifts. Money weighting also removed the potential bias of small switches in the aggregate direction of the risk shifts. The resulting unweighted and money weighted risk shifts were compared to the performance of the Australian Equities Market. For the purposes of comparison, the unit price series of the FuturePlus Super Australian Equities portfolio managed by FuturePlus Financial Services. A 30 day trend line was calculated for both analyses, to assess pattern of switches more accuratelyvii. Furthermore a linear best fit line was attempted, to assess whether there was any bias in the direction of risk shifts over the period analysed. The resulting plot of money weighted switches against the Australian Equities Unit Price Series is shown in Figures 1 and 2 below:

Risk Shifts by Superannuation Investors
1.0000
1.5000
2.0000
2.5000
3.0000
3.5000
4.0000
1/07
/02
1/09
/02
1/11
/02
1/01
/03
1/03
/03
1/05
/03
1/07
/03
1/09
/03
1/11
/03
1/01
/04
1/03
/04
1/05
/04
1/07
/04
1/09
/04
1/11
/04
1/01
/05
1/03
/05
1/05
/05
1/07
/05
1/09
/05
1/11
/05
1/01
/06
1/03
/06
Un
it P
rice
Ser
ies
of A
ustr
alia
n E
quiti
es
-6
-4
-2
0
2
4
6
Ris
k M
ovem
ents
Indexed Equities PerfRisk BiasLog. (Indexed Equities Perf)30 per. Mov. Avg. (Risk Bias)Linear (Risk Bias)
Figure 1 Unweighted Risk Shifts by Superannuation Investors
Risk Shifts by Superannuation Investors
1.0000
1.5000
2.0000
2.5000
3.0000
3.5000
4.0000
1/07
/02
1/09
/02
1/11
/02
1/01
/03
1/03
/03
1/05
/03
1/07
/03
1/09
/03
1/11
/03
1/01
/04
1/03
/04
1/05
/04
1/07
/04
1/09
/04
1/11
/04
1/01
/05
1/03
/05
1/05
/05
1/07
/05
1/09
/05
1/11
/05
1/01
/06
1/03
/06
Un
it P
rice
Ser
ies
of A
ustr
alia
n E
quiti
es
-$2,000,000
-$1,500,000
-$1,000,000
-$500,000
$0
$500,000
$1,000,000
$1,500,000
$2,000,000
Ris
k M
ovem
ents
Indexed Equities PerfRisk Bias30 per. Mov. Avg. (Risk Bias)Linear (Risk Bias)
Figure 2 Money Weighted Risk Shifts by Superannuation Investors

2.1.1 Money Weighting as a proxy for absolute wealth The money weighted data series provides an important analytical tool. The data set used was of investors switching their entire investment between portfolios. The data set specifically excludes a small subset of investor where investments were split between numbers of target portfolios. The implication of this important observation is that the absolute value of investments can be deemed to provide clues as to absolute wealth. i.e. the higher the investment value switched, the more likely the investor had a higher level of wealth. While this assumption is not true in all cases, on aggregate, the more investors had in Superannuation, and were then able to switch, the more likely they had accumulated greater wealth through higher income or longer duration of savings.
2.1.2 Correlation between risk shifts and market direction The data shows a number of outcomes: Firstly there is no discernible correlation between the aggregate direction of the risk shifts and the direction of the market. The data cannot demonstrate that investors were making investment choices that bore any relationship to the direction of the market during the period of study, for either unweighted or weighted risk shifts. Correlation between the risk shifts and the unit price series reflecting the market, are shown in Table 4 as follows: Table 4 Correlation of Risk Shifts with the Australian Equities Market
Correlation between Aggregate Risk Shift Series and Australian Equities Unit Price Series 0.00898
Correlation between Aggregate Weighted Risk Shift Series and Australian Equities Unit 0.05558
Secondly, there was no correlation between the Aggregate Weighted Risk Shifts and Australian Equities Unit Price Series. There is a higher correlation however between the Unweighted Risk Shift Series and the Weighted Risk Shift Series, with a correlation of 0.24. However this is to be expected as the former is a major factor of the latter. Nevertheless it is surprising that the correlation is so low and additional analysis may be merited. The importance of the money weighted risk shift series having an equally low correlation to the unweighted risk shift series may support Simon (1955) and Kahneman (1979) that investors are more likely to act on changes in value of investments rather than absolute wealth.

2.1.3 Correlation between risk shifts and adjusted-for-carry-costs Australian Equities Unit Price Series
One of Fama’s tests for Weak Form of the Efficient Market Hypothesis requires that in an Efficient Market, investors are rewarded for ‘carry costs’; i.e. investors are recompensed for the time value of money of investing in the market. However Fama also identifies that, apart from these ‘carry costs’, there is no other discernable information in historical information. This paper does not aim to re-evaluate Fama’s test for market efficiency. Nevertheless, by recasting the Australian Equities Unit Price Series after accounting for ‘carry costs’ (assumed at 5.5% compounded weekly for the period in question), and subsequently considering whether investors have assessed whether there are periods of market inefficiency, one can review whether there is any discernable trend.
Unit Price Adjusted for a Carry Cost of 5.5% compounded weekly
-0.6000
-0.4000
-0.2000
0.0000
0.2000
0.4000
0.6000
1/07
/02
1/09
/02
1/11
/02
1/01
/03
1/03
/03
1/05
/03
1/07
/03
1/09
/03
1/11
/03
1/01
/04
1/03
/04
1/05
/04
1/07
/04
1/09
/04
1/11
/04
1/01
/05
1/03
/05
1/05
/05
1/07
/05
1/09
/05
1/11
/05
1/01
/06
1/03
/06
Adj
uste
d Un
it Pr
ice
Inde
x
-$4,000,000
-$3,000,000
-$2,000,000
-$1,000,000
$0
$1,000,000
$2,000,000
$3,000,000
$4,000,000
Unit Price less Carry CostsMoney W eighted Risk Weighted LHS
RHS
Figure 3 Correlation between Australian Equities Unit Price net of Carry Cost and Money Weighted Risk Shifts
A visual analysis can be seen to demonstrate more aggressive risk shifts from around 6 – 9 months from the establishment that the market price was providing investors with a greater than ‘carry cost’ return. While there is not sufficient analysis to assess whether the visual analysis is correct, if this is proven, it in fact highlights the rational response of investors in a ‘bull-market’, and in fact highlights a source of market inefficiency whereby investors believe that the historical data provides information for these investors make a switching decision.

At this stage, without more rigorous quantitative assessment, this analysis should be seen as preliminary.
2.2 Was there any correlation between investment switches and age?
Conventional wisdom indicates that investors would adjust their risk profiles as they move closer to retirement, shifting from riskier to less risky portfolios. Figure 4 below shows an x-y plot of age versus switching patterns on an unweighted basis (to avoid any bias from age based increases in wealth). The figure also shows a best fit linear trendline. Both visually, and from the linear trendline, there seems to be no correlation between age and risk shifts. This is confirmed even when conducting the comparison with money weighted risk shifts, where one would expect a bias merely as a result of older investors accumulating more funds. Again there seems to be no correlation.
Risk Shifts plotted against Age
-2
-1
0
1
2
3
4
5
35 45 55 65
Age
SwitchesLinear (Switches)
Figure 4 Risk Shifts plotted against age
Further analysis on assessing gender bias in investor behaviour (as shown in Figure 5 below) again yields few clues, with male and female average risk shifts, on an unweighted basis, not showing any significant difference.
Differences in money weighted risk shifts can readily be accounted for by employment status and tenure.

Risk Shifts plotted against Gender
1.93
1.81
0
0.2
0.4
0.6
0.8
1
1.2
1.4
1.6
1.8
2
FEMALE MALE
Gender
$0
$10,000
$20,000
$30,000
$40,000
$50,000
$60,000
$70,000
$80,000
$90,000
$100,000
Unweighted
Money Weighted
Figure 5 Risk Shifts plotted against gender
It will be shown later however, that there is a remarkable correlation with investors who are given the option to choose investment options for the first time. This will be discussed in the next chapter.
2.3 What conclusions can be drawn from the aggregate behaviour of investors implementing investment switches?
In conclusion, investor risk shifts seem to be less correlated with market movements, age or gender than expected. There is a small correlation between evidence of a ‘bull market’ and shifts to higher risk portfolios, but this requires more analysis to confirm. In summary therefore, investors on an aggregate basis, seem to exhibit overall symmetric, yet ‘random’ behaviour, except where they believe a clear market trend has been established. This random behaviour is likely as a result of investor response to individual circumstances, and seems not to provide a directional bias in aggregate.

3. Quantitative Research: Investment Decisions of Investors having a choice for the first time.
A subset of investors, who were given Investment Choice from the 1st October 2005 for the first time, was analysed to assess whether this ‘event’ created a specific bias in investor behaviour. This chapter provides a preliminary analysis of the results of the introduction of investment choice.
3.1 Investment Options Members of this subset of investors are members of a hybrid “defined benefit - defined contribution” fund. Investor funds for the defined contribution component had not been subject to choice prior to 1 October 2005, and had been invested according to ‘Trustee Selection’, a portfolio with a risk profile between High Growth and Diversified. From 1 October 2005, these investors were offered the opportunity to change their investment options as shown in Table 5 below. For the purposes of analysis, these options were assigned ‘Risk Values’ as per Chapter 1.3: Table 5 Investment Choices Available and Relative Risk ValuesTable 5
Pre 1 October 2005 Post 1 October 2005 ‘Risk Values’
High Growth +1
Trustee Selection Trustee Selection 0
Diversified -1
Balanced -2
Cap Guarded -3
Cash -4
3.2 Results to Date Because these investors are in effect only able to choose investment options over the defined contribution component of their investments (often the smaller component), there is an immediate bias in the sample. As such care must be taken to compare these results with those shown in Chapter 2. However, assuming that investors behave according to the principle of ‘gains and losses’ as imputed in Chapter 2.1.2, the results may provide some clues as to the effect of the event of being offered choice for the first time. As of May 2006, a number of members had elected to switch out of their default option (i.e. Trustee Selection) into one of these investment options (i.e. shift their investment portfolio risk), and these members provide the basis of the sample.

3.2.1 What investment choices or risk shifts did investors make? These risk shifts were analysed in aggregate to establish whether there was any correlation between switch decision and age or gender. Because of the very small sample size (unlike the sample in Chapter 2), the sample was stratified by age, with each age cohort assigned an aggregate outcome based on a simple count of individual investor risk shifts. This allowed a better comparison between say 58 year olds, and 48 year olds, where the number of investors aged 58 and making an investment choice differed in number, when compared to those aged 48viii. This approach provided a surprisingly strong correlation between age and investment decision. In fact, the closer the member to retirement, the more conservative the investment option members switched into. This correlation was sustained for both male and female members. Figure 6 below shows a scatter diagram relating age to risk bias. Each point is the risk outcome for each age stratified sample of investors. These points are plotted by risk shift as described in Chapter 1.3. Simply put, investors moving from Trustee Selection to ‘High Growth’ were allocated a risk shift of ‘1’. A move to ‘Diversified’ was allocated a risk shift ‘-1’, etc. The figure also shows a trendline and correlation coefficient R2 of 0.716 (the closer to 1, the more confident we are that the trendline represents the scatter points). This trendline seemingly provides a good model for risk propensity against age!
Correlation of Age with Risk Shift
R2 = 0.7164
-5
-4
-3
-2
-1
0
1
40 45 50 55 60 65
Median Age of Segment
Ris
k Sh
ift
Age versus Risk ProfileLinear (Age versus Risk Shift)
Figure 6 Median age of member segments versus risk

3.3 Summary There seemed to be a very strong correlation between investors’ risk shifts and age, for investors afforded investment choice for the first time. Older investors shifted to less risky portfolios, while younger investors shifted to portfolios with increased risk. In the absence of other data, this analysis shows a higher correlation to demographic (age) based factors rather than investors’ individual risk profiles. This is a different result to the conclusions reached in Chapter 2.2, where the analysis there showed no discernible relationship between age and risk shifts. The conclusion therefore may be that the ‘event’ of being offered investment choice for the first time, triggered investor behaviour that more corresponded to ‘rational’ behaviour. It will be interesting to review this analysis several years on, once the affects of the ‘event’ has subsided, to assess investor behaviour at that stage.

4. Investor Behaviour and decision making in risk shifts
The preceding chapters have yielded interesting insights into investor risk shifts in aggregate, and Chapter 3 in particular proposed a possible ‘event’ triggered behaviour pattern. This chapter however provides important new information relating to investor behaviour, on a far more extensive basis than aggregate quantitative data can yield. This chapter is based on the outcomes of a survey of investors who exercised investment choice and shifted the risk profile of their portfolios. The survey also included a subset of investors who didn’t exercise choice as a control sample). The survey was conducted by Woolcott Research Pty Ltd and based on telephonic interviews over a 4 week period during May 2006. Particular acknowledgement should be given to the work and analysis provided by Karyn Wong, Director of Woolcott Research, and by Shane Murray, Senior Researcher at Woolcott Research.
4.1 What was the objective of the survey? The objective of the survey was to provide ‘investor level’ information as to the behaviour of investors in making investment decisions – specifically in changing risk profiles through selecting between investment portfolios. The survey was to provide important investor attitudinal information relating to risk and the utilities. The surveyix consisted of a sample of investors as set out in Chapter 1.2.1. This study was quantitative in nature and consisted of n=236 telephone interviews amongst members of the LGSS and EISS funds. The sample included members who had made an investment choice decision in the last 12 months prior to the survey (‘switchers’) , and a smaller ‘control’ sample of members who had specifically elected not to make a choice (‘non-switchers’), to act as a reference sample and to allow comparisons. Aside from the usual areas of investigation relating to perceptions and behaviour, there were a number of more intricate sections in the questionnaire that relied on techniques including:
1 Choice Modelling to understand the utility of risk, return and time horizon on investment choice.
2 Some Myers Briggs / Jung style personality statements to provide assessment of personality type correlation with investment decisions
3 The use of Mercer HR Consulting risk scenarios to assess investor perceptions of risk and return.
4 Modelled answers to test the impact of event and people in triggering investment behaviour

4.2 Investor Expectations and Understanding of Risk, Return and Time Horizon dynamics?
There has been significant amount of work in Australia to educate investors with regard to investments. Specifically, all investors receive standardised information as to their investment options in a Product Disclosure Statement, while countless media articles have appeared, discussing investment strategies and options. In order to assess whether investors use this information to make informed decisions, the first set of questions related to understanding investor perceptions of investment characteristics of a variety of investment portfolios. In order to avoid too-large a range of possibilities, investors were asked about their perceptions relating to just three investment portfolios, with ‘High’, ‘Medium’ and ‘Low’ Growth options. Investors were asked in the survey to construct risk, return and time horizon expectations for each of these portfolios.
4.2.1 Investor Expectations of Returns for different portfolio types The initial question was to assess investor expectations for return expectations. Figure 7 below shows the respondent perceptions while the shaded portion represents the actual range of investment returns likely for each corresponding type of ‘real’ portfolios.
EXPECTED RETURNS
High Growth Medium Growth Low Growth
3
3
13
19
17
45
2
0
8
14
18
48
0 20 40 60 80 100
<5
5-6
7-8
9-10
11-14
15+
%
Switchers
Non-switchers
9
10
28
27
15
9
0
16
22
28
16
18
0 20 40 60 80 100
<5
5-6
7-8
9-10
11-14
15+
%
Switchers
Non-switchers
6
23
43
15
5
5
2
20
56
12
4
6
0 20 40 60 80 100
<3
3-4
5-6
7-8
9-10
11+
%
Switchers
Non-switchers
Exp
ect
ed
% R
etu
rn
Q. As you may or may not be aware, investments are categorised according to their projected growth. For the following investment categories, I would like you to tell me what kind of percentage return (including inflation) you would expect from that type of investment per year?
Base: All members (n=236) Figure 7 Investor perceptions of return characteristics
There seemed to be no real difference between investors that elected to shift their risk by making an investment change (‘switchers’) and those that didn’t.

There is however a marked overestimation as to the return expectations of portfolios for all risk characteristics. Investors consistently overestimated the returns targeted and available from investment portfolios.
4.2.2 Investor Expectations of Risks for different portfolio types The next question was to assess investor understanding of risk characteristics for each of these portfolios. Risk was characterized as the probability of a year of negative returns. In the survey the question was asked to assess the number of years out of 10 during which investors would experience a negative return. Figure 8 below shows the respondent perceptions while the shaded portion represents the actual risk of investments for each corresponding type of ‘real’ portfolios.
NUMBER OF NEGATIVE RETURN YEARS OUT OF 10 YEARS High Growth Medium Growth Low Growth
11
30
33
14
3
2
6
14
16
30
16
6
12
6
0 20 40 60 80 100
0
1
2
3
4
5
6+
%
Switchers
Non-switchers
56
23
5
6
1
4
6
48
18
6
4
6
10
8
0 20 40 60 80 100
0
1
2
3
4
5
6+
%
Switchers
Non-switchers
7
11
28
28
12
8
5
8
12
26
30
8
10
6
0 20 40 60 80 100
0
1
2
3
4
5
6+
%
Switchers
Non-switchers
Years
of
Neg
ati
ve R
etu
rn
Q You may have noticed over the last few years that managed investments have increased their returns some years and decreased others. Thinking again about the investment categories, I would now like you to tell me how years out of ten you would expect negative returns if you had a (INSERT)… investment?
Base: All members (n=236)
Figure 8 Investor perceptions of risk characteristics
Surprisingly, investors were fairly accurate in their assessment of the likelihood of investment portfolios returning a year with negative investment returns, across all three investment portfolio types.
4.2.3 Investor Expectations of Time Horizon for different portfolio types
The final question in this group was to assess investor understanding of the time horizon for which investment objectives were constructed, for each of these portfolios. Time horizon was characterized as the likely number of years investors would have to wait before being fairly sure that they would experience the return characteristics of the particular portfolio.

Figure 9 below shows the respondent perceptions while the shaded portion represents the time horizon objective for each corresponding type of ‘real’ portfolio.
YEARS UNTIL MATURATION OF INVESTMENT
High Growth Medium Growth Low Growth
31
57
8
3
2
30
48
16
6
0
0 20 40 60 80 100
<5
5-10
11-20
21+
DK
%
Switchers
Non-switchers
42
49
4
3
2
26
54
12
8
0
0 20 40 60 80 100
<5
5-10
11-20
21+
DK
%
Switchers
Non-switchers
60
25
8
5
2
48
30
8
14
0
0 20 40 60 80 100
<5
5-10
11-20
21+
DK
%
Switchers
Non-switchers
Q. Using the same investment categories, I would now like you to tell me how many years you would expect to wait to ensure the investment is most likely to achieve its expected returns?
Exp
ect
ed
years
un
til
matu
rati
on
Base: All members (n=236)
Figure 9 Investor perceptions of time horizon characteristics
Interestingly, investors again were able to reasonable reflect the time horizon of the portfolios discussed. However, the data is insufficiently robust to draw any specific conclusions. Choice modelling of utility of time horizon will show far clearer outcomes than is possible with this line of questioning.

4.3 Choice modelling and investor utilities of Risk, Return and Time Horizon.
The most important findings of the survey arose as a result of modelling investor preferences between different portfolios with different risk, return and time horizon options. The questions were set up to require investors to make purely binary decisions – with a style of question being “…which of the following two portfolios do you prefer?...” The resulting analysis of decisions allowed modelling of relative preferences (or utility) of each of the characteristics of the portfolios – risk, return and time horizon. Essentially, the analysis was able to establish how much more ‘utility’ is received by an investor, for example, as a result of a 15% return versus a 10% return. Utilities are arbitrarily zero centred and while a greater score in a specific attribute is better than a lesser score, one cannot compare utilities across categories. i.e. a level of utility for risk cannot be compared to a level of utility for return. While additional work is currently being undertaken to model risk, return and time horizon utilities in combination, these are beyond the scope of this paper. The following results highlight investor utility with each dimension, and highlight some of the key assumptions underlying rational decision making.
4.3.1 Relative utility of Returns The first outcome of choice modelling was assessing the relative utility of returns. Figure 10 below demonstrates the utility curve for investors’ preferences plotted against annual investment returns.
Utility Curves
-1.7-1.5-1.3-1.1-0.9-0.7-0.5-0.3-0.10.10.30.50.70.91.11.31.51.7
3.9% 6.0 - 6.3% 6.5 - 7.2% 7.2 - 8.1% 8.0 - 9.0%
Return
Uti
lity
All18-3435-54
55+
Figure 10 Utility curve for Return
As anticipated return has a positively sloping utility function. A trendline fit using a concave function yielded a higher correlation that a linear function, but the data is perhaps not sufficient to provide sufficient confidence to draw any conclusions.

4.3.1 Relative utility of Risk The second outcome of choice modelling was in assessing the relative utility of risk to investors. Risk was identified to respondents as the likelihood (or percentage probability) of a negative return in year, or the number of years out of 10, during which there will be a negative return for the year. Figure 11 below demonstrates the utility curve for investor preferences of risk.
Utility Curves
-1.7-1.5-1.3-1.1-0.9-0.7-0.5-0.3-0.10.10.30.50.70.91.11.31.51.7
no chance 13% chance 20% chance 25% chance 33% chance
Risk of loss
Uti
lity All
18-3435-54
55+
Figure 11 Utility curve for Risk
As expected, the utility curve for risk is negative. Investors prefer less risk to more risk. The data is not sufficiently comprehensive to assess a best fit,. Both a linear trendline and a concave trendline fitted the data points with a R2 of over 90%. The important finding is that there is a clearly negative slope as anticipated.

4.3.2 Relative utility of Time Horizon The third outcome of choice modelling was to assess relative utility of maturity of investment, or time horizon over which the likelihood of achieving the desired return increases in certainty. Portfolios will generally have a time horizon over which the risk-return parameters are constructed, and assessing relative investor utility may provide clues to this. Figure 12 below shows the utility curve for time horizon:
Utility Curves
-1.7-1.5-1.3-1.1-0.9-0.7-0.5-0.3-0.10.10.30.50.70.91.11.31.51.7
1 year 3 year 5 year 10 year
Time Horizon
Uti
lity
All18-34
35-5455+
Figure 12 Utility curve for Time Horizon
Astonishingly there was no clear discernible relative utility for time horizon! Investors were seemingly indifferent whether the maturity profile or objective time horizon of the portfolio was 1 year of 5 years or even 10 years! This inability of investors to appreciate temporal aspects of investments has been discussed before, but this evidence provides unambiguous clues as to investor perceptions.
4.3.3 Utility curves Summary In summary therefore, investor utility for risk and return were in accordance to conventional wisdom. Investor were however seemingly indifferent to investment time horizon.

4.4 Was there any correlation with investor personality profile?
Investor personality is rarely reviewed in aggregate. The survey attempted to assess whether investor personalities provided some relationship to investor behaviour. A comprehensive personality test for each of the respondents was unfortunately out of the question. Specifically, the Meyers-Briggs Personality Type Instrument (MBTI) was reviewed as to whether it could be used. In the survey questionnaire, an abbreviated set of questions were asked of survey respondents to assess personality type. These questions were loosely based on the MBTI and on the Jung 16 personality types. However, because these questions were necessarily abbreviated relative to a full scale MBTI, no conclusions can be drawn as to individual personality types. However in aggregate, the anticipated MBTI standard response pattern was observed in the spread of the responses, and as such, in aggregate some conclusions can be drawn as to personality types and investment behaviour. Specifically, to limit overstretching the capability of the survey to draw conclusions, the only dimension assessed was whether investors who actively engaged in investment switching had any differing personality characteristics. A demographic overlay relating specifically to education level provided some further clues. Figure13 below highlights the results of the survey in relation to investor personality profiles. The conventional MBTI investor characteristics are used as short hand reference points, but it must be noted that the MBTI instrument was not used:
ENFJ
ENFP
INFP
INFJ
ENTJ
ENTP
INTP
INTJ
ESFJESTJ
ESFPESTP
ISFPISTP
ISFJISTJ
ENFJ
ENFP
INFP
INFJ
ENTJ
ENTP
INTP
INTJ
ESFJESTJ
ESFPESTP
ISFPISTP
ISFJISTJ
NNSS
TFFT
4%
1%
2%
3%
16%
3%
2%
6%
J5%19%E
P3%11%E
P3%7%I
J3%13%I
NNSS
TFFT
4%
1%
2%
3%
16%
3%
2%
6%
J5%19%E
P3%11%E
P3%7%I
J3%13%I
SWITCHERS

ENFJ
ENFP
INFP
INFJ
ENTJ
ENTP
INTP
INTJ
ESFJESTJ
ESFPESTP
ISFPISTP
ISFJISTJ
ENFJ
ENFP
INFP
INFJ
ENTJ
ENTP
INTP
INTJ
ESFJESTJ
ESFPESTP
ISFPISTP
ISFJISTJ
NNSS
TFFT
4%
2%
2%
12%
6%
4%
2%
4%
J2%16%E
P2%10%E
P4%8%I
J4%18%I
NNSS
TFFT
4%
2%
2%
12%
6%
4%
2%
4%
J2%16%E
P2%10%E
P4%8%I
J4%18%I
NON-SWITCHERS
Base: All respondents (n=236)
Figure 13 Personality profiles of Switchers and Non-switchers
The figure above highlights three areas of possible personality difference between investors who implemented investment choice and those who didn’t. Further work will need to be done, including perhaps using the full MBTI personality typing before drawing more specific conclusions.
To complement personality typing, demographic questions were correlated against propensity to action investment decisions. Table 6 below highlights demographic information relating to investors’ education levels, and switching propensity. This highlights that ‘switchers’ may be more likely to possess a higher level of education. Table 6 Education Levels
Education Levels Switchers %
Non-Switchers %
Some secondary school 4 8 Intermediate/School Certificate 11 16 Leaving Certificate/HSC 14 18 Trade qualification/Diploma 35 40 University Undergraduate Degree 19 12
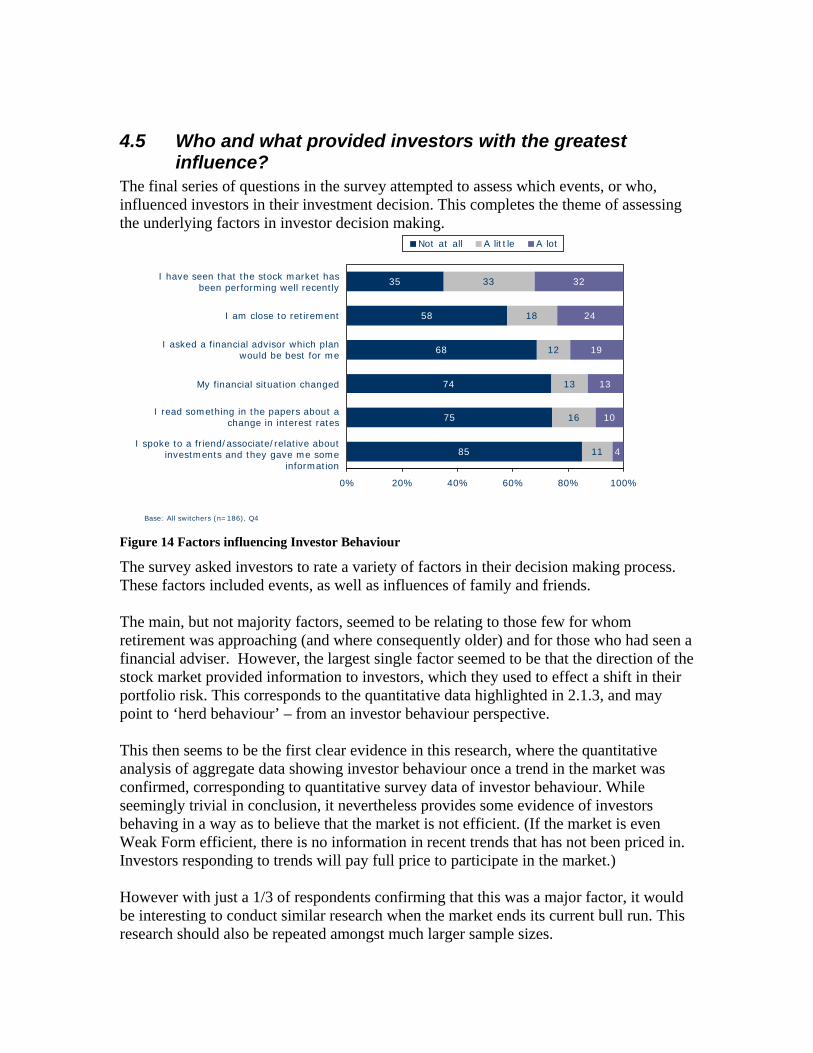
4.5 Who and what provided investors with the greatest influence?
The final series of questions in the survey attempted to assess which events, or who, influenced investors in their investment decision. This completes the theme of assessing the underlying factors in investor decision making.
35
58
68
74
75
85
33
18
12
13
16
11
32
24
19
13
10
4
0% 20% 40% 60% 80% 100%
Not at all A little A lot
Base: All switchers (n=186), Q4
I have seen that the stock market has been performing well recently
I am close to retirement
I asked a financial advisor which plan would be best for me
My financial situation changed
I read something in the papers about a change in interest rates
I spoke to a friend/associate/relative about investments and they gave me some
information
Figure 14 Factors influencing Investor Behaviour
The survey asked investors to rate a variety of factors in their decision making process. These factors included events, as well as influences of family and friends. The main, but not majority factors, seemed to be relating to those few for whom retirement was approaching (and where consequently older) and for those who had seen a financial adviser. However, the largest single factor seemed to be that the direction of the stock market provided information to investors, which they used to effect a shift in their portfolio risk. This corresponds to the quantitative data highlighted in 2.1.3, and may point to ‘herd behaviour’ – from an investor behaviour perspective. This then seems to be the first clear evidence in this research, where the quantitative analysis of aggregate data showing investor behaviour once a trend in the market was confirmed, corresponding to quantitative survey data of investor behaviour. While seemingly trivial in conclusion, it nevertheless provides some evidence of investors behaving in a way as to believe that the market is not efficient. (If the market is even Weak Form efficient, there is no information in recent trends that has not been priced in. Investors responding to trends will pay full price to participate in the market.) However with just a 1/3 of respondents confirming that this was a major factor, it would be interesting to conduct similar research when the market ends its current bull run. This research should also be repeated amongst much larger sample sizes.

5. Overall Findings of research into Investor Behaviour
The research findings presented highlighted investor behaviour, in aggregate terms as well as quantitatively through a survey.
5.1 Research Findings A summary of the findings of this research are as follows:
5.1.1 Weight of Money is with the institutional investors (1.2.2) The first finding of this paper is that, whatever the investment predilections of individual investors, whether rational or not, their impact in aggregate can only be felt if sufficient weight of funds is shifted in response to their decision making. Given that the structure of the superannuation system in Australia is biased towards investment via pooled funds or portfolios, it is unlikely that sufficient investors exercise investment choice on individual securities to impact their pricing. However the aggregate shifting by investors of the risk of their portfolios may have more impact.
5.1.2 Investor risk shifts seem independent of initial wealth (2.1.2) The importance of the money weighted risk shift series having an equally low correlation to the unweighted risk shift series may support Simon (1955) and Kahneman (1979) that investors are more likely to act on changes in value of investments rather than absolute wealth.
5.1.3 Investors seem to exhibit herd behaviour (2.1.3 and 4.5) Quantitative analysis of risk shifts seemed to indicate that investors shift to higher risk portfolios once a ‘bull-market’ is established. Some 6 – 9 months after the market seemed to confirm a return greater than the ‘carry-cost’, investors started to increase their risk. The survey results supported this finding. Investors who engaged in switching indicated in the survey that the market trend influenced them in their switching patterns. This then seems to be the first clear evidence in this research, where the quantitative analysis of aggregate data showed investor behaviour increasing risk once a favourable trend in the market was confirmed, corresponded to the quantitative survey data of investor behaviour, who indicated that the market trend is, in itself, a source of influence. While seemingly trivial in conclusion, it nevertheless provides some evidence of investors behaving in a way as to believe that the market is not efficientx.
5.1.4 Events trigger specific ‘rational’ behaviour (3.2) Investors given investment choice for the first time seemed to shift their risk based largely on their age, with older investors shifting to less risky portfolios, and younger investors increasing risk. This is at odds with the behaviour of investors who have always had choice, implying that events operate to change investor decision making.

5.1.5 Investors overestimate portfolio returns (4.2) There is a marked overestimation as to the return expectations of portfolios for all risk characteristics. Investors consistently overestimated the returns available and targeted from investment portfolios. Surprisingly, investors were fairly accurate in their assessment of the likelihood of investment portfolios returning a year with negative investment returns, across all three investment portfolio types. Interestingly, investors again were able to reasonable reflect the time horizon of the portfolios discussed. However, the data is insufficiently robust to draw any specific conclusions. Choice modelling of utilities will show far clearer outcomes than is possible with this line of questioning.
5.1.6 Utility functions are as anticipated for Risk and Return, but surprisingly Investors are indifferent to time horizon (4.3)
Investors gained more utility with greater return – as expected. That is, Return has a positively sloping utility function. A trendline fit using a concave function yielded a higher correlation that a linear function, but the data is perhaps not sufficient to provide sufficient confidence to draw any conclusions. In turn, and as expected, the utility curve for risk is negative. Investors prefer less risk to more risk. Astonishingly there was no clear discernible relative utility for time horizon! Investors were seemingly indifferent whether the maturity profile or objective time horizon of the portfolio was 1 year of 5 years or even 10 years! This inability of investors to appreciate temporal aspects of investments has been discussed before, but this evidence provides unambiguous clues as to investor perceptions.
5.1.7 There seems to be evidence that Investors behave differently according to their personality profile and demographics. (4.4)
Abbreviated personality typing seemed to highlight possible personality difference between investors who implemented investment choice and those who didn’t. Further work will need to be done, including perhaps using the full MBTI personality typing before drawing more specific conclusions. Furthermore, demographic information relating to investors education levels seemed to indicate ‘switchers’ are far more likely to possess a higher level of education.
5.2 Summary of Investor Behaviour This research paper provides an analysis of investor behaviour, in particular, in investors’ thinking and their approach to shifting their risk.

The paper is novel in that it utilises the enormous source of information in the Australian Superannuation System to derive some understanding of investor perceptions of risk and return. Rather than focusing on the impact of investors on individual securities, the paper reviews investor impact in terms of the market efficiency though their shift in the risk-return equation. Broadly speaking, investors in superannuation are unlikely to be able to influence the prices of individual securities. However, by exhibiting well know behaviours such as ‘herd behaviour’, investors may sustain bubbles. This work is seminal in nature, and ideally should be extended to the market as a whole, in order to derive more comprehensive models and more supportable conclusions.

6. References Fama, E., 1997, 'Market Efficiency, Long-Term Returns And Behavioural Finance', Journal of Financial Economics, 49, pp. 283-306. Kahneman, D., 2003, ‘Maps of Bounded Rationality: A Perspective on Intuitive Judgement and Choice', American Economic Review, pp.1449-1475.
Kahneman, D., Tversky, A., 1979, ‘Prospect Theory: An Analysis Of Decision Under Risk', Econometrica, Volume 47, Issue 2, pp.263-292
Livanas, J., 2006, ‘How can the market be efficient if investors are not rational? ', JASSA (Journal of the Securities Institute of Australia), No. 2, Winter, 2006, pp 10-14.
Simon, H.A. 1955, 'A Behavioral Model of Rational Choice', Cowles Foundation Paper 98, The Quarterly Journal Of Economics, Vol LXIX, pp.99-118.
7. Footnotes i Australian Bureau Of Statistics, ‘Superannuation: Coverage And Financial Characteristics, 6360.0’ Apr To Jun 2000 ii Australian Prudential Regulatory Authority, ‘Statistics: Annual Superannuation Bulletin’, June 2005, issued 20 April 2006) iii The detail characteristic of these options are summarised in Table 1 Further details can be found in the Product Disclosure Statement of LGSS and EISS, at www.lgsuper.com.au, and www.eisuper.com.auiv The detail of the membership profile is proprietary information of FuturePlus. v The questionnaire is proprietary information of FuturePlus Financial Services Pty ltd and may be available on request. vi This investment option was only offered to investors who had not previously been offered choice of investments. Those investors had previously been assigned ‘Trustee Selection’ for their defined contribution investments as part of their hybrid defined benefit scheme. The analysis only considers the defined contribution component. These investors make up a special subset and are analysed separately in Chapter 3. vii Care should be taken in assigning relevance to the actual day recorded as the day of the switch. The time to administratively implement the decision may be up to 1 week, with perhaps a delay of a further week to effect the investment changes and to finalise reporting. When also considering the time delay between the actual investment decision taken by the investor, and the actual direction provided by the investor, the granularity of the data is unlikely to be able to support analysis at periods shorter than 4 weeks to 30 days. Consequently a 30 day trend line probably provides the shortest period on analysis possible. viii The sample in Chapter 2 was deemed sufficiently large to avoid swamping by different sized age cohorts, although it may be useful to assess whether even in this sample, stratification may change the conclusions. ix The questionnaire is proprietary information of FuturePlus Financial Services Pty ltd and may be available on request. x If the market is even Weak Form efficient, there is no information in recent trends that has not been priced in. Investors responding to bull-market trends will pay full price to participate in the market and will not benefit from any information as a result of a trend.