
Are US Investors Rational? - Evidence from Return Based ... · Are US Investors Rational? -...
15
International Journal of Science Commerce and Humanities Volume No 5 No 1 March 2017 1 Are US Investors Rational? - Evidence from Return Based and SharpeRatio Based Momentum Approach on AAII Portfolios Carol Wang 1 Wright State University Wei Rowe 2 University of Nebraska at Omaha Abstract The American Association of Individual Investors (AAII)is a non-profit organization that provides a series of popular trading strategies for individual investors to followfor their personal stock portfolio management. We examine the momentum effects based on the monthly returns of the AAII trading strategies from 1998 to 2012. Our research results demonstrate that (1)the momentum effects are significantly and economically strong based on both prior two-month return and prior two-month Sharpe ratio; (2) The Sharpe ratio based momentum approach dominates the return based momentum approach on average; (3) There is an incremental gapbetween the momentums effects of the two different approaches over time, with a sudden spike starting in 2009. Our findings suggest that US individualinvestors have learned to be more rational by considering the tradeoff of risks and returns in making investment decisions since 2001. Our studypresents additional evidence to support behavioral finance theory and sheds light on thearea regarding the evolvement ofinvestment rationality in U.S. markets. 1 Correspondent author: Carol Wang,[email protected], Tel:(937)443-7451 2 Wei Rowe,[email protected], Tel: (402)554-2812
Transcript of Are US Investors Rational? - Evidence from Return Based ... · Are US Investors Rational? -...
International Journal of Science Commerce and Humanities Volume No 5 No 1 March 2017
1
Are US Investors Rational? - Evidence from Return Based and SharpeRatio
Based Momentum Approach on AAII Portfolios
Carol Wang1
Wright State University
Wei Rowe2
University of Nebraska at Omaha
Abstract
The American Association of Individual Investors (AAII)is a non-profit organization that provides a
series of popular trading strategies for individual investors to followfor their personal stock portfolio
management. We examine the momentum effects based on the monthly returns of the AAII trading strategies
from 1998 to 2012. Our research results demonstrate that (1)the momentum effects are significantly and
economically strong based on both prior two-month return and prior two-month Sharpe ratio; (2) The Sharpe
ratio based momentum approach dominates the return based momentum approach on average; (3) There is an
incremental gapbetween the momentums effects of the two different approaches over time, with a sudden spike
starting in 2009. Our findings suggest that US individualinvestors have learned to be more rational by
considering the tradeoff of risks and returns in making investment decisions since 2001. Our studypresents
additional evidence to support behavioral finance theory and sheds light on thearea regarding the evolvement
ofinvestment rationality in U.S. markets.
1Correspondent author: Carol Wang,[email protected], Tel:(937)443-7451
2Wei Rowe,[email protected], Tel: (402)554-2812

International Journal of Science Commerce and Humanities Volume No 5 No 1 March 2017
22
1. Introduction
American Association of Individual Investors (AAII), a nonprofit investment education organization
provides a number of trading techniques identified by academic research to the public through their website
(www.aaii.com). Through these trading techniques, AAII aims to show to its members on how to manage a
stock portfolio and capitalize on these methods without having to commit a great deal of time and effort to day-
to-day monitoring and analysis.
In this study, we focus on the momentum effect based on performance of different trading strategies
provided by AAII. Traditional momentum studiescover the momentum effects onperformances of individual
stocks. The benefit of focusing on trading strategies instead of focusing on single stocksis because thetrading
strategies are purely derived from the outcome of a quantitative screening method. For single stocks, the
financial fundamentals are specific across different companies and markets, therefore the momentum effects
based on the performance of single stocks are likely to contain confounding factors and create noises to pure
momentum effects.
We investigate the predictive effects using two different momentum indicators. One is based on the past
average portfolio returns, and the other is based on the past Sharpe ratio of the portfolios, a risk adjusted return.
We examine the difference of the predictability by the momentum effectunder the two types ofmeasurement for
momentum indicators. By comparing the difference, we attempt to find out which indicator drives up the
momentum effect more dominantly. We associate the dominance of predictability with the level of rationality
of investor composition of the U.S markets.
In the following section, we review prior literature relevant to the issues addressed in thisresearch. Later
sections describe the hypothesis development, data and methods, analyze the test results. The final section
summarizes our findings and conclusions.
2. Literature Review
Momentum investing is a trading strategy that yields positive returns on average by buying and holding
the past stock winners and selling or shorting the past stock losers. There is a rich literature in academia and in
industry documenting the momentum efficacy across different time periods (Jegadeesh and Titman (1993) and
Asness (1994), Jegadeesh and Titman (2001), Israel and Moskowitz (2013)); across different countries
(Rouwenhorst (1998, 1999), Asness, Liew, and Stevens (1997)); and across different markets and asset classes
(Moskowitz and Grinblatt (1999), Okunev and White (2003), Moskowitz, Ooi, and Pedersen (2012), Asness,
Moskowitz, and Pedersen (2013)).
Obviously, the robustness of the momentum efficacy found in these studies challenge the efficient
market hypothesis (Fama, 1970) (Researchers have provided evidence of other market anomalies, including the
P/E ratio (Basu, 1977; Campbell and Shiller, 1988b; Fama and French, 1988), dividend yield (Fama and French,
1988), book-to-market ratio (Kothari and Shanken, 1997), dividend-price ratio (Campbell and Shiller, 1988a),
and equity share (Baker and Wurgler (2000), to name a few). These market anomalies have inspired two
popular explanations that provide different perspectives on the subject. One is based on implications of the
traditional efficient market hypothesis. The other is based on the emerged behavioral hypothesis that allows for
irrational behavior on the part of investors.
Proponents of the efficient market hypothesis assume that investors are rational and any over-reaction or
under-reaction of investors tends to offset or cancel out any mispricing. Hence, prices normally reflect true asset
value (Fama, 1998). According to Black (1993), some of the anomalous evidence is purely a result of data
mining or statistical artifacts. Davis et al. (2000) reason that due to the limits of currently developed theories

International Journal of Science Commerce and Humanities Volume No 5 No 1 March 2017
23
and models, some unobserved risks of the assets cannot be fully captured by the Capital Asset Pricing Model
and, therefore, the market anomalies are a result of investors’ biased perception of true asset value. Fama and
French (1993; 1995; 1996) propose multi-factor models that appear to explain the average returns on a full
scale.
The behavioral camp, on the other hand, relaxes the assumption of investor rationality. Proponents of
behavioral finance suggest that equilibrium prices reflect the weighted average of the beliefs of both rational
and irrational traders (Hirchleifer, 2001). Albert Einstein once said “Only two things are infinite, the Universe
and Human Stupidity and I’m not sure about the former.” The behaviorists believe that investors are subject to
various cognitive errors and can make illogical and irrational investment decisions. According to Barber and
Odean (1999), people’s deviations from rationality are often systematic. Systematic over-reaction to
information is common among investors. When the over-reaction is eventually corrected, over-adjusted stock
returns converge or reverse. Hogarth and Reder (1986); Einhorn and Hogarth (1986); Kleidon (1986); De Bondt
et al. (1987) and Lakonishok et al. (1994) are among the group that support the behavioral hypothesis.
Our study contributes to the literature in the following aspects:
First, the traditional studies of momentum effects are mainly implemented on individual stocks or
market indices. This paper develops an innovative approach by examining the momentum effects on different
trading strategies. In general, trading stocks or indices involves investors’ perception on a large variety of firm
specific, industry specific and macro-economic variables, therefore momentum study on stock or indices is
subject to significant confounding disturbance and may create spurious results. However, portfolios formed on
trading strategy are determined by quantitative models, thus studying the strategy momentum can facilitates
with a cleaner data set for our research interest by eliminating the fundamental aspects of the securities as well
as investors’ sentiments in their investment decisions.
Second, unlike prior research design, we apply two types of momentum trading approach. One is based
on average past returns as used in previous studies. The second is based on past Sharpe ratios of the portfolios.
By comparing differences in the momentous power between the two measurements, we can capture the source
of momentum effects by answering question on whether the momentum is driven by naïve investors who make
judgment purely on raw returns or by more sophisticated investors who weigh both the returns and the risks of
an investment opportunity in forming their portfolios. The finding of this study provides a different perspective
to better understand the nature of the well-documented momentum phenomena and an additional empirical
evidence to the growing behavioral finance literature.
Third, prior research (Frederick and Brett, 2008) on the performance of AAII trading strategies covers
the year of 1998 through 2005. Our study extends the sample period to the more current year (May 2012). A
longer time horizon can capture the impact from the post-financial crisis during 2008 and 2009 and deserves an
updated test of the effectiveness of AAII strategies.
The empirical results from this study provides a new investment alternative for individual investors and
has practical implications to the investment community, academia researchers and educators.
3. Hypothesis Development
Since the behavioral finance has brought into the main stream of the academic research, one central
argument of this line of study focuses on various irrational and cognitive bias that plague the public investors

International Journal of Science Commerce and Humanities Volume No 5 No 1 March 2017
24
when they make investment decisions. We argue that investors cannot be, probably will never be rational
enough to make perfect judgments as the information available to the public is increasing exponentially and is
impossible for one individual to absorb and to process completely on a timely basis unless he/she is a robot.
The journey to the full rationality is a dynamic, continuous, and infinite course as the human economic world
develops.
Inexperienced investors tend to think linearly. This manner of thinking is common among individual
investors and is mainly determined by the limited amount of time on a daily basis and the limited vigor of brain
power due to a lack of quantitative training, compared to institutional investors.We study and compare the
momentum effects based on two different levels of dimension of considerations by investors respectively. The
one dimension consideration is based on the past average return only. Naïve investors tend to focus on the raw
returns to chase capital gains only given their linear thinking habit. Unless this type of investors encounter
dramatic negative lossesby taking excessive risks and suffered from the pain of the losses, they are typically
blind to risk factors since risks are invisible and adds an additional dimension of thinking to them. The two-
dimension consideration is based on a balance of risk and return, such as a risk adjusted return measured by
Sharpe ratio. More educated or more experienced investors understand the huge impact on their wealth by
taking excessive type I risk. They normallychoose to take a more conservative approach by weighing both risk
and return in forming their portfolios.
We study the predictability of the momentum trading between the one dimension approach and the two-
dimension approach based on the monthly returns of the AAII portfolios. By comparing the different levels of
the predictive power by the two different approaches, we can tackle the issue on whether the public investors of
U.S. are composed of more naïve investors or more sophisticated investors.
4. Data and Methods
The AAII was founded in 1978 in Chicago. In its website, it reports the monthly returns on a total of 82
portfolios based on different trading screening methods beginning with January 1998. It also updates the
descriptive statistics on the portfolio characteristics including Sharpe Ratio, Standard Deviation, averagereturn,
return range, largest monthly gain and loss for each calendar year. Table 1 presents a complete list of the
portfolios in AAII report.
Table 1 – List of AAII Portfolio

International Journal of Science Commerce and Humanities Volume No 5 No 1 March 2017
25
# Portfolio Names
1 S&P 500 p+B1:W1rice chg
2 S&P MidCap 400 price chg
3 S&P SmallCap 600 price chg
4 NASDAQ 100 price chg
5 Dow Jones 30 price chg
6 T-Bills price chg
7 S&P 500 (TR)
8 S&P 500 Growth (TR)
9 S&P 500 Value (TR)
10 S&P MidCap 400 (TR)
11 S&P MidCap 400 Growth (TR)
12 S&P MidCap 400 Value (TR)
13 S&P SmallCap 600 (TR)
14 S&P SmallCap 600 Growth (TR)
15 S&P SmallCap 600 Value (TR)
16 All Exchange-Listed Stocks price chg
17 ADR Screen price chg
18 All ADRs price chg
19 Buffett: Hagstrom price chg
20 Buffettology: EPS Growth price chg
21 Buffettology: Sustainable Growth price chg
22 O'Neil's CAN SLIM price chg
23O'Neil's CAN SLIM Revised 3rd Edition price
chg
24 Cash Rich Firms price chg
25 Dual Cash Flow price chg
26 Dividend (High Relative Yield) price chg
27 Dogs of the Dow price chg
28 Dogs of the Dow: Low Priced 5 price chg
29 Dreman price chg
30 Dreman With Est Revisions price chg
31 Driehaus price chg
32 Dividend Screen: DRPs price chg
33 Dividend Screen: Non-DRPs price chg
34 Est Rev: Lowest 30 Down price chg
35 Est Rev: Down 5% price chg
36 Est Rev: Top 30 Up price chg
37 Est Rev: Up 5% price chg
38 Fisher (Philip) price chg
39 Foolish Small Cap 8 price chg
40 Foolish Small Cap 8 Revised price chg
41 Price-to-Free-Cash-Flow price chg
42 Fundamental Rule of Thumb price chg
43Graham--Defensive Investor (Non-Utility) price
chg
44 Graham--Defensive Investor (Utility) price chg
45 Graham--Enterprising Investor price chg
46 IBD Stable 70 price chg
47 Insider Net Purchases price chg
48 Inve$tWare Quality Growth price chg
49 Kirkpatrick Bargain price chg
50 Kirkpatrick Growth price chg
51 Kirkpatrick Value price chg
52 Lakonishok price chg
53 Lynch price chg
54 Magic Formula price chg
55 MAGNET Complex price chg
56 MAGNET Simple price chg
57 Muhlenkamp price chg
58 Murphy Technology price chg
59 Neff price chg
60 O'Shaughnessy: All Cap price chg
61O'Shaughnessy: Growth Market Leaders price
chg
62 O'Shaughnessy: Growth price chg
63O'Shaughnessy: Small Cap Growth & Value
price chg
64 O'Shaughnessy: Tiny Titans price chg
65 O'Shaughnessy: Value price chg
66 Oberweis Octagon price chg
67 P/E Relative price chg
68Value on the Move--PEG With Est Growth price
chg
69Value on the Move--PEG With Hist Growth
price chg
70 Piotroski: High F-Score price chg
71 Piotroski 9 price chg
72 Price-to-Sales price chg
73 Return on Equity price chg
74 Rule #1 Investing price chg
75 Schloss price chg
76 Shadow Stock Screen price chg
77 T. Rowe Price price chg
78 Templeton price chg
79 Wanger (Revised) price chg
80 Weiss Blue Chip Div Yield price chg
81 Stock Market Winners price chg
82 Zweig price chg
International Journal of Science Commerce and Humanities Volume No 5 No 1 March 2017
26
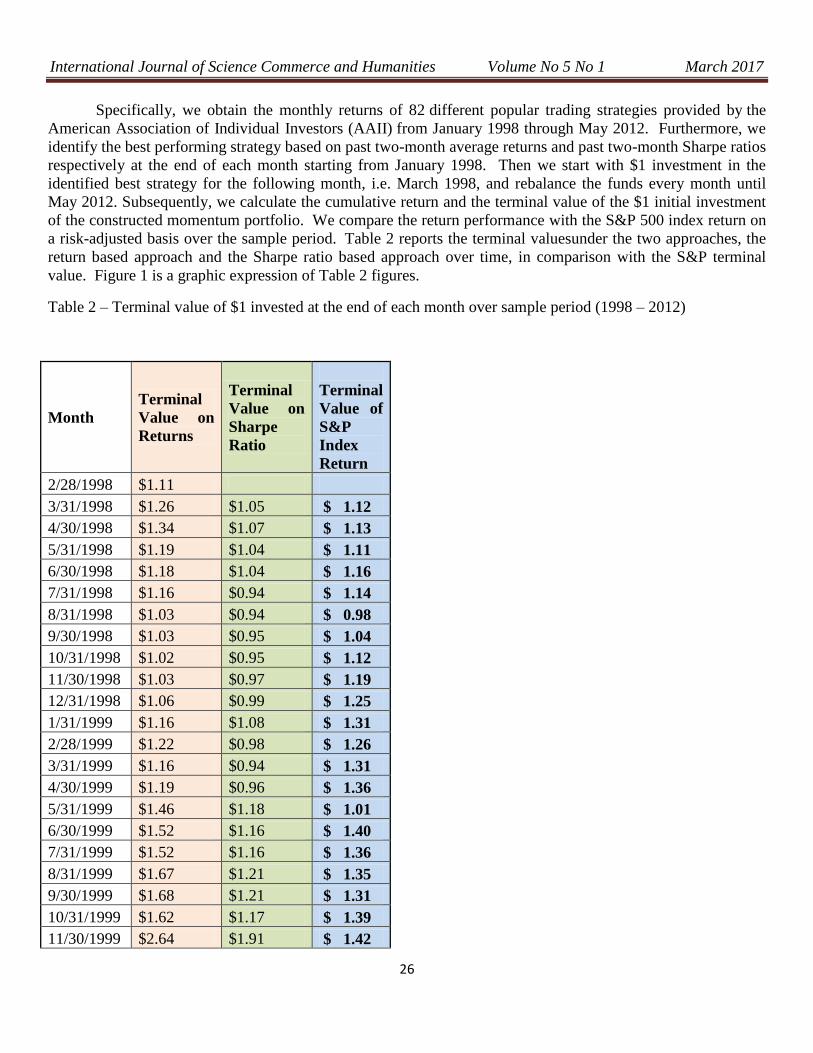
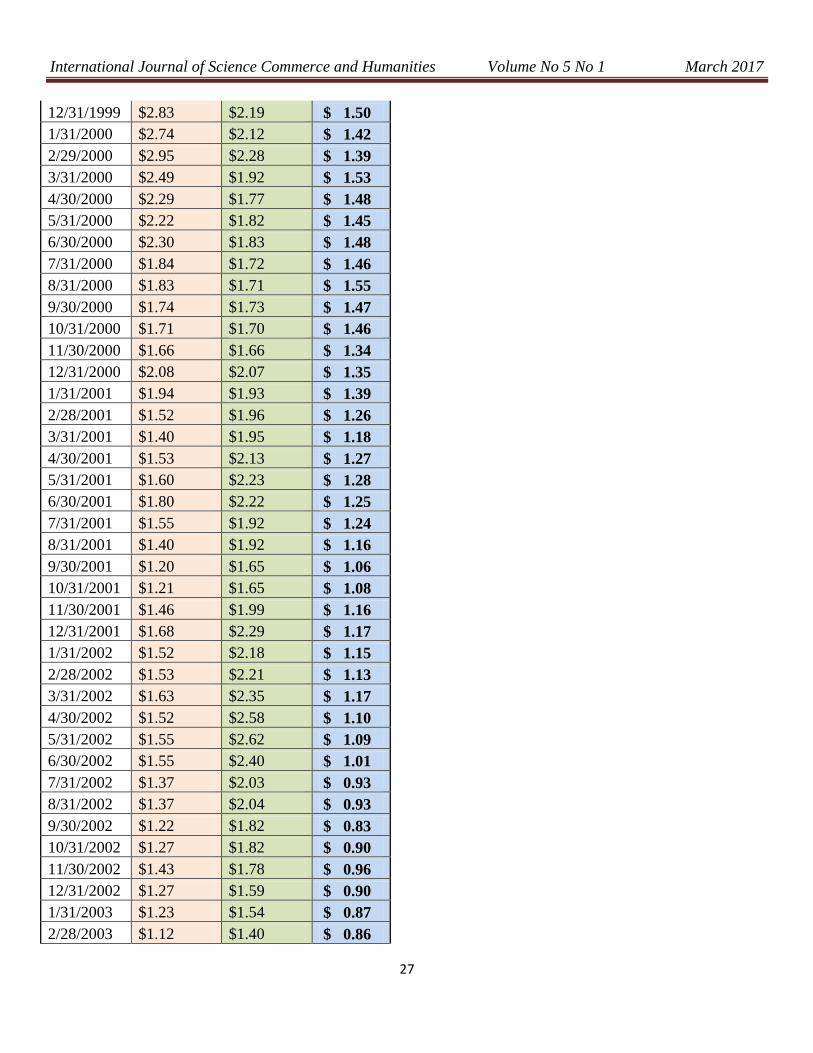
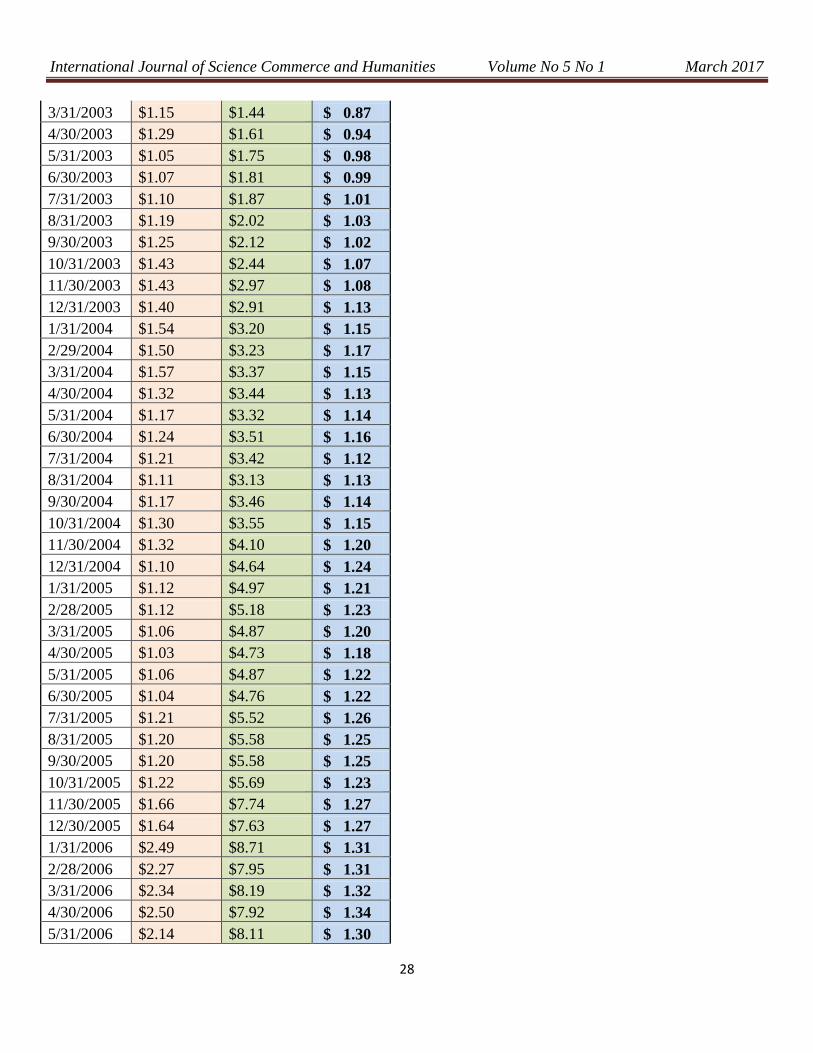
Specifically, we obtain the monthly returns of 82 different popular trading strategies provided by the
American Association of Individual Investors (AAII) from January 1998 through May 2012. Furthermore, we
identify the best performing strategy based on past two-month average returns and past two-month Sharpe ratios
respectively at the end of each month starting from January 1998. Then we start with $1 investment in the
identified best strategy for the following month, i.e. March 1998, and rebalance the funds every month until
May 2012. Subsequently, we calculate the cumulative return and the terminal value of the $1 initial investment
of the constructed momentum portfolio. We compare the return performance with the S&P 500 index return on
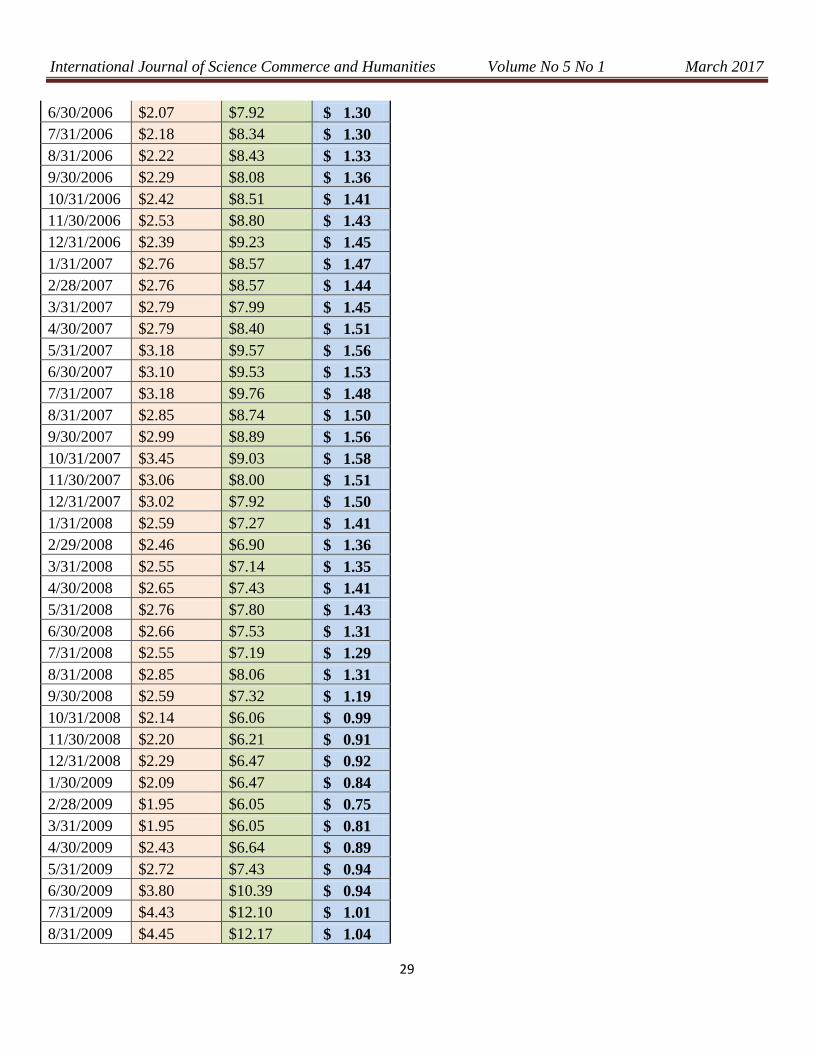
a risk-adjusted basis over the sample period. Table 2 reports the terminal valuesunder the two approaches, the
return based approach and the Sharpe ratio based approach over time, in comparison with the S&P terminal
value. Figure 1 is a graphic expression of Table 2 figures.
Table 2 – Terminal value of $1 invested at the end of each month over sample period (1998 – 2012)
Month
Terminal
Value on
Returns
Terminal
Value on
Sharpe
Ratio
Terminal
Value of
S&P
Index
Return
2/28/1998 $1.11
3/31/1998 $1.26 $1.05 $ 1.12
4/30/1998 $1.34 $1.07 $ 1.13
5/31/1998 $1.19 $1.04 $ 1.11
6/30/1998 $1.18 $1.04 $ 1.16
7/31/1998 $1.16 $0.94 $ 1.14
8/31/1998 $1.03 $0.94 $ 0.98
9/30/1998 $1.03 $0.95 $ 1.04
10/31/1998 $1.02 $0.95 $ 1.12
11/30/1998 $1.03 $0.97 $ 1.19
12/31/1998 $1.06 $0.99 $ 1.25
1/31/1999 $1.16 $1.08 $ 1.31
2/28/1999 $1.22 $0.98 $ 1.26
3/31/1999 $1.16 $0.94 $ 1.31
4/30/1999 $1.19 $0.96 $ 1.36
5/31/1999 $1.46 $1.18 $ 1.01
6/30/1999 $1.52 $1.16 $ 1.40
7/31/1999 $1.52 $1.16 $ 1.36
8/31/1999 $1.67 $1.21 $ 1.35
9/30/1999 $1.68 $1.21 $ 1.31
10/31/1999 $1.62 $1.17 $ 1.39
11/30/1999 $2.64 $1.91 $ 1.42
International Journal of Science Commerce and Humanities Volume No 5 No 1 March 2017
27
12/31/1999 $2.83 $2.19 $ 1.50
1/31/2000 $2.74 $2.12 $ 1.42
2/29/2000 $2.95 $2.28 $ 1.39
3/31/2000 $2.49 $1.92 $ 1.53
4/30/2000 $2.29 $1.77 $ 1.48
5/31/2000 $2.22 $1.82 $ 1.45
6/30/2000 $2.30 $1.83 $ 1.48
7/31/2000 $1.84 $1.72 $ 1.46
8/31/2000 $1.83 $1.71 $ 1.55
9/30/2000 $1.74 $1.73 $ 1.47
10/31/2000 $1.71 $1.70 $ 1.46
11/30/2000 $1.66 $1.66 $ 1.34
12/31/2000 $2.08 $2.07 $ 1.35
1/31/2001 $1.94 $1.93 $ 1.39
2/28/2001 $1.52 $1.96 $ 1.26
3/31/2001 $1.40 $1.95 $ 1.18
4/30/2001 $1.53 $2.13 $ 1.27
5/31/2001 $1.60 $2.23 $ 1.28
6/30/2001 $1.80 $2.22 $ 1.25
7/31/2001 $1.55 $1.92 $ 1.24
8/31/2001 $1.40 $1.92 $ 1.16
9/30/2001 $1.20 $1.65 $ 1.06
10/31/2001 $1.21 $1.65 $ 1.08
11/30/2001 $1.46 $1.99 $ 1.16
12/31/2001 $1.68 $2.29 $ 1.17
1/31/2002 $1.52 $2.18 $ 1.15
2/28/2002 $1.53 $2.21 $ 1.13
3/31/2002 $1.63 $2.35 $ 1.17
4/30/2002 $1.52 $2.58 $ 1.10
5/31/2002 $1.55 $2.62 $ 1.09
6/30/2002 $1.55 $2.40 $ 1.01
7/31/2002 $1.37 $2.03 $ 0.93
8/31/2002 $1.37 $2.04 $ 0.93
9/30/2002 $1.22 $1.82 $ 0.83
10/31/2002 $1.27 $1.82 $ 0.90
11/30/2002 $1.43 $1.78 $ 0.96
12/31/2002 $1.27 $1.59 $ 0.90
1/31/2003 $1.23 $1.54 $ 0.87
2/28/2003 $1.12 $1.40 $ 0.86
International Journal of Science Commerce and Humanities Volume No 5 No 1 March 2017
28
3/31/2003 $1.15 $1.44 $ 0.87
4/30/2003 $1.29 $1.61 $ 0.94
5/31/2003 $1.05 $1.75 $ 0.98
6/30/2003 $1.07 $1.81 $ 0.99
7/31/2003 $1.10 $1.87 $ 1.01
8/31/2003 $1.19 $2.02 $ 1.03
9/30/2003 $1.25 $2.12 $ 1.02
10/31/2003 $1.43 $2.44 $ 1.07
11/30/2003 $1.43 $2.97 $ 1.08
12/31/2003 $1.40 $2.91 $ 1.13
1/31/2004 $1.54 $3.20 $ 1.15
2/29/2004 $1.50 $3.23 $ 1.17
3/31/2004 $1.57 $3.37 $ 1.15
4/30/2004 $1.32 $3.44 $ 1.13
5/31/2004 $1.17 $3.32 $ 1.14
6/30/2004 $1.24 $3.51 $ 1.16
7/31/2004 $1.21 $3.42 $ 1.12
8/31/2004 $1.11 $3.13 $ 1.13
9/30/2004 $1.17 $3.46 $ 1.14
10/31/2004 $1.30 $3.55 $ 1.15
11/30/2004 $1.32 $4.10 $ 1.20
12/31/2004 $1.10 $4.64 $ 1.24
1/31/2005 $1.12 $4.97 $ 1.21
2/28/2005 $1.12 $5.18 $ 1.23
3/31/2005 $1.06 $4.87 $ 1.20
4/30/2005 $1.03 $4.73 $ 1.18
5/31/2005 $1.06 $4.87 $ 1.22
6/30/2005 $1.04 $4.76 $ 1.22
7/31/2005 $1.21 $5.52 $ 1.26
8/31/2005 $1.20 $5.58 $ 1.25
9/30/2005 $1.20 $5.58 $ 1.25
10/31/2005 $1.22 $5.69 $ 1.23
11/30/2005 $1.66 $7.74 $ 1.27
12/30/2005 $1.64 $7.63 $ 1.27
1/31/2006 $2.49 $8.71 $ 1.31
2/28/2006 $2.27 $7.95 $ 1.31
3/31/2006 $2.34 $8.19 $ 1.32
4/30/2006 $2.50 $7.92 $ 1.34
5/31/2006 $2.14 $8.11 $ 1.30
International Journal of Science Commerce and Humanities Volume No 5 No 1 March 2017
29
6/30/2006 $2.07 $7.92 $ 1.30
7/31/2006 $2.18 $8.34 $ 1.30
8/31/2006 $2.22 $8.43 $ 1.33
9/30/2006 $2.29 $8.08 $ 1.36
10/31/2006 $2.42 $8.51 $ 1.41
11/30/2006 $2.53 $8.80 $ 1.43
12/31/2006 $2.39 $9.23 $ 1.45
1/31/2007 $2.76 $8.57 $ 1.47
2/28/2007 $2.76 $8.57 $ 1.44
3/31/2007 $2.79 $7.99 $ 1.45
4/30/2007 $2.79 $8.40 $ 1.51
5/31/2007 $3.18 $9.57 $ 1.56
6/30/2007 $3.10 $9.53 $ 1.53
7/31/2007 $3.18 $9.76 $ 1.48
8/31/2007 $2.85 $8.74 $ 1.50
9/30/2007 $2.99 $8.89 $ 1.56
10/31/2007 $3.45 $9.03 $ 1.58
11/30/2007 $3.06 $8.00 $ 1.51
12/31/2007 $3.02 $7.92 $ 1.50
1/31/2008 $2.59 $7.27 $ 1.41
2/29/2008 $2.46 $6.90 $ 1.36
3/31/2008 $2.55 $7.14 $ 1.35
4/30/2008 $2.65 $7.43 $ 1.41
5/31/2008 $2.76 $7.80 $ 1.43
6/30/2008 $2.66 $7.53 $ 1.31
7/31/2008 $2.55 $7.19 $ 1.29
8/31/2008 $2.85 $8.06 $ 1.31
9/30/2008 $2.59 $7.32 $ 1.19
10/31/2008 $2.14 $6.06 $ 0.99
11/30/2008 $2.20 $6.21 $ 0.91
12/31/2008 $2.29 $6.47 $ 0.92
1/30/2009 $2.09 $6.47 $ 0.84
2/28/2009 $1.95 $6.05 $ 0.75
3/31/2009 $1.95 $6.05 $ 0.81
4/30/2009 $2.43 $6.64 $ 0.89
5/31/2009 $2.72 $7.43 $ 0.94
6/30/2009 $3.80 $10.39 $ 0.94
7/31/2009 $4.43 $12.10 $ 1.01
8/31/2009 $4.45 $12.17 $ 1.04

International Journal of Science Commerce and Humanities Volume No 5 No 1 March 2017
30
9/30/2009 $4.86 $12.90 $ 1.08
10/31/2009 $4.22 $11.19 $ 1.06
11/30/2009 $4.37 $11.60 $ 1.12
12/31/2009 $4.37 $11.60 $ 1.14
1/31/2010 $4.13 $11.76 $ 1.10
2/28/2010 $4.59 $13.06 $ 1.13
3/31/2010 $4.59 $13.06 $ 1.19
4/30/2010 $4.70 $13.11 $ 1.21
5/31/2010 $6.10 $17.01 $ 1.11
6/30/2010 $6.20 $17.30 $ 1.05
7/31/2010 $6.89 $19.21 $ 1.12
8/31/2010 $7.02 $19.57 $ 1.07
9/30/2010 $8.56 $20.26 $ 1.16
10/31/2010 $8.76 $20.75 $ 1.21
11/30/2010 $9.54 $22.60 $ 1.20
12/31/2010 $8.78 $20.79 $ 1.28
1/31/2011 $9.32 $22.07 $ 1.31
2/28/2011 $9.23 $23.45 $ 1.35
3/31/2011 $9.35 $23.75 $ 1.35
4/30/2011 $9.35 $23.75 $ 1.39
5/31/2011 $10.20 $25.91 $ 1.37
6/30/2011 $9.97 $25.32 $ 1.35
7/31/2011 $10.31 $26.19 $ 1.32
8/31/2011 $10.31 $26.19 $ 1.24
9/30/2011 $10.02 $25.46 $ 1.15
10/31/2011 $10.02 $25.46 $ 1.28
11/30/2011 $9.82 $25.47 $ 1.27
12/31/2011 $10.10 $25.30 $ 1.28
1/31/2012 $10.49 $26.28 $ 1.34
2/29/2012 $11.16 $28.03 $ 1.39
3/31/2012 $11.51 $28.90 $ 1.44
5. Results
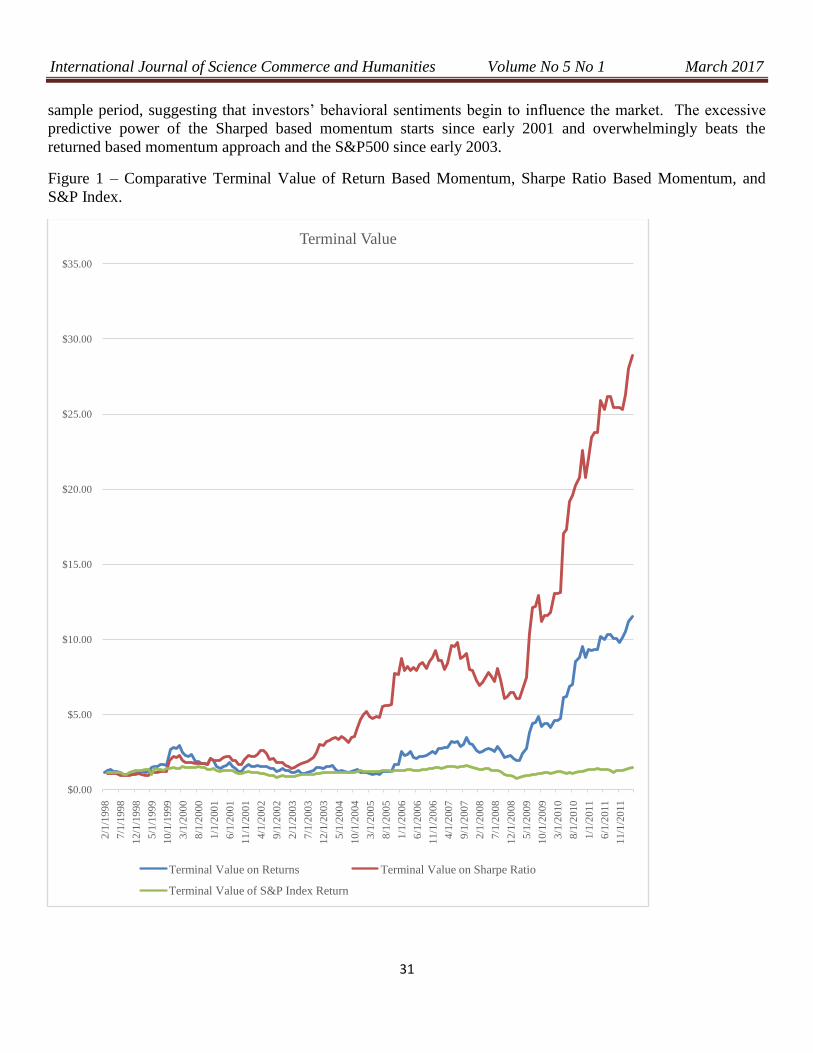
Figure 1 demonstrates that from early 1998 to March 2012, the terminal value of the initially invested $1
based on the Sharpe momentum approach is significantly greater than the terminal value of both the return
momentum approach and the S&P index over time ($28.9 vs $11.5 and $1.44). The differences of the three
portfolios are less discernable between 1998 and early 2003 than later period. The return based momentum
trading method starts to outperform the S&P index since the end of 2005 and continues till the end of the
International Journal of Science Commerce and Humanities Volume No 5 No 1 March 2017
31
sample period, suggesting that investors’ behavioral sentiments begin to influence the market. The excessive
predictive power of the Sharped based momentum starts since early 2001 and overwhelmingly beats the
returned based momentum approach and the S&P500 since early 2003.
Figure 1 – Comparative Terminal Value of Return Based Momentum, Sharpe Ratio Based Momentum, and
S&P Index.
$0.00
$5.00
$10.00
$15.00
$20.00
$25.00
$30.00
$35.00
2/1
/199
8
7/1
/199
8
12
/1/1
998
5/1
/199
9
10
/1/1
999
3/1
/200
0
8/1
/200
0
1/1
/200
1
6/1
/200
1
11
/1/2
001
4/1
/200
2
9/1
/200
2
2/1
/200
3
7/1
/200
3
12
/1/2
003
5/1
/200
4
10
/1/2
004
3/1
/200
5
8/1
/200
5
1/1
/200
6
6/1
/200
6
11
/1/2
006
4/1
/200
7
9/1
/200
7
2/1
/200
8
7/1
/200
8
12
/1/2
008
5/1
/200
9
10
/1/2
009
3/1
/201
0
8/1
/201
0
1/1
/201
1
6/1
/201
1
11
/1/2
011
Terminal Value
Terminal Value on Returns Terminal Value on Sharpe Ratio
Terminal Value of S&P Index Return
International Journal of Science Commerce and Humanities Volume No 5 No 1 March 2017
32
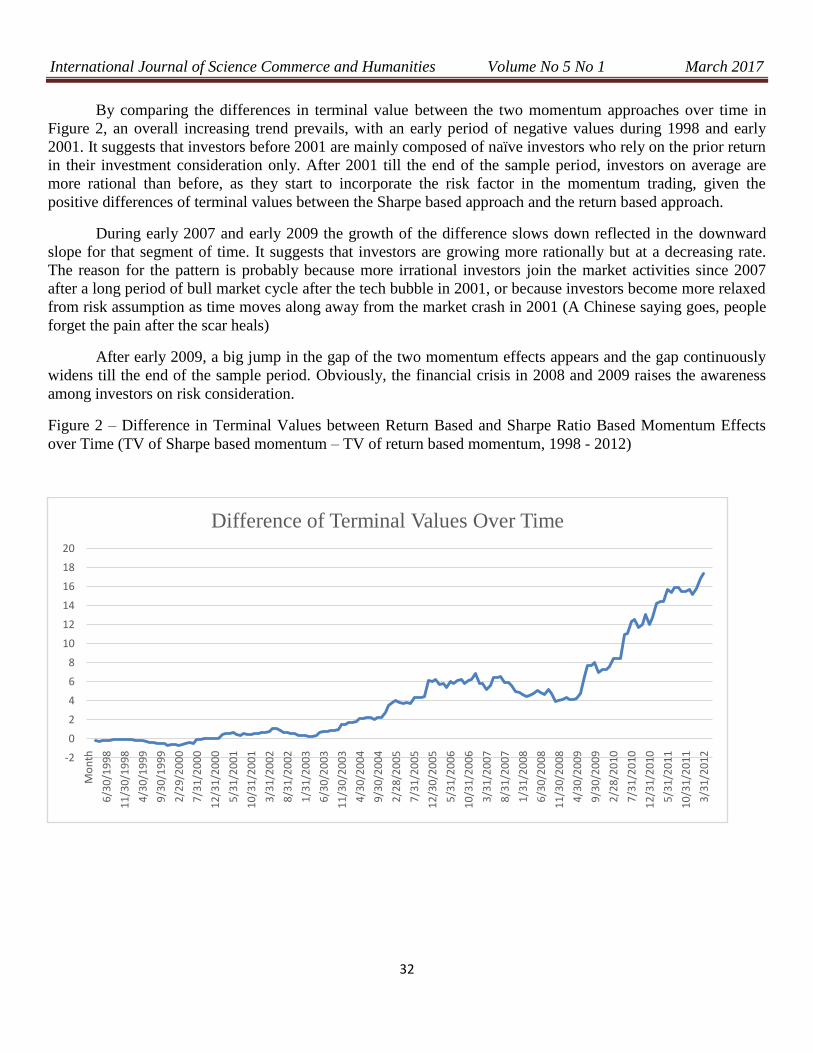
By comparing the differences in terminal value between the two momentum approaches over time in
Figure 2, an overall increasing trend prevails, with an early period of negative values during 1998 and early
2001. It suggests that investors before 2001 are mainly composed of naïve investors who rely on the prior return
in their investment consideration only. After 2001 till the end of the sample period, investors on average are
more rational than before, as they start to incorporate the risk factor in the momentum trading, given the
positive differences of terminal values between the Sharpe based approach and the return based approach.
During early 2007 and early 2009 the growth of the difference slows down reflected in the downward
slope for that segment of time. It suggests that investors are growing more rationally but at a decreasing rate.
The reason for the pattern is probably because more irrational investors join the market activities since 2007
after a long period of bull market cycle after the tech bubble in 2001, or because investors become more relaxed
from risk assumption as time moves along away from the market crash in 2001 (A Chinese saying goes, people
forget the pain after the scar heals)
After early 2009, a big jump in the gap of the two momentum effects appears and the gap continuously
widens till the end of the sample period. Obviously, the financial crisis in 2008 and 2009 raises the awareness
among investors on risk consideration.
Figure 2 – Difference in Terminal Values between Return Based and Sharpe Ratio Based Momentum Effects
over Time (TV of Sharpe based momentum – TV of return based momentum, 1998 - 2012)
-2
0
2
4
6
8
10
12
14
16
18
20
Mo
nth
6/3
0/1
99
8
11
/30
/19
98
4/3
0/1
99
9
9/3
0/1
99
9
2/2
9/2
00
0
7/3
1/2
00
0
12
/31
/20
00
5/3
1/2
00
1
10
/31
/20
01
3/3
1/2
00
2
8/3
1/2
00
2
1/3
1/2
00
3
6/3
0/2
00
3
11
/30
/20
03
4/3
0/2
00
4
9/3
0/2
00
4
2/2
8/2
00
5
7/3
1/2
00
5
12
/30
/20
05
5/3
1/2
00
6
10
/31
/20
06
3/3
1/2
00
7
8/3
1/2
00
7
1/3
1/2
00
8
6/3
0/2
00
8
11
/30
/20
08
4/3
0/2
00
9
9/3
0/2
00
9
2/2
8/2
01
0
7/3
1/2
01
0
12
/31
/20
10
5/3
1/2
01
1
10
/31
/20
11
3/3
1/2
01
2
Difference of Terminal Values Over Time
International Journal of Science Commerce and Humanities Volume No 5 No 1 March 2017
33
6. Conclusions
Our study find the existence of strong momentum effects of the AAII portfolios under both return based
and Sharpe ratio based indicator. In addition, we find that the abnormal returns based on past Sharpe ratio of
the AAII portfolios are significantly greater than those based on the past average return of the portfolios.
The fact that the risk adjusted consideration measured by Sharpe ratio is stronger in the momentum
effects over time in these trading strategies shows that investors begin to include the risks factors into their
decision making. This evidence suggests that either the investors become more sophisticated than before, or
probably more sophisticated investors come to participate in the financial trading activities. Investors used to
think on only one dimension of thought, i.e. the return only. Now investors have learned to base their judgment
on two dimensions, both risk and return in their asset management.
The increasing trend continues and the gap in the momentum effects between the two approaches
becomes wider and wider over the sample period, especially right after each major financial crisis. That the
individual investors on average grow more rational as a group. The improved rationality of investor pool is a
result of combined efforts from education and from lessons of financial losses. Our results confirms the
proposition of behavioral finance theory on the momentum study, and sheds additional light on how the
financial market should evolve in the future given the nature of investors thinking capacity.
Ultimately, the best returns and success for investors come from giving major consideration to risk of
the overall portfolio. Our study also presents valuable implications from the perspective of academic
researchers, educators, and practitioners.
References
Asness, C.S., 1994. The power of past stock returns to explain future stock returns, working paper. University
of Chicago.
Asness, C.S., Liew, J.M., Stevens, R.L., 1997. Parallels between the cross-sectional predictability of stock and
country returns. Journal of Portfolio Management 23, 79–87.
Asness, C.S., Moskowitz, T.J., Pedersen, L.H., 2013. Value and momentum everywhere. The Journal of
Finance 58, 929–985
Basu, S., 1977. Investment performance of common stocks in relation to their price-earnings ratios: A test of the
efficient market hypothesis. J. Finance, 32: 663-682.
Baker, M. and J. Wurgler, 2000. The equity share in new issues and aggregate stock returns. J. Finance, 55:
2219-2257.
Barber, B.M. and T. Odean, 1999. The courage of misguided convictions. Financial Anal. J.
Black, F., 1993. Beta and return. J. Portfolio Management, 20:8-18. DOI: 10.3905/jpm.1993.409462
Campbell, J.Y. and R.J. Shiller, 1988a. The dividendprice ratio and expectations of future dividends and
discount factors. Rev. Financial Stud., 1: 195-228. DOI: 10.1093/rfs/1.3.195

International Journal of Science Commerce and Humanities Volume No 5 No 1 March 2017
34
Campbell, J.Y. and R.J. Shiller, 1988b. Stock prices, earnings and expected dividends. J. Finance, 43: 661-676.
Davis, J.L., E.F. Fama and K.R. French, 2000. Characteristics, Covariances and Average Returns: 1929 to 1997.
J. Finance 55: 389-406. DOI: 10.1111/0022-1082.00209
De Bondt, F.M. Werner and R.H. Thaler. 1987. Further evidence on investor overreaction and stock market
seasonality. J. Finance, 42: 557-581. DOI: 10.2307/2328371
Einhorn, H.J. and R.M. Hogarth, 1986. Decision making under ambiguity. J. Bus., 59: S225-S250.
Fama, E.F.1970. Efficient capital markets: A review of theory and empirical work. J. Finance, 25: 383- 417.
DOI: 10.2307/2325486.
Fama, E.F. 1998. Market efficiency, long-term returns, and behavioral finance. J. Financial Econ., 349: 283-
306. DOI: 10.1016/S0304-405X(98)00026-9
Fama, E.F. and K.R. French, 1993. Common risk factors in the returns on stocks and bonds. J. Financial Econ.,
33: 3-56. DOI: 10.1016/0304- 405X(93)90023-5
Fama, E.F. and K.R. French, 1995. Size and book-tomarket factors in earnings and returns. J. Finance 50: 131-
155.
Fama, E.F. and K.R. French, 1996. Multifactor explanations of asset pricing anomalies. J. Finance, 51: 55-84.
Fama, E.F. and K.R. French, 1998. Dividend yields and expected stock returns. J. Financial Econ., 22: 3- 25.
DOI: 10.1016/0304-405X(88)90020-7
Hirshleifer, D. (2001). Investor psychology and asset pricing. Journal of Finance, 56, 1533–1597
Hogarth, R.M. and M.W. Reder, 1986. Editors' comments: Perspectives from economics and psychology. J.
Bus., 59: 185-207.
Israel, R., Moskowitz, T.J., 2013. The role of shorting, firm size, and time on market anomalies. Journal of
Financial Economics 108, 275–301.
Jegadeesh, N., Titman, S., 1993. Returns to buying winners and selling losers: implications for stock market
efficiency. Journal of Finance 48, 65–91.
Jegadeesh, N., Titman, S., 1995. Overreaction, delayed reaction, and contrarian profits. Review of Financial
Studies 8, 973–999.
Jegadeesh, N., Titman, S., 2001. Profitability of momentum strategies: an evaluation of alternative explanations.
Journal of Finance 56, 699–720
Kleidon, A.W., 1986. Anomalies in financial economics: Blueprint for change? J. Bus., 59: S469-S499.
Kothari, S. and J. Shanken, 1997. Book-to-market, dividend yield and expected market returns: A time-series
analysis. J. Financial Econ., 44: 169- 203. DOI: 10.1016/S0304-405X(97)00002-0
Lakonishok, J., A. Shleifer and R.W. Vishny, 1994. Contrarian investment, extrapolation and risk. J. Finance,
49: 1541-1578.

International Journal of Science Commerce and Humanities Volume No 5 No 1 March 2017
35
Moskowitz, T.J., Grinblatt, M., 1999. Do industries explain momentum? Journal of Finance 54, 1249–1290.
Moskowitz, T.J.,
Moskowitz, T.J., Ooi, Y.H., Pedersen, L.H., 2012. Time series momentum. Journal of Financial Economics
104, 228–250.
Okunev, J., White, D., 2003. Do momentum-based strategies still work in foreign currency markets? Journal of
Financial and Quantitative Analysis 38, 425–447
Rouwenhorst, K.G., 1998. International momentum strategies. Journal of Finance 53, 267–284.
Schadler, Frederick P.; Cotton, Brett D, 2008. Are the AAII Stock Screens a Useful Tool for Investors?
Financial Services Review 17 (2008) 185-201