Archaeology in the Digital Era Volume...
22
Archaeology in the Digital Era Volume II
Transcript of Archaeology in the Digital Era Volume...

Archaeology in the Digital EraVolume II

Archaeology in the Digital EraVolume II
e-Papers from the 40th Conference on Computer Applications and Quantitative
Methods in ArchaeologySouthampton, 26-30 March 2012
Edited byGraeme Earl, Tim Sly, Angeliki Chrysanthi, Patricia Murrieta-Flores, Constantinos Papadopoulos, Iza
Romanowska and David Wheatley
AMSTERDAM UNIVERSITY PRESS
Cover design: Magenta Ontwerpers, Bussum
Lay-out: Iza Romanowska
Amsterdam University Press English-language titles are distributed in the US and Canada
by the University of Chicago Press.
e-ISBN 978 90 4852 728 1 (pdf)
NUR 684
© Computer Applications and Quantitative Methods in Archaeology (CAA) /
Amsterdam University Press, Amsterdam 2013
All rights reserved. Without limiting the rights under copyright reserved above, no part of this book may be reproduced, stored in or introduced into a retrieval system, or transmitted, in any form or by any means (electronic, mechanical, photocopying, recording or otherwise) without the written permission of both the copyright owner and the author of the book.
Every effort has been made to obtain permission to use all copyrighted illustrations reproduced in this book. Nonetheless, whosoever believes to have rights to this material is advised to contact the publisher.
This e-book is published in the CAA series Computer Applications and Quantitative Methods in Archaeology.

Contents
Human Computer Interaction, Multimedia, Museums15 Towards Collaborative Decipherment of Non-Verbal Markings in Archaeology
Barbara Rita Barricelli, Stefano Valtolina, Giovanna Bagnasco Gianni and Alessandra Gobbi
21 Archaeological Documentation in the Field: the Case of the Roman Forum of CástuloAna Martínez Carrillo, Marcelo Castro, Francisco Arias de Haro and Manuel Serrano
30 Implications for the Design of Novel Technologies for Archaeological FieldworkTom Frankland and Graeme Earl
37 OpenArchaeoSurvey, or ‘Being Educated by the Digital Fieldwork Assistant’Jitte Waagen, Nils de Reus and Rogier Kalkers
48 The Use of iPad as a Documenting Tool on an Archaeological Excavation on Govče 2011 Project in North - Eastern SloveniaEva Butina
57 Back into Pleistocene Waters. The Narrative Museum of Casal de’ Pazzi (Rome)Augusto Palombini, Patrizia Gioia, Antonia Arnoldus-Huyzendveld, Marco Di Ioia and Sofia Pescarin
66 Etruscanning 3D: an Innovative Project about EtruscansEva Pietroni, Daniel Pletinckx, Wim Hupperetz and Claudio Rufa
77 Personalizing Interactive Digital Storytelling in Archaeological Museums: the CHESS ProjectLaia Pujol-Tost, Maria Roussou, Olivier Balet and Stavroula Poulou
91 Installation for Interpretation of Archaeological Sites. The Portus Visualisation ProjectJavier Pereda
102 Material Motion: Motion Analysis for Virtual Heritage ReconstructionKirk Woolford and Stuart Dunn
110 Interactive Workspace for Exploring Heterogeneous Data Uros Damnjanovic and Sorin Hermon
Simulating the Past
120 The Use of CFD to Understand Thermal Environments Inside Roman Baths: A Transdisciplinary ApproachTaylor Oetelaar, Clifton Johnston, David Wood, Lisa Hughes and John Humphrey

130 Structural Assessment of Ancient Building Components, the Temple of Artemis at CorfuGeorg Herdt, Aykut Erkal, Dina D’Ayala and Mark Wilson Jones
138 Final Results of the Virtual 3D Reconstruction of the East Pediment of the Temple of Zeus at Olympia András Patay-Horváth
146 Teaching Cultural Heritage and 3D Modelling through a Virtual Reconstruction of a Medieval CharterhouseAndres Bustillo, Ines Miguel, Lena Saladina Iglesias and Ana Maria Peña
156 3D Reconstruction in Archaeological Analysis of Medieval SettlementsDaniele Ferdani and Giovanna Bianchi
165 Handling Transparency in 3D Reconstructed Online Environments: Aquae Patavinae VR Case StudyDaniele Ferdani, Bruno Fanini, Guido Lucci Baldassari, Ivana Cerato, Sofia Pescarin
174 3D Documentation for the Assessment of Underwater Archaeological RemainsBarbara Davidde Petriaggi, Roberto Petriaggi, Gabriele Gomes de Ayala
181 Post-Excavation Analysis in Archaeology Using 3D-Technology: the Case Study of Hala Sultan TekkeKostas Anastasiades, Sorin Hermon, Nicola Amico and Giancarlo Iannone, Karin Nys
190 A New Approach for Interactive Procedural Modelling in Cultural HeritageRené Zmugg, Ulrich Krispel, Wolfgang Thaller, Sven Havemann, Martin Pszeida and Dieter W. Fellner
205 Virtual Reality Simulations in Cultural HeritageIoanneta Vergi
214 Taking Excavation to a Virtual World: Importing Archaeological Spatial Data to Second Life and OpenSimIsto Huvila and Kari Uotila
221 Using ConML to Visualize the Main Historical Monuments of CretePanagiotis Parthenios
225 A High-Performance Computing Simulation of an Irrigation Management System: The Hohokam Water Management Simulation IIJohn T. Murphy
Field and Lab Recording
232 Application of RTI in Museum ConservationEleni Kotoula
241 Automatically Recognizing the Legends of Ancient Roman Republican CoinsAlbert Kavelar, Sebastian Zambanini and Martin Kampel

250 Multispectral Imaging of Historic Handwritings Fabian Hollaus
258 Multispectral Image Analysis of a Censored Postcard from 1942Florian Kleber, Fabian Hollaus and Robert Sablatnig
264 Semantic Web Technologies Applied to Numismatic CollectionsEthan Gruber, Sebastian Heath, Andrew Meadows, Daniel Pett, Karsten Tolle and David Wigg-Wolf
275 Automatic Coin Classification and IdentificationReinhold Huber-Mörk
289 Archiving Three-Dimensional Archaeology: New Technologies, New Solutions?Kieron Niven, Stuart Jeffrey and Julian D. Richards
295 Intra-Site Analysis and Photogrammetry: the Case Study of the ‘Buca Di Spaccasasso’ (Grosseto, Italy) an Eneolithic Funerary SiteGiovanna Pizziolo, Daniele Pirisino, Carlo Tessaro and Nicoletta Volante
308 Site Recording Using Automatic Image Based Three Dimensional Reconstruction Techniques Victor Ferreira, Luís Mateus and José Aguiar
316 Photographic Rectification and Photogrammetric Methodology Applied to the Study of Construction Process of Provicial Forum of TarracoM. Serena Vinci
324 Image-Based 3D Documentation of Archaeological Trenches Considering Spatial, Temporal and Semantic AspectsRobert Wulff and Reinhard Koch
337 Digital Photogrammetry: a Contribution to the Study of Early Middle Ages Sarcophagi Quarries of Panzoult (Indre-et-Loire, France)Daniel Morleghem
344 Low-Cost Photogrammetry and 3D Scanning: the Documentation of Palaeolithic Parietal Art in El Niño CaveAlejandro García Moreno and Diego Garate
350 3D Documentation in Archaeology: Recording Las Cuevas Site, Chiquibul Reserve, BelizeFabrizio Galeazzi, Holley Moyes and Mark Aldenderfer
363 Social Spreading of Geometric, Recorded Data from a Range of Types of 3D Scanners via a Web Data ServerJorge Angas and Paula Uribe
376 Combining Terrestrial Laser Scanning and Techniques of Digital Image Processing in “Archaeology of the Architecture” Analysis in the Walls of the Andalusian Site of Vascos (Navalmoralejo, Toledo-Spain)María J. Iniesto-Alba, Miguel A. Bru Castro, Estela Paradelo Fernández and Pablo Carballo Cruz
386 3D Model of the Roman Walls of Lugo (Galicia, Spain) Using a Terrestrial Laser Scanner and an Unmanned Aerial VehicleMaría J. Iniesto-Alba, Alicia Canizares-Sánchez, David Miranda and Rafael Crecente
398 (Re)seeing the Engraved Block of El Mirón Cave (Ramales de la Victoria, Cantabria, Spain)Vera Moitinho de Almeida, Luis Teira, Manuel González-Morales, Lawrence G. Straus, Millán Mozota and Ana Blasco
406 Meshlab as a Complete Open Tool for the Integration of Photos and Colour with High-Resolution 3D Geometry Data Marco Callieri, Guido Ranzuglia, Matteo Dellepiane, Paolo Cignoni and Roberto Scopigno
417 Enhancing Surface Features with the Radiance Scaling Meshlab PluginXavier Granier, Romain Vergne, Romain Pacanowski, Pascal Barla and Patrick Reuter
422 OpeninfRA – Storing and Retrieving Information in a Heterogeneous Documentation SystemAlexander Schulze, Frank Henze, Felix F. Schäfer, Philipp Gerth and Frank Schwarzbach
432 Towards Reverse Engineering Archaeological ArtefactsVera Moitinho de Almeida and Juan Anton Barceló
Data Analysis, Modelling and Sharing 444 ARCA: Creating and Integrating Archaeological Databases
Maria del Carmen Moreno Escobar
457 A Database for Radiocarbon Dates. Some Methodological and Theoretical Issues about its ImplementationIgor Bogdanović, Juan Antonio Barceló and Giacomo Capuzzo
468 Standardised Vocabulary in Archaeological DatabasesMatthias Lang, Geoff Carver and Stefan Printz
474 Modelling Imperfect Time in DatasetsKoen Van Daele
480 Distribution Analysis of Bone Remains in the Prehistoric Site of Mondeval De Sora (Belluno - Italy): Issues and ProposalsMaria Chiara Turrini, Federica Fontana, Antonio Guerreschi and Ursula Thun Hohenstein
487 Places, People, Events and Stuff; Building Blocks for Archaeological Information SystemsPaul J. Cripps
498 ArcheoInf, the CIDOC-CRM and STELLAR: Workflow, Bottlenecks, and Where do we Go from Here?Geoff Carver
509 @OccupyWatlingStreet: Can we find out Who was occupying What, Where and When in the Past?Keith May

520 Connecting Archaeology and Architecture in Europeana: the Iberian Digital CollectionsAna Martínez Carrillo, Arturo Ruiz and Alberto Sánchez
527 Open Access Journals in Archaeology and OpenAccessArchaeology.orgDoug Rocks-Macqueen
533 SVG Pottery: Upgrading Pottery Publications to the Web AgeStefano Costa
541 Through an Urban Archaeological Data Model Handling Data ImperfectionAsma Zoghlami, Cyril de Runz, Dominique Pargny, Eric Desjardin and Herman Akdag
551 Guerrilla Foursquare: a Digital Archaeological Appropriation of Commercial Location-Based Social NetworkingAndrew Dufton and Stuart Eve
558 Conceptualising eScience for Archaeology with Digital Infrastructures and Socio-Technical DynamicsTeija Oikarinen and Helena Karasti
Geospatial Technologies and Analysis570 Intrasite Spatial Analysis of the Cemeteries with Dispersed Cremation Burials
Marge Konsa
575 A Specific Approach for a Peculiar Site: New Spatial Technologies for Recording and Analysing a Palaeolithic Site (the Cave of La Garma, Northern Spain)Alfredo Maximiano, Pablo Arias and Roberto Ontañón
584 Use of Quantitative Methods to Study an Alpine Rock Art Site: the Mont Bego RegionThomas Huet
592 “The Whole is More than the Sum of its Parts”- Geospatial Data Integration, Visualisation and Analysis at the Roman Site of Ammaia (Marvão, Portugal)Eleftheria Paliou and Cristina Corsi
608 Scattered Chronology - Surface Artefact Survey and Spatial Analysis of Ceramic ConcentrationsOndrej Malina and Jakub Silhavy
617 Ecological and Social Space in the High Mountains in South Norway 8500 – 2000 BP Espen Uleberg and Ellen Anne Pedersen
624 Chalcolithic Territorial Patterns in Central Moldavia (Iaşi County, Romania)Robin Brigand, Andrei Asăndulesei, Olivier Weller and Vasile Cotiugă
636 Settlement Patterns in Drahany Uplands (Czech Republic): GIS and Quantitative Methods Based ApproachLukáš Holata

645 Rural Life in Protohistoric Italy: Using Integrated Spatial Data to Explore Protohistoric Settlement in the SibaritideKayt Armstrong and Martijn van Leusen
655 Reconstructing the Ancient Cultural Landscape Around Pompeii in 2D and 3D: from Scientific Data to a Computer Animated Museum ExhibitSebastian Vogel, David Strebel, Michael Märker and Florian Seiler
662 Using GIS to Reconstruct the Roman Centuriated Landscape in the Low Padua Plain (Italy)Michele Matteazzi
670 Integrating Spatial Analyses into Foraging Societies Land Use Strategies. A Case Study from the Nalón River Basin (Asturias, North of Spain)Alejandro García, Miguel Angel Fano and Diego Garate
678 Lost Worlds: A Predictive Model to Locate Submerged Archaeological Sites in SE Alaska, USAKelly R. Monteleone, E. James Dixon and Andrew D. Wickert
694 Familiar Road, Unfamiliar Ground. Archaeological Predictive Modelling in HungaryGergely Padányi-Gulyás, Máté Stibrányi, Gábor Mesterházy and Márton Deák
710 Mathematical Models for the Determination of Archaeological PotentialNevio Dubbini and Gabriele Gattiglia
720 Calculating AccessibilityIrmela Herzog
735 Simulated Paths, Real Paths? A Case Study of Iberian Cessetania (Iron Age Society)Joan Canela Gràcia
742 Open Source GIS for Archaeological Data: Two Case Studies from British and Egyptian ArchaeologyAnna Kathrin Hodgkinson, Luca Bianconi and Stefano Costa
752 Speeding up Georeferencing with Subpixel AccuracyGianluca Cantoro
761 Multi+ or Manifold Geophysical Prospection?Apostolos Sarris
771 Managing Data from Multiple Sensors in an Interdisciplinary Research CruiseØyvind Ødegård, Martin Ludvigsen, Geir Johnsen, Asgeir J. Sørensen, Stefan Ekehaug and Fredrik Dukan and Mark Moline
781 Towards Detection of Archaeological Objects in High-Resolution Remotely Sensed Images: the Silvretta Case StudyKarsten Lambers and Igor Zingman

792 ArcheOS and UAVP, a Free and Open Source Platform for Remote Sensing: the Case Study of Monte S. Martino ai Campi of Riva del Garda (Italy)Alessandro Bezzi, Luca Bezzi, Rupert Gietl and Nicoletta Pisu
800 The Visualization of the Archaeological Information through Web Servers: from Data Records on the Ground to Web Publication by Means of Web Map Services (WMS)Julio Zancajo, Teresa Mostaza and Mercedes Farjas
Theoretical Approaches and Context of Archaeological Computing
807 Crafting Archaeological Methodologies: Suggesting Situational Method Engineering for the Humanities and Social SciencesCésar Gonzalez-Perez and Charlotte Hug
821 Boundary Concepts For Studying the Built Environment. A Framework of Socio-Spatial Reasoning for Identifying and Operationalising Comparative Analytical Units in GISBenjamin Vis
839 Everything Flows: Computational Approaches To Fluid LandscapesDimitrij Mlekuž
846 Reliability of the Representation of a Distribution: a Case Study on Middle Bronze Age Metal Finds in the Seine ValleyEstelle Gauthier and Maréva Gabillot
854 Assessing Positional Uncertainty due to Polygon-to-Point Collapse in the Cartographic Modelling of Archaeological Scatters Fernando Sanchez and Antoni Canals
863 Theoretical Space-Time Modelling of the Diffusion of Raw Materials and Manufactured ObjectsEstelle Gauthier, Olivier Weller, Jessica Giraud, Robin Brigand, in collaboration with: Pierre Pétrequin and Maréva Gabillot
874 A Tangible ChronologyJean-Yves Blaise and Iwona Dudek
888 Reconstructing Fragments: Shape Grammars and Archaeological ResearchMyrsini Mamoli and Terry Knight
897 Grammar Modelling and the Visualisation of an Uncertain Past: the Case of Building 5 at PortusMatthew Harrison, Simon Keay and Graeme Earl
912 Can Infovis Tools Support the Analysis of Spatio-Temporal Diffusion Patterns in Historic Architecture?Jean-Yves Blaise and Iwona Dudek

926 History in 3D: New Virtualization Techniques for Innovative Architectural and Archaeological Scholarship and EducationJames C. Sweet, Krupali Krusche, Christopher R. Sweet, and Paul Turner
939 Investigating the Effectiveness of Problem-Based Learning in 3D Virtual Worlds. A Preliminary Report on the Digital Hadrian’s Villa ProjectLee Taylor-Nelms, Lynne A. Kvapil, John Fillwalk and Bernard Frischer
949 Building Blocks of the Lost Past: Game Engines and Inaccessible Archaeological SitesAnna Maria Kotarba-Morley, Joe Sarsfield, Joe Hastings, John Bradshaw and Peter Nicholas Fiske
961 Re-reading the British Memorial: A Collaborative Documentation ProjectNicole Beale and Gareth Beale

13
Foreword
This volume is an extension of the printed volume “Archaeology in the Digital Era. Papers from the 40th Annual Conference of Computer Applications and Quantitative Methods in Archaeology (CAA), Southampton, 26-29 March 2012. It consists of a selection of the peer-reviewed papers presented at the Computer Applications and Quantitative Methods in Archaeology 2012 conference hosted by the Archaeological Computing Research Group at the University of Southampton, UK between 26th and 30th March 2012. The conference included 53 sessions divided between the themes of simulating the past, spatial analysis, data modelling and sharing, data analysis, management, integration and visualisation, geospatial technologies, field and lab recording, theoretical approaches and the context of archaeological computing, and a general theme. In addition there were 12 workshops. A total of 380 papers and posters were presented, and two key note addresses. Alongside the lively conference atmosphere at the venue there was a thriving social media back channel. In addition to these proceedings there is therefore a broad ranging multimedia record of the event, accessible via the conference website.
The co-organisers of CAA2012 and myself would like to thank the CAA Steering Committee for their advice and assistance. We are also indebted to Professor Anne Curry (Dean of Faculty of Humanities) and Professor Jonathan Adams (Head of Archaeology) for their support and encouragement. Many individuals and organisations in Southampton and further afield, including the sponsors and exhibitors, contributed to making the conference such a success. Of course without the many delegates travelling from across the globe and offering such exciting contributions there could have been no conference, and we are very grateful to them for their lively contributions to all aspects of the event. Finally, we would like to offer our thanks to the superb team of volunteers that made CAA2012 possible. The Archaeological Computing Research Group at Southampton was very proud indeed to be able to host the 40th CAA conference and we know that this was demonstrated by the enthusiasm, dedication and professionalism of the postgraduate and undergraduate students that gave so much of their time to the event.
I very much hope that you enjoy these proceedings and all the many related outputs from CAA2012, and I look forward to seeing you at future CAA conferences.
Graeme Earl
Southampton, United Kingdom, November 2012

Human Computer Interaction, Multimedia, Museums

308
1. Introduction
Traditionally the archaeological recording is based on direct measurements made upon a grid set up on field. Used as a coordinate frame it supports manual drawing done on sheets of paper. The setting out of the grid could be accomplished with the use of a theodolite. Total stations allowed not to materialize a grid on field and to consider it only conceptually. Either way, the recording is always based on the discretization of the archaeological structure towards a two-dimensional representation. In recent times, the use of terrestrial laser scanning (TLS) resulted in a much faster and reliable way of recording with the advantage of three dimensional data acquisition (Borrazás et al 2008) (Mateus et al 2008) (Costantino 2010). Usually it is either used to generate colour orthoimages or to enable direct 3D drawing. Field recording is relatively straightforward but we think it is still an expensive technology requiring an high level of expertise.
The very recent developments of automated three dimensional recording techniques based in images brought a new set of opportunities for the archaeological recording that, in some circumstances, present advantages with respect to TLS. Examples of
Corresponding author: [email protected]
commercial software tools that implement this kind of techniques are Image Master (http://www.topconpositioning.com/products/software/office-applications/imagemaster), Photomodeler Scanner (http://www.photomodeler.com/products/pm-scanner.htm) and PhotoScan (http://www.agisoft.ru/products/photoscan). There are also free web services - My3DScanner (http://www.my3dscanner.com/), Microsoft Photosynth (http://photosynth.net/); Arc3D (http://www.arc3d.be/), Autodesk 123D Catch (http://www.123dapp.com/catch), and freeware software available on the internet such as VisualSFM (http://www.cs.washington.edu/homes/ccwu/vsfm), Photosynth toolkit (http://www.visual-experiments.com/2010/08/19/my-photosynth-toolkit/), and PMVS/CMVS (http://grail.cs.washington.edu/software/cmvs/). All these freeware tools are based in the structure-from-motion (SFM) approach for camera orientation and in the multi-view-stereo approach (MVS) for dense point cloud reconstruction.
In this article, we present three case studies in the “Convento de Cristo” UNESCO World Heritage site in Tomar, Portugal. It was used a combination of Visual SFM - Visual Structure From Motion (Wu 2007) (Wu 2011) and PMVS/CMVS - Clustering views for
Site Recording Using Automatic Image Based Three Dimensional Reconstruction Techniques
Victor Ferreira, Luís Mateus and José AguiarUniversidade Técnica de Lisboa, Portugal
Abstract: The objectives of this paper are to demonstrate that image based three dimensional reconstruction techniques, such as structure from motion (SFM) and multi-view-stereo (MVS) enable the production of documentation with comparable quality to the one produced with terrestrial laser scanning (TLS). We start by demonstrating that proposition and then, will present two more case studies where those techniques were used to produce data for the archaeological recording. In one of those, SFM/MVS was combined with TLS, providing a new layer of information after excavation was done.
Keywords: PHotogrammetry, Structure From Motion, Archaeology, Terrestrial Laser Scanning, Point Clouds

Site Recording Using Automatic Image Based Three Dimensional Reconstruction Techniques Victor Ferreira, Luís Mateus and José Aguiar
309
Multi-View Stereo / Patch-based multi-view stereo software (Furukawa and Ponce 2009) (Furukawa et al. 2009). The reason for this choice, although it may not ensure the most accurate results, is due to free access to the software and with the possibility of controlling all the process since the processing is done locally. It was also important to assess to what extent these freeware tools can provide reliable results.
First we start by demonstrating that image based techniques, such as the selected ones, can provide data with acceptable metric quality when compared with TLS, using an example where the highly decorated “Janela Manuelina” of the “Convento de Cristo” was recorded.
Secondly we discuss the case of “Pátio dos Carrascos” where those techniques were used to retrieve data for the archaeological recording. We demonstrate that the semantic quality of the data was suited to the archaeological recording. By semantic quality we mean visual qualities of the obtained materials that can be used for the archaeological interpretation and analysis.
And thirdly we discuss the case of “Paços do Infante”, where these image based techniques allowed the generation of 3D data defining a new layer of information added to a previously survey done with TLS. This operation allowed showing that both surveys have comparable performances both in metric and semantic aspects. It further allowed to visually depict the amount of excavation that was done.
2. The SFM/MVS Workflow
In general, image based three dimensional reconstruction workflow can be divided in two stages: i) image acquisition, and ii) image processing.
The first stage has to follow some specific rules to enable a more successful processing which is almost unattended with the SFM/MVS
approach. It is recommended that features to be reconstructed should appear in three or more images. Images have to be redundant, and consecutive images should be taken with small base distances. The total number of images can be several hundreds. The final spatial resolution of the point cloud models is directly related with the camera distance to the object and with image resolution.
The processing stage consists on the following steps: i) feature detection in images, ii) image matching, iii) camera calibration, iv) camera orientation (relative orientation), and v) geometry reconstruction. In the SFM/MVS approach, geometry reconstruction occurs in two steps: i) sparse reconstruction, and ii) dense reconstruction. Usually, dense reconstruction uses data retrieved in the previous step as input data. The user only has to select what images are going to be processed and to define a set of parameters that will have effect on the quality and density of the reconstruction. After the reconstruction is complete, it is possible to scale and orient the model for further processing (ortho image generation, mesh generation). Until recent times these steps were done manually (Mateus 2008) (Almagro 2008) (Drap 2009). It was a cumbersome and time consuming task where an operator had to pick multiple points on multiple images. Today it is possible to perform all those steps in a fully automatic way. We may coin this form of photogrammetry as automatic digital photogrammetry (ADP).
In our examples, for the sparse reconstruction we used the software VSFM and for the dense reconstruction we used the software CMVS/PMVS. This last tool uses the processing data produced in the first processing stage by VSFM, and has two steps: i) clustering of groups of images (CMVS) and ii) dense reconstruction of 3d points (PMVS).
CMVS analyzes the image data, and tries to divide it in groups that have highly

CAA2012 Proceedings of the 40th Conference in Computer Applications and Quantitative Methods in Archaeology, Southampton, United Kingdom, 26-30 March 2012
310
correlated images, and with some of them also in the other groups. The maximum size of the groups is selected by the user and is dependent of several factors: image size, available RAM (critical factor), processing time. Normally, in the first time a job is processed, the user should test the group size to make sure the processing does not exceed the available RAM. CMVS creates files with processing options for each group created, so PMVS (in the next stage), knows how to process them.
PMVS is invoked, processing each group sequentially. It is also possible to divide the groups by several computers shortening the total time of processing.
There are a set of parameters that have to be adjusted in order to control the reconstruction. Some relevant parameters are level, csize, minImageNum, CPU, quad, maxAngle. Basically, with these parameters it is possible to control the downsampling of the original images, the density of reconstructions, the minimum number of images where a point as to be visible to be reconstructed, the number of CPUs to be used, the noise of the reconstructions, and the angle between homologous rays. Full documentation about the meaning of these parameters and default values used can be found in PMVS home page (http://grail.cs.washington.edu/software/pmvs/documentation.html). When starting to use PMVS, one can use it with the default configuration (that is acceptable to the average object), or change the parameters, in order to get a better result, depending on the purpose of the final model.
This automatic approach is highly dependent on the texture of objects since the algorithms used rely on matching features identified in multiple images. So, features must exist, otherwise automatic reconstruction is not possible. Usually, historic buildings are rich in textures. This can result in very dense textured point clouds that in some cases can equal or supersede, in density, the TLS point clouds.
3. Case Studies
Here we describe the image acquisition strategy, the processing workflow, the results obtained and the comparisons with the other recording techniques referred (traditional techniques and TLS). In Fig. 1 the three recorded places are identified.
3.1. Assessing the Metric Quality of a SFM/MVS Point Cloud Model - “Janela Manuelina”
One of the more known places of the “Convento de Cristo” is the famous “Janela Manuelina”. It is a very complex and detailed piece of sculpture that presents a serious challenge of recording. It measures approximately 5mx12m. To be able to accomplish a full and comprehensive photographic recording we used a telescopic mast. This enabled us to get images from higher angles, so that blind spots could be minimized. We also defined an approximate half circular pattern to displace the camera ensuring that small base distances were kept. Compliance with this principle was assured both vertically and horizontally.
The images were then processed with VisualSFM software, making a sparse reconstruction and then using CMVS/PMVS software for the dense reconstruction phase. In figure 2 we can see the feature detection in images (Fig. 2A) and the overall matching between images (Fig. 2B) here represented as a
Figure 1. “Janela Manuelina” (A), “Pátio dos Carrascos” (B), “Paços do Infante” (C).

Site Recording Using Automatic Image Based Three Dimensional Reconstruction Techniques Victor Ferreira, Luís Mateus and José Aguiar
311
matching matrix where the color means a level of correspondence probability.
CMVS/PMVS starts by clustering images in smaller sets that can be processed within the available RAM. Then, these groups of images, called options, are processed one at a time to retrieve dense point clouds. All the point clouds are in the same coordinate frame and have the same scale, but adicional ground control points are needed to scale the final model to its real size. Table 1 shows some relevant data about this case study, namely about data recorded, hardware and software used, and processing parameters.
It is important to notice that the spatial resolution of the reconstructions is also dependent of the camera distance to the objects, meaning that closer distances allow denser reconstructions but require more images to cover similar areas. The distances from camera to object ranged from 2m to 15m. A very dense point cloud model was obtained, with more than one point per square millimetre (Fig. 3), with approximately 130 million points.
Scale and orientation were done against a terrestrial laser scanning point cloud. That survey was done with a time-of-flight (TOF) scanner with an average point density of 5mm. Twenty one homologous points between the two models were selected. From those points, scale and orientation was recovered. The registration error was about 9mm. In part, this error is due to manual point selection over reflectance laser data. Then a mesh was generated from the TLS point cloud. This mesh was set as a reference to inspect the ADP point cloud. This task was performed using MeshLab software. Before inspection, the ADP point cloud was downsampled to approximately 5mm point spacing. Using a colour code, distances were mapped in the reference mesh (Fig. 4).
Visual analysis of the results shows that generally the differences are below one centimeter. Bigger differences occur in the areas where the TLS mesh resulted from interpolation of points over void areas. This shows that an image based approach can provide reliable and
Figure 2. A) SIFT feature detection, B) Matching matrix between images.
Table 1. Metadata about “Janela Manuelina” case study.
Figure 3. A) Global view of the point cloud model, B) Detailed view, C) Detailed view where point density can be observed.

CAA2012 Proceedings of the 40th Conference in Computer Applications and Quantitative Methods in Archaeology, Southampton, United Kingdom, 26-30 March 2012
312
accurate data when compared with TLS data assumed as ground truth.
3.2 “Pátio dos Carrascos”
The need for this survey came from a demand for stratigraphical analysis in an area where an architectural intervention is being planned. An ancient pavement was uncovered with the excavation and recording was needed.
The archaeological recording is usually done stone by stone. In order to do this, a large number of points have to be identified for proper depiction of the features of each element. This can be easily done over images, for instance rectified images. However, for three dimensional objects, this technique is not very suited. In this case, ortho images are more adequate, but they require a 3D model from which to be extracted. And this, until recently, was a very time consuming task and had to be done manually or semi-automatically. To
overcome this issue, we used the ADP (SFM/MVS) approach. In table 2 it is presented some data about the processing of this case study.
A 3D point cloud model was generated with approximately eight million points over an area of 110 square meters, corresponding to an average point density of seven points per square centimetre. The generated point cloud model was then scaled and oriented using four topographic control points measured with a total station and manually identified in the point cloud model. Small ink marks were painted on site to make points identification easier for the operator. The registration error was under 9mm. After this step, an orthoimage was exported and delivered to the archaeologists that used it to draw the relevant features for their analysis as it is shown in figure 5.
Figure 4. Inspection of the ADP point cloud metric quality having a mesh generated from TLS point cloud as reference. In the left side it represented the histogram of the mapping distances.
Table 2. Metadata about “Pátio dos Carrascos” case study.
Figure 5. 3D view of point cloud model (A);orthoimage generated from the point cloud (B) and stratigraphical analysis (C) done over the image.
Site Recording Using Automatic Image Based Three Dimensional Reconstruction Techniques Victor Ferreira, Luís Mateus and José Aguiar
313
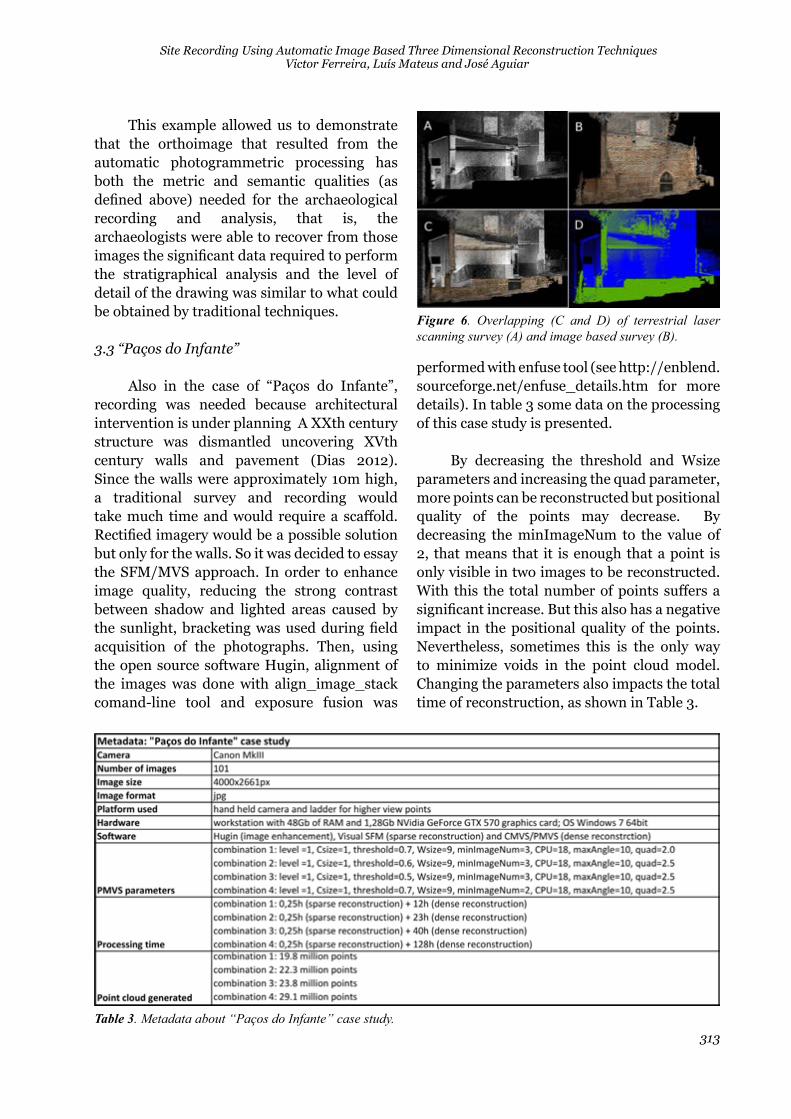
This example allowed us to demonstrate that the orthoimage that resulted from the automatic photogrammetric processing has both the metric and semantic qualities (as defined above) needed for the archaeological recording and analysis, that is, the archaeologists were able to recover from those images the significant data required to perform the stratigraphical analysis and the level of detail of the drawing was similar to what could be obtained by traditional techniques.
3.3 “Paços do Infante”
Also in the case of “Paços do Infante”, recording was needed because architectural intervention is under planning A XXth century structure was dismantled uncovering XVth century walls and pavement (Dias 2012). Since the walls were approximately 10m high, a traditional survey and recording would take much time and would require a scaffold. Rectified imagery would be a possible solution but only for the walls. So it was decided to essay the SFM/MVS approach. In order to enhance image quality, reducing the strong contrast between shadow and lighted areas caused by the sunlight, bracketing was used during field acquisition of the photographs. Then, using the open source software Hugin, alignment of the images was done with align_image_stack comand-line tool and exposure fusion was
performed with enfuse tool (see http://enblend.sourceforge.net/enfuse_details.htm for more details). In table 3 some data on the processing of this case study is presented.
By decreasing the threshold and Wsize parameters and increasing the quad parameter, more points can be reconstructed but positional quality of the points may decrease. By decreasing the minImageNum to the value of 2, that means that it is enough that a point is only visible in two images to be reconstructed. With this the total number of points suffers a significant increase. But this also has a negative impact in the positional quality of the points. Nevertheless, sometimes this is the only way to minimize voids in the point cloud model. Changing the parameters also impacts the total time of reconstruction, as shown in Table 3.
Table 3. Metadata about “Paços do Infante” case study.
Figure 6. Overlapping (C and D) of terrestrial laser scanning survey (A) and image based survey (B).

CAA2012 Proceedings of the 40th Conference in Computer Applications and Quantitative Methods in Archaeology, Southampton, United Kingdom, 26-30 March 2012
314
The final point cloud model was scaled and aligned to a previously TLS survey of the site, made before excavation. Four homologous points were manually identified in both point cloud models in areas that remained unchanged during excavation. In figure 6 we have represented the site before excavation (Fig. 6A) where a TLS survey was done, after excavation (Fig. 6B) where a ADP survey was done, and the overlapping of both surveys (Figs. 6C and 6D).
The error of this registration was approximately 2cm. This may be explained by the chosen combination of parameters, particularly the “minImageNum”, leading to a more noisy reconstruction with less positional quality. Nevertheless, the overall quality of the model was suited to generate ortho images of the plans, at the scale needed, to be analysed by the archaeologists. The overlapping of both surveys also enabled a visual perception of the amount of excavation that was done, and of the position of the uncovered features (Fig. 6D).
4. Conclusions
It can be suggested that image based three dimensional reconstruction techniques (ADP), such as the ones referred, can present themselves as effective and low time consuming ways of maintaining a site recording always up to date, using only standard uncalibrated digital cameras for data acquisition. It should be added that the three dimensional reconstruction is almost unattended and automatic, what doesn’t happen with the traditional photogrammetric approaches.
One the advantages of an image based approach over terrestrial laser scanning is that it is more versatile, and in our opinion the handling of a camera is much easier even for non experts than the handling of a scanner. For instance, a camera can be easily placed in a mast, in a drone to record higher parts of a building, an underwater camera can be used in rivers or ocean sites, a macro lens can be
used for smaller scale objects, and photos can be immediately processed, can be transmitted and processed at a distance, or just archived for later processing and historic reference (without the need for immediate processing). One of the disadvantages is that it is always needed extra information to scale and orient the models. This extra information can be collected with other measuring systems.
In our opinion, the possibility of recovering the geometry and texture of a site, with a method that uses standard photographic cameras, that can be easily learned, and is extremely versatile regarding the use scenarios, represents a new field of opportunities, specially for the low budget archaeological recording and analysis. Regarding the image processing, the availability of freeware, open source software and free online services, represents a democratization of the access to three dimensional processing that was not possible before.
With the appropriate setting of parameters it was shown that SFM/MVS has an acceptable metric performance when compared to TLS as it was shown with the first case study where discrepancies were generally under one centimeter. The fact that colour generation in ADP point cloud models is part of the overall geometric processing also represents an advantage when comparing with TLS. Colour is a very important quality of the data generated (ortho images for instance) for the archaeologist interpretation and analysis. Notice that in TLS colour acquisition and mapping is always an extra step of the processing.
The issue with these techniques is the hardware requirements, namely the processing performance of the computers, available RAM in the GPU (when using software that makes use of the GPU - the case of VSFM) and available RAM in the operating system (from 8GB for the smaller projects, to as many as 48GB or even 96GB for the bigger projects).

Site Recording Using Automatic Image Based Three Dimensional Reconstruction Techniques Victor Ferreira, Luís Mateus and José Aguiar
315
Acknowledgements
The authors wish to thank to FCT (Foundation for Science and Technology) for funding the research where the present work was integrated, namely the research project “Contributions to Architectural Heritage Conservation: Documentary Methodology based in terrestrial digital photogrammetry and 3D Laser scanning”, ref.:PTDC/AUR/66476/2006.
References
Almagro, A. 2008. “The califal gate of Gormaz Castle.” Arqueologia de la Arquitectura 5: 55-77.
Borrazás, P. M., R. Blanco-Rotea, and A. R. Paz. 2008. “Application of Terrestrial Laser Scanning to recording and analysis of Building Heritage: case study of Santa Eulála de Bóveda (Lugo) and San Fiz de Solovio (Santiago de Compostela).” Arqueologia de la Arquitectura 5: 15-32.
Costantino, D., M. G. Angelini, and G. Caprino. 2010. “Laser Scanner survey of an international site - scala di Fiurno (Lecce, Italy).” International Archives of Photogrammetry, Remote Sensing and Spatial Information Sciences XXXVIII (5): 178-183.
Dias, A. C. 2012. “O Castelo dos Templários e o Convento de Cristo à luz das recentes escavações arqueológicas.” In Proceedings of I Colóquio Internacional Cister, os Templários e a Ordem de Cristo. Tomar, edited by J. Carreiras, and G. Vairo, 301-322. Tomar: Instituto Politécnico de Tomar.
Drap, P., J. Seinturier, J.-C. Chambelland, G. Gaillard, H. Pires, G. Vannini, M. Mucciotti, and E. Pruno. 2009. ”Going back to Shawback (Jordan) and getting the data back: towards a 3D GIS dedicated to medieval archaeology.” ISPRS archives XXXVIII (5)/W1: 1-8.
Furukawa, Y., and J. and Ponce. 2009. “Accurate, Dense and Robust Multi-view Stereopsis.” IEEE Transactions on Pattern Analysis and Machine Intelligence (PAMI 2009) 32 (8):1362-1376.
Furukawa Y., B. Curless, S. Seitz, and R. Szeliski. 2009. “Clustering Views for Multi-View Stereo.” Accessed December 2011. http://grail.cs.washington.edu/software/cmvs.
Mateus L., L. Fontes, J. Aguiar, S. Catalão, N. Botica, and F. Agostinho. 2008. “A report on multiple approaches to the S. Frutuoso of Montélios Chapel survey.” In Proceedings of the 9th International Symposium on Virtual Reality, Archaeology and Cultural Heritage – VAST 2008, edited by M. Ashley, S. Hermon, A. Proença, and K. Rodriguez-Echavaria, 51-55. Braga: Departamento de Informática, Universidade do Minho.
Wu, C. 2007. “SIFTGPU: An Implementation of Scale Invariant Feature Transform (SIFT).” Accessed December 2011. http://cs.unc.edu/~ccwu/siftgpu.
Wu, C. 2011 “Visual Structure From Motion.” Accessed December 2011. http://www.cs.washington.edu/homes/ccwu/vsfm.