Aquatic effect and risk assessment for plant protection...
150
C.E. Smit, G.H.P. Arts, T.C.M. Brock, T.E.M. ten Hulscher, R. Luttik and P.J.M. van Vliet C.E. Smit, G.H.P. Arts, T.C.M. Brock, T.E.M. ten Hulscher, R. Luttik and P.J.M. van Vliet Evaluation of the Dutch 2011 proposal Aquatic effect and risk assessment for plant protection products
Transcript of Aquatic effect and risk assessment for plant protection...

C.E. Smit, G.H.P. Arts, T.C.M. Brock, T.E.M. ten Hulscher, R. Luttik and P.J.M. van Vliet
Alterra Wageningen UR is the research institute for our green living environment. We offer a combination of practical and scientific research in a multitude of disciplines related to the green world around us and the sustainable use of our living environment, such as flora and fauna, soil, water, the environment, geo-information and remote sensing, landscape and spatial planning, man and society.
The mission of Wageningen UR (University & Research centre) is ‘To explore the potential of nature to improve the quality of life’. Within Wageningen UR, nine specialised research institutes of the DLO Foundation have joined forces with Wageningen University to help answer the most important questions in the domain of healthy food and living environment. With approximately 30 locations, 6,000 members of staff and 9,000 students, Wageningen UR is one of the leading organisations in its domain worldwide. The integral approach to problems and the cooperation between the various disciplines are at the heart of the unique Wageningen Approach.
Alterra Wageningen URP.O. Box 47 6700 AA WageningenThe Netherlands T +31 (0) 317 48 07 00www.wageningenUR.nl/en/alterra
Alterra Report 2463 ISSN 1566-7197
C.E. Smit, G.H.P. Arts, T.C.M. Brock, T.E.M. ten Hulscher, R. Luttik and P.J.M. van Vliet
Evaluation of the Dutch 2011 proposal
Aquatic effect and risk assessment for plant protection products


Aquatic effect and risk assessment for plant protection products
Evaluation of the Dutch 2011 proposal
C.E. Smit1, G.H.P. Arts2, T.C.M. Brock2, T.E.M. ten Hulscher3, R. Luttik1 and P.J.M. van Vliet4
1 National Institute for Public Health and the Environment – Ministry of Health, Welfare and Sport
2 Alterra, part of WageningenUR
3 Rijkswaterstaat – Ministry of Infrastructure and the Environment
4 Ctgb – Board for the Authorisation of Plant Protection Products and Biocides
Commissioned by the Dutch Ministries of Economic Affairs (project BO-12.07-002-001 and BO-20-002-001) and of Infrastructure & Environment (project M/601720).
Alterra Wageningen UR Wageningen, August 2013
Alterra report 2463
ISSN 1566-7197

Smit, C.E., G.H.P. Arts, T.C.M. Brock, T.E.M. Ten Hulscher, R. Luttik and P.J.M. Van Vliet, P.J.M., 2013. Aquatic effect and risk assessment for plant protection products; Evaluation of the Dutch 2011 proposal. Wageningen, Alterra Wageningen UR (University & Research centre), Alterra report 2463. 146 blz.; 32 fig.; 90 tab.; 12 ref. In this report the proposals for the prospective (underlying Regulation 1107/2009/EC) and the retrospective (underlying the Water Framework Directive) aquatic effect assessment for plant protection products (pesticides) as described in Alterra Report 2235 are evaluated by applying the proposed procedures to a number of realistic cases (neonicotinoid insecticide, pyrethroid insecticide, triazinone herbicide, mitosis inhibiting herbicide, pyridinamine fungicide and cyano-acetamide fungicide). The examples presented in this report can be used as an illustration how the effect assessment schemes as described in Alterra Report 2235 need to be applied in decision making. Furthermore, the Regulatory Acceptable Concentrations (RACs) derived for these example cases on the basis of the new effect decision trees are compared with their Predicted Environmental Concentrations (PECs) provided by the Exposure Working Group and calculated on the basis of the new Dutch ditch exposure scenario. Finally, the possible consequences of the new proposed effect and risk assessment procedures within the context of the plant protection product regulation are discussed, by comparing the ‘current/old’ and the ‘proposed/new’ risk assessment procedures. Overall it can be concluded that the decision trees for prospective and retrospective effect assessment as described in Alterra Report 2235 can be used without major problems, although minor changes for improvement are suggested particularly with respect to the chronic effect assessment for herbicides. Of the six example plant protection products evaluated and currently registered in the Netherlands, one product cannot be placed on the market anymore on the basis of the new decision trees and exposure scenario and recently published toxicity data, while for three of the six products higher-tier effect assessment approaches as well drift reductions of 95% are required. For the two remaining products the Tier-1 effect assessment and drift reducing measures of 50% seem to suffice. Keywords: Pesticides; Water organisms; Ecological risk assessment; Effect assessment tiers; Verification; Regulation 1107/2009/EC; Water Framework Directive. The pdf file is free of charge and can be downloaded via the website www.wageningenUR.nl/en/alterra (go to Alterra reports). Alterra does not deliver printed versions of the Alterra reports. Printed versions can be ordered via the external distributor. For ordering have a look at www.rapportbestellen.nl. © 2013 Alterra (an institute under the auspices of the Stichting Dienst Landbouwkundig Onderzoek), P.O. Box 47, 6700 AA Wageningen, The Netherlands, T +31 (0)317 48 07 00, E [email protected], www.wageningenUR.nl/en/alterra. Alterra is part of Wageningen UR (University & Research centre). • Acquisition, duplication and transmission of this publication is permitted with clear acknowledgement
of the source. • Acquisition, duplication and transmission is not permitted for commercial purposes and/or monetary
gain. • Acquisition, duplication and transmission is not permitted of any parts of this publication for which
the copyrights clearly rest with other parties and/or are reserved. Alterra assumes no liability for any losses resulting from the use of the research results or recommendations in this report. Alterra report 2463 | ISSN 1566-7197

Contents
Beleidssamenvatting 9
1 Introduction 19
1.1 Motivation of this report 19 1.2 Outline of the report 20
2 Additions to Alterra Report 2235 21
2.1 Erratum for calculation of the RACsp 21 2.2 Effects assessment for algae and macrophytes 22 2.3 Additional advice for deriving test endpoints 22
2.3.1 How to deal with different test parameters 22 2.3.2 How to deal with different test durations 23 2.3.3 How to derive a single endpoint per species: PPP Regulation (drainage
ditches) 23 2.3.4 How to derive a single endpoint per species: WFD assessment 24
2.4 Guidance how to derive SSDs 25
3 Example insecticide IN 27
3.1 Relevant properties and exposure profile of Insecticide IN 27 3.1.1 Information on use and characteristics 27 3.1.2 Exposure profiles 27
3.2 Laboratory toxicity data 28 3.3 First tier risk assessment for drainage ditches 29
3.3.1 Regulatory Acceptable Concentrations for aquatic organisms based on core dataset 29
3.3.2 Bioconcentration and secondary poisoning 30 3.4 Higher tier assessment 31
3.4.1 Derivation of the RAC using (a limited number of) additional data 31 3.4.2 Derivation of the RAC using SSDs 31 3.4.3 Derivation of the RAC using micro-/mesocosm studies 33
3.5 Risk assessment for drainage ditches 37 3.6 Effect and risk assessment procedure underlying the Water Framework
Directive 38 3.6.1 Monitoring data 38 3.6.2 Aquatic toxicity data 39 3.6.3 Pooling of data for freshwater and marine species 41 3.6.4 Derivation of the QSfw, eco and MAC-QSfw, eco using the assessment factor
approach 41 3.6.5 Derivation of the QSfw, eco and MAC-QSfw, eco using the SSD approach 42 3.6.6 Derivation of the MAC-QSfw, eco and QSfw, eco using micro-mesocosm
studies 43 3.6.7 Selection of the overall MAC-EQS and EQS 43
3.7 Risk assessment for WFD waterbodies 44
4 Example insecticide IP 45
4.1 Relevant properties and exposure profile of insecticide IP 45 4.1.1 Information on use and characteristics 45 4.1.2 Exposure profiles 45
4.2 Laboratory toxicity data 46

4 | Alterra report 2463
4.3 First tier risk assessment for drainage ditches 47 4.3.1 Regulatory Acceptable Concentrations for aquatic organisms based
on core dataset 47 4.3.2 Bioconcentration and secondary poisoning 48
4.4 Higher tier risk assessment 49 4.4.1 Derivation of the RAC using (a limited number of) additional data 49 4.4.2 Derivation of the RAC using SSDs 49 4.4.3 Derivation of the RAC using micro-/mesocosm studies 50
4.5 Risk assessment for drainage ditches 52 4.6 Effect and risk assessment procedure underlying the Water Framework
Directive 54 4.6.1 Monitoring data 54 4.6.2 Aquatic toxicity data 54 4.6.3 Pooling of data for freshwater and marine species 55 4.6.4 Derivation of the QSfw, eco and MAC-QSfw, eco using the assessment factor
approach 56 4.6.5 Derivation of the QSfw, eco and MAC-QSfw, eco using the SSD approach 56 4.6.6 Derivation of the MAC-QSfw, eco and QSfw, eco using micro-mesocosm
studies 57 4.6.7 Selection of the overall MAC-EQS and EQS 58
4.7 Risk assessment for WFD waterbodies 58
5 Example herbicide HT 59
5.1 Relevant properties and exposure profile of HT 59 5.1.1 Information on use and characteristics 59 5.1.2 Exposure profiles 59
5.2 Laboratory toxicity data 60 5.3 First tier risk assessment for drainage ditches 61
5.3.1 Regulatory Acceptable Concentrations for aquatic organisms based on core dataset 61
5.3.2 Bioconcentration and secondary poisoning 63 5.4 Higher tier risk assessment 63
5.4.1 Derivation of the RAC using (a limited number of) additional data 63 5.4.2 Derivation of the RAC using SSDs 63 5.4.3 Derivation of the RAC using micro-/mesocosm studies 66
5.5 Risk assessment for drainage ditches 68 5.6 Effect and risk assessment procedure underlying the Water Framework
Directive 69 5.6.1 Monitoring data 69 5.6.2 Aquatic toxicity data 69 5.6.3 Pooling of data for freshwater and marine species 71 5.6.4 Derivation of the MAC-QSfw, eco and QSfw, eco using the assessment factor
approach 71 5.6.5 Derivation of the MAC-QSfw, eco and QSfw, eco using the SSD approach 71 5.6.6 Derivation of the MAC-QSfw, eco and QSfw, eco using micro-mesocosm
studies 73 5.6.7 Selection of the overall MAC-EQS and EQS 73
5.7 Risk assessment for WFD waterbodies 74
6 Example herbicide HM 75
6.1 Relevant properties and exposure profile of HM 75 6.1.1 Information on use and characteristics 75 6.1.2 Exposure profiles 75
6.2 Laboratory toxicity data 76 6.3 First tier risk assessment for drainage ditches 76

Alterra-report 2463 | 5
6.3.1 Regulatory Acceptable Concentrations for aquatic organisms based on core dataset 76
6.3.2 Bioconcentration and secondary poisoning 78 6.4 Higher tier risk assessment 79
6.4.1 Derivation of the RAC using (a limited number of) additional data 79 6.4.2 Derivation of the RAC using SSDs 79 6.4.3 Derivation of the RAC using micro-/mesocosm studies 79
6.5 Risk assessment for drainage ditches 79 6.6 Effect and risk assessment procedure underlying the Water Framework
Directive 80 6.6.1 Monitoring data 80 6.6.2 Aquatic toxicity data 80 6.6.3 Pooling of data for freshwater and marine species 81 6.6.4 Derivation of the MAC-QSfw, eco and QSfw, eco using the assessment factor
approach 81 6.6.5 Derivation of the MAC-QSfw, eco and QSfw, eco using the SSD approach 81 6.6.6 Derivation of the MAC-QSfw, eco and QSfw, eco using micro-mesocosm
studies 81 6.6.7 Derivation of the QSfw, secpois 81 6.6.8 Derivation of the QSwater, hh food 82 6.6.9 Selection of the overall MAC-EQS and EQS 82
6.7 Risk assessment for WFD waterbodies 82
7 Example fungicide FP 83
7.1 Relevant properties and exposure profile of fungicide FP 83 7.1.1 Information on use and characteristics 83 7.1.2 Exposure profiles 83
7.2 Laboratory toxicity data 84 7.3 First tier risk assessment for drainage ditches 84
7.3.1 Regulatory Acceptable Concentrations for aquatic organisms based on core dataset 84
7.3.2 Bioconcentration and secondary poisoning 86 7.4 Higher tier risk assessment 86
7.4.1 Derivation of the RAC using (a limited number of) additional data 86 7.4.2 Derivation of the RAC using SSDs 87 7.4.3 Derivation of the RAC using micro-/mesocosm studies 89
7.5 Risk assessment for drainage ditches (PPP regulation) 91 7.6 Effect and risk assessment procedure underlying the Water Framework
Directive 93 7.6.1 Monitoring data 93 7.6.2 Aquatic toxicity data 93 7.6.3 Derivation of the MAC-QSfw, eco and QSfw, eco using the assessment factor
approach 94 7.6.4 Derivation of the MAC-QSfw, eco and QSfw, eco using the SSD approach 95 7.6.5 Derivation of the MAC-QSfw, eco and QSfw, eco using micro-mesocosm
studies 96 7.6.6 Derivation of the QSfw, secpois 96 7.6.7 Derivation of the QSwater, hh food 96 7.6.8 Selection of the overall MAC-EQS and EQS 96
7.7 Risk assessment for WFD waterbodies 96
8 Example fungicide FC 97
8.1 Relevant properties and exposure profile of fungicide Fc 97 8.1.1 Information on use and characteristics 97 8.1.2 Exposure profiles 97
8.2 Laboratory toxicity data 98

6 | Alterra report 2463
8.3 First tier risk assessment for drainage ditches 98 8.3.1 Regulatory Acceptable Concentrations for aquatic organisms based
on core dataset 98 8.3.2 Bioconcentration and secondary poisoning 99
8.4 Higher tier risk assessment 100 8.4.1 Derivation of the RAC using (a limited number of) additional data 100 8.4.2 Derivation of the RAC using SSDs 100 8.4.3 Derivation of the RAC using micro-/mesocosm studies 100
8.5 Risk assessment for drainage ditches (PPP regulation) 100 8.6 Effect and risk assessment procedure underlying the Water Framework Directive
101 8.6.1 Monitoring data 101 8.6.2 Aquatic toxicity data 101 8.6.3 Pooling of data for freshwater and marine species 102 8.6.4 Derivation of the QSfw, eco and MAC-QSfw, eco using the assessment factor
approach 102 8.6.5 Derivation of the MAC-QSfw, eco and QSfw, eco using the SSD approach 102 8.6.6 Derivation of the MAC-QSfw, eco and QSfw, eco using micro-mesocosm
studies 102 8.6.7 Derivation of the QSfw, secpois 102 8.6.8 Derivation of the and QSwater, hh food 103 8.6.9 Selection of the overall MAC-EQS and EQS 103
8.7 Risk assessment for WFD waterbodies 103
9 Evaluation of the effect assessment procedure 104
9.1 Introduction 104 9.2 Comparison of 1st tier and higher tier RACs 104
9.2.1 Insecticide IN 104 9.2.2 Insecticide IP 105 9.2.3 Herbicide HT 106 9.2.4 Fungicide Fp 107 9.2.5 Conclusion and implications for compounds without higher tier data 108
9.3 Comparison of different methods to derive EQSs (WFD) 108 9.3.1 Introduction 108 9.3.2 Insecticide IN 109 9.3.3 Insecticide IP 109 9.3.4 Herbicide HT 109 9.3.5 Fungicide FP 110 9.3.6 Conclusion 110
9.4 Comparison between PPP regulation and WFD 111 9.4.1 Insecticide IN 111 9.4.2 Insecticide IP 111 9.4.3 Herbicide HT 112 9.4.4 Herbicide HM 112 9.4.5 Fungicide FP 113 9.4.6 Fungicide FC 113 9.4.7 Summary and conclusion 113
9.5 Discussion on methodology 115 9.5.1 Data treatment 115 9.5.2 Choice of relevant parameters 115 9.5.3 First tier / Assessment factor approach 115 9.5.4 Geomean method for derivation of the RAC 115 9.5.5 Species Sensitivity Distribution 116 9.5.6 Mesocosms 118

Alterra-report 2463 | 7
10 Comparison of current and proposed risk assessment procedure for PPP registration 119
10.1 Introduction 119 10.2 Comparison of old and new proposed exposure assessments 119 10.3 Comparison of old and new proposed effect assessments 120 10.4 Overall summary of new proposed risk assessments 121
11 Conclusions 123
References 125
Annex 1 Dataset of insecticide IN 126 Annex 2 Dataset of insecticide IP 129 Annex 3 Dataset of herbicide HT 135 Annex 4 Dataset for herbicide HM 138 Annex 5 Dataset of fungicide FP 141 Annex 6 Dataset of fungicide FC 143


Alterra report 2463 | 9
Beleidssamenvatting
Korte beleidssamenvatting Dit rapport evalueert het Nederlandse voorstel voor de effectbeoordeling van gewasbeschermings-middelen in oppervlaktewater in het kader van de pre- en post-registratie. Dit voorstel is uitvoerig beschreven in Brock TCM, Arts GHP, ten Hulscher TEM, Luttik R, Roex EWM, Smit CE, van Vliet PJM. (2011) Aquatic effect assessment for plant protection products: A Dutch proposal that addresses the requirements of the Plant Protection Product Regulation and Water Framework Directive. Alterra Report 2235. De beslisbomen voor de pre-registratie (in lijn met de Europese Gewasbeschermings-verordening, 1107/2009/EC) en post-registratie (in lijn met de Europese Kaderrichtlijn Water, 2000/60/EC) worden in het voorliggende rapport geëvalueerd met zes voorbeeldstoffen. De zes voorbeeldstoffen verschillen in werkingsmechanisme. Omdat kleine aanpassingen zijn gedaan aan de dataset, zijn de stoffen geanonimiseerd. De blootstelling en effectbeoordeling worden in het voorliggende rapport beoordeeld voor drie trappen in de risicobeoordeling: de eerste trap gebaseerd op laboratoriumtoetsen met standaard test organismen; de tweede trap gebaseerd op de Geomean-methode of statistische extrapolatie met de SSD (Species Sensitivity Distribution) methode; de derde trap gebaseerd op microcosm en mesocosm experimenten. Voor twee van de zes stoffen waren geen hogere trap gegevens bekend. Deze stoffen, die voldoen aan de eerste trap van de risicobeoordeling, zijn toegevoegd als een extra toets voor de effectbeoordeling. De voorspelde blootstellingsgegevens voor de kavelsloot (PECs) zijn geleverd door de Beslisboom Water werkgroep Blootstelling. Het gaat hier om de voorlopige gegevens aangeleverd in december 2012. De gemeten concentraties van de voorbeeldstoffen in KRW-wateren zijn afkomstig uit de Bestrijdingsmiddelenatlas en/of aangeleverd door de Waterdienst. De voornaamste conclusie over de gevolgde methodiek is dat de werkwijze beschreven in Brock et al. (2011) goed uitvoerbaar is. De uitwerking van de voorbeeldstoffen heeft de werkwijze op enkele punten aangescherpt. Andere conclusies zijn dat de eerste trap niet altijd strenger is dan de hogere trappen. De eerste trap voor de effectbeoordeling van herbiciden is mogelijk onvoldoende beschermend. De verschillen tussen de toelatingsnormen en de normen van de Kaderrichtlijn Water zijn relatief beperkt. In de meeste gevallen is het verschil minder dan een factor 6 en te verklaren vanuit het verschil in toegepaste veiligheidsfactoren. De toevoeging van openbare literatuur aan het standaarddossier onder de nieuwe verordening zal leiden tot strengere toelatingsnormen. Ook zullen daardoor de verschillen tussen toelatings- en KRW-normen kleiner worden. Dit geldt niet voor de verschillen tussen de toelatingsnorm voor langdurige blootstelling en de KRW norm voor langdurige blootstelling. Hier worden door de KRW hogere veiligheidsfactoren gebruikt. Het voorliggende rapport adviseert om SSDs (Species Sensitivity Distributions) te maken op basis van herziene criteria. Door de specifieke werking van herbiciden en insecticiden, zou een specifieke SSD adequater zijn dan een generieke SSD. De voornaamste conclusies over de toelaatbaarheid van de stoffen is dat de eerste trap grotendeels te vergelijken is met de huidige toelatingsnorm. Bij de hogere trappen kan in het geval van microcosm- en mesocosm studies de nieuwe methodiek tot strengere toelatingsnormen leiden. Dit wordt veroorzaakt door hogere veiligheidsfactoren en realistischere en daardoor strengere blootstellings-profielen. Deze leiden tot een langdurige aanwezigheid van de stoffen in de sloot, waardoor het chronische risico zwaarder mee gaat wegen in de toelating. Op basis van de in Brock et al. (2011) beschreven beslisbomen, dossier data, recent gepubliceerde toxiciteitgegevens en blootstellingsprofielen aangeleverd door de BBW werkgroep Blootstelling is één van de zes geëvalueerde stoffen toelaatbaar bij 50% driftreductie. Vijf van de zes stoffen zijn toelaatbaar bij 95 % driftreductie. Het neonicotinoid insecticide is niet toelaatbaar op basis van de gevolgde procedure.

10 | Alterra report 2463
Uitgebreide beleidssamenvatting Inleiding en doel van het rapport Dit rapport evalueert het Nederlandse voorstel voor de effectbeoordeling van gewasbeschermingsmiddelen in oppervlaktewater in het kader van de pre- en post-registratie. Dit voorstel is uitvoerig beschreven in Brock TCM, Arts GHP, ten Hulscher TEM, Luttik R, Roex EWM, Smit CE, van Vliet PJM. (2011) Aquatic effect assessment for plant protection products: A Dutch proposal that addresses the requirements of the Plant Protection Product Regulation and Water Framework Directive. Alterra Report 2235. De beslisbomen voor de pre-registratie (in lijn met de Europese Gewasbeschermingsverordening, 1107/2009/EC) en post-registratie (in lijn met de Europese Kaderrichtlijn Water, 2000/60/EC) worden in het voorliggende rapport geëvalueerd met behulp van zes voorbeeldstoffen. De blootstellingsberekeningen en effectbeoordeling voor deze voorbeeldstoffen zijn gebaseerd op realistische gegevens voor bestaande, momenteel in Nederland toegelaten middelen. Echter, om de consistentie van de getrapte benadering bij de effectbeoordeling beter te kunnen evalueren zijn voor enkele voorbeeldstoffen kleine aanpassingen aan de dataset gedaan. Om deze reden zijn de de zes voorbeeldstoffen geanonimiseerd. De zes modelstoffen zijn insecticiden, herbiciden en fungiciden. Voor elk toepassingsgebied zijn twee stoffen gekozen met een verschillende werking: de insecticiden zijn een neonicotinoide (IN) en een pyrethroide (IP), de herbiciden een fotosynthese-remmer (HT) en een mitose-remmer (HM) en de fungiciden een pyridinamine (FP) en een cyano-acetamide (FC). Voor vier van de zes modelstoffen (IN, IP, HT en FP) is een uitgebreide set aan gegevens beschikbaar waardoor het mogelijk was om de verschillende trappen (tiers) van de effect-beslisbomen te doorlopen. Trap 1 is gebaseerd op laboratoriumtoetsen met standaard testorganismen, in Trap 2 worden aanvullende gegevens gebruikt in de geomean-methode of voor statistische extrapolatie (Species Sensitivity Distribution, SSD) en Trap 3 is gebaseerd op resultaten van micro- of mesocosm experimenten. Voor twee van de zes stoffen (herbicide HM en fungicide FC) zijn alleen de basisgegevens beschikbaar. Deze twee laatste voorbeeldstoffen zijn toegevoegd om een meer realistische afspiegeling van de in Nederland toegelaten stoffen te krijgen. Het hoofddoel van deze evaluatie is tweeledig: (1) het evalueren van de interne consistentie en bruikbaarheid van de beslisbomen voor de effectbeoordeling bij de pre- en post-registratie van gewasbeschermingsmiddelen, en (2) het geven van advies/richtlijnen hoe de beslisbomen te hanteren bij de effectbeoordeling van gewasbeschermingsmiddelen in oppervlaktewater. Voor elk van de stoffen zijn de toelatingsnormen (RACs, Regulatory Acceptable Concentrations) en waterkwaliteitsnormen volgens de Kaderrichtlijn water (JG- en MAC-MKN) afgeleid volgens de methodiek die is beschreven in Brock et al. (2011). Afhankelijk van het aantal gegevens en de onderzochte soorten kan dit volgens drie methoden: met een veiligheidsfactor (assessment factor; AF) op het laagste eindpunt, door het toepassen van SSDs of op basis van mesocosmstudies. Hoewel in grote lijn vergelijkbaar met de methoden uit de verschillende trappen van de kavelslootbeoordeling, zijn er verschillen in o.a. de eisen aan de dataset en de hoogte van de veiligheidsfactoren. Op basis van deze case-studies zijn enkele aspecten uit de beslisboom verder verduidelijkt. Daarnaast zijn de RACs- en MKN-waarden vergeleken met respectievelijk de voorspelde blootstellingsconcentraties (PECs) van deze stoffen in de kavelsloot en gemeten blootstellingsconcentraties van deze stoffen in grotere KRW-wateren. Dit biedt ook de mogelijkheid om de consequenties voor de toelating van de combinatie van de nieuwe beslisbomen voor effectbeoordeling en nieuwe procedures voor blootstellingbeoordeling (o.a. nieuw scenario voor kavelsloot) te evalueren door de huidige risicobeoordeling met de ‘nieuwe’ risicobeoordeling te vergelijken. De voorspelde blootstellingsgegevens voor de kavelsloot (PECs) zijn geleverd door de Beslisboom Water werkgroep Blootstelling. Het betreft hier de voorlopige gevens aangeleverd in december 2012. De in KRW-wateren gemeten concentraties van de voorbeeldstoffen zijn afkomstig uit de Bestrijdingsmiddelenatlas en/of aangeleverd door de Waterdienst. De voornaamste conclusies over de methodiek zijn als volgt: • De werkwijze in het rapport van Brock et al. (2011) is goed uitvoerbaar. De case-stusies hebben
geleid tot een verdere verduidelijking op bepaalde punten.

Alterra-report 2463 | 11
• De aanname dat de eerste trap strenger is dan de hogere tier(s) klopt niet altijd, maar leidt waarschijnlijk niet tot onterechte beslissingen over toelaatbaarheid, omdat de eerste trap streng genoeg is om verder onderzoek te eisen.
• Voor herbiciden is de effectbeoordeling volgens de Europese methodiek gebaseerd op EC50-waarden. Als EC50-waarden voor algen en waterplanten gebruikt worden bij de SSD methode, biedt dit mogelijk onvoldoende bescherming tegen lange termijn effecten op primaire producenten. De aanbeveling is om de chronische effectbeoordeling net als bij andere taxonomische groepen, te baseren op NOEC/EC10-waarden, waarbij in de eerste trap een veiligheidsfactor van 10 moet worden toegepast.
• Door het toevoegen van openbare literatuur aan het standaarddossier onder de nieuwe verordening, worden de toelatingsnormen in een aantal gevallen strenger.
• Het verschil tussen de acute toelatingsnormen en de MAC-MKN is beperkt tot minder dan een factor 6. Het verschil is grotendeels te verklaren door verschillen in veiligheidsfactoren.
• Als de chronische toelatingsnorm en JG-MKN met vergelijkbare methodiek kunnen worden afgeleid, is ook daar het verschil minder dan een factor 6. In die gevallen waar de mesocosmstudies nu niet geschikt waren om een JG-MKN af te leiden (IP en FP), zijn de verschillen tussen toelatingsnorm en KRW-normen relatief groot.
• Door het gebruik van openbare literatuur in de toelating worden de verschillen tussen de toelatings- en KRW-normen kleiner. Verschillen tussen de chronische toelatingsnorm en de JG-MKN zullen echter blijven bestaan. Dit geldt vooral voor herbiciden, omdat de JG-MKN is gebaseerd op NOEC/EC10-waarden voor algen en waterplanten, terwijl de toelating gebruik maakt van de EC50 (zie boven) en voor insecticiden, omdat vanwege het ontbreken van chronische studies binnen de KRW een grotere veiligheidsfactor moet worden toegepast. Het gebrek aan mesocosmstudies met chronische blootstelling speelt ook een rol.
• De criteria voor het toepassen van SSDs onder de KRW zouden beter moeten worden afgestemd op stoffen met een specifieke werking. De eis om altijd een brede set aan taxonomische groepen in de SSD op te nemen verdient heroverweging.
Met betrekking tot de toelaatbaarheid zijn de conclusies als volgt: • De eerste trap toelatingsnorm volgens de nieuwe methodiek is deels vergelijkbaar met de huidige
toelatingsnorm. Voor insecticiden wordt de nieuwe toelatingsnorm in een aantal gevallen lager , maar dit heeft te maken met nieuwe datavereisten van de EU en niet met de manier van afleiden. Tevens gelden voor sommige herbiciden additionele data vereisten (o.a. Myriophyllum test). Voor herbiciden leidt de voorgestelde methodiek tot lagere toelatingsnormen als het advies om de NOEC/EC10-waarden te gebruiken wordt opgevolgd.
• De nieuwe blootstellingsscenario’s resulteren in een langere aanwezigheid van de stoffen in de kavelsloot. Dit betekent dat de chronische toelatingsbeoordeling een grotere rol speelt dan voorheen.
• In het geval van mesocosmstudies kan de nieuwe methodiek tot strengere toelatingsnormen leiden. Het blootstellingsprofiel in de mesocosmstudie moet realistisch worst case zijn ten opzichte van het voorspelde profiel in de kavelsloot. Oude studies voldoen vaak niet aan het nieuwe voorspelde blootstellingsprofiel, ondermeer door de langere aanwezigheid van de stof (zie boven). Tevens is in een aantal gevallen gekozen voor een hogere veiligheidsfactor.
• Op basis van de nu beschikbare blootstellingsgegevens is één van de zes stoffen (een fungicide) toelaatbaar bij 50% driftreductie. De herbiciden zijn wel toelaatbaar als wordt uitgegaan van de huidige systematiek, maar dan zijn lange termijn effecten niet uitgesloten. Wanneer 95% driftreductie wordt bereikt, zijn vijf van de zes stoffen toelaatbaar. Het neonicotinoid insecticide is niet toelaatbaar.

12 | Alterra report 2463
De zes voorbeeldstoffen zijn momenteel allemaal toegelaten door het Ctgb (volgens de gangbare toelatingsmethodieken). In onderstaande tabel is schematisch weergegeven wat de gevolgen van de voorgestelde nieuwe toelatingsprocedures zouden zijn voor de toelating. Stof Acute risicobeoordeling Chronische risicobeoordeling
50% drift reductie
95% drift reductie
50% drift reductie
95% drift reductie
Insecticide IN Niet toelaatbaar
Niet toelaatbaar
Niet toelaatbaar
Niet toelaatbaar
Insecticide IP Niet toelaatbaar
Toelaatbaar Niet toelaatbaar
Toelaatbaar
Herbicide HT Toelaatbaar Toelaatbaar Toelaatbaar op basis van huidige systematiek (EC50/10)
Toelaatbaar op basis van voorgestelde systematiek Niet toelaatbaar op
basis van voorgestelde methodiek (NOEC/10)
Herbicide HM Toelaatbaar Niet geévalueerd
Toelaatbaar op basis van huidige systematiek (EC50/10)
Niet geévalueerd
Niet toelaatbaar op basis van voorgestelde methodiek (NOEC/10)
Fungicide FP Toelaatbaar, grensgeval
Toelaatbaar Niet toelaatbaar
Toelaatbaar
Fungicide FC Toelaatbaar Niet geévalueerd
Toelaatbaar Niet geévalueerd
Uitgebreide samenvatting per stof Insecticide IN Voor insecticide IN zijn relatief veel acute toxiciteitgegevens beschikbaar voor zowel standaard testorganismen als additionele soorten. Ook zijn een mesocosm studie en diverse microcosm studies beschikbaar. Effectbeoordeling kavelsloot (toelating) Zowel voor de acute en chronische effectbeoordeling was het mogelijk verschillende trappen te doorlopen (zie tabel hieronder). De zo verkregen toelatingsnormen (RACs) zijn vergeleken met de voorspelde concentraties in de kavelsloot. De volgens het nieuwe blootstellingsscenario berekende concentraties in de kavelsloot zijn langere tijd hoger dan de drempelwaarde voor effecten in micro-/mesocosmstudies. Daarom is het niet mogelijk om herstel mee te nemen als optie in de risicobeoordeling. Tijdschaal Trap Gevoeligste soorten RAC
[µg/L] Acuut Eerste trap
(standaard testsoorten) Americamysis bahia 0,359
Tweede trap (SSD-methode)
Arthropoden (zonder Daphnia)
0,215
Derde trap (micro-/mesocosms)
Insecten 0,275 (drempelwaarde)
Chronisch Eerste trap (standaard testsoorten)
Chironomus 0,260
Tweede trap (geomean-methode)
Insecten 0,124
Derde trap (micro-/mesocosms)
Insecten 0,140 (drempelwaarde)
Uit bovenstaande tabel blijkt dat de verschillen tussen de acute en chronische effectbeoordeling relatief klein zijn (< factor 2). De verschillen tussen de trappen zijn relatief klein. Opvallend hierbij is dat zowel bij de acute als chronische effectbeoordeling de derde trap in een lagere RAC resulteert dan de eerste trap. Voor de risicobeoordeling wordt gekozen voor de derde trap RACs. De berekende piekconcentratie en het tijdgewogen gemiddelde over zeven dagen zijn hoger dan de acute en chronische RAC, ook als rekening wordt gehouden met 95% driftreductie en een hogere

Alterra-report 2463 | 13
verdwijnsnelheid van de stof uit de waterfase. Dit betekent dat er voor insecticide IN sprake is van een onaanvaardbaar ecologisch risico in de kavelsloot. Effectbeoordeling grotere waterlichamen (KRW) Omdat voldoende gegevens beschikbaar zijn voor insecticide IN was het mogelijk om bij de afleiding van de MAC-MKN de drie beschikbare methoden te hanteren. Omdat relatief weinig chronische toxiciteitgegevens uit laboratorium testen beschikbaar zijn, maar wel een geschikte mesocosmstudie, was het mogelijk om bij de chronische effectboordeling (JG-MKN) twee methoden te hanteren (zie tabel hieronder) Tijkdschaal Methode Gevoeligste soorten MKN
[µg/L] Acuut (MAC-MKN) AF Epeorus longimanus (insect) 0,065 SSD Insecten 0,163 micro-/mesocosm Insecten 0,183 Chronisch (JG-MKN) AF Chironomus 0,042 micro-/mesocosm Insecten 0,070
Ook voor de effectbeoordeling volgend de KRW-methodiek geldt dat de verschillen tussen de acute (MAC-MKN) en chronische (JG-MKN) effectbeoordeling relatief klein zijn (< factor 3). Dit geldt ook voor de verschillende tussen de gebruikte methodes (< factor 3). In dit rapport is gekozen voor de MKNs afgeleid op basis van de mesocosm studie. Op representatieve KRW-meetpunten in Nederlands oppervlaktewater zijn tussen 2007 en 2009 maximale concentraties van insecticide IN gemeten van 0,25 tot 0,81 µg/L. Deze waarden zijn hoger dan de hier afgeleide MAC-MKN van 0,183 µg/L. De jaargemiddelde concentraties van insecticide IN waren 0,075 tot 0,32 µg/L, dit is hoger dan de voor IN afgeleide JG-MKN van 0,07 µg/L. Daarmee voldoet insecticide IN niet aan de hier afgeleide KRW-normen. Insecticide IP Voor insecticide IP zijn relatief veel acute toxiciteitgegevens beschikbaar uit zowel studies met standaardsoorten als uit aanvullende studies met andere waterorganismen. Ook zijn diverse micro-/mesocosm studies beschikbaar. Effectbeoordeling kavelsloot (toelating) Zowel voor de acute en chronische effectbeoordeling was het mogelijk verschillende trappen te doorlopen (zie tabel hieronder). Op basis van het berekende blootstellingsprofiel in de kavelsloot is het mogelijk om naast de drempelwaarde uit de mesocosmstudies, ook de concentratie te gebruiken waarbij na kortdurende effecten herstel optreedt. Daarom zijn voor beide situaties RACs afgeleid. Tijdschaal Trap Gevoeligste soorten RAC
[ng/L] Acuut Eerste trap
(standaard testsoorten) Gammarus pulex 0,16
Tweede trap SSD-methode
Arthropoden 0,71
Derde trap micro-/mesocosms
Arthropoden 5,0 (drempelwaarde) 8,3 (kortdurend effect met herstel)
Chronisch Eerste trap standaard testsoorten
Chironomus 0,2
Derde trap micro-/mesocosms
Arthropoden 3,3 (drempelwaarde) 6,3 (kortdurend effect met herstel)
Uit bovenstaande tabel blijkt dat ook voor insecticide IP de verschillen tussen de acute en chronische effectbeoordeling relatief klein zijn (< factor 2). De verschillen in RACs (acuut en chronisch) op basis van de hoogste trap (micro-/mesocosms) en de eerste trap zijn relatief groot. Dit kan verklaard worden door het feit dat de standaard testorganismen relatief gevoelig zijn voor IP en doordat onder semi-veldomstandigheden de blootstellingsconcentratie van IP veel sneller afneemt dan in de laboratoriumstudies. Dit komt ondermeer door sorptie aan sediment en planten. De verschillen tussen de derde trap RACs zonder of met herstel zijn relatief klein (< factor 2). Voor de risicobeoordeling wordt gekozen voor de derde trap RACs. Als rekening wordt gehouden met 95% drifreductie en

14 | Alterra report 2463
aanvullende gegevens voor afbraak in de waterfase zijn de risico’s aanvaardbaar. De berekende piekconcentratie in de kavelsloot is dan met 2,1 ng/L lager dan bovenvermelde derde trap RACs. IP is niet toelaatbaar als er wordt gerekend met 50% driftreductie en/of de standaard invoerparameters voor de blootstellingsberekening. Effectbeoordeling grotere waterlichamen (KRW) Omdat voldoende gegevens beschikbaar zijn voor insecticide IP was het mogelijk om bij de afleiding van de MAC-MKN drie methoden te hanteren. Er waren nauwelijks chronische toxiciteitsstudies en de blootstelling in de mesocosms voldeed niet aan de eisen van de KRW-methodiek voor het afleiden van de JG-MKN, omdat de concentratie tussen de pulsdoseringen daalde tot vrijwel nul. Daarom kon voor deze norm alleen de AF-methode worden gebruikt, waarbij een hogere AF werd toegepast vanwege de kleine dataset (zie tabel hieronder). Tijdschaal Methode Gevoeligste soorten MKN
[ng/L] acuut (MAC-MKN) AF Hyalella azteca (Crustacea) 0,23 SSD Insecten 0,23 micro-/mesocosm Insecten 0,87 chronisch (JG-MKN) AF Daphnia (AF van 50) 0,04
Het verschil tussen de acute (MAC-MKN) en chronische (JG-MKN) normen is relatief groot, dit kan verklaard worden door beperkte beschikbaarheid van chronische toxiciteitsgegevens en de AF van 50 die daarom gebruikt is bij de afleiding van de JG-MKN (0,04 ng/L). De verschillen tussen MAC-MKNs die zijn afgeleid met de verschillende methoden zijn relatief klein (< factor 4). In dit rapport is gekozen voor de MAC-MKN afgeleid op basis van de mesocosm studie (0.87 ng/L). De gemeten concentraties van IP in Nederlands oppervlaktewater zijn lager dan de rapportagegrens van 20 ng/L. Aangezien de MAC-MKN (0,87 ng/L) en de JG-MKN (0,04 ng/L) lager zijn dan deze rapportagegrens kan niet worden vastgesteld of de gemeten concentraties onder of boven de norm liggen. Dit probleem kan alleen opgelost worden door de analysemethode voor IP te verbeteren zodat concentraties op hetniveau van de MKN-waarden kunnen worden aangetoond. Een andere optie is om met adequate blootstellingsmodellen de concentraties in KRW-wateren te berekenen als aanvulling op de chemische analyses. Herbicide HT Voor herbicide HT zijn relatief veel toxiciteitsgegevens beschikbaar voor zowel standaard toetssoorten als aanvullende soorten uit de gevoelige taxonomische groepen (algen en macrofyten). Er is ook een bruikbare mesocosmstudie beschikbaar. Effectbeoordeling kavelsloot (toelating) Voor herbicide HT zijn algen en macrofyten de meest gevoelige waterorganismen. Bij algen en macrofyten kan uit de standaardtoetsen zowel een EC50 als een NOEC/EC10 afgeleid worden. Er is geen duidelijk onderscheid in acute en chronische eindpunten, zoals bij andere organismen wel het geval is. In het kader van de Europese toelating wordt bij de eerste en tweede trap gebruik gemaakt van EC50-waarden voor algen en macrofyten, in de eerste trap wordt een veiligheidsfactor van 10 gebruikt. In Alterra rapport 2235 wordt voorgesteld om de acute effectbeoordeling van herbiciden te baseren op EC50-waarden voor primaire producenten en de chronische effectbeoordeling op hun NOEC/EC10-waarden. In onderstaande tabel (en in dit rapport) zijn beide opties uitgewerkt.

Alterra-report 2463 | 15
Voor herbicide HT was het mogelijk verschillende trappen te doorlopen (zie tabel hieronder). De mesocosmstudie kon alleen worden gebruikt voor een RAC die is gekoppeld aan de ecologische drempelwaarde. Tijdschaal Eerste trap Gevoeligste soorten RAC
[µg/L] Acuut/chronisch (gangbaar)
Eerste trap standaard testsoorten
Lemna (EC50/10)
0,79
Tweede trap SSD-methode
primaire producenten (EC50-waarden)
2,6
Derde trap micro-/mesocosms
primaire producenten 2,5 (drempelwaarde)
Chronisch (volgens Alterra raport 2235)
Eerste trap standaard testsoorten
Lemna (NOEC/10)
0,058
Tweedetrap SSD methode
primaire producenten (NOEC waarden)
0,24
Derde trap micro-/mesocosms
primaire producenten 1,2 (drempelwaarde)
Uit bovenstaande tabel blijkt dat ook voor herbicide HT de verschillen tussen de gangbare en in Alterra-rapport 2235 voorgestelde effectbeoordeling vooral groot zijn bij de eerste en tweede trap (> factor 10) maar relatief klein bij de derde trap (<factor 3). Bij de nu geldende methode zijn de verschillen in RACs tussen de hoogste trap (micro-/mesocosms) en de eerste trap < factor 4. Op basis van de in Alterra-rapport 2235 voorgestelde methodiek zijn de verschillen in chronische effectbeoordeling tussen de eerste trap en de derde trap groot (factor 20). Voor de risicobeoordeling wordt gekozen voor de derde trap RACs. Bij het berekenen van de blootstelling in de kavelsloot is uitgegaan van aanvullende gegevens over de verdwijnsnelheid van HT uit de waterfase. Als wordt uitgegaan van de gangbare methodiek, zijn de risico’s aanvaardbaar bij 50% driftreductie: in dat geval is de berekende piekconcentratie is met 0,55 µg/L lager dan de RAC van 2,5 µg/L. Als echter wordt uitgegaan van de methodiek die is voorgesteld in Alterra rapport 2235, is 95% driftreductie nodig. Alleen dan is de piekconcentratie (0,904 µg/L) lager dan de RAC (1,2 µg/L). Effectbeoordeling grotere waterlichamen (KRW) Omdat voldoende gegevens beschikbaar zijn voor herbicide HT was het mogelijk om bij de afleiding van zowel de MAC-MKN als de JG-MKN drie methoden te hanteren (zie tabel hieronder). Het verschil tussen de uiteindelijk geselecteerde normen voor piek- en lange-termijnblootstelling (MAC-MKN 1.6 µg/L; JG-MKN 0.6 µg/L) is relatief klein (<factor 3). De verschillen tussen MAC-MKNs die zijn afgeleid met de verschillende methoden zijn eveneens klein (maximaal factor 2). De verschillen tussen JG-MKNs afgeleid met de verschillende methoden zijn groter (maximaal factor 10). De gemeten concentraties van herbicide HT Nederlands oppervlaktewater zijn lager dan de rapportagegrens van 20 tot 50 ng/L. Aangezien zowel de MAC-MKN als de JG-MKN hoger zijn dan deze waarden, is het niet waarschijnlijk dat herbicide HT de normen in grotere KRW-wateren overschrijdt. Tijdschaal Methode Gevoeligste soorten MKN (Milieukwaliteitsnorm)
[µg/L] Acuut (MAC-MKN)
AF Lemna (EC50/10)
0,79
SSD primaire producenten 1,4 micro-/mesocosm primaire producenten 1,6 Chronisch (JG-MKN)
AF Lemna (NOEC/10)
0,058
SSD primaire producenten 0,18 micro-/mesocosm primaire producenten 0,6
Herbicide HM Voor herbicide HM zijn in het toelatingsdossier alleen toxiciteitgegevens beschikbaar voor de standaard waterorganismen. In de openbare literatuur zijn wel aanvullende toxiciteitsgegevens te vinden (voor o.a. mariene soorten), maar de dataset is onvoldoende om een SSD toe te passen. Er zijn geen veldgegevens beschikbaar.

16 | Alterra report 2463
Effectbeoordeling kavelsloot (toelating) Voor de kavelsloot kan alleen een eerste trap effectbeoordeling worden uitgevoerd.Voor herbicide HM zijn algen en Lemna de meest gevoelige aquatische organismen, maar de verschillen met Dapnia en vis zijn klein (< factor 5). Aangezien in de gangbare Europese procedure een veiligheidsfactor van 10 wordt toegepast op de EC50 van primaire producenten en een veiligheidsfactor van 100 en 10 op respectievelijk de acute E(L)C50 en chronische NOEC van Daphnia en vis, zijn in de Europese beoordelingsprocedure deze soorten bepalend voor het risico. In Alterra-rapport 2235 wordt voorgesteld om de acute effectbeoordeling van herbiciden te baseren op EC50-waarden van primaire producenten en de chronische effectbeoordeling op hun NOEC/EC10-waarden. In onderstaande tabel (en in dit rapport) zijn beide opties uitgewerkt. Tijdschaal Trap Gevoeligste soorten RAC
[µg/L] Acuut (gangbaar)
Eerste trap standaard testsoorten
Daphnia (EC50/100) 38
Chronisch (gangbaar)
Eerste trap standaard testsoorten
Dario rerio (NOEC/10) 32
Chronisch (voorstel Alterra-raport 2235)
Eerste trap standaard testsoorten
Pseudokirchneriella (NOEC/10) 19,7
Uit bovenstaande tabel blijkt dat voor herbicide HM de verschillen tussen de gangbare en in Alterra-rapport 2235 voorgestelde effectbeoordeling op basis van de eerste trap relatief klein zijn (< factor 2). De berekende piekconcentratie van herbicide HM in de kavelsloot is 29.9 µg/L bij 50% drift reductie. Deze concentratie is lager dan de RAC op basis van de gangbare Europese methodiek, dus is dan sprake van een aanvaardbaar risico. De piekconcentratie is echter hoger dan de eerste trap RAC op basis van de in Alterra raport 2235 voorgestelde methode. Daarmee kan een ecologisch risico niet uitgesloten worden. Effectbeoordeling grotere waterlichamen (KRW) In de openbare literatuur zijn enkele additionele toxiciteitgegevens beschikbaar voor herbicide HM die bruikbaar zijn voor de MKN-afleiding. Het aantal additionele toxiciteitsgegevens was echter niet voldoende om de SSD-methode toe te passen (zie tabel hieronder). Tijdschaal Trap Gevoeligste soorten MKN
[µg/L] Acuut (MAC-MKN) AF methode Chlamydomonas eugametos (EC50/10) 43 Chronisch (JG-MKN) AF methode Scenedesmus quadricauda (NOEC/10) 4
Het verschil tussen de MAC-MKN (43 µg/L) en JG-MKN (4 µg/L) bedraagt ongeveer een factor 10. De concentraties (90ste percentiel) van herbicide HM in Nederlands oppervlakterwater waren in 2010 en 2011 lager dan 3,3 µg/L. Dit is lager dan de MKN-waarden en normoverschrijding is niet waarschijnlijk. Fungicide FP Voor fungicide FP zijn relatief veel toxiciteitgegevens beschikbaar voor zowel standaard toetsorganismen als voor aanvullende soorten.Er is ook een microcosmstudie beschikbaar.

Alterra-report 2463 | 17
Effectbeoordeling kavelsloot (toelating) Zowel voor de acute en chronische effectbeoordeling was het mogelijk verschillende trappen te doorlopen (zie tabel hieronder). De volgens het nieuwe blootstellingsscenario berekende concentraties in de kavelsloot zijn langere tijd hoger dan de drempelwaarde voor effecten in de microcosmstudie. Daarom is het niet mogelijk om herstel mee te nemen als optie in de risicobeoordeling. Tijdschaal Trap Gevoeligste soorten RAC
[µg/L] acuut Eerste trap
standaard testsoorten Oncorhynchus mykiss 0,63
Tweede trap SSD-methode
vissen overige soorten
9,34 1,31
Derde trap micro-/mesocosms
micro-Crustacea (geen vis) 0,95 (drempelwaarde)
chronisch Eerste trap standaard testsoorten
Pimephales promelas 0,29
Tweede trap geomean
vissen 0.59
Derde trap micro-/mesocosms
Micro-Crustacea (geen vis) 0,95 (drempelwaarde)
Uit bovenstaande tabel blijkt dat voor fungicide FP de verschillen tussen de acute en chronische effectbeoordeling relatief klein zijn (< factor 2), maar wel op andere eindpunten gebaseerd zijn (respectievelijk micro-Crustacea in microcosms en vis). Voor de risicobeoordeling wordt gekozen voor de derde trap acute RAC en de tweede trap chronische RAC. De berekende piekconcentraties op basis van 50% en 95% driftreductie zijn respectievelijk 1,241 µg/L en 0,118 µg/L. Alleen bij 95% driftreductie is de blootstelling lager dan de geselecteerde RACs. Onder deze aanname is er een aanvaardbaar ecologisch risico in de kavelsloot voor fungicide FP. Effectbeoordeling grotere waterlichamen (KRW) Voor fungicide FP was het mogelijk om bij de MAC-MKN af te leiden met de AF-methode en de microcosmstudie. Met de beschikbare chronische toxiciteitsgegevens kon niet worden voldaan aan de randvoorwaarden van de KRW-methodiek voor toepassing van de SSD-methode. De SSD op basis van acute toxiciteitsdata is niet gebruikt vanwege de slechte fit. Dit komt doordat volgens de KRW-methodiek alle soorten, inclusief de vissen, in de SSD moeten worden gebruikt. Voor de kavelsloot zijn de vissen apart beoordeeld. De microcosmstudie kon wel worden gebruikt voor het afleiden van de MAC-MKN, maar het blootstellingsregime kon niet als chronisch worden beschouwd omdat de concentratie tussen de pulsdoseringen te sterk daalde. De JG-MKN kon daarom alleen worden afgeleid met de AF-methode (zie tabel hieronder). Tijdschaal Methode Gevoeligste soorten MKN
[µg/L] Acuut (MAC-MKN) AF Brachionus calcyflorus (EC50/10) 0,16 micro-/mesocosm micro-Crustacea 0,9 Chronisch (JG-MKN) AF methode B. calcyflorus (EC50/100) 0,016
Het verschil tussen de MAC-MKN en JG-MKN is een factor 10. De laagste acute EC50 voor Brachionus calcyflorus is lager dan de laagste chronische NOEC. Daarom voor beide normtype dezelfde toxiciteitswaarde gebruikt, maar met een verschillende veiligheidsfactor Het verschil tussen MAC-MKNs die zijn afgeleid met de verschillende methoden is kleiner dan een factor 6. In dit rapport is gekozen voor de MAC-MKN afgeleid op basis van de mesocosm studie (0.9 µg/L). De hoogste gemeten concentratie FP op Nederlandse KRW-meetlocaties is 0,22 µg/L. De MAC-MKN (0,9 ng/L) en normoverschrijding is niet waarschijnlijk. Er zijn niet voldoende monitoringgegevens beschikbaar om een jaargemiddelde concentratie uit te rekenen. Het is dan ook niet bekend of de JG-MKN zal worden overschreden. Fungicide FC
Voor fungicide FC zijn in het toelatingsdossier voornamelijk toxiciteitgegevens beschikbaar voor standaard test organismen. Er zijn wel aanvullende gegevens voor vissen, maar vissen zijn minder gevoelig dan de andere standaardsoorten.

18 | Alterra report 2463
Effectbeoordeling kavelsloot (toelating) Voor de kavelsloot is alleen een eerste trap effectbeoordeling mogelijk (zie tabel). Tijdschaal Trap Gevoeligste soorten RAC
[µg/L] Acuut Eerste trap
standaard testsoorten Pseugokirchneriella subcapitata 41
Chronisch Eerste trap standaard testsoorten
Daphnia magna 6,7
Uit bovenstaande tabel blijkt dat voor fungicide FC het verschil tussen de acute en chronische effectbeoordeling ongeveer een factor 6 bedraagt. De berekende piekconcentratie bij 50% driftreductie is 1,058 µg/L. Deze concentratie is lager dan de acute en chronische eerste trap RACs en daarmee is er voor fungicide FC sprake van een aanvaardbaar ecologisch risico in de kavelsloot. Effectbeoordeling grotere waterlichamen (KRW) In de open literatuur zijn slechts een beperkt aantal additionele toxiciteitsgegevens te vinden zodat ook bij de KRW-normafleiding alleen de AF-methode toegepast kon worden. Omdat geen toxiciteitsgegevens voor aquatische schimmels beschikbaar zijn, is bij de chronische effectbeoordeling een AF van 50 toegepast. Tijdschaal Methode Gevoeligste soorten MKN
[µg/L] Acuut (MAC-MKN) AF Anabaena flos-aquae 25,4 Chronisch (JG-MKN) Laagste tox waarde AF methode Cyprinodon variegatus NOEC/50 1,2
Het verschil tussen de MAC-MKN en JG-MKN is relatief groot (factor 21), hetgeen verklaard kan worden door het feit dat een AF van 50 werd toegepast voor de chronische norm. De concentraties (90ste percentiel) van fungicide FC in Nederlands oppervlaktewater waren in 2010 en 2011 lager dan 1,5 µg/L, ongeveer een derde van de locaties had concentraties lager dan 0,15 µg/L. Normoverschrijding is niet waarschijnlijk. Verschillen in effectbeoordeling tussen toelatings- en KRW-procedure
In onderstaande tabel zijn de hoogste trap RACs (op basis van de drempelwaarde optie) en de uiteindelijk geselecteerde MAC-MKN- en JG-MKN- waarden voor de voorbeeldstoffen weergegeven. De acute RAC (RACac) is een factor 0,9 tot 5,7 hoger dan de MAC-MKN. De chronische RAC (RACch) is een factor 2,0 tot 82,5 hoger dan de JG-MKN. De verschillen tussen de chronische RAC en JG-MKN zijn het hoogst voor insecticide IP (factor 82,5) en fungicide FP (36,9), maar beduidend lager voor de andere voorbeeldstoffen. Dit komt doordat bij IP en FP de chronische RAC kon worden afgeleid met micro-/mesocosmstudies, terwijl bij de JG-MKN afleiding alleen de AF-methode kon worden toegepast. In de mesocosmstudies was de concentraties tussen de pulsen zoveel afgenomen, dat het blootstellingsregime volgens de KRW-methodiek niet als chronisch kon worden beschouwd. Acute effectbeoordeling Chronische effectbeoordeling Stof RACac
[µg/L] MAC-MKN [µg/L]
Ratio RACac: MAC-MKN
RACch
[µg/L] JG-MKN [µg/L]
Ratio RACch: JG-MKN
Insecticide IN 0,275 0,183 1,5 0,140 0,070 2,0 Insecticide IP 0,005 0,00087 5,7 0,0033 0,00004 82,5 Herbicide HT 2,5 1,6 1,6 (1,2) 0,6 2,0 Herbicide HM 38 43 0,9 (19,7) 4 4,9 Fungicide FP 0,95 0,9 1,1 0,59 0,016 36,9 Fungicide FC 41 25,4 1,6 6,7 1,2 5,6

Alterra-report 2463 | 19
1 Introduction
1.1 Motivation of this report
Recently, Dutch proposals for new scenarios in the pre-registration exposure prediction of plant protection products (PPPs) in drainage ditches (Tiktak et al., 2012) and new decision trees for (a) the pre-registration aquatic effect assessment of PPPs within the context of Regulation 1107/2009/EC and (b) the derivation of water quality standards for PPPs to be used in the retrospective risk assessment within the context of the Water Framework Directive (Brock et al., 2011) have been published. In these reports, however, the possible consequences of the new risk assessment proposals for the prospective and retrospective risk assessment of PPPs did not receive much attention. The Dutch Ministries of Economic Affairs and of Infrastructure & Environment decided that the new risk assessment proposals should be evaluated by applying the proposed procedures to a number of realistic PPP-cases. The Ministries commissioned this evaluation research to the Exposure Assessment Working group that developed the new exposure scenarios for Dutch drainage ditches and to the Effect Assessment Working group that updated the aquatic effect assessment schemes. In these working groups representatives of Ctgb (Board for the Authorisation of Plant Protection Products and Biocides), PBL (Netherlands Environmental Assessment Agency), RIVM (National Institute for Public Health and the Environment) and Wageningen UR (Wageningen University and Research centre) participate. For the evaluation, six example PPPs were selected that differed in environmental fate characteristics, toxic mode-of-action and availability of dossier data, viz.: IN = neonicotinoid insecticide IP = pyretroid insecticide HT = triazinone herbicide HM = mitosis inhibitor herbicide FP = pyridinamine fungicide FC = cyano-acetamide fungicide Although the example PPPs are based on existing PPPs and dossier data, we anonimised the substances to avoid discussions with stakeholders that distract the attention from the aim of the report. This aim is to evaluate the potential consequences and possible areas for improvement of the new exposure and effect assessment procedures proposed. In addition, in a few example PPPs we slightly adjusted the available lower- and higher-tier information in a realistic way to obtain a more complete dataset to allow a proper tiered-approach in the risk assessment. We also included two PPPs (HM and FC) for which only little higher-tier information is available, since this is a realistic situation for many PPPs. The example PPPs mentioned above are used by the Exposure Assessment Working group to evaluate the new exposure scenarios for Dutch drainage ditches described in Tiktak et al. (2012) and to explore possibilities for higher-tier exposure assessments. This research will be described in a separate report (Ter Horst et al., 2013). In this report of the Effect Assessment Working group we used the exposure profiles of the example PPPs as made available by the Exposure Assessment Working Group in 2012. In December 2012, however, it appeared that the exposure calculations need to be revised because of problems with some hydrological parameters used. A quick scan demonstrated that the calculated peak concentrations of the example PPPs may become 5 to 20% higher if the correct hydrological parameters are used in the TOXSWA calculations. Since an increase in calculated peak concentrations of 5 to 20% likely will not change the final conclusions on basis of the risk assessment procedure decribed in this report, and correct exposure profiles cannot be provided before spring 2013, the Effect Assessment Working Group decided to proceed with the exposure data provided in 2012.

20 | Alterra report 2463
In this report of the Effect Assessment Working group the example PPPs are used to evaluate the effect decision schemes described in Brock et al. (2011). In addition, the exposure estimates of the example PPPs for drainage ditches provided by the Exposure Assessment Working group in 2012, and available chemical monitoring data for larger WFD surface waters will be linked to the effect estimates to provide insight in the risk assessment procedure. Furthermore, shortcomings of the proposed effect decision schemes (Brock et al., 2011) will be discussed and suggestions for improvement provided.
1.2 Outline of the report
In Chapter 2 an erratum for calculating the Regulatory Acceptable Concentration for secondary poisoning (RACsp) to Alterra Report 2235 is given, as well as additional information on data selection and data treatment for the lower and higher-tier effect assessments. The aquatic effect and risk assessment procedure on basis of Alterra report 2235 and the additional information/guidance of chapter 2 is described for the insecticides IN and IP in Chapters 3 and 4, for the herbicides HT and HM in Chapters 5 and 6, and for the fungicides FP and FC in Chapters 7 and 8. In Chapter 9 a general evaluation and discussion is presented on the lessons learnt when applying the decision schemes and guidance presented in Alterra Report 2235 and Chapter 2. In addition, suggestions for improving the decision schemes is provided. In Chapter 10 the possible consequences of the new proposed effect and risk assessment procedure within the context of PPP regulation is discussed by comparing the old and new risk assessment procedures for the example PPPs. Based on the experience gained with the case-studies, conclusions and recommendations for the effect assessment are presented in Chapter 11.

Alterra-report 2463 | 21
2 Additions to Alterra Report 2235
2.1 Erratum for calculation of the RACsp
In Chapter 5.3.3 of Alterra report 2235 (Brock et al., 2011), which deals with the derivation of the Regulatory Acceptable Concentration for secondary poisoning of birds and mammals, some errors have been made. The Chapter should be read in the following way (revisions are indicated in bold): Assuming a food chain from fish to fish-eating birds or mammals, EFSA (2008) proposes a simple worst-case risk assessment in which the exposure of birds and mammals is calculated from the expected residues in fish. To that end, the highest appropriate PECTWA, 21-d is selected from the environmental fate section, and multiplied by the whole-body bioconcentration factor of fish to give the Predicted Environmental Concentration in fish: PECfish = PECTWA, 21 d x BCF with PECfish = concentration in whole fish [mg/kg] PECTWA, 21 d = time weighted average PEC in water over 21 days [mg/L] BCFfish = whole body bioconcentration factor in fish [L/kg] Note that the default time window of 21 days is chosen unless on basis of scientific reasoning a shorter time window is more appropriate (EFSA, 2008). Then, the PECfish (in mg/kg) is converted to a daily dose for mammals and birds by multiplying with 0.138 (mammals) and 0.159 (birds) respectively, and compared with the relevant long-term no-adverse-effect-level (NOAEL, in mg/kg bw per day). Multiplications are based on a 3000-g mammal eating 415 g fresh fish per day, and a 1000-g bird eating 159 g per day, according to Smit (2005). The ratio between the relevant NOAEL and the daily dose in fish is denoted as the Toxicity Exposure Ratio (TER), and compared with the appropriate trigger value of 5. For TER ≥ 5, no further action is required, for TER < 5, refinement is needed. Note that the TER-approach with trigger 5 is the reciprocal of a Exposure Toxicity Ratio ('PEC/PNEC') with trigger 0.2. Refinement options are for instance: • The use of refined models for calculating exposure concentrations in the surface water. • The use of measured concentrations either in the surface water or in fish. • Modeling of the internal body burden of fish using information on uptake and elimination kinetics in
fish as well as information on dissipation kinetics in water, rather than assuming equilibrium and calculating BCF value.
Within the context of this report, instead of calculating the TER, preference is given to the derivation of the Regulatory Acceptable Concentration in water for secondary poisoning (RACsp), which can be compared with the time weighted average PEC. Using the same input as described above, the following calculations are made: The relevant long-term no-adverse-effect-level (NOAEL, in mg/kg bw per day) is divided by the assessment factor of 5 to give the 'regulatory acceptable dose', and converted into a concentration in fish by dividing by a factor of 0.159 for birds or 0.138 for mammals. Then, the resulting 'regulatory acceptable concentration in fish' is divided by the BCFfish to yield the corresponding concentration in water. This RACsp relates to the 21-days TWA concentration in water, unless scientific reasoning indicates otherwise. If the 21-days TWA PEC is higher than the RACsp, further refinement is necessary. If the 21-days TWA PEC is lower than the RACsp, no further action is needed. Written in formula, the RACsp in surface water for fish eating birds and mammals is derived as follows:

22 | Alterra report 2463
fish
mammal
fish
birdSP BCF0.1385
NOAELorBCF159.05
NOAELRAC××××
=
with RACsp = Regulatory Acceptable Concentration in water for secondary poisoning [mg/L] NOAELbirds= relevant long-term no-adverse-effect-level [mg/kg bw per d] BCFfish = whole body bioconcentration factor in fish [L/kg] This RACsp should be compared with the 21-days TWA PEC in sruface water. If RACsp > 21-d TWA PECsw, no further action is required. If RACsp < 21-d TWA PECsw, refinement is necessary.
2.2 Effects assessment for algae and macrophytes
In aquatic ecotoxicity testing, the LC50 is generally associated with acute, lethal effects after short-term exposure, the NOEC with chronic, sublethal effects after long-term exposure. For primary producers, this is not so straightforward. The endpoints refer to sublethal effects only and the test duration generally covers multiple generations or at least a large part of the generation time. Formally speaking, it is probably best to use the terms 'short-term' and 'long-term' only as indication of the exposure time considered. Short-term is days to one week, long-term is weeks to months. Acute and chronic relate to the test duration in relation to the generation time of an organism. Endpoints such as EC50, NOEC denote the (no) effect level. They can be derived from chronic and acute tests and may refer to lethal as well as sub-lethal parameters. Speaking in this way, the algae test is a short-term test that in view of its duration in relation to the life cycle delivers chronic EC50 or NOEC-values. The 7-14 days test with macrophytes is of intermediate duration. For Lemna, which has a fast generation time, it can be considered as chronic, for other macrophytes it is probably only semi-chronic. Under 91/414/EC, the RAC for algae and macrophytes is calculated from the EC50 with an assessment factor of 10. In the main report, we considered the option that this would be changed and that in the future the EC50 would be used with a factor of 100, and/or the NOEC with a factor of 10 (see notes to Table 5-1 and 5-2 of the main report). At present, there is no indication that this will indeed be the case. In this verification exercise, therefore only the existing practice is considered for the 1st tier assessment, i.e. data on algae and macrophytes are used for derivation of a single RAC, using the EC50 with an assessment factor of 10. In addition, to verify the recommendations of the main report (Brock et al., 2011), we include the derivation of RACs based on primary producer NOEC/EC10-values for the Tier-1 and higher tier approaches. In the main report, we pragmatically indicated the EC50-based RAC as acute or short-term and the NOEC-based RAC as chronic or long-term. This line is also followed in this verification report.
2.3 Additional advice for deriving test endpoints
2.3.1 How to deal with different test parameters
If for standard test organisms endpoints are available from tests with different parameters, preference is given to the endpoints that are specified in the guideline, e.g. immobilisation for daphnids and mortality for fish in case of acute studies. For algae, growth rate is preferred as regulatory endpoint according to OECD 201, but biomass or yield may be considered as well if growth rate is not reported. For Lemna the preferred regulatory endpoints are growth and biomass. For sediment-rooted macrophytes the AMRAP workshop recommended to use growth and biomass as regulatory endpoints (Maltby et al., 2010). For Myriophyllum growth rate of length and biomass might be preferred endpoints as growth rates exhibit lower variability and better statistical power than yields and are independent of test duration (ToxRat Solutions, 2012). However, for Myriophyllum, growth rates were in general less sensitive than yields. Growth endpoints might be based on a range of morphological endpoints, which are not standardized as yet. Data from the open literature may include non-standard parameters. If a parameter is relevant in view of the protection aim for that specific species group, the endpoints are included. Examples are population growth rate for Daphnia magna, or chlorophyll-a content for algae. For non-standard test species, preference is given to endpoints for parameters that

Alterra-report 2463 | 23
are applicable to related standard test species, i.e. immobility for invertebrates, mortality for fish, growth rates for primary producers. Whether or not non-standard parameters can be included in the dataset has to be judged on a case-by-case basis. Appendix 1 of the WFD-guidance gives some guidance on this point.
2.3.2 How to deal with different test durations
If endpoints are available from tests with different durations, preference is given to the endpoints from tests that followed the minimum test duration as specified in the guideline, e.g. at least 72 hours for algae, 48 hours for daphnids, 96 hours for fish. If for Daphnia magna endpoints are available from 24 and 48-hours test, the latter is preferred for risk assessment even when it is higher than the 24-hours value, since a test duration of 48 hours is prescribed in the guideline. In principle, the test duration for daphnids is considered applicable to other invertebrates as well. For algae, the test duration according to OECD 201 used to be 96 hours, but the current OECD guideline prescribes 72 hours. Both durations are accepted, the lowest is selected. Tests according to US EPA guidelines may last for 120 hours. If for the same species a shorter test is available, the endpoint from this test is used, even if it is higher than the 120-hours value. If raw data are available, a 96-hours value can be calculated and added to the dataset. For Lemna, test durations of 7 and 14 days may be used, the lowest relevant endpoint from either a 7- or 14-days test is selected.
2.3.3 How to derive a single endpoint per species: PPP Regulation (drainage ditches)
The datasets that are used for Tier 1 (AF approach with standard test species) and Tier 2 (Geomean and SSD approach) should contain one toxicity endpoint per species, and where applicable, it should be decided whether to use the endpoints for the active or formulated products. First, the geometric mean is calculated of multiple comparable toxicity values for the same species and the same endpoint, obtained in tests with the same compound. This can only be done if there are no indications that the difference in toxicity values is caused by differences in e.g. test conditions or life stages. Then, the results for different endpoints, test durations, and test compounds are compared and the lowest is taken, considering the remarks on test parameters (Section 2.3.1) and the preferred test duration (Section 2.3.2) made above. If for a certain species multiple compounds are tested and the lowest endpoint refers to a formulated product, this value is only taken into account if the tested product is subject of authorisation, otherwise the endpoint for the active is used. However, if for a species only an endpoint from a formulated product is available, this endpoint is used, even if the tested product was not subject of authorisation. Below, some examples are given. Note that all endpoints are expressed on the basis of the active substance. Example 1. The following data are available for Scenedesmus subspicatus: 72-hours ErC50 21 and 20 µg/L (active; geometric mean 20.5 μg/L), 72-hours ErC50 47, 40, and 60.6 µg/L (70% WG product; geometric mean 48.5 μg/L) and 72-hours ErC50 18.7 µg/L (600 g/L SC product). The overall lowest value of 18.7 µg/L is used for the drainage ditch assessment, since this 600 g/L SC formulation is the product under consideration for authorisation. Example 2. The following data are available for Daphnia magna: 21-days NOEC for reproduction 1290 and 320 µg/L (active), 21-days NOEC for mortality 1000 and 500 µg/L (500 g/L SC product), 21-days EC10 for growth 600 µg/L (active). The geometric mean is 642 µg/L for reproduction, and 707 µg/L for mortality. The overall lowest relevant value of 600 µg/L (EC10 for growth for the active) is used.

24 | Alterra report 2463
2.3.4 How to derive a single endpoint per species: WFD assessment
As for the drainage ditch, the geometric mean is calculated of multiple comparable toxicity values for the same species and the same endpoint, obtained in tests with the same compound. WFD-water quality standards refer to substances, and not to formulated products. Therefore, when for a given species results are available from similar tests with the active and with formulations (for comparable endpoints), it is tested whether or not the results can be pooled. In line with the procedure to judge the span of species sensitivities for MAC-derivation (see Section 8.2.4 of the main report) the geometric mean of the available values for active and products is used if the standard deviation of the log-transformed individual toxicity values is <0.5. If this is not the case, the value for the active is used. If for a species the most critical endpoint originates from a test with a formulated product, and no comparable endpoint from a test with the active is available, this endpoint is used for risk limit derivation. Below, some examples are given. Note that all endpoints are expressed on the basis of the active substance. Example 1. The following acute data are available for Scenedesmus subspicatus: 72-hours ErC50 21 and 20 µg/L (active; geometric mean 20.5 μg/L), 72-hours ErC50 47, 40, and 60.6 µg/L (70% WG product; geometric mean 48.5 μg/L) and 72-hours ErC50 18.7 µg/L (600 g/L SC product). Resulting 72-hours ErC50 values per compound are thus 20.5, 48.5 and 18.7 μg/L. The standard deviation of the log-transformed values is 0.239, indicating that the toxicity of active and products is comparable. The geometric mean of 20.5, 48.5 and 18.7 μg/L = 26.5 μg/L is used. Example 2: The following chronic data are available for Scenedesmus subspicatus: 96-hours NOErC 1.8 µg/L (active), 72-hours NOErC 3.2 µg/L (active), 72-hours NOErC 10, 3.2 and 30.2 (70% WG formulation; geometric mean 9.9 μg/L), and 72-hours NOErC 5.7 µg/L (600 g/L SC product). Resulting 72-hours NOErC values per compound are thus 3.2, 9.9 and 5.7 μg/L. The standard deviation of the log-transformed values is 0.24, indicating that the toxicity of active and products is comparable. The geometric mean of 72-hours NOErC values 3.2, 9.9 and 5.7 μg/L = 5.6 μg/L. This is higher than the 96-hours value of 1.8 μg/L, and the latter is used. Example 3. The following 21-days NOEC values are available from three tests with Daphnia magna (see Table 1). In test 2, the active and product were tested in parallel and NOECs were derived for five different endpoints. For each of the endpoints, it is first tested whether the standard deviation of the log transformed data is <0.5. Since this is the case, the geometric mean of the endpoints for active and product are taken. Comparing all resulting available endpoints, the value of 1768 μg/L for the number of neonates per adult is selected.
Table 1 21-days NOEC values for Daphnia magna. All values are expressed on the basis of the active substance. Test number Compound Test endpoint Value
[μg/L] Geomean [μg/L]
1 active adult length 1800 1800
2 active neonates per adult 1250 1768
product neonates per adult 2500
active brood size, time to 1st brood 2500 2500
product brood size, time to 1st brood 2500
active broods per adult 5000 5000
product broods per adult 5000
active mortality 20000 10000
product mortality 5000
3 active reproduction 2000 2000
active growth 4000 4000
active mortality 10000 10000

Alterra-report 2463 | 25
Example 3. The following data are available for Daphnia magna: 21-days NOEC for reproduction 1290 and 320 µg/L (active; geometric mean 642 μg/L), 21-days NOEC for mortality 1000 and 500 µg/L (500 g/L SC product; geometric mean 707 μg/L), 21-days EC10 for growth 600 µg/L (active). The overall lowest value of 600 µg/L for the active is used. Example 4. The following data are available for Lemna gibba: 14-days EC50 for dry weight 130 µg/L (active), 7-days EC50 for growth rate 31.9 µg/L based on frond area (600 g/L product) and 41.7 µg/L based on frond number (600 g/L SC product). The lowest endpoint (31.9 µg/L) is selected, because there is no comparable endpoint from a test with the active.
2.4 Guidance how to derive SSDs
For generating Species Sensitivity Distributions (SSDs) the default approach has been defined as to treat different taxonomic groups as different groups - given the prerequisite that the minimum required number of eight toxicity data is met - unless scientific arguments can be raised to consider different taxonomic groups as one group (Brock et al., 2011). A second principle is that the toxic mode-of-action of the pesticide is taken into account. In the derivation of SSDs in the light of the pesticide regulation, the toxic mode-of-action is taken as a starting point for constructing SSDs to derive acceptable concentrations. That means that SSDs are constructed with the most sensitive group. In the derivation of SSDs in the light of the Water Framework Directive, the toxic mode-of-action is considered in a second step in the generation of SSDs and is applied to construct specific SSDs. After the default approach has been followed, next steps include the extension of the dataset with other taxonomic groups of a higher taxonomic level - e.g. considering all arthropods instead of insects- and evaluate the Goodness-of-Fit by the Anderson-Darling test. If at the higher taxonomic level the SSD meets the criteria of the Anderson-Darling test, the SSD at this higher taxonomic level is considered in the risk assessment. In practice in this process the following steps can be distinguished: 1. The first step is to construct a SSD with the most sensitive taxonomic group resulting from Tier I
(e.g. insects). 2. The second step is to extend the dataset with the most related species group at a the next-higher
taxonomic level and generate a SSD at this higher taxonomic level (e.g. combine insects and crustaceans to generate a SSD at the level of arthropods).
The next steps evaluate how the taxonomic group added to the SSD fits into the sensitivity distribution of the SSD already generated. 3. Check the SSDs for their Goodness-of-Fit by means of the Anderson-Darling test. This statistical
test is especially appropriate for testing the distribution of datasets including low numbers of data. 4. Apply a standard t-test for comparison of the HC50-values. 5. Apply specific attention to the lower tail of the sensitivity distribution (see main report). 6. The SSD at the highest taxonomic level for the considered sensitive taxonomic groups that still
meets the Goodness-of-Fit criteria of the Anderson-Darling test (at least sigificance level of 0.05), is included in the risk assessment; the curves also need a visual inspection and the data points in the tail of the SSD curve should be relatively worst case (in the sense that most of the toxicity data around the HC5 and lower are on the right hand side of the fitted curve).
7. An SSD that addresses the sensitivity of fish should be based on a minimum of five toxicity data for different fish species (Campbell et al., 1999). Note that if fish species are included in the SSD for general biocides (non-specific fungicides), the aim is to derive a concentration that is protective at the population/community level. Since for fish a more stringent protection goal is adopted, it should always be checked whether the outcome meets the regulatory lower or higher-tier trigger for fish. For further details see Brock et al. (2011).
8. For fungicides for which a wide array of aquatic species seem to be sensitive, data from all taxonomic groups are recommended to be used to construct SSDs and to assess risk (Maltby et al., 2009; Van Wijngaarden et al., 2010). Note that in these SSDs also toxicity data for fish may be included. In general, data to be included in SSDs should preferably represent the level of family of order. A lower taxonomic level might be justified if feeding strategies or life history traits makes this necessary.
9. The HARAP Guidance Document (Campbell et al., 1999) does not specify the taxonomic groups and level of taxonomic resolution when selecting toxicity data for these generic SSDs. Of the

26 | Alterra report 2463
different groups of pesticides, several fungicides represent the least specific toxic mode-of-action. From this point of view, the generic SSDs as generated for fungicides might resemble the SSDs for biocides. For those fungicides that are general biocides, a default approach could be to include toxicity data from at least eight different taxa of six different taxonomic groups in the SSD. These data include three to five toxicity data already generated in the first tier and five to three additional toxicity data (including fish). The available guidance on pesticides does not yet give further recommendations on which taxa have to be included in SSDs for fungicides.
10. The family or order level is taken as a criterion to distinguish different taxonomic groups for fungicides. According to the draft Aquatic Guidance Document (in prep.), at least six different families or orders should be present in a SSD for biocidal fungicides.
11. If a SSD for a fungicide with a less specific toxic mode-of-action does not meet the goodness-of-fit criteria of the Anderson-Darling test, separate SSD curves need to be constructed and the most sensitive distribution that meets the goodness-of-fit criteria of the Anderson-Darling test will be used in the risk assessment. E.g. non-invertebrates might be separated from vertebrates. Arthropods might be separated from non-arthropods and within the group of primary producers, macrophytes might be separated from algae (Maltby et al., 2009).
12. For those fungicides for which a certain taxonomic group is clearly more sensitive - i.e. at least a factor of 10 more sensitive than other taxonomic groups - it is recommended, in first instance, to construct a SSD with toxicity data from this taxonomic group. When more toxicity data are available, it has to be checked which most related species group at a the next-higher taxonomic level can be included in the SSD in order to generate a SSD at a higher taxonomic level (see procedure described under 2).

Alterra-report 2463 | 27
3 Example insecticide IN
3.1 Relevant properties and exposure profile of Insecticide IN
3.1.1 Information on use and characteristics
Insecticide IN is a neonicotinoid insecticide. The neonicotinoids are a class of insecticides with a common mode of action that affects the central nervous system of insects, causing paralysis and death. Neonicotinoids block a specific neural pathway that is more abundant in insects than warm-blooded animals. They bind at a specific site, the postsynaptic nicotinic acetylcholine receptor. As a group they are effective against sucking insects such as aphids, but also chewing insects such as Coleoptera and some Lepidoptera. Insecticide IN is used in a wide range of different crops, including apples, tomatoes, sugar beet and maize. Because of its systemic properties it can be applied as treated seeds, but it is also applied via spraying and drip irrigation in greenhouses. Relevant physico-chemical and environmental properties are presented below:
Table 2 Physico-chemical and environmental properties of insecticide IN.
Substance type Insecticide
Substance group Neonicotinoid
Molar mass 255.7 g/mol
Solubility in water 610 mg/L (20°C)
log Kow 0.57
DegT50 in soil 118 d (20°C; pF 2)
DegT50 in water (Tier-1 value) 1000 d (20°C)
DegT50 in water (Tier-2 value) 21 d (20°C)
DegT50 in sediment 1000 d (20°C)
Kom soil, sediment, suspended solids 131 L/kg
1/n 0.8 -
Saturated vapour pressure 4.0E-10 Pa (20°C)
3.1.2 Exposure profiles
The exposure concentrations of IN is calculated for application in lilies (2x; 0.07 kg/ha on 1 and 8 May). The predicted Tier-1 exposure profiles on the basis of the new Dutch ditch scenario using the DegT50 in water of 1.000 days are presented in the upper panel of Figure 1. Exposure profiles are given for 50% drift reduction (blue line) and 95% drift reduction (red line). The exposure profile simulating 50% drift reduction is characterised by a PECmax of 1.154 µg/L. This peak concentration is caused by drainage input in September. The highest 7-days Time Weighted Average PEC (TWA PEC) and 21-days TWA PEC values for the 50% drift reduction profile are 1.126 µg/L and 1.088 µg/L, respectively. The exposure profile simulating 95% drift reduction is characterised by a PECmax of 0.818 µg/L (December). The highest 7-days TWA PEC and 21-days TWA PEC values for the 95% drift reduction profile are 0.802 µg/L and 0.713 µg/L, respectively. The Tier-1 exposure data for IN illlustrate that the differences in peak and long-term exposure concentrations are relatively small. The predicted Tier-2 exposure profiles using the DegT50 in water of 21 days are presented in the lower panel of Figure 1, representing 50% (blue line) and 95% (red line) drift reduction. The exposure

28 | Alterra report 2463
profile simulating 50% drift reduction is characterised by a PECmax of 0.944 µg/L. This peak concentration is caused by drift input in May. The highest 7-days TWA PEC and 21-days TWA PEC values for the 50% drift reduction profile are 0.789 µg/L and 0.669 µg/L, respectively. The exposure profile simulating 95% drift reduction is characterised by a PECmax of 0.683 µg/L (November). The highest 7-days TWA PEC and 21-days TWA PEC values for the 95% drift reduction profile are 0.654 µg/L and 0.609 µg/L, respectively.
Figure 1 Tier-1 (upper panel) and Tier-2 (lower panel) exposure profiles for insecticide IN on the basis of the new Dutch ditch scenario and 50% (blue line) and 95% (red line) drift reduction.
3.2 Laboratory toxicity data
The full laboratory dataset for insecticide IN is presented in Appendix 1. The dataset consists of the dossier data submitted for the European and national authorisation under Directive 91/414/EC, and data from the open literature. By including literature data, we anticipate the situation under the new Regulation 1107/2009/EC which requires that open literature should be added to the dossier. We therefore also consider the situation that additional data are available from literature references that appeared to be scientifically valid upon evaluation. For the verification, different situations are

Alterra-report 2463 | 29
explored, i.e. starting with the data from the dossier and including additional data from the open literature.
3.3 First tier risk assessment for drainage ditches
3.3.1 Regulatory Acceptable Concentrations for aquatic organisms based on core dataset
In order to verify the assumption that a first tier assessment with the core data alone is protective, a first tier assessment is performed using only the endpoints from the core dataset required according to Annex II (see Table 5-1 and 5-2 of the main report). These data are presented in Table 3 (acute) and Table 4 (chronic). In some cases, the notifier submitted more than one test with the same species. A single value per species is derived according to the procedures described in Section 2.3.3. All endpoints are expressed on the basis of the active substance. Algae For algae, tests with Pseudokirchneriella subcapitata and Scenedesmus subspicatus are present in the dossier, but these did not result in > 50% effect at the highest concentration tested. The limit test with the lowest concentration is included here. Arthropods According to Annex II, a second crustacean has to be tested in case of insecticides. Americamysis bahia is mentioned as test species, but it is indicated that other more relevant freshwater species, e.g. Chironomus sp. may be used if guidelines or protocols are available. In the present case study, the notifier submitted data on both species, and we consider them as belonging to the core dataset. For A. bahia as well as Chironomus riparius, two comparable tests with the active are available, and the geometric mean values are used. According to the new Annex II, a chronic test should have been performed with A. bahia, since this was the most sensitive species in the acute tests. However, no such studies are available. The chronic data requirements introduce another problem. For insects, 28-days studies with C. riparius are required, but these studies are in fact modified exposure tests in the presence of sediment. According to the ELINK-workshop, these tests may be considered as higher tier studies. For the present exercise, however, the endpoints are used as indicated in Annex II. Fish For fish, two tests with Oncorhynchus mykiss are available. One of these did not result in >50 % effect at the highest concentration tested. The result of the other test, in which an extended concentration range was applied, is used here.

30 | Alterra report 2463
Table 3 Acute toxicity of insecticide IN to aquatic organisms, core data according to Annex II. All values are expressed on the basis of the active substance.
Taxon/species Test Criterion Value compound [μg/L] Algae Scenedesmus subspicatus active EC50 > 10000 Crustaceans Americamysis bahia active LC50 35.9 Daphnia magna active EC50 85000 Insects Chironomus riparius active LC50 55.2 Fish Oncorhynchus mykiss active LC50 211000
Table 4 Chronic toxicity of Insecticide IN to aquatic organisms, core data according to Annex II. All values are expressed on the basis of the active substance.
Taxon/species Test compound Criterion Value [µg/L]
Crustaceans Daphnia magna active NOEC 1800 Insects Chironomus riparius product EC10 2.6a Fish Oncorhynchus mykiss active NOEC 9020
a Water/sediment test; endpoint based on nominal initial concentration in the water phase.
For each taxon, the most critical endpoint is selected and the Regulatory Acceptable Concentration (RAC; based on active substance) is determined using the appropriate assessment factor (Table 5). The lowest RACs are indicated in bold.
Table 5 Acute and chronic RAC for Insecticide IN based on core data according to Annex II. All values are expressed on the basis of the active substance.
Time scale Taxon Critical endpoint [µg/L]
AF RAC [µg/L]
Acute Algae > 10000 10 > 1000 Crustaceans 35.9 100 0.359 Insects 55.2 100 0.552 Fish > 83000 100 > 830 Chronic Crustaceans 1800 10 180 Insects 2.6 10 0.26a Fish 9020 10 902
a RAC refers to initial concentration in the water phase.
3.3.2 Bioconcentration and secondary poisoning
Because the log Kow is < 3 (see Table 2) no RAC for bioconcentration in the aquatic food chain has to be calculated.

Alterra-report 2463 | 31
3.4 Higher tier assessment
3.4.1 Derivation of the RAC using (a limited number of) additional data
In the dossier several additional species are available for taxonomic groups that are represented by the standard test species and for taxonomic groups not represented by standard tests. Since for the acute assessment enough data are available for construction of an SSD, the geometric mean approach is only considered for the chronic assessment. The geometric mean values for each group of organisms are presented in Table 6. The chronic RAC for insects has decreased from 0.26 µg/L to 0.124 µg/L (both for insects) and the chronic RACs for crustaceans and fish have decreased from 180 and 902 µg/L, to 33.9 and 329 µg/L.
Table 6 Chronic geomean RAC-values for insecticide IN. All values are based on the active substance.
Time scale Taxon Geometric mean [µg/L]
Number of data AF RAC [µg/L]
Chronic Crustaceans 339 2 10 33.9 Fish 3290 2 10 329 Insects 1.24 2 10 0.124
3.4.2 Derivation of the RAC using SSDs
For insecticide IN, SSDs are constructed based on acute toxicity data only, as the available chronic data do not meet the minimum required number of eight datapoints. The data used for generating the SSDs for IN are presented in Table 7. For species for which multiple test endpoints are available, the footnotes describe how the single value per species is derived according to the methods described in Section 2.3.3.
Table 7 Aggregated acute toxicity data of insecticide IN used to construct the SSDs for arthropods. All values are expressed on the basis of the active substance.
Crustaceans Insects Taxon/species L/EC50
[µg/L] Taxon/species L/EC50
[µg/L] Ceriodaphnia dubia 2.07 Baetis rhodani 1.72 Chydorus sphaericus 832 Centroptilum triangulifer 4.98 Cypretta seuratti 1 Chironomus riparius 55.2 Cypridopsis vidua 10d Chironomus tentans 7.8a Americamysis bahia 35.9e Cloeon dipterum 43.33 Gammarus pulex 110f Epeorus assimilus 5.06 Hyalella azteca 55g Epeorus longimanus 0.65b Illyocrypsis dentifera 3g Habrophlebia lauta 31.18 Hydropsyche sp. 23.07 Leuctra sp. 8.57 Simulium vittatum 8.1c Siphonoperla sp. 8.63
a: geometric mean of 10.5 and 5.75 μg/L, 96-hours LC50 from tests with active substance.
b: most sensitive life stage and test duration, 96-hours LC50 for late-instar larvae; test with formulated product (no test with active substance
available).
c: geometric mean of 6.75, 8.25 and 9.54 μg/L, 48-hours LC50 from tests with active.
d: lowest relevant parameter: immobility.
e: geometric mean of 37.7 and 34.1 μg/L, geometric mean of tests with active (35.9 μg/L) is lower than endpoint from test with product (36
μg/L).
f: most sensitive minimum test duration, 48 hours .
g: most sensitive endpoint, immobility.

32 | Alterra report 2463
For generating SSDs the default approach has been followed as described in Paragraph 2.4. The first step is to contruct a SSD with the most sensitive taxonomic group for IN resulting from Tier 1, i.e. insects, which are clearly more sensitive than crustaceans. The second step is to extend this dataset with the crustaceans - excluding Daphnia, which is not sensitive - and generate a new SSD on the taxonomic level of Arthropoda with this extended dataset. The generated SSDs were checked for their fit by means of the Anderson-Darling test. The SSD curve for insects is presented in Figure 2. The SSD passes the Anderson-Darling goodness-of-fit test for normality at the 5% significance level. The median HC5 deduced from this curve is 0.983 µg/L, with a lower limit of 0.253 µg/L and a higher limit of 2.22 µg/L. The SSD for the combined group of insects and crustacea (excluding D. magna) is presented in Figure 3. The calculations pass the Anderson-Darling goodness-of-fit test at the 5% significance level. The HC5 for the combined dataset is slightly lower than the value for insects alone, i.e. 0.646 µg/L with a lower limit of 0.183 µg/L and a higher limit of 1.53 µg/L. Nonetheless, both SSDs overlap and therefore the SSD on the higher level of arthropods is used in the risk assessment. The pesticide decision tree suggests to apply an AF of 3, if the DT50 of the compound exceeds ten days and/or if the exposure profile is characterised by several pulse exposures that are toxicologically dependent. Based on this criterion, the SSD-RAC is 0.215 µg/L.
Figure 2 Species Sensitivity Distribution for insecticide IN based on twelve insect data (see Table 7).
Figure 3 Species Sensitivity Distribution for insecticide IN based on twenty arthropod data (see Table 7).

Alterra-report 2463 | 33
3.4.3 Derivation of the RAC using micro-/mesocosm studies
Available micro-/mesocosm studies One valid GLP microcosm experiment was available with a detailed description in the DAR. This study concerned an outdoor experimental pond study performed in Germany, treated two times with IN at a three weeks interval and focusing on treatment-related responses of zooplankton, macro-invertebrates, phytoplankton and periphyton. In addition, two scientific papers could be retrieved from the open literature in which the ecological impact of pulsed exposures to IN was studied in outdoor stream microcosms located in North America and with a focus on benthic insect populations. Although in these scientific papers detailed background information (e.g. basic data on which calculations are based) is not provided, the results presented in these papers can be used as additional information to put the GLP experimental pond study in perspective. A summary of the valid GLP experimental pond study is presented below in Table 8, a summary of non-GLP experimental stream study A is presented in Table 9.
Table 8 Overall summary of Effect class responses observed for several categories of endpoints in the outdoor experimental pond study treated twice (interval 21 days) with insecticide IN. Within each category the most sensitive population/community level endpoint was selected. The Effect class concentrations are expressed in terms of the nominal treatment concentrations, the measured peak concentration and 2-, 7- and 21-days time weighted average (TWA) concentrations, respectively, expressed on the basis of the active substance. * = responses can at least in part be explained as resulting from indirect effects.
Concentration [μg/L] Nominal 0.6 1.5 3.8 9.4 23.5 Peak 0.60 1.71 4.40 10.72 26.44 48-hours TWA 0.55 1.57 4.05 9.86 24.32 7-days TWA 0.45 1.29 3.32 8.09 19.96 21-days TWA 0.28 0.80 2.06 5.02 12.37 Population responses
Insects 1-2 3A 3A 3A 3A – 5B * Other macroinvertebrates 1 1 1 5A * 5B * Cladocera 1 1 1 1 3B-5A Copepoda 1 1 1 1 3A Rotifera 1 1-2 * 1-2 * 1-2 * 3A * Phytoplankton 1 2 * 3A * 3A * 3A * Periphyton 1 1-2 * 2 * 3A * 3A *
Community responses Insect in emergence traps 1 3A 3A 3A 5B Macroinvertebrates on artificial substrates
1 1 1 3A * 5B *
Macroinvertebrates in sediment samples
1 1 1 5A * 5B *
Zooplankton 1 1 1 2-3A 3A-3B Phytoplankton 1 3A * 3A * 3A*-3B * 3B * Community metabolism (DO-
pH-conductivity) 1 3A * 3A * 3A * 3A *
Overall Effect class on basis of the most sensitive endpoint
1-2 3A 3A 5A 5B

34 | Alterra report 2463
Table 9 Overall summary of Effect class responses observed for several categories of endpoints in outdoor experimental stream study A, treated three times with 24-hours pulse exposures (interval seven days) of insecticide IN. Concentrations are expressed on the basis of the active substance. Within each category the most sensitive endpoint was selected. ↓= decrease in abundance.
Concentration [μg/L] Measured mean concentration of the 24-h pulse exposures 1.63 17.60 EPT insect taxa * (semi-/univoltine)
1-2↓ 4↓
Diptera (chironomids; multi-voltine) 1 1 Coleoptera 1 1-2↓ Oligochaeta 1 4↓ Microbial decomposition 1 1 Overall Effect class on basis of the most sensitive endpoint 1-2 4
*Ephemeroptera, Plecoptera, Trichoptera
A summary of the effects observed in the non-GLP experimental stream study B is presented below. This experimental steam study studied the impact of pulsed and continuous exposure to IN on two univoltine insects populations (Epeorus sp.; Baetis sp.). Continuous exposure (20 d) • Heptageniid nymphs (Epeorus sp.) abundance: reduced at 0.8 µg/L ==>NOEC: 0.3 µg/L emergence: reduced ≥ 0.3 µg/L ==>NOEC: 0.1 µg/L adult male thorax length: reduced ≥ 0.3 µg/L ->NOEC: 0.1 µg/L
• Baetid nymphs (Baetis sp.): abundance: reduced at 0.8 µg/L ->NOEC: 0.3 µg/L emergence: NOEC > 0.8 µg/L adult male head length: reduced ≥ 0.1 µg/L ->NOEC: < 0.1 µg/L
Pulse exposure (12 h) • Heptageniid nymphs (Epeorus sp.) abundance: reduced at 9.1 µg/L ->NOEC: 3.9 µg/L emergence: reduced at 9.1 µg/L ->NOEC: 3.9 µg/L adult male thorax length: reduced ≥ 0.1 µg/L -> NOEC: < 0.1 µg/L
• Baetid nymphs (Baetis sp.) abundance: NOEC > 9.1 µg/L emergence: NOEC > 9.1 µg/L adult male head length: reduced ≥ 0.1 µg/L -> NOEC: < 0.1 µg/L
Acute RAC derivation on basis of micro-/mesocosm experiments In the GLP outdoor experimental pond study the overall diversity of arthropods (crustaceans and insects) was relatively high. However, concern was raised that the majority of insects present were bi- to multi-voltine (two or more generations per year), while the number of semi/uni-voltine insects (one or less than one generation per year) was relatively low (except Odonata). Note, however, that the non-GLP experimental stream study A (Table 9) focused on effects of IN on Ephemeroptera, Plecoptera and Trichoptera, characterized by semi/uni-voltine life cycles. In this experimental stream study three repeated 24-hours pulse exposures (interval of seven days) were applied and a mean measured 24-hours pulse concentration of 1.63 µg/L represented the Effect class 1-2 concentration for Ephemeroptera, Plecoptera and Trichoptera. Clear effects without recovery (Effect class 4; test duration 21 days after first pulse exposure) were observed at a mean 24-hours pulse concentration of 17.60 µg/L.

Alterra-report 2463 | 35
In experimental stream study B, population level effects on two univoltine insects were observed at repeated (twelve hours) pulse exposures higher than 3.9 µg/L. In this study, however, effects at thorax/head length of Epeorus and Baetis were observed at pulsed exposure concentrations as low as 0.1 µg/L. Since we do not know the ecological consequence of effects on thorax/head length of insects, we assume on the basis of the additional information of experimental stream studies A and B the lowest Effect class 3A concentrations of the GLP outdoor pond study (nominal 1.5 µg/L) can be used in the effect/risk assessment when addressing the 'Ecological recovery option'. In addition, we assume that the Effect class 1-2 concentration of the GLP outdoor pond study (nominal 0.6 µg/L) can be used in the effect/risk assessment when addressing the 'Ecological threshold option'. In the acute effect assessment Effect classes expressed in terms of the measured peak concentration may be used to derive the RAC if the exposure in the micro-/mesocosm experiment is relatively worst case for the exposure in the field. An overall dissipation DT50 of 8.2 days for IN was observed in the water column of the GLP outdoor experimental pond study. Consequently, it has to be concluded that this dissipation is faster than the overall water dissipation that can be derived from the calculated Tier-2 exposure profile for the Dutch ditch scenario (Figure 1). This observation is in conflict with the recommendation that the exposure in the micro-/mesocosm experiment should be realistic-worst case. Under these circumstances, and for a proper effect/risk assessment, the concentration-response relationships as observed in the outdoor pond experiment should not be expressed in terms of nominal or measured peak concentrations. To overcome this problem we decided to use Effect class concentrations expressed in terms of the 48-hours TWA concentration (as recommended for the acute effect assessment for WFD water bodies in section 8.4.4.2 of the main report), resulting in an Effect class 1-2 concentration of 0.55 µg/L and the lowest Effect class 3A concentration of 1.57 µg/L. The acute RAC addressing the ecological threshold option is derived by applying an AF of 2 (see Table 6-5 of main report) to the 48-hours TWA Effect class 1-2 concentration (0.55 µg/L) resulting in an acute RACETO of 0.275 µg/L. The acute RAC addressing the ecological recovery option is derived by applying an AF of 3 to 4 (see Table 6-5 of main report). An AF of 3 was selected since the available mesocosm study is considered of sufficient quality and supporting open domain information on concentration-reponse relationships for univoltine insects is available. Applying an AF of 3 to the 48-hours TWA Effect class 3A concentration (1.57 µg/L) results in a provisional acute RACERO of 0.52 µg/L (see decision scheme 6-1 of main report). This provisional acute RACERO of 0.52 µg/L and the acute RACETO of 0.275 µg/L have to be plotted on the Tier-2 exposure profile of insecticide IN (Figure 4) for the final decision (for rationale see section 4.3 of main report). The data presented in Figure 4 clearly illustrate that in both Tier-2 exposure profiles (with 50 and 95% drift reduction) the PECmax is higher than the acute RACETO and the provisional acute RACERO, indicating unacceptable risks. These data also show that a final acute RACERO cannot be derived since the acute RACETO is exceeded for a longer period than eight weeks in both exposure profiles.

36 | Alterra report 2463
Figure 4 Acute RACs derived from the GLP outdoor pond experiment plotted on the Tier-2 IN exposure profiles assessed for 50% drift reduction (blue line) and 95% drift reduction (red dotted line).
Chronic RAC derivation on basis of micro-/mesocosm experiments An important question at stake is whether the GLP pond study can be used for the chronic risk assessment as well, considering the fact that IN was relatively persistent in the water column. Note e.g. that at the moment of the second application approximately 10 to 20 % of the dose of the first application was still present in the water column. In the effect assessment described below it is assumed that the 21-days TWA concentration is suitable to express the Effect class concentrations that can be used in the chronic risk assessment. In the GLP experimental pond study the 21-days TWA Effect class 1-2 concentration is 0.28 µg/L, while the 21-days TWA Effect class 3A concentration is 0.80 µg/L (see Table 8). The chronic RAC addressing the ecological threshold option is derived by applying an AF of 2 (see Table 6-6 of main report) to the 21-daysTWA Effect class 1-2 concentration (0.28 µg/L) resulting in an chronic RACETO of 0.14 µg/L. Note that this value is lower than the Tier-1 chronic RAC. The chronic RAC addressing the ecological recovery option is derived by applying an AF of 3 to 4 (see Table 6-6 of main report) to the 21-days TWA Effect class 3A concentration. An AF of 3 is selected since the mesocosm study is considered of sufficient quality and additional information on concentration-response responses for univoltine insects is provided. Applying an AF of 3 to the 21-days TWA Effect class 3A concentration of 0.80 µg/L results in a provisional chronic RACERO of 0.267 µg/L. Considering the predicted Tier-2 exposure profiles (see Figure 5) it is obvious that a definitive chronic RACERO cannot be derived because predicted exposure concentrations are higher than the chronic RACs in the course of a considerable part of the year. The final chronic risk assessment should therefore be derived by comparing the Tier-2 PECmax (95% drift reduction 0.683 µg/L) or the Tier-2 7-days TWA PEC (95% drift reduction 0.654 µg/L) with the chronic RACETO (0.14 µg/L). Consequently, also chronic risks are identified for insecticide IN in Dutch edge-of-field surface waters.

Alterra-report 2463 | 37
Figure 5 Chronic RACs derived from the GLP outdoor pond experiment plotted on theTier-2 IN exposure profiles assessed for 50% drift reduction (blue line) and 95% drift reduction (red dotted line).
3.5 Risk assessment for drainage ditches
Below, the derived RACs for insecticide IN (rounded values) are summarised in Table 10. From this table it is obvious that the first tier RACs are higher than those obtained in the higher tiers. It is concluded that the assumption that the first tier is protective for higher tiers is not valid. As stated above, the Ecological Recovery Option is not applicable for both the acute and the chronic mesocosm-based RAC, since the predicted exposure profiles are higher than the provisional chronic RACETO (and RACERO) for a large part of the year.
Table 10 Summary of first and higher tier critical RACs for insecticide IN. All values are in μg/L, expressed on the basis of the active substance.
Time scale 1st tier higher tier geomean SSD mesocosm (ETO) mesocosm (ERO) acute 0.36 n.d. 0.22 0.28 n.a. chronic 0.26 0.124 n.d. 0.14 n.a.
n.d. = not derived; n.a. = not applicable.
Table 11 summarises the PECs for insecticide IN for 50 and 95% drift reduction based on first tier and second tier calculations (see Section 3.1).
Table 11 Summary of first and second tier PECs for insecticide IN. All values are in μg/L, expressed on the basis of the active substance.
Exposure profile
50% drift reduction 95% drift reduction PECmax 7-d TWA PEC 21-d TWA PEC PECmax 7-d TWA PEC 21-d TWA PEC
First tier 1.2 1.3 1.1 0.82 0.80 0.71 Second tier 0.94 0.79 0.67 0.68 0.65 0.61

38 | Alterra report 2463
The acute RACs should be compared with the estimated initial concentration (PECmax). With respect to the chronic RACs, it should be decided whether or not time weighted average concentrations can be used for a comparison of the chronic RAC and PEC (see Section 3.3 of the main report). The TWA PEC is not applicable in case the RACs are derived from studies in which the exposure concentration is not maintained during the tests. This is the case for the first tier chronic RAC that is based on the initial concentration in the water phase of a water/sediment system (see Table 6) and a comparison with the PECmax is considered most appropriate. This also holds for the chronic RAC based on the geomean method. As indicated above, the mesocosm-based chronic RACETO derived from the mesocosm studies may be compared with the PECmax and/or 7-days TWA PEC. The comparison of the first and higher tier RACs with the respective 2nd tier PECs is presented below. Since the PEC/RAC is greater than 1 in all cases, a potential risk is identified for all tiers.
Table 12 Ratios of PEC and RAC for insecticide IN. Values greater than 1 indicate a risk, empty cells indicate that the combination of PEC and RAC is not applicable.
Time scale RAC [μg/L]
PEC/RAC based on 2nd tier PEC PECmax 50% DR [0.94 μg/L]
PECmax 95% DR [0.68 μg/L]
7-d TWA PEC 50% DR [0.79 μg/L]
7-d TWA PEC 95% DR [0.65 μg/L]
acute first tier 0.36 2.6 1.9 SSD 0.22 4.3 3.1 mesocosm (ETO) 0.28 3.4 2.4 mesocosm (ERO) chronic first tier 0.26 3.6 2.6 geomean 0.124 7.6 5.5 mesocosm (ETO) 0.14 6.7 4.9 5.6 4.6 mesocosm (ERO)
3.6 Effect and risk assessment procedure underlying the Water Framework Directive
3.6.1 Monitoring data
Monitoring data for insecticide IN on WFD-monitoring locations were obtained from the Bestrijdingsmiddelenatlas over 2007-2009. First, all datapoints were selected with concentrations above the reporting limit. Next, those locations were selected for which at least monthly measurements were available. This resulted in about nine locations with useful data. For these locations, the following concentrations were calculated where possible: annual average, average over the three months with the highest concentrations and maximum concentration. Note that this procedure may be different from current practice, where datapoints below the reporting limits may be included as half of the reporting limit. For the purpose of this verification report, it is considered more useful to rely on measured values only, rather than on estimated concentrations on the basis of reporting limits. As an example, concentration profiles are presented for two monitoring stations which are located in areas used for arable farming (i.e. greenhouse or fruit culture excluded). A summary of the resulting values is presented in Table 13, and in the figures below.

Alterra-report 2463 | 39
Table 13 Monitoring data for insecticide IN.
Location number
Year Annual average [ng/L]
3-Months average [ng/L]
Maximum [ng/L]
1 2007 322 403 (January-March) 720 2008 276 343 (January-March) 520 2009 n.a. 467 (January-March) 810 2 2007 130 230 (May-July) 380 2008 74.5 115 (April-June) 250
n.a. = not available.
Figure 6 Concentration profile of location 1, x-axis represents monitoring dates, y-axis represents measured concentrations of insecticide IN in ng/L.
Figure 7 Concentration profile of location 2, x-axis represents monitoring dates, y-axis represents measured concentrations of insecticide IN in ng/L.
3.6.2 Aquatic toxicity data
The aggregated ecotoxicity data for insecticide IN are presented in the tables below for freshwater and marine species. The tables contain the lowest value per species, generated according to the methods in Section 2.3.4, see also the footnotes to the table. All values are expressed on the basis of the active substance.

40 | Alterra report 2463
Table 14 Aggregated toxicity data of insecticide IN for freshwater species.
ACUTE CHRONIC Taxon/species L/EC50
[µg/L] Taxon/species NOEC/EC10
[µg/L] Bacteria Algae Vibrio fischeri 61900 a Desmodesmus subspicatus 106000 l Algae Pseudokirchneriella subcapitata < 100000 b Desmodesmus subspicatus 212424 b Scenedesmus subspicatus 10000 Pseudokirchneriella subcapitata >100000 c Crustaceans Scenedesmus subspicatus >10000 c Daphnia magna 1768 m Crustaceans Hyalella azteca 0.47 n Ceriodaphnia dubia 2.07 Insects Chydorus sphaericus 832 Chironomus riparius < 0.4b,o Cypretta seuratti 1 Chironomus tentans 0.42 p Cypridopsis vidua 10 d Sericostoma vittatum ≥ 5.0 q Daphnia magna 45616 e Fish Gammarus pulex 110 f Danio rerio 300000 Hyalella azteca 55 f Oncorhynchus mykiss 1200 r Illyocrypsis dentifera 3o Insects Baetis rhodani 1.72 Centroptilum triangulifer 4.98 Chironomus riparius 55.2 Chironomus tentans 7.8 g Cloeon dipterum 43.33 Epeorus assimilus 5.06 Epeorus longimanus 0.65 h Habrophlebia lauta 31.18 Hydropsyche sp. 23.07 Leuctra sp. 8.57 Simulium vittatum 8.1 i Siphonoperla sp. 8.63 Fish Danio rerio 227099 j Leuciscus idus melanotus 237000 Oncorhynchus mykiss 211000 Annelids Lumbriculus variegates 6.2 k
a: considered as freshwater species since tested in distilled water; endpoint from test with active substance in distilled water; toxicity of
formulated product is similar. b: geometric mean of 389000 and 116000 μg/L, endpoint growth rate from test with active and product; difference between active and product
small enough to allow for pooling. c: unbound values are not used for QS derivation, data included to show that species has been tested. d: lowest relevant parameter: immobility. e: geometric mean of 69361 (geometric mean of endpoint immobility in tests with active substance) and 30000 μg/L (test with product);
difference between active and product small enough to allow for pooling. f: most sensitive minimum test duration, 48 hours. g: geometric mean of 10.5 and 5.75 μg/L, 96-hours LC50 from tests with active substance. h: most sensitive life stage and test duration, 96-hours LC50 for late-instar larvae; test with formulated product (no comparable test with active
substance available). i: geometric mean of 6.75, 8.25 and 9.54 μg/L, 96-hours LC50 from tests with active. j: geometric mean of 241000 and 214000 μg/L, endpoint mortality from test with active and product; difference between active and product
small enough to allow for pooling. k: endpoint from test with formulated product (no comparable test with active substance available). l: endpoint from test with the active substance, difference between active and product too large to take geometric mean; Desmodesmus
subspicatus is sometimes considered the same species as Scenedesmus subspicatus, but according to algaebase.org this is not the case. m: geometric mean of 1250 and 2500 μg/L, overall lowest relevant endpoint from tests with active and product (see Example 2 in Section 2.3.4). n: lowest endpoint from test with longest duration, 28-days LC10; test with formulated product (no comparable 28-d endpoints from test with
active available). o: lowest relevant endpoint, development rate; test with formulated product (no comparable test with active available). p: lowest endpoint from test with longest duration, 28-days LC10. Test with formulated product (no comparable 28-d endpoints from test with
active available). q: lowest relevant endpoint, mortality; test with formulated product (no comparable test with active available). r: lowest relevant endpoint, growth.

Alterra-report 2463 | 41
Table 15 Aggregated toxicity data of insecticide IN for marine species.
ACUTE CHRONIC Taxon/species L/EC50
[µg/L] Taxon/species NOEC/EC10
[µg/L] crustaceans Molluscs Americamysis bahia 35.9 a Crassostrea virginica ≥ 23300 b,d molluscs Crassostrea virginica >145000 b,c fish Cyprinodon variegatus 161000
a: geometric mean of 37.7, 34.1 and 36 μg/L, 96-hours LC50 from tests with active substance and product; difference between active and
product small enough to allow for pooling.
b: unbound values are not used for QS derivation, data included to show that species has been tested.
c: highest concentration without 50% effect.
d: lowest concentration without effect.
3.6.3 Pooling of data for freshwater and marine species
According to the guidance, data for freshwater and marine species may be pooled since there are too few data to perform a meaningful statistical comparison and there are no further indications (spread of the data, read-across, expert judgement) of a difference in sensitivity between freshwater versus marine organisms of the relevant taxonomic groups.
3.6.4 Derivation of the QSfw, eco and MAC-QSfw, eco using the assessment factor approach
Acute toxicity data are available for 31 species, representing seven taxa (bacteria, algae, crustaceans, insects, molluscs, fish and annelids). The acute base set (algae, Daphnia, fish) is available. Chronic data are available for eleven species, representing five taxa (algae, crustaceans, insects, molluscs and fish). The lowest acute endpoint is the 96-hours LC50 of 0.65 µg/L for the mayfly Epeorus longimanus, the lowest chronic endpoint is the 28-days LC10 of 0.42 µg/L for the midge Chironomus tentans. There are substantial differences within taxa, and even between related species in a taxon (see e.g. Ceriodaphnia dubia and Daphnia magna, or Epeorus assimilus and E. longimanus). In addition, differences are not consistent between acute and chronic data. The acute endpoint for Chironomus tentans is a factor of seven lower than that for C. riparius, while the latter seems to be more sensitive after chronic exposure. Differences in test duration may be important, since for C. tentans the LC10 for mortality decreases from 1.33 to 0.42 µg/L after elongation of the test from 10 to 28 days (see Appendix 1 and Table A1.2). On the other hand, the EC10 and NOEC for growth do not differ between 10 and 28 days, and seem to be comparable for the two chironomid species. The QSfw, eco may be derived by putting an assessment factor of 10 to the lowest chronic endpoint, provided that the potentially most sensitive taxonomic group is represented in the dataset. Insects are present in the chronic dataset, and using the LC10 of 0.42 µg/L for the insect C. tentans with an assessment factor of 10, a QSfw, eco of 0.042 µg/L (42 ng/L) may be derived. It is noted, however, that lower endpoints have been derived for C. riparius, and that the lowest endpoint for this species is a <-value (<0.4 µg/L for development rate in a 10-days test). It is also noted that the lowest chronic endpoint of 0.42 µg/L is only slightly lower than the acute LC50 of 0.65 µg/L for E. longimanus. For those species for which acute and chronic data are available, it appears that there is more than a factor of 10 difference between acute and chronic endpoints (see D. magna, Hyalella azteca, C. riparius and C. tentans). This would probably mean that a chronic test with mayflies would lead to a lower endpoint than found for C. tentans. However, from the mesocosm experiment B (see section 3.4.3), it appears that emergence and abundance of Epeorus sp. is not affected after continuous exposure to 0.1 µg/L. For Baetis sp., which is another univoltine species, NOEC-values of 0.3 and 0.8 µg/L were obtained. This indicates that an assessment factor of 10 on the lowest LC10 would most likely be sufficiently protective, and the QSfw, eco is set to 0.042 µg/L (42 ng/L).

42 | Alterra report 2463
According to the guidance, the MAC-QSfw, eco, may be derived applying an assessment factor of 10 to the lowest acute endpoint in case the compound has a known mode of toxic action and a representative species for the potentially most sensitive taxonomic group is included in data set. Using the LC50 of 0.65 µg/L for the insect E. longimanus with an assessment factor of 10, the MAC-QSfw, eco is 0.065 µg/L (65 ng/L).
3.6.5 Derivation of the QSfw, eco and MAC-QSfw, eco using the SSD approach
There are not enough chronic data to derive a QSfw, eco using the SSD-approach, since valid NOEC or EC10-values are available for four taxonomic groups only. Regarding the MAC-QSfw, eco, the requirements for an acute SSD are listed below, with the respective species from the dataset indicated. 1. Fish: Danio rerio (family Cyprinidae). 2. A second family in the phylum Chordata: Oncorhynchus mykiss (family Salmonidae). 3. A crustacean: Cypretta seuratti. 4. An insect: Epeorus longimanus. 5. A family in a phylum other than Arthropoda or Chordata: Lumbriculus variegatus. 6. A family in any order of insect or any phylum not already represented: Vibrio fischeri. 7. Algae: Desmodesmus subspicatus. 8. Higher plants: no data. It is noted that the acute dataset does not contain the required eight taxa, but it can be argued that macrophytes do not belong to the potentially sensitive species. Therefore, it is considered justified to explore the SSD-approach for derivation of the MAC-QSfw, eco. The median estimate of the HC5 is 0.077 µg/L with upper- and lower limit 0.0059 and 0.51 µg/L. The Anderson-Darling goodness-of-fit is rejected at all levels. The SSD-graph is presented below in Figure 8. The poor fit confirms that in view of the specific mode of action of insecticide IN, a generic SSD is not appropriate. For this situation, the WFD-guidance offers the possibility to construct a specific SSD for the sensitive taxonomic group(s), provided that the minimum requirement of at least ten values for different species of the sensitive taxonomic group. This is the case for insecticide IN, and the SSD for insects is presented in Figure 9. The goodness-of-fit is accepted at all levels. The median estimate of the HC5 is 0.983 µg/L (0.253-2.23). A default assessment factor of 6 is suggested for derivation of the MAC-QSfw, eco using a specific SSD based on acute L/EC50-values (see Table 8-6 in main report). Therefore, the MAC-QSfw, eco is 0.163 µg/L.
Figure 8 Species Sensitivity Distribution for insecticide IN based on the aggregated acute toxicity data for all species.

Alterra-report 2463 | 43
Figure 9 Species Sensitivity Distribution for insecticide IN based on the aggregated acute toxicity data for insects only. Note that this figure is identical to Figure 2.
3.6.6 Derivation of the MAC-QSfw, eco and QSfw, eco using micro-mesocosm studies
Available micro-/mesocosm studies In principle the same valid micro-/mesocosm study available for RAC derivation can be used for QSfw, eco and MAC-QSfw, eco derivation (see Table 8). MAC-QSfw, eco derivation on basis of micro-/mesocosm experiments The lowest Effect class 1-2 and/or population-level NOEC caused by pulsed exposure to insecticide IN can be derived from the GLP experimental pond study. Consequently for MAC-QSfw, eco derivation the Effect class 1-2 concentration of 0.55 µg/L, expressed in terms of initial 48-hours TWA concentration, derived from the GLP outdoor pond experiment (Table 8) may be used by applying an AF of 3 (see Section 8.4.6.3 of main report). This results in a MAC-QSfw, eco of 0.183 µg/L. Note that this MAC-QSfw, eco value is lower than the Effect class 1-2 concentration of 1.63 µg/L, in terms of 24-hours pulse concentrations, derived from experimental stream study A (Table 9) and the population-level NOEC of 3.9 µg/L, in terms of 12-hours pulse concentrations, for the most sensitive insect species in experimental stream study B (Section 2.5.4.). In this latter study, however, treatment-related effect on thorax/head length of two sensitive insects were observed at pulse exposure as low as 0.1 µg/L. The ecological implication of this endpoint is not clear at the moment but needs further consideration. QSfw, eco derivation on basis of micro-/mesocosm experiments We assume that the 21-days TWA concentration is most suitable to express the Effect class 1-2 concentration of the GLP outdoor experimental pond study that can be used for derivation of the QSfw, eco. Note that in the GLP experimental pond study the insecticide was applied two times (interval 21 days). The 21-days TWA Effect class 1-2 concentration is 0.28 µg/L. For derivation of the QSfw, eco an AF of 2-4 has to be applied to Effect class 1 concentrations and an AF of 4-5 to Effect class 2 concentrations (see Table in Section 8.4.6.3 in main report). Considering the fact that the exposure concentration in the GLP experimental pond study was an Effect class 1 - 2 we decided to apply an AF of 4. Consequently, on basis of the GLP experimental pond study the derived QSfw, eco is 0.07 µg/L.
3.6.7 Selection of the overall MAC-EQS and EQS
The following MAC-QSfw, eco values are derived: 0.065 µg/L (assessment factor approach), 0.163 µg/L (SSD approach), and 0.183 µg/L (mesocosm approach). The most sensitive species used for the assessment factor approach is also represented in the SSD and in the mesocosm studies. According to the WFD-guidance, preference is given to the values derived by SSD and/or mesocosm studies, since these represent a more robust approach towards assessing ecosystem effects. The SSD consists of twelve datapoints, covering different insect families, goodness-of-fit is accepted and the confidence

44 | Alterra report 2463
interval around the HC5 is rather small. The SSD and mesocosm approach result in similar values. The mesocosm has been performed with two applications, which is considered as a worst case exposure regime for MAC-derivation and covers indirect effects. It is proposed to use the mesocosm result and set the MAC-EQS to 0.18 µg/L. For the QSfw, eco, the following values are available, 0.042 µg/L (assessment factor approach) and 0.07 µg/L (mesocosm approach). Preference is given to the value derived from the mesocosm study, since this represents a more robust approach towards assessing ecosystem effects. The EQS is 0.07 µg/L.
3.7 Risk assessment for WFD waterbodies
The MAC-EQS of 0.18 µg/L should be compared with the measured peak concentration. With peak concentrations of 0.25 to 0.81 μg/L (see section 3.6), the MAC-EQS is exceeded on the two locations for which monitoring data are present. The EQS of 0.07 µg/L should be compared with the annual average, or with the average over a shorter period of time when this is more appropriate from the use pattern of the compound. The annual average concentrations on the two locations are between 0.075 and 0.32 μg/L, 3-months average values range from 0.12 to 0.47 μg/L. These values are all higher than the EQS. Based on these data, the WFD-standards for insecticide IN are not met on these locations during 2007-2009.

Alterra-report 2463 | 45
4 Example insecticide IP
4.1 Relevant properties and exposure profile of insecticide IP
4.1.1 Information on use and characteristics
Insecticide IP is a synthetic pyrethroid insecticide that is used against a variety of insects. The compound acts via contact- and stomach action. It also has a repellent action. It is not systemic. Insecticide IP is used in a wide range of different crops, including potatoes, beet, cereals, cabbage and flower bulbs. Relevant physico-chemical and environmental properties are presented below.
Table 16 Physico-chemical and environmental properties of insecticide IP.
Substance type Insecticide Substance group Pyrethroid Molar mass 449.9 g/mol Solubility in water 0.005 mg/L (20°C) log Kow 7 DegT50 in soil 50 (20 °C; pF 2) DegT50 in water (Tier-1 value) 1000 d (20°C) DegT50 in water (Tier-2 value) 1 (20 °C) DegT50 in sediment 1000 d (20°C) Kom soil, sediment, suspended solids 138820 L/kg 1/n 0.9 - Saturated vapour pressure 2E-7 Pa (20°C)
4.1.2 Exposure profiles
The exposure concentrations of IP are calculated for application in lilies (20 applications of 0.005 kg/ha, starting 1 May with intervals of seven days). The Tier-1 exposure profile is based on a degradation rate of IP as derived from the standard laboratory water-sediment test (default water degradation DT50 of 1000 d). The predicted Tier-1 exposure profiles for insecticide IP on basis of the new Dutch ditch scenario and 50% (blue line) and 95% (red line) drift reduction are presented in the upper panel of Figure 10. The PECmax, the highest 7-days TWA PEC, and the highest 21-days TWA PEC for the 50% drift reduction profile are 41.4 ng/L, 20.6 ng/L and 20.2 ng/L, respectively. For the 95% drift reduction profile, the PECmax is 3.3 ng/L, the 7-days TWA PEC is 1.6 ng/L and the 21-days TWA PEC is 1.5 ng/L. Several micro/mesocosm tests with insecticide IP are available from which a relatively worst case DT50 of 1 day could be derived for disipation of IP from the water phase. Using this information, Tier-2 exposure profiles were derived on basis of 50% drift reduction and 95% drift reduction (see lower panel Figure 10). The Tier-2 PECmax, the highest 7-days TWA PEC, and the highest 21-days TWA PEC for the 50% drift reduction profile are 25.9 ng/L, 4.9 ng/L and 4.7 ng/L, respectively. For the corresponding 95% drift reduction profile, the PECmax is 2.1 ng/L, the 7-days TWA PEC is 0.4 ng/L and the 21-days TWA PEC is 0.4 ng/L (lower panel Figure 10).

46 | Alterra report 2463
Figure 10 Tier-1 (upper panel) and Tier-2 (lower panel) exposure profiles for the insecticide IP on basis of the new Dutch ditch scenario and 50% (blue line) and 95% (red line) drift reduction.
4.2 Laboratory toxicity data
The full laboratory dataset for insecticide IP is presented in Appendix 2. The dataset consists of the dossier data submitted for the European and national authorisation under Directive 91/414/EC, and data from the open literature. By including literature data, we anticipate the situation under the new Regulation 1107/2009/EC which requires that open literature should be added to the dossier. We therefore also consider the situation that additional data are available from literature references that appeared to be scientifically valid upon evaluation. For the verification, different situations are explored, i.e. starting with the data from the dossier and including additional data from the open literature.

Alterra-report 2463 | 47
4.3 First tier risk assessment for drainage ditches
4.3.1 Regulatory Acceptable Concentrations for aquatic organisms based on core dataset
In order to verify the assumption that a first tier assessment with the core data alone is protective, a first tier assessment is performed using only the endpoints from the core dataset required according to Annex II (see Table 5-1 and 5-2 of the main report). These data are presented in Table 17 (acute) and Table 18 (chronic). For this, it is assumed that the 5% product is subject of authorisation. All endpoints are expressed on the basis of the active substance. Algae For algae, tests are submitted with the active substance in which the highest test concentration of 300 µg/L did not result in >50% effect. Therefore, the endpoints from the test with the formulated product are used (expressed on the basis of the active substance). In accordance with the recommendations of the OECD (see footnote 1 to Table 5-1 in the main report) the EC50 of 1600 µg/L for growth rate is used, rather than the value of 1400 µg/L for biomass. These values are higher than the water solubility for this compound, but accepted in the dossier. Arthropods Tests with Daphnia magna for the active and the 5% product are present in the dossier. The EC50-value from the tests with the 5% product is 0.09 µg/L, which is considerable lower than the EC50 obtained with the active substance alone (0.36 µg/L). The EC50 of the formulated product is used for risk assessment of the drainage ditch. According to Annex II, a second crustacean has to be tested in case of insecticides, the new dossier requirements indicate Americamysis bahia as an option, or the insect Chironomus riparius when accepted protocols for this species have become available. In this dossier, which dates back to the early 1990’s only a the test with Gammarus pulex is present in addition to D. magna. Insect data are not submitted in the initial dossier. The chronic dataset contains a NOEC-value for Daphnia. Fish According to the new data requirements for Annex II, Oncorhynchus mykiss will be the only species which should be routinely tested. Two studies with this species are included in the dossier, with LC50-values of 0.93 and 0.24 µg/L. In this case, the toxicity of the active substance is higher than that of the 5% product. The lowest value is selected for derivation of the RAC. The dossier also contains data for other fish species, some of which yield lower LC50-values than the test with O. mykiss. The risk assessment is performed with O. mykiss to test whether the core dataset is protective, but the lowest available endpoint (LC50 0.14 µg/L for Ictalurus punctatus) is also included in the tables. The chronic dataset contains a NOEC for the saltwater fish species Cyprinodon variegatus.
Table 17 Acute toxicity of insecticide IP to aquatic organisms, core data according to Annex II. All values are expressed on the basis of the active substance.
Taxon/species Test Criterion Value compound [μg/L] Algae Pseudokirchneriella subcapitata 5% product EC50 1600a Crustaceans Daphnia magna 5% product EC50 0.09 Gammarus pulex EC50 0.016 Fish Ictalurus punctatus active LC50 0.14 Oncorhynchus mykiss active LC50 0.24
a: value is higher than water solubility.

48 | Alterra report 2463
Table 18 Chronic toxicity of insecticide IP to aquatic organisms, core data according to Annex II. All values are expressed on the basis of the active substance.
Taxon/species Test Criterion Value compound [μg/L] Crustaceans Daphnia magna active NOEC 0.002 Fish Cyprinodon variegatus active NOEC 0.25
For each taxon, the most critical endpoint is selected and the Regulatory Acceptable Concentration (RAC) is determined using the appropriate assessment factor (Table 19). The acute RAC for crustaceans which is based on G. pulex is similar to the chronic RAC which is based on D. magna. According to the new Annex II, a chronic test should have been performed with the most sensitive species in the acute tests. However, no such studies are available in the dossier, although it is likely that other species are more sensitive than D. magna. The lowest RACs are indicated in bold. Note that for fish, the current dossier requirements would lead to a RAC of 2.4 ng/L based on O. mykiss, but on the basis of all dossier data the RAC would be 1.4 ng/L based on I. punctatus. It may seem strange that the acute RAC for fish is lower than the chronic RAC. In this case, the acute LC50 and chronic NOEC are similar, while the assessment factors differ by a factor of 10. Judged on the LC50-data, it may be questioned whether the chronic test has been performed with a relatively insensitive species. Another explanation may be that for this compound, the effects seen in a chronic study are caused by the initial contact with the compound.
Table 19 Acute and chronic RAC for Insecticide IP based on core data according to Annex II. All values are expressed on the basis of the active substance.
Time scale Taxon Critical endpoint [µg/L]
AF RAC [µg/L]
RAC [ng/L]
Acute Algae 1600 10 160 160000 Crustaceans 0.016 100 0.00016 0.16 Fish 0.24 100 0.0024 2.4 Chronic Crustaceans 0.002 10 0.0002 0.2 Fish 0.25 10 0.025 25
4.3.2 Bioconcentration and secondary poisoning
The log KOW of insecticide IP is 7, the experimental BCF for fish is 1600 to 2240 L/kg, based on studies with a formulated product (geometric mean 1893 L/kg). Since the log KOW is > 3 and the BCF is ≥ 100 L/kg, the direct long-term risks for fish due to bioconcentration and secondary poisoning of predatory birds and mammals should be assessed. For the risk assessment for fish, decision scheme 4-2 in the main report is followed. There is not enough information to judge whether or not 95% depuration has been reached within fourteen days. The DT90 in the water/sediment study is 141 days in one system, and 45 days in another. This means that according to the new Annex II probably a FLC-test would be required. In the present dossier, the only chronic test with fish is an ELS-test with C. variagatus. The RAC based on this test is 25 ng/L (see Table 19), which should be compared with the PECmax (see decision Scheme 4-2 in the main report). The effect data for mammalian and avian species to be used in the assessment for secondary poisoning are presented in the next table (Table 20).

Alterra-report 2463 | 49
Table 20 Toxicity data to be used in the assessment of secondary poisoning of fish eating birds and mammals.
Species Exposure time Criterion Effect concentration [mg/kgdiet]
Rat 2 years NOAEL 10 Mallard duck 20 weeks NOEL 30
The RACsp for fish eating birds and mammals is calculated according to the equations in Section 5.3.3 of the main report as: NOAELbird / 5 *0.159 * BCFfish = 30/ (5 * 0.159 * 1893) = 0.0199 mg/L = 19.9 µg/L NOAELmammal / 5 *0.138 * BCFfish = 10/ (5 * 0.138 * 1893) = 0.0077 mg/L = 7.7 µg/L These RACs should be compared with the 21-days TWA PEC.
4.4 Higher tier risk assessment
4.4.1 Derivation of the RAC using (a limited number of) additional data
For the acute assessment, enough data are available for construction of an SSD. Not enough standard and additional chronic toxicity data are available to apply the geomean approach.
4.4.2 Derivation of the RAC using SSDs
SSDs are constructed based on acute toxicity data (EC50 values). The minimum required number of acute toxicity data is available from the dossier and literature. Chronic data are only available for one crustacean and one insect, which is not sufficient to generate a chronic SSD. For species for which multiple test endpoints are available, the single value per species is derived according to the methods described in Section 2.3.3. For generating SSDs the default approach has been followed as described in Section 2.4. Tier-1 data show that arthropods are most sensitive towards Insecticide Ip. From the additional data presented in Table 21, it appears that insects and crustaceans display the same range of sensitivity, which is consistent with the mode of action of Ip. As insects are not more sensitive than crustaceans or vice versa, there is no argument to construct separate SSDs on the level of either insects or crustaceans. Therefore, they are grouped together as arthropods and the SSD is constructed based on arthropods (Figure 11).
Table 21 Aggregated acute toxicity data of insecticide IP for freshwater arthropods used to construct the SSD. All values are expressed on the basis of the active substance.
Crustaceans Insects Taxon/species L/EC50
[µg/L] Taxon/species L/EC50
[µg/L] Asellus aquaticus 0.0248a Caenis horaria 0.0136 Cyclops sp. 0.3 Chaoborus obscupires 0.0028 Daphnia galatea 0.117 Cloeon dipterum 0.0248c Daphnia magna 0.37 Corixa sp. 0.03 Gammarus pulex 0.014b Erythromma viridulum 0.493 Hyalella Azteca 0.0023 Ischnura elegans 0.13 Ostracoda 3.3 Macropelopia sp. 0.244 Proasellus coxalis 0.0177c Notonecta glauca 0.0148 Simocephalus vetulus 0.957 Sialis lutaria 0.028
a: Most sensitive endpoint (immobilisation).
b: Most sensitive endpoint (mortality).
c: Most sensitive endpoint (immobilisation) and test duration.

50 | Alterra report 2463
The SSD curve passes the Anderson-Darling goodness-of-fit test at the 0.05 % significance level. The median HC5 deduced from this curve is 0.00214 µg/L with a lower limit of 0.000453 µg/L and a higher limit of 0.00605 µg/L. According to the main report, an AF of 3 should be applied. Therefore, the SSD-RAC is 0.00071 µg/L (0.71 ng/L).
Figure 11 Species Sensitivity Distribution based on acute toxicity data for 18 arthropods (EC50 values).
4.4.3 Derivation of the RAC using micro-/mesocosm studies
Available micro-/mesocosm studies In total four valid micro-/mesocosm experiments are available that can be used in the effect assessment of IP. All these studies are obtained from the open literature but are described in enough detail to allow a proper evaluation. A short summary of the these studies is given in Appendix 2. A summary of the treatment-related responses of the most sensitive measurement endpoints in these micro-/mesocosm experiments is presented below (Table 22). We expressed the effect classes in terms of peak concentrations since the dissipation of Ip in the water column of the micro/mesocosm test systems (dissipation DT50 of approximately 1 day) resembles that in the Tier-2 exposure profiles. Acute RAC derivation on basis of micro-/mesocosm experiments Effect class concentrations expressed in terms of peak concentrations for the different micro-/ mesocosm studies are presented in Table 22). An Effect class 1 concentration could only be derived from study 1. Note, however, that the Effect class 1 concentration of study 1 is hard to interpret due of the large spacing (factor of 10) between treatment levels and because the next treatment level already resulted in Effect class 5 responses. In addition, study 1 is characterised by drift and runoff applications of IP, Effect class 1 was associated with concentrations of 1.6 ng/L for spray drift exposure and 4.7 ng/L for runoff exposure. An AF of 1 to 2 (see Table 6-5 of main report) may be used in concert with an Effect class 1 concentration to derive an acute RAC addressing the ecological recovery option. Since several micro-/mesocosm studies are available we decided to use an AF of 1, resulting in an acute RACETO of 1.6-4.7 ng/L. Alternatively, the acute RAC addressing the ecological threshold option can be derived by applying an AF 2 to 3 to the Effect class 2 concentrations of studies 2 and 3. An AF of 2 is selected since several micro-/ mesocosm studies are available. Applying an AF of 2 to the Effect class 2 concentration of 10 ng/L (see Table 22) results in an acute RACETO of 5.0 ng/L. Considering the fact that it is harder to interpret the acute RACETO derived from study 1 we selected the acute RACETO of 5.0 ng/L derived from studies 2 and 3.

Alterra-report 2463 | 51
Table 22 Summary of treatment-related responses for the most sensitive measurement endpoint in the micro-/mesocosms performed with repeated applications of insecticide IP. The exposure-response relationships are expressed in terms of peak concentrations and Effect classes. Concentrations are expressed on the basis of the active substance.
Peak exposure concentration of IP in ng/L Effect class 1 Effect class 2 Effect class 3A Effect class 4 Effect class 5 Study 1 1.6 / 4.7 16 / 47 Study 2 10 25 Study 3 10 25 - 50 100 Study 4 1 0 - 25 50
The acute RAC addressing the ecological recovery option may be based on an Effect class 3A concentration and the application of an AF of 3 to 4 (see Table 6-5 of main report). Selecting the Effect class 3A concentration of 25 ng/L (Table 22) and the application of an AF of 3 will result in a provisional acute RACERO of 8.3 ng/L. Note that we selected an AF of 3 and not of 4 since several micro-/mesocosm studies are available. This provisional acute RACERO and the acute RACETO have to be plotted on the predicted exposure profiles for the final decision (see Figure 12 for Tier-2 exposure profiles). Comparing the acute RACETO and the provisional acute RACERO derived from the micro-/ mesocosm experiments with the Tier-2 exposure profile on basis of 50% drift emission reveals that unacceptable risks to aquatic organisms can be expected for a long period (Figure 12). The Tier-2 profile for 95% drift reduction, however, seems to be acceptable when adopting both the ecological threshold option (acute RACERO) and the ecological recovery option (provisional acute RACERO). The peak exposures of all 20 pulses are below the acute RACETO (and consequently also below the acute RACERO).
Figure 12 Acute RACs derived from the results of experimental model ecosystem experiments (see Table 21) and plotted on the Tier-2 (DegT50 of 1 day) exposure profiles for Iinsecticide IP based on 50% drift reduction (blue line) and 95% drift reduction (red line).
Chronic RAC derivation on basis of micro-/mesocosm experiments In principle, micro-/mesocosm experiments that simulate a pulsed exposure regime can also be used for the chronic risk assessment if the simulated exposure regime is long enough to express the effects on sensitive arthropods and the dissipation of the PPP from water is not faster in the micro-/mesocosm test system than predicted for the field. In that case the chronic RAC based on Effect classes that are expressed in terms of peak exposure concentrations should be directly compared with the PECmax (see Table 6-6 of the main report). In the available micro-/mesocosm tests the dissipation rate of the test compound is similar to realistic worst-case than that predicted for the edge-of-field ditch.

52 | Alterra report 2463
The available mesocoms study 1 (Appendix 2; Table 22) seems to be most suitable for a chronic risk assessment, but concentration-response relationships are relatively hard to interpret as discussed above. In this outdoor experimental pond study, twelve spray drift applications and six run-off applications (three times higher than the drift applications) were administered and an Effect class 1 concentration of 1.6/4.7 ng/L (for drift and runoff applications, respectively) could be derived. An AF of 1 to 2 (see Table 6-6 of main report) may be used in concert with an Effect class 1 concentration to derive a chronic RAC addressing the ecological threshold option. Since several micro-/mesocosm studies are available we decided to use an AF of 1, resulting in a chronic RACETO of 1.6 or 4.7 ng/L that has to be compared with the PECmax (e.g. Tier-2 PECmax of 2.1 ng/L; 95% drift reduction). Following this line of reasoning, chronic risks seem to be acceptable when adopting a chronic RACETO of 4.7 ng/L (on basis of runoff exposure) and the Tier-2 PECmax on basis of 95% drift reduction. If we assume that the three weekly applications of IP in studies 2 - 4 (see Table 22) suffice to express the maximum effects on sensitive aquatic arthropods, the chronic RACETO may be derived from these studies by applying an AF of 2-3 to the Effect class 2 concentrations of 10 ng/L observed in these outdoor microcosm experiments (see Table 6-6 of main report). We decided to apply an AF of 3 to address the remaining uncertainties due to the relatively low number of repeated applications relative to the predicted exposure profile, resulting in a chronic RACETO of 3.3 ng/L, a value very well comparable with the RACETO derived on basis of study 1 (see above). We decided to use the chronic RACETO of 3.3 ng/L in the risk assessment. This value should be compared with the PECmax (e.g Tier-2 PECmax of 2.1 ng/L; 95% drift reduction). Following this line of reasoning, chronic risks seem to be acceptable when adopting the Tier-2 PECmax on basis of 95% drift reduction. The chronic RAC addressing the ecological recovery option (ERO) may be based on an Effect class 3A concentration and the application of an AF of 3 to 4 (see Table 6-6 of main report). Selecting the Effect class 3A concentration of 25 ng/L (Table 22) and the application of an AF of 4 (the higher AF to address the remaining uncertainties due to the relatively low number of repeated applications in the micro-/mesocosm test system relative to the predicted exposure profile) will result in a provisional chronic RACERO of 6.3 ng/L. The repeated pulse concentrations calculated for the 50% drift reduction profile are for a long period higher than this provisional chronic RACERO of 6.3 ng/L, indicating unacceptable risks. However, since the Tier-2 PECmax on basis of 95% drift reduction is lower than both the provisional chronic RACERO and the chronic RACETO, chronic risks on basis of the recovery option are acceptable under the condition that 95% drift reduction is applied. Consequently, the provisional chronic RACERO of 6.3 ng/L can be made definitive when using the 95% drift reduction option in the risk assessment.
4.5 Risk assessment for drainage ditches
Below, the derived RACs for insecticide IP (rounded values) are summarised in Table 23. In case of insecticide IP, the RACs increase with the higher tiers, indicating that for this compound the first tier is indeed protective. This was expected based on the mode of action of this compound, because the standard test organisms are proven to be sensitive towards pyrethroid insecticides. In this case, the additional data from the open literature did not include species that are much more sensitive, while at the same time the addition of more data allowed for lower trigger values.
Table 23 Summary of first and higher tier critical RACs for insecticide IP. All values are in ng/L and expressed on the basis of the active substance.
Time scale 1st tier higher tier geomean SSD mesocosm (ETO) mesocosm (ERO) bioconc fish sec pois Acute 0.16 n.d. 0.71 5.0 8.3# 25 7700 Chronic 0.20 n.d. n.d. 3.3& 6.3&#
n.d. = not derived; # applicable for 95% drift reduction exposure profile only; & obligatory to compare with PECmax in risk assessment

Alterra-report 2463 | 53
Table 24 summarises the PECs for insecticide IP for 50 and 95% drift reduction based on first tier and second tier calculations (see Section 4.1).
Table 24 Summary of first and second tier PECs for insecticide IP. All values are in ng/L, expressed on the basis of the active substance.
Exposure profile
50% drift reduction 95% drift reduction PECmax 7-d TWA PEC 21-d TWA PEC PECmax 7-d TWA PEC 21-d TWA PEC
First tier 41.4 20.6 20.2 3.3 1.6 1.5 Second tier 25.9 4.9 4.7 2.1 0.4 0.4
The acute RACs should be compared with the estimated peak concentration (PECmax). With respect to the higher tier chronic RACs (RACETO and RACERO derived from micro-/ mesocosms), it is obligatory to compare them with the PECmax since the chronic RACs are expressed in terms of peak concentration simulated in the micro-/mesocosm test system. This could be done because the dissipation of the insecticide in the micro-/mesocosm test system was similar to realistic worst-case when compared with that predicted for the field. For the lower tiers it should be decided whether or not time weighted average concentrations can be used for a comparison of the chronic RAC and PEC (see Section 3.3 of the main report). The TWA PEC is not applicable in case the acute to chronic ratio is <10, which is an indication that effects in a chronic test are mainly due to mortality or immobility during initial exposure. Since different organisms determine the short-term and chronic RAC, it is not possible to conclude on this item on a species level. The acute to chronic ratio for D. magna is 45 (EC50 0.09 μg/L, NOEC 0.002 μg/L). However, the acute and chronic endpoints for fish are almost the same, which indicates that a comparison with the PECmax is probably more appropriate. Since a definitive conclusion cannot be drawn, we compare the first tier chronic RAC with both the PECmax and the 7-days TWA RAC. The chronic risk assessment for fish due to bioconcentration is based on the PECmax. The risks of secondary poisoning are based on a comparison of the RAC with the 21-days TWA PEC.
Table 25 Ratios of PEC and RAC for insecticide IP. Values greater than one indicate a risk, empty cells indicate that the combination of PEC and RAC is not applicable.
Time scale RAC [ng/L]
PEC/RAC based on 2nd tier PEC PECmax 50% DR [25.9 ng/L]
PECmax 95% DR [2.1 ng/L]
7-d TWA PEC 50% DR [4.9 ng/L]
7-d TWA PEC 95% DR [0.4 ng/L]
21-d TWA PEC 50% DR [4.7 ng/L]
21-d TWA PEC 95% DR [0.4 ng/L]
acute First tier 0.16 162 13 SSD 0.71 36 3.0 mesocosm (ETO)
5.0 5.2 0.4
mesocosm (ERO)
8.3 0.3
chronic First tier 0.20 130 11 25 2.0 mesocosm (ETO)
3.3 7.8 0.6
mesocosm (ERO)
6.3 0.24
bioconc fish 25 1.0 0.08 sec poisoning
7700 < 0.001 <0.001

54 | Alterra report 2463
From this table it follows that no unacceptable risk is identified when the exposure profile based on 95% drift reduction is used. This conclusion is only valid for the higher tier RAC based on mesocosms, in which fish are absent. Therefore, it has to be checked whether the first tier RACs for fish are not exceeded. The acute RAC for fish is 2.4 ng/L, the chronic RAC is 25 ng/L. As noted before, the acute and chronic endpoints for fish are almost the same, but the assessment factors differ by a factor of 10. The ratio between the 2nd tier PECmax for 95% drift reduction (2.1 ng/L) and the RAC for fish is 0.88 (acute) and 0.08 (chronic). Since these ratios are both smaller than 1, there is no unacceptable risk for fish. The additional data from the open literature enabled the generation of a separate SSD for fish. Based on nine toxicity data for fish (L/EC50), the HC5 is 77.7 ng/L (22.3 – 153.2). Applying an AF of 5 for repeated pulse exposures (Table 6.4 in Brock et al., 2011) results in a SSD – RAC of 15.5 ng/L. This final RAC for fish is higher than the RACETO so that the potential risks for fish are covered by the micro-/mesocosm tests.
4.6 Effect and risk assessment procedure underlying the Water Framework Directive
4.6.1 Monitoring data
An evaluation of monitoring data on WFD-monitoring locations shows that insecticide IP was never detected above the reporting limit of 0.02 µg/L (20 ng/L).
4.6.2 Aquatic toxicity data
The aggregated ecotoxicity data for insecticide IP are presented in the tables below for freshwater and marine species. The tables contains the lowest value per species. First, the geometric mean of multiple comparable toxicity values for the same species and the same endpoint, according to the recommendations in Section 2.3.4. All values are expressed on the basis of the active substance.

Alterra-report 2463 | 55
Table 26 Aggregated toxicity data of insecticide IP for freshwater species.
ACUTE CHRONIC Taxon/species L/EC50
[µg/L] Taxon/species NOEC/EC10
[µg/L] algae Algae Pseudokirchneriella subcapitata 1600a Pseudokirchneriella subcapitata 460 a crustaceans crustaceans Asellus aquaticus 0.0248 b Daphnia magna 0.002 g Cyclops sp. 0.3 Daphnia galatea 0.117 Daphnia magna 0.37 Gammarus pulex 0.014c Hyalella azteca 0.0023 Ostracoda 3.3 Proasellus coxalis 0.0177d Simocephalus vetulus 0.957 insects Caenis horaria 0.0136 Chaoborus obscupires 0.0028 Cloeon dipterum 0.0248e Corixa sp. 0.03 Erythromma viridulum 0.493 Ischnura elegans 0.13 Macropelopia sp. 0.244 Notonecta glauca 0.0148 Sialis lutaria 0.028 arachnids Hydracarina 0.047 fish Cyprinus carpio 0.50 Danio rerio 0.73 e Gasterosteus aculeatus 0.49 e Ictalurus punctatus 0.15 e Lepomis macrochirus 0.21 Leuciscus idus 0.07 e Onchorhynchus mykiss 0.47 f Oryzias latipes 1.60 e Pimephales promelas 0.70 e
a: endpoint higher than water solubility, but accepted in dossier.
b: most sensitive endpoint (immobilisation), test with product.
c: most sensitive endpoint (mortality) for relevant test duration (48 hours).
d: most sensitive endpoint (immobilisation) for relevant test duration (48 hours).
e: geometric mean of tests with active.
f: geometric mean of endpoints from test with active and 5% product, difference between active and product is small enough to allow for
pooling.
g: most relevant exposure duration (21 days), parameter reproduction.
Table 27 Aggregated toxicity data of insecticide IP for marine species.
ACUTE CHRONIC Taxon/species L/EC50
[µg/L] Taxon/species NOEC/EC10
[µg/L] Fish Cyprinodon variegatus 0.25
4.6.3 Pooling of data for freshwater and marine species
According to the guidance, data for freshwater and marine species may be pooled since there are too few data to perform a meaningful statistical comparison and there are no further indications (spread of the data, read-across, expert judgement) of a difference in sensitivity between freshwater versus marine organisms of the relevant taxonomic groups.

56 | Alterra report 2463
4.6.4 Derivation of the QSfw, eco and MAC-QSfw, eco using the assessment factor approach
Acute toxicity data are available for 29 species, representing five taxa (algae, crustaceans, insects, arachnids and fish). The acute base set (algae, Daphnia, fish) is available. Although the endpoint for algae is higher than the water solubility, it is accepted to show that algae are not a sensitive species group. Chronic data are available for three species, representing three taxa (algae, crustaceans and fish). The lowest acute endpoint is the 48-hours LC50 of 0.0023 µg/L for the amphipod Hyalella azteca, the lowest chronic endpoint is the 21-d NOEC of 0.002 µg/L for D. magna. According to the guidance, the MAC-QSfw, eco, may be derived applying an assessment factor of 10 to the lowest acute endpoint in case the compound has a known mode of toxic action and a representative species for the potentially most sensitive taxonomic groups (crustaceans and insects) are included in data set. Using the LC50 of 0.0023 µg/L for the for the amphipod Hyalella azteca with an assessment factor of 10, the MAC-QSfw, eco is 0.00023 µg/L = 0.23 ng/L. The NOEC for P. kirchneriella of 460 µg/L is much higher than the water solubility and should probably considered as invalid. However, it can be used to demonstrate that algae are not a sensitive group. Based on the availability of three chronic values, an assessment factor of 10 could be used for derivation of the QSfw, eco. However, as was noticed in the first tier assessment for the drainage ditch, D. magna is most likely less sensitive than other crustacean and insect species. From Table 22, it appears that the lowest acute LC50 of 0.0023 μg/L for Hyallella azteca is similar to the chronic NOEC for D. magna of 0.002 µg/L. Even if the acute to chronic ratio is smaller than 10, the NOEC for H. azteca might be substantially lower than the lowest NOEC value. The data indicate that this holds true for other species as well, see e.g. Chaoborus obscupires and Notonecta glauca. Therefore, an assessment factor of 10 is considered to be insufficient for the protection of the potentially most sensitive taxon, and an assessment factor of 50 should be used (see main report, section 8.2, top of page 83). This results in a QSfw, eco of 0.002 / 50 = 0.00004 μg/L = 0.04 ng/L.
4.6.5 Derivation of the QSfw, eco and MAC-QSfw, eco using the SSD approach
Derivation of the QSfw, eco and/or MAC-QSfw, eco using the SSD approach is allowed when at least ten values (preferably fifteen) are available for different species covering at least eight taxonomic groups. There are not enough chronic toxicity data to derive the QS by means of an SSD. The taxonomic groups to be covered and their representatives in the present acute dataset are as follows:
1. Fish: Leuciscus idus (family Cyprinidae). 2. A second family in the phylum Chordata: Oncorhynchus mykiss (family Salmonidae). 3. A crustacean: Hyalella azteca. 4. An insect: Chaoborus obscuripes (order Diptera). 5. A family in a phylum other than Arthropoda or Chordata: no data. 6. A family in any order of insect or any phylum not already represented: Caenis horaria (order
Ephemeroptera) or Hydracarina. 7. Algae: Pseudokirchneriella subcapitata. 8. Higher plants: no data.
The dataset does not include macrophytes. However, Insecticide IP was shown not to have a direct effect on macrophytes (see evaluation of mesocosm studies, Section 4.4.3 and Appendix 2) and molluscs (LOEC value of > 8.9 μg/L for Bithynia tentaculata, see Appendix 2, Table A2.1) in concentrations below its water solubility. Additionally, a large amount of data is available for the potentially most sensitive taxonomic groups of crustaceans and insects. Therefore, it is considered justified to perform an SSD. The goodness-of-fit is accepted at all levels, except for the Anderson-Darling test at significance level 0.1. The median estimate of the HC5 is 0.0021 µg/L with upper- and lower limit 0.0005-0.006 µg/L. The SSD-graph is presented below in Figure 13. When the MAC-QSfw,
eco is derived using an SSD curve based on L(E)50-values, a default assessment factor of 10 is applied in order to extrapolate from the short-term L(E)C50 level to the short-term no-effect level. Using the HC5 value of 0.0021 μg/L, this would result in a MAC-QSfw, eco of 0.00021 μg/L = 0.21 ng/L. This is similar to the value derived using the assessment factor approach.

Alterra-report 2463 | 57
Figure 13 Species sensitivity distribution for insecticide Ip based on acute L(E)C50-values for all taxa.
For insecticide IP, acute EC10 values are available for eleven species of crustaceans and insects from the open literature, see Appendix 2, Table A2.3. According to the guidance, a specific SSD may be constructed if the requirements for a generic SSD have been met first, which is considered to be the case for InsecticideP. The SSD based on the acute EC10-values is presented in Figure 14 below. The goodness-of-fit is accepted at all levels. The median estimate of the HC5 is 0.00068 µg/L. According to Table 8-6 of the main report, an assessment factor of 3 is applied by default, resulting in a MAC-QSfw,
eco of 0.00023 μg/L = 0.23 ng/L, which is similar to the values derived above.
Figure 14 Species sensitivity distribution for insecticide Ip based on acute L(E)C10-values for insects and crustaceans.
4.6.6 Derivation of the MAC-QSfw, eco and QSfw, eco using micro-mesocosm studies
The available micro-/mesocosm experiments all concern pulsed exposure regimes in which water exposure concentrations between pulses almost decline to zero, consequently, they can only be considered for the MAC-QSfw, eco derivation. In the effect assessment in line with the WFD decision schemes, the effects observed in the micro-/mesocosm experiments should be expressed in terms of

58 | Alterra report 2463
48-hours TWA concentrations of the highest pulse. In Table 28 the Effect class concentrations derived from the available micro-/mesocosm experiments are expressed in terms of highest 48-hours TWA concentrations
Table 28 Summary of treatment-related responses for the most sensitive measurement endpoint in the micro-/mesocosms performed with repeated applications of insecticide IP. The exposure-response relationships are expressed in terms of the highest 48-hours TWA concentrations and Effect classes, concentrations are expressed on the basis of the active substance. Note that in Study 1 the lower Effect class values mentioned relate to drift applications and the higher values to runoff applications.
Highest 48-h TWA exposure concentration of IP in ng/L Effect class 1 Effect class 2 Effect class 3A Effect class 4 Effect class 5 Study 1 0.87 / 2.5 8.7 / 25.4 Study 2 5.4 13.5 Study 3 5.2 12.9 – 27.8 54.4 Study 4 5.6 – 13.7 27.1
An AF of 2-3 may be used to derive a MAC-QSfw, eco (see Section 8.4.6.3 of main report) when an appropriate Effect class 2 concentration is available from a repeated application study. Since several of these micro-/mesocosm studies are available from which an Effect class 2 concentration could be derived we decided to apply an AF of 2 to the lowest available Effect class 2 concentration (5.2 ng/L), resulting in a MAC-QSfw, eco of 2.6 ng/L. Alternatively, the Effect class 1 concentration of 0.87 ng/L (spray exposure) or 2.5 ng/L (runoff exposure) might be used with an AF of 1-2. Since several studies are available an AF of 1 is considered justified. Since according to the WFD-guidance absence of any effects is the starting point for QS-derivation, preference is given to a MAC-QSfw, eco based on Effect Class 1 concentrations (0.87 ng/L or 2.5 ng/L). Although the possible MAC-QSfw, eco of 2.6 ng/L on basis of the procedure described above for studies 2 and 3, resembles very much the higher possible MAC-QSfw, eco value from study 1 (2.5 ng/L), a precautionary approach was followed by selecting the MAC-QSfw, eco of 0.87 ng/L (the lower value of study 1 on basis of drift exposure).
4.6.7 Selection of the overall MAC-EQS and EQS
The following MAC-QSfw, eco values are derived: 0.23 ng/L (assessment factor and SSD approach), and 0.87 ng/L (mesocosm approach). According to the WFD-guidance, preference is given to the values derived by SSD and/or mesocosm studies, since these represent a more robust approach towards assessing ecosystem effects. The mesocosm has been performed with repeated applications, which is considered as a worst case exposure regime for MAC-derivation and also covers indirect and long-term effects. It is proposed to use the mesocosm result and set the MAC-EQS to 0.87 ng/L. The QSfw, eco could only be derived using the assessment factor approach. The EQS is 0.04 ng/L.
4.7 Risk assessment for WFD waterbodies
The MAC-EQS and EQS are both lower than the detection limit of 20 ng/L. Therefore, it cannot be judged whether actual concentrations meet the WFD-standards. A risk cannot be excluded.

Alterra-report 2463 | 59
5 Example herbicide HT
5.1 Relevant properties and exposure profile of HT
5.1.1 Information on use and characteristics
Herbicide HT is a selective triazinone herbicide which inhibits photosynthesis. It is used for control of annual grasses and numerous broadleaf weeds in a.o. potatoes, carrots, grass, and asparagus. Relevant physico-chemical and environmental properties are presented below in Table 29.
Table 29 Physico-chemical and environmental properties of herbicide HT.
Substance type Herbicide Substance group Triazinone Molar mass 214.3 g/mol Solubility in water 1050 mg/L (20 °C) log Kow 1.6 (20 °C) DegT50 in soil 10 (20 °C; pF 2) DegT50 in water (Tier-1 value) 1000 d (20 °C) DegT50 in water (Tier-2 value) 14 (20 °C) DegT50 in sediment 1000 d (20 °C) Kom soil, sediment, suspended solids 36 L kg-1 1/n 0.9 - Saturated vapour pressure 9.0E-5 Pa (20 °C)
5.1.2 Exposure profiles
The exposure profiles are calculated for application of HT in potatoes on basis of three applications of 0.105 kg/ha on 1, 8 and 15 May. In the upper panel of Figure 15 the Tier-1 exposure profiles are presented that are calculated for HT using a DegT50 of 1000 days in water and 50% (blue line) and 95% (red line) drift reduction. In case of 50% drift reduction the calculated peak concentration of HT is 1.745 µg/L, the highest 7days TWA PEC is 1.719 µg/L, and the highest 21-days TWA PEC is 1.666 µg/L. In case of 95% drift reduction the calculated peak concentration is 1.130 µg/L, while the 7-days and 21-days TWA concentration are 1.107 µg/L and 1.072 µg/L, respectively. The Tier-1 exposure concentrations illustrate that long-term presence of HT is predicted in the new Dutch ditch scenario. On basis of additional information, resulting in an estimated higher-tier water DegT50 of 14 d for HT, Tier-2 exposure profiles can be calculated (lower panel of Figure 15). In case of 50% drift reduction the calculated peak concentration of HT is 1.353 µg/L, the highest 7-days TWA concentration is 1.281 µg/L and the highest 21-days TWA concentration is 1.138 µg/L. In case of 95% drift reduction the calculated peak concentration is 0.904 µg/L, while the 7-days and 21-days TWA concentrations are 0.841 µg/L and 0.707 µg/L, respectively. The Tier-2 exposure concentrations are used in the risk assesment presented below. As expected, the Tier-2 exposure profile is characterised by a less prolonged period of relatively high exposure concentrations. Both drift and drainage input, however, contribute to the highest exposure concentrations calculated.

60 | Alterra report 2463
Figure 15 Tier-1 (upper panel) and Tier-2 (lower panel) exposure profiles for herbicide HT on the basis of the new Dutch ditch scenario and 50% (blue line) and 95% (red line) drift reduction.
5.2 Laboratory toxicity data
The full laboratory dataset for herbicide HT is presented in Appendix 3. The dataset consists of the dossier data submitted for the European and national authorisation under Directive 91/414/EC, and data from the open literature. By including literature data, we anticipate the situation under the new Regulation 1107/2009/EC which requires that open literature should be added to the dossier. We therefore also consider the situation that additional data are available from literature references that appeared to be scientifically valid upon evaluation. For the verification, different situations are explored, i.e. starting with the data from the dossier and including additional data from the open literature.

Alterra-report 2463 | 61
5.3 First tier risk assessment for drainage ditches
5.3.1 Regulatory Acceptable Concentrations for aquatic organisms based on core dataset
In order to verify the assumption that a first tier assessment with the core data alone is protective, a first tier assessment is performed using only the endpoints from the core dataset required according to Annex II (see Table 5-1 and 5-2 of the main report). These data are presented in Table 30 (acute) and Table 31 (chronic). For this, we assume that the 600 g/L SC formulation is subject of authorisation. All values are expressed on the basis of the active substance. Algae For algae, tests are submitted with Pseudokirchneriella subcapitata and Scenedesmus subspicatus, which are considered as meeting the Annex II requirement. In accordance with the recommendations of the OECD (see footnote 1 to Table 5-1 in the main report) the endpoints for growth rate are used, rather than the values for biomass. For S. subspicatus, EC50 values for growth rate from the dossier are 21 and 20 µg/L from tests with the active, and 18.7 μg/L from a test with the 600 g/L SC formulation. In line with the procedure described in the section 2.3.3, the lowest values are selected for derivation of the RAC. For P. subcapitata, an EC50 for growth rate of 26.5 µg/L is available from a test with the active. Although currently not an Annex II requirement we also incorporated the NOEC values for standard test algae in our evaluation, since this is a proposal in Alterra Report 2235 (see also Section 2.2). The lowest NOEC value reported for standard algae is 2.5 µg/L for the green alga Pseudokirchneriella subcapitata. Macrophytes For macrophytes, tests with Lemna gibba and L. minor are included in the dossier. For L. gibba, the following EC50-values are available: 130 µg/L for dry weight from a 14-days test with the active substance, 31.9 µg/L for growth rate based on frond area from a test with a 600 g/L SC product, and 41.7 µg/L for growth rate based on frond numbers from a 7-days test with a 600 g/L SC product. In view of the NOEC-values that were obtained for the respective test compounds, the EC50 of 130 µg/L seems to be rather high. A 14-days test with L. minor using the active substance resulted in EC50-values of 7.9, 13.3 and 37 µg/L for dry weight, frond count and growth rate, respectively. The lowest EC50-values of 31.9 µg/L for L. gibba and 7.9 µg/L for L. minor are selected for the acute assessment. Additional tests with Myriophyllum sp. or Glyceria maxima are required in case the mode of action or results from herbicide sceening assays indicate the need to do so, i.e. in case of a specific mode of action working on dicot macrophytes or adsorption to the sediment, for which a test with the rooted Myriophyllum species is required, ór in case the toxic mode-of-action predominantly affects monocots, for which a Glyceria test is required (see Footnote 3 to Table 5-1 in the main report). This is not the case for herbicide HT and such data are not included in the dossier. Available data from the open literature and will be used in Section 5.4.2. Although currently not an Annex II requirement we also incorporated the NOEC values for standard test species of macrophytes in our evaluation, since this is a proposal in Alterra Report 2235 (see 2.2). The lowest NOEC value reported for a standard test macrophyte is 0.58 µg/L for L. minor. Cyanobacteria For Anabaena flos-aquae two growth rate EC50-values are available in the dossier from tests with the active substance, 375 μg/L from a 72-hours test, 61 µg/L from a 96-hours test. The lowest value is considered in Table 30. Daphnia Two acute tests with Daphnia magna are present in the dossier. The EC50-values from the tests with the active are 49000 and 49600 µg/L. The geometric mean of 49299 µg/L is used for the acute

62 | Alterra report 2463
assessment. Chronic NOEC-values are 320 and 1290 µg/L for the active, the geometric mean of 642 µg/L is used. Fish According to the new data requirements for Annex II, Oncorhynchus mykiss will be the only species which should be routinely tested. Three acute studies with this species are included in the dossier, which resulted in 42000, 74600 and 80300 µg/L for the active. The geometric mean of 63130 µg/L is used. The dossier also contains data for other fish species, but these yielded higher LC50-values than the tests with O. mykiss. ELS-tests with O. mykiss and Pimephales promelas are included in the chronic dossier data, the lower value of 4430 µg/L for O. mykiss is used for the chronic risk assessment.
Table 30 Acute toxicity of herbicide HT to aquatic organisms, core data according to Annex II. All values are expressed on the basis of the active substance.
Taxon/species Test Criterion Value compound [μg/L] Algae Pseudokirchneriella subcapitata active EC50 26.5 Scenedesmus subspicatus 600 g/L SC product EC50 18.7 Cyanobacteria Anabaena flos-aquae active EC50 61 Macrophytes Lemna gibba 600 g/L SC product EC50 31.9 Lemna minor active EC50 7.9 Crustaceans Daphnia magna active EC50 49299 a Fish Oncorhynchus mykiss active LC50 63130a
a: geometric mean.
Table 31 Chronic toxicity of herbicide HT to aquatic organisms, core data according to Annex II. In addition, the chronic NOEC values for primary producers as proposed in Alterra Report 2235 are given. All values are expressed on the basis of the active substance.
Taxon/species Test Criterion Value compound [μg/L] Crustaceans Daphnia magna active NOEC 642a Fish Oncorhynchus mykiss active EC10 4430 Algae Pseudokirchneriella subcapitata active NOEC 2.5 Anabaena flos-aquae active NOEC 3.2 Macrophytes Lemna minor active NOEC 0.58 Lemna gibba active NOEC 18
a: geometric mean.
For each taxon, the most critical endpoint is selected and the Regulatory Acceptable Concentration (RAC) is determined using the appropriate assessment factor. The lowest RACs are indicated in bold. As indicated above, additional data on fish are available in the dossier, i.e. acute LC50-values of 169400 and 141600 µg/L for Leuciscus idus, and a NOEC of 13100 µg/L for P. promelas. These data do not change the RAC, since they are higher than the values for O. mykiss.

Alterra-report 2463 | 63
Table 32 Acute and chronic RAC for herbicide HT based on core data according to Annex II. In addition, the chronic NOEC values for primary producers as proposed in Alterra Report 2235 are given. All values are expressed on the basis of the active substance.
Time scale Taxon Critical endpoint [µg/L]
AF RAC [µg/L]
Acute Algae 18.7# 10 1.87 Cyanobacteria 61# 10 6.1 Macrophytes 7.9# 10 0.79 Crustaceans 49299 100 493 Fish 63130 100 631 Chronic Crustaceans 642 10 64.2 Fish 4430 10 443 Algae 2.5& 10 0.25 Macrophytes 0.58& 10 0.058
# based on EC50-values according to current guidance.
& based on NOEC/EC10-values as proposed in Alterra report 2235.
5.3.2 Bioconcentration and secondary poisoning
Because the log Kow is < 3 (see Table 29) no RAC for bioconcentration in the aquatic food chain has to be calculated.
5.4 Higher tier risk assessment
5.4.1 Derivation of the RAC using (a limited number of) additional data
Since for the acute assessment enough data are available for construction of an SSD, the geomean approach is not considered.
5.4.2 Derivation of the RAC using SSDs
Primary producers (algae and macrophytes) are the most sensitive groups in the 1st tier risk assessment based on EC50-values. Within the group of primary producers, macrophytes show the highest sensitivity. Additional data on primary producers are available, including data obtained with other products. The available data are presented in Table 33, aggregated endpoints for individual species are derived according to Section 2.3.3. Two additional Lemna species are represented, i.e. Lemna paucicostata and L. perusilla. The endpoints are front count. Also additional EC50-values are available for a number of rooted macrophyte species, i.e. Ceratophyllum demersum, Egeria densa, Elodea canadensis, Elodea sp., Myriophyllum heterophyllum, M. spicatum and Najas sp. The available endpoints are fresh weight, dry weight or length growth. There are also data available for the symbiotic species Azolla mexicana - Anabaena azollae. The endpoints measured for this species (mainly process-related endpoints) are above the upper range of the other species endpoints, and concern a combination of two species. They are therefore not considered here. For generating SSDs for HT, the default approach has been followed as described in Section 2.4. SSDs based on EC50-values as well as on NOECs are generated and discussed here.

64 | Alterra report 2463
Table 33 Aggregated acute and chronic toxicity data of herbicide HT for freshwater algae and macrophytes used for construction of the SSDs. All values are expressed on the basis of the active substance.
ACUTE CHRONIC Taxon/species L/EC50
[µg/L] Taxon/species NOEC/EC10
[µg/L] Algae algae Chlamydomonas reinhardi 23 Chlorella kessleri 8 Chlorella kessleri 26 Pseudokirchneriella subcapitata 2.5e Chlorella vulgaris 31 Scenedesmus subspicatus 1.8f Euglena gracilis 200a macrophyta Pseudokirchneriella subcapitata 26.5b Egeria densa 1.57 Scenedesmus quadricauda 152 Elodea sp. 29.8 Scenedesmus subspicatus 18.7c Lemna gibba 15g Macrophyta Lemna minor 0.58 Ceratophyllum demersum 14 Lemna perusilla 4.32 Egeria densa 22 Myriophyllum spicatum 2.85 Elodea canadensis 21 Elodea sp. 78 Lemna gibba 31.9d Lemna minor 7.9 Lemna paucicostata 45 Lemna perusilla 16 Myriophyllum heterophyllum 17 Myriophyllum spicatum 64 Najas sp. 19
a: lowest relevant endpoint with unbound value, chlorophyll content.
b: preferred endpoint, growth rate.
c: lowest relevant endpoint, growth rate, from test with 600 g/L SC formulation; data from 70% WG. formulation are not considered since
endpoints for the requested product are available.
d: most sensitive endpoint, growth rate from test with 600 g/L SC formulation.
e lowest relevant endpoint and test duration, 72-hours growth rate from test with active.
f lowest relevant endpoint and test duration, 96-hours growth rate from test with active.
g: most sensitive endpoint, dry weight from test with active.
As macrophytes are the most sensitive group for herbicide HT, the additional EC50-values from the open literature were used to construct an acute SSD based on macrophytes specifically. This SSD was based on eleven datapoints (Table 33). The EC50-based SSD for macrophytes is presented in Figure 16. The HC5 for macrophytes is calculated as 7.64 µg/L, with a lower limit of 3.55 µg/L and a higher limit of 11.98 µg/L. For algae not enough data are available to generate a specific acute SSD.
Figure 16 SSD presenting the acute data for herbicide HT for macrophytes (n = 11 datapoints). The Anderson-Darling test for normality was accepted.

Alterra-report 2463 | 65
Figure 17 SSD presenting the acute data for herbicide HT for primary producers (algae and macrophytes combined; n = 18 datapoints). The Anderson-Darling test for normality was accepted.
If macrophytes and algae are combined in one SSD for primary producers (Figure 17), the HC5 for primary producers is 7.75 µg/L with a lower limit of 4.07 µg/L and a higher limit of 11.91 µg/L. As the HC5 ranges of macrophytes, algae and primary producers overlap, the highest taxonomic level is considered here for consideration in the risk assessment of herbicide HT. Therefore, the HC5 considered here is 7.7.5 µg/L. Since the dissipation DT50 of the predicted exposure profile exceeds 10 days, an assessment factor of 3 is used. This leads to an acute EC50-based SSD-RAC of 2.6 µg/L. When applying the official EU guidance, for algae and macrophytes only EC50-values are used in the RAC derivation. However, we also explore in our report a RAC derivation using NOEC/EC10-values for primary producers, as proposed in Alterra Report 2235 (Brock et al., 2011). The chronic dataset includes nine NOEC/EC10-values for primary producers (algae and macrophytes combined; see Table 33). For macrophytes or algae alone, the number of datapoints is below the critical number of eight that is required for a SSD. Therefore only an SSD at the higher taxonomic level of primary producers can be constructed. Cyanobacteria were not included in the SSDs as Oscillatoria laetevirens is not sensitive to HT and only Anabaena flos-aquae has a sensitivity in the range of algae. The SSD based on NOEC/EC10-values for primary producers is shown in Figure 18. The NOEC/EC10-based HC5 is 0.480 µg/L with a lower limit of 0.096 µg/L and a higher limit of 1.15 µg/L. An assessment factor of 1 to 2 was suggested for SSDs based on NOEC/EC10-values. Similar to the EC50-based SSD, there were not enough datapoints to construct SSDs for the taxonomic groups of macrophytes and algae separately. Therefore, the chronic SSD could only be generated on the basis of the higher taxonomic level of primary producers. In order to account for a higher variability at this higher taxonomic level, an AF of 2 is proposed here. Therefore, the chronic NOEC/EC10-based SSD-RAC is 0.240 µg/L.

66 | Alterra report 2463
Figure 18 Chronic SSD for herbicide HT for primary producers (algae and macrophytes combined; n = 9 datapoints). The Anderson-Darling test for normality was accepted.
5.4.3 Derivation of the RAC using micro-/mesocosm studies
Acute RAC derivation on basis of micro-/mesocosm experiments One valid GLP microcosm experiment is available. This study concerns an outdoor field ditch enclosure study performed in the Netherlands, treated once with herbicide HT and focusing on treatment-related responses of phytoplankton, zooplankton, periphyton, macrophtes and community metabolism endpoints (e.g. dynamics in pH, dissolved oxygen, alkalinity). Measured peak concentrations ranged from 96 to 109% of nominal concentrations, so nominal concentrations are used as peak concentrations in the tests systems. The mean dissipation rate of herbicide HT in the water column of the test systems was 7.1 days. Although the diversity and densities of algae and zooplankton populations were appropriate in the test systems, only a few species of macrophytes characterised the community (particularly Myriophyllum spicatum). A summary of the treatment-related responses for the main measurement endpoints, expressed in terms of Effect classes, is presented below (Table 34).
Table 34 Overall summary of Effect class responses observed for several categories of endpoints in the outdoor ditch enclosure study treated once with herbicide HT. Within each category the most sensitive population/community level endpoint was selected. The Effect class concentrations are expressed in terms of the nominal treatment concentrations, the measured peak concentration and 2-, 7- and 21-day time weighted average (TWA) concentrations, respectively, expressed on the basis of the active substance. ↓ = decline ; ↑ increase.
Type of Concentration Treatment level [µg/L] Peak 1.8 5.6 18 56 180 2-days TWA 1.6 5.1 16.3 50.8 163.4 3-days TWA 1.6 4.9 15.6 48.6 156.1 7-days TWA 1.3 4.1 13.0 40.5 130.3 21-days TWA 0.8 2.4 7.7 23.8 76.5 Most sensitive endpoint within category Phytoplankton 1 1 2 ↓ 3A ↓ 3A ↓ Periphyton 1 1 1 2 5B ↓↑ Macrophytes 1 1 3A ↓ 5B ↓ 5B ↓ Invertebrates 1 1 1 3A ↓ 5B ↓↑ Community metabolism 1 1 2 ↓ 3A ↓ 3A ↓ Overall Effect class on basis of the most sensitive endpoint 1 1 3A 5B 5B

Alterra-report 2463 | 67
When considering the predicted exposure profile (Figure 15) it appears that the rate of dissipation of herbicide HT in the outdoor ditch enclosures is faster (mean dissipation DT50 of 7.1 days) than that in the field (SecondTier-2 exposure profile). For this reason we do not use the peak concentration, but the highest 3-days TWA concentrations in the test systems to express the Effect classes. This was done since the duration of the standard toxicity test with algae usually is 72 hours (for rationale see Section 8.4.4.2 in main report). To address the Ecological Threshold Option the Effect class 1 concentrations of 4.9 µg/L (highest 3-days TWA concentration) may be used in the effect assessment by applying an AF of 1 to 2 (see Table 6-5 of main report). Because only one micro-/mesocosm experiment was available we decided to use an AF of 2. This procedure results in an acute RACETO of 2.45 µg/L. Comparing this acute RACETO value with the Tier-2 peak exposure concentrations (PECmax with 50% drift reduction 1.353 µg/L; PECmax with 95% drift reduction 0.904 µg/L) it is clear that acute risks are not triggered. It may be argued that this acute RACETO mentioned above should be used with caution because only a limited number of macrophytes were present in the enclosure study. Note, however, that for photosynthesis inhibiting herbicides such as HT it is reported that species senitivity distributions do not differ markedly between aquatic algae and aquatic vascular plants (Van den Brink et al., 2006). This indicates that the acute RACETO derived from the ditch enclosure study can be directly used in the aquatic risk assessment. Most aquatic vascular plants, however, have a longer life-cycle than algae, and consequently may show a much lower rate of recovery when impacted by a herbicide. Therefore, because of the low number of macrophyte species present in the ditch enclosure study, we consider it problematic to use the Effect class 3A concentration to derive an acute RAC on basis of the Ecological Recovery Option. Consequently we decided not to consider this option. Chronic RAC derivation on basis of micro-/mesocosm experiments Although for herbicide registration based on toxicity data for primary producers currently no clear distinction is made between acute and chronic RACs, in this report we also explore the derivation of a chronic RAC as originally proposed in Alterra Report 2235 (Brock et al., 2011). We assume that the GLP ditch enclosure study can be used for the chronic risks assessment as well, considering the fact that herbicide HT was relatively persistent in the water column (mean dissipation DT50 of 7.1 days). In the effect assessment described below it is assumed that the 21-days TWA concentration is suitable to express the Effect class that can be used in the chronic risk assessment. In the GLP ditch enclosure study the 21-days TWA Effect class 1 concentration is 2.4 µg/L. The chronic RAC addressing the Ecological Threshold Option is derived by applying an AF of 1 2 (see Table 6-6 of main report) to the 21-days TWA Effect class 1 concentration (2.4 µg/L). Because only one micro-/mesocosm study is available we decided to apply the AF of 2, resulting in an chronic RACETO of 1.2 µg/L. When plotting this lower chronic RACETO estimate (1.2 µg/L) on the exposure profiles (Figure 19) it is obvious that chronic risks are identified for approximately ten days for the 50% drift reduction exposure profile. Also the Tier-2 maximum 7-days TWA PEC of the 50% drift reduction profile (1.281 µg/L) is somewhat higher than the chronic RACETO estimate of 1.2 µg/L. However, when implementing a 95% drift reduction regime, risks due to long-term exposure to herbicide HT appear to be acceptable (Figure 19).

68 | Alterra report 2463
Figure 19 The chronic RACETO (derived from the GLP ditch enclosure study) and plotted on the predicted Tier-2 exposure profiles for herbicide HT. The blue line respresents the exposure profile for 50% drift reduction and the dotted red line that for 95% drift reduction.
5.5 Risk assessment for drainage ditches
Below, the derived RACs for herbicide HT are summarised in Table 35. The Tier-1 RAC based on EC50-values for primary producers is more stringent than the higher tier RACs. The Tier-1 RAC based on NOECs for primary producers as proposed by Alterra report 2235 is also protective for higher tiers. However, the SSD-RAC based on EC50-values is higher than the mesocosm-RAC.
Table 35 Summary of first and higher tier critical RACs for herbicide HT. All values are in μg/L, expressed on the basis of the active substance.
Time scale First tier Higher tier geomean SSD mesocosm (ETO) Acute 0.79# - 2.6# 2.45 Chronic 0.058& - 0.24& 1.2$
# based on EC50-values according to current guidance
& based on NOEC/EC10-values as proposed in Alterra report 2235
$ according to Alterra report 2235
The RACs based on EC50s for primary producers should be compared with the estimated peak concentration (PECmax). With respect to the RAC based on NOECs for primary producers, it should be decided whether or not TWA-PECs can be used in the risk assessment (see Section 3.3 of the main report). Since the chronic SSD shows that algae and macrophytes have a similar sensitivity distribution, and the duration of algal test usually is short, we considered the use of the PECmax in the risk assessment as most appropriate, and 7- or 21-days TWA PECs are not used. Table 36 summarises the PECs for herbicide HT for 50 and 95% drift reduction based on first tier and second tier calculations (see Section 5.1).

Alterra-report 2463 | 69
Table 36 Summary of first and higher tier critical PECs for herbicide HT. All values are in µg/L, expressed on the basis of the active substance.
Exposure profile 50% drift reduction 95% drift reduction PECmax 7-d TWA PEC 21-d TWA PEC PECmax 7-d TWA PEC 21-d TWA PEC 1st tier 1.745 1.719 1.666 1.130 1.107 1.072 2nd tier 1.353 1.281 1.138 0.904 0.841 0.707
Table 37 Ratios of PEC and RAC for herbicide HT. Values greater than 1 indicate a risk.
Time scale RAC [µg/L]
PEC/RAC based on 2nd tier PEC PECmax 50% DR [1.353 µg/L]
PECmax 95% DR [0.904 [µg/L]
Acute 1st tier 0.79# 1.71 1.14 SSD 2.6# 0.52 0.35 mesocosm (ETO) 2.45 0.55 0.37 Chronic 1st tier 0.058& 23.33 15.59 SSD 0.24& 5.64 3.77 mesocosm (ETO) 1.2$ 1.13 0.75
# based on EC50-values according to current guidance.
& based on NOEC/EC10-values as proposed in Alterra report 2235.
$ according to Alterra report 2235.
For the 1st tier Table 37 shows that an unacceptable risk is identified even when the exposure profile is based on 95% drift reduction. This a is also the case for the SSD approach when based on NOEC/EC10-values for primary producers. For the higher tiers, the ‘acute’ risk is acceptable when based on the SSD approach using EC50-values and considering the mesocosm (threshold option). This is the case for both the 50% and 95% drift reduction exposure profiles. However, in the chronic risk assessment only the RACETO (micro-/mesocosm approach) in combination with the 95% drift reduction profile shows acceptable risks.
5.6 Effect and risk assessment procedure underlying the Water Framework Directive
5.6.1 Monitoring data
Monitoring data for herbicide HT reveal that in all cases concentrations were below the reporting limit of 20 to 50 ng/L.
5.6.2 Aquatic toxicity data
The aggregated ecotoxicity data for herbicide HT are presented in the tables below for freshwater and marine species. The tables contains the lowest value per species, derived according to the procedures described in Section 2.3.4. The derivation of the single endpoint for Scenedesmus subspicatus is described in detail in example 1 of Section 2.3.4. The data for the Azolla mexicana - Anabaena azollae symbiotic system are not included, since the endpoints concern a combination of two species. All values are expressed on the basis of the active substance.

70 | Alterra report 2463
Table 38 Aggregated toxicity data of herbicide HT for freshwater species. All values are expressed on the basis of the active substance.
ACUTE CHRONIC Taxon/species L/EC50
[µg/L] Taxon/species NOEC/EC10
[µg/L] Cyanobacteria Cyanobacteria Anabaena flos-aquae 61a Anabaena flos-aquae 3.2a Oscillatoria laetevirens 2960b Oscillatoria laetevirens 1010 Algae Algae Chlamydomonas reinhardi 23 Chlorella kessleri 8 Chlorella kessleri 26 Pseudokirchneriella subcapitata 2.5c Chlorella vulgaris 31 Scenedesmus subspicatus 1.8k Euglena gracilis 200 Macrophytes Pseudokirchneriella subcapitata 26.5 c Egeria densa 1.57 Scenedesmus quadricauda 152 Elodea sp. 29.8 Scenedesmus subspicatus 26.5d Lemna gibba 15e Macrophytes Lemna minor 0.58 Ceratophyllum demersum 14 Lemna perusilla 4.32 Egeria densa 22 Myriophyllum spicatum 2.85 Elodea canadensis 21 Crustaceans Elodea sp. 78 Ceriodaphnia dubia 4690 Lemna gibba 31.9e Daphnia magna 642l Lemna minor 7.9 Fish Lemna paucicostata 45 Oncorhynchus mykiss 4430m Lemna perusilla 16 Pimephales promelas 13100 Myriophyllum heterophyllum 17 Myriophyllum spicatum 64 Najas sp. 19 Crustaceans Ceriodaphnia dubia 26500 Daphnia magna 49299f Diaptomus mississippiensis 11300 Insects Chironomus riparius 65125g Fish Ictalurus punctatus > 100000h Lepomis macrochirus 92000 Leuciscus idus 154878i Oncorhynchus mykiss 70031j Rasbora heteromorpha 98000
a: most sensitive test duration (96 hours).
b: most relevant endpoint (fresh weight).
c: preferred endpoint, growth rate.
d: geometric mean of 20.5, 48.5 and 18.7 μg/L, (geometric mean) 72-hours ErC50 per compound, see Example 1 in section 2.3.4.
e: most sensitive relevant endpoint, growth rate (test with product).
f: geometric mean of 49000, 49600 and 41300 µg/L; difference between active and product small enough to allow for pooling of data.
g: geometric mean of 97500 and 43500 μg/L; difference between active and product small enough to allow for pooling of data.
h: highest concentration without 50% effect.
i geometric mean of 169600 and 141600 µg/L.
j: geometric mean of 74600, 80300, 95600 and 42000 µg/L; difference between active and product small enough to allow for pooling of data.
k: lowest relevant test duration, see Example 2 in Section 2.3.4.
l: geometric mean of 1290 and 320 µg/L from tests with active; difference between active and 600 g/L SC formulation too large to pool data.
m: Most sensitive endpoint and test duration, EC10 for length from 95 days test.
Table 39 Aggregated toxicity data of herbicide HT for marine species. Value is expressed on the basis of the active substance.
ACUTE CHRONIC Taxon/species L/EC50
[µg/L] Taxon/species NOEC/EC10
[µg/L] Fish Cyprinodon variegatus 85000

Alterra-report 2463 | 71
5.6.3 Pooling of data for freshwater and marine species
According to the guidance, data for freshwater and marine species may be pooled since there are too few data to perform a meaningful statistical comparison and there are no further indications (spread of the data, read-across, expert judgement) of a difference in sensitivity between freshwater versus marine organisms of the relevant taxonomic groups.
5.6.4 Derivation of the MAC-QSfw, eco and QSfw, eco using the assessment factor approach
Acute data are available for 30 species, representing six taxonomic groups (cyanophyta, algae, macrophytes, crustaceans, insects and fish). Chronic data are available for sixteen species, representing five taxa (cyanophyta, algae, macrophytes, crustaceans and fish). The lowest acute endpoint is the 14-days EC50 of 7.9 µg/L for the macrophyte Lemna minor, the lowest chronic endpoint is the 14-days NOEC of 0.58 µg/L for the same species. According to the guidance, the MAC-QSfw, eco, may be derived applying an assessment factor of 10 to the lowest acute endpoint in case the compound has a known mode of toxic action and a representative species for the potentially most sensitive taxonomic groups (algae and/or macrophytes) are included in data set. Using the EC50 of 7.9 µg/L for L. minor with an assessment factor of 10, the MAC-QSfw, eco is 0.79 µg/L. Based on the availability of 16 chronic values, including representatives of the potentially most sensitive taxa, an assessment factor of 10 could be used for derivation of the QSfw, eco. This results in a QSfw, eco of 0.58 / 10 = 0.058 μg/L.
5.6.5 Derivation of the MAC-QSfw, eco and QSfw, eco using the SSD approach
Not enough chronic data are available to generate a chronic SSD and to derive a chronic SSD. Derivation of the MAC-QSfw, eco using SSD is allowed when at least 10 values (preferably 15) are available for different species covering at least eight taxonomic groups. The taxonomic groups to be covered and their representatives in the present dataset are as follows:
1. Fish: Lepomis macrochirus (family Centrarchidae) 2. A second family in the phylum Chordata: Oncorhynchus mykiss (family Salmonidae) 3. A crustacean: Daphnia magna 4. An insect: Chironomus riparius (order Diptera) 5. A family in a phylum other than Arthropoda or Chordata: Anabaena flos-aquae (phylum
cyanobacteria) 6. A family in any order of insect or any phylum not already represented: no data 7. Algae: Pseudokirchneriella subcapitata 8. Higher plants: Lemna minor
The present dataset does not include an additional insect order. However, it can be seen from the data that cyanophyta, algae and macrophytes are by far the most sensitive species groups. Therefore, it is considered justified to perform an SSD. The HC5 is 0.956 (lower and upper limit 0.122-4.334), but the goodness-of-fit is rejected at all levels. This indicaties that using the whole dataset is not a good option. Therefore, an SSD is constructed using the data for algae and macrophytes. Using this SSD, the median estimate of the HC5 is 7.85 µg/L with lower and upper limit 4.14-12.06 µg/L. The SSD-graph is presented in Figure 21.

72 | Alterra report 2463
Figure 20 Species Sensitivity Distribution for herbicide HT based on the full dataset. The Anderson-Darling test was rejected at all levels.
Figure 21 Species Sensitivity Distribution for herbicide HT based on algae and macrophytes. The Anderson-Darling test was accepted at all levels.
When the MAC-QSfw, eco is derived using an SSD curve based on L(E)50-values for a specific group of sensitive taxa, an assessment factor of 6 is recommended. This factor should cover residual uncertainty relating to e.g. the extrapolation from laboratory to field, but also cover the fact that the input data are based on a 50% effect level whereas the MAC-QSfw, eco represents no effect. Using an AF of six results in a MAC-QSfw, eco of 1.4 μg/L. However, considering the chronic data, it appears that this value is very close to the chronic NOEC/EC10-values and even more than a factor of 2 higher than the NOEC for L. minor. For primary producers, the acute and chronic endpoints originate from the same tests or tests with a similar duration. This means that it in view of the NOEC/EC10-values, it cannot be excluded that long-term effects occur at the level of the MAC-QSfw, eco. It can be argued that the MAC-QSfw, eco will be compared with short-term concentration peaks, i.e. that the exposure duration in the field will be shorter than the duration in the tests from which the endpoints have been derived. This would mean that the acute data used for derivation of the MAC-QSfw, eco represent a worst case exposure situation and that the MAC-QSfw, eco overestimates the risk. However, with a sampling scheme of at most once a month, there is a chance that concentrations are elevated for a longer period of time, meaning that an observed peak in fact involves longer exposure

Alterra-report 2463 | 73
times. This would favour the use of the default assessment factor of 10, leading to a MAC-QSfw, eco of 0.81 µg/L. It is not considered justified, however, to adjust flaws in the monitoring scheme by increasing the assessment factor. Besides, the results of the mesocosm experiments (see 5.5.3) indicate that a MAC-QSfw, eco of 1.4 μg/L might be protective. Although particular sensitive species were not present in that experiment, this result is considered acceptable since the effects of herbicide HT are rapidly reversible. Following the same argumentation as described above for the MAC-QSfw, eco, the QSfw, eco may also be derived by means of a chronic SSD for the sensitive species groups. Omitting the NOEC for Oscillatoria laetevirens, 11 species remain and the goodness-of-fit is accepted at all levels in all tests. The median estimate of the HC5 is 0.53 µg/L with lower and upper limit 0.15-1.1 µg/L. The SSD-graph is presented below. When the QSfw, eco is derived using an SSD curve based on NOEC/EC10-values for a specific group of sensitive taxa, an assessment factor of 3 recommended, which results in a QSfw, eco of 0.18 μg/L.
5.6.6 Derivation of the MAC-QSfw, eco and QSfw, eco using micro-mesocosm studies
The available microcosm experiment concerns a single application study with mean dissipation DT50 of 7.1 days (see section 4.5.3 for more details). This study may be considered for the MAC-QSfw, eco derivation if the treatment-related responses are expressed in terms of 72-hours TWA concentrations and for the QS derivation if expressing the treatment-related responses in terms of 21-days TWA concentrations. In Table 34 presented in Section 4.5.3 the Effect class concentrations derived from the available microcosm experiment are expressed in terms of initial 72-hours and 21-days TWA concentrations. An AF of 2-3 may be used to derive a MAC-QSfw, eco (see Section 8.4.6.3 of main report) when an appropriate Effect class 1 concentration is available from a single application study. Because only one micro-/mesocosm study is available (with a low number of macrophyte species present) we decided to apply an AF of 3 to the 72-hours TWA Effect class 1 concentration (4.9 µg/L), resulting in a MAC-QSfw,
eco of 1.6 µg/L. An AF of 2-4 may be used to derive a QSfw, eco (see Section 8.4.6.3 of main report) when an appropriate Effect class 1 concentration is available. Because only one micro-/mesocosm study is available (with a low number of macrophyte species present) we decided to apply an AF of 4 to the 21-days TWA Effect class 1 concentration (2.4 µg/L), resulting in a QSfw, eco of 0.6 µg/L.
5.6.7 Selection of the overall MAC-EQS and EQS
The following MAC-QSfw, eco values are derived: 0.79 µg/L (assessment factor approach), 1.4 µg/L (SSD approach) and 1.6 µg/L (mesocosm approach). According to the WFD-guidance, preference is given to the values derived by SSD and/or mesocosm studies, since these represent a more robust approach towards assessing ecosystem effects. The fact that only few macrophytes species were present in the mesocosm might be seen as a reason to give preference to the SSD. However, this uncertainty has been accounted for by applying the higher assessment factor. Besides, since Herbicide HT is a photosynthesis inhibitor, it may be expected that the presence of algae in the mesocosm adequately covers the sensitive species. Therefore, the value of 1.6 μg/L is selected as the MAC-EQS. The QSfw, eco is 0.058 µg/L using the assessment factor approach, 0.18 µg/L using the SSD-approach and 0.6 µg/L using the mesocosm approach. As for the MAC-EQS, the mesocosm-based value is selected and the EQS is set to 0.6 μg/L.

74 | Alterra report 2463
5.7 Risk assessment for WFD waterbodies
Monitoring data show that concentrations of herbicide HT at WFD-monitoring locations are below the reporting limit of 20 to 50 ng/L. Since the reporting limit is lower than the the MAC-EQS and EQS, this means that the MAC-EQS and EQS are not exceeded.

Alterra-report 2463 | 75
6 Example herbicide HM
6.1 Relevant properties and exposure profile of HM
6.1.1 Information on use and characteristics
Herbicide HM is a herbicide with contact action. It is used in full field applications for a range of different crops, including flower bulbs, and as a sprout suppressor for potatoes upon storage. The compound is a mitosis inhibitor, absorbed predominately by roots and causes disruption of microtubule organisation in plants. Herbicide HM inhibits root and epicotyl growth, normal cell division, protein and RNA synthesis, suppresses transpiration and respiration, interferes with oxidative phosphorylation and photosynthesis and inhibits the activity of beta-amylase. Relevant physico-chemical and environmental properties are presented below in Table 40.
Table 40 Physico-chemical and environmental properties of herbicide HM.
Substance type Herbicide Substance group mitosis inhibitor Molar mass 373.4 g/mol Solubility in water 110 mg/L (20 °C, pH 7) log Kow 3.76 (20 °C, pH 7) DegT50 in soil 24.5 d (20 °C) DegT50 in water (Tier-1 value) 1000 d (20 °C) DegT50 in water (Tier-2 value) - DegT50 in sediment 1000 d (20 °C) Kom soil, sediment, suspended solids 197.2 L/kg 1/n 0.9 - Saturated vapour pressure 0.024 (25 °C)*
(fraction of atmospheric deposition accumulated within 24 hours = 0.02)
Herbicide HM is classified as H351, H373 and H411 (harmonised classification according to CLP). According to the triggers as given in the WFD-guidance, the QSwater,hh food should be derived. The ADI is 0.05 mg/kg bw/d, based on the NOAEL of 5 mg/kg bw/d from a 60-week study with dogs and applying a safety factor of 100.
6.1.2 Exposure profiles
The exposure profile is calculated for application of HM in hyacinths on basis of 3 applications of 0.8 kg/ha at 5 day intervals starting on October 1. Figure 22 presents the Tier-1 exposure profiles for HM according to the Dutch ditch scenario based on a water DegT50 of 1.000 days and 50% drift reduction. The calculated peak concentration of HM is 29.9 µg/L (October 12) and the highest 7-days TWA and 21-days TWA concentration are 27.2 µg/L and 24.2 µg/L, respectively.

76 | Alterra report 2463
Figure 22 Tier-1 exposure profile for herbicide HM according to the new Dutch ditch scenario and 50% drift reduction.
6.2 Laboratory toxicity data
The full laboratory dataset for herbicide HM is presented in Appendix 4. The dataset consists of the dossier data submitted for the European and national authorisation under Directive 91/414/EC, and data from the open literature. By including literature data, we anticipate the situation under the new Regulation 1107/2009/EC which requires that open literature should be added to the dossier. We therefore also consider the situation that additional data are available from literature references that appeared to be scientifically valid upon evaluation. For the verification, different situations are explored, i.e. starting with the data from the dossier and including additional data from the open literature.
6.3 First tier risk assessment for drainage ditches
6.3.1 Regulatory Acceptable Concentrations for aquatic organisms based on core dataset
In order to verify the assumption that a first tier assessment with the core data alone is protective, a first tier assessment is performed using only the endpoints from the core dataset required according to Annex II (see Tables 5-1 and 5-2 of the main report). These data are presented in Table 41 (acute) and Table 42 (chronic). The full dataset is presented in Appendix 4. Note that endpoints are given in mg a.s./L. Test have been submitted with a range of different products, among which emulsifiable concentrates (EC), emulsions in water (EW), products for hot fogging (HN), ultra low volume liquids (UL) and other liquids (AL). In some cases the type of formulation is not clear. For this verification exercise, it is assumed that the 400 g/L EC formulation is subject of authorisation. All values are expressed on the basis of the active substance. Algae For algae, tests are submitted with Pseudokirchneriella subcapitata. In accordance with the recommendations of the OECD (see Footnote 1 to Table 5-1 in the main report) the endpoints for growth rate are used, rather than the values for biomass. For P. kirchneriella, the EC50-values for growth rate are 3.3 mg/L for the active (96-hours), and 1.9 and 2.14 mg/L for the 400 g/L EC-formulation for 96 and 72 hours, respectively. The lowest value of 1.9 mg/L is taken forward. Although currently not an Annex II requirement we also incorporated the NOEC- values for standard test algae

Alterra-report 2463 | 77
in our evaluation as proposed in Alterra Report 2235 (Brock et al., 2011). The lowest NOEC value reported for standard algae is 0.197 mg/L for the green alga Pseudokirchneriella subcapitata. Macrophytes For macrophytes, tests with Lemna minor are available. The lowest relevant EC50 is 1.67 mg/L, from a 7-days test with the active. Additional tests with Myriophyllum sp. or Glyceria maxima are required in case the mode of action or results from herbicide sceening assays indicate the need to do so, i.e. in case of a specific mode of action working on dicot macrophytes or adsorption to the sediment, for which a test with the rooted Myriophyllum species is required, ór in case the toxic mode-of-action predominantly affects monocots, for which a Glyceria test is required (see footnote 3 to Table 5-1 in the main report). This is not the case for herbicide HM. As for algae, we also used the NOEC-values for standard test species of macrophytes in our evaluation. The lowest NOEC value reported for a standard test macrophyte is 0.46 mg/L for Lemna minor. Daphnia Five acute tests with Daphnia magna are present in the dossier. The EC50-values from the tests with the active are 4 and 3.7 mg/L (geometric mean 3.8 mg/L), tests with the 400 g/L EC-formulations resulted in EC50-values of 8.4, 2.6, and 3.59 mg/L (geometric mean 4.3 mg/L based on active substance). The lowest endpoint of 3.8 mg/L is taken forward. Two chronic studies with the active resulted in NOECs of 0.46 and 1.61 mg/L (geometric mean 0.86 mg/L). Fish According to the new data requirements for Annex II, Oncorhynchus mykiss will be the only species which should be routinely tested. Two studies with this species are included in the dossier, LC50-values are 7.5 mg/L for the active, and 3.91 mg/L for the 400 g/L EC formulation (expressed on the basis of the active). The lowest value of 3.91 mg/L is used. The only available chronic endpoint is for Danio rerio, NOEC 0.32 mg/L from a test with the active.
Table 41 Acute toxicity of herbicide HM to aquatic organisms, core data according to Annex II. All values are expressed on the basis of the active substance.
Taxon/species Test Criterion Value compound [mg/L] Algae Pseudokirchneriella subcapitata product EC50 1.9 Macrophytes Lemna minor active EC50 1.67 Crustaceans Daphnia magna active EC50 3.8 Fish Oncorhynchus mykiss active LC50 3.91
Table 42 Chronic toxicity of herbicide HM to aquatic organisms, core data according to Annex II. In addition, the chronic NOEC values for primary producers as proposed in Alterra Report 2235 are given. All values are expressed on the basis of the active substance.
Taxon/species Test Criterion Value compound [mg/L] Crustaceans Daphnia magna active NOEC 0.67 Fish Danio rerio active NOEC 0.32 Algae Pseudokirchneriella subcapitata 400 g/L EC product NOEC 0.197 Macrophytes Lemna minor active NOEC 0.46

78 | Alterra report 2463
For each taxon, the most critical endpoint is selected and the Regulatory Acceptable Concentration (RAC) is determined using the appropriate assessment factor. The lowest RACs are indicated in bold.
Table 43 Acute and chronic RAC for herbicide HM based on core data according to Annex II. In addition, the chronic NOEC values for primary producers as proposed in Alterra Report 2235 are given. All values are expressed on the basis of the active substance.
Time scale Taxon Critical endpoint [mg/L]
AF RAC [mg/L]
RAC [μg/L]
Acute Algae 1.9# 10 0.19 190 Macrophytes 1.67# 10 0.167 167 Crustaceans 3.8 100 0.038 38 Fish 3.91 100 0.039 39 Chronic Crustaceans 0.86 10 0.086 86 Fish 0.32 10 0.032 32 Algae 0.197& 10 0.0197 19.7 Macrophytes 0.46& 10 0.046 46
# based on EC50-values according to current guidance
& based on NOEC/EC10-values as proposed in Alterra report 2235
6.3.2 Bioconcentration and secondary poisoning
The log KOW of herbicide Hm is 3.51 - 3.76, the experimental BCF for fish is 144 L/kg. Since the log Kow is > 3 and the BCF is ≥ 100 L/kg, the direct long-term risks for fish due to bioconcentration and secondary poisoning of predatory birds and mammals should be assessed. Because the BCF is between 100 and 1000 the risk assessment for bioconcentration in fish can be based on the ELS study with a NOEC of 0.32 mg/L for Danio rerio. The according RAC based on this value is 0.32/10 = 0.032 mg/L. When applying 50% (and 95%) drift reduction, the PECmax is lower than the RAC. Therefore, the risks are acceptable. The effect data for mammalian and avian species to be used in the assessment for secondary poisoning are presented in Table 44.
Table 44 Toxicity data to be used in the assessment of secondary poisoning of fish eating birds and mammals.
Species Exposure time Criterion Effect concentration [mg/kgdiet]
Rat Two years NOAEL 600 Colinus virginianus 22 weeks NOEL ≥1000
The RACsp for fish eating birds and mammals is calculated according to the equations in Section 2.2 of the this report as: NOAELbird / 5 *0.159 * BCFfish = 1000/ (5 * 0.159 * 144) ≥ 7.31 mg/L NOAELmammal / 5 *0.138 * BCFfish = 600/ (5 * 0.138 * 144) = 6.04 mg/L These RACsp should be compared with the 21-days TWA PECs, which is 24.2 μg/L. There are no unacceptable risks.

Alterra-report 2463 | 79
6.4 Higher tier risk assessment
6.4.1 Derivation of the RAC using (a limited number of) additional data
In the dossier acute toxicity data for additional fish species are available. The geometric mean LC50-value for fish is presented in Table 45. The acute geomean-RAC for fish is now 75.33 µg/L instead of 39 µg/L, but this is higher than the critical first tier RAC for primary producers and invertebrates and will not drive the risk assessment.
Table 45. Acute geomean RAC-values for herbicide HM. All values are expressed on the basis of the active substance.
Time scale Taxon Geometric mean [µg/L]
Number AF RAC [µg/L]
Acute Fish 7533 (4 species) 4 100 75.33
6.4.2 Derivation of the RAC using SSDs
There are not enough data for derivation of the RAC using SSDs.
6.4.3 Derivation of the RAC using micro-/mesocosm studies
There are no semi-field data available.
6.5 Risk assessment for drainage ditches
The critical acute RAC for herbicide HM is 38 µg/L, the critical chronic RAC is 32 µg/L when following the current procedure, or 19.7 µg/L when using the NOEC for primary producers according to the proposal in Alterra report 2235 (Brock et al., 2011). The RACs based on EC50-values for primary producers should be compared with the estimated peak concentration (PECmax). With respect to the RAC based on NOECs for primary producers, it should be decided whether or not TWA-PEC can be used in the risk assessment (see Section 3.3 of the main report). Since the RAC is based on algae, and the duration of algal test usually is short, we considered the use of the PECmax in the risk assessment as most appropriate. The PECmax is 29.9 µg/L. Table 46 summarises the ratio of PEC and RAC, values are expressed on the basis of the active substance. An unacceptable risk is identified when the RAC is based on NOEC/EC10-values for primary producers. If the current approach is followed and EC50-values are used, no risk is identified.
Table 46 Ratios of PEC and RAC for herbicide HM. Values greater than 1 indicate a risk.
Time scale RAC [µg/L]
PEC/RAC based on first tier PECmax [29.9 µg/L]
Acute 38# 0.78
Chronic 19.7& 1.5 # based on EC50-values according to current guidance
& based on NOEC/EC10-values as proposed in Alterra report 2235

80 | Alterra report 2463
6.6 Effect and risk assessment procedure underlying the Water Framework Directive
6.6.1 Monitoring data
In 2010 and 2011, 90th concentrations of herbicide HM on WFD-monitoring locations were lower than 3.3 μg/L. Average concentrations have declined from about 15 ng/L in 2001 to about 10 ng/L in 2009 (data from Bestrijdingsmiddelenatlas).
6.6.2 Aquatic toxicity data
The aggregated ecotoxicity data for herbicide HM are presented in the tables below for freshwater and marine species. The tables contains the lowest value per species, derived according to the procedures described in Section 2.3.4. All values are expressed on the basis of the active substance.
Table 47 Aggregated toxicity data for herbicide HM for freshwater species. Note that endpoints are given in mg/L, expressed on the basis of the active substance.
ACUTE CHRONIC Taxon/species L/EC50
[mg/L] Taxon/species NOEC/EC10
[mg/L] Algae Algae Chlamydomonas eugametos 0.43 Desmodesmus subspicatus 1.17 Desmodesmus subspicatus 3.04a Navicula pelliculosa 0.702 Navicula pelliculosa 1.65a Pseudokirchneriella subcapitata 0.21g Pseudokirchneriella subcapitata 1.5b Scenedesmus quadricauda 0.04 Macrophytes Macrophytes Lemna minor 1.67c Lemna minor 0.46c Crustaceans Crustaceans Daphnia magna 3.8d Daphnia magna 0.67h Fish Fish Cyprinus carpio 4.1e Danio rerio 0.32 Danio rerio 13.4 Lepomis macrochirus 12 Micropterus salmoides 10 Oncorhynchus mykiss 5.9f Salvelinus fontinalus 8.8 Amphibians Pleurodeles waltii 20 Triturus helveticus 6.5 Xenopus laevis 8.5
a: most relevant endpoint, growth rate.
b: geometric mean of 2.14, 1.0, 1.8 and 1.36 mg/L, (geometric mean) 72-hours ErC50 per compound; difference between active and formulations
is small enough to allow for pooling; geometric mean of 96-hours ErC50 is higher. See section 2.3.4 for further explanation.
c: lowest relevant endpoint and test duration, 7-days biomass.
d: geometric mean of 3.8, 4.3, 2.3, 4.3, 2.5, 0.98, 0.42 and 3.1 mg/L, (geometric mean) EC50 per compound; difference between active and
formulations is small enough to allow for pooling.
e: geometric mean of 7.0 and 2.4 mg/L, LC50 per compound; difference between active and formulations is small enough to allow for pooling.
f: geometric mean of 7.5, 3.91, 6.2, 9, 5.92 and 4.56 mg/L, LC50 per compound; difference between active and formulations is small enough to
allow for pooling.
g: geometric mean of 0.46 and 0.1, 96-hours NOEC for growth rate for active and 400 g/L EC formulation; difference between active and
formulations is small enough to allow for pooling; geometric mean of 72-hours NOErC is higher. See section 2.3.4 for further explanation.
h: geometric mean of 0.45 and 1.0 mg/L.

Alterra-report 2463 | 81
Table 48 Aggregated toxicity data of herbicide HM for marine species. Note that endpoint is given in mg/L, expressed on the basis of the active substance.
ACUTE CHRONIC Taxon/species L/EC50
[mg/L] Taxon/species NOEC/EC10
[mg/L] Echinoderms Lytechinus pictus 0.124
6.6.3 Pooling of data for freshwater and marine species
According to the guidance, data for freshwater and marine species may be pooled since there are too few data to perform a meaningful statistical comparison and there are no further indications (spread of the data, read-across, expert judgement) of a difference in sensitivity between freshwater versus marine organisms of the relevant taxonomic groups. However, the only marine endpoint available is for a typically marine species that is not representative for freshwater ecosystems. The endpoint for echinoderms is therefore not taken into account for QS-derivation for freshwater.
6.6.4 Derivation of the MAC-QSfw, eco and QSfw, eco using the assessment factor approach
Acute data are available for 15 species, representing five taxonomic groups (algae, macrophytes, crustaceans, fish and amphibians). Chronic data are available for seven species, representing four taxa (algae, macrophytes, crustaceans and fish). The lowest acute endpoint is the 48-hours EC50 of 0.43 mg/L for cell density of Chlamydomonas eugametos, the lowest chronic endpoint is the 72-hours NOEC of 0.04 mg/L for Scenedesmus quadricauda. According to the guidance, the MAC-QSfw, eco, may be derived applying an assessment factor of 10 to the lowest acute endpoint in case the compound has a known mode of toxic action and a representative species for the potentially most sensitive taxonomic groups (algae and/or macrophytes) are included in data set. Using the EC50 of 0.43 mg/L for C. eugametos with an assessment factor of 10, the MAC-QSfw, eco is 43 µg/L. Based on the availability of seven chronic values, including representatives of the potentially most sensitive taxa, an assessment factor of 10 can be used for derivation of the QSfw, eco. This results in a QSfw, eco of 0.04/ 10 = 4 μg/L.
6.6.5 Derivation of the MAC-QSfw, eco and QSfw, eco using the SSD approach
There are not enough data to use the SSD approach.
6.6.6 Derivation of the MAC-QSfw, eco and QSfw, eco using micro-mesocosm studies
There are no field studies available.
6.6.7 Derivation of the QSfw, secpois
The criticial concentrations in food for mammals (QSbiota, secpois, fw) are derived based on the toxicity data for birds and mammals as presented in Appendix 4, and the default assessment factors from the WFD-guidance. With respect to the mammal studies, it should be noted that a number of endpoints in Appendix 4 refer to parameters such as changes in haematology or organ weights. The link of these endpoints to population level effects is not clear, according to the guidance relevant endpoints are mortality, growth and effects on reproduction. Only those endpoints are listed in Table 49 below. The ≥-value for birds is not used, but included in the table to show that bird-species have been tested.

82 | Alterra report 2463
Table 49 Summary of QSbiota, secpois, fw for herbicide HM.
Species Duration NOAEC [mg/kg fd]
AF QSbiota, secpois, fw [mg/kg fd]
Bird 22 w ≥ 1000 Dog 28 d 20000 300 67 Dog 60 w 2000 30 67 Mouse 18 m 4150 30 138 Rat 28 d 3000 300 10 Rat 90 d 1000 90 11 Rat 90 d 6000 90 67 Rat 2 year 600 30 20 Rat gestation day 6-15 4000 90a 44 Rat gestation day 6-19 8000 90a 89 Rabbit day 6-18 after mating 4163 90a 46
a: although involving short-term exposure, an assessment factor of 90 is used because the compound is administered during a critical phase in
embryonic development.
For rats, the NOAEC values from the 90-days studies (1000 and 6000 mg/kg fd) are higher than the NOAEC from the two year study (600 mg/kg fd), but the larger assessment factor for the 90-days studies leads to a lower QSbiota, secpois, fw in one case. In such a situation, preference is given to the study with the longest test duration and the lowest assessment factor. The QSbiota, secpois, fw is therefore set to 20 mg/kg fd. The QSfw, secpois is derived as QSbiota, secpois, fw divided by the BCF of 144 L/kg and BMF of 1, resulting in 140 µg/L.
6.6.8 Derivation of the QSwater, hh food
The criticial concentration in food for humans (QSbiota, hh food) is calculated from the ADI (0.05 mg/kg bw/d), a body weight of 70 kg and a daily fish consumption of 115 g and a maximum contribution of fish consumption to the ADI of 10%. The resulting QSbiota, hh food is 0.1 x 0.05 x 70 / 0.115 = 3.04 mg/kg fd. Subsequently the QSfw, hh food is calculated using the BCF of 144 L/kg and BMF of 1 as 3.04 / (144 x 1) = 0.0211 mg/L = 21.1 µg/L.
6.6.9 Selection of the overall MAC-EQS and EQS
The MAC-EQS is 43 µg/L. For the EQS, the lowest of the routes direct ecotoxicity, secondary poisoning and human exposure via fish is selected, resulting in 4 µg/L.
6.7 Risk assessment for WFD waterbodies
The 90th percentile concentration of herbicide HM of 3.3 μg/L is lower than the MAC-EQS and EQS. It is not expected that WFD-standards will be exceeded.

Alterra-report 2463 | 83
7 Example fungicide FP
7.1 Relevant properties and exposure profile of fungicide FP
7.1.1 Information on use and characteristics
Fungicide FP is a multi-site contact protective fungicide belonging to the pyridinamine family. It disrupts the energy production in the fungus. It is used in a variety of crops, incuding potatoes, onions, and flower bulbs. Relevant physico-chemical and environmental properties are presented below in Table 50.
Table 50 Physico-chemical and environmental properties of fungicide FP.
Substance type Fungicide Substance group Phenyl-pyridinamine Molar mass 465.1 g/mol Solubility in water 0.135 mg/L (20 °C) log Kow 4.03 (25 °C) DegT50 in soil 72 (20 °C; pF 2) DegT50 in water (lower tier value) 3.7 d (20 °C) DegT50 in water (higher tier value) - DegT50 in sediment 1000 d (20 °C) Kom soil, sediment, suspended solids 1138 L kg-1 1/n 0.65 - Saturated vapour pressure 7.5E-3 Pa (25 °C)
Fungicide FP is proposed to be assigned R23, 41, 43 and 63. According to the triggers as given in the WFD-guidance, the QSwater,hh food should be derived. The ADI is 0.01 mg/kg bw/d, based on a 2-year mouse study, supported by a 52-week dog study and applying a safety factor of 100.
7.1.2 Exposure profiles
The exposure profile is calculated for application of FP in potatoes on basis of 15 applications of 0.2 kg/ha at seven day intervals and starting on June 1. Figure 23 presents the predicted Tier-1 exposure profiles based on the new Dutch ditch scenario, using a DegDT50 of 3.7 days and 50% (blue line) and 95% (red line) drift reduction. The overall dissipation of FP is so fast that no gradual increase in peak exposure concentrations can be observed following each treatment. The exposure profile simulating 50% drift reduction is characterised by a PECmax of 1.241 µg/L. The highest 7-days TWA PEC and 21-days TWA PEC values for the 50% drift reduction profile are 0.087 µg/L and 0.077 µg/L, respectively. The exposure profile simulating 95% drift reduction is characterised by a PECmax of 0.118 µg/L. The highest 7-days TWA PEC and 21-days TWA PEC values for the 95% drift reduction profile are 0.024 µg/L and 0.021 µg/L, respectively.

84 | Alterra report 2463
Figure 23 Tier-1 exposure profiles for fungicide FP on basis of the new Dutch ditch scenario and 50% (blue line) and 95% (red line) drift reduction.
7.2 Laboratory toxicity data
The full laboratory dataset for fungicide FP is presented in Appendix 4. The dataset consists of the dossier data submitted for the European and national authorisation under Directive 91/414/EC, and data from the open literature. By including literature data, we anticipate the situation under the new Regulation 1107/2009/EC which requires that open literature should be added to the dossier. We therefore also consider the situation that additional data are available from literature references that appeared to be scientifically valid upon evaluation. For the verification, different situations are explored, i.e. starting with the data from the dossier and including additional data from the open literature.
7.3 First tier risk assessment for drainage ditches
7.3.1 Regulatory Acceptable Concentrations for aquatic organisms based on core dataset
In order to verify the assumption that a first tier assessment with the core data alone is protective, a first tier assessment is performed using only the endpoints from the core dataset required according to Annex II (see Table 5-1 and 5-2 of the main report). These data are presented in Table 51 (acute) and Table 52 (chronic). For this we assume that the 500 g/L product is subject of authorisation. All values are expressed on the basis of the active substance. Algae For Pseudokirchneriella subcapitata the EC50 for growth rate was determined as > 220 µg/L in a test with the active, and > 2176 μg/L in a test with the 500 g/L product (expressed on the basis of the active substance). Greater than values cannot be used for derivation of the RAC, but are incuded for indicative purposes. The lowest NOEC is used for derivation of the RAC. Arthropods For Daphnia magna, acute endpoints are available from five tests, the EC50-values for mobility are 55, 190 and 220 µg/L in tests with the active (geometric mean 132 µg/L), and 119 and 147 µg/L in tests with a 500 g/L product (geometric mean 180 µg/L expressed as active). The lowest of both geomeans, 132 µg/L, will be used for derivation of the RAC. Two chronic NOECs are available from tests with the active, the lowest relevant endpoint (12.5 µg/L for growth) is selected. Chironomus riparius appears to

Alterra-report 2463 | 85
be sensitive as judged from the chronic NOEC from a water/sediment study. However, according to Annex II, testing of insects in addition to algae is only required for insecticides. Fish For Oncorhynchus mykiss, 96-hours LC50-values of 36 and 110 µg a.s./L are obtained with the active. The geometric mean of these values of 63 µg a.s./L is used for derivation of the RAC, because it is lower than the LC50 of 160 µg a.s./L for the 500 g a.s./L product. With respect to the chronic data for fish, a 21-days NOEC for O. mykiss is available, but this test is no longer part of the data requirements. Instead, an ELS- or FLC-test is required, depending on the characteristics of the compound. Both tests are present in the dossier, the lowest endpoint of 2.9 µg a.s./L from the FLC-test is used for the first tier assessment. Macrophytes According to Annex II, macrophytes have to be tested in case the fungicide has a herbicidal action. Although not fully clear from the acute data, the chronic data (see Table 52) indicate that the sensitivity of macrophytes is similar to that of crustaceans. Therefore, the acute EC50 for Lemna gibba is considered as part of the core dataset.
Table 51 Acute toxicity of Fungicide FP to aquatic organisms, core data according to Annex II. All values are expressed on the basis of the active substance.
Taxon/species Test Criterion Value compound [μg a.s/L] Algae Pseudokirchneriella subcapitata active EC50 > 220 Macrophyta Lemna gibba active EC50 > 69 Crustaceans Daphnia magna active EC50 132a Fish Oncorhynchus mykiss active LC50 63b
a: geometric mean of three EC50-values
b: geometric mean of two LC50-values
Table 52 Chronic toxicity of fungicide FP to aquatic organisms, core data according to Annex II.
Taxon/species Test Criterion Value compound [μg a.s/L] Crustaceans Daphnia magna active NOEC 12.5 Fish Pimephales promelas active NOEC 2.9
For each taxon, the Regulatory Acceptable Concentration (RAC) is determined using the appropriate assessment factor. The lowest RACs are indicated in bold. Greater-than values are presented for indicative purposes, but are not used in the risk assessment.

86 | Alterra report 2463
Table 53 Acute and chronic RAC for Fungicide FP based on core data according to Annex II.
Time scale Taxon Critical endpoint [µg a.s./L]
AF RAC [µg a.s./L]
Acute Algae > 220 10 > 22 Macrophytes > 69 10 > 6.9 Crustaceans 132 100 1.32 Fish 63 100 0.63 Chronic Crustaceans 12.5 10 1.25 Fish 2.9 10 0.29
7.3.2 Bioconcentration and secondary poisoning
The log KOW of Fungicide FP is 4, the experimental BCF for fish is 960-1090 L/kg, based on studies with a formulated product (geometric mean 1023 L/kg). The BCF is based on total radioactive residues, and can thus be overestimated. However, additional information is not available. Since the log Kow is > 3 and the BCF is ≥ 100 L/kg, the direct long-term risks for fish due to bioconcentration and secondary poisoning of predatory birds and mammals should be assessed. For the risk assessment for fish, decision scheme 4-2 in the main report is followed. From the BCF-study it appears that 22-24% of the residue is remaining after the 14-days depuration period, but the DT90 in the water/sediment study is <100 days. In this case, the RAC based on an ELS-test should be compared with the PECmax. The NOEC from the ELS-test with P. promelas is 2.9 µg a.s./L. With a trigger of 10, the RAC is 0.29 µg a.s./L. The 50% drift reduction PECmax (1.241 µg/L) is higher than the this RAC, indicating risks. The 95% drift reduction PECmax (0.118 µg/L) is lower than this RAC, indicating low risks. The effect data for mammalian and avian species to be used in the assessment for secondary poisoning are presented in the next table.
Table 54 Toxicity data to be used in the assessment of secondary poisoning of fish eating birds and mammals.
Species Exposure time Criterion Effect concentration [mg/kgdiet]
Mouse 104 w NOAEC 10 Anas platyrhynchos 43 w NOAEC 500
The RACsp for fish eating birds and mammals is calculated according to the equations in section 5.3.3 of the main report as: NOAELbird / 5 *0.159 * BCFfish = 500/ (5 * 0.159 * 1023) = 0.615 mg/L = 615 µg/L NOAELmammal / 5 *0.138 * BCFfish = 10/ (5 * 0.138 * 1023) = 0.014 mg/L = 14 µg/L These RACs should be compared with the 21-days TWA PEC (50% drift reduction, 0.077 μg/L; 95% drift reduction, 0.021 μg/L), indicating low risks.
7.4 Higher tier risk assessment
7.4.1 Derivation of the RAC using (a limited number of) additional data
Since for the acute assessment enough data are available for construction of an SSD, the geomean approach is only considered for the chronic assessment. For fish, the geometric mean value is 5.9 µg a.s./L, based on the endpoints for Oncorhynchus mykiss (NOEC 12 µg a.s./L) and Pimephales promelas (2.9 µg a.s./L). For the other taxa, no additional data are present, and single values are given in Table 55.

Alterra-report 2463 | 87
Table 55 Chronic geomean RAC values for fungicide F. All values are expressed on the basis of the active substance.
Time scale Taxon Geometric mean [µg/L]
Remark AF RAC [µg/L]
Chronic Crustaceans 12.5 single value 10 1.25 Insects 6.25 single value 10 0.625 Fish 5.9 n = 2 10 0.59
7.4.2 Derivation of the RAC using SSDs
Fungicide FP has a broad biocidal mode-of-action illustrated by the fact that all Tier-1 critical endpoints (including the additional data) are within a factor of 50. Sensitivity among organisms differs, even within taxonomic groups. Tier 1 shows that the most sensitive organisms belong to the Crustacea, Rotifera and Oligochaeta. As no taxonomic group of organisms is the most sensitive over its full range of species, all acute data are included in one SSD, except for fish. Vertebrates like fish represent a higher protection goal. Therefore a separate SSD is recommended following the default approach as described in paragraph 2.4. In addition, a separate SSD for fish allows for the comparison of the acute fish SSD with the threshold levels from mesocosm studies, which do not include fish either in the case of FP. As data for 6 fish species are available (including one saltwater species), indeed a separate acute fish SSD can be constructed as this number exceeds the minimum number of data points required for fish (n=5). The data for Lemna gibba and Pseudokirchneriella subcapitata are non-determinate values (greater than values) and are not included in the SSD but only considered indicatively. Chironomus and Glyptotendipes were tested in combination without discrimination between the two species, and therefore these results are not used either. Table 52 lists the toxicity values used for construction of the acute SSDs. Eight chronic toxicity values are available representing 4 taxonomic groups (Table 52). This was not considered sufficient to construct a separate chronic SSD.

88 | Alterra report 2463
Table 56 Aggregated acute toxicity data of fungicide FP for freshwater species used for the construction of SSDs. All values are expressed on the basis of the active substance.
ACUTE CHRONIC Taxon/species L/EC50
[µg/L] Taxon/species NOEC/EC10
[µg/L] algae algae Desmodesmus subspicatus 227 Desmodesmus subspicatus 30 Monoraphidium minutum 1799 Monoraphidium minutum 197 Pseudokirchneriella subcapitata > 220a Pseudokirchneriella subcapitata 48e Scenedesmus quadricauda 9932 Scenedesmus quadricauda 375 macrophytes macrophytes Lemna gibba > 69.1 Lemna gibba 35.9 crustaceans crustaceans Acanthrocyclops venustus 4.6 Daphnia magna 12.5f Asellus aquaticus 79.1 fish Daphnia galeata 49.7 Oncorhynchus mykiss 12 Daphnia magna 132b Pimephales promelas 2.9g Daphnia pulex 66.4 Gammarus pulex 127 Proasellus coxalis 368 insects Caenis horaria 1995 Cloeon dipterum 176 rotifers Brachionus calyciflorus 1.6 molluscs Lymnaea stagnalis 43.8 Physa fontinalis 263 molluscs, bivalves Sphaerium sp. 185 flatworms Dugesia sp. 40.5 Polycelis nigra 105 Hirudinea Erpobdella sp. 89.1 Oligochaetes Lumbriculus variegatus 39.4 Tubifex sp 8 fish Cyprinodon variegatusa 120 Cyprinus carpio 150 Danio rerio 89 Lepomis macrochirus 55 Oncorhynchus mykiss 63d Poecilia reticulata 109
a: most relevant parameter for active substance
b: geometric mean of 55, 190 and 220 μg/L from tests with active
c: saltwater species
d: geometric mean of 36 and 110 μg/L from tests with active
e: most sensitive test duration, 96 hours
f: most sensitive endpoint
g: most sensitive endpoint and test duration
For the acute SSD based on data from 10 taxonomic groups (Figure 24), the HC5 is 3.92 µg/L with a lower limit of 0.98 µg/L and a higher limit of 10.26 µg/L. Using an assessment factor of 3, the acute SSD-RAC is 1.31 µg/L. Using the acute data for fish, the HC5 is estimated as 46.7 µg/L with a lower limit of 21.9 µg/L and a higher limit of 65.6 µg/L (Figure 25). Applying an AF of 5 (Table 6.4 in Brock et al., 2001) results in an SSD-RAC for fish of 9.34 µg/L.

Alterra-report 2463 | 89
Figure 24 SSD presenting the acute data for fungicide FP for 10 taxonomic groups (non-vertebrates). The Anderson-Darling test for normality was accepted at the 0.05 % significance level.
Figure 25 SSD based on acute data for fungicide FP for fish. The Anderling-Darlon test for normality was accepted at the 0.05 % significance level.
7.4.3 Derivation of the RAC using micro-/mesocosm studies
Acute RAC derivation on basis of micro-/mesocosm experiments One indoor microcosm experiment (without fish) is available that simulated the impact of repeated pulse exposures (four times; seven days interval) on a freshwater community. In the test systems representatives of taxa are present that apear to be the most sensitive in additional laboratory single species tests (Rotifera, Crustacea, Oligochaeta; see above). In the test systems water dissipation of Fungicide FP varied between 0.8 - 2 days (mean 1.6 days) and before the next application approximately 1-5% of the previous application was still present. In the microcosm test pulse duration was overall realistic to slightly worst-case when compared to that for the predicted exposure profiles (Figure 23). A summary of the exposure-response relationships (Effect classes) observed in the microcosm experiment is presented in Table 57. The highest nominal concentrations are based on actual measurements of FP in the dosing solution applied to each microcosm, the water volume of each test system, and the FP concentration measured in the microcosms immediately before the second, third and fourth application.

90 | Alterra report 2463
Table 57 Summary of effects observed in microcosms treated with fungicide FP in terms of Effect classes that are expressed in nominal, highest measured peak (2 hours post application), and highest 48-hours and 21-days TWA concentrations, expressed on the basis of the active substance.
Endpoint category Treatment level [µg/L] Nominal 0.56 2.7 11.3 55.6 253.0 Highest measured peak 0.41 1.9 8.0 38.9 231 Highest 48-hours TWA 0.37 1.8 7.6 37.2 169 Highest 21-days TWA 0.10 0.2 1.1 8.0 93.8 Effect Class
Macrocrustaceansa 1c 1c 1 2 ↓ 5B ↓
Other macroinvertebratesb 1 1 1 1 5B ↓ Microcrustaceans 1 1 2-3A↓ 3A ↓ 5B ↓↑ Rotifers 1 1 1↓ 3A ↓ 5A ↓↑ Algae 1 1 1 3A↑d 5B↑ Macrophytes 1 1 1 1 1e
Community metabolism 1 1 1 1 3A ↓↑ Decomposition 1 1 1 1 2-3A ↓ Overall Effect class 1 1 2-3A 3A 5B
a To the endpoint category 'macrocrustaceans' belong the species Asellus aquaticus and Gammarus pulex.
b To the endpoint category 'other macroinvertebrates' belong Lymnea stagnalis and Oligochaeta.
c Due to competition between A. aquaticus and G. pulex, the latter species disappeared from the microcosms at the two lowest treatment levels
and the controls at the end of the experiment. There was no indication that this disappearance of G. pulex was due to applications of FP.
d One species only showed an effect, relatively small deviations compared to controls.
e No effects observed on biomass, however all Myriophyllum spicatum apical shoots did flower during the experiment except for those at the
250 µg/L treatment level.
Since in the microcosms the DT50 for dissipation from the water phase was overall realistic to slightly worst-case as compared to the predicted exposure profile, we used the measured peak concentration to express the Effect classes (for rationale see Section 8.4.4.2 of main report). To address the Ecological Threshold Option the overall Effect class 1 concentrations of 1.9 µg/L may be used with an AF of 1 to 2 (Table 6-5 of main report). We selected an AF of 2 since only one study is avialable and the study concerned an indoor microcosm experiment. This procedure results in an acute RACETO of 0.95 µg/L. The acute RACETO value of 0.95 µg/L is higher than the PECmax of the 95% drift reduction exposure profile (indicating acceptable risks) but lower than the 50% drift reduction exposure profile (indicating potential risks). To address the Ecological Recovery Option either the overall Effect class 2-3A (8.0 µg/L based on measured peak concentrations) or the highest overall Effect class 3A concentration (38.9 µg/L) may be used by applying an AF of 3 to 4. Because the model ecosystem study concerned an indoor test system we selected the overall Effect class 2-3A concentration of 8.0 µg/L and an AF of 4, resulting in a provisional acute RACERO of 2.0 µg/L. This value is higher than the Tier-1 PECmax values of both the 50% and 95% drift reduction profiles. Note that this provisional acute RACERO is derived from a microcosm experiment that simulated 4 weekly treatments of the fungicide. The predicted exposure profile, however, is characterised by 15 weekly pulse exposures. By plotting the provisional acute RACETO (Ecological Threshold Option) on the predicted exposure profiles (see Figure 26) it appears that during a period of 14 weeks some effects can be expected in case of 50% drift reduction. Consequently, without additional information, the provisional acute RACERO cannot be used in the final risk assessment since the period of possible effects followed by recovery may be larger than 8 weeks. In case of 95% drift reduction, the predicted exposures are always lower than the acute RACETO so that risks due to short-term exposures are not expected (Figure 26).

Alterra-report 2463 | 91
Figure 26 Tier-1 exposure profiles for fungicide FP on basis of the new Dutch ditch scenario and 50% (blue line) and 95% (red line) drift reduction on which the acute RACETO derived fom the microcosm experiment is plotted.
Chronic RAC derivation on basis of micro-/mesocosm experiments An important question at stake is whether the indoor microcosm study can be used for the chronic risks assessment as well, considering the fact that fungicide FP was applied four times at weekly intervals and that the pulse duration in the microcosm was realistic to slighly worst-case test system as compared to the predicted profile. Before the next application approximately 1 - 5 % of the previous application was still present in the water column. Since the most sensitive measurement endpoints comprised micro-crustaceans we assume that four realistic to slightly worst-case pulse exposures suffice to express the maximum effects. In that case the chronic effects of FP in the microcosms can be expressed in terms of the measured peak concentration, but the chronic RAC thus derived should always be comared with the PECmax in the risk assessment (see Table 6-6 of main report). The chronic RAC addressing the ecological threshold option is derived by applying an AF of 1 to 2 (see Table 6-6 of main report) to the Effect class 1 concentration based on measured peak concentration (1.9 µg/L). We selected an AF of 2 since only one indoor study is available, resulting in a chronic RACETO of 0.95 µg/L.
7.5 Risk assessment for drainage ditches (PPP regulation)
Below, the derived RACs for fungicide FP (rounded values) are summarised in Table 58. In case of FP, the RACs do not deviate much between tiers, but for this compound the 1st tier is overall protective. Note that in the end the RAC for bioconcentration in fish (0.29 µg/L) drives the risk assessment. Table 59 summarises the PECs for fungicide FP for 50 and 95% drift reduction based on 1st tier calculations (see Section 7.1.2).

92 | Alterra report 2463
Table 58 Summary of first and higher tier critical RACs for Fungicide FP. All values are in µg/L, expressed on the basis of the active substance.
Time scale First tier
Higher tier
geomean SSD mesocosm (ETO) mesocosm (ERO) bioconc fish sec pois Acute 0.63 1.31$
9.34* 0.95 2.0# 0.29 14
Chronic 0.29 0.59 n.d. 0.95& n.d. $ based on SSD for non-vertebrates
* based on SSD for fish
# applicable for 95% drift reduction exposure profile only
& obligatory to compare with PECmax in risk assessment
Table 59 Summary of PECs for Fungicide FP. All values are in µg/L, expressed on the basis of the active substance.
Exposure profile 50% drift reduction 95% drift reduction PECmax 7-d TWA PEC 21-d TWA PEC PECmax 7-d TWA PEC 21-d TWA PEC 1st tier 1.24 0.087 0.077 0.118 0.024 0.021
The acute RACs should always be compared with the estimated peak concentration (PECmax), this is also the case for the RAC for bioconcentration in fish. In this evaluation the chronic RACs based on laboratory toxicity data (Tier 1; geomean, SSD) are compared with with the PECmax and the 7-days TWA PEC since the criteria for using the TWA approach are not violated (see Alterra Report 2235). The chronic RACETO derived in Section 7.4.3, however, should be compared with the PECmax since this RAC is expressed in terms of peak concentration of the test substance in the microcosms. The risks of secondary poisoning are based on a comparison of the RACsp with the 21-days TWA PEC.
Table 60 Ratios of PEC and RAC for fungicide FP. Values greater than 1 indicate a risk., empty cells indicate that the combination of PEC and RAC is not applicable.
Acute RAC [µg/L]
PEC/RAC based on 2nd tier PEC PECmax 50% DR [1.24 µg/L]
PECmax 95% DR [0.118 µg/L]
7-d TWA PEC 50% DR [0.087 µg/L]
7-d TWA PEC 95% DR [0.024 µg/L]
21-d TWA PEC 50% DR [0.077 µg/L]
21-d TWA PEC 95% DR [0.021 µg/L]
first tier 0.63 2.0 0.2 SSD (non-vert.) 1.31 0.9 0.1 SSD (fish) 9.34 0.13 0.01 microcosm (ETO) 0.95 1.3 0.1 chronic 1st tier 0.29 4.3 0.4 0.3 0.08 Geomean (fish) 0.59 2.1 0.2 0.15 0.04 microcosm (ETO) 0.95 1.3 0.1 bioconc. fish 0.29 4.3 0.4 sec. poisoning 14 0.006 0.002
From Table 59 it follows that for bioconcentration in fish and the acute first Tier the risks are unacceptable when 50% drift reduction is considered (PEC/RAC values > 1). No unacceptable risk is identified when the exposure profile based on 95% drift reduction is used (all PEC/RAC values < 1).

Alterra-report 2463 | 93
7.6 Effect and risk assessment procedure underlying the Water Framework Directive
7.6.1 Monitoring data
Monitoring data for WFD-monitoring locations reveal that in the majority of cases fungicide FP was not detected above the reporting limit except for some occasions in June, July and August. Summarising the data for five locations, measured concentrations on individual sampling dates range from 20 to 220 ng/L.
7.6.2 Aquatic toxicity data
The aggregated ecotoxicity data for fungicide FP are presented in the tables below for freshwater species. The table contains the lowest value per species, derived according to the procedures described in the Introduction. There are no toxicity data from marine species. Chironomus and Glyptotendipes were tested in combination without discrimination between the two species, and therefore the result is not used.

94 | Alterra report 2463
Table 61 Aggregated toxicity data of fungicide FP for freshwater species. All values are expressed on the basis of the active substance.
ACUTE CHRONIC Taxon/species L/EC50
[µg/L] Taxon/species NOEC/EC10
[µg/L] algae algae Desmodesmus subspicatus 227 Desmodesmus subspicatus 30 Monoraphidium minutum 1799 Monoraphidium minutum 197 Pseudokirchneriella subcapitata > 220a Pseudokirchneriella subcapitata 48e Scenedesmus quadricauda 9932 Scenedesmus quadricauda 375 macrophytes macrophytes Lemna gibba > 69.1 Lemna gibba 35.9 crustaceans crustaceans Acanthrocyclops venustus 4.6 Daphnia magna 12.5f Asellus aquaticus 79.1 fish Daphnia galeata 49.7 Oncorhynchus mykiss 12 Daphnia magna 132b Pimephales promelas 2.9g Daphnia pulex 66.4 Gammarus pulex 127 Proasellus coxalis 368 insects Caenis horaria 1995 Cloeon dipterum 176 rotifers Brachionus calyciflorus 1.6 molluscs Lymnaea stagnalis 43.8 Physa fontinalis 263 mollusks, bivalves Sphaerium sp. 185 flatworms Dugesia sp. 40.5 Polycelis nigra 105 Hirudinea Erpobdella sp. 89.1 Oligochaetes Lumbriculus variegatus 39.4 Tubifex sp 8 fish Cyprinodon variegatusa 120 Cyprinus carpio 150 Danio rerio 89 Lepomis macrochirus 55 Oncorhynchus mykiss 63d Poecilia reticulata 109
a: most relevant parameter for active substance.
b: geometric mean of 55, 190 and 220 μg/L from tests with active.
c: saltwater species.
d: geometric mean of 36 and 110 μg/L from tests with active.
e: most sensitive test duration, 96 hours.
f: most sensitive endpoint.
g: most sensitive endpoint and test duration.
7.6.3 Derivation of the MAC-QSfw, eco and QSfw, eco using the assessment factor approach
Acute data are available for 30 species, representing nine taxonomic groups (algae, macrophytes, crustaceans, insects, rotifers, molluscs, flatworms, ringworms and fish). Chronic data are available for eight species, representing five taxonomic groups (algae, macrophytes, crustaceans, insecta and fish). The lowest acute endpoint is the 48-hours EC50 of 1.6 µg/L for the rotifer Brachionus calyciflorus, the lowest chronic endpoint is the 278-days NOEC of 2.9 µg/L for fish. According to the guidance, the MAC-QSfw, eco, may be derived applying an assessment factor of 10 to the lowest acute endpoint in case the compound has a known mode of toxic action and a representative species for the potentially most sensitive taxonomic groups are included in data set. As

Alterra-report 2463 | 95
stated in the main report (Brock et al., 2011), for derivation of the QSfw, eco it should be considered whether or not fungi are potentially more sensitive than the other taxa represented in the dataset. It is logical to consider this also for the MAC-QSfw, eco. Fungicide FP is a biocidal fungicide, for which in principle any taxon could be the most sensitive and screening data for fungicide FP indicate that fungi are not particularly sensitive. Using the EC50 of 1.6 µg/L for B. calyciflorus with an assessment factor of 10, the MAC-QSfw, eco is 0.16 µg/L. Based on the availability of three chronic values, an assessment factor of 10 could be considered for derivation of the QSfw, eco. However, the lowest acute endpoint (EC50 of 1.6 µg/L for B. calyciflorus) is lower than the lowest chronic endpoint (NOEC of 2.9 µg/L for P. promelas). In this case, an assessment factor of 100 is put on the lowest acute endpoint, resulting in a QSfw, eco of 1.6 / 100 = 0.016 μg/L.
7.6.4 Derivation of the MAC-QSfw, eco and QSfw, eco using the SSD approach
Derivation of the MAC-QSfw, eco using SSD is allowed when at least ten values (preferably fifteen) are available for different species covering at least eight taxonomic groups. The taxonomic groups to be covered and their representatives in the present dataset are as follows:
1. Fish: Lepomis macrochirus (family Centrarchidae) 2. A second family in the phylum Chordata: Oncorhynchus mykiss (family Salmonidae) 3. A crustacean: Daphnia magna 4. An insect: Cloeon dipterum (order Ephemeroptera) 5. A family in a phylum other than Arthropoda or Chordata: Dugesia (phylum Platyhelminthes) 6. A family in any order of insect or any phylum not already represented: Tubifex sp. (phylum
Annelida) 7. Algae: Pseudokirchneriella subcapitata 8. Higher plants: no data
The present dataset does not include valid data on macrophytes. However, a test with Lemna gibba did not result in 50% effect at the highest concentration tested therefore, it is considered justified to perform an SSD despite the fact that the data requirements are not fully met. The goodness-of-fit is rejected except for the Anderson-Darling test at the 0.01 level. Using this SSD, the median estimate of the HC5 is 5.66 µg/L with lower and upper limit 2.0 - 12.05 µg/L. However, in view of the bad fit, using this value is not considered justified.
Figuur 27 SSD presenting the acute data for fungicide FP for seven taxonomic groups including vertebrates. The Anderling-Darlon test for normality was only accepted at the 0.01 % significance level.

96 | Alterra report 2463
7.6.5 Derivation of the MAC-QSfw, eco and QSfw, eco using micro-mesocosm studies
The available microcosm experiment concerns a pulsed exposure regime in which water exposure concentrations between pulses decline to approximately 1-5% of the initial peak concentration. Consequently, as described in Section 8.4.4.3 of the main report (Brock et al., 2011), this microcosm study can only be considered for the MAC-QSfw, eco derivation. In the effect assessment in line with the WFD decision schemes, the effects observed in the microcosm experiment should be expressed in terms of 48-hours TWA concentrations of the highest pulse (crustaceans appear to be the most sensitive taxa). The Effect class concentrations derived from the available micro-/mesocosm experiments, expressed in terms of highest 48-hours TWA concentrations are presented in Table 57 (Section 5.5.3). An AF of 1-2 may be used to derive a MAC-QSfw, eco (see Section 8.4.6.3 of main report) when an appropriate Effect class 1 concentration is available from a repeated application study. Since it concerns a single indoor microcosm study we decided to apply an AF of 2 to the available 48-hours TWA Effect class 1 concentration (1.8 µg/L), resulting in a MAC-QSfw, eco of 0.9 µg/L.
7.6.6 Derivation of the QSfw, secpois
The BCF of fungicide FP is higher than 100 L/kg and derivation of the QSfw, secpois is triggered. The lowest relevant endpoint is the 104-weeks NOAEC of 10 mg/kg diet for the mouse. Using an assessment factor of 30, the QSbiota, secpois, fw is 0.33 mg/kgdiet. This is the QS expressed as a concentration in fish. The equivalent concentration in water is calculated by dividing this value by the BCF of 1023, leading to a QSfw, secpois of 0.32 µg/L.
7.6.7 Derivation of the QSwater, hh food
Derivation of the QSwater, hh food is triggered. The ADI is 0.01 mg/kgbw.d. Assuming a body weight of 70 kg, a daily food intake of 115 g fish, and a contribution to the ADI of 10%, the QSbiota, hh food is 0.01 x 0.1 x 70 / 0.115 = 0.61 mg/kgdiet. This is the QS expressed as a concentration in fish. The equivalent concentration in water is calculated by dividing this value by the BCF of 1023 L/kg, leading to a QSwater, hh food of 0.60 µg/L.
7.6.8 Selection of the overall MAC-EQS and EQS
The following MAC-QSfw, eco values are derived: 0.16 µg/L (assessment factor approach), and 0.9 µg/L (mesocosm approach). According to the WFD-guidance, preference is given to the values derived by SSD and/or mesocosm studies, since these represent a more robust approach towards assessing ecosystem effects. It is proposed set the MAC-EQS to 0.9 µg/L. The QSfw, eco could only be derived using using the assessment factor approach and is 0.016 µg/L. The QSfw, secpois is 0.32 µg/L, QSwater, hh food is 0.60 µg/L. The lowest is selected, resulting in an EQS of 0.016 µg/L
7.7 Risk assessment for WFD waterbodies
In view of the available monitoring data, with highest measured concentrations of 220 ng/L (0.22 µg/L), it is not expected that the MAC-EQS is exceeded on WFD-monitoring locations. There are not enough datapoints to calculate an annual average concentration. On some locations, however, measured concentrations are higher than the EQS of 0.016 µg/L (16 ng/L) on consecutive sampling dates. This indicates that the EQS may be exceeded for longer periods of time.

Alterra-report 2463 | 97
8 Example fungicide FC
8.1 Relevant properties and exposure profile of fungicide Fc
8.1.1 Information on use and characteristics
Fungicide FC is a contact protective (cyano-acetamide) fungicide for the control of Phytophtora infestans in potatoes and Bremia lactucae in lettuce. It acts by prevention of spore germination, haustorial formation and mycelial growth of the target pathogens. Relevant physico-chemical and environmental properties are presented below in Table 62.
Table 62 Physico-chemical and environmental properties of fungicide FC.
Substance type Fungicide Substance group Cyano-acetamide Molar mass 198.2 g/mol Solubility in water 780 mg/L (20 °C) log Kow 0.64 (20 °C) DegT50 in soil 1.2 d (20 °C) DegT50 in water (lower tier value) 2.1 d (20 °C) (maximum of 2.1 d at pH 7 and 0.04 d at pH 9) DegT50 in water (higher tier value) - DegT50 in sediment 1000 d (20 °C) Kom soil, sediment, suspended solids 25.9 L kg-1 1/n 0.86 - Saturated vapour pressure 1.5E-4 Pa (20 °C)
Fungicide FC is classified as H302, H317, H400 and H410 (harmonised classification according to CLP). According to the triggers as given in the WFD-guidance, the QSwater, hh food should be derived. The ADI is 0.03 mg/kg bw/d, based on a one-year dog study applying a safety factor of 100.
8.1.2 Exposure profiles
The exposure profile is calculated for application of FC in potatoes on basis of four applications of 0.12 kg/ha at 7 day intervals starting on May 17. Figure 28 presents the Tier-1 exposure profiles for FC in the Dutch ditch scenario based on a DegT50 of 2.1 days in water and 50% drift reduction. The calculated peak concentration of FC is 1.058 µg a.s./L (June 7) and the highest 7-days TWA and 21-days TWA concentration are 0.671 µg/L and 0.578 µg/L, respectively.

98 | Alterra report 2463
Figure 28 Tier-1 exposure profile for fungicide FC based on the new Dutch ditch scenario and 50% drift reduction.
8.2 Laboratory toxicity data
The full laboratory dataset for fungicide FC is presented in Appendix 5. The dataset consists of the dossier data submitted for the European and national authorisation under Directive 91/414/EC, no data from the open literature could be retrieved.
8.3 First tier risk assessment for drainage ditches
8.3.1 Regulatory Acceptable Concentrations for aquatic organisms based on core dataset
In order to verify the assumption that a first tier assessment with the core data alone is protective, a first tier assessment is performed using only the endpoints from the core dataset required according to Annex II (see Table 5-1 and 5-2 of the main report). These data are presented in Table 63 (acute) and Table 57 (chronic). The 50% WP formulation is subject of authorisation. All values are expressed on the basis of the active substance. Algae For algae, the dossier contains three tests with Pseudokirchneriella subcapitata. In the tests with the active, the EC50 for growth rate was determined as 2390 and 630 µg/L (geometric mean 1227 μg/L). In a test with the50% WP product, the EC50 for growth rate was determined as 410 µg/L (expressed as active). The lowest endpoint of 410 μg/L is used here. Daphnia For Daphnia magna, acute endpoints are available from two tests. The test with the product resulted in a >-value (>101000 μg/L) and is not used, the EC50 obtained with the active is 27000 μg/L. The NOEC for D. magna is 67 μg/L, determined in a test with the active. Fish For Oncorhynchus mykiss, 96-hours LC50-values of 61000 and 60600 µg/L (expressed as active) are obtained with the active and the 50% WP product, respectively. The lowest of these values (60600

Alterra-report 2463 | 99
µg/L) is used for derivation of the RAC. With respect to the chronic data for fish, a 21-days NOEC for O. mykiss is available, but this test is no longer part of the data requirements. Instead, an ELS- or FLC-test is required, depending on the characteristics of the compound. The endpoint of 120 µg/L from the ELS-test with O. mykiss is used for the first tier assessment. Macrophytes According to Annex II, macrophytes have to be tested in case the fungicide has a herbicidal action. The available indicate that macrophytes are not senstive: no effects were observed at the highest concentration tested (700 μg/L).
Table 63 Acute toxicity of fungicide FC to aquatic organisms, core data according to Annex II. All values are expressed on the basis of the active substance.
Taxon/species Test Criterion Value compound [μg a.s/L] Algae Pseudokirchneriella subcapitata product EC50 410 Macrophyta Lemna gibba active EC50 > 700 Crustaceans Daphnia magna active EC50 27000 Fish Oncorhynchus mykiss active LC50 60600
Table 64 Chronic toxicity of fungicide FP to aquatic organisms, core data according to Annex II. All values are expressed on the basis of the active substance.
Taxon/species Test Criterion Value compound [μg/L] Crustaceans Daphnia magna active NOEC 67 Fish Oncorhynchus mykiss active NOEC 120
For each taxon, the Regulatory Acceptable Concentration (RAC) is determined using the appropriate assessment factor. The lowest RACs are indicated in bold. Greater-than values are presented for indicative purposes, but are not used in the risk assessment.
Table 65 Acute and chronic RAC for fungicide FC based on core data according to Annex II. All values are expressed on the basis of the active substance.
Time scale Taxon Critical endpoint [µg/L]
AF RAC [µg/L]
Acute Algae 410 10 41 Macrophytes > 700 10 > 70 Crustaceans 27000 100 270 Fish 60600 100 606 Chronic Crustaceans 67 10 6.7 Fish 120 10 12
8.3.2 Bioconcentration and secondary poisoning
The log KOW of fungicide FC is 0.64, there is no need to derive the RAC for risks due to bioconcentration and/or secondary poisoning.

100 | Alterra report 2463
8.4 Higher tier risk assessment
8.4.1 Derivation of the RAC using (a limited number of) additional data
For fish toxicity data are available for more than one species for acute as well as for chronic toxicity (see Appendix 6). RAC-values for fish based on the geomean method (see Table 66) are lower than the corresponding Tier-1 RACs based on the standard dossier, but not lower than the lowest RACs in Table 64 for algae (acute) and for crustaceans (chronic).
Table 66 Acute and chronic RAC for fungicide Fc based on additional data (see Appendix 6). All values are expressed on the basis of the active substance.
Time scale Taxon Geometric mean [µg/L]
Number of data AF RAC [µg/L]
Acute fish 43572 4 100 435.7
Chronic fish 97.2 3 10 9.72
8.4.2 Derivation of the RAC using SSDs
There are not enough data to derive RAC using SSDs.
8.4.3 Derivation of the RAC using micro-/mesocosm studies
No data available.
8.5 Risk assessment for drainage ditches (PPP regulation)
Below, the derived RACs for fungicide Fc (rounded values) are summarised in Table 67. In case of Fc, valid RACs are available for Tier 1 only. The log KOW of fungicide FC (0.64) does not trigger risks due to bioconcentration and secondary poisoning, so corresponding RACs need not to be assessed.
Table 67 Summary of first and higher tier critical RACs for Fungicide FC. All values are in µg/L, expressed on the basis of the active substance.
Time scale first tier higher tier geomean SSD mesocosm (ETO) mesocosm (ERO) Acute 41 n.d. $ n.d. n.d. n.d. Chronic 6.7 n.d. $ n.d. n.d. n.d.
n.d. = not derived; $ Not derived for the taxonomic group triggered in Tier 1
Table 68 summarises the PECs for fungicide FC for 50% drift reduction based on 1st tier calculations (see Section 8.1.2).
Table 68 Summary of PECs for fungicide FC. All values are in µg/L, expressed on the basis of the active substance.
Exposure profile 50% drift reduction PECmax 7-d TWA PEC 21-d TWA PEC 1st tier 1.058 0.671 0.578

Alterra-report 2463 | 101
The acute RACs should always be compared with the estimated peak concentration (PECmax). In this evaluation the chronic RACs based on laboratory toxicity data (tier 1) is compared with with the PECmax and the 7-days TWA PEC since the criteria for using the TWA-approach are not violated (see Alterra Report 2235). From Table 69 it follows that no unacceptable risk are identified (PEC/RAC < 1).
Table 69 Ratios of PEC and RAC for fungicide FC. Values greater than 1 indicate a risk, empty cells indicate that the combination of PEC and RAC is not applicable.
Time scale RAC [µg/L]
PEC/RAC based on 2nd tier PEC PECmax 50% DR [1.058 µg/L]
7-d TWA PEC 50% DR [0.671 µg/L]
acute 1st tier 41 0.026 chronic 1st tier 6.7 0.158 0.100
8.6 Effect and risk assessment procedure underlying the Water Framework Directive
8.6.1 Monitoring data
In 2010 and 2011, 90th percentile concentrations of FC were lower than 1.5 µg/L, about one-third of the locations had 90th percentile concentrations below 0.15 µg/L (data from Bestrijdingsmiddelenatlas).
8.6.2 Aquatic toxicity data
The aggregated ecotoxicity data for fungicide FC are presented in the tables below for freshwater and saltwater species. The table contains the lowest value per species, derived according to the procedures described in Section 2.3.4. Note that according to this procedure, the values per species differ from those presented for the drainage ditch. Results from tests in which no effect was found (>-values) are not used for standard derivation, but are presented to show that a particular species has been tested. All values are expressed on the basis of the active substance.
Table 70 Aggregated toxicity data of fungicide FC for freshwater species. All values are expressed on the basis of the active substance.
ACUTE CHRONIC Taxon/species L/EC50
[µg/L] Taxon/species NOEC/EC10
[µg/L] cyanobacteria cyanobacteria Anabaena flos-aquae 254 Anabaena flos-aquae 65.2 algae algae Pseudokirchneriella subcapitata 709a Pseudokirchneriella subcapitata 156b macrophytes macrophytes Lemna gibba > 700 Lemna gibba ≥ 700 crustaceans crustaceans Daphnia magna 27000 Daphnia magna 67 fish fish Oncorhyncus mykiss 61000 Oncorhyncus mykiss 120b
a: geometric mean of 1227 and 410 μg a.s./L, (geometric mean) EC50-values per compound; difference between active and formulation is small
enough to allow for pooling.
b: geometric mean of 220 and 110 μg a.s./L, 72-hours EC50 for active and formulation; difference between active and formulation is small
enough to allow for pooling.

102 | Alterra report 2463
Table 71 Aggregated toxicity data of Fungicide FC for marine species.
ACUTE CHRONIC Taxon/species L/EC50
[µg/L] Taxon/species NOEC/EC10
[µg/L] Crustacea Fish Americamysis bahia > 44400 Cyprinodon variegatus 58.1 Mollusca Crassostrea virginica > 444000 Fish Cyprinodon variegatus > 47500
8.6.3 Pooling of data for freshwater and marine species
According to the guidance, data for freshwater and marine species may be pooled since there are too few data to perform a meaningful statistical comparison and there are no further indications (spread of the data, read-across, expert judgement) of a difference in sensitivity between freshwater versus marine organisms of the relevant taxonomic groups.
8.6.4 Derivation of the QSfw, eco and MAC-QSfw, eco using the assessment factor approach
Acute toxicity data are available for eight species, representing six taxa (cyanobacteria, algae, macrophytes, crustaceans, molluscs, and fish). The acute base set (algae, Daphnia, fish) is available. Chronic data are available for six species, representing five taxa (cyanobacteria, algae, macrophytes, crustaceans, and fish). The lowest acute endpoint is the 96-hours EC50 of 254 µg/L for Anabaena flos-aquae, the lowest chronic endpoint is the 36-days NOEC of 58.2 µg a.s./L for the fish Cyprinodon variegatus. According to the guidance, the MAC-QSfw, eco, may be derived applying an assessment factor of 10 to the lowest acute endpoint in case the compound has a known mode of toxic action and a representative species for the potentially most sensitive taxonomic groups are included in data set. Fungicide FC is a biocidal fungicide, for which in principle any taxon could be the most sensitive, but in line with the recommendations for derivation of the QSfw, eco it would be most appropriate to consider whether or not fungi are potentially more sensitive than the other taxa represented in the dataset. However, for derivation of the MAC-QSfw, eco an assessment factor of either 100 or 10 is possible and increasing the factor to 100 is not considered justified. Using the EC50 of 254 µg/L for A. flos-aquae with an assessment factor of 10, the MAC-QSfw, eco is 25.4 µg/L. Based on the availability of chronic values for five taxa, an assessment factor of 10 could be considered for derivation of the QSfw, eco. As stated in the main report, for derivation of the QSfw, eco it should be considered whether or not fungi are potentially more sensitive than the other taxa represented in the dataset. There are no data to verify that this is not the case. Therefore an additional factor of 5 is applied to the lowest chronic endpoint of 58.1 μg/L, resulting in a QSfw, eco of 58.1 / 50 = 1.2 μg/L.
8.6.5 Derivation of the MAC-QSfw, eco and QSfw, eco using the SSD approach
There are not enough data to derive the MAC-QSfw, eco or QSfw, eco by means of SSDs.
8.6.6 Derivation of the MAC-QSfw, eco and QSfw, eco using micro-mesocosm studies
Field studies are not available.
8.6.7 Derivation of the QSfw, secpois
In view of the log Kow of 0.64, derivation of the QSfw, secpois is not triggered.

Alterra-report 2463 | 103
8.6.8 Derivation of the and QSwater, hh food
Fungicide FC is classified as H302, H317, H400 and H410. According to the triggers as given in the WFD-guidance, the QSwater, hh food should be derived. The ADI is 0.03 mg/kg bw/d, based on a one-year dog study applying a safety factor of 100. A BCF is not available, but can be estimated from the log Kow using the following relationship: log BCFfish = 0.85 x logKow - 0.70 With a log Kow of 0.64, this results in a BCF of 0.70 L/kg. According to the formulas given in the main report, the QSbiota, hh food = 0.03 x 0.1 x 70 / 0.115 = 1.8 mg/kgfish. The QSwater, hh food is 1.8 / 0.7 = 2.6 mg/L = 2600 μg/L.
8.6.9 Selection of the overall MAC-EQS and EQS
The MAC-EQS is 25.4 μg/L. The QSfw, eco is 1.2 μg/L, the QSwater, hh food is 2600 μg/L. The lowest of these is selected as overall EQS, which is set to 1.2 μg/L.
8.7 Risk assessment for WFD waterbodies
Since the 90th percentile concentrations of FC are lower than 1.5 µg/L, it can be assumed that the annual average is lower than the EQS of 1.2 µg/L. It is thus not expected that the MAC-EQS and EQS will be exceeded.

104 | Alterra report 2463
9 Evaluation of the effect assessment procedure
9.1 Introduction
In this Chapter, we summarize and evaluate the effect assessments for the selected compounds. For the drainage ditch assessment, the major point of evaluation is whether or not the assumption of the tiered approach are met, i.e. it is checked whether lower tiers are indeed protective considering the outcome of the higher tier assessments. Secondly, the differences between the outcomes of the drainage ditch effects assessment and WFD-standard derivation are explored. Finally, some discussions points will be raised regarding the procedures used in both frameworks.
9.2 Comparison of 1st tier and higher tier RACs
In this section, the tiered approach is evaluated. Below a summary is presented per compound of the available first and higher tier critical RACs for the four compounds for which a higher tier assessment could be performed. For herbicide HM and fungicide FC, only first tier RACs were derived and these compounds are not included. For the mesocosm RAC, only the ecological threshold option is included because the applicability of the RACERO depends on the drift reduction measures.
9.2.1 Insecticide IN
Table 72 and Figure 29 show the critical acute and chronic RACs for insecticide IN as derived in the first and higher tiers.
Table 72 Summary of available first and higher tier critical RACs for insecticide IN.
Time scale RAC [µg/L] first tier geomean SSD mesocosm
Acute 0.36 - 0.22 0.28 Chronic 0.26 0.12 - 0.14

Alterra-report 2463 | 105
Figure 29 Comparison of critical acute and chronic RACs for insecticide IN as derived in the firstt and higher tiers.
As already indicated in Section 3.5, it is obvious that the first tier RACs for insecticide IN are higher than those obtained in the higher tiers (up to a factor of 1.6 and 2.2 in the acute and chronic assessments, respectively). For this type of compound, the recommended standard test species are less sensitive than other related species within the same taxonomic group of the Arthropoda. It is concluded that the assumption that the first tier is protective for higher tiers is not valid for this insecticide. The first tier is stringent enough to trigger a higher tier assessment. The mesocosm RAC is higher than the RACs derived by means of SSD or geomean method, indicating that the Tier-2 RAC based on a SSD or geomean approach is protective for the following tier(s). With the inclusion of open literature in the dataset under the new PPP regulation, a more accurate first tier will be possible. However, even within the potentially most sensitive group of insects, the variation in sensitivity is large and it cannot be stated beforehand which species should be included. Moreover, due to the lack of chronic toxicity for insects from water-only studies, it is not possible to derive a chronic SSD. The development of suitable test protocols to fill this data-gap is identified as an important research need.
9.2.2 Insecticide IP
In case of insecticide IP, the RACs increase with the higher tiers, indicating that for this compound the first tier is indeed protective (see Table 73 and Figure 30). Based on the mode of action of this compound this was expected, because the standard test organisms are proven to be sensitive towards pyrethroid insecticides. In this case, the additional data from the open literature did not include species that are much more sensitive with toxicity values lower than those included in the first Tier RAC. The observation that the mesocosm RAC is substantially higher than the RACs based on laboratory toxicity data might be explained by the fact that under semi-field conditions the dissipation of insecticide IP from water in the presence of sediment is much faster than in water-only laboratory tests.

106 | Alterra report 2463
Table 73 Summary of available first and higher tier critical RACs for insecticide IP.
Time scale RAC [ng/L] 1st tier SSD mesocosm
acute 0.16 0.71 5.0 chronic 0.20 - 3.3
Figure 30 Comparison of critical acute and chronic RACs for insecticide IP as derived in the first and higher tiers.
9.2.3 Herbicide HT
Table 74 and Figure 31 show the critical acute and chronic RACs for herbicide HT as derived in the firstt and higher tiers. The first tier EC50-based RAC of 0.79 µg/L as derived according to the current draft guidance, is protective for the SSD-based RAC where the SSD is constructed with EC50-values. However, it is not protective where the SSD is constructed with NOEC/EC10-values for plants (Figure 30). When the first tier RAC is derived according to the recommendations in Brock et al. (2011), i.e. using the NOEC/EC10 values with a trigger value of 10, it is protective for the SSD-based RAC constructed with NOEC values. The SSD-based RAC constructed with EC50-values for plants is higher than the mesocosm based RACs. When using this SSD, it cannot be excluded that a long-term chronic exposure will lead to effects on macrophytes in particular, since the diversity of macrophyte species in the mesocosm study was low (see 5.4.2 and 5.4.3). If NOEC/EC10-values are used to construct an SSD-based RAC, the resulting value is protective for the long-term effects seen in the mesocosm. Following a protective approach, the chronic risk assessment for herbicides might be better based on NOEC/EC10-values for primary producers.
Table 74 Summary of available first and higher tier critical RACs for herbicide HT.
Time scale RAC [µg/L] first tier SSD mesocosm
Acute 0.79# 2.6# 2.5 Chronic 0.058& 0.24& 1.2$
# based on EC50-values according to current guidance
& based on NOEC/EC10-values as proposed in Alterra report 2235
$ according to Alterra report 2235

Alterra-report 2463 | 107
Figure 31 Comparison of critical acute and chronic RACs for herbicide HT as derived in the first and higher tiers.
9.2.4 Fungicide Fp
For fungicide Fp, the first tier acute RAC is protective for the higher tiers, but the SSD-based acute RAC is slightly higher than the value based on the mesocosm (see Table 75 and Figure 32). At the chronic time scale, both the first tier and geomean RAC are lower than the mesocosm-based value, indicating that the assumption of lower tiers being protective for higher tiers is met for the chronic risk assessment, but not for the acute risk assessment.
Table 75 Summary of available first and higher tier critical RACs for fungicide Fp.
Time scale RAC [µg/L] 1st tier geomean SSD mesocosm
acute 0.63 - 1.3 0.95 chronic 0.29 0.59 - 0.95
Figure 32 Comparison of critical acute and chronic RACs for Fungicide FP as derived in the firstt and higher tiers.

108 | Alterra report 2463
9.2.5 Conclusion and implications for compounds without higher tier data
The assumption that the lower-tier RAC is protective for higher tiers is not met for two out of four compounds. For IN the first tier is not protective for higher tiers. However, the first tier was stringent enough to trigger a higher tier assessment. For herbicide HT the the SSD RAC based on EC50-values might not be protective for long-term exposure. This conclusion raises the question whether or not additional data for the two other compounds, herbicide HM and fungicide FP would lead to different conclusions. For herbicide HM, the data used in the WFD-assessment may shed some light on this, because for this additional information from other formulations and from the open literature was taken into account. For herbicide HM, the lowest acute EC50 for algae from the WFD-dataset is 0.43 mg/L. For the drainage ditch, an AF of 10 would be applied, and the additional data would lead to a first tier acute RAC of 43 µg/L. This is very similar to the first tier RAC of 38 µg/L, but this may be purely coincidental because the latter is based on an EC50 for Daphnia magna. However, since the PECmax is 29.2 µg/L, it is concluded that the additional data would also not point at a potential acute risk. The lowest chronic NOEC for algae is 40 µg/L. Under the PPP-regulation, this NOEC would not be used to derive a first tier RAC, but it can be concluded that a chronic assessment according to the recommendations of the main report would lead to a chronic first tier RAC of 4 µg/L. This is a factor of 4.9 lower than the first tier acute RAC and eight times lower than the chronic first tier RAC of 19.7 µg/L. Given the exposure profile, this would lead to PEC/RAC values above 1, and a potential risk would be identified. Similar to herbicide HT it may be possible that the chronic effect assessment for herbicides under the PPP-regulation (based on EC50-values for primary producers and an AF of 10) is not protective for long-term exposure to this herbicide. Note, however, that we do not have a mesocosm study for this compound to verify this. For fungicide FC, the lowest EC50 used for the WFD-assessment was 254 µg/L for cyanobacteria. With an assessment factor of 10, the 1st tier acute RAC would be 25.4 µg/L. This is about 1.6 times lower than the current first tier acute RAC, but a risk would still not be identified. The lowest chronic NOEC is 58.1 μg/L which would lead to a chronic first tier RAC of 5.8 µg/L. That is only slightly lower than the current value of 6.7 µg/L based on D. magna and a potential risk would not be identified. It is concluded that for the compounds evaluated here, additional data would not change the conclusions of the drainage ditch assessment. However, the conclusion that the chronic risk assessment of herbicides should take into account NOEC/EC10-values for primary producers, is confirmed.
9.3 Comparison of different methods to derive EQSs (WFD)
9.3.1 Introduction
Depending on the type and number of data, three approaches are possible to derive quality standards for direct ecotoxicity under the WFD: applying an assessment factor to the lowest credible datum (AF-approach), using statistical extrapolation (SSD approach), or using mesocosm data (model ecosystem approach). These three methods are basically similar to the different methods used under the PPP-regulation, but differ with respect to data requirement and assessment factors used. With respect to the assessment factors, it is noted that the WFD does not have a fixed value, but offers defaults which can be adapted when needed. Another important difference with the drainage ditch assessment is that under the WFD the results of the different methods are used in parallel rather than in a tiered approach. The three approaches each yield a quality standard (denoted as MAC-QSfw, eco and QSfw, eco) and the final value (denoted as MAC-EQS and EQS) is selected afterwards. The QS that is derived on the basis of a mesocosm experiment not necessarily overrules the SSD- or AF-based QS. However, where available, preference is given to SSD- or mesocosm-based values, since these include a more scientific approach towards ecosystem effects as compared to the AF-method. The different methods

Alterra-report 2463 | 109
are not only applied in parallel, but information from one approach can also be taken into account when the other methods are used. If a mesocosm is not considered adequate for derivation of an QS, it can still give valuable information to adapt the default assessment factor for the AF- or SSD-method. The methods are thus interconnected and should be seen as different approaches rather than refinements. However, comparing the different methods can still give valuable information on consistency between methods with respect to e.g. default assessment factors. Below, the QS-values for direct ecotoxicity are compared for those compounds for which the SSD- and/or mesocosm approach could be applied. It should be noted that in some cases the WFD also required derivation of QS for secondary poisoning and/or human exposure via fish consumption. However, these routes were never critical, which confirms previous observations for PPP.
9.3.2 Insecticide IN
Table 75 shows the MAC-QSfw, eco and QSfw, eco that were derived for Insecticide IN using different methods. In the AF-approach, the default assessment factor of 10 is used. The resulting value is a factor of 2.5 lower than the MAC-QSfw, eco based on the SSD- and mesocosm-approach. The SSD was constructed with L/EC50-values for insects and the MAC-QSfw, eco was derived using an AF of 6. For the mesocosm, an AF of 3 was used. For the QSfw, eco the lowest possible AF of 10 was used on the NOEC. On the basis of the laboratory data alone probably a higher AF would have been used, since the acutely most sensitive species was not present in the chronic dataset. However, information from the mesocosm was taken into account and the factor of 10 was maintained. The resulting QSfw, eco is a factor of 1.5 lower than the mesocosm-based value.
Table 76 Summary of available QS-values for insecticide IN.
Type of QS QS [µg/L] AF method SSD mesocosm
MAC-QSfw, eco 0.065 0.16 0.18 QSfw, eco 0.042 0.07
9.3.3 Insecticide IP
Table 77 shows the MAC-QSfw, eco and QSfw, eco that were derived for insecticide IP using different methods. For the MAC-QSfw, eco, the AF- and SSD-method yielded similar results. A specific SSD was constructed using acute L(E)C10-values for arthropods, and the MAC-QSfw, eco was derived with an AF of 3. Using acute L(E)C50-values for all taxa with the default AF of 10 resulted in a similar value. The mesocosm-based MAC-QSfw, eco is a factor of about 4 higher than the other two values. Very few chronic data were available and because the lowest NOEC was only marginally lower than the lowest LC50, an AF of 50 was applied to derive the QSfw, eco. The data did not allow for derivation of the QSfw, eco by other methods.
Table 77 Summary of available QS-values for insecticide IP.
Type of QS QS [ng/L] AF method SSD mesocosm
MAC-QSfw, eco 0.23 0.21 0.87 QSfw, eco 0.04
9.3.4 Herbicide HT
Table 78 shows the MAC-QSfw, eco and QSfw, eco that were derived for herbicide HT using different methods. For the MAC-QSfw, eco, the SSD- and mesocosm method yielded similar results. A specific SSD was constructed using EC50-values for primary producers, and the MAC-QSfw, eco was derived with an AF of 6. Results of the mesocosm experiment were used to underpin this factor. The AF-based MAC-QSfw, eco was less than a factor of 2 lower.

110 | Alterra report 2463
For the QSfw, eco, there was a factor of 10 difference between the results of the mesocosm and AF-method. The SSD-based QSfw, eco was in between those two, the difference was a factor of 3 in both cases. As already mentioned for the drainage ditch assessment, the distinction between acute and chronic is complicated for primary producers. This is also the case for the MAC-QSfw, eco and EQS. Because for algae and macrophytes the EC50-and NOEC/EC10-values originate from the same studies and mostly refer to the same endpoint, the MAC-QSfw, eco should be set at a level that is protective for chronic effects too. The MAC-QSfw, eco should therefore not be higher than the NOECs and/or the NOEC-based chronic HC5. It is noted, however, that the test duration of most macrophyte studies probably exceeds the duration of short-term concentration peaks for which the MAC-QSfw, eco was introduced. If effects appear to be reversible, as is the case for Herbicide HT, this can be considered a reason to accept a higher MAC-QSfw, eco. However, due to the type of data, the MAC-concept is probably less appropriate for primary producers unless the time-window associated with short-term concentration peaks is more explicitly defined.
Table 78 Summary of available QS-values for herbicide HT.
Type of QS QS [µg/L] AF method SSD mesocosm
MAC-QSfw, eco 0.79 1.4 1.6 QSfw, eco 0.058 0.18 0.6
9.3.5 Fungicide FP
Table 79 shows the MAC-QSfw, eco and QSfw, eco that were derived for fungicide FP using different methods. For the MAC-QSfw, eco, only the AF-approach and mesocosm method could be used. The difference was less than a factor of 6. The chronic dataset would in principle allow for an assessment factor of 10. However, the lowest acute endpoint was lower than the lowest chronic endpoint and therefore the former was used for derivation of the QSfw, eco. The data did not allow for derivation of the QSfw, eco by other methods.
Table 79 Summary of available QS-values for fungicide FP.
Type of QS QS [µg/L] AF method SSD mesocosm
MAC-QSfw, eco 0.16 0.9 QSfw, eco 0.016
9.3.6 Conclusion
In all cases, the SSD and mesocosm approach lead to similar or higher QS-values than the AF-approach. In general the difference between the approaches are small. This may partly be due to the fact that we used refined assessment factors for specific SSDs. The WFD-guidance gives a default AF of 5 for the SSD-based QSfw, eco, with the option to lower this factor and a default AF of 10 for the SSD-based MAC-QSfw, eco, with an option to use a lower or higher factor when needed. The results of the verification indicate that the assessment factors as proposed in the main report are indeed useful as starting point when a specific SSD can be constructed. However, for primary producers it should always be considered whether or not lowering the assessment factor for the SSD-based based MAC-QSfw, eco does lead to unacceptable long-term effects, i.e. the MAC-QSfw, eco should in principle not be higher than the NOEC-based HC5. It is also noted that for herbicide HT a 10-fold difference was found between the mesocosm-based QSfw, eco, and the value based on the AF-approach. Note that for derivation of the chronic RAC, this difference is even larger due to the fact that in that case a lower assessment factor was put on the mesocosm. More research is needed into the factors that determine the sensitivity of standard and non-standard macrophyte species under laboratory and field conditions.

Alterra-report 2463 | 111
9.4 Comparison between PPP regulation and WFD
In this section, the RACs of the drainage ditch assessment as derived according to the new regulation are compared with the WFD-quality standards in order to assess the absolute difference and to identify the factors that contribute most to these differences. Tables 80-85 summarise the RACs, MAC-EQS and EQS-values for each of the compounds as derived with different methods. The ratio of the drainage ditch RAC and corresponding MAC-EQS or EQS is presented in the last column.
9.4.1 Insecticide IN
For Insecticide IN, the largest differences are found when the 1st tier RAC is compared with the MAC-EQS or EQS. This is due to the additional data that are used for the WFD-standard derivation that were not part of the core dataset under the PPP-regulation. For the SSD and mesocosm approach, the difference can be explained by the higher assessment factors that are proposed for the WFD-standard derivation.
Table 80 Comparison of first and higher tier critical RACs for insecticide IN with MAC-EQS and EQS-values derived according to comparable methods.
Time scale Method RAC [µg/L]
MAC/EQS [µg/L]
Difference PPP/WFD
Acute first tier/AF method 0.36 0.065 5.5 SSD 0.22 0.16 1.4 mesocosm 0.28 0.18 1.6 Chronic first tier 0.26 0.042 6.2 geomean 0.12 - - mesocosm 0.14 0.07 2.0
9.4.2 Insecticide IP
For insecticide IP, the first tier acute RAC and MAC-EQS using the AF method are quite similar. The lowest acute endpoint in the WFD-dataset is about 10 times lower than that in the core dataset used for the drainage ditch assessment. Because the WFD uses an AF of 10 and the PPP-regulation an AF of 100, the net result is similar. However, if additional endpoints are also be used for the drainage ditch assessment, the first tier acute RAC would be a factor of 10 lower than the MAC-EQS. The MAC-EQS is derived with an SSD based on acute L(E)C10-values with an AF of 3, but a similar result is obtained when using the L(E)C50-values with the default AF of 10. The same L(E)50-values are also used for the ditch assessment, but with a lower AF. The difference in the acute RACs and MAC-EQS derived using SSDs can thus be attributed to the difference in assessment factors between the two frameworks. The difference between the acute mesocosm RAC and MAC-EQS can be explained by a combination of factors. First, the RAC is based on the initial concentrations, while for the MAC-EQS the 48-hours TWA is used. This leads to a factor of two difference. Secondly, the RAC is based on Effect Class 2 concentrations, while the MAC-EQS is based on the lowest Effect Class 1 concentration (= threshold). The first tier chronic RAC and the EQS are based on the same endpoint, but for the EQS an AF of 50 is applied to account for the fact that a chronic NOEC is missing for the taxon that appeared to be acutely most sensitive. Another difference is that mesocosms with multiple pulses can only be used for EQS derivation when concentrations do not decline to 0. This restriction is not applied for the drainage ditch assessment, since in that case it can be judged whether the exposure regime in the mesocosm experiment is worst case as compared to the predicted exposure. If that is the case, the results of the mesocosm study can be used for derivation of the appropriate standard.

112 | Alterra report 2463
Table 81 Comparison of first and higher tier critical RACs for insecticide IP with MAC-EQS and EQS-values derived according to comparable methods.
Time scale Method RAC [ng/L]
MAC/EQS [ng/L]
Difference PPP/WFD
Acute first tier/AF method 0.16 0.23 0.7 SSD 0.71 0.21 3.4 mesocosm 5.0 0.87 5.7 Chronic first tier/AF method 0.20 0.04 5.0 mesocosm 3.3 -
9.4.3 Herbicide HT
The first tier acute RAC and MAC-EQS are both based on the lowest endpoint for macrophytes using an AF of 10. The difference between the higher tier acute RAC and the corresponding MAC-EQS can be fully attributed to the use of different AFs, since the HC5-values and the endpoints derived from the mesocosm study are the same. The same holds for the chronic RAC and EQS.
Table 82 Comparison of first and higher tier critical RACs for herbicide HT with MAC-EQS and EQS-values derived according to comparable methods.
Time scale Method RAC [µg/L]
MAC/EQS [µg/L]
Difference PPP/WFD
Acute first tier/AF method 0.79# 0.79 1.0 SSD 2.6# 1.4 1.9 mesocosm 2.5 1.6 1.6 Chronic first tier/AF method 0.058& 0.058 1.0 SSD 0.24& 0.18 1.3 mesocosm 1.2$ 0.6 2.0
# based on EC50-values according to current guidance.
& based on NOEC/EC10-values as proposed in Alterra report 2235.
$ according to Alterra report 2235.
9.4.4 Herbicide HM
For herbicide HM, the strange situation occurs that the acute endpoints for crustaceans and fish are not so much different from the acute endpoints for primary producers, which are the presumed most sensitive taxa. Because the first tier acute RAC uses a trigger of 100 for crustaceans and fish, and a factor of ten for primary producers, the first tier acute RAC for this herbicide is based on crustaceans. For derivation of the MAC-EQS, an AF of ten is used. The chronic RAC according to the PPP regulation is based on a NOEC for fish, but the NOEC for algae in the core dataset is not much lower. For derivation of the EQS, a NOEC is used from a formulated product that was not subject of authorization and was therefore not included in the derivation of the RACs.
Table 83 Comparison of first and higher tier critical RACs for herbicide HM with MAC-EQS and EQS-values derived according to comparable methods.
Time scale Method RAC [µg/L]
MAC/EQS [µg/L]
Difference PPP/WFD
Acute first tier 38 43 0.9 Chronic first tier/AF method 19.7& 4 4.9
& based on NOEC/EC10-values as proposed in Alterra report 2235.

Alterra-report 2463 | 113
9.4.5 Fungicide FP
For fungicide FP, the difference between the 1st tier RAC and MAC-EQS is due to a combination of different endpoints and triggers/AFs, i.e. LC50 63 µg/L with trigger 100 for the RAC and EC50 1.6 µg/L with AF 10 for the MAC-EQS. It should be noted, however, that if the EC50 of 1.6 µg/L would have been available for RAC-derivation, and a trigger value of 100 would be used, the RAC would have been a factor of 10 lower than the MAC-EQS. For the drainage ditch, an acute SSD without fish could be constructed, but this is not an option under the WFD. The mesocosm RAC and MAC-EQS are based on the same Effect Class and the same assessment factor is used, but the RAC is based on the initial concentration while the MAC-EQS is based on the 48-hours TWA. This causes the slight difference between RAC and MAC-EQS. The first tier chronic RAC and the EQS differ because for the latter it is taken into account that a chronic NOEC is missing for the taxon that appeared to be acutely most sensitive. Because the lowest acute endpoint is lower than the lowest NOEC, the acute endpoint is used. As for insecticide IP, the decline in concentrations in the mesocosm is such that it cannot be used for EQS-derivation. Note that the risk assessment for the drainage ditch is in the end driven by the geomean RAC for fish beig the most critical value.
Table 84 Comparison of first and higher tier critical RACs for fungicide FP with MAC-EQS and EQS-values derived according to comparable methods.
Time scale Method RAC [µg/L]
MAC/EQS [µg/L]
Difference PPP/WFD
Acute first tier/AF method 0.63 0.16 3.9 SSD 1.3 mesocosm 0.95 0.9 1.1 Chronic first tier/AF method 0.29 0.016 18 geomean (fish) 0.59 mesocosm (no fish) 0.95
9.4.6 Fungicide FC
For fungicide FC, the first tier RAC and MAC-EQS are both based on an EC50 for algae with the same trigger/AF of 10. The difference thus reflects the difference in the lowest available endpoint. For the chronic assessment, the lowest NOEC in the WFD-assessment (58 µg/L for fish) is almost similar to that in the core dataset for the drainage ditch assessment (67 µg/L for Daphnia), but a higher AF of 50 is used for derivation of the EQS to account for the remaining uncertainty with respect to the sensitivity of fungi.
Table 85 Comparison of first and higher tier critical RACs for fungicide FC with MAC-EQS and EQS-values derived according to comparable methods.
Time scale Method RAC [µg/L]
MAC/EQS [µg/L]
Difference PPP/WFD
Acute first tier/AF method 41 25.4 1.6 Chronic first tier/AF method 6.7 1.2 5.6
9.4.7 Summary and conclusion
With respect to the first tier acute RACs and MAC-EQS derived with the AF-method, it appears that differences are mainly due to differences in the dataset and trigger values/AF. The main factor in the dataset is the presence of additional endpoints from the open literature, and differences in the way data are aggregated per species aggregation (e.g. use of toxicity values for the formulated products). It should further be noted that for PPPs with a specific mode of action, the MAC-EQS is usually derived with a default AF of 10. For insecticides and fungicides, a trigger of 100 is applied for derivation of the

114 | Alterra report 2463
acute RAC. If the same datasets were used for these compounds, the RAC would thus be lower than the MAC-EQS. In the main report it is concluded that the AF of 10 for the MAC-EQS is most likely too low. For herbicides, the acute RAC and MAC-EQS are equal when based on the same endpoints for primary producers. If differences are observed, these are due to different datasets. The SSD-approach leads to comparable or even the same results in terms of the EC50-based HC5, but the AFs differ (AF 2-3 for the PPP-assessment, AF 6-10 for the MAC-EQS). Finally, the difference between the mesocosm-based acute RAC and MAC-EQS is a combination of the Effect Class considered, the use of TWA concentrations for the MAC-EQS and the AF that is applied. However, except for insecticide IP, the differences are quite small ultimately. For the first tier chronic RAC a trigger value of 10 is used on the lowest NOEC, which is similar to the EQS-derivation in case the datasets are the same. However, higher factors are used in the WFD-method when there is uncertainty about potentially sensitive groups. This is the case for insecticides, because chronic data on the acutely most sensitive insects are often lacking, and for fungicides in case it cannot be demonstrated that fungi are not specifically sensitive. A chronic SSD was only possible for herbicide HT and led to a chronic RAC and EQS that were very similar. However, as indicated before, the use of NOECs for primary producers for derivation of the chronic RAC is not foreseen under the PPP-regulation. Derivation of an EQS on the basis of mesocosms was possible in two cases only. If mesocosms can be used, the difference between the RAC and EQS is caused by differences in Effect Classes considered and AFs, but the resulting values are quite similar. Table 86 summarises the highest tier acute and chronic RACs and selected MAC-EQS and EQS-values and the difference between those values. It is concluded that the difference between the RACs and QS generally amounts to a factor of not more than 6 if comparable methods can be used, i.e. the critical RAC is a Tier-1 value and the QS is based on the AF-method (see HM and FC), or both are based on mesocosm data (see IN). Large differences between the chronic RAC and EQS are found for IP en FP. For these compounds, concentration decline in the mesocosm studies was fast and they could not be used for EQS-derivation. In addition, the critical RAC for FP is based on the geomean value for fish, which is not an option under the WFD.
Table 86 Highest tier acute and chronic RACs and selected MAC-EQS and EQS for the six compounds.
Compound Acute effect assessment Chronic effect assessment RAC
[µg/L] MAC-EQS [µg/L]
Ratio RAC: MAC-EQS
RAC
[µg/L] EQS [µg/L]
Ratio RAC: EQS
Insecticide IN 0.275 0.183 1.5 0.140 0.070 2.0 Insecticide IP 0.005 0.00087 5.7 0.0033 0.00004 82.5 Herbicide HT 25 1.6 1.6 (1.2)& 0.6 2.0 Herbicide HM 38 43 0.9 (19.7)& 4 4.9 Fungicide FP 0.95 0.9 1.1 0.59 0.016 36.9 Fungicide FC 41 25.4 1.6 6.7 1.2 5.6
& Based on recommendations in Alterra report 2235
It is expected that with the inclusion of open literature in the dataset under the new PPP regulation, differences between RACs and EQS-values will become smaller and RAC values will become more stringent. Due to methodological differences and higher AFs, the WFD-quality standards will generally still be lower than the RACs. Major differences may remain for the chronic time scale, because of the different treatment of NOECs for primary producers, the lack of chronic data for insects and the absence of true chronic mesocosm studies.

Alterra-report 2463 | 115
9.5 Discussion on methodology
9.5.1 Data treatment
With the inclusion of additional data, it is likely that multiple endpoints for one species become available. Taking the lowest value per species for derivation of the RAC would mean that any additional data would be useless. Therefore, we adopted the principle of the WFD-methodology to derive a single endpoint per species by taking the geometric mean of comparable endpoints. Still some issues had to be addressed, e.g. how to deal with different endpoints and test durations. In this report, we give further guidance for this (see Chapter 2). The use of data for formulated products needs further attention. For derivation of the RAC, we now used the principle of the current PPP-procedure and only included data for the product that is subject of authorisation. It is recognised, however, that relevant data from the open literature may be excluded in this way. For the WFD-assessment, we propose a pragmatic rule to decide whether or not data for the active substance and formulated products may be pooled. Such a procedure might be discussed for the drainage ditch assessment as well.
9.5.2 Choice of relevant parameters
With the inclusion of open literature, studies become available that do not necessarily follow the official guidelines. Non-standard species are tested and non-standard effect parameters are included. In this report, we developed some additional guidance on this point (see Chapter 2). It is recognised, however, that more guidance is needed on this aspect, especially when consistent effects are noted on sub-lethal parameters for which the biological significance is not (yet) clear (e.g. effects of Insecticide IN on thorax/head length). We propose that in this case the RAC or quality standard is not based on this particular endpoint, but to take the uncertainty into account in the choice of the assessment factor. For macrophytes, the official (draft) guidelines include multiple parameters and the sensitivity appears to differ between species and test methods. Guidance is needed which parameter should be selected and used in the assessment.
9.5.3 First tier / Assessment factor approach
The first tier assessment under the PPP-regulation and the assessment factor approach under the WFD are basically the same: the lowest available endpoint is used with a safety factor to derive the RAC or quality standard. The trigger value for the acute RAC for invertebrates and fish is a factor of 10 higher than the corresponding AF used for derivation of the MAC-EQS. For primary producers, the same factor is used. As stated before and already indicated in the main report, the minimum AF of 10 for the MAC-EQS is most likely too low, also in view of the default AF of 10 that is applied for MAC-derivation on the basis of an acute SSD. For the EQS, the WFD-methodology offers the possibility to use a higher AF, or to rely on acute data in case there is uncertainty if the dataset adequately covers the potentially sensitive species groups. This specifically applies when chronic data on the acutely most sensitive taxon are missing, or when the endpoint for a particular species that is only present in the acute dataset is close to or lower than the lowest chronic endpoint for another species. For fungicides, absence of information on fungi may also be a reason to raise the AF. The options for derivation of the MAC-EQS are limited to AFs of 10 or 100, while under the PPP-regulation trigger values are fixed. It remains to be seen how the first tier assessment for PPPs will change as a result of the new data requirements, which also involve inclusion of data from the open literature. However, we expect the first Tier to become more stringent.
9.5.4 Geomean method for derivation of the RAC
The geomean method, which is only applicable to the PPP-regulation seems to be of limited use for the aquatic effects assessment of PPPs. If additional data are generated, the aim will almost always be to construct SSDs. In the two cases where the geomean approach was applied (chronic RAC for insecticide IN and fungicide FP), the geomean RAC was higher than the first tier RAC and did not change the assessment markedly. In the draft Aquatic guidance document (EFSA, 2013), provisions

116 | Alterra report 2463
have been made with respect to the use of the geomean method for taxa with a high variation between species. In case of differences in sensitivity of 1 or 2 orders of magnitude (factor 10-100) an assessment has to be made if the dataset could be biased by introducing insensitive species. If the most sensitive species is more than a factor of 10 (for plants and chronic tests) or 100 (for acute invertebrate and fish test) below the geometric mean of all the tested species, a weight of evidence approach should be applied. According to EFSA, further guidance is needed to calibrate the geomean method.
9.5.5 Species Sensitivity Distribution
Different approaches under PPP-regulation and WFD The most important difference between the methods under the PPP-regulation and WFD is how laboratory toxicity data are used for construction of an SSD. Under the PPP-regulation, it can be decided beforehand to construct an SSD for a specific taxon based on the mode of action of a compound. For PPP, constructing a specific SSD is started with the taxa as defined in the data requirements, i.e. algae and macrophytes for photosynthesis inhibitors, algae and/or macrophytes for other herbicides, and insects and/or crustaceans for insecticides. Based on the mode of action, the dataset is then extended to the next higher taxonomic level, e.g. crustacea may be added to the insects and an SSD for arthropods is constructed in case insects and arthropods do not differ in sensitivity. Under the WFD, first an SSD should be constructed using the entire dataset which should comply with a predefined list of required taxa. If for compounds with a specific mode of action there is clear evidence of a 'break' in the SSD between the sensitive and other species, an SSD may be constructed using only 'those taxa that are expected to be particularly sensitive in view of the mode of action of the compound'. For the generation of SSDs within the context of the WFD Directive, we thus followed the procedure of generating a SSD based on all required taxonomic groups first. As expected for pesticides with a specific mode of action, curves generally have a bad fit and do not meet the criteria for the Anderson-Darling test (see the generic SSDs for IN, Ip and HT in this report) since these SSDs combine sensitive and insensitive taxonomic groups. This poor fit confirms that in view of the specific mode of action of the pesticide, a generic SSD is not appropriate. As indicated above, the WFD-guidance offers the possibility to construct a specific SSD for the sensitive taxonomic group(s), provided that the minimum requirement of at least ten values for different species of the sensitive taxonomic group are included in the SSD. Although this number is higher than required under the PPP-regulation, it was met in most cases and as a second step, specific SSDs could be constructed, focusing on the sensitive taxonomic group only. These specific SSDs are identical to the specific SSDs generated for the drainage ditch assessment. This indicates that the WFD-approach of first generating a generic SSD is probably superfluous and leads to unnecessary testing. On the other hand, the example of herbicide HM shows that assuming beforehand that a particular taxon is most sensitive does not hold true, even for PPPs with a specific mode of action. Also under the PPP-regulation, careful examination of the whole dataset is needed before an SSD for a particular taxon is constructed. As shown above in Section 9.3, while specific SSDs generated for the drainage ditch assessment and the WFD result in similar HC5-values, the final outcome in terms of RACs and EQS-values differs because of the different AFs that are applied. Selection of data for SSDs It should be noted that the species groups used in a single SSD differs with respect to their taxonomic level. Crustaceans represent a sub-phylum and insects a class, green algae (chlorophyta) are a phylum, 'macrophytes', which refer to all primary producers which can be observed with the naked eye, is not even an official taxonomic level (higher plants belong to the kingdom Plantae, together with green algae). Both under the PPP-regulation and the WFD, guidance is lacking as to which taxonomic level should be used to distinct between the various species groups and which criteria can be used to select the species group that is particularly sensitive. The rather subjective designation of
Alterra-report 2463 | 117
taxonomic entity that is used now often correlates with the observed difference in sensitivity between organism groups. There are, however, cases in which the variation between species cannot be explained from their taxonomic relationship. In this respect, it should be noted that under the WFD the criteria life-form and feeding strategy are used to decide whether or not a species represents an additional typically marine taxon, next to the freshwater dataset. Following that guidance, marine macro-algae are considered to be an additional taxon since they differ from green algae and from freshwater macroalgae (Characeae). Similarly marine crabs are considered to be different from water fleas although belonging to the same taxon of Crustacea. In addition, these criteria can also be used either within the freshwater taxa or within the marine taxa to distinguish between taxonomically related species. So, next to taxonomic position, these additional criteria may be used to decide on whether or not a species should be included in the specific SSD, or may be counted as an additional taxon in a generic SSD. But still, also having this additional criterion, it will be very hard to predict always beforehand whether or not a species will display sensitivity towards a certain PPP. Variation within taxa In the case of insecticide IN, large differences in sensitivity are found between Daphnia magna and Ceriodaphnia dubia, although they belong to the same family and have similar life-forms and feeding strategies. For neonicotinoids, the presence of a specific receptor determines whether or not a species shows a response. It is not yet understood if and how this biochemical trait relates to the taxonomic position; probably also other differences in life-history traits between species play a role. For instance, D. magna and C. dubia differ in their generation time and moulting frequency, and this may interact with the toxicity of insecticide IN. Life-form and feeding strategy may indeed be important additional criteria, but are not the only ones that have to be considered. Another example comes from the primary producers and relates to the sensitivity of blue-green algae for herbicide HT. Anabaena flos-aquae belongs to the Cyanobacteria (blue-green algae) and has a sensitivity in the range of the other algae taxa, e.g. green algae. Another alga from the group of Cyanobacteria, Oscillatoria laetevirens, was not sensitive to HT at all. The explanation for this difference in sensitivity between taxonomically closely related species was not clear. Both species have an identical photosynthetic apparatus that does not differ from other algae. Probably traits related to differences in uptake, elimination and/or metabolization of the herbicide are important explanatory variables. As a consequence, we decided to exclude the toxicity values of both Cyanobacteria from the SSD for HT. Input data for herbicides For HT the highest taxonomic level was considered here for consideration in the risk assessment in the context of the drainage ditch assessment, as the HC5 ranges of macrophytes and algae overlap considerably. For primary producers the generation of SSDs not only requires the selection of species to be included, but also the selection of toxicity endpoints to be considered for inclusion in the SSD. In this report we followed the OECD guidance as closely as possible (see Section 2.3.10) and therefore preferred growth endpoints over biomass. These endpoints are also recommended by Maltby et al. (2010). However, as effects of realistic concentrations of herbicides on aquatic macrophytes are in general sublethal, a range of assessment endpoints can possibly be considered for inclusion in SSDs. For additional data from the open literature with non-standard test species or non-standard methods, the decision which assessment endpoints are appropriate has to be taken on a case-by-case basis. Taking the lowest endpoints as performed by Giddings et al. (2013, in press), might be a worst-case approach. Conclusion on data selection The conclusion is that the selection based on taxonomy in combination with mode of action as is done now may have drawbacks, but is not easily replaced by other criteria that can easily applied beforehand. The alternative is that the SSD is thoroughly examined for possible outliers. If a particular species shows extremely low sensitivity as compared to closely related species, it may be excluded from the SSD if taxonomic level, life form or feeding strategy give reason to consider that species being different from its taxonomic relatives. Also for this, criteria have to be developed, for instance whether or not different insect orders may be considered as different taxonomic groups.

118 | Alterra report 2463
The pitfall is that considering a species as an outlier is always depending on the amount of toxicity data present. For example, C. dubia is almost 23000 times more sensitive towards insecticide IN than D. magna. The question is whether we would have excluded Chydorus sphaericus, which is a factor of over 400 less sensitive than C. dubia, if the even higher EC50 value for D. magna had not been present in the dataset. We now excluded D. magna from the SSD, and left C. sphaericus in. We realize, however, that we do not have a criterion other than that D. magna is extremely insensitive. We discussed the option of setting a factor, e.g. to exclude a species from the dataset if the endpoint is a factor of 1.000 higher than that of the most sensitive related species. However, at this stage, we are not able to set such a general factor and any choice would be arbitrary. The geomean method faces a more or less similar problem (see discussion above). Probably, there is no other option than exploring whether or not SSDs using all data or excluding some datapoints lead to different results. Use of chronic endpoints for primary producers According to the new data requirements, the endpoints for algae and macrophytes under the new Regulation will be used in the first tier assessment in a similar way as before, i.e. the EC50 will be used with a trigger value of 10. For the higher tiers, it is not clearly defined which endpoints can be used. In the main report, we considered the option that the EC50-values for algae and macrophytes would be used with a trigger value of 100, and the NOEC-values with a trigger value of 10. Following that reasoning, it would be logical to perform a higher tier with both types of endpoints. Now that the first tier uses a trigger value of 10 for the EC50 and does not consider NOEC-values, it is the question how an SSD based on NOEC/EC10-values fits in the tiered approach. We consider the assessment of chronic endpoints for algae and macrophytes as a necessary part of the risk assessment.
9.5.6 Mesocosms
A major change in the methodology for the drainage ditch assessment is that the predicted exposure profile should be taken into account when deriving endpoints from mesocosm studies. The exposure model has changed, a.o. by the inclusion of drainage. Predicted profiles differ from the exposure in most mesocosm studies, which simulate single or multiple pulse exposure as a result from drift. As a consequence, the mesocosm studies can only be evaluated when the exposure profiles are available and this may require a different organisation of the evaluation process and requires a close cooperation between fate and effects experts. In addition, the predicted exposure profiles show that applicants should carefully consider the set-up of mesocosm studies. It will be hard to address different application patterns with a single mesocosm study and more or less chronic exposure becomes more relevant.

Alterra-report 2463 | 119
10 Comparison of current and proposed risk assessment procedure for PPP registration
10.1 Introduction
In this Chapter, a comparison is made between (1) the risk assessment that was performed for authorisation according to the current procedure used by Ctgb, and (b) the proposals from this report (new procedure) based on Brock et al. (2011) and Tiktak et al. (2012). For this the example compounds selected for this report are used (see Chapters 3 to 8). The result of the old and new proposed procedure may differ because of differences in the effects assessment (derivation of the RAC), differences in exposure assessment (derivation of the PEC), or a combination of both.
10.2 Comparison of old and new proposed exposure assessments
Table 86 summarises the PECs that are used in the most recent assessments by Ctgb and the new Tier-1 PECs. For the two insecticides (IN and IP) and the herbicide HT also Tier-2 PECs are available. In the current risk assessment procedure the default option is to calculate the PECs on the basis of 50% drift reduction. For insecticide IP and herbicide HT, however, the current PECs are based on 75% drift reduction and were recalculated to 50% drift reduction for reasons of comparison.
Table 87 Comparison of PECmax according to the current exposure assessment procedure and new Tier-1 and available Tier-2 PECmax values following the proposed new exposure assessment procedure according to Tiktak et al. (2012) and their ratios. The bold and red figures are the new PECmax values used in the final risk assessment as described in this report.
Compound PECmax current 50% DR [µg/L]
PECmax new 50% DR [µg/L])
Ratio PECmax new versus current 50% DR
PECmax new 95% DR [µg/L]
IN Tier-1 0.626 1.154 1.8 0.818 IN Tier-2 0.944 1.5 0.683 IP Tier-1 0.0106 0.0414 3.9 0.0033 IP Tier-2 0.0259 2.5 0.0021 HT Tier-1 1.3744 1.745 1.3 1.130 HT Tier-2 1.353 1.0 0.904 HM 10.09 29.90 3.0 - FP 0.9445 1.241 1.3 0.118 FC 0.572 1.058 1.8 -
The Tier-1 PECmax values on basis of the new proposed procedure and 50% drift reduction are on average a factor of 3 (range 1.3 - 3.9) higher than the PECmax values currently used by Ctgb. The Tier-2 PECmax values on basis of the new proposed procedure and 50% drift reduction are on average a factor of 2.8 (range 1.5 - 2.5) higher than the PECmax values currently used by Ctgb.

120 | Alterra report 2463
10.3 Comparison of old and new proposed effect assessments
Table 87 summarises the acute RACs obtained in the Tier-1 and highest tier for both the procedure used currently by Ctgb and the new proposed effect assessment procedure. In Table 88 the corresponding RACs for the chronic effect assessment procedures are summarised. The differences in final RACs between the current and new procedure may be caused by differences in the underlying dataset and/or methodological differences. Since for all example compounds the dataset from the EU risk assessment was used as a basis, the underlying dataset to derive the Tier-1 RAC is in many cases (e.g. IP, HT and FP in Table 88 and IN and FP in Table 89) not a major cause of variation. For some substances, however, new Tier-1 data and data requirements became available so that the current and new Tier-1 RAC are based on different test organisms (e.g. IN in Table 88 and IP and FC in Table 89) or endpoints (e.g. FC in Table 89). Also note that the current and new Tier-1 effect assessment procedure may deviate for herbicides. In the new proposal described in Alterra Report 2235 the NOEC and an AF of 10 is used for primary producers in the chronic effect assessment, whereas it currently is the EC50 and an AF of 10 (see HT and HM in Table 89).
Table 88 Comparison of current Tier-1 and highest tier acute RAC and new Tier-1 and highest tier acute RAC values according to the proposed new effect assessment procedure and their ratios. The species or taxon that determines the RAC is indicated. Higher tier RACs derived from micro-/mesocosm studies are based on the ‘Ecological Threshold Option (ETO) and the ‘Ecological Recovery Option (ERO)’.
Compound Tier-1 RAC current [µg/L]
Tier-1 RAC new [µg/L]
Ratio Tier-1 RAC current:new
Highest tier RAC current [µg/L]
Highest tier RAC new [µg/L]
Ratio Highest Tier RAC current:new
IN 0.552 (Chironomus)
0.359 (Americamysis)
1.5 0.600 (mesocosm)
0.275 (ETO)
2.2
IP 0.00016 (Gammarus)
0.00016 (Gammarus)
1.0 0.01 (mesocosm) 0.0032 (fish)
0.0050 (ETO) 0.0083 (ERO) 0.0155 (fish)
2.0 1.2
HT 0.79 (Lemna)
0.79 (Lemna)
1.0 - 2.450 (ETO) -
HM 40 (Daphnia)
38 (Daphnia)
1.1 - - -
FP 0.55 (fish)
0.63 (fish)
0.9 - 0.95 (ETO) 2.0 (ERO)
-
FC 12.2 (algae)
41 (algae)
0.3 - - -

Alterra-report 2463 | 121
Table 89 Comparison of current Tier-1 and highest tier chronic RAC and new Tier-1 and highest tier chronic RAC values according to the proposed new effect assessment procedure and their ratios. The species or taxon that determines the RAC is indicated. Higher tier RACs derived from micro-/mesocosm studies are based on the ‘Ecological Threshold Option (ETO) and the ‘Ecological Recovery Option (ERO)’.
Compound Tier-1 RAC current [µg/L]
Tier-1 RAC new [µg/L]
Ratio Tier-1 RAC current:new
Highest tier RAC current [µg/L]
Highest tier RAC new [µg/L]
Ratio Highest Tier RAC current:new
IN 0.210 (Chironomus)
0.260 (Chironomus)
0.8 0.600 (mesocosm)
0.140 (ETO)
4.3
IP 0.0006 (crustacean)
0.0002 (Daphnia)
3.0 0.01 (mesocosm)
0.0033 (ETO) 0.0063 (ERO)
3.0 1.6
HT 0.79 (Lemna; EC50)
0.79 (Lemna, EC50) 0.058 (Lemna; NOEC)
1.0 13.6
- 1.200 (ETO) -
HM 32\( fish) 32 (fish) 19.7 (algae; NOEC)
1.0 1.6
- - -
FP 0.29 (fish)
0.29 (fish)
1.0 - 0.95 (ETO)
-
FC 4.4 (fish)
6.7 (Daphnia)
0.7 - - -
The new procedure to derive the highest tier RAC is a factor of 1.2 to 4.3 more stringent than the current procedure (see Tables 88 and 89). This find its cause in different procedures to derive RACs from micro-/mesocosm studies. Particularly differences in interpretation of simulated exposure profiles in micro-/mesocosms play an important role in the RAC derivation. In the old situation only spray drift was taken into account in the exposure assessment and the micro-/mesocosm studies were designed in such a way that the number of spray applications was more or less mimicked in the cosm study (single or repeated pulse exposures). In contrast, the exposure profile in the new situation may deviate from the old scenario due to more exposure routes that are taken into account like drainage and run-off. In many cases there are more (non-similar) pulses present in the annual exposure profile predicted, while also risks due to chronic exposure are more often triggered. For this reason more often a chronic RAC has to be derived from the micro-/mesocosm studies. In particular, if the simulated exposure regime in the micro-/mesocosm test system is not realistic-worst case relative to the predicted exposure profile the chronic RAC may be considerably lower than the RACs based on cosm studies in the old procedure.
10.4 Overall summary of new proposed risk assessments
An overall summary of the new proposed risk assessment procedure applied to the data for the six example compounds is presented in Table 90. All the example compounds are characterized by a safe use when following the risk assessment procedure currently used by Ctgb on the basis of 50-75% drift reduction techniques. When applying the new proposed exposure and effect assessment procedures, one of the six example compounds (insecticide IN) has no safe use, even when adopting 95 % drift reduction and higher-tier exposure and effect assessments. Insecticide IP and fungicide FP can only be used when adopting 95% drift emission reduction techniques and higher-tier effect assessments. For fungicide FC the Tier-1 effect assessment procedure and a 50% drift reduction already allows for a safe use. This is also the case for HM if the chronic effect assessment is based on the EC50 of primary producers and the application of an AF of 10. A decision ‘safe use’ also accounts for herbicide HT when a higher-tier effect assessment and 95% drift reduction is used. When using the EC50 of primary producers and an AF factor of 10 in the chronic risk assessment this herbicide may also be safely used under 50% drift reduction conditions.

122 | Alterra report 2463
Table 90 Overall summary of the risk assessment procedure on basis of the new exposure and effect assessment.
Compound Acute risk assessment Chronic risk assesment 50% drift reduction
95% drift reduction
50% drift reduction
95% drift reduction
Insecticide IN No safe use No safe use No safe use No safe use Insecticide IP No safe use Safe use No safe use Safe use Herbicide HT Safe use when based on
EC50/10 Safe use when based on EC50/10
Safe use when based on EC50/10
Safe use
No safe use when based on NOEC/10
Herbicide HM Safe use Not evaluated Safe use when based on EC50/10
Not evaluated
No safe use when based on NOEC/10
Fungicide FP Safe use, border case Safe use No safe use Safe use Fungicide FC Safe use Not evaluated Safe use Not evaluated

Alterra-report 2463 | 123
11 Conclusions
The conclusions of this verification study are as follows: • For IN the first tier RAC is less stringent than those derived in higher tiers. However, the first tier
RAC triggered a higher tier assessment. In general, for insecticides and fungicides the final risk assessment does not seem to result into false negatives (i.e. no risks identified in the first tier, whereas higher tier assessments indicate a risk).
• For herbicides, SSDs based on EC50-values for algae and macrophytes may not be protective for long-term effects on primary producers. It is recommended to base the chronic risk assessment on NOEC/EC10-values, using a trigger value of 10 in the first tier.
• The derivation of the MAC-EQS by means of the AF-approach should be evaluated, the minimum AF of 10 is likely too low, also when considering the fact that the default AF for the SSD-method is also 10.
• The difference between acute RACs and MAC-EQS generally amounts to a factor of not more than 6. The difference is mainly due to differences in assessment factors.
• If the chronic RAC and EQS can be derived using similar methods, the difference between the two is also less than a factor of 6. If mesocosmstudies could not be used for derivation of the EQS, which was the case for IP en FP, the difference between RAC and WFD-standard is relatively.
• The inclusion of open literature in the dataset under the new PPP regulation will potentially lead to more stringent RAC values and smaller differences between acute RACs and EQS-values, especially when SSD- and mesocosm-based values are considered.
• Major differences between drainage ditch assessment and WFD-standards may remain for the chronic time scale, because of the use of EC50-values instead of NOEC/EC10-values for primary producers, the general lack of chronic toxicity data for insects and other invertebrates and the absence of chronic mesocosm studies.
• The criteria for construction of SSDs as defined in the WFD-guidance need special attention for substances with a specific mode of action. The requirement that a generic SSD should always be constructed before allowing a specific SSD should be reconsidered for PPP.
• The proposal for refined AFs when specific SSDs are used for derivation of WFD-quality standards seems to be adequate.
• Care should be taken that the pre-selection of taxa for a specific SSD under the PPP-regulation is underpinned by data. Other taxa than the presumed sensitive taxa may be equally or more sensitive.
• Taxonomic position in relation to mode of action are the main selection criteria for inclusion of species in an SSD. Life history characteristics may be useful to explain outliers. Next to statistical data (goodness of fit), further criteria should be developed to underpin data selection.
• The interpretation of mesocosm data depends on the comparison of the exposure in the mesocosm study with the predicted exposure in the field. Predicted exposure profiles should be taken into account when designing experiments and evaluating the studies. This requires a close cooperation between fate and effects experts, for the applicant at the stage of registration as well as for the evaluators at the stage of authorisation.
The following conclusions are drawn with respect to the consequences for authorisation: • The first tier-1 RAC according to the proposed methodology is comparable to the values on which
current authorisation are based. For insecticides, the proposed RAC will be lower in a number of cases, but this is due to new European data requirements rather than the methodology for RAC derivation. In addition, new data requirements have been set for some herbicides (a.o. testing Myriophyllum). For herbicides, the proposed methodology results in lower RAC-values if the advice to use NOEC/EC10-values will be followed.
• The new exposure scenarios result in long-term presence of compounds in the drainage ditch. This implies that the chronic effect assessment will become more important for authorisation.
• In case of mesocosm studies, the proposed methodology may result in more stringent RACs. The exposure in the mesocosm should be worst-case as compared to the predicted profile in the

124 | Alterra report 2463
drainage ditch. Older studies often do not comply with the new exposure profile, e.g. because of the long-term exposure (see above). In addition, a higher assessment factor has been used in some cases.
• Based on the currently available new exposure profiles, a safe use at 50% drift reduction was demonstrated for one of the six compounds (FC). A safe use was demonstrated for the herbicides when the current procedures are used, but long-term effects cannot be excluded in that case. If 95% drift reduction is applied, a safe use is demonstrated for five out of six compounds. Authorisation of the neonicotinoid insecticide would not be possible.

Alterra-report 2463 | 125
References
Brock, T.C.M., G.H.P. Arts, T.E.M. ten Hulscher, F.M.W. de Jong, R. Luttik, E.W.M. Roex, C.E. Smit and P.J.M. van Vliet, 2011. Aquatic effect assessment for plant protection products. Dutch proposal that addresses the requirements of the Plant Protection Product Regulation and Water Framework Directive. Alterra Report 2235, 140 pp
EC, 1991. Council Directive 91/414/EEC of 15 July 1991 concerning the placing of plant protection products on the market. Official Journal of the European Union L 230:1-32. http://eur-lex.europa.eu/LexUriServ/LexUriServ.do?uri=CELEX:31991L0414:EN:NOT
EC, 2000. Directive 2000/60/EC of the European parliament and of the Council of 23 October 2000 establishing a framework for Community action in the field of water policy. Official Journal of the European Union L 327:1-72. http://ec.europa.eu/environment/water/water-framework/index_en.html
EC, 2009. Regulation (EC) No 1107/2009 of the European parliament and the council of 21 October 2009 concerning the placing of plant protection products on the market and repealing Council Directives 79/117/EEC and 91/414/EEC. Official Journal of the European Union L 309:1-50.
EC, 2011. Technical Guidance Document for deriving Environmental Quality Standards. Guidance Document No. 27. Common Implementation Strategy for the Water Framework Directive (2000/60/EC). Technical Report - 2011 - 055, 203 pp
EFSA, 2008. Risk Assessment for Birds and Mammals. The EFSA Journal 734:1-181. EFSA, 2013. Draft Scientific Opinion. Draft Guidance Document on tiered risk assessment for plant
protection products for aquatic organisms in edge-of-field surface waters. EFSA Panel on Plant Protection Products and their Residues (PPR). European Food Safety Authority (EFSA), Parma, Italy.
Giddings, J., G. Arts and U. Hommen, in press. The Relative Sensitivity of Macrophyte and Algal Species to Herbicides and Fungicides: An Analysis Using Species Sensitivity Distributions". Integrated Environmental Assessment and Management.
Maltby, L., D. Arnold, G. Arts, J. Davies, F. Heimbach, C. Pickl and V. Poulsen (eds.), 2010. Aquatic Macrophyte Risk Assessment for Pesticides. SETAC Press & CRC Press, Taylor & Francis Group, Boca Raton, FL, 140 pp.
Smit, C.E., 2005. Energy and moisture content and assimilation efficiency of bird and mammal food. Chapter 4 in: Factsheets for the (eco)toxicological risk assessment strategy of the National Institute for Public Health and the Environment – Part V (JWA Scheepmaker, CE Smit and MTM Van Raaij, eds.). Bilthoven, The Netherlands: RIVM. Report 601516013.
Ter Horst, M.M.S., J.J.I.I. Boesten, C, van Griethuysen, A.M.A. van der Linden, A. Tiktak and J.C. van de Zande, 2013. Additional calculations using the scenarios for exposre of aquatic organisms to plnat protection products in the Netherlands. Alterra report (in prep)
Tiktak, A., P.I. Adriaanse, J.J.T.I. Boesten, J. Delsman, C. van Griethuysen, M.M.S. ter Horst, B.H.J. Linders, A.M.A. van der Linden and J.C. van de Zande, 2012. Scenarios for exposure of water organisms in the Nethrelands. RIVM Report 607407002/2011

126 | Alterra report 2463
Dataset of insecticide IN Annex 1
Table A1.1 Acute toxicity of insecticide IN to aquatic organisms. Core data according to the data requirements in Annex II that are included in the dossier are presented on a grey background. Additional data were included in the dossier or obtained from the open literature.
Taxon/species Test Exp. Criterion Test Value compound time endpoint [μg a.s/L] Bacteria Vibrio fischeria active 30 min EC50 bioluminescence 61900 Vibrio fischeri product 30 min EC50 bioluminescence 56000 Algae Pseudokirchneriella subcapitata active 72 h EC50 biomass > 100000 Pseudokirchneriella subcapitata active 72 h EC50 growth rate > 100000 Scenedesmus subspicatus active 72 h EC50 biomass > 10000 Scenedesmus subspicatus active 72 h EC50 growth rate > 10000 Desmodesmus subspicatus active 72 h EC50 growth rate 389000 Desmodesmus subspicatus product 72 h EC50 growth rate 116000 Crustacea Americamysis bahia active 96 h LC50 mortality 37.7 Americamysis bahia active 96 h LC50 mortality 34.1 Americamysis bahia product 96 h LC50 mortality 36 Ceriodaphnia dubia product 48 h LC50 mortality 2.07 Chydorus sphaericus active 48 h EC50 immobility 832 Cypretta seuratti active 48 h EC50 immobility 1 Cypridopsis vidua active 48 h LC50 mortality 273 Cypridopsis vidua active 48 h EC50 immobility 10 Daphnia magna active 48 h EC50 immobility 56600 Daphnia magna product 48 h EC50 immobility 30000 Daphnia magna active 48 h EC50 immobility 85000 Gammarus pulex active 48 h EC50 immobility 110 Gammarus pulex active 96 h EC50 immobility 131 Hyalella azteca active 96 h LC50 mortality 526 Hyalella azteca active 96 h EC50 immobility 55 Ilyocypris dentifera active 48 h LC50 mortality 214 Ilyocypris dentifera active 48 h EC50 immobility 3 Insecta Baetis rhodani active 96 h EC50 immobility 1.72 Centroptilum triangulifer active 72 h EC50 immobility 4.98 Chironomus riparius active 24 h LC50 mortality 55.2 Chironomus tentans active 96 h LC50 mortality 10.5 Chironomus tentans active 96 h LC50 mortality 5.75 Cloeon dipterum active 96 h EC50 immobility 43.33 Epeorus assimilis active 96 h EC50 immobility 5.06 Epeorus longimanus product 96 h LC50 mortality 0.65 Epeorus longimanus (early instar) product 24 h LC50 mortality 2.1 Epeorus longimanus (late instar) product 24 h LC50 mortality 2.1 Habrophlebia lauta active 96 h EC50 immobility 31.18 Hydropsyche sp. active 96 h EC50 immobility 23.07 Leuctra sp. active 96 h EC50 immobility 8.57 Simulium vittatum active 48 h LC50 mortality 6.75 Simulium vittatum active 48 h LC50 mortality 8.25 Simulium vittatum active 48 h LC50 mortality 9.54 Siphonoperla sp. active 96 h EC50 immobility 8.63 Mollusca Crassostrea virginica active 96 h EC50 shell growth > 23300

Alterra-report 2463 | 127
Taxon/species Test Exp. Criterion Test Value compound time endpoint [μg a.s/L] Crassostrea virginica active 96 h EC50 shell growth > 145000 Fish Leuciscus idus melanotus active 96 h LC50 mortality 237000 Lepomis macrochirus active 96 h LC50 mortality > 105000 Oncorhynchus mykiss active 96 h LC50 mortality 211000 Oncorhynchus mykiss active 96 h LC50 mortality > 83000 Cyprinodon variegatus active 96 h LC50 mortality 161000 Danio rerio active 96 h LC50 mortality 241000 Danio rerio product 96 h LC50 mortality 214000 Cyprinodon variegatus active 96 h LC50 mortality 161000 Annelida Lumbriculus variegatus product 96 h EC50 immobility 6.2
a: considered as freshwater species since tested in distilled water.
Table A1.2 Chronic toxicity of InsecticideN to aquatic organisms. The 200 g/L product is subject of authorisation. Core data according to the data requirements in Annex II for the active and this formulation are presented on a grey background. Additional data were included in the dossier or obtained from the open literature.
Taxon/species Test Exp. Criterion Test Value compound time endpoint [μg a.s/L] Algae Pseudokirchneriella subcapitata active 72 h NOEC growth rate < 100000 Pseudokirchneriella subcapitata active 72 h NOEC biomass < 100000 Scenedesmus subspicatus active 72 h NOEC growth rate 10000 Scenedesmus subspicatus active 72 h NOEC biomass 10000 Desmodesmus subspicatus active 72 h EC10 growth rate 106000 Desmodesmus subspicatus product 72 h EC10 growth rate 5600 Crustacea Daphnia magna active 21 d NOEC adult length 1800 Daphnia magna active 21 d NOEC neonates per adult 1250 Daphnia magna product 21 d NOEC neonates per adult 2500 Daphnia magna active 21 d NOEC brood size, time to 1st brood 2500 Daphnia magna product 21 d NOEC brood size, time to 1st brood 2500 Daphnia magna active 21 d NOEC broods per adult 5000 Daphnia magna product 21 d NOEC broods per adult 5000 Daphnia magna active 21 d NOEC mortality 20000 Daphnia magna product 21 d NOEC mortality 5000 Daphnia magna active 21 d NOEC reproduction 2000 Daphnia magna active 21 d NOEC growth 4000 Daphnia magna active 21 d NOEC mortality 10000 Gammarus pulex active 28 d NOEC swimming behaviour 64.0 a Gammarus pulex active 28 d NOEC mortality 128.0 a Hyalella azteca product 10 d NOEC mortality 3.53 b,c Hyalella azteca product 10 d EC10 growth 10.7 b,c Hyalella azteca product 28 d LC10 mortality 0.47 c Hyalella azteca product 28 d NOEC mortality 3.44 c Hyalella azteca product 28 d NOEC growth ≥ 11.46 c Insecta Chironomus riparius product 10 d NOEC growth 0.4 Chironomus riparius product 10 d NOEC emergence ratio 0.4 Chironomus riparius product 10 d NOEC development rate < 0.4 Chironomus riparius product 6 d NOEC burrowing activity 0.768 Chironomus riparius active 28 d EC5 emergence 1.86 a Chironomus riparius active 28 d EC10 emergence 2.09 a Chironomus riparius active 28 d EC15 emergence 2.25 a Chironomus riparius active 28 d EC50 emergence 3.11 a

128 | Alterra report 2463
Taxon/species Test Exp. Criterion Test Value compound time endpoint [μg a.s/L] Chironomus riparius 200 g/L product 28 d EC5 emergence 2.3 a Chironomus riparius 200 g/L product 28 d EC10 emergence 2.6 a Chironomus riparius 200 g/L product 28 d EC15 emergence 2.7 a Chironomus riparius 200 g/L product 28 d EC50 emergence 3.6 a Chironomus riparius 200 g/L product 28 d NOEC emergence 3.2 a Chironomus tentans active 10 d NOEC growth 0.67 Chironomus tentans product 10 d NOEC mortality ≥ 3.57 b,c Chironomus tentans product 10 d LC10 mortality 1.33 b,c Chironomus tentans product 10 d EC10 growth 1.64 b,c Chironomus tentans product 10 d NOEC growth 1.17 b,c Chironomus tentans product 28 d LC10 mortality 0.42 c Chironomus tentans product 28 d NOEC growth ≥ 1.14 c Sericostoma vittatum product 6 d NOEC mortality ≥ 5.0 Sericostoma vittatum product 6 d NOEC feeding rate 1.23 Mollusca Crassostrea virginica active 96 h NOEC shell growth ≥ 23300 Crassostrea virginica active 96 h NOEC shell growth < 145000 Fish Oncorhynchus mykiss active 91 d NOEC development 9020 Oncorhynchus mykiss active 98 d NOEC growth 1200 Danio rerio active 48 h d NOEC development ≥ 320000 Danio rerio product 48 h d LC10 mortality 300000
a: test in water/sediment system; endpoint based on initial concentration in water phase.
b: results for first 10 days of a 28-days test.
c: silica sand or cheese cloth present; endpoint based on mean measured concentrations in water phase.
d: in view of life-stage tested (fertilised eggs), test duration is considered as chronic.

Alterra-report 2463 | 129
Dataset of insecticide IP Annex 2
Table A2.1 Acute toxicity of insecticide IP to aquatic organisms. The 5% product is subject of authorisation. Core data according to the data requirements in Annex II for the active and this formulation are presented on a grey background. Additional data were included in the dossier or obtained from the open literature.
Taxon/species Test Exp. Criterion Test Value compound time endpoint [μg a.s/L] Algae Pseudokirchneriella subcapitata active 96h EC50 growth rate > 300 Pseudokirchneriella subcapitata active 96h EC50 biomass > 300 Pseudokirchneriella subcapitata 5% product 96h EC50 growth rate 1600 Pseudokirchneriella subcapitata 5% product 96h EC50 biomass 1400 Crustacea Asellus aquaticus active 48h LC50 mortality 0.026 Asellus aquaticus 5% product 48h EC50 immobilisation 0.0248 Asellus aquaticus 5% product 96h EC50 immobilisation 0.0248 Asellus aquaticus 5% product 48h LC50 mortality 0.14 Asellus aquaticus 5% product 96h LC50 mortality 0.0752 Cyclops sp. active 48h EC50 mortality 0.3 Daphnia galeata 5% product 48h EC50 immobilisation 0.117 Daphnia galeata 5% product 48h LC50 mortality 0.397 Daphnia magna active 48h EC50 immobilisation 0.36 Daphnia magna 5% product 48 h EC50 immobilisation 0.09 Daphnia magna 13% product 48 h EC50 immobilisation 0.09 Daphnia magna active 48h EC50 immobilisation 0.39 Gammarus pulex active 96h EC50 immobilisation 0.016 Gammarus pulex 5% product 48h LC50 mortality 0.0314 Gammarus pulex 5% product 96h LC50 mortality 0.0242 Gammarus pulex L. active 48h EC50 mortality 0.014 Hyalella azteca active 48h LC50 mortality 0.0023 Hyalella azteca 23% product 48h EC50 immobilisation 0.0038 Ostracoda active 48h EC50 mortality 3.3 Proasellus coxalis 5% product 48h EC50 immobilisation 0.0177 Proasellus coxalis 5% product 96h EC50 immobilisation 0.0274 Proasellus coxalis 5% product 48h LC50 mortality 0.0788 Proasellus coxalis 5% product 96h LC50 mortality 0.0446 Simocephalus vetulus 5% product 48h EC50 immobilisation 0.957 Simocephalus vetulus 5% product 48h LC50 mortality 1.34 Insecta Caenis horaria 5% product 48h EC50 immobilisation 0.0179 Caenis horaria 5% product 96h EC50 immobilisation 0.0136 Caenis horaria 5% product 48h LC50 mortality 0.257 Caenis horaria 5% product 96h LC50 mortality 0.0346 Chaoborus obscuripes 5% product 48h EC50 immobilisation 0.0028 Chaoborus obscuripes 5% product 96h EC50 immobilisation 0.0028 Chaoborus obscuripes 5% product 48h LC50 mortality > 0.0274 Chaoborus obscuripes 5% product 96h LC50 mortality 0.0757 Cloeon dipterum active 48h EC50 mortality 0.038 Cloeon dipterum 5% product 48h EC50 immobilisation 0.0248 Cloeon dipterum 5% product 96h EC50 immobilisation 0.0883 Cloeon dipterum 5% product 48h LC50 mortality 0.122 Cloeon dipterum 5% product 96h LC50 mortality 0.105 Corixa sp. active 48h EC50 mortality 0.03 Erythromma viridulum 5% product 48h EC50 immobilisation 0.689 Erythromma viridulum 5% product 96h EC50 immobilisation 0.493 Erythromma viridulum 5% product 48h LC50 mortality 1.583 Erythromma viridulum 5% product 96h LC50 mortality 0.493

130 | Alterra report 2463
Taxon/species Test Exp. Criterion Test Value compound time endpoint [μg a.s/L] Ischnura elegans active 48h EC50 mortality 0.13 Macropelopia sp. 5% product 48h EC50 immobilisation 0.244 Macropelopia sp. 5% product 96h EC50 immobilisation 0.0643 Macropelopia sp. 5% product 48h LC50 mortality 1.019 Macropelopia sp. 5% product 96h LC50 mortality 0.698 Notonecta glauca 5% product 48h EC50 immobilisation 0.0148 Notonecta glauca 5% product 96h EC50 immobilisation 0.0164 Notonecta glauca 5% product 48h LC50 mortality 0.0226 Notonecta glauca 5% product 96h LC50 mortality 0.0164 Sialis lutaria 5% product 48h EC50 immobilisation 0.0515 Sialis lutaria 5% product 96h EC50 immobilisation 0.028 Sialis lutaria 5% product 48h LC50 mortality > 2.179 Sialis lutaria 5% product 96h LC50 mortality > 2.179 Mollusca Bithynia tentaculata 5% product LOEC avoidance > 8.9 Arachnida Hydracarina active 48h EC50 mortality 0.047 Fish Cyprinus carpio 5% product 96h LC50 mortality 0.5 Danio rerio see footnote a 96h LC50 mortality 0.68 Danio rerio active 96h LC50 mortality 0.78 Gasterosteus aculeatus l see footnote a 96h LC50 mortality 0.35 Gasterosteus aculeatus L. active 96h LC50 mortality 0.49 Ictalurus punctatus Raf. see footnote a 96h LC50 mortality 0.14 Ictalurus punctatus Raf. active 96h LC50 mortality 0.16 Lepomis macrochirus active 96h LC50 mortality 0.21 Leuciscus idus see footnote a 96h LC50 mortality 0,068 Leuciscus idus active 96h LC50 mortality 0.08 Oncorhynchus mykiss 5% product 96h LC50 mortality 0.93 Oncorhynchus mykiss active 96h LC50 mortality 0.24 Oryzias latipes see footnote a 96h LC50 mortality 1.2 Oryzias latipes active 96h LC50 mortality 1.6 Pimephales promelas Raf. see footnote a 96h LC50 mortality 0.61 Pimephales promelas Raf. active 96h LC50 mortality 0.7 Poecilia reticulata see footnote a 96h LC50 mortality 2
a: test compound not reported in dossier, assumed that active has been tested.
Table A2.2 Chronic toxicity of insecticide IP to aquatic organisms. The 5% product is subject of authorisation. Core data according to the data requirements in Annex II for the active and this formulation are presented on a grey background. Additional data were included in the dossier or obtained from the open literature.
Taxon/species Test Exp. Criterion Test Value compound time endpoint [μg a.s/L] Algae Pseudokirchneriella subcapitata 5% product 96h NOEC growth rate 460 Crustacea Daphnia magna active 21 d NOEC reproduction 0.002 Daphnia magna active 12 d EC10 reproduction 0.025 Fish Cyprinodon variegatus Lac.a active 28 d NOEC early life stage 0.25
a: saltwater species.

Alterra-report 2463 | 131
Table A2.3 Acute L(E)C10-values for insecticide IP to aquatic organisms from the open literature.
Taxon/species Exp. Criterion Value time [μg a.s/L] Crustacea Asellus aquaticus 96 h 0.0097 Daphnia galeata 48 h 0.0440 Gammarus pulex 96 h 0.0131 Proasellus coxalis 48 h 0.0130 Simocephalus vetulus 48 h 0.334 Insecta Caenis horaria 96 h 0.0036 Chaoborus obscupires 48 h 0.0006 Cloeon dipterum 48 h 0.0072 Erythromma viridulum 48 h 0.377 Macropelopia sp. 48 h 0.125 Notonecta glauca 48 h 0.0072
Short description of available micro-/mesocosm studies performed with insecticide IP Study no 1 In 1986 effects of IP were studied in sixteen outdoor experimental ponds in the USA, each being 15 x 30 m with a maximum depth of 2m. Sets of four replicate mesocosms were treated with three rates of the insecticide, applied as an EC formulation with the active ingredient IP. One set of four replicates was used as control. Multiple applications of the insecticide were studied simulating spray drift (12 x; weekly) and runoff (6x; biweekly). The spray drift treatments were equivalent to approximately nominal concentrations of 1.6 ng a.i./L, 16 ng a.i./L and 160 ng a.i./L. The runoff application were equivalent to approximately nominal concentrations 4.7 ng a.i./L, 47 ng a.i./L and 470 ng a.i./L. Since treatments were applied as soil-water slurries, and IP quickly sorbs to sediment particles the bioavailable fraction in the soil-water slurry will be considerably lower than the calculated nominal concentrations on basis of runoff applications. In addition, due to the fast dissipation of IP measured concentrations a few hours post treatment may not be very informative. For this reason the relevant exposure concentrations are probably higher than the nominal spray drift applications, but lower than the nominal runoff applications. From this study, on basis of measured IP concentrations in the overlying water, an overall water dissipation DT50 of 1 day was calculated. Physicochemical characteristics of the test systems (e.g. DO, pH, alkalinity) were not affected by the treatment. In addition convincing treatment-related effects could not be observed on phytoplankton and periphyton. The most sensitive endpoints comprised arthropod populations of the macroinvertebrate community. No convincing treatment-related effects could be observed in biomass and numbers of bluegill sunfish and macrophytes, although slight and transient effects cannot be excluded. The table below provides a summary of treatment-related effects in the experimental ponds. The treatment-levels are expressed in terms of Effect classes and as nominal concentrations and highest 48 h TWA concentrations of the spray drift and runoff applications. ↓ = decrease , ↑ = increase. Within each category (e.g. Insects) the response of the most sensitive measurement endpoint was selected. Unfortunately the data presented in th original publication do not allow to calculate the highest 21-d TWA concentreation or a TWA concentration for the toptal application period.

132 | Alterra report 2463
Table A2.4 Summary of treatment related effects in experimental ponds treated with Insecticide IP.
Peak conc. Spray drift 1.6 ng/L 16 ng/L 160 ng/L Peak conc. Runoff 4.7 ng/L 47 ng/L 470 ng/L 48 h TWA Spray drift 0.9 8.7 86.6 48 h TWA Runoff 2.5 25.4 254.3 Population responses Fish 1 1-2 1-2 Macrocrustaceans - - - Insects 1 5↓↑ 5↓ Other macroinvertebrates 1 1 1 Microcrustaceans 1 1 5↓ Rotifers 1 1 1 Algae 1 1 1 Macrophytes 1 1-2↑ 1-2↑ Community responses Community metabolism 1 1 1 Overall response 1 5 5
Study no. 2 and 3 In spring of the year 2000 a comparative study on the fate and ecological effects of the pyrethroid insecticide IP in mesotrophic (macrophyte-dominated) and eutrophic (phytoplankton-dominated) outdoor microcosms of 50 cm depth was performed. In this study the a formulated product (100 g a.i/L) was used. Twelve microcosms of each micriocosm type were used for effect studies and two of each microcosm type were used for fate studies. No fish were present in the microcosms. Average macrophyte biomass in the mesotrophic microcosms was 117 g/m2. The eutrophic microcosms were devoid of macrophytes. Average dissolved organic carbon and chlorophyll-a levels were 8.8 and 17.8 mg DOC/L and 58.5 and 106.5 µg chl-a/L for the macrophyte-dominated and phytoplankton-dominated microcosms, respectively. The study focussed on responses of free-living invertebrates and of selected invertebrate taxa incubated in in situ bioassays. IP was applied three times at one-week intervals and nominal treatment concentrations used to assess effects were 0, 10, 25, 50, 100 and 250 ng/L. The rate of dissipation of IP in the water column of the two types of test systems was similar (DT50 water phase approximately 1 d). Initial, direct effects were primarily observed on arthropod taxa. The most sensitive species was the phantom midge Chaoborus which showed transient effects at the lowest treatment level. Where clear population and community responses were observed (at concentrations higher than 10 ng/L), the overall pattern of direct effects was comparable between the different types of test systems. At higher exposure concentrations differences in recovery of affected populations were observed between the two types of test systems. The observed indirect effects (e.g. increase of rotifers and microcrustaceans) were more pronounced in the plankton dominated test systems. The study revealed that there were no great differences in threshold levels for direct toxic effects between types of test systems. The differences that were observed primarily concerned recovery potential and indirect effects. Study 2: The table below provides a summary of treatment-related effects in the plankton-dominated microcosms treated with the insecticide IP in spring. The numbers in the table refer to the Effect classes. The treatment-levels are expressed as nominal concentrations and initial 48-h TWA concentrations during the treatment period. ↓ = decrease, ↑ = increase. Within each category (e.g. Insects) the response of the most sensitive measurement endpoint was selected.

Alterra-report 2463 | 133
Table A2.5 Summary of treatment related effects in plankton-dominated microcosms treated with Insecticide IP.
Nominal concentration 10 ng/L 25 ng/L 50 ng/L 100 ng/L 250ng/L 48h TWA conc. 5.4 ng/L 13.5 ng/L 27.0 ng/L 54.1 ng/L 135 ng/L Population responses Macrocrustaceans - - - - - Insects 2↓ 3A↓ 3A↓ 3A↓ 3A↓ Other macroinvertebrates 1 1 1 2↑ 2↑ Microcrustaceans 2-3A↑ 4↑ 4↑ 4↑ 4↑↓ Rotifers 2↑ 3A↑ 3A↑ 3A↑ 3A↑ Phytoplankton Chl-a 1 1 1 1 2↑ Macrophyte biomass - - - - - Community responses PRC macroinvertebrates 2 3A 3A 3A 3A PRC zooplankton 2 2 2 2 2 Community metabolism 1 1 1 1 1 Overall response 2 4 4 4 4
Study 3. The table below provides a summary of treatment-related effects in the macrophyte-dominated microcosms treated with the insecticide IP in spring. The numbers in the table refer to the Effect classes. The treatment-levels are expressed as nominal concentrations and initial 48-h TWA concentrations during the treatment period. ↓ = decrease , ↑ = increase. Within each category (e.g. Insects) the response of the most sensitive measurement endpoint was selected.
Table A2.6 Summary of treatment related effects in macrophyte-dominated microcosms treated with Insecticide IP.
Nominal concentration 10 ng/L 25 ng/L 50 ng/L 100 ng/L 250ng/L 48 h TWA conc. 5.2 ng/L 12.9 ng/L 27.8 ng/L 54.4 ng/L 137 ng/L Population responses Macrocrustaceans 1 2↓ 2↓ 4↓ 4↓ Insects 2↓ 3A↓ 3A↓ 3A↓ 3A↓ Other macroinvertebrates 1 1 1 1 2↑↓ Microcrustaceans 1 2↓ 2↓ 2↓ 4↓ Rotifers 2↑↓ 2↑↓ 2↑↓ 2↑↓ 2↓;3A↑ Phytoplankton Chl-a 1 1 1 1 1 Macrophyte biomass 1 1 1 1 1 Community responses PRC macroinvertebrates 2 2 3A 3A 4 PRC zooplankton 1 1 2 2 2 Community metabolism 1 1 1 1 1 Overall response 2 3A 3A 4 4
Study no 4. In late summer of the year 2000 another microcosms experiment was performed with IP in similar mesotrophic macrophyte-dominated microcosms as used in Study 4 (see above) to get insight in the influence of the time of the year on the impact of insecticide-stress. In this study the same formulated product was used. No fish were present in the microcosms. Average macrophyte biomass in the enclosures of the mesotrophic microcosms was 241 g/m2. The study focussed on responses of free-living invertebrates and of selected invertebrate taxa incubated in in situ bioassays. Again, IP was applied three times at one-week intervals and nominal treatment concentrations used to assess effects were 0, 10, 25, 50, 100 and 250 ng/L. The rate of dissipation of IP in the water column of the test systems was on average 1 d. The table below provides a summary of treatment-related effects in the macrophyte-dominated microcosms treated with the insecticide IP in late summer. The numbers in the table refer to the Effect

134 | Alterra report 2463
classes. The treatment-levels are expressed as nominal concentrations. ↓ = decrease , ↑ = increase. Within each category (e.g. Insects) the response of the most sensitive measurement endpoint was selected.
Table A2.7 Summary of treatment related effects in macrophyte-dominated microcosms treated with Insecticide IP.
Nominal concentration 10 ng/L 25 ng/L 50 ng/L 100 ng/L 250ng/L 48-h TWA conc. 5.6 ng/L 13.7 ng/L 27.1 ng/L 54.7 ng/L 136 ng/L Population responses Macrocrustaceans 1 2↓ 3A↓ 4↓ 4↓ Insects 3A↓ 3A↓ 4↓ 4↓ 4↓ Other macroinvertebrates 1 1 1 1 2↑ Microcrustaceans 1 1 1 2↓ 3↓ Rotifers 2↑ 2↑ 2↑ 2↑ 2↑ Phytoplankton Chl-a 1 1 1 1 1 Macrophyte biomass 1 1 1 1 1 Community responses PRC macroinvertebrates 1 2 2 4 4 PRC zooplankton 1 1 1 1 1 Community metabolism 1 1 1 1 1 Overall response 3A 3A 4 4 4
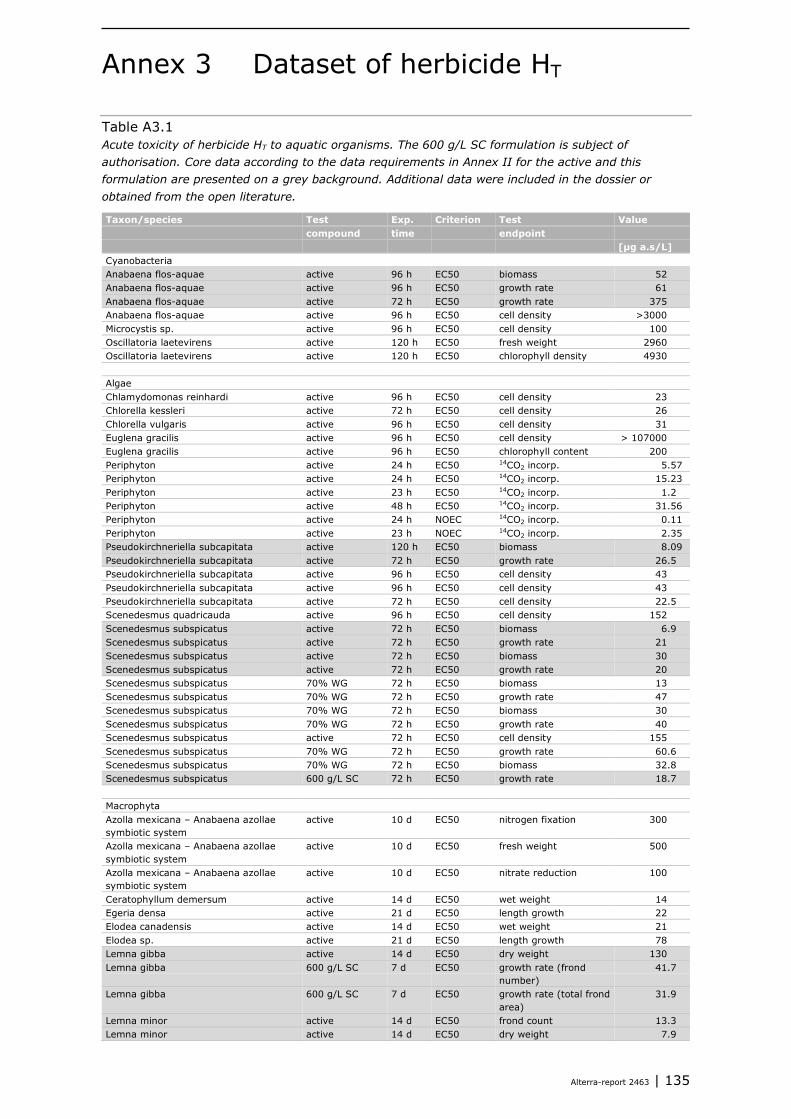
Alterra-report 2463 | 135
Dataset of herbicide HT Annex 3
Table A3.1 Acute toxicity of herbicide HT to aquatic organisms. The 600 g/L SC formulation is subject of authorisation. Core data according to the data requirements in Annex II for the active and this formulation are presented on a grey background. Additional data were included in the dossier or obtained from the open literature.
Taxon/species Test Exp. Criterion Test Value compound time endpoint [μg a.s/L] Cyanobacteria Anabaena flos-aquae active 96 h EC50 biomass 52 Anabaena flos-aquae active 96 h EC50 growth rate 61 Anabaena flos-aquae active 72 h EC50 growth rate 375 Anabaena flos-aquae active 96 h EC50 cell density >3000 Microcystis sp. active 96 h EC50 cell density 100 Oscillatoria laetevirens active 120 h EC50 fresh weight 2960 Oscillatoria laetevirens active 120 h EC50 chlorophyll density 4930 Algae Chlamydomonas reinhardi active 96 h EC50 cell density 23 Chlorella kessleri active 72 h EC50 cell density 26 Chlorella vulgaris active 96 h EC50 cell density 31 Euglena gracilis active 96 h EC50 cell density > 107000 Euglena gracilis active 96 h EC50 chlorophyll content 200 Periphyton active 24 h EC50 14CO2 incorp. 5.57 Periphyton active 24 h EC50 14CO2 incorp. 15.23 Periphyton active 23 h EC50 14CO2 incorp. 1.2 Periphyton active 48 h EC50 14CO2 incorp. 31.56 Periphyton active 24 h NOEC 14CO2 incorp. 0.11 Periphyton active 23 h NOEC 14CO2 incorp. 2.35 Pseudokirchneriella subcapitata active 120 h EC50 biomass 8.09 Pseudokirchneriella subcapitata active 72 h EC50 growth rate 26.5 Pseudokirchneriella subcapitata active 96 h EC50 cell density 43 Pseudokirchneriella subcapitata active 96 h EC50 cell density 43 Pseudokirchneriella subcapitata active 72 h EC50 cell density 22.5 Scenedesmus quadricauda active 96 h EC50 cell density 152 Scenedesmus subspicatus active 72 h EC50 biomass 6.9 Scenedesmus subspicatus active 72 h EC50 growth rate 21 Scenedesmus subspicatus active 72 h EC50 biomass 30 Scenedesmus subspicatus active 72 h EC50 growth rate 20 Scenedesmus subspicatus 70% WG 72 h EC50 biomass 13 Scenedesmus subspicatus 70% WG 72 h EC50 growth rate 47 Scenedesmus subspicatus 70% WG 72 h EC50 biomass 30 Scenedesmus subspicatus 70% WG 72 h EC50 growth rate 40 Scenedesmus subspicatus active 72 h EC50 cell density 155 Scenedesmus subspicatus 70% WG 72 h EC50 growth rate 60.6 Scenedesmus subspicatus 70% WG 72 h EC50 biomass 32.8 Scenedesmus subspicatus 600 g/L SC 72 h EC50 growth rate 18.7 Macrophyta Azolla mexicana – Anabaena azollae symbiotic system
active 10 d EC50 nitrogen fixation 300
Azolla mexicana – Anabaena azollae symbiotic system
active 10 d EC50 fresh weight 500
Azolla mexicana – Anabaena azollae symbiotic system
active 10 d EC50 nitrate reduction 100
Ceratophyllum demersum active 14 d EC50 wet weight 14 Egeria densa active 21 d EC50 length growth 22 Elodea canadensis active 14 d EC50 wet weight 21 Elodea sp. active 21 d EC50 length growth 78 Lemna gibba active 14 d EC50 dry weight 130 Lemna gibba 600 g/L SC 7 d EC50 growth rate (frond
number) 41.7
Lemna gibba 600 g/L SC 7 d EC50 growth rate (total frond area)
31.9
Lemna minor active 14 d EC50 frond count 13.3 Lemna minor active 14 d EC50 dry weight 7.9

136 | Alterra report 2463
Taxon/species Test Exp. Criterion Test Value compound time endpoint [μg a.s/L] Lemna minor active 14 d EC50 growth rate 37 Lemna paucicostata active 8 d EC50 frond count 45 Lemna perusilla active 28 d EC50 frond count 16 Myriophyllum heterophyllum active 14 d EC50 wet weight 17 Myriophyllum spicatum active 28 d EC50 dry weight 64 Najas sp. active 14 d EC50 wet weight 19 Crustacea Ceriodaphnia dubia 75% product 48 h LC50 mortality 26500 Daphnia magna active 48 h EC50 immobility 49000 Daphnia magna active 48 h EC50 immobility 49600 Daphnia magna 70% WG 48 h EC50 immobility 41300 Daphnia magna 70% WG 48 h EC50 immobility > 70000 Daphnia magna active 48 h EC50 mobility > 100000 Diaptomus mississippiensis 75% 48 h LC50 mortality 113000 Insecta Chironomus riparius 75% 48 h EC50 mobility 97500 Chironomus riparius active 48 h EC50 mobility 43500 Fish Cyprinodon variegatusa active 96 h LC50 mortality 85000 Ictalurus punctatus active 96 h LC50 mortality > 10000 Ictalurus punctatus active 96 h LC50 mortality >100000 Ictalurus punctatus active 96 h LC50 mortality >100000 Lepomis macrochirus active 96 h LC50 mortality 92000 Leuciscus idus active 96 h LC50 mortality 169400 Leuciscus idus melanotus active 96 h LC50 mortality 141600 Oncorhynchus mykiss active 96 h LC50 mortality 74600 Oncorhynchus mykiss active 96 h LC50 mortality 80300 Oncorhynchus mykiss 70% WG
product 96 h LC50 mortality 95600
Oncorhynchus mykiss active 96 h LC50 mortality 42000 Oncorhynchus mykiss 70 WG product 96 h LC50 mortality >69900 Rasbora heteromorpha 70% product 96 h LC50 mortality 98000
a: saltwater species.
Table A3.2 Chronic toxicity of herbicide HT to aquatic organisms. The 600 g/L SC formulation is subject of authorisation. Core data according to the data requirements in Annex II for the active and this formulation are presented on a grey background. Additional data were included in the dossier or obtained from the open literature.
Taxon/species Test Exp. Criterion Test Value compound time endpoint [μg a.s/L] Cyanobacteria Anabaena flos-aquae active 96 h NOEC biomass 3.2 Anabaena flos-aquae active 96 h NOEC growth rate 3.2 Anabaena flos-aquae active 72 h NOEC growth rate 61 Oscillatoria laetevirens active 120 h EC10 fresh weight 1010 Algae Chlorella kessleri active 72 h EC10 cell density 8 Pseudokirchneriella subcapitata active 120 h NOEC biomass 4.69 Pseudokirchneriella subcapitata active 72 h NOEC growth rate 2.5 Pseudokirchneriella subcapitata active 96 h NOEC cell density 19 Scenedesmus subspicatus 70% product 72 h NOEC growth rate/ biomass 10 Scenedesmus subspicatus active 96 h NOEC growth rate 1.8 Scenedesmus subspicatus active 72 h NOEC biomass 3.2 Scenedesmus subspicatus active 72 h NOEC growth rate 3.2 Scenedesmus subspicatus 70% WG 72 h NOEC growth rate 3.2 Scenedesmus subspicatus 70% WG 72 h NOEC growth rate 30.2 Scenedesmus subspicatus 70% WG 72 h NOEC biomass 25.2 Scenedesmus subspicatus 600 g/L SC 72 h NOEC growth rate 5.7

Alterra-report 2463 | 137
Taxon/species Test Exp. Criterion Test Value compound time endpoint [μg a.s/L] Macrophyta Azolla mexicana –Anabaena azollae symbiotic system
active 10 d EC10 fresh weight 1.64
Egeria densa active 21 d EC10 length, growth 1.57 Eleodea sp. active 21 d EC10 length, growth 29.8 Lemna gibba active 14 d NOEC dry weight 18 Lemna gibba 600 g/L SC 7 d EC10 growth rate
(frond area) 15
Lemna minor active 14 d NOEC dry weight, frond number 0.58 Lemna perusilla active 28 d EC10 frond count 4.32 Myriophyllum spicatum active 28 d EC10 length growth 2.85 Crustacea Cerodaphnia dubia 75% product 7 d NOEC reproduction 4690 Daphnia magna active 21 d NOEC reproduction 1290 Daphnia magna active 21 d NOEC reproduction 320 Daphnia magna 70% WG 21 d NOEC reproduction 4000 Fish Oncorhynchus mykiss active 21 d NOEC weight, length 10000 Oncorhynchus mykiss active 21 d NOEC mortality 5600 Oncorhynchus mykiss 70% WG 21 d NOEC mortality 7080 Oncorhynchus mykiss active 95 d EC10 length 4430 Pimephales promelas active 36 d NOEC fry survival 13100

138 | Alterra report 2463
Dataset for herbicide HM Annex 4
Table A4.1 Acute toxicity of herbicide HM to aquatic organisms. The 400 g/L EC formulation is subject of authorisation. Core data according to the data requirements in Annex II for the active and this formulation are presented on a grey background. Additional data were included in the dossier or obtained from the open literature.
Taxon/species Test Exp. Criterion Test Value compound time endpoint [mg a.s/L] Algae Chlamydomonas eugametos active 48 h EC50 cell density 0.43 Desmodesmus subspicatus 120 g/L AL product 72 h EC50 growth rate 3.04 Desmodesmus subspicatus 120 g/L AL product 72 h EC50 yield 2.34 Navicula pelliculosa active 96 h EC50 growth rate 1.65 Navicula pelliculosa active 96 h EC50 biomass 1 Pseudokirchneriella subcapitata active 96 h EC50 growth rate 3.3 Pseudokirchneriella subcapitata 400 g/L EC product 96 h EC50 biomass 1.1 Pseudokirchneriella subcapitata 400 g/L EC product 96 h EC50 growth rate 1.9 Pseudokirchneriella subcapitata 400 g/L EC product 72 h EC50 growth rate 2.14 Pseudokirchneriella subcapitata 400 g/L EC product 72 h EC50 biomass 0.869 Pseudokirchneriella subcapitata 300 g/L HN product 72 h EC50 growth rate >1.1 Pseudokirchneriella subcapitata 300 g/L HN product 72 h EC50 biomass >1.1 Pseudokirchneriella subcapitata 300 g/L HN product 72 h EC50 growth rate >1.4 Pseudokirchneriella subcapitata 300 g/L HN product 72 h EC50 biomass >1.4 Pseudokirchneriella subcapitata 120 g/L EW product 72 h EC50 growth rate 0.9 Pseudokirchneriella subcapitata 120 g/L EW product 72 h EC50 biomass 0.49 Pseudokirchneriella subcapitata 300 g/L UL product 72 h EC50 biomass 1.1 Pseudokirchneriella subcapitata 300 g/L UL product 72 h EC50 growth rate 1.8 Pseudokirchneriella subcapitata 500 g/L product 72 h EC50 growth rate 1.36 Pseudokirchneriella subcapitata 500 g/L product 72 h EC50 biomass 0.86 Pseudokirchneriella subcapitata 120 g/L EW product 72 h EC50 growth rate 1.13 Pseudokirchneriella subcapitata 120 g/L EW product 72 h EC50 biomass 0.62 Macrophyta Lemna minor active 7 d EC50 growth rate 3.82 Lemna minor active 7 d EC50 biomass 1.67 Lemna minor active 14 d EC50 growth rate 3.14 Lemna minor active 14 d EC50 biomass 2.65 Crustacea Daphnia magna active 48 h EC50 mobility 4 Daphnia magna active 48 h EC50 mobility 3.7 Daphnia magna 400 g/L EC product 48 h EC50 mobility 8.4 Daphnia magna 400 g/L EC product 48 h EC50 mobility 2.6 Daphnia magna 400 g/L EC product 48 h EC50 mobility 3.59 Daphnia magna 300 g/L HN product 48 h EC50 mobility 2.3 Daphnia magna 300 g/L EC product 48 h EC50 mobility 4.3 Daphnia magna 120 g/L EW product 48 h EC50 mobility 0.47 Daphnia magna 300 g/L UL product 48 h EC50 mobility 2.5 Daphnia magna 500 g/L product 48.h EC50 mobility 0.98 Daphnia magna 120 g/L AL product 48 h EC50 mobility 3.51 Daphnia magna 120 g/L EW product 48 h EC50 mobility 0.37 Fish Cyprinus carpio 400 g/L EC product 96 h LC50 mortality 5.3 Cyprinus carpio 400 g/L EC product 96 h LC50 mortality 9.2 Cyprinus carpio 120 g/L EW product 96 h LC50 mortality 2.4 Danio rerio active 96 h LC50 mortality 13.4 Lepomis macrochirus active 48 h LC50 mortality 12 Micropterus salmoides active 48 h LC50 mortality 10 Oncorhynchus mykiss active 96 h LC50 mortality 7.5 Oncorhynchus mykiss 400 g/L EC product 96 h LC50 mortality 3.91 Oncorhynchus mykiss 300 g/L HN product 96 h LC50 mortality 6.2 Oncorhynchus mykiss 300 g/L EC product 96 h LC50 mortality 9 Oncorhynchus mykiss 500 g/L product 96 h LC50 mortality 5.92 Oncorhynchus mykiss 120 g/L AL product 96 h LC50 mortality 4.56

Alterra-report 2463 | 139
Taxon/species Test Exp. Criterion Test Value compound time endpoint [mg a.s/L] Salvelinus fontinalis 400 g/L EC product 96 h LC50 mortality 8.8 Amphibia Pleurodeles waltlii active 24 h LC50 mortality 20 Triturus helveticus active 24 h LC50 mortality 6.5 Xenopus laevis active 24 h LC50 mortality 8.5
Table A4.2 Chronic toxicity of herbicide HM to aquatic organisms. The 400 g/L EC formulation is subject of authorisation. Core data according to the data requirements in Annex II for the active and this formulation are presented on a grey background. Additional data were included in the dossier or obtained from the open literature.
Taxon/species Test Exp. Criterion Test Value compound time endpoint [μg a.s/L] Algae Desmodesmus subspicatus 120 g/L AL product 72 h NOEC growth rate, yield 1.17 Navicula pelliculosa active 96 h NOEC growth rate, biomass 0.702 Pseudokirchneriella subcapitata 400 g/L EC product 96 h NOEC growth rate, biomass 0.46 Pseudokirchneriella subcapitata active 96 h NOEC biomass 0.1 Pseudokirchneriella subcapitata 400 g/L EC product 72 h NOEC growth rate, biomass 0.197 Pseudokirchneriella subcapitata 300 g/L HN product 72 h NOEC growth rate, biomass 0.32 Pseudokirchneriella subcapitata 300 g/L EC product 72 h NOEC growth rate, biomass 0.74 Pseudokirchneriella subcapitata 120 g/L EW product 72 h NOEC growth rate 0.23 Pseudokirchneriella subcapitata 300 g/L UL product 72 h NOEC growth rate 0.83 Pseudokirchneriella subcapitata 300 g/L UL product 72 h NOEC biomass 0.46 Pseudokirchneriella subcapitata 500 g/L product 72 h NOEC growth rate, biomass 0.36 Pseudokirchneriella subcapitata 120 g/L EW product 72 h NOEC growth rate, biomass 0.117 Scenedesmus quadricauda 400 g/L EW product 72 h NOEC cell density 0.04 Macrophyta Lemna minor active 7 d NOEC biomass 0.46 Lemna minor active 14 d NOEC growth rate, biomass 1.61 Crustacea Daphnia magna active 21 d NOEC reproduction 0.45 Daphnia magna active 21 d NOEC reproduction 1 Echinoderms Lytechinus pictus active 8 h NOEC Development 0.124a Fish Danio rerio active 34 d NOEC larval survival 0.32
a: in view of the life stage tested (fertilised eggs), test result can be considered as chronic endpoint.
Table A4.3 Oral toxicity of Herbicide HM for birds and mammals. All tests have been performed with the active substance and were submitted as part of the dossier.
Species Application route
Exp. Time Criterion Test endpoint Value
[mg a.s./kg diet]
Birds Colinus virginianus
diet 5 d LC50 mortality >5170
Coturnix coturnix japonica
diet 5 d LC50 mortality >5000
Colinus virginianus
diet 22 w NOEC reproduction ≥1000
Mammals Dog diet 14 d NOEC organ weights, haematology 5000

140 | Alterra report 2463
Species Application route
Exp. Time Criterion Test endpoint Value
[mg a.s./kg diet]
clinical signs ≥ 25000 Dog diet 28 d NOEC spleen weight, thyroid activity
food consumption, weight 200 20000
Dog capsule 90 d NOEC blood and organ changes body weight gain
1000 ≥ 25000
Dog diet 60 w NOEC effects on thyroid body weight gain
200 2000
Mouse diet 90 d NOEC blood, reticulocytes body weight
1743 ≥ 3486
Mouse diet 90 d NOEC increased met-Hb and Heinzbodies body weight gain
<1000 ≥ 300
Mouse diet 18 m NOEC changes in spleen and bone-marrow mortality
830 4150
Rabbit gavagea d 6-18 after mating
NOEC maternal decreased food consumption and mortality, increased spleen weight; slightly retarded foetal weight and ossification
8325
Rabbit gavagea d 6-18 after mating
NOEC maternal decreased food consumption embryotoxicity
8325 4163
Rat diet 28 d NOEC red blood cell parameters, reticulocytes body weight
<600 3000
Rat diet 90 d NOEC red blood cells body weight gain
340 6000
Rat diet 90 d NOEC blood cell count and Met-Hb body weight gain, clinical signs
120 ≥ 3000
Rat diet 2 y NOEC changes in liver, spleen and bone-marrow body weight gain
<600 600
Rat diet 2 gen. (90 d) NOEC F1 parental body weight and organ changes; off-spring body weight and survival reduction, changes in spleen
1000
Rat gavagea d 6-15 of gestation
NOEC maternal decreased growth and food consumption; reduced foetal weight and retarded ossification
4000
Rat gastric intubationa
d 6-19 of gestation
NOEC maternal body weight gain; maternal spleen weight foetal weight, fertility
800 < 800 8000
a: recalculated from endpoint based on body weight using conversion factors.

Alterra-report 2463 | 141
Dataset of fungicide FP Annex 5
Table A5.1. Acute toxicity of fungicide FP to aquatic organisms. The 500 g/L product is subject of authorisation. Core data according to the data requirements in Annex II for the active and this formulation are presented on a grey background. Additional data were included in the dossier or obtained from the open literature.
Taxon/species Test Exp. Criterion Test Value compound time endpoint [μg a.s/L] Algae Desmodesmus subspicatus 500 g/L product 96 h EC50 Chl-a 227 Monoraphidium minutum 500 g/L product 96 h EC50 Chl-a 1799 Pseudokirchneriella subcapitata active 96 h EC50 growth rate > 220a Pseudokirchneriella subcapitata 500 g/L product 72 h EC50 Chl-a 1168 Pseudokirchneriella subcapitata 500 g/L product 72 h EC50 growth rate > 2176 Scenedesmus quadricauda 500 g/L product 96 h EC50 Chl-a 9932 Macrophyta Lemna gibba active 7 EC50 growth rate >69.1 Crustacea Acanthrocyclops venustus 500 g/L product 96 h EC50 mobility 4.6 Asellus aquaticus 500 g/L product 96 h EC50 mobility 79.1 Daphnia galeata 500 g/L product 96 h EC50 mobility 49.7 Daphnia magna active 48 h EC50 mobility 220 Daphnia magna 500 g/L product 96 h EC50 mobility 146.8
Daphnia magna 500 g/L product 48 h EC50 mobility 119 Daphnia magna active 48 h EC50 mobility 190 Daphnia magna active 48 h EC50 mobility 55 Daphnia pulex 500 g/L product 96 h EC50 mobility 66.4 Gammarus pulex 500 g/L product 96 h EC50 mobility 127 Proasellus coxalis 500 g/L product 96 h EC50 mobility 368 Insecta Caenis horaria 500 g/L product 96 h EC50 mobility 1995 Chironomus + Glyptotendipes 500 g/L product 96 h EC50 mobility 98.2 Cloeon dipterum 500 g/L product 96 h EC50 mobility 176 Erpobdella sp. 500 g/L product 96 h EC50 mobility 89.1 Rotifera Brachionus calyciflorus 500 g/L product 48 h EC50 mobility 1.6 Mollusca Lymnaea stagnalis 500 g/L product 96 h EC50 mobility 43.8 Physa fontinalis 500 g/L product 96 h EC50 mobility 263 Sphaerium sp. 500 g/L product 96 h EC50 mobility 185 Platyhelmintes Dugesia sp. 500 g/L product 96 h EC50 mobility 40.5 Polycelis nigra 500 g/L product 96 h EC50 mobility 105 Oligochaeta Lumbriculus variegatus 500 g/L product 96 h EC50 mobility 39.4 Tubifex sp 500 g/L product 96 h EC50 mobility 8 Fish Cyprinodon variegatusa active 96 h LC50 mortality 120 Cyprinus carpio active 96 h LC50 mortality 150 Danio rerio active 96 h LC50 mortality 89 Lepomis macrochirus active 96 h LC50 mortality 55 Oncorhynchus mykiss active 96 h LC50 mortality 36 Oncorhynchus mykiss active 96 h LC50 mortality 110

142 | Alterra report 2463
Taxon/species Test Exp. Criterion Test Value compound time endpoint [μg a.s/L] Oncorhynchus mykiss 500 g/L product 96 h LC50 mortality 160 Poecilia reticulata active 96 h LC50 mortality 109
a: saltwater species.
Table A5.2 Chronic toxicity of fungicide FP to aquatic organisms. The 500 g/L product is subject of authorisation. Core data according to the data requirements in Annex II for the active and this formulation are presented on a grey background. Additional data were included in the dossier or obtained from the open literature.
Taxon/species Test Exp. Criterion Test Value compound time endpoint [μg a.s/L] Algae Desmodesmus supspicatus 500 g/L product 96 h EC10 Chl-a 30 Monoraphidum minutum 500 g/L product 96 h EC10 Chl-a 197 Pseudokirchneriella subcapitata active 96 h NOEC growth rate 48 Pseudokirchneriella subcapitata 500 g/L product 96 h EC10 Chl-a 102 Pseudokirchneriella subcapitata 500 g/L product 72 h NOEC growth rate 157 Scenedesmus obliquus 500 g/L product 96 h EC10 Chl-a 375 Macrophyta Lemna gibba active 7 NOEC biomass 35.9 Crustacea Daphnia magna active 21 d NOEC growth 12.5 Daphnia magna active 21 d NOEC mortality 68 Insecta Chironomus riparius active 28 d NOEC emergence 6.25a Fish Oncorhynchus mykiss active 21 d NOEC mortality 12 Pimephales promelas active 35 d NOEC mortality 5.3 Pimephales promelas active 278 d NOEC reproduction 2.9
a: test in water/sediment system; endpoint based on initial concentration in water phase.

Alterra-report 2463 | 143
Dataset of fungicide FC Annex 6
Table A6.1 Acute toxicity of fungicide FC to aquatic organisms. The 50% WP product is subject of authorisation. Core data according to the data requirements in Annex II for the active and this formulation are presented on a grey background. Additional data were included in the dossier or obtained from the open literature.
Taxon/species Test Exp. Criterion Test Value compound time endpoint [μg a.s/L] Cyanophyta Anabaena flos-aquae active 96 h EC50 growth rate 254 Algae Pseudokirchneriella subcapitata active 72 h EC50 growth rate 2390 Pseudokirchneriella subcapitata active 72 h EC50 growth rate 630 Pseudokirchneriella subcapitata 50% WP product 72 h EC50 growth rate 410 Macrophyta Lemna gibba active 14 d EC50 biomass / growth rate > 700 Crustacea Americamysis bahia active 96 h EC50 mortality > 44400 Daphnia magna active 48 h EC50 immobility 27000 Daphnia magna 50% WP product 48h EC50 immobility > 101000 Mollusca Crassostrea virginicaa active 96 h EC50 shell growth > 46900 Fish Cyprinodon variegatusa active 96 h LC50 mortality > 47500 Lepomis macrochirus active 96 h LC50 mortality 29000 Oncorhynchus mykiss active 96 h LC50 mortality 61000 Oncorhynchus mykiss 50% WP product 96 h LC50 mortality 60600
a: saltwater species.
Table A6.2 Chronic toxicity of fungicide FC to aquatic organisms. The 50% WP product is subject of authorisation. Core data according to the data requirements in Annex II for the active and this formulation are presented on a grey background. Additional data were included in the dossier or obtained from the open literature.
Taxon/species Test Exp. Criterion Test Value compound time endpoint [μg a.s/L] Cyanophyta Anabaena flos-aquae active 96 h NOEC growth rate 65.2 Algae Pseudokirchneriella subcapitata active 120 h NOEC growth rate 662 Pseudokirchneriella subcapitata active 72 h NOEC growth rate 220a Pseudokirchneriella subcapitata 50% WP product 72 h EC50 growth rate 110 Macrophyta Lemna gibba active 14 d NOEC biomass / growth rate ≥ 700 Crustacea Daphnia magna active 21 d NOEC immobility, time to
reproduction 67
Fish

144 | Alterra report 2463
Taxon/species Test Exp. Criterion Test Value compound time endpoint [μg a.s/L] Oncorhynchus mykiss active 21 d NOEC length 220 Oncorhynchus mykiss active 97 d NOEC length 120 Cyprinodon variegatus active 36 d NOEC juvenile survival 58.1
a: significant inhibition at lowest test concentration of 220 µg/L, since inhibition was only 5% this is considered as NOEC.

Alterra-report 2463 | 145

146 | Alterra report 2463
Alterra Wageningen UR P.O. Box 47 6700 AA Wageningen The Netherlands T +31 (0)317 48 07 00 www.wageningenUR.nl/en/alterra Alterra report 2463 ISSN 1566-7197
Alterra Wageningen UR is the research institute for our green living environment. We offer a combination of practical and scientific research in a multitude of disciplines related to the green world around us and the sustainable use of our living environment, such as flora and fauna, soil, water, the environment, geo-information and remote sensing, landscape and spatial planning, man and society. The mission of Wageningen UR (University & Research centre) is ‘To explore the potential of nature to improve the quality of life’. Within Wageningen UR, nine specialised research institutes of the DLO Foundation have joined forces with Wageningen University to help answer the most important questions in the domain of healthy food and living environment. With approximately 30 locations, 6,000 members of staff and 9,000 students, Wageningen UR is one of the leading organisations in its domain worldwide. The integral approach to problems and the cooperation between the various disciplines are at the heart of the unique Wageningen Approach.


C.E. Smit, G.H.P. Arts, T.C.M. Brock, T.E.M. ten Hulscher, R. Luttik and P.J.M. van Vliet
Alterra Wageningen UR is the research institute for our green living environment. We offer a combination of practical and scientific research in a multitude of disciplines related to the green world around us and the sustainable use of our living environment, such as flora and fauna, soil, water, the environment, geo-information and remote sensing, landscape and spatial planning, man and society.
The mission of Wageningen UR (University & Research centre) is ‘To explore the potential of nature to improve the quality of life’. Within Wageningen UR, nine specialised research institutes of the DLO Foundation have joined forces with Wageningen University to help answer the most important questions in the domain of healthy food and living environment. With approximately 30 locations, 6,000 members of staff and 9,000 students, Wageningen UR is one of the leading organisations in its domain worldwide. The integral approach to problems and the cooperation between the various disciplines are at the heart of the unique Wageningen Approach.
Alterra Wageningen URP.O. Box 47 6700 AA WageningenThe Netherlands T +31 (0) 317 48 07 00www.wageningenUR.nl/en/alterra
Alterra Report 2463 ISSN 1566-7197
C.E. Smit, G.H.P. Arts, T.C.M. Brock, T.E.M. ten Hulscher, R. Luttik and P.J.M. van Vliet
Evaluation of the Dutch 2011 proposal
Aquatic effect and risk assessment for plant protection products