April and May 2018 Fault Induced Solar Photovoltaic ......BPS-Connected Solar PV Tripping: In both...
40
NERC | Report Title | Report Date I April and May 2018 Fault Induced Solar Photovoltaic Resource Interruption Disturbances Report Southern California Events: April 20, 2018 and May 11, 2018 Joint NERC and WECC Staff Report January 2019
Transcript of April and May 2018 Fault Induced Solar Photovoltaic ......BPS-Connected Solar PV Tripping: In both...

NERC | Report Title | Report Date I
April and May 2018 Fault Induced Solar Photovoltaic Resource Interruption Disturbances Report Southern California Events: April 20, 2018 and May 11, 2018 Joint NERC and WECC Staff Report January 2019

NERC | April and May 2018 Fault-Induced Solar PV Resource Disturbances Report | January 2019 ii
Table of Contents
Preface ....................................................................................................................................................................... iii
Executive Summary ................................................................................................................................................... iv
Overview of Angeles Forest and Palmdale Roost Disturbances ............................................................................ iv
Key Findings, Actions, and Recommendations ....................................................................................................... v
Chapter 1: Angeles Forest and Palmdale Roost Disturbances ...................................................................................1
Angeles Forest Disturbance on April 20, 2018 ........................................................................................................1
Palmdale Roost Disturbance on May 11, 2018 .......................................................................................................6
Additional Information Related to Disturbances ................................................................................................. 10
Chapter 2: Detailed Findings from Disturbance Analysis ........................................................................................ 13
Continued Use of Momentary Cessation ............................................................................................................. 13
Fault Ride-Through Performance ........................................................................................................................ 15
Transient AC Overvoltage and DC Reverse Current Tripping .............................................................................. 16
Curtailment Commands from Balancing Authority ............................................................................................. 18
Partial Tripping and Momentary Cessation ......................................................................................................... 19
Difference between Inverter Terminal and POI Voltage ..................................................................................... 20
Lack of High Resolution Data and Time Stamping ............................................................................................... 23
Response of Distributed Energy Resources ......................................................................................................... 24
Pacific DC Intertie Performance and RAS Action ................................................................................................. 27
Combustion Turbine Trip during Disturbance ..................................................................................................... 28
Appendix A: List of Acronyms .................................................................................................................................. 30
Appendix B: Disturbance Analysis Teams ................................................................................................................ 32

NERC | April and May 2018 Fault-Induced Solar PV Resource Disturbances Report | January 2019 iii
Preface
The vision for the Electric Reliability Organization (ERO) Enterprise, which is comprised of the North American Electric Reliability Corporation (NERC) and the seven Regional Entities (REs), is a highly reliable and secure North American bulk power system (BPS). Our mission is to assure the effective and efficient reduction of risks to the reliability and security of the grid. The North American BPS is divided into seven RE boundaries as shown in the map and corresponding table below. The multicolored area denotes overlap as some load-serving entities participate in one Region while associated Transmission Owners/Operators participate in another.
FRCC Florida Reliability Coordinating Council
MRO Midwest Reliability Organization
NPCC Northeast Power Coordinating Council
RF ReliabilityFirst
SERC SERC Reliability Corporation
Texas RE Texas Reliability Entity
WECC Western Electricity Coordinating Council

NERC | April and May 2018 Fault-Induced Solar PV Resource Disturbances Report | January 2019 iv
Executive Summary
This report contains the ERO analysis of the BPS disturbances that occurred in the Southern California area on April 20, 2018, (Angeles Forest disturbance) and May 11, 2018, (Palmdale Roost disturbance). Both of these events consisted of a loss of solar photovoltaic (PV) facilities in response to transmission line faults. This report was prepared following data requests sent to Generator Owners (GOs) subsequent to each event. The events were identified by NERC, WECC, California Independent System Operator (CAISO), and Southern California Edison (SCE). The purpose of the report is to document the analysis of these disturbance and provide key findings and recommendations for the industry. The ERO has previously published two disturbance reports on the Blue Cut Fire disturbance1 (August 16, 2016) and the Canyon 2 Fire disturbance2 (October 9, 2017); both of these disturbances consisted of the loss of BPS-connected solar PV resources in response to transmission line faults. These two disturbance analyses resulted in two separate NERC alerts3, 4 being issued to the industry. Note that the NERC alert following the Canyon 2 Fire disturbance was issued on May 1, 2018, 11 days after the Angeles Forest disturbance and only 10 days before the Palmdale Roost disturbance.
Overview of Angeles Forest and Palmdale Roost Disturbances The Angeles Forest disturbance occurred on April 20, 2018, at 17:11:06 Pacific Daylight Time (PDT), and was initiated by a 500 kV transmission line fault caused by a failed splice. The resulting phase-to-phase fault was cleared normally by line relay protection in 2.6 cycles. The Palmdale Roost disturbance occurred on May 11, 2018, at 15:20:14 PDT, and was initiated by a 500 kV transmission line fault due to insulator flashover caused by a buildup of bird nesting material. The resulting single-line-to-ground fault was cleared normally by line relay protection in three cycles. These disturbances were analyzed together since the resource losses, key findings, and recommendations were very similar for both events. No generating resources were tripped as a consequence of either of the line outages. However, each disturbance involved BPS-connected solar PV resources across the southern and central California regions, an increase in net load in CAISO (attributed to response of distributed energy resources), and a combined-cycle unit trip for the Angeles Forest disturbance. The measured and estimated resources loss and reduction caused by each disturbance is shown in Table E.1 and include the following:
BPS-Connected Solar PV Tripping: In both disturbances, a number of BPS-connected solar PV resources tripped in response to the transmission faults. Causes of inverter tripping included ac undervoltage, transient sub-cycle ac overvoltage, ac overcurrent, and dc reverse current.
BPS-Connected Solar PV Momentary Cessation: In both disturbances, many BPS-connected solar PV resources entered momentary cessation, ceasing active and reactive current injection to the grid.
Net Load Increase Attributed to DER Tripping: In both disturbances, net load increased immediately after the fault event and lasted on the order of 5–10 minutes. Detailed analysis showed that this increase in net load is likely attributable to response of distributed energy resources (DERs). DERs showed similar responses as that of the PV plants.
1 Blue Cut Fire Disturbance report, June 2017: https://www.nerc.com/pa/rrm/ea/Pages/1200-MW-Fault-Induced-Solar-Photovoltaic-Resource-Interruption-Disturbance-Report.aspx. 2 Canyon 2 Fire Disturbance report, February 2018: https://www.nerc.com/pa/rrm/ea/Pages/October-9-2017-Canyon-2-Fire-Disturbance-Report.aspx. 3 Blue Cut Fire Disturbance NERC Alert, June 2017: https://www.nerc.com/pa/rrm/bpsa/Alerts%20DL/NERC%20Alert%20Loss%20of%20Solar%20Resources%20during%20Transmission%20Disturbance.pdf. 4 Canyon 2 Fire Disturbance NERC Alert, May 2018: https://www.nerc.com/pa/rrm/bpsa/Alerts%20DL/NERC_Alert_Loss_of_Solar_Resources_during_Transmission_Disturbance-II_2018.pdf.

Executive Summary
NERC | April and May 2018 Fault-Induced Solar PV Resource Disturbances Report | January 2019 v
Combined-Cycle Combustion Turbine Trip (Palmdale Roost Disturbance): During the Palmdale Roost disturbance, a combustion turbine (CT) at a combined-cycle power plant tripped off-line due to low fuel gas pressure and turbine controls. This subsequently caused a reduction of output from the steam unit.
Pacific DC Intertie (PDCI) Blocking and BPA RAS: During the Palmdale Roost disturbance, the PDCI entered a blocking state due to low terminal voltage. Changes in power flow across the Western Interconnection (WI) caused BPA RAS to remove shunt reactors and insert series capacitors along the California–Oregon Intertie (COI). Both controls operated as designed.
Table E.1: Generating Resource Reductions
Type Angeles Forest
[MW] Palmdale Roost
[MW]
CAISO BPS-Connected Solar PV 860 MW 630 MW
SCE BPS-Connected Solar PV 670 MW 620 MW
PG&E BPS-Connected Solar PV 225 MW 225 MW
SDG&E BPS-Connected Solar PV 0 MW 0 MW
LADWP BPS-Connected Solar PV 17 MW 48 MW
IID BPS-Connected Solar PV 0 MW 33 MW
Combined-Cycle Power Plant 200 MW5 N/A
CAISO Net Load Increase6 130 MW 100 MW
Key Findings, Actions, and Recommendations Table E.2 summarizes the key findings and recommendations as an outcome of the analyses of the Angeles Forest disturbance on April 20, 2018, and the Palmdale Roost disturbance on May 11, 2018.
Table E.2: Key Findings and Recommendations
Topic: Continued Use of Momentary Cessation
Key Finding #1: Momentary cessation continues to be an issue during disturbances. Many momentary cessation settings have not been widened from above 1.1 per unit (pu) or below 0.9 pu voltage. The NERC Alert issued on May 1, 2018, and the Canyon 2 Disturbance Report includes three recommendations that address momentary cessation—recommendations 1a, 1b, and 2.
Recommendation #1: GOs, in coordination with their inverter manufacturer(s), should implement the recommended changes to inverter settings and performance as outlined in the NERC Alert following the Canyon 2 Fire disturbance. Transmission Planners (TPs) and Planning Coordinators (PCs) should be following up with applicable GOs to ensure that these changes are being made and that models are being updated accordingly to accurately reflect the dynamic behavior of solar PV resources connected to the BPS.
5 Combustion turbine #1 tripped at 125 MW, and the steam turbine reduced output from 150 MW to 75 MW over the course of 19 minutes. 6 Attributed to DER performance.

Executive Summary
NERC | April and May 2018 Fault-Induced Solar PV Resource Disturbances Report | January 2019 vi
Table E.2: Key Findings and Recommendations
Topic: Fault Ride-Through Performance
Key Finding #2: Some solar PV plants are exhibiting forms of fault ride-through that support BPS reliability with active and reactive current injection during and immediately following fault conditions.
Recommendation #2: GOs, in coordination with their inverter manufacturer(s), should implement the recommended changes to inverter settings and performance as outlined in the NERC Alert following the Canyon 2 Fire disturbance.
Topic: Transient AC Overvoltage and DC Reverse Current Tripping
Key Finding #3: Inverter tripping on transient sub-cycle ac overvoltage continues to be an issue. In some cases, this ac overvoltage causes dc reverse current in the inverter, and the inverters may exhibit a fatal error code that requires manual reset at the inverter.
Recommendation #3: GOs should work with their inverter manufacturers to set transient ac overvoltage protection as wide as possible while still protecting the integrity of the inverter and associated equipment. GOs should also coordinate with their inverter manufacturer to ensure that dc reverse current detection and protection are set to avoid tripping for dc reverse currents that could result during sub-cycle transient overvoltage conditions since these are not likely to damage any equipment in the plant.
Topic: Partial Tripping and Momentary Cessation
Key Finding #4: Multiple plants in both the Angeles Forest disturbance and Palmdale Roost disturbance exhibited partial tripping7 and may have also exhibited momentary cessation for the remaining inverters. This type of performance is fairly common during extra high voltage (EHV) fault events, particularly for inverter-based resources near the fault location.
Recommendation #4: The NERC Inverter-Based Resource Performance Task Force (IRPTF) should review existing NERC Reliability Standards and provide some technical perspectives and guidance as to how partial tripping or partial momentary cessation could be handled. This was highlighted in the NERC IRPTF Standard Authorization Request (SAR) submitted regarding PRC-024-2 and may be applicable to other NERC Reliability Standards as well.
Topic: Difference between Inverter Terminal and POI Voltage
Key Finding #5: Vastly different voltage conditions have been observed during grid disturbances between the individual inverter terminals and the point of interconnection (POI). Many existing inverters are programmed with the PRC-024-2 curve settings and do not account for differences between inverter terminal conditions and the POI. This leads to a susceptibility for inverter tripping and does not meet the intent of PRC-024-2.
7 Partial tripping involves a portion of (rather than all) inverters tripping at an inverter-based resource. Since each individual generating resource (i.e., inverter) experiences a slightly different terminal conditions across a dispersed power producing resource, some may observe conditions that warrant tripping while others may not.

Executive Summary
NERC | April and May 2018 Fault-Induced Solar PV Resource Disturbances Report | January 2019 vii
Table E.2: Key Findings and Recommendations
Recommendation #5: GOs should be performing analyses for each installation to correctly set inverter protective functions such that all inverters within a facility will not trip for any voltages seen at the POI within the “No Trip” zone of Attachment 2 of PRC-024-2. Setting the inverter protection settings to match the PRC-024-2 curve is not a recommended practice as it does not consider the vastly different voltage conditions that may be experienced at the inverter terminals relative to the POI voltage (as has been observed in multiple disturbances analyses).
Topic: Lack of High Resolution Data and Time Stamping
Key Finding #6: Lack of available high speed data at multiple inverter-based resources has hindered event analysis. Some data was only time stamped with a resolution of one second or slower. This caused issues when trying to identify exact causes of inverter tripping.
Recommendation #6: Each inverter-based resource should have the capability to capture high speed data from some inverters within the plant during grid events, particularly during large grid disturbances. High speed data at the plant controller, capturing response at the POI, should also be available. Time stamped sequence of events recorder (SER) logs should have at least 1 ms resolution to support event analysis of inverter tripping during BPS fault events. Transmission entities should also consider installing and utilizing digital fault recorder (DFR) data at the POI of inverter-based resources.
Topic: Response of Distributed Energy Resources
Key Finding #7: Tripping or momentary cessation of DERs was involved in the Angeles Forest and Palmdale Roost disturbances. This is based on anecdotal evidence and analysis of area net load and individual transmission-distribution (T-D) transformer load supervisory control and data acquisition (SCADA) points. Increase in net load on the order of 130 MW and 100 MW in the CAISO footprint was observed for the Angeles Forest and Palmdale Roost disturbances, respectively. These are estimated values of DER response, since the exact values are not ascertainable. DER response was identified in the SCE footprint; DERs in the PG&E footprint were not affected.
Recommendation #7: Transmission Owners (TOs), Balancing Authorities (BAs), Reliability Coordinators (RCs), and other transmission entities should review load SCADA points following grid disturbances for those load banks that have relatively high penetration of DERs. Individual SCADA points should be used for aggregate of load values rather than using area net load points that may involve other external factors. The NERC System Planning Impacts of Distributed Energy Resources Working Group (SPIDERWG) should consider developing more comprehensive guidance on accounting for DERs during BPS disturbances by building off of the examples described herein.
Topic: Pacific DC Intertie Performance and RAS Action
Key Finding #8: The PDCI experienced temporary blocking to avoid commutation failure during the Palmdale Roost fault near the inverter terminal of the PDCI. The large change in power flows across the WI initiated BPA RAS due to detected drop in voltage along the COI. Both these actions operated as designed to support BPS reliability. However, the impacts of these actions and BPS solar PV use of momentary cessation has likely not been sufficiently studied by TPs and PCs.

Executive Summary
NERC | April and May 2018 Fault-Induced Solar PV Resource Disturbances Report | January 2019 viii
Table E.2: Key Findings and Recommendations
Recommendation #8: TPs and PCs in the WI should ensure that momentary cessation of BPS-connected solar PV is modeled correctly along with accurate modeling of the PDCI blocking. Fault events in the Southern California region should be further studied by applicable TPs, PCs, and the NERC IRPTF to ensure stable operation with the combination of all control actions modeled correctly.
Topic: Combustion Turbine Trip during Disturbance
Key Finding #9: The combined-cycle power plant tripped due to low fuel gas pressure as the turbine control system attempted to readjust the number of burners used as the plant initiated a runback of active power output. One CT tripped, causing the steam turbine to also reduce output over many minutes.
Recommendation #9: The GO for this facility should coordinate with the turbine manufacturer to ensure that the turbine controls are correctly tuned to be able to ride through BPS fault disturbances.
Data and information about events were gathered from the affected registered entities involved in the disturbances, and this was instrumental to the successful and timely completion of this analysis.

NERC | April and May 2018 Fault-Induced Solar PV Resource Disturbances Report | January 2019 1
Chapter 1: Angeles Forest and Palmdale Roost Disturbances
Angeles Forest Disturbance on April 20, 2018 On April 20, 2018, at 17:11:06 Pacific Daylight Time (PDT), a splice failed on a 500 kV transmission line in the SCE footprint, causing the top conductor to fall into the middle phase of a vertically arranged tower structure (see Figures 1.1 and 1.2). The disturbance was coined the “Angeles Forest” disturbance since the fault occurred in the vicinity of the Angeles National Forest but was unrelated to any forest fires. The B-C phase fault was cleared normally within 2.6 cycles. Since the fault involved direct conductor contact, the fault is assumed to be a low impedance line-line fault.
Figure 1.1: Photo of Failed Splice [Source: SCE]
Figures 1.3 and 1.4 show DFR point-on-wave data from the local and remote ends of the faulted transmission circuit, respectively. Red dotted vertical lines show an estimate of the fault inception and fault clearing times. The DFRs monitor line voltages via capacitance-coupled voltage transformers (CCVTs) that are on the line (within the zone of protection). When the line clears, the CCVTs will monitor any LC resonance that exists on the line as it rings down to a steady-state. The faulted line is also mixed 500 kV underground/overhead configuration with relatively lopsided resistance-inductance-capacitance (RLC) line parameters and unbalanced line shunt reactors to compensate for high capacitive charging from the underground portion of the line. Since the line is 500 kV, there is significant charging from the underground portion that led to the unusual shunt compensation; this was likely the cause of the abnormal resonant RLC response shown in the DFR records when the line was opened at both terminals.
Figure 1.2: Old Photo of Tower
[Source: SCE]

Chapter 1: Angeles Forest and Palmdale Roost Disturbances
NERC | April and May 2018 Fault-Induced Solar PV Resource Disturbances Report | January 2019 2
Figure 1.3: DFR Data from Local End of Faulted 500 kV Circuit [Source: SCE]
Figure 1.4: DFR Data from Remote End of Faulted 500 kV Circuit [Source: SCE] The disturbance affected8 generation in CAISO (SCE and Pacific Gas & Electric (PG&E)) and the Los Angeles Department of Water and Power (LADWP) footprints. Figures 1.5 through 1.8 show CAISO,9 SCE, PG&E, and LADWP BPS-connected solar PV responses during the grid disturbance.10 No noticeable impact to BPS-connected solar PV was observed in either San Diego Gas & Electric (SDG&E) or Imperial Irrigation District (IID) footprints. The 500 kV transmission line fault resulted in a reduction of BPS-connected solar PV output by 860 MW in CAISO and 17 MW in LADWP.
8 No solar PV resources were de-energized as a direct consequence of protective relaying removing the faulted transmission element from service. Rather, the solar PV inverter controls and protection caused the reduction in output from all affected plants. 9 SCE, PG&E, and SDG&E are within the CAISO BA footprint, so the CAISO response should be similar to the sum of each individual response. However, the resolution of local utility data is higher; and therefore, it picks up a larger change in BPS-connected solar PV output immediately following the fault event (capturing more loss due to momentary cessation). 10 The fault occurred during the daily solar PV ramp down. Since solar PV had begun its afternoon decline, some generation did not return to pre-disturbance output after the event due to the change in solar irradiance and the maximum available power, as expected.

Chapter 1: Angeles Forest and Palmdale Roost Disturbances
NERC | April and May 2018 Fault-Induced Solar PV Resource Disturbances Report | January 2019 3
Figure 1.5: CAISO BPS-Connected Solar PV and Net Load during Angeles Forest Disturbance [Source: CAISO]
Figure 1.6: SCE BPS-Connected Solar PV during Angeles Forest Disturbance [Source: SCE]

Chapter 1: Angeles Forest and Palmdale Roost Disturbances
NERC | April and May 2018 Fault-Induced Solar PV Resource Disturbances Report | January 2019 4
Figure 1.7: PG&E BPS-Connected Solar PV during Angeles Forest Disturbance [Source: PG&E]
Figure 1.8 LADWP BPS-Connected Solar PV during Angeles Forest Disturbance [Source: LADWP]
In addition to the BPS-connected solar PV resource tripping, one natural gas turbine at a 2-on-1 (two natural gas turbines and a steam turbine) combined-cycle power plant located in Kern County in the PG&E footprint tripped off-line due to the fault event. The plant tripped on low fuel gas pressure, causing one natural gas turbine loaded at 125 MW to trip. This subsequently reduced the steam turbine output from 150 MW to 75 MW over the course
Chapter 1: Angeles Forest and Palmdale Roost Disturbances
NERC | April and May 2018 Fault-Induced Solar PV Resource Disturbances Report | January 2019 5
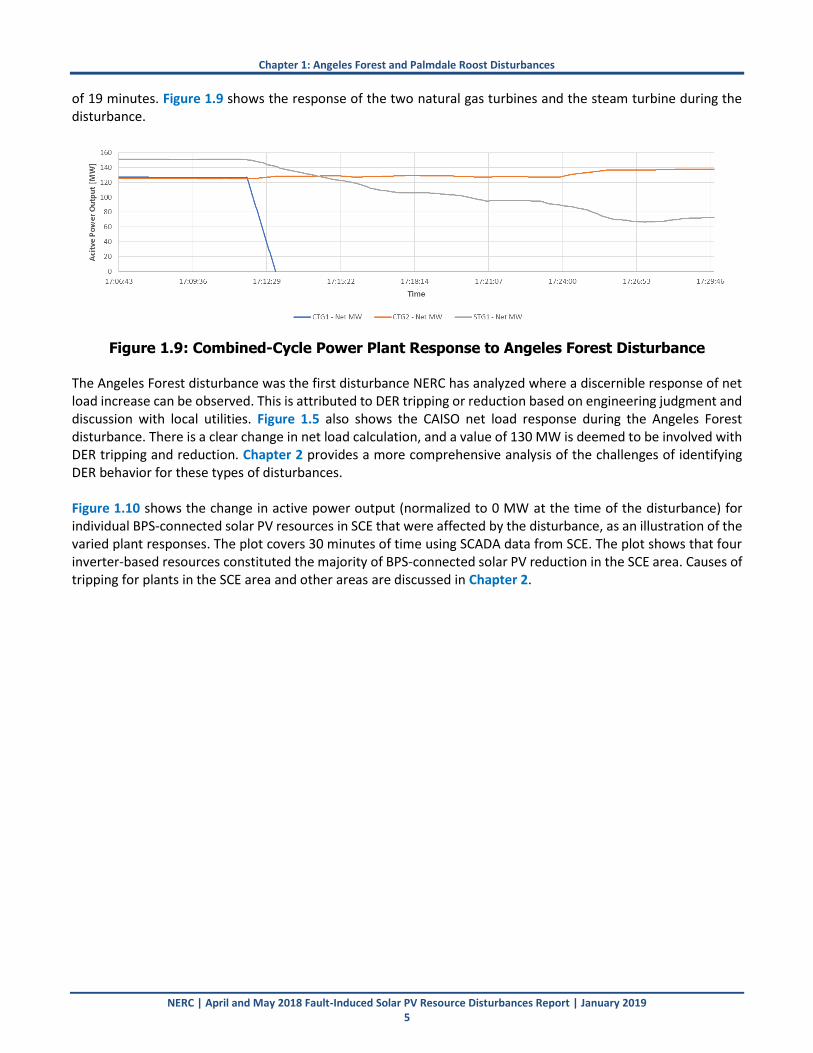
of 19 minutes. Figure 1.9 shows the response of the two natural gas turbines and the steam turbine during the disturbance.
Figure 1.9: Combined-Cycle Power Plant Response to Angeles Forest Disturbance The Angeles Forest disturbance was the first disturbance NERC has analyzed where a discernible response of net load increase can be observed. This is attributed to DER tripping or reduction based on engineering judgment and discussion with local utilities. Figure 1.5 also shows the CAISO net load response during the Angeles Forest disturbance. There is a clear change in net load calculation, and a value of 130 MW is deemed to be involved with DER tripping and reduction. Chapter 2 provides a more comprehensive analysis of the challenges of identifying DER behavior for these types of disturbances. Figure 1.10 shows the change in active power output (normalized to 0 MW at the time of the disturbance) for individual BPS-connected solar PV resources in SCE that were affected by the disturbance, as an illustration of the varied plant responses. The plot covers 30 minutes of time using SCADA data from SCE. The plot shows that four inverter-based resources constituted the majority of BPS-connected solar PV reduction in the SCE area. Causes of tripping for plants in the SCE area and other areas are discussed in Chapter 2.

Chapter 1: Angeles Forest and Palmdale Roost Disturbances
NERC | April and May 2018 Fault-Induced Solar PV Resource Disturbances Report | January 2019 6
Figure 1.10: Affected Solar PV Facilities (SCADA Data) [Source: SCE]
Palmdale Roost Disturbance on May 11, 2018 On May 11, 2018, at 15:20:14 PDT, a fault occurred on a short 500 kV transmission circuit in the SCE footprint near Palmdale, California, and was subsequently coined the “Palmdale Roost” disturbance since the fault was due to bird nesting materials causing a flashover. The B-phase-to-ground (B-N) fault was normally cleared in three cycles. Figures 1.11 and 1.12 show DFR records of line-to-line voltages and line currents at both ends of the faulted circuit.
Figure 1.11: DFR Voltage and Current at One End of Faulted Circuit [Source: SCE]

Chapter 1: Angeles Forest and Palmdale Roost Disturbances
NERC | April and May 2018 Fault-Induced Solar PV Resource Disturbances Report | January 2019 7
Figure 1.12: DFR Voltage and Current at Other End of Faulted Circuit [Source: SCE] This disturbance affected11 generation in CAISO (SCE and PG&E), LADWP, and IID footprints. Figures 1.13 through 1.17 show CAISO, SCE, PG&E, LADWP, and IID BPS-connected solar PV responses during the grid disturbance.12 No noticeable impact to BPS-connected solar PV was observed in SDG&E. The 500 kV transmission line fault resulted in a reduction of BPS-connected solar PV output by 630 MW in CAISO, 48 MW in LADWP footprint, and 33 MW in IID. The Palmdale Roost disturbance, similar to the Angeles Forest disturbance, included a discernible response of net load increase that is attributed to DER tripping or reduction. Figure 1.13 shows CAISO net load response during the Angeles Forest disturbance. There is a clear change in net load calculation, and a value of 100 MW is deemed to be involved with DER tripping and reduction.
Figure 1.13: CAISO BPS-Connected Solar PV and Net Load during Palmdale Roost Disturbance [Source: SCE]
11 No solar PV resources were de-energized as a direct consequence of removing the faulted element from service in this event either. 12 Again, note that SCE and PG&E are within the CAISO BA footprint. The resolution of SCE and PG&E data is slightly higher and therefore picks up a larger change in BPS-connected solar PV output immediately following the fault event (capturing more loss due to momentary cessation).

Chapter 1: Angeles Forest and Palmdale Roost Disturbances
NERC | April and May 2018 Fault-Induced Solar PV Resource Disturbances Report | January 2019 8
Figure 1.14: SCE BPS-Connected Solar PV during Palmdale Roost Disturbance [Source: SCE]
Figure 1.15: PG&E BPS-Connected Solar PV and Net Load during Palmdale Roost Disturbance [Source: PG&E]

Chapter 1: Angeles Forest and Palmdale Roost Disturbances
NERC | April and May 2018 Fault-Induced Solar PV Resource Disturbances Report | January 2019 9
Figure 1.16: LADWP BPS-Connected Solar PV during Palmdale Roost Disturbance [Source: LADWP]
Figure 1.17: IID BPS-Connected Solar PV during Palmdale Roost Disturbance [Source: IID]
Figure 1.18 shows individual BPS-connected solar PV resources that were affected by the disturbance, and their change in active power output from the time of the disturbance (normalized to 0 MW for unit prior to the disturbance). The plot covers 43 minutes of time by using SCADA data from SCE. The plot shows that three inverter-based resources constituted the majority of BPS-connected solar PV reduction in the SCE area. The causes of tripping are discussed in Chapter 2.

Chapter 1: Angeles Forest and Palmdale Roost Disturbances
NERC | April and May 2018 Fault-Induced Solar PV Resource Disturbances Report | January 2019 10
Figure 1.18: Affected Solar PV Facilities (SCADA Data) [Source: SCE]
Additional Information Related to Disturbances Figure 1.19 shows the geographic location of both the Angeles Forest and Palmdale Roost fault to contextualize the geographic region of interest. Both faults were just north of the Los Angeles basin in the SCE footprint. The Blue Cut Fire and Canyon 2 Fire locations are also shown for reference.
Figure 1.19: Map of the Fault Locations [Source: SCE]
Chapter 1: Angeles Forest and Palmdale Roost Disturbances
NERC | April and May 2018 Fault-Induced Solar PV Resource Disturbances Report | January 2019 11
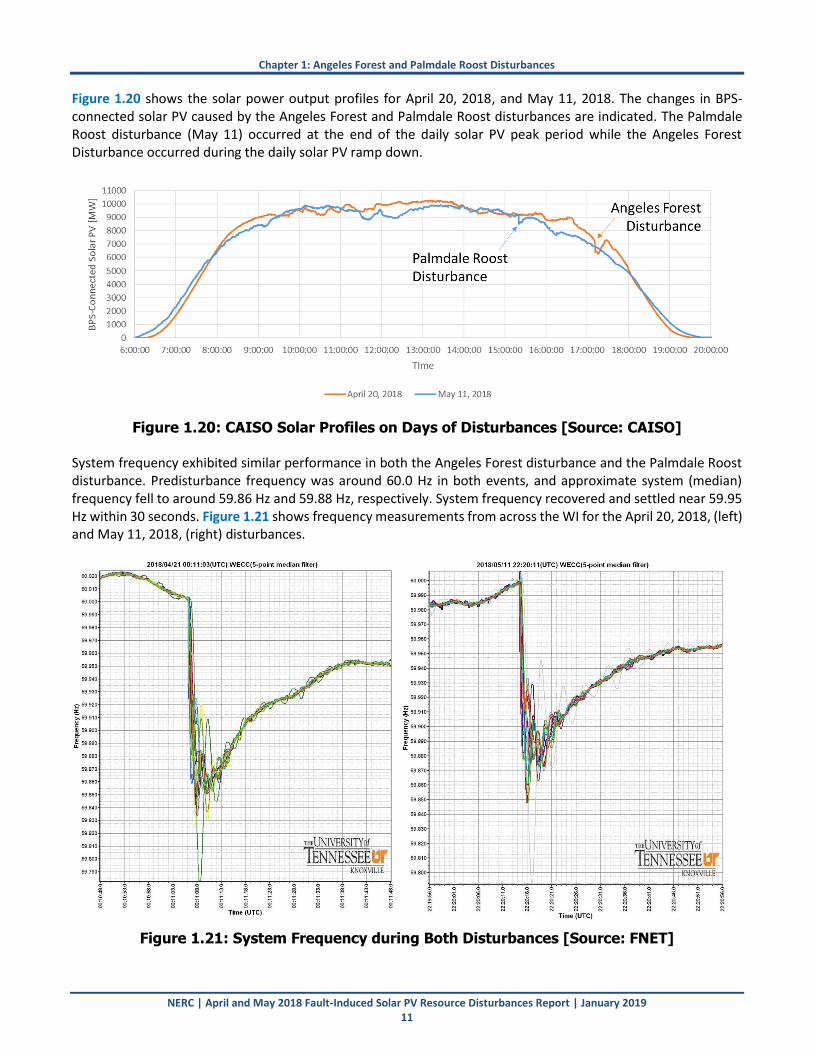
Figure 1.20 shows the solar power output profiles for April 20, 2018, and May 11, 2018. The changes in BPS-connected solar PV caused by the Angeles Forest and Palmdale Roost disturbances are indicated. The Palmdale Roost disturbance (May 11) occurred at the end of the daily solar PV peak period while the Angeles Forest Disturbance occurred during the daily solar PV ramp down.
Figure 1.20: CAISO Solar Profiles on Days of Disturbances [Source: CAISO] System frequency exhibited similar performance in both the Angeles Forest disturbance and the Palmdale Roost disturbance. Predisturbance frequency was around 60.0 Hz in both events, and approximate system (median) frequency fell to around 59.86 Hz and 59.88 Hz, respectively. System frequency recovered and settled near 59.95 Hz within 30 seconds. Figure 1.21 shows frequency measurements from across the WI for the April 20, 2018, (left) and May 11, 2018, (right) disturbances.
Figure 1.21: System Frequency during Both Disturbances [Source: FNET]

Chapter 1: Angeles Forest and Palmdale Roost Disturbances
NERC | April and May 2018 Fault-Induced Solar PV Resource Disturbances Report | January 2019 12
Figure 1.22 shows the CAISO area control error (ACE) for the Angeles Forest disturbance (left) and the Palmdale Roost disturbance (right). ACE is analyzed to ensure that the estimated resource loss size matches reasonably well with the change in ACE at the time of the disturbance. Since these types of disturbances involving solar PV and momentary cessation that can have large fluctuations in active power injection occur across a wide area, the additional data point helps ensure resource loss numbers are reasonable.
Figure 1.22: CAISO ACE during Angeles Forest and Palmdale Roost Disturbances Both disturbances affected multiple footprints in the California area, including SCE, PG&E, CAISO, LADWP, and IID (see Figure 1.23). These entities have all experienced a growth in solar PV penetration that is expected to continue in the near future. At the time of the Angeles Forest Disturbance, CAISO solar PV output was around 7,230 MW with an internal load of 23,500 MW.
Figure 1.23: California Balancing Authority Areas

NERC | April and May 2018 Fault-Induced Solar PV Resource Disturbances Report | January 2019 13
Chapter 2: Detailed Findings from Disturbance Analysis
WECC sent out data requests to all affected generating facilities. Information was collected regarding the primary causes of reduction in output and the inverter characteristics at each site. NERC and WECC Staff, in coordination with the affected entities and TOs, analyzed the information collected. This chapter documents some of the detailed analysis performed and the key findings and recommendations from these analyses.
Continued Use of Momentary Cessation Many plants involved in both the Angeles Forest and Palmdale Roost disturbances exhibited momentary cessation caused by inverter terminal voltage falling below specified low voltage threshold values for each facility. The NERC Alert13 following the Blue Cut Fire recommended that any recovery from momentary cessation should occur within five seconds, which was attributed to ensuring frequency stability for widespread loss of active power by solar PV resources. This recommendation was modified in the NERC Alert14 following the Canyon 2 Fire disturbance. That recommendation stated that GOs should work with their inverter manufacturer(s) to identify changes consistent with equipment capability that can be made to eliminate momentary cessation to the greatest possible extent. For inverters where momentary cessation cannot be eliminated entirely (i.e., by using another form of ride-through mode), GOs were recommended to identify changes that can be made to momentary cessation settings that result in the following:
Reducing the momentary cessation low voltage threshold to the lowest value possible
Increasing the momentary cessation high-voltage threshold to the highest possible value, higher than the NERC Reliability Standard PRC-024-2 voltage ride-through curve levels at minimum
Reducing the recovery delay (time between voltage recovery and start of current injection) to the smallest possible value (i.e., on the order of 1–3 electrical cycles)
Increasing the active power ramp rate upon return from momentary cessation to at least 100 percent per second unless specific reliability studies have demonstrated otherwise.
Figure 2.1 shows the data gathered related to momentary cessation from solar PV resources connected to the BPS. Of the 13,500+ MW of solar PV that provided a response to the NERC Alert, about 9,700 MW currently use momentary cessation. Of that amount of capacity, about 5,200 MW of resources stated they could eliminate momentary cessation and use another form of ride-through. For the remaining approximate 4,500 MW of resources that cannot eliminate momentary cessation, about 2,500 MW use a low-voltage threshold for momentary cessation that is less than or equal to 0.4 pu. About 2,000 MW of solar PV resources use momentary cessation, cannot eliminate its use, and have a low voltage threshold greater than 0.4 pu.
13 Blue Cut Fire Disturbance NERC Alert, June 2017: https://www.nerc.com/pa/rrm/bpsa/Alerts%20DL/NERC%20Alert%20Loss%20of%20Solar%20Resources%20during%20Transmission%20Disturbance.pdf. 14 Canyon 2 Fire Disturbance NERC Alert, May 2018: https://www.nerc.com/pa/rrm/bpsa/Alerts%20DL/NERC_Alert_Loss_of_Solar_Resources_during_Transmission_Disturbance-II_2018.pdf.

Chapter 2: Detailed Findings from Disturbance Analysis
NERC | April and May 2018 Fault-Induced Solar PV Resource Disturbances Report | January 2019 14
Figure 2.1: Data Collected Related to Momentary Cessation The ERO is expecting applicable GOs owning solar PV resources connected to the BPS to implement the recommendations outlined in the NERC Alert. Ideally, the use of momentary cessation will be minimized for existing resources and eliminated for newly interconnecting resources connected to the BPS. The NERC Alert was issued on May 1, 2018, near the time of both disturbances. Therefore, it was not expected that entities had sufficient time to make any substantive changes to their facilities. Many of the affected entities are non-Bulk Electric System (BES) generating resources and may not have received the NERC Alert information since they are not subject to NERC Reliability Standards and may not be NERC registered entities.
Improved Recovery from Momentary Cessation in Some Cases Some plants have made changes based on the recommendations following the Blue Cut Fire and Canyon 2 Fire disturbances. Figure 2.2 shows an example of a solar PV plant that has observed multiple nearby fault events over the last couple years. The plant responds slightly differently to each event; however, the dynamic response to the Angeles Forest disturbance (April 20, 2018) shows improved recovery back to predisturbance output in a relatively quick time frame compared to the prior events. While the delay upon recovery from momentary cessation is still one second (well beyond the time recommended in the NERC Alert following the Canyon 2 Fire disturbance), the interaction between inverter response and the plant-level controller appears to have been mitigated. The GO has made changes to the plant-level controller such that restoration from momentary cessation is not impeded by plant-level controller ramp rates. It appears those corrections have resulted in improved performance returning to predisturbance output. The GO is awaiting approval from their respective PC prior to eliminating momentary cessation (as recommended in the NERC Alert).

Chapter 2: Detailed Findings from Disturbance Analysis
NERC | April and May 2018 Fault-Induced Solar PV Resource Disturbances Report | January 2019 15
Figure 2.2: Improved Recovery from Momentary Cessation
Fault Ride-Through Performance A couple of plants analyzed using DFR data at the POI during the Angeles Forest disturbance exhibited effective fault ride-through performance, including injection of reactive current during on-fault and post-fault conditions. Figure 2.3 shows the voltage, active power, and reactive power at the POI of one large solar PV facility. When the fault occurs, active power drops quickly and reactive power increases. This is caused by the drop in voltage at the time of the fault. Once the fault clears, in approximately three cycles, the active power ramps back up very quickly, and reactive power settles. Post-fault voltage recovery at the POI is very good.
Key Finding: Momentary cessation continues to be an issue during disturbances. Many momentary cessation settings have not been widened from above 1.1 per unit or below 0.9 per unit voltage. The NERC Alert issued on May 1, 2018, and the Canyon 2 Disturbance Report includes three recommendations that address momentary cessation—recommendations 1a, 1b, and 2. Recommendation: GOs, in coordination with their inverter manufacturer(s), should implement the recommended changes to inverter settings and performance as outlined in the NERC Alert following the Canyon 2 Fire disturbance. TPs and PCs should be following up with applicable GOs to ensure that these changes are being made and that models are being updated accordingly to accurately reflect the dynamic behavior of solar PV resources connected to the BPS.

Chapter 2: Detailed Findings from Disturbance Analysis
NERC | April and May 2018 Fault-Induced Solar PV Resource Disturbances Report | January 2019 16
Figure 2.3: Data Collected Related to Momentary Cessation The response of this solar PV resource was cross-checked with the data submitted in response to the NERC Alert, which also stated that momentary cessation is not used, that reactive current injection is used during fault conditions, and that a mixture of active and reactive current is used once voltage returns to within the continuous operating range.
Transient AC Overvoltage and DC Reverse Current Tripping A number of solar PV plants, particularly with one inverter manufacturer, exhibited tripping on transient sub-cycle ac overvoltage. Figure 2.4 shows a high-speed recording from one of the inverters that tripped. The inverter experiences sub-cycle spikes in voltage, particularly during the on-fault conditions (fault inception and fault clearing). Immediately after the fault, the voltage waveform is still somewhat distorted and a slight root-mean-square overvoltage persists. It is unclear, due to lack of time synchronization and data logging resolution, what part of the waveform actually initiated the tripping. However, note that the ac overvoltage instigates the opening of the inverter ac circuit breaker. This does not occur until after the BPS fault is already cleared.
Key Finding: Some solar PV plants are exhibiting forms of fault ride-through that support BPS reliability with active and reactive current injection during and immediately following fault conditions. Recommendation: GOs, in coordination with their inverter manufacturer(s), should implement the recommended changes to inverter settings and performance as outlined in the NERC Alert following the Canyon 2 Fire disturbance.

Chapter 2: Detailed Findings from Disturbance Analysis
NERC | April and May 2018 Fault-Induced Solar PV Resource Disturbances Report | January 2019 17
Figure 2.4: Transient Sub-Cycle AC Overvoltage at Inverter Terminals Transient ac overvoltage may also lead to inverter tripping on dc reverse current. Inverters have anti-parallel diodes across the insulated-gate bipolar transistors (IGBTs), or switches in the power electronics, to mitigate voltage spikes during switching. During normal operation, the inverter balances the ac voltage so as to keep the potential higher on the dc side. Normally, this is not a problem because the maximum ac voltage the inverter can generate is sufficiently lower than the field dc voltage; thus current can flow out to the grid. However, ac transient overvoltage may cause the ac voltage to be greater than the dc voltage. This can lead to current flowing into the dc bus and PV arrays. UL Std. 174115 includes a testing requirement that any reverse current should not exceed the manufacturer’s specification for maximum reverse current. The maximum dc reverse current specification depends on the inverter and is specified by the manufacturer. However, it does not specify a maximum duration and provides sufficient design flexibility that it should be feasible for inverters to not trip due to reverse current during transient ac overvoltages. This issue was identified in the Canyon 2 Fire disturbance, and highlighted in that disturbance report. According to a number of equipment manufacturers, reverse current is not damaging to the inverters, the dc power source, nor the collector systems. Rather, detection and protection of this dc reverse current is used to protect the panels, particularly for local faults in the collector system. However, panels can be rated to at least 1–2 times rated current in the reverse direction. The Canyon 2 Fire disturbance report recommended GOs coordinate with their inverter manufacturers to ensure that dc reverse current detection and protection are set to avoid tripping for dc reverse currents that could result during sub-cycle transient overvoltage conditions since these are not likely to damage any equipment in the plant. Mitigating steps may include increasing the magnitude settings to align with the ratings of the equipment or implementing a short duration to the dc reverse current protection before sending the trip command. Refer to the Canyon 2 Fire disturbance report for more details.16
15 UL 1741, “Standard for Inverters, Converters, Controllers and Interconnection System Equipment for Use with Distributed Energy Resources”: https://standardscatalog.ul.com/standards/en/standard_1741_2. 16 Canyon 2 Fire Disturbance report, February 2018: https://www.nerc.com/pa/rrm/ea/Pages/October-9-2017-Canyon-2-Fire-Disturbance-Report.aspx.

Chapter 2: Detailed Findings from Disturbance Analysis
NERC | April and May 2018 Fault-Induced Solar PV Resource Disturbances Report | January 2019 18
The ac overvoltage condition causes a “minor” fault, and the inverter will automatically restart after a five-minute wait time. The dc reverse current condition causes a fatal error code, and the inverter must be manually reset before restarting. Therefore, any inverter that tripped on dc reverse current did not return to service until the following day due to coordination issues and needing an on-site technician to reset the inverters.
Curtailment Commands from Balancing Authority One solar PV facility reported that the reduction in active power output observed at their facility was caused by a curtailment command received from CAISO’s Automated Dispatch System (ADS). Upon reviewing the active power output and power set point data (See Figure 2.5), it was determined that the curtailment occurred after the fault condition by a couple minutes (assuming aligned time synchronization). Therefore, it was determined that the curtailment command did not contribute to the reduction in solar PV output during the time of the disturbance. However, it did appear strange that the set point command drops from 100 percent to zero percent immediately and remains there for approximately five minutes and then returns to 100 percent. Further, it is unclear what caused the curtailment from the BA and if that was related to the post-fault operating conditions observed by the BA. Therefore, it is recommended that BAs ensure their dispatch and curtailment commands are coordinated appropriately and are particularly able to handle these conditions where a substantial amount of solar PV resources reduce power output for periods of 5–10 minutes. There appears to be some anomalous behavior with automatic generation control (AGC) that has occurred in multiple events immediately after the fault and solar PV reduction conditions.
Figure 2.5: Active Power Output and Set Point at Curtailed Solar PV Facility
Key Finding: Inverter tripping on transient sub-cycle ac overvoltage continues to be an issue. In some cases, this ac overvoltage causes dc reverse current in the inverter, and the inverters may exhibit a fatal error code that requires manual reset at the inverter. Recommendation: GOs should work with their inverter manufacturers to set transient ac overvoltage protection as wide as possible while still protecting the integrity of the inverter and associated equipment. GOs should also coordinate with their inverter manufacturer to ensure that dc reverse current detection and protection are set to avoid tripping for dc reverse currents that could result during sub-cycle transient overvoltage conditions since these are not likely to damage any equipment in the plant.

Chapter 2: Detailed Findings from Disturbance Analysis
NERC | April and May 2018 Fault-Induced Solar PV Resource Disturbances Report | January 2019 19
Partial Tripping and Momentary Cessation Partial tripping or partial momentary cessation refers to situations where a fraction of the total inverters at a given facility trip or enter momentary cessation, respectively. Dispersed power producing resources (i.e., inverter-based resources) commonly exhibit partial tripping or momentary cessation since the terminal voltage conditions at each inverter are slightly different (e.g., due to electrical impedance to the POI, in-plant shunt capacitance, etc.) or if the plant consists of inverters of different vintage or manufacturer. This is particularly noticeable at locations further from the fault location where inverter terminal conditions just barely or nearly reach the threshold values for tripping or momentary cessation.17 In many cases, a fraction of the inverters may trip while the remaining inverters may enter momentary cessation. Figure 2.6 illustrates a plant where 60 percent of the inverters entered momentary cessation while the remaining 40 percent tripped. The response to the Angeles Forest disturbance (April 20, 2018) was compared against the response to the Canyon 2 disturbance (October 9, 2017), and it was observed that the plant exhibited very similar behavior in both events. Figure 2.6 is annotated to illustrate what is happening at the facility during the disturbance, including the following:
1. It is very clear that the active power output following the fault goes to nearly 0 MW and recovers to about 60 percent of the predisturbance output. This matches the fraction of inverters that entered momentary cessation, which is to be expected.
2. The recovery time for that fraction of inverters that entered into momentary cessation was on the order of less than five seconds, according to the recommendation in the NERC Alert following the Blue Cut Fire disturbance. The Generator Operator (GOP) has stated that they are awaiting direction from CAISO, per the NERC Alert following the Canyon 2 Fire disturbance, to eliminate momentary cessation.
3. An approximate 35-second delay then occurs where active power output levels off with the fraction of inverters that recovered from momentary cessation. After 35 seconds or so, the tripped inverters have completed their automatic reset and begin returning to service. These inverters do not have any intentional time delay (e.g., five minutes) before attempting to restore output.
4. The tripped inverters then resume current injection back to predisturbance output based on the ramp rates programmed into the plant-level controller.
Figure 2.6: Partial Tripping and Momentary Cessation during Past Disturbances
17 Whereas, closer to the fault location, the inverter terminal voltage conditions are more likely to reach threshold values since the terminal conditions are more severe closer to the fault.

Chapter 2: Detailed Findings from Disturbance Analysis
NERC | April and May 2018 Fault-Induced Solar PV Resource Disturbances Report | January 2019 20
As mentioned, this type of response and partial tripping of inverters within an inverter-based resource facility can be fairly common during grid disturbances. The NERC Standards Committee approved the SAR submitted by the NERC IRPTF, which includes a line item to address partial tripping of inverter-based resources (and other dispersed power producing resources).
Difference between Inverter Terminal and POI Voltage Two interrelated issues have been observed in all disturbances involving solar PV resources to-date as well as in the data collected from the NERC Alert following the Canyon 2 Fire disturbance. These include the following:
Vastly different operating conditions observed during grid disturbances between the individual inverter terminals and the POI
Voltage protective relay settings that do not account for these differences between terminal and POI voltage
Both of these issues are described in the following sub-sections.
Reported Undervoltage versus Measured POI At least one solar PV plant reported that some of the inverters at the facility tripped on low line-to-line voltage. The GO stated that “SCADA data was not captured with high enough resolution to capture the under-voltage condition” and that the inverter SER logs were the most granular data available. The data loggers reported the following:
Inverter 5-8: 0.6Vpu for 480ms
Inverter 6-7: 0.6Vpu for 345ms
Inverter 7-3: 0.6Vpu for 375ms These voltages and durations appeared to be extremely long since the fault was cleared in less than three cycles. However, insufficient inverter-level point-on-wave data was available to ascertain exactly what was observed at the individual inverters. However, the GO stated that these inverters use large three-phase HVAC18 units for cooling rather than liquid cooling, which could have had an effect on the individual terminal voltages. Motor reacceleration could pull down terminal voltage for some period of time, causing a delayed voltage recovery situation within the plant.
18 Heating, ventilation, and air conditioning (HVAC)
Key Finding: Multiple plants in both the Angeles Forest disturbance and Palmdale Roost disturbance exhibited partial tripping and may have also exhibited momentary cessation for the remaining inverters. This type of performance is fairly common during EHV fault events, particularly for inverter-based resources near the fault location. Recommendation: The NERC IRPTF should review existing NERC Reliability Standards and provide some technical perspectives and guidance as to how partial tripping or partial momentary cessation could be handled. This was highlighted in the NERC IRPTF SAR submitted regarding PRC-024-2 but may be applicable to other NERC Reliability Standards as well.

Chapter 2: Detailed Findings from Disturbance Analysis
NERC | April and May 2018 Fault-Induced Solar PV Resource Disturbances Report | January 2019 21
However, DFR data from the TO was available at the POI for this facility and is shown in Figure 2.7. Line-to-line voltages at the POI dropped to about 0.85 pu for no more than a few milliseconds and voltages returned to predisturbance levels within 100 ms. POI voltages were well within the “No Trip” zone of PRC-024-2. There is a clear difference between observed voltage conditions at the individual inverter terminals and at the POI, yet insufficient data from local inverters continues to hinder comprehensive analysis to identify a root cause.
Figure 2.7: POI Voltage for Plant Reporting Low Voltage Tripping
Inverter Voltage Protective Relay Settings and PRC-024-2 The GO for the plant described in the preceding sub-section stated that the observed local inverter terminal voltage conditions fell outside the PRC-024-2 low voltage curve, and that was the reason for inverter tripping. The GO provided an illustration of these conditions (see Figure 2.8), showing the programmed inverter voltage protective settings and the cumulative voltage observed for inverters 5-8.
Figure 2.8: Illustration of Inverter Terminal Voltage versus PRC-024-2 Voltage Curve

Chapter 2: Detailed Findings from Disturbance Analysis
NERC | April and May 2018 Fault-Induced Solar PV Resource Disturbances Report | January 2019 22
It should be reinforced and clarified that PRC-024-2 Requirement R2 states that generator voltage protective relaying (including protective functions within control systems that directly trip or provide tripping signals to the generator based on voltage inputs) shall be set to “not trip the applicable generating units as a result of a voltage excursion (at the point of interconnection) caused by an event on the transmission system external to the generating plant that remains within the “no trip zone” of PRC-024 Attachment 2.”19 The “Voltage Ride-Through Time Duration Curve” in Attachment 2 (shown in Figure 2.9) also refers to the “POI Voltage (per unit)” on the vertical axis. It is the responsibility of the GO to determine, either through stability studies or engineering calculations, what the appropriate inverter trip settings should be such that they will not trip for voltages at the POI that are within the “No Trip” zone of PRC-024-2. As described above, it appears to be a very common situation that the POI and inverter terminal conditions are significantly different during grid disturbances. Therefore, it is not suitable to simply program the PRC-024-2 voltage curve directly into the inverter protective settings. This leads to a susceptibility for inverter tripping during transient voltage excursions at the time of faults.
Figure 2.9: PRC-024-2 Voltage Curve
19 PRC-024-2, Requirement R2.
Key Finding: Vastly different voltage conditions have been observed during grid disturbances between the individual inverter terminals and the POI. Many existing inverters are programmed with the PRC-024-2 curve settings, and do not account for differences between inverter terminal conditions and the POI. This leads to a susceptibility for inverter tripping and does not meet the intent of PRC-024-2. Recommendation: GOs should be performing analyses for each installation to correctly set inverter protective functions such that all inverters within a facility will not trip for any voltages seen at the POI within the “No Trip” zone of Attachment 2 of PRC-024-2. Setting the inverter protection settings to match the PRC-024-2 curve is not a recommended practice as it does not consider the vastly different voltage conditions that may be experienced at the inverter terminals relative to the POI voltage (as has been observed in multiple disturbance analyses).

Chapter 2: Detailed Findings from Disturbance Analysis
NERC | April and May 2018 Fault-Induced Solar PV Resource Disturbances Report | January 2019 23
Lack of High Resolution Data and Time Stamping Lack of data visibility and poor data quality continue to be a concern for comprehensive event analysis after large BPS disturbances. Lack of high speed data captured at the inverter or plant-level controller hinders a complete analysis of inverter-based resource behavior to BPS fault events. Additionally, low resolution time stamping of inverter SER information also poses a challenge for determining causes and effects of inverter tripping. In many cases, GOs were only able to provide SCADA data with resolution on the order of 5–10 minutes (rather than milliseconds). Multiple facilities did not have sufficient resolution on their inverter SER logs to discern what occurred during the transient grid conditions. Table 2.1 shows an example SER log report from an inverter that tripped during the disturbance. The log is in sequential order of records, which is helpful to understand primary and secondary causes of tripping. However, the time resolution is only to one second. Since the fault cleared in 2.5 cycles (0.042 seconds), this information cannot be compared directly to high speed data recordings. Therefore, it is not possible to draw exact conclusions from the information provided by the GO. High speed data recordings at inverter-based resources, due to the fast nature of their controls and protection, greatly improves the understanding and analysis of these resources. In particular, point-on-wave recording from the inverters, plant-level controller, and POI are the most useful sources of data along with the inverter event records.
Table 2.1: Example Event Log with Low Resolution
EVENT LOG
Date Time Event Item
2018/04/20 16:53:24 DC REV. CURRENT
2018/04/20 16:53:24 INSTANT. AC OV.
2018/03/13 18:31:21 FREQUENCY NORMAL
2018/03/13 18:31:21 NORMAL
2018/03/13 18:31:21 NORMAL
2018/03/13 18:31:20 EXT. MINOR FAULT
2018/03/13 18:31:20 UNDER FREQUENCY
Key Finding: A lack of available high-speed data at multiple inverter-based resources has hindered event analysis. Some data was only time stamped with a resolution of one second or slower, causing issues when trying to identify exact causes of inverter tripping. Recommendation: Each inverter-based resource should have the capability to capture high-speed data from some inverters within the plant during grid events, particularly during large grid disturbances. High-speed data at the plant controller, capturing response at the POI, should also be available. Time stamped SER logs should have at least 1 ms resolution to support event analysis of inverter tripping during BPS fault events. Transmission entities should also consider installing and utilizing DFR data at the POI of inverter-based resources.
Chapter 2: Detailed Findings from Disturbance Analysis
NERC | April and May 2018 Fault-Induced Solar PV Resource Disturbances Report | January 2019 24
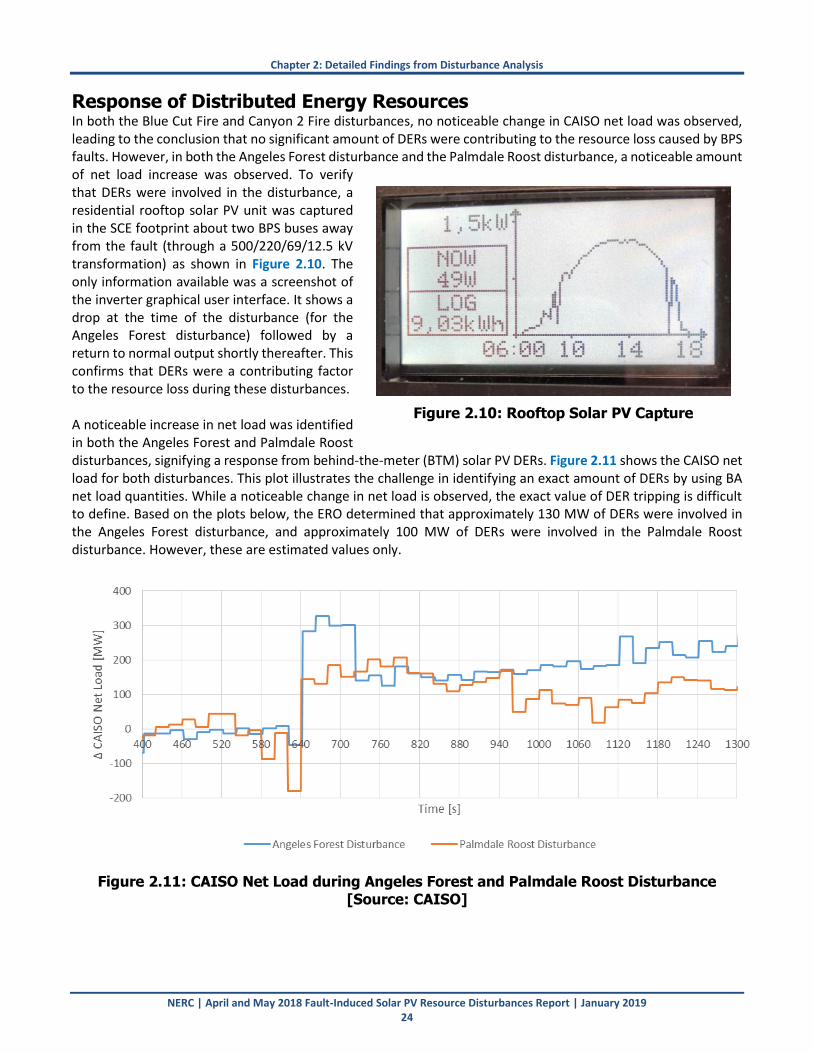
Response of Distributed Energy Resources In both the Blue Cut Fire and Canyon 2 Fire disturbances, no noticeable change in CAISO net load was observed, leading to the conclusion that no significant amount of DERs were contributing to the resource loss caused by BPS faults. However, in both the Angeles Forest disturbance and the Palmdale Roost disturbance, a noticeable amount of net load increase was observed. To verify that DERs were involved in the disturbance, a residential rooftop solar PV unit was captured in the SCE footprint about two BPS buses away from the fault (through a 500/220/69/12.5 kV transformation) as shown in Figure 2.10. The only information available was a screenshot of the inverter graphical user interface. It shows a drop at the time of the disturbance (for the Angeles Forest disturbance) followed by a return to normal output shortly thereafter. This confirms that DERs were a contributing factor to the resource loss during these disturbances. A noticeable increase in net load was identified in both the Angeles Forest and Palmdale Roost disturbances, signifying a response from behind-the-meter (BTM) solar PV DERs. Figure 2.11 shows the CAISO net load for both disturbances. This plot illustrates the challenge in identifying an exact amount of DERs by using BA net load quantities. While a noticeable change in net load is observed, the exact value of DER tripping is difficult to define. Based on the plots below, the ERO determined that approximately 130 MW of DERs were involved in the Angeles Forest disturbance, and approximately 100 MW of DERs were involved in the Palmdale Roost disturbance. However, these are estimated values only.
Figure 2.11: CAISO Net Load during Angeles Forest and Palmdale Roost Disturbance [Source: CAISO]
Figure 2.10: Rooftop Solar PV Capture

Chapter 2: Detailed Findings from Disturbance Analysis
NERC | April and May 2018 Fault-Induced Solar PV Resource Disturbances Report | January 2019 25
SCE also gathered its net load data around the time of the disturbances, as shown in Figure 2.12. This plot, upon first glance, shows a significant amount of DER response within the first few seconds following the event. However, SCE explained that using the area-wide net load plot can lead to false interpretation of DER response during grid events for the following reasons:
The SCADA point used by SCE for area net load does not include sub-transmission generation or any metered20 solar PV in their footprint. However, it does account for the unmetered DERs that are mostly composed of BTM solar PV.
The SCADA point used by SCE for area net load is calculated as the sum of metered generation plus intertie imports, which includes area net load and losses.21 Therefore, the SCADA point does not differentiate between changes in net load and changes in losses.
As with all energy management systems (EMS), the remote terminal units (RTUs) reporting data to the EMS are not time-synchronized. Delays in the incoming data during the disturbance can result in temporary spikes. Fast changes in metered generation (e.g., generator tripping or active power reduction) before refreshed values of intertie flow can cause the calculated load point to change rapidly around fault events. Once the refreshed values are received, the spikes balance out.
For the reasons described above, the spikes in net load were accounted for as calculation errors and variations in system losses and intertie flow changes. The temporary increase within the first tens of seconds after the fault event should not be completely attributed to DER tripping or active power reduction when using area-wide net load SCADA points.
Figure 2.12: SCE Area Net Load Response [Source: SCE] SCE found that the best method to analyze DER response is to monitor the T-D transformer bank flows directly by using SCADA measurements rather than using the calculated area net load value. This is beneficial because it removes the time synchronization issues that occur in the method discussed above. Figure 2.13 (left) shows direct measurements of T-D bank flows in the area around the fault. The significant upward spike does not occur in these measurements as it did in the area-wide calculation. However, it is clear that multiple T-D transformer banks did increase net loading immediately after the fault. These net load increases lasted on the order of five to seven
20 Generally, generation greater than 1 MW is metered by SCE on the distribution, subtransmission, and transmission system. 21 Net Load + Losses = Metered Generation + Intertie Imports

Chapter 2: Detailed Findings from Disturbance Analysis
NERC | April and May 2018 Fault-Induced Solar PV Resource Disturbances Report | January 2019 26
minutes, correlating with the reset times for DER tripping as described in IEEE Std. 1547.22 After that time, the net loading returned back to its original load level (accounting for decrease in solar irradiance during solar PV ramp down in the early evening) in all cases. This method of accounting for DER response is much more accurate and provides a clearer picture of how DERs respond to BPS faults. However, this method is time intensive and difficult to aggregate all individual T-D transformer banks to ascertain a total DER reduction value.
Figure 2.13: SCE (left) and PG&E (right) Individual Load SCADA Points For the Angeles Forest disturbance, PG&E also provided individual T-D transformer net load SCADA points across their footprint. Figure 2.13 (right) also shows that net load remained relatively constant during the disturbance; hence, DERs in the PG&E footprint were likely not involved.
22 IEEE Std. 1547-2003, “IEEE Standard for Interconnecting Distributed Resources with Electric Power Systems”: https://standards.ieee.org/standard/1547-2003.html. IEEE Std. 1547a-2014, “IEEE Standard for Interconnecting Distributed Resources with Electric Power Systems – Amendment 1”: https://standards.ieee.org/standard/1547a-2014.html. IEEE Std. 1547-2018, “IEEE Standard for Interconnection and Interoperability of Distributed Energy Resources with Associated Electric Power Systems Interfaces”: https://standards.ieee.org/standard/1547-2018.html.
Key Finding: Tripping or momentary cessation of DERs was involved in the Angeles Forest and Palmdale Roost disturbances. This is based on anecdotal evidence and analysis of area net load and individual T-D transformer load SCADA points. Increase in net load on the order of 130 MW and 100 MW in the CAISO footprint was observed for the Angeles Forest and Palmdale Roost disturbances, respectively. These are estimated values of DER response since the exact values are not ascertainable. DER response was identified in the SCE footprint; DERs in the PG&E footprint were not affected. Recommendation: TOs, BAs, RCs, and other transmission entities should review load SCADA points following grid disturbances for those load banks that have relatively high penetration of DERs. Individual SCADA points should be used for aggregate of load values rather than using area net load points that may involve other external factors. The NERC SPIDERWG should consider developing more comprehensive guidance on accounting for DERs during BPS disturbances, building off of the examples described herein.

Chapter 2: Detailed Findings from Disturbance Analysis
NERC | April and May 2018 Fault-Induced Solar PV Resource Disturbances Report | January 2019 27
Pacific DC Intertie Performance and RAS Action The Palmdale Roost disturbance was unique in that the PDCI RAS and another BPA RAS were also involved in the disturbance. When the fault occurred in the Southern California area, about 25 miles from the receiving end of the PDCI inverter terminal, voltage fell low enough at the terminal for it to very briefly block firing of the thyristors in the power electronic controls. DC blocking is used to avoid commutation failure on the PDCI, particularly for low voltages at the inverter end. When the fault was detected, the PDCI responded as designed for a temporary fault on the ac side by ceasing thyristor firing and thus blocking current flow; this action occurs within cycles of detecting the low voltage. Once voltage returned to above acceptable levels, the PDCI resumed thyristor firing and returned to predisturbance power flow within approximately 200 ms. The brief blocking of the PDCI, along with the momentary cessation and tripping of solar PV resources in Southern California, caused a moderate pickup of power along the COI. Figure 2.14 shows COI power flow, which is a collection of three ac transmission circuits. Power flow rapidly increased from about 2300 MW to 2900 MW within about one electrical cycle. After fault clearing, the PDCI began recovering active power flow, large synchronous machine inertia in the Pacific Northwest inherently responded, and COI flow reached a maximum flow of around 3500 MW.
Figure 2.14: COI Active Power Pickup during Palmdale Roost Disturbance [Source: BPA] An increase in power flow across large areas of the WI can cause fluctuations in BPS voltages. Buses along the COI are inherently prone to larger fluctuations in voltage since they are in the midpoint of these large power changes. Therefore, the BPA RAS is designed to autonomously act to maintain transient voltage stability and support these large power swings. Figure 2.15 shows a COI 500 kV bus voltage during the disturbance. Bus voltage was initially around 540 kV prior to the disturbance. Immediately after the fault and a large power fluctuation, COI voltage dropped on the initial swing to a value of 520 kV. Voltages fell below a predetermined threshold value for a sufficient period of time such that the BPA RAS initiated removal of shunt reactors that were in-service and insertion of series capacitors along the COI corridor. These actions of the BPA RAS operated as designed, and are not related to blocking of the PDCI (other than the impacts of the additional change in COI flow due to PDCI blocking). The PDCI also has a gen drop associated with its tripping, but the gen drop was not armed due to low power transfer levels and gen drop is not initiated for temporary blocking conditions.

Chapter 2: Detailed Findings from Disturbance Analysis
NERC | April and May 2018 Fault-Induced Solar PV Resource Disturbances Report | January 2019 28
Figure 2.15: COI Bus Voltage during Palmdale Roost Disturbance [Source: BPA]
Combustion Turbine Trip during Disturbance During the Angeles Forest disturbance, one CT at a 2-on-1 (two natural gas turbines and a steam turbine) combined-cycle power plant located in Kern County (PG&E footprint) tripped off-line. The CT generator was loaded at about 125 MW at the time. In response to the combustion turbine trip, the steam generator reduced output from 150 MW to 75 MW over a period of 19 minutes due to reduced steam. Overall, the plant reduced output by 200 MW. Figure 2.16 shows plots of CT1 and CT2 response provided by the GO with both units changing power output during the fault and then responding to the underfrequency. However, CT1 tripped shortly after the disturbance. The plant reported that the CT tripped when a “LOW FUEL GAS PRESSURE – TRIP” alarm initiated. The first alarm that populated was a “DWATT SENSOR FAILURE.” The CT generator response to the disturbance was a spike in MW output from 130 MW to 175 MW that occurred very briefly during the fault. This spike in output caused the turbine control system to declare that both generator
Key Finding: The PDCI experienced temporary blocking to avoid commutation failure during the Palmdale Roost fault near the inverter terminal of the PDCI. The large change in power flows across the WI initiated the BPA RAS due to detected drop in voltage along the COI. Both of these actions operated as designed to support BPS reliability. However, the impacts of these actions along with BPS solar PV use of momentary cessation has likely not been sufficiently studied by TPs and PCs. Recommendation: TPs and PCs in the WI should ensure that momentary cessation of BPS-connected solar PV is modeled correctly along with accurate modeling of the PDCI blocking. Fault events in the Southern California area should be further studied by applicable TPs and PCs as well as the NERC IRPTF to ensure stable operation with the combination of all control actions modeled correctly.

Chapter 2: Detailed Findings from Disturbance Analysis
NERC | April and May 2018 Fault-Induced Solar PV Resource Disturbances Report | January 2019 29
power output signals “failed.” When both power output signals are failed simultaneously, the turbine control system initiates runback to a safe operating level (16 MW, in this case). This reduced output results in the turbine control system decreasing the number of burners being utilized in the turbine combustor, which results in the burners actually being required to pass more fuel than when the unit is at full load. The turbine control system determined that the fuel pressure was too low to sustain the required natural gas flow through the reduced amount of burners being utilized at the lower output level. The turbine control system then initiated a low fuel pressure trip.
Figure 2.16: Gas Turbine Responses at Tripped Combined-Cycle Plant
Key Finding: The combined-cycle power plant tripped due to low fuel gas pressure as the turbine control system attempted to readjust the number of burners used as the plant initiated a runback of active power output. One CT tripped, causing the steam turbine to also reduce output over many minutes. Recommendation: The GO for this facility should coordinate with the turbine manufacturer to ensure that the turbine controls are correctly tuned to be able to ride through BPS fault disturbances.

NERC | April and May 2018 Fault-Induced Solar PV Resource Disturbances Report | January 2019 30
Appendix A: List of Acronyms
Acronym/Term Definition
ac Active Current
ACE Area Control Error
ADS Automatic Dispatch System
AGC Automatic Generation Control
BA Balancing Authority
BAA Balancing Authority Area
BES Bulk Electric System
BPS Bulk Power System
BTM Behind the Meter
CAISO California Independent System Operator
CCVT Capacitance Coupled Voltage Transformers
COI California-Oregon Intertie
CT Combustion Turbine
dc Direct Current
DER Distributed Energy Resource
DFR Digital Fault Recorder
EHV Extra High Voltage
EMS Energy Management System
ERO Electric Reliability Organization
FERC Federal Energy Regulatory Commission
GO Generator Owner
GOP Generator Operator
IEEE Institute of Electrical and Electronic Engineers
IGBT Insulated-Gate Bipolar Transistors
IID Imperial Irrigation District
IRPTF Inverter-Based Resources Performance Task Force
LADWP Los Angeles Department of Water and Power
MW Megawatt
NERC North American Electric Reliability Corporation
PC Planning Coordinator
PDCI Pacific DC Intertie
PG&E Pacific Gas and Electric
POI Point of Interconnection
pu Per Unit
PV Photovoltaic
RC Reliability Coordinator
RAS Remedial Action Scheme
RE Regional Entity
RLC Resistance-Inductance-Capacitance
RTU Remote Terminal Unit
SAR Standard Authorization Request
SCADA Supervisory Control and Data Acquisition
SCE Southern California Edison
SDG&E San Diego Gas and Electric
SER Sequence of Events Recorder

Appendix A: List of Acronyms
NERC | April and May 2018 Fault-Induced Solar PV Resource Disturbances Report | January 2019 31
Acronym/Term Definition
SPIDERWG System Planning Impacts of Distributed Energy Resources Working Group
TO Transmission Owner
T-D Transmission-Distribution
TP Transmission Planner
WI Western Interconnection

NERC | April and May 2018 Fault-Induced Solar PV Resource Disturbances Report | January 2019 32
Appendix B: Disturbance Analysis Teams
These disturbances were analyzed by the following individuals. NERC gratefully acknowledges WECC, Southern California Edison, Pacific Gas & Electric, California ISO, and the affected Generator Owners and Generator Operators. The coordination between all affected entities was crucial to identifying the key findings and developing recommendations for improved performance. NERC would also like to acknowledge the continued engagement and support of the inverter manufacturers to ensure that the mitigating measures being developed are pragmatic. Lastly, all members of the NERC Inverter-Based Resource Performance Task Force (IRPTF) continue to help support NERC in its mission to ensure reliability, particularly faced with rapidly changing technology and grid performance characteristics.
Name Company Rich Bauer North American Electric Reliability Corporation
James Merlo North American Electric Reliability Corporation
Ryan Quint North American Electric Reliability Corporation
Jule Tate North American Electric Reliability Corporation
Steve Ashbaker Western Electricity Coordinating Council
Katie Iversen Western Electricity Coordinating Council
Evan Paull Western Electricity Coordinating Council
Dan Goodrich Bonneville Power Administration
Lou Fonte California Independent System Operator
Songzhe Zhu California Independent System Operator
Paul Rodriguez Imperial Irrigation District
Robert Kerrigan Los Angeles Department of Water and Power
Michael Detmers Pacific Gas and Electric
Ron Markham Pacific Gas and Electric
David Piper Southern California Edison