
AppsensePM
16
AppSense Performance Manager Memory Control and Optimization Whitepaper
-
Upload
james-gregory -
Category
Documents
-
view
78 -
download
0
Transcript of AppsensePM
AppSense Performance Manager Memory Control and Optimization
Whitepaper
2
ContentsGlossary 3
Introduction 4
Physical Memory Control 5
Physical Memory Limits 5
Physical Memory Trimming 7
Virtual Memory Control 9
Application Memory Limits 9
User Memory Limits 9
Virtual Memory Optimizer 10
Overview 10
Dynamic Link Library Loading 10
Optimizer Components 11
Optimizing Signed Components 13
Optimizing Network Components 13
Caching Unoptimized Network Components 13
Obsolete Files and the Cleanup Process 13
Notes on System Resource Utilization 14
Conclusion 15
3
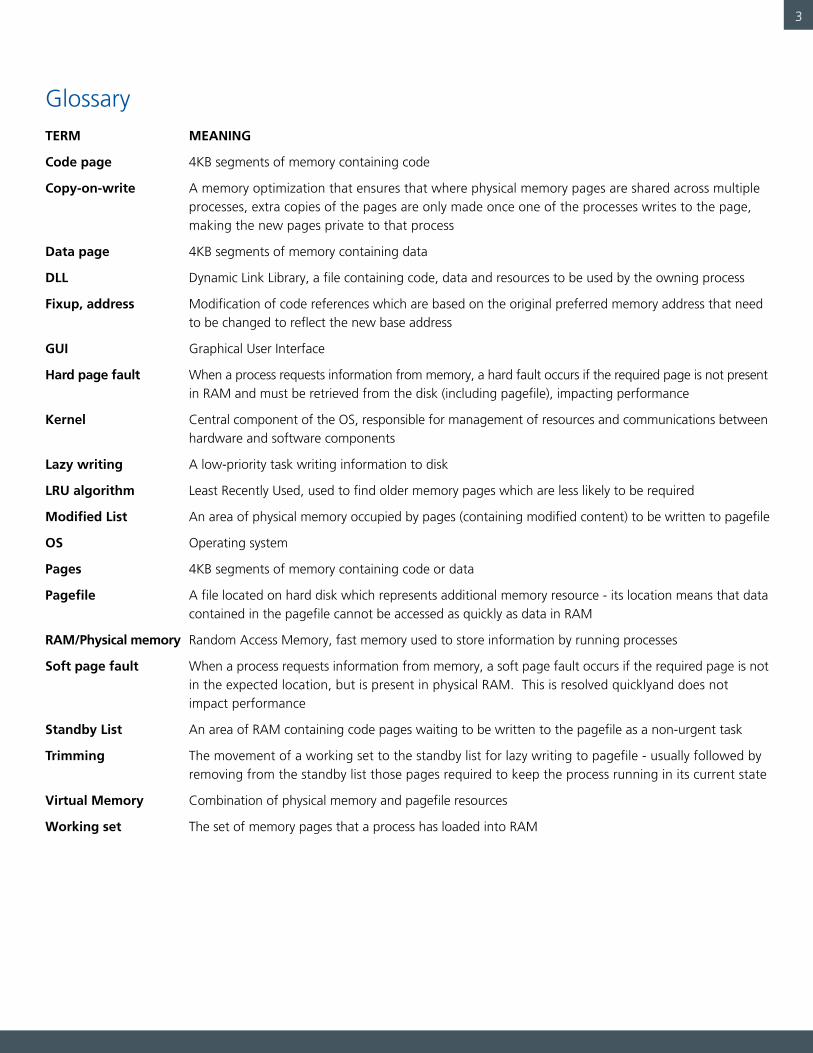
GlossaryTERM MEANING
Code page 4KB segments of memory containing code
Copy-on-write A memory optimization that ensures that where physical memory pages are shared across multiple processes, extra copies of the pages are only made once one of the processes writes to the page, making the new pages private to that process
Data page 4KB segments of memory containing data
DLL Dynamic Link Library, a file containing code, data and resources to be used by the owning process
Fixup, address Modification of code references which are based on the original preferred memory address that need to be changed to reflect the new base address
GUI Graphical User Interface
Hard page fault When a process requests information from memory, a hard fault occurs if the required page is not present in RAM and must be retrieved from the disk (including pagefile), impacting performance
Kernel Central component of the OS, responsible for management of resources and communications between hardware and software components
Lazy writing A low-priority task writing information to disk
LRU algorithm Least Recently Used, used to find older memory pages which are less likely to be required
Modified List An area of physical memory occupied by pages (containing modified content) to be written to pagefile
OS Operating system
Pages 4KB segments of memory containing code or data
Pagefile A file located on hard disk which represents additional memory resource - its location means that data contained in the pagefile cannot be accessed as quickly as data in RAM
RAM/Physical memory Random Access Memory, fast memory used to store information by running processes
Soft page fault When a process requests information from memory, a soft page fault occurs if the required page is not in the expected location, but is present in physical RAM. This is resolved quicklyand does not impact performance
Standby List An area of RAM containing code pages waiting to be written to the pagefile as a non-urgent task
Trimming The movement of a working set to the standby list for lazy writing to pagefile - usually followed by removing from the standby list those pages required to keep the process running in its current state
Virtual Memory Combination of physical memory and pagefile resources
Working set The set of memory pages that a process has loaded into RAM
4
Introduction
This document is intended to detail the features within AppSense Performance Manager specific to management of available memory resources on a server or workstation. This functionality is divided into three main areas:
Physical Memory Control
Virtual Memory Limits
Memory Optimization
Each of these functional areas will be explored to explain how the features actually work. This document is not intended to describe how the features are configured or to detail best practices. In addition, descriptions of computer architecture or functionality are not intended as comprehensive explanations of each topic, but merely working examples of how AppSense Performance Manager interacts with the Windows memory manager and associated components. For instance, memory pages are described as being 4KB in size, omitting the ability of Windows to utilize large memory pages or of the different page sizes used in 64-bit computing.
5
Physical Memory Control
The physical memory features of AppSense Performance Manager can be managed by the AppSense Performance Manager console.
AppSense Performance Manager Physical Memory Control functionality is designed to manage the working sets for processes running on the system. ‘Microsoft Windows Internals, Fourth Edition, Russinovich & Solomon, MS Press’ describes a working set as ‘the subset of a process’s virtual address space that is physically resident’. A more easily applied description is that the working set of a process is the set of memory pages that a process has loaded into RAM. Working Sets are managed by Microsoft’s working set manager, which is a kernel-mode system thread running as part of the Windows memory manager.
The physical memory control functionality within AppSense Performance Manager can be divided into two main areas:
Physical Memory Limits Physical Memory Trimming
Physical Memory Limits
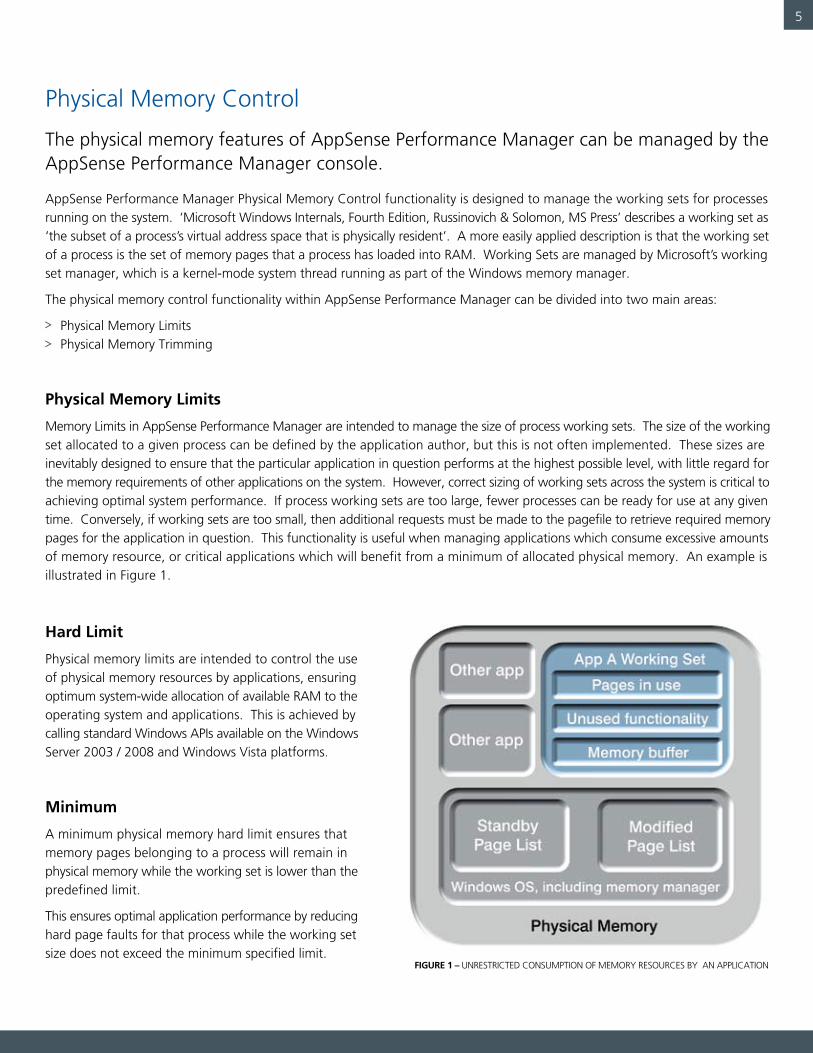
Memory Limits in AppSense Performance Manager are intended to manage the size of process working sets. The size of the working set allocated to a given process can be defined by the application author, but this is not often implemented. These sizes are inevitably designed to ensure that the particular application in question performs at the highest possible level, with little regard for the memory requirements of other applications on the system. However, correct sizing of working sets across the system is critical to achieving optimal system performance. If process working sets are too large, fewer processes can be ready for use at any given time. Conversely, if working sets are too small, then additional requests must be made to the pagefile to retrieve required memory pages for the application in question. This functionality is useful when managing applications which consume excessive amounts of memory resource, or critical applications which will benefit from a minimum of allocated physical memory. An example is illustrated in Figure 1.
FIGURE 1 – UNRESTRICTED CONSUMPTION OF MEMORy RESOURCES By AN APPLICATION
Hard Limit
Physical memory limits are intended to control the use of physical memory resources by applications, ensuring optimum system-wide allocation of available RAM to the operating system and applications. This is achieved by calling standard Windows APIs available on the Windows Server 2003 / 2008 and Windows Vista platforms.
Minimum
A minimum physical memory hard limit ensures that memory pages belonging to a process will remain in physical memory while the working set is lower than the predefined limit.
This ensures optimal application performance by reducing hard page faults for that process while the working set size does not exceed the minimum specified limit.
6
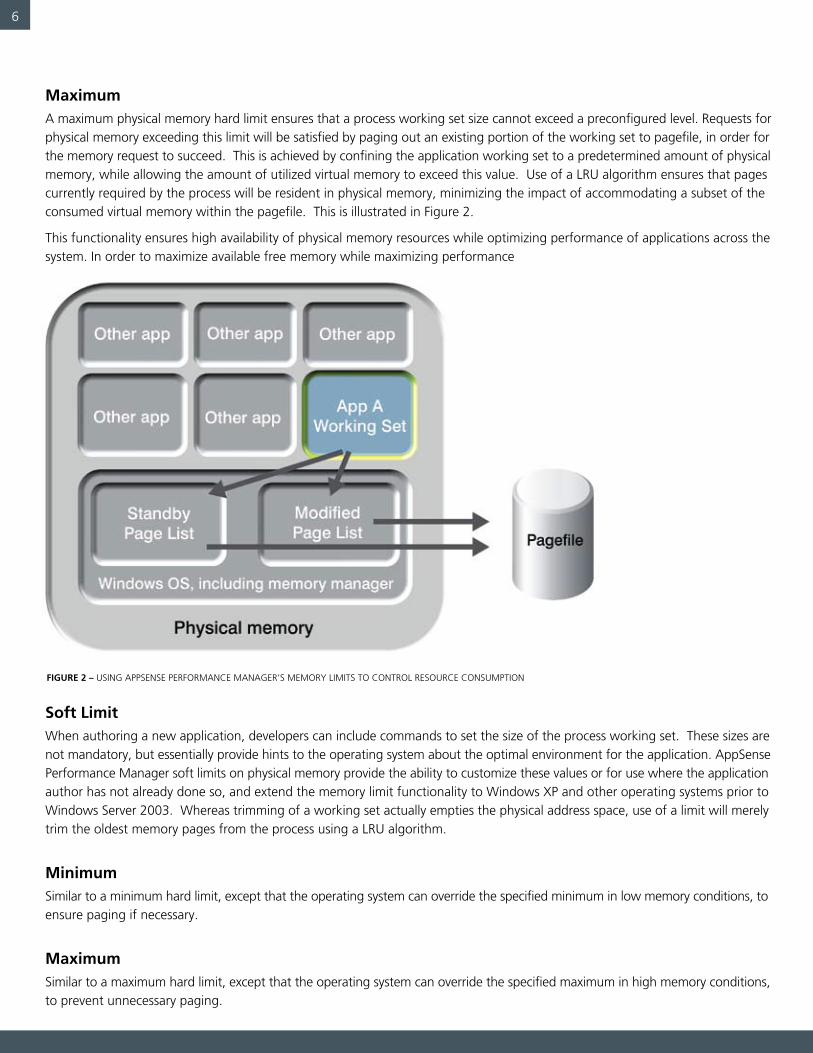
MaximumA maximum physical memory hard limit ensures that a process working set size cannot exceed a preconfigured level. Requests for physical memory exceeding this limit will be satisfied by paging out an existing portion of the working set to pagefile, in order for the memory request to succeed. This is achieved by confining the application working set to a predetermined amount of physical memory, while allowing the amount of utilized virtual memory to exceed this value. Use of a LRU algorithm ensures that pages currently required by the process will be resident in physical memory, minimizing the impact of accommodating a subset of the consumed virtual memory within the pagefile. This is illustrated in Figure 2.
This functionality ensures high availability of physical memory resources while optimizing performance of applications across the system. In order to maximize available free memory while maximizing performance
Soft LimitWhen authoring a new application, developers can include commands to set the size of the process working set. These sizes are not mandatory, but essentially provide hints to the operating system about the optimal environment for the application. AppSense Performance Manager soft limits on physical memory provide the ability to customize these values or for use where the application author has not already done so, and extend the memory limit functionality to Windows XP and other operating systems prior to Windows Server 2003. Whereas trimming of a working set actually empties the physical address space, use of a limit will merely trim the oldest memory pages from the process using a LRU algorithm.
MinimumSimilar to a minimum hard limit, except that the operating system can override the specified minimum in low memory conditions, to ensure paging if necessary.
MaximumSimilar to a maximum hard limit, except that the operating system can override the specified maximum in high memory conditions, to prevent unnecessary paging.
FIGURE 2 – USING APPSENSE PERFORMANCE MANAGER’S MEMORy LIMITS TO CONTROL RESOURCE CONSUMPTION
7
Physical Memory Trimming
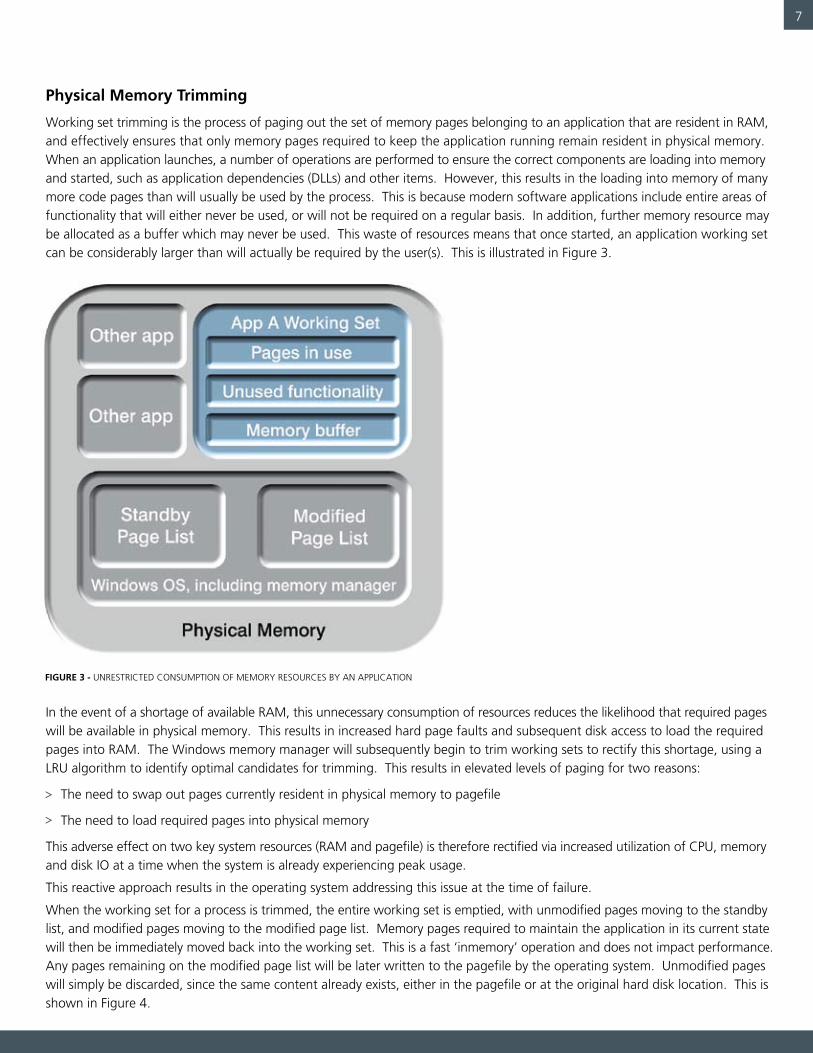
Working set trimming is the process of paging out the set of memory pages belonging to an application that are resident in RAM, and effectively ensures that only memory pages required to keep the application running remain resident in physical memory. When an application launches, a number of operations are performed to ensure the correct components are loading into memory and started, such as application dependencies (DLLs) and other items. However, this results in the loading into memory of many more code pages than will usually be used by the process. This is because modern software applications include entire areas of functionality that will either never be used, or will not be required on a regular basis. In addition, further memory resource may be allocated as a buffer which may never be used. This waste of resources means that once started, an application working set can be considerably larger than will actually be required by the user(s). This is illustrated in Figure 3.
In the event of a shortage of available RAM, this unnecessary consumption of resources reduces the likelihood that required pages will be available in physical memory. This results in increased hard page faults and subsequent disk access to load the required pages into RAM. The Windows memory manager will subsequently begin to trim working sets to rectify this shortage, using a LRU algorithm to identify optimal candidates for trimming. This results in elevated levels of paging for two reasons:
The need to swap out pages currently resident in physical memory to pagefile
The need to load required pages into physical memory
This adverse effect on two key system resources (RAM and pagefile) is therefore rectified via increased utilization of CPU, memory and disk IO at a time when the system is already experiencing peak usage.
This reactive approach results in the operating system addressing this issue at the time of failure.
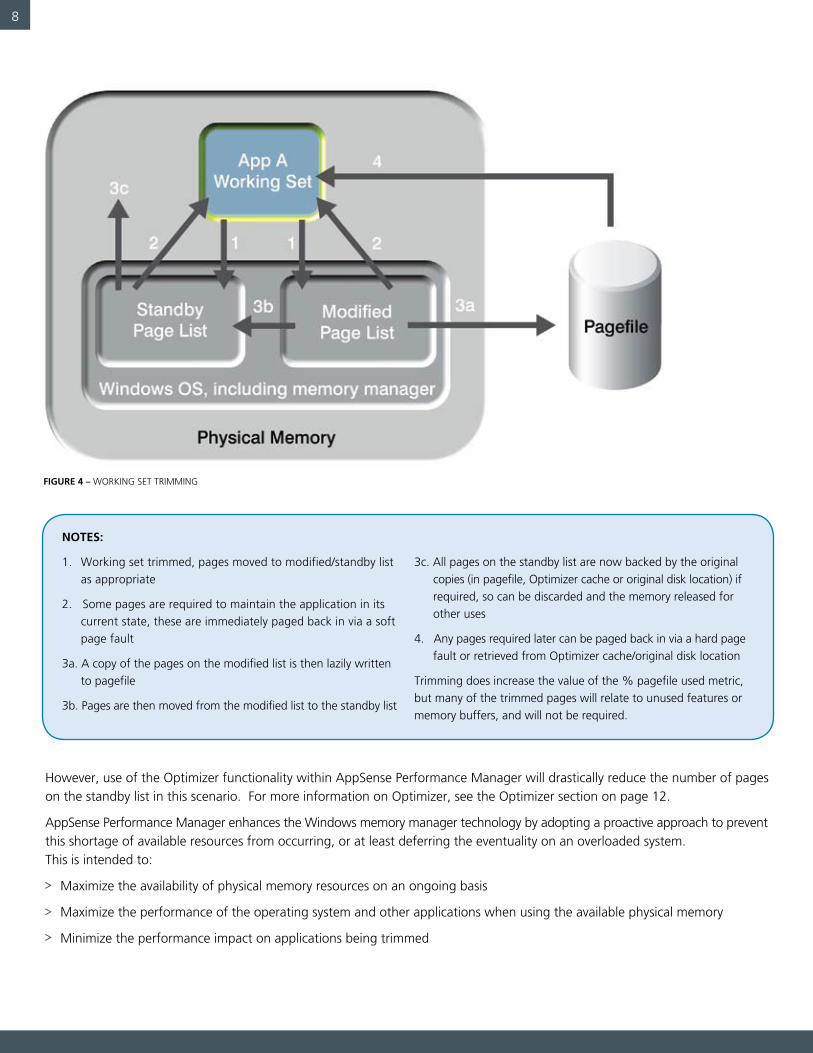
When the working set for a process is trimmed, the entire working set is emptied, with unmodified pages moving to the standby list, and modified pages moving to the modified page list. Memory pages required to maintain the application in its current state will then be immediately moved back into the working set. This is a fast ‘inmemory’ operation and does not impact performance. Any pages remaining on the modified page list will be later written to the pagefile by the operating system. Unmodified pages will simply be discarded, since the same content already exists, either in the pagefile or at the original hard disk location. This is shown in Figure 4.
FIGURE 3 - UNRESTRICTED CONSUMPTION OF MEMORy RESOURCES By AN APPLICATION
8
NOTES:
1. Working set trimmed, pages moved to modified/standby list as appropriate
2. Some pages are required to maintain the application in its current state, these are immediately paged back in via a soft page fault
3a. A copy of the pages on the modified list is then lazily written to pagefile
3b. Pages are then moved from the modified list to the standby list
3c. All pages on the standby list are now backed by the original copies (in pagefile, Optimizer cache or original disk location) if required, so can be discarded and the memory released for other uses
4. Any pages required later can be paged back in via a hard page fault or retrieved from Optimizer cache/original disk location
Trimming does increase the value of the % pagefile used metric, but many of the trimmed pages will relate to unused features or memory buffers, and will not be required.
However, use of the Optimizer functionality within AppSense Performance Manager will drastically reduce the number of pages on the standby list in this scenario. For more information on Optimizer, see the Optimizer section on page 12.
AppSense Performance Manager enhances the Windows memory manager technology by adopting a proactive approach to prevent this shortage of available resources from occurring, or at least deferring the eventuality on an overloaded system. This is intended to:
Maximize the availability of physical memory resources on an ongoing basis
Maximize the performance of the operating system and other applications when using the available physical memory
Minimize the performance impact on applications being trimmed
FIGURE 4 – WORKING SET TRIMMING
9
AppSense Performance Manager utilizes the same standard APIs as the Windows memory manager to manipulate use of the available system resources and maximize the available physical memory, using the following criteria:
On application startup As described above, once an application has launched, the working set is generally larger than is required. The ‘Reduce on startup’ feature monitors the application to ensure that the launch has completed and the application has entered a stable state (consumption of less than 2% CPU for 2 seconds) before trimming the working set. This has the effect of swapping memory pages dedicated to unused functionality within the application. Otherwise, the relevant information is written to the pagefile and can be recalled later if necessary.
Process working sets can also be trimmed depending on the state of the application, sessions or desktop, such as: Window Position (Any, Minimized, Not Minimized, Foreground, Background)
Session (Any, Connected, Not Connected)
Session Idle (Any, Idle, Not Idle)
Desktop (Any, Locked, Unlocked)
The idle state requires no keyboard or mouse activity for a specified time before activating. Prior to version 7.1, the default idle time was 30 seconds. In version 7.2 this has been increased to 600 seconds (10 minutes). This value can be modified by configuring the following registry key to the appropriate number of seconds: REG_DWORD - HKLM\Software\AppSense Technologies\ Performance Manager\Core\Session Idle Time. Within version 8.0 the idle time (default 900 seconds = 15 minutes) can be configured within the AppSense Performance Manager Console - Options - General (Session Idle Timeout) area.
Virtual Memory Control
AppSense Performance Manager virtual memory functionality provides application and user memory limits.
Application Memory LimitsApplication Memory Limits prevent individual processes from monopolizing virtual memory. The threshold is individual to each instance of the application and once reached the system is able to close the application to free up virtual memory. Application Memory Limits offer two modes of operation; hard and soft limits.
Hard LimitA hard memory limit restricts the application instance to the specified virtual memory allocation, denying any more virtual memory beyond that specified. This ensures that no single process can use up all of the virtual memory available and thus helps to ensure that each process has access to a suitable amount of virtual memory. Prior to activating this feature, the implications of refusing memory requests for the specific applications concerned should be understood to avoid unexpected consequences.
Soft LimitA soft memory limit manages consumption of virtual memory resources by issuing a message to the user, and optionally a ‘close’ command to the application instance after it has breached the specified limit for a specified period of time. This close command is similar to using the normal application ‘exit’ command and allows the user to save the contents of the application. Should the application instance continue to consume more memory than specified, and not close as requested, a configuration option is available to ‘terminate’ or issue a forced close to the application instance after an additional period of time.
10
Virtual Memory OptimizerOverview
Most applications are not designed and developed with optimal memory resource utilization in mind, which can lead to performance and functionality problems when they are deployed in production environments. Even if an application functions correctly, it is rare that it has been optimized to make the most efficient use of the available memory resources. These inefficiencies can have a severe effect on user experience and overall system performance.
The AppSense Performance Manager Optimizer functionality addresses this by managing allocations of virtual memory space when loading Dynamic Link Libraries (DLLs).
Dynamic Link Library Loading
Many business applications require multiple DLLs to be loaded to provide their functionality. A DLL is simply a collection of code, data or resources which provide the application with access to the operating system services or additional application functionality. Common system service DLLs such as kernel32.dll and user32.dll provide access to the Windows kernel objects and GUI components. In addition, application and vendor specific DLLs are usually loaded, to provide common application functionality. ActiveX controls (OCX) and Control Panel Applets (CPL) are examples of specialized DLL versions.
When a DLL is loaded, the read-only code segment can usually be shared within physical memory by all processes that require it, avoiding duplication in physical memory. Only the data sections in a DLL need to be private to each application instance, as this content may change from one instance to the next. This is achieved by marking the physical memory pages as with copy-on-write protection to ensure that private copies will be made if any process attempts to write to the existing pages.
In the 32-bit version of Windows Server 2003, each process has a 4GB virtual address range. Most of the lower 2GB address range is available for code and user data, and is private to each process. With the exception of a few system DLLs, each DLL is loaded into the lower 2GB address range. If the preferred load address of a DLL would cause it to load into a set of memory pages which are not free, then a load address collision occurs. The operating system must relocate the code pages containing the DLL to an alternative address, which requires address fixups to be performed on each of the code pages. Note that the fixups are performed at the code page level rather than the section (or file) level. The process of performing fixups not only results in a slower load time, but also causes an increase in pagefile usage.
Normally when a DLL loads, a memory section is created, which is backed by the DLL image file on disk. When code pages containing the DLL are removed from an application’s working set, they can be retrieved later from the original DLL file on disk when required. However, if address fixups have been performed by the operating system to relocate the code pages containing the DLL, the act of marking the file as copy-on-write means that the file has been modified, so the original DLL file on disk can no longer be used for this purpose.
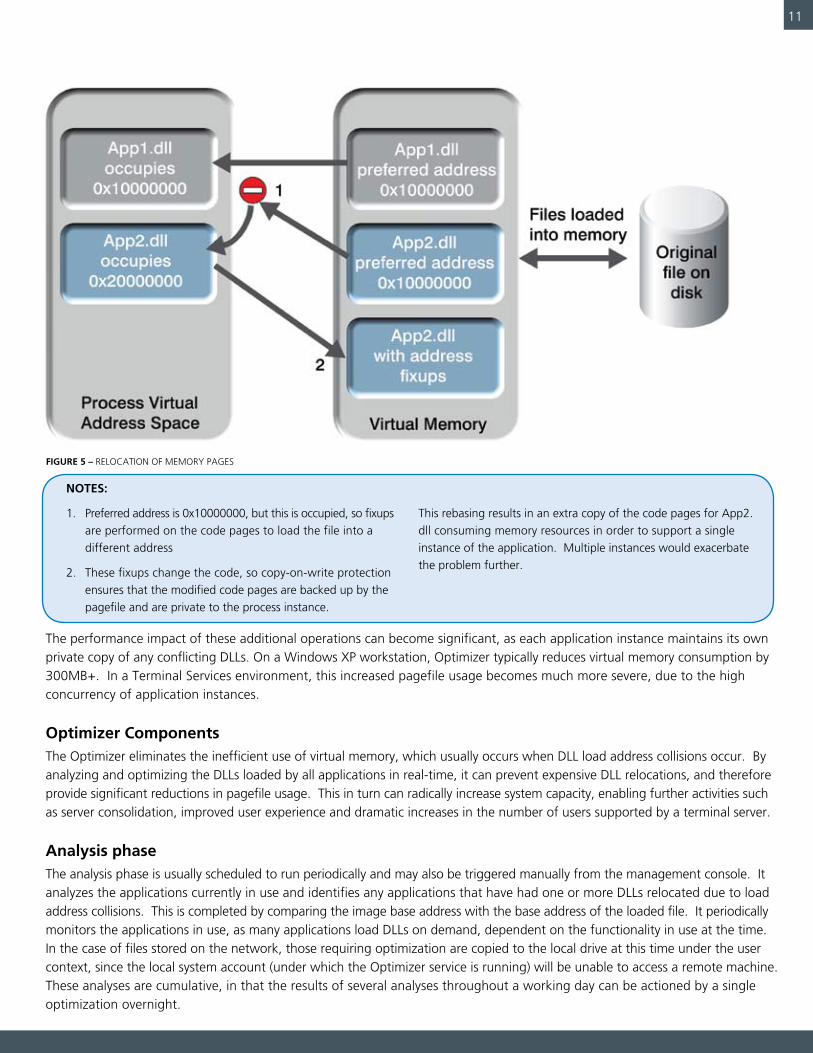
The operating system copes with the problem of load address collisions by initially making code pages read/write. If the OS needs to relocate a DLL then the code pages are modified with the address fixups, with a duplicate written to the system pagefile, since the DLL is no longer the same as the original DLL file on disk. This is illustrated in Figure 5.
User Memory LimitsThis allows limits on virtual memory to be applied to users and groups. This feature does not prevent any open applications from consuming additional memory, but instead ensures that once the defined limit has been reached for the session, no further applications can be launched until the memory usage is brought back under the defined limit. Exceptions can be set up where, even if user limits have been reached, these applications will still launch, ensuring mission critical applications or troubleshooting tasks can always run.
11
FIGURE 5 – RELOCATION OF MEMORy PAGES
NOTES:
1. Preferred address is 0x10000000, but this is occupied, so fixups are performed on the code pages to load the file into a different address
2. These fixups change the code, so copy-on-write protection ensures that the modified code pages are backed up by the pagefile and are private to the process instance.
This rebasing results in an extra copy of the code pages for App2.dll consuming memory resources in order to support a single instance of the application. Multiple instances would exacerbate the problem further.
The performance impact of these additional operations can become significant, as each application instance maintains its own private copy of any conflicting DLLs. On a Windows XP workstation, Optimizer typically reduces virtual memory consumption by 300MB+. In a Terminal Services environment, this increased pagefile usage becomes much more severe, due to the high concurrency of application instances.
Optimizer ComponentsThe Optimizer eliminates the inefficient use of virtual memory, which usually occurs when DLL load address collisions occur. By analyzing and optimizing the DLLs loaded by all applications in real-time, it can prevent expensive DLL relocations, and therefore provide significant reductions in pagefile usage. This in turn can radically increase system capacity, enabling further activities such as server consolidation, improved user experience and dramatic increases in the number of users supported by a terminal server.
Analysis phaseThe analysis phase is usually scheduled to run periodically and may also be triggered manually from the management console. It analyzes the applications currently in use and identifies any applications that have had one or more DLLs relocated due to load address collisions. This is completed by comparing the image base address with the base address of the loaded file. It periodically monitors the applications in use, as many applications load DLLs on demand, dependent on the functionality in use at the time. In the case of files stored on the network, those requiring optimization are copied to the local drive at this time under the user context, since the local system account (under which the Optimizer service is running) will be unable to access a remote machine. These analyses are cumulative, in that the results of several analyses throughout a working day can be actioned by a single optimization overnight.
12
Optimization phase
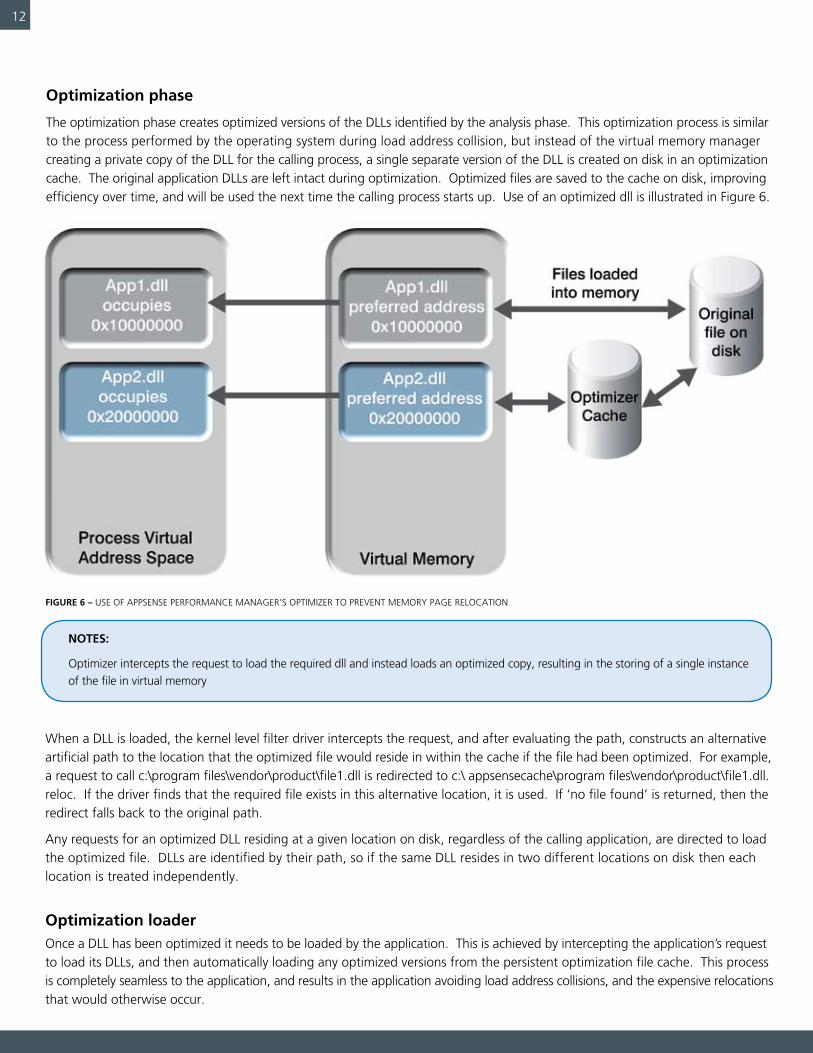
The optimization phase creates optimized versions of the DLLs identified by the analysis phase. This optimization process is similar to the process performed by the operating system during load address collision, but instead of the virtual memory manager creating a private copy of the DLL for the calling process, a single separate version of the DLL is created on disk in an optimization cache. The original application DLLs are left intact during optimization. Optimized files are saved to the cache on disk, improving efficiency over time, and will be used the next time the calling process starts up. Use of an optimized dll is illustrated in Figure 6.
When a DLL is loaded, the kernel level filter driver intercepts the request, and after evaluating the path, constructs an alternative artificial path to the location that the optimized file would reside in within the cache if the file had been optimized. For example, a request to call c:\program files\vendor\product\file1.dll is redirected to c:\ appsensecache\program files\vendor\product\file1.dll.reloc. If the driver finds that the required file exists in this alternative location, it is used. If ‘no file found’ is returned, then the redirect falls back to the original path.
Any requests for an optimized DLL residing at a given location on disk, regardless of the calling application, are directed to load the optimized file. DLLs are identified by their path, so if the same DLL resides in two different locations on disk then each location is treated independently.
Optimization loaderOnce a DLL has been optimized it needs to be loaded by the application. This is achieved by intercepting the application’s request to load its DLLs, and then automatically loading any optimized versions from the persistent optimization file cache. This process is completely seamless to the application, and results in the application avoiding load address collisions, and the expensive relocations that would otherwise occur.
FIGURE 6 – USE OF APPSENSE PERFORMANCE MANAGER’S OPTIMIzER TO PREVENT MEMORy PAGE RELOCATION
NOTES:
Optimizer intercepts the request to load the required dll and instead loads an optimized copy, resulting in the storing of a single instance of the file in virtual memory
13
Optimizing Signed Components
It is possible to optimize digitally-signed components, although this does remove the signature due to the changes made in performing the address fixups.
Optimizing Network Components
Application components accessed over the network can be optimized, causing a local copy of the files to be stored in the optimization cache. When a cached copy of any file is accessed, the file is compared with the original in order to check for updated versions. This differs from management of optimized files on the local drive, and allows for scenarios where the network is not always present such as mobile/ laptop computers.
Caching Unoptimized Network Components
Even when network components cannot be optimized, they can be cached in order to further exploit the advantages of reduced network bandwidth consumption.
When Optimizer detects that a network component is loaded, it will query the network file for its creation/last modified timestamp. If the network file is newer than the one in the cache, the network version is loaded and the cached version made obsolete; if the network version is the same as the one on disk, the disk version is loaded.
Consequently, the Optimizer driver will make one additional network access for every network component that is loaded. Caching of Network Components is disabled by default, but can be useful in scenarios where the network contributes to a performance bottleneck, whether due to bandwidth, latency or other issues. Cached network components are not optimized.
Obsolete Files and the Cleanup Process
On the local disk, the Optimizer Driver intercepts every single access to every single file. Whenever a “delete” or “rename” operation occurs on a local file, the Optimizer Driver can detect whether an old copy of that file exists in the cache. If so, the file in the cache is given a “.obsolete” extension. This extension ensures that this copy of the file will not be loaded again. Every 5 minutes, the Optimizer Agent looks at all files in the cache and, if one is found with a “.obsolete” extension, it is purged along with that file entry in the database. At this point, the file is no longer optimized.
14
Notes on System Resource Utilization
The functionality and examples documented here were tested on and apply to Windows Server 2003, Windows XP and Windows Vista. However, Windows Vista is the only one of these operating systems to expose performance counters relating to the modified and standby page lists. As has been explained, when using functionality such as trimming, the key relationship is between the working set of the target process and the modified/standby page lists. This means that when testing these concepts on earlier versions of Windows, a process of deduction is required. As an example, when the pages leave the working set, but before the pagefile grows in size, recall of the process into the foreground (and use of the application) will result in soft page faults (transition faults and demand zero faults). This indicates that the trimmed memory pages resided on the modified and standby lists in the interim period. This will be illustrated further using practical demonstrations and perform charts which will accompany this paper. The system performance counter objects can be used to observe these differences, but it is important that the relevant metrics and their implications on overall system performance are properly understood.
For example, trimming of process working sets and enforcing limits on consumption of physical memory will cause increased use of the system pagefile. This can be measured by monitoring \Paging File\ (\??\C:\pagefile.sys)\% Usage, which shows the amount of the Page File instance in use, expressed as a percentage.
However, this does not provide an indication of the rate at which data was written to or read from the pagefile. The counter \Memory\ Pages Input/sec records “the rate at which pages are read from disk to resolve hard page faults.” This can be used to measure the need to retrieve from disk, data which cannot be found in physical memory.
When a process working set is trimmed, for example, the pagefile usage % will increase, as data is moved from physical memory. Depending on the contents, the trimmed memory pages will be moved to the modified or standby lists to be lazily written to pagefile later. However, this is subject to the following:
Measurement of the \Memory\Modified Page List bytes counter (or the standby cache counters as appropriate) will show movement of working set contents to the modified or standby lists
These lists are located in physical memory, so any contents required by the processes will be soft faulted back into the working set without impacting performance
Writing to the pagefile will take place as a low priority IO task, will have minimal impact on performance, and will typically be completed in a very short time
Although the code/data can be retrieved from pagefile following a hard page fault, the use of a LRU to allocate the most appropriate content for paging out, combined with the issues discussed earlier regarding unnecessarily large working set sizes (see Physical Memory Trimming), reduces the likelihood that the memory pages will be needed at all
In the case of Optimizer, the analysis and optimization phases will inevitably have an impact on system performance. This impact is typically low, but can be further mitigated by scheduling the work to be completed during periods of low resource utilization.
15
For more information on AppSense Performance Manager, please visit www.appsense.com
you can also evaluate AppSense software for 21 days by visiting www.appsense.com/evaluate
ConclusionIn summary, use of physical memory control can significantly improve utilization of the available memory resources while only having a minimal impact on pagefile performance. In addition, use of Optimizer significantly reduces paging due to reduced consumption of virtual memory. Even taking the operation of AppSense Performance Manager itself into consideration, this provides a net result of significantly improved memory performance while potentially reducing paging.
The information contained in this document (“the Material”) is believed to be accurate at the time of printing, but no representation or warranty is given (express or implied) as to its accuracy, completeness or correctness. Neither AppSense nor the publisher accepts any liability whatsoever for any direct, indirect or consequential loss or damage arising in any way from any use of or reliance placed on this Material for any purpose.
© 2000-2008 APPSENSE INCORPORATED. ALL RIGHTS RESERVED
AppSense is a registered trademark of AppSense Inc. All other brands or product names are trademarks or registered trademarks of their respective companies.
www.appsense.com


